Analysis of Variance. Copyright 2014 Pearson Education, Inc.
|
|
|
- Hillary Theodora Wells
- 6 years ago
- Views:
Transcription

1 Analysis of Variance 12-1
2 Learning Outcomes Outcome 1. Understand the basic logic of analysis of variance. Outcome 2. Perform a hypothesis test for a single-factor design using analysis of variance manually and with the aid of Excel software. Outcome 3. Conduct and interpret post-analysis of variance pairwise comparison procedures. Outcome 4. Recognize when randomized block analysis of variance is useful and be able to perform analysis of variance on a randomized block design. Outcome 5. Perform analysis of variance on a two-factor design of experiments with replications using Excel and interpret the output. 12-2
3 12.1 One-Way Analysis of Variance It is a common situation when someone needs to determine whether three or more populations have equal means ANOVA analysis of variance Completely Randomized Design: An experiment that consists of the independent random selection of observations representing each level of one factor 12-3
4 One-Way Analysis of Variance An analysis of variance design in which independent samples are obtained from two or more levels of a single factor for the purpose of testing whether the levels have equal means. Examples: Accident rates for 1 st, 2 nd, and 3 rd shift Expected mileage for five brands of tires 12-4
5 Introduction to One-Way ANOVA Factor: A quantity under examination in an experiment as a possible cause of variation in the response variable Levels: The categories, measurements, or strata of a factor of interest in the current experiment Balanced Design: An experiment has a balanced design if the factor levels have equal sample sizes. 12-5
6 One-Way ANOVA Assumptions All populations are normally distributed. The population variances are equal. The observations are independent - that is, the occurrence of any one individual value does not affect the probability that any other observation will occur. The data are interval or ratio level. 12-6


7 Hypotheses of One-Way ANOVA If the null hypothesis is true, the populations have identical distributions sample means for random samples from each population should be close in value The null hypothesis should be rejected only if the sample means are substantially different (some pairs may be the same) 12-7
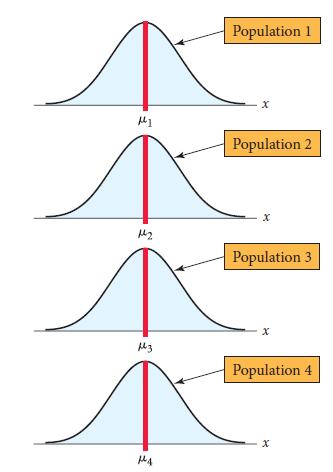
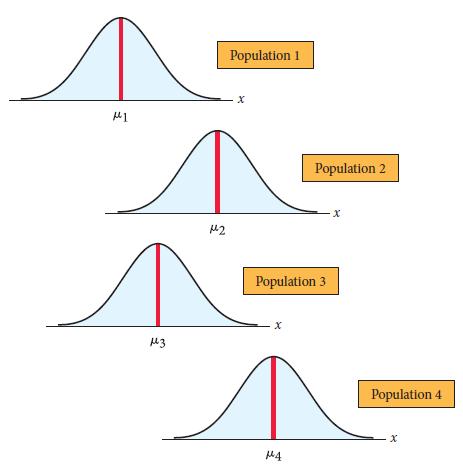
8 Hypotheses of One-Way ANOVA 12-8
9 Partitioning the Sum of Squares Total Variation (SST): The aggregate dispersion of the individual data values across the various factor levels Within-Sample Variation (SSW): The dispersion that exists among the data values within a particular factor level Between Sample Variation (SSB): Dispersion among the factor sample means 12-9

10 Partitioned Sum of Squares SST - Total sum of squares SSB - Sum of squares between SSW - Sum of squares within 12-10

11 Total Sum of Squares i k n = j i = 1 =

12 Sum of Squares Between k = i= 1 Variation Due to Differences Among Groups 12-12

13 Sum of Squares Within i k n = j i = 1 = 1 Variation Due to Differences Within Groups 12-13

14 Mean Squares Mean Square Between Samples: Mean Square Within Samples: 12-14

15 One-Way ANOVA Table Source of Variation Between Samples Within Samples Total SS df MS F-Ratio SSB MSB SSW MSW SST 12-15


16 One-Way ANOVA - Example Company runs business in several locations. The VP of sales for the company is interested in knowing whether the dollar value for orders made by individual customers differs, on average, between the four locations. Business Locations Mean Variance n

17 One-Way ANOVA - Example Source of Variation SS df MS F-Ratio Between Samples Within Samples Total Draw a conclusion: 12-17

18 One-Way Analysis of Variance 12-18
19 One-Way Analysis of Variance Step 5: Determine the decision rule Step 6: Compute the total sum of squares, sum of squares between, and sum of squares within, and complete the ANOVA table. Step 7: Reach a decision Step 8: Draw a conclusion 12-19


20 How to Do It in Excel? 1. Open file. 2. Select Data > Data Analysis. 3. Select ANOVA: Single Factor. 4. Define data range. 5. Specify Alpha. 6. Indicate output choice. 7. Click OK
21 The Tukey-Kramer Procedure for Multiple Comparisons A method for testing which populations have different means after the one-way ANOVA rejected the null hypothesis Experiment-Wide Error Rate: The proportion of experiments in which at least one of the set of confidence intervals constructed does not contain the true value of the population parameter being estimated

22 The Tukey-Kramer Procedure for Multiple Comparisons 12-22
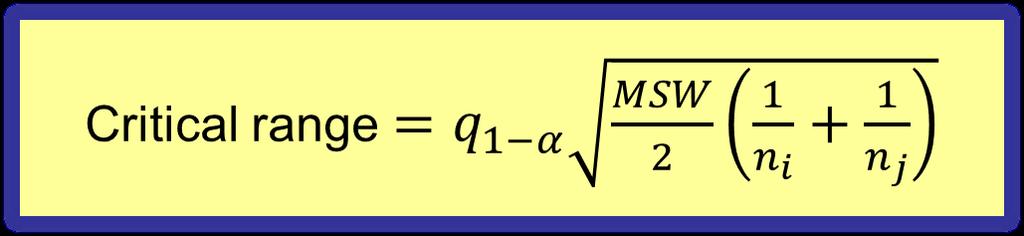

23 Tukey-Cramer Critical Range 12-23
24 The Tukey-Kramer Procedure for Multiple Comparisons - Example Step 1: Specify the parameter(s) of interest Step 2: Formulate the appropriate null and alternative hypotheses Step 3: Specify the significance level for the test Step 4: Select independent simple random samples from each population Step 5: Check to see that the normality and equal-variance assumptions have been satisfied 12-24
25 The Tukey-Kramer Procedure for Multiple Comparisons - Example Step 6: Determine the decision rule Step 7: Use Excel to construct the ANOVA table Step 8: Reach a decision Step 9: Draw a conclusion Step 10: Use the Tukey-Kramer test to determine which populations have different means 12-25


26 The Tukey-Kramer Procedure for Multiple Comparisons - Example Company distributes weight loss-enhancing products. 263 people were studied. 89 people have received a placebo,91 product 1, and 83 product 2. At the end of six weeks, the subjects weight loss was recorded. The company was hoping to find statistical evidence that at least one of the products is an effective weight-loss aid. The following absolute differences of sample means were received: 12-26


27 The Tukey-Kramer Procedure for Multiple Comparisons - Example Placebo vs. Product 1 Placebo vs. Product 2 Product 1 vs. Product 2 Critical Range Significant? Yes Yes No 12-27
28 12.2 Randomized Complete Block Analysis of Variance One-way ANOVA method is appropriate as long as we are interested in analyzing one factor at a time There are situations in which another factor may affect the observed response in a one-way design When an additional factor with two or more levels is involved, a design technique called blocking can be used to eliminate the additional factor s effect on the statistical analysis of the main factor of interest 12-28
29 Randomized Complete Block ANOVA Assumptions: The populations are normally distributed. The populations have equal variances. The observations within samples are independent. The data measurement must be interval or ratio level. Examples: Testing 5 routes to a destination through 3 different cab companies to see if differences exist Determining the best training program (out of 4 choices) for various departments within a company 12-29
30 Randomized Complete Block ANOVA Sum of Squares Partitioning for Randomized Complete Block Design: SST - Total sum of squares SSB - Sum of squares between factor levels SSBL - Sum of squares between blocks SSW - Sum of squares within levels 12-30


31 Sum of Squares for Blocking b = j= 1 Note: If the corresponding variation in the blocks is significant, the variation within the factor levels will be significantly reduced. This can make it easier to detect a difference in the population means if such a difference actually exists


32 Mean Squares F-Ratios Mean Square Blocking: Mean Square Between Samples: Mean Square Within Samples 12-32

33 Randomized Block ANOVA Table Source of Variation Between Blocks Between Samples Within Samples Total SS df MS F-Ratio SSBL MSBL SSB MSB SSW MSW SST 12-33

34 Primary and Secondary Tests Primary or Main Factor Test: Secondary or Blocking Factor Test 12-34
35 Randomized Complete Block ANOVA Step 1: Specify the parameter of interest and formulate the appropriate null and alternative hypotheses Step 2: Specify the level of significance for conducting the tests Step 3: Select simple random samples from each population, and compute treatment means, block means, and the grand mean Step 4: Compute the sums of squares and complete the ANOVA table Step 5: Test to determine whether blocking is effective Step 6: Conduct the main hypothesis test to determine whether the populations have equal means 12-35


36 Randomized Complete Block ANOVA - Example Professor has developed three different midterm exams that are to be graded on a 1,000 point scale. Before she uses the exams in a live class, she wants to determine if the tests will yield the same mean scores. To test this, a random sample of fourteen people is selected. Each student will take each test
37 Randomized Complete Block ANOVA - Example 12-37

38 Randomized Complete Block ANOVA - Example Source of Variation Between Blocks Between Samples Within Samples SS df MS F-Ratio F-Critical 116, , , , , ,850.9 Total 614,


39 How to Do It in Excel? 1. Open file. 2. Select Data > Data Analysis. 3. Select ANOVA: Two Factor Without Replication. 4. Define data range. 5. Specify Alpha. 6. Indicate output choice. 7. Click OK. Blocking Test Main Factor Test 12-39
40 Fisher s Least Significant Difference Test Even if the null hypothesis of equal population means is rejected, the ANOVA does not specify which population means are different Fisher s test is one test for multiple comparisons that can be used for a randomized block ANOVA design 12-40

41 Fisher s Least Significant Difference Test 12-41
42 Fisher s Least Significant Difference Test - Example Note: The previous example us used Step 1: Compute LSD Statistic: Step 2: Compute the sample means from each population 12-42

43 Fisher s Least Significant Difference Test - Example Step 3: Form all possible contrasts by finding the absolute differences between all pairs of sample means. Compare these to the LSD value. Comparison Significant? < No > Yes > Yes 12-43
44 12.3 Two-Factor Analysis of Variance with Replication There are many situations in which there are actually two or more factors of interest in the same study Two-factor ANOVA follows the same logic as one-way ANOVA The measurements are called replications All combinations of two factors (A and B) are considered Example: miles redemption method (A) and age group (B) 12-44
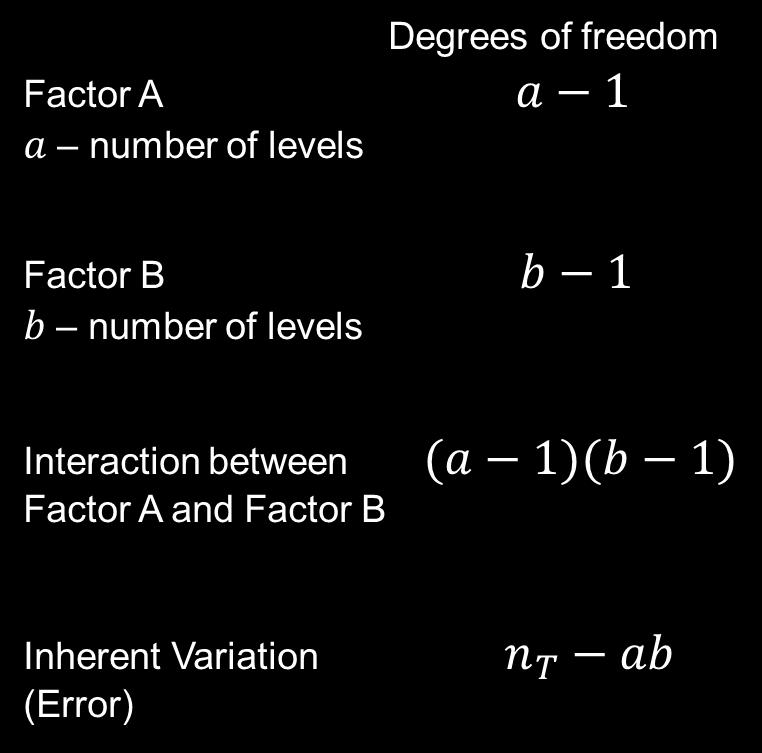
45 Partitioning the Total Sum of Squares One part is due to differences in the levels of factor A (SS A ). Another part is due to the levels of factor B (SS B ). Another part is due to the interaction between factor A and factor B (SS AB ). The final component making up the total sum of squares is the sum of squares due to the inherent random variation in the data (SSE )
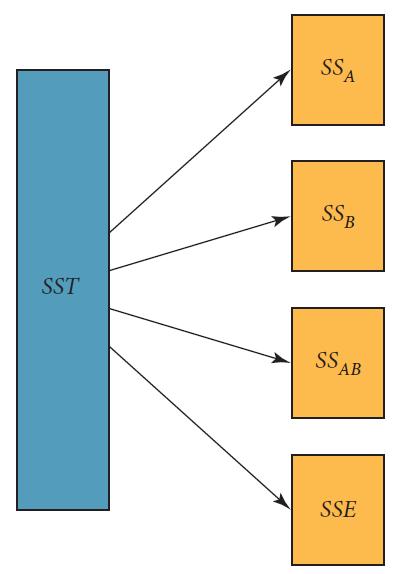
46 Partitioning the Total Sum of Squares 12-46
47 Assumptions for Two-Factor ANOVA The population values for each combination of pairwise factor levels are normally distributed The variances for each population are equal. The samples are independent. The data measurement is interval or ratio level

48 Hypotheses in Two-Factor ANOVA Factor A: Factor B: Interaction: 12-48

49 Two-Factor ANOVA Table Source of Variation SS df MS F-Ratio Factor A SS A MS A Factor B SS B MS B AB Interaction SS AB MS AB Error SSE MSE Total SST 12-49


50 Two-Factor ANOVA Equations Total Sum of Squares: Sum of Squares Factor A: Sum of Squares Factor B: a b n i= 1 j= 1 k= 1 a i= 1 b j= 1 Sum of Squares Interaction: a b i= 1 j= 1 Sum of Squares Error: a b n i= 1 j= 1 k=
51 Two-Factor ANOVA Equations Grand mean: a b n i= 1 j= 1 k= 1 Mean of each level of factor A: b n j= 1 k= 1 Mean of each level of factor B: a n i= 1 k= 1 Mean of each cell: n k =


52 Two-Factor ANOVA Equations Mean square factor A: Mean square factor B: Mean square interaction: Mean square error: 12-52


53 Two-Way ANOVA: The F-Test Statistic Factor A main effect: Factor B main effect: Interaction effect: 12-53


54 Two-Factor ANOVA - Example Airline company is concerned because many of its frequent flier program members have accumulated large quantities of free miles. They conducted an experiment in which each of three methods for redeeming frequent flier miles was offered to a sample of 16 customers divided in four age groups. Factor A is the redemption offer type with three levels. Factor B is the age group of each customer with four levels


55 Two-Factor ANOVA - Example Summary in Excel 1. Open file. 2. Select Data > Data Analysis. 3. Select ANOVA: Two Factor With Replication. 4. Define data range (include factor A and B labels). 5. Specify the number of rows per sample: 4 6. Specify Alpha. 7. Indicate output range. 8. Click OK

56 Two-Factor ANOVA Table Example Results 12-56
57 Interaction No Interaction Interaction is present 12-57
58 Interaction Test for interaction If present, conduct a one-way ANOVA to test the levels of one of the other factors using only one level of the other factor If NO interaction, test Factor A and Factor B 12-58

59 All rights reserved. No part of this publication may be reproduced, stored in a retrieval system, or transmitted, in any form or by any means, electronic, mechanical, photocopying, recording, or otherwise, without the prior written permission of the publisher. Printed in the United States of America
A few things to remember about ANOVA
 A few things to remember about ANOVA 1) The F-test that is performed is always 1-tailed. This is because your alternative hypothesis is always that the between group variation is greater than the within
Week 7 One-way ANOVA
 Week 7 One-way ANOVA Objectives By the end of this lecture, you should be able to: Understand the shortcomings of comparing multiple means as pairs of hypotheses. Understand the steps of the ANOVA method
MGB 203B Homework # LSD = 1 1
 MGB 0B Homework # 4.4 a α =.05: t = =.05 LSD = α /,n k t.05, 7 t α /,n k MSE + =.05 700 + = 4.8 n i n j 0 0 i =, j = 8.7 0.4 7. i =, j = 8.7.7 5.0 i =, j = 0.4.7. Conclusion: µ differs from µ and µ. b
Name May 3, 2007 Math Probability and Statistics
 Name May 3, 2007 Math 341 - Probability and Statistics Long Exam IV Instructions: Please include all relevant work to get full credit. Encircle your final answers. 1. An article in Professional Geographer
Unit 4: Inference for numerical variables Lecture 3: ANOVA
 Unit 4: Inference for numerical variables Lecture 3: ANOVA Statistics 101 Thomas Leininger June 10, 2013 Announcements Announcements Proposals due tomorrow. Will be returned to you by Wednesday. You MUST
One-factor ANOVA by example
 ANOVA One-factor ANOVA by example 2 One-factor ANOVA by visual inspection 3 4 One-factor ANOVA H 0 H 0 : µ 1 = µ 2 = µ 3 = H A : not all means are equal 5 One-factor ANOVA but why not t-tests t-tests?
PLANNED ORTHOGONAL CONTRASTS
 PLANNED ORTHOGONAL CONTRASTS Please note: This handout is useful background for the workshop, not what s covered in it. Basic principles for contrasts are the same in repeated measures. Planned orthogonal
Experimental Design and Data Analysis Part 2
 Experimental Design and Data Analysis Part 2 Assump@ons for Parametric Tests t- test and ANOVA Independence Variance Normality t-test Yes Yes Yes ANOVA Yes Yes Yes Lecture 7 AEC 460 Assume homogeneity
Introduction to Analysis of Variance (ANOVA) The Structural Model, The Summary Table, and the One- Way ANOVA
 The Structural Model, The Summary Table, and the One- Way ANOVA") Introduction to Analysis of Variance (ANOVA) The Structural Model, The Summary Table, and the One- Way ANOVA Limitations of the t-test Although the t-test is commonly used, it has limitations Can only
Introduction to Analysis of Variance (ANOVA) The Structural Model, The Summary Table, and the One- Way ANOVA Limitations of the t-test Although the t-test is commonly used, it has limitations Can only
Select Boxplot -> Multiple Y's (simple) and select all variable names.
 and select all variable names.") One Factor ANOVA in Minitab As an example, we will use the data below. A study looked at the days spent in the hospital for different regions of the United States. Can the company reject the claim the
One Factor ANOVA in Minitab As an example, we will use the data below. A study looked at the days spent in the hospital for different regions of the United States. Can the company reject the claim the
ANOVA - Implementation.
 ANOVA - Implementation http://www.pelagicos.net/classes_biometry_fa17.htm Doing an ANOVA With RCmdr Categorical Variable One-Way ANOVA Testing a single Factor dose with 3 treatments (low, mid, high) Doing
Statistical Analysis of PGA Tour Skill Rankings USGA Research and Test Center June 1, 2007
 Statistical Analysis of PGA Tour Skill Rankings 198-26 USGA Research and Test Center June 1, 27 1. Introduction The PGA Tour has recorded and published Tour Player performance statistics since 198. All
Unit4: Inferencefornumericaldata 4. ANOVA. Sta Spring Duke University, Department of Statistical Science
 Unit4: Inferencefornumericaldata 4. ANOVA Sta 101 - Spring 2016 Duke University, Department of Statistical Science Dr. Çetinkaya-Rundel Slides posted at http://bit.ly/sta101_s16 Outline 1. Housekeeping
One-way ANOVA: round, narrow, wide
 5/4/2009 9:19:18 AM Retrieving project from file: 'C:\DOCUMENTS AND SETTINGS\BOB S\DESKTOP\RJS\COURSES\MTAB\FIRSTBASE.MPJ' ========================================================================== This
Factorial Analysis of Variance
 Factorial Analysis of Variance Overview of the Factorial ANOVA Factorial ANOVA (Two-Way) In the context of ANOVA, an independent variable (or a quasiindependent variable) is called a factor, and research
Setting up group models Part 1 NITP, 2011
 Setting up group models Part 1 NITP, 2011 What is coming up Crash course in setting up models 1-sample and 2-sample t-tests Paired t-tests ANOVA! Mean centering covariates Identifying rank deficient matrices
Legendre et al Appendices and Supplements, p. 1
 Legendre et al. 2010 Appendices and Supplements, p. 1 Appendices and Supplement to: Legendre, P., M. De Cáceres, and D. Borcard. 2010. Community surveys through space and time: testing the space-time interaction
Factorial ANOVA Problems
 Factorial ANOVA Problems Q.1. In a 2-Factor ANOVA, measuring the effects of 2 factors (A and B) on a response (y), there are 3 levels each for factors A and B, and 4 replications per treatment combination.
DOCUMENT RESUME. A Comparison of Type I Error Rates of Alpha-Max with Established Multiple Comparison Procedures. PUB DATE NOTE
 DOCUMENT RESUME ED 415 284 TM 028 030 AUTHOR Barnette, J. Jackson; McLean, James E. TITLE A Comparison of Type I Error Rates of Alpha-Max with Established Multiple Comparison Procedures. PUB DATE 1997-11-13
One Way ANOVA (Analysis of Variance)
") One Wa ANOVA (Analsis of Variance) The one-wa analsis of variance (ANOVA) is used to determine whether there are an significant differences between the means of two or more independent (unrelated) groups
One Wa ANOVA (Analsis of Variance) The one-wa analsis of variance (ANOVA) is used to determine whether there are an significant differences between the means of two or more independent (unrelated) groups
Stat 139 Homework 3 Solutions, Spring 2015
 Stat 39 Homework 3 Solutions, Spring 05 Problem. Let i Nµ, σ ) for i,..., n, and j Nµ, σ ) for j,..., n. Also, assume that all observations are independent from each other. In Unit 4, we learned that the
Chapter 13. Factorial ANOVA. Patrick Mair 2015 Psych Factorial ANOVA 0 / 19
 Chapter 13 Factorial ANOVA Patrick Mair 2015 Psych 1950 13 Factorial ANOVA 0 / 19 Today s Menu Now we extend our one-way ANOVA approach to two (or more) factors. Factorial ANOVA: two-way ANOVA, SS decomposition,
Example 1: One Way ANOVA in MINITAB
 Example : One Way ANOVA in MINITAB A consumer group wants to compare a new brand of wax (Brand-X) to two leading brands (Sureglow and Microsheen) in terms of Effectiveness of wax. Following data is collected
Class 23: Chapter 14 & Nested ANOVA NOTES: NOTES: NOTES:
 Slide 1 Chapter 13: ANOVA for 2-way classifications (2 of 2) Fixed and Random factors, Model I, Model II, and Model III (mixed model) ANOVA Chapter 14: Unreplicated Factorial & Nested Designs Slide 2 HW
Running head: DATA ANALYSIS AND INTERPRETATION 1
 Running head: DATA ANALYSIS AND INTERPRETATION 1 Data Analysis and Interpretation Final Project Vernon Tilly Jr. University of Central Oklahoma DATA ANALYSIS AND INTERPRETATION 2 Owners of the various
Biostatistics & SAS programming
 Biostatistics & SAS programming Kevin Zhang March 6, 2017 ANOVA 1 Two groups only Independent groups T test Comparison One subject belongs to only one groups and observed only once Thus the observations
Stats 2002: Probabilities for Wins and Losses of Online Gambling
 Abstract: Jennifer Mateja Andrea Scisinger Lindsay Lacher Stats 2002: Probabilities for Wins and Losses of Online Gambling The objective of this experiment is to determine whether online gambling is a
BIOL 101L: Principles of Biology Laboratory
 BIOL 101L: Principles of Biology Laboratory Sampling populations To understand how the world works, scientists collect, record, and analyze data. In this lab, you will learn concepts that pertain to these
Taking Your Class for a Walk, Randomly
 Taking Your Class for a Walk, Randomly Daniel Kaplan Macalester College Oct. 27, 2009 Overview of the Activity You are going to turn your students into an ensemble of random walkers. They will start at
Announcements. Lecture 19: Inference for SLR & Transformations. Online quiz 7 - commonly missed questions
 Announcements Announcements Lecture 19: Inference for SLR & Statistics 101 Mine Çetinkaya-Rundel April 3, 2012 HW 7 due Thursday. Correlation guessing game - ends on April 12 at noon. Winner will be announced
Chapter 12 Practice Test
 Chapter 12 Practice Test 1. Which of the following is not one of the conditions that must be satisfied in order to perform inference about the slope of a least-squares regression line? (a) For each value
MJA Rev 10/17/2011 1:53:00 PM
 Problem 8-2 (as stated in RSM Simplified) Leonard Lye, Professor of Engineering and Applied Science at Memorial University of Newfoundland contributed the following case study. It is based on the DOE Golfer,
5.1 Introduction. Learning Objectives
 Learning Objectives 5.1 Introduction Statistical Process Control (SPC): SPC is a powerful collection of problem-solving tools useful in achieving process stability and improving capability through the
Competitive Performance of Elite Olympic-Distance Triathletes: Reliability and Smallest Worthwhile Enhancement
 SPORTSCIENCE sportsci.org Original Research / Performance Competitive Performance of Elite Olympic-Distance Triathletes: Reliability and Smallest Worthwhile Enhancement Carl D Paton, Will G Hopkins Sportscience
Confidence Interval Notes Calculating Confidence Intervals
 Confidence Interval Notes Calculating Confidence Intervals Calculating One-Population Mean Confidence Intervals for Quantitative Data It is always best to use a computer program to make these calculations,
Empirical Example II of Chapter 7
 Empirical Example II of Chapter 7 1. We use NBA data. The description of variables is --- --- --- storage display value variable name type format label variable label marr byte %9.2f =1 if married wage
Section I: Multiple Choice Select the best answer for each problem.
 Inference for Linear Regression Review Section I: Multiple Choice Select the best answer for each problem. 1. Which of the following is NOT one of the conditions that must be satisfied in order to perform
Chapter 2: ANOVA and regression. Caroline Verhoeven
 Chapter 2: ANOVA and regression Caroline Verhoeven Table of contents 1 ANOVA One-way ANOVA Repeated measures ANOVA Two-way ANOVA 2 Regression Simple linear regression Multiple regression 3 Conclusion Caroline
Design of Experiments Example: A Two-Way Split-Plot Experiment
 Design of Experiments Example: A Two-Way Split-Plot Experiment A two-way split-plot (also known as strip-plot or split-block) design consists of two split-plot components. In industry, these designs arise
Navigate to the golf data folder and make it your working directory. Load the data by typing
 Golf Analysis 1.1 Introduction In a round, golfers have a number of choices to make. For a particular shot, is it better to use the longest club available to try to reach the green, or would it be better
Driv e accu racy. Green s in regul ation
 LEARNING ACTIVITIES FOR PART II COMPILED Statistical and Measurement Concepts We are providing a database from selected characteristics of golfers on the PGA Tour. Data are for 3 of the players, based
IDENTIFYING SUBJECTIVE VALUE IN WOMEN S COLLEGE GOLF RECRUITING REGARDLESS OF SOCIO-ECONOMIC CLASS. Victoria Allred
 IDENTIFYING SUBJECTIVE VALUE IN WOMEN S COLLEGE GOLF RECRUITING REGARDLESS OF SOCIO-ECONOMIC CLASS by Victoria Allred A Senior Honors Project Presented to the Honors College East Carolina University In
Political Science 30: Political Inquiry Section 5
 Political Science 30: Political Inquiry Section 5 Taylor Carlson tncarlson@ucsd.edu Link to Stats Motivation of the Week They ve done studies, you know. 60% of the time, it works every time. Brian, Anchorman
How Effective is Change of Pace Bowling in Cricket?
 How Effective is Change of Pace Bowling in Cricket? SAS and all other SAS Institute Inc. product or service names are registered trademarks or trademarks of SAS Institute Inc. in the USA and other countries.
by Robert Gifford and Jorge Aranda University of Victoria, British Columbia, Canada
 Manual for FISH 4.0 by Robert Gifford and Jorge Aranda University of Victoria, British Columbia, Canada Brief Introduction FISH 4.0 is a microworld exercise designed by University of Victoria professor
NCSS Statistical Software
 Chapter 256 Introduction This procedure computes summary statistics and common non-parametric, single-sample runs tests for a series of n numeric, binary, or categorical data values. For numeric data,
Guide to Computing Minitab commands used in labs (mtbcode.out)
") Guide to Computing Minitab commands used in labs (mtbcode.out) A full listing of Minitab commands can be found by invoking the HELP command while running Minitab. A reference card, with listing of available
Guide to Computing Minitab commands used in labs (mtbcode.out) A full listing of Minitab commands can be found by invoking the HELP command while running Minitab. A reference card, with listing of available
Math 121 Test Questions Spring 2010 Chapters 13 and 14
 Math 121 Test Questions Spring 2010 Chapters 13 and 14 1. (10 pts) The first-semester enrollment at HSC was 1120 students. If all entering freshmen classes were the same size and there were no attrition,
Basic Autoclave #1 Ideal Gas Law, Inert Gas
 11. Autoclaves 40 Overview An autoclave is a high pressure, high temperature hydrometallurgy unit with carefully controlled conditions. In this chapter, we will simulate an autoclave using two different
Midterm Exam 1, section 2. Thursday, September hour, 15 minutes
 San Francisco State University Michael Bar ECON 312 Fall 2018 Midterm Exam 1, section 2 Thursday, September 27 1 hour, 15 minutes Name: Instructions 1. This is closed book, closed notes exam. 2. You can
Safety at Intersections in Oregon A Preliminary Update of Statewide Intersection Crash Rates
 Portland State University PDXScholar Civil and Environmental Engineering Master's Project Reports Civil and Environmental Engineering 2015 Safety at Intersections in Oregon A Preliminary Update of Statewide
Is lung capacity affected by smoking, sport, height or gender. Table of contents
 Sample project This Maths Studies project has been graded by a moderator. As you read through it, you will see comments from the moderator in boxes like this: At the end of the sample project is a summary
BEFORE YOU OPEN ANY FILES:
 Dive Analysis Lab * Make sure to download all the data files for the lab onto your computer. * Bring your computer to lab. * Bring a blank disk or memory stick to class to save your work and files. The
Distancei = BrandAi + 2 BrandBi + 3 BrandCi + i
 . Suppose that the United States Golf Associate (USGA) wants to compare the mean distances traveled by four brands of golf balls when struck by a driver. A completely randomized design is employed with
Traffic Accident Data Processing
 Traffic Accident Data Processing D o n a l d F. P e t t y Engineer of Traffic Research and Surveys Indiana State Highway Commission The following is a portion of the Highway Safety Program Standards developed
A Combined Recruitment Index for Demersal Juvenile Cod in NAFO Divisions 3K and 3L
 NAFO Sci. Coun. Studies, 29: 23 29 A Combined Recruitment Index for Demersal Juvenile Cod in NAFO Divisions 3K and 3L David C. Schneider Ocean Sciences Centre, Memorial University St. John's, Newfoundland,
ESP 178 Applied Research Methods. 2/26/16 Class Exercise: Quantitative Analysis
 ESP 178 Applied Research Methods 2/26/16 Class Exercise: Quantitative Analysis Introduction: In summer 2006, my student Ted Buehler and I conducted a survey of residents in Davis and five other cities.
Accident data analysis using Statistical methods A case study of Indian Highway
 Accident data analysis using Statistical methods A case study of Indian Highway Rahul Badgujar 1, Priyam Mishra 2, Mayank Chandra 3, Sayali Sandbhor 4, Humera Khanum 5 1,2,3 Undergraduate scholars, Department
Session 2: Introduction to Multilevel Modeling Using SPSS
 Session 2: Introduction to Multilevel Modeling Using SPSS Exercise 1 Description of Data: exerc1 This is a dataset from Kasia Kordas s research. It is data collected on 457 children clustered in schools.
Analyses of the Scoring of Writing Essays For the Pennsylvania System of Student Assessment
 Analyses of the Scoring of Writing Essays For the Pennsylvania System of Student Assessment Richard Hill The National Center for the Improvement of Educational Assessment, Inc. April 4, 2001 Revised--August
In my left hand I hold 15 Argentine pesos. In my right, I hold 100 Chilean
 Chapter 6 Meeting Standards and Standings In This Chapter How to standardize scores Making comparisons Ranks in files Rolling in the percentiles In my left hand I hold 15 Argentine pesos. In my right,
Money Lost or Won -$5 +$3 +$7
 Math 137 Unit 7 Review 1. The numbers of endangered species for several groups are listed here. Location Mammals Birds Reptiles Amphibians Total USA 63 78 14 10 Foreign 251 175 64 8 Total If one endangered
In addition to reading this assignment, also read Appendices A and B.
 1 Kinematics I Introduction In addition to reading this assignment, also read Appendices A and B. We will be using a motion detector to track the positions of objects with time in several lab exercises
Ozobot Bit Classroom Application: Boyle s Law Simulation
 OZO AP P EAM TR T S BO RO VE D Ozobot Bit Classroom Application: Boyle s Law Simulation Created by Richard Born Associate Professor Emeritus Northern Illinois University richb@rborn.org Topics Chemistry,
CHAPTER ANALYSIS AND INTERPRETATION Average total number of collisions for a try to be scored
 CHAPTER 8 8.1 ANALYSIS AND INTERPRETATION As mentioned in the previous chapter, four key components have been identified as indicators of the level of significance of dominant collisions when evaluating
Probability & Statistics - Solutions
 Probability & Statistics - Solutions Question 1 (a) A survey of 50 students with part-time jobs, randomly selected in NUI Maynooth in January 2018, found that they had a mean weekly net pay of 374. The
PERFORMANCE OF LIGHT WEIGHT STOCKER CALVES GRAZING SUMMER NATIVE RANGE WITH 25 OR 40% PROTEIN SUPPLEMENTS
 PERFORMANCE OF LIGHT WEIGHT STOCKER CALVES GRAZING SUMMER NATIVE RANGE WITH 25 OR 40% PROTEIN SUPPLEMENTS H. T. Purvis II 1, C. R. Floyd 1 and K. S. Lusby 2 Story in Brief Trials were conducted to evaluate
Transportation Research Forum
 Transportation Research Forum Modeling through Traffic Speed at Roundabouts along Urban and Suburban Street Arterials Author(s): Bashar H. Al-Omari, Khalid A. Ghuzlan, and Lina B. Al-Helo Source: Journal
The Animated Eyes Symbol as Part of the WALK Signal: An Examination of the Generality of its Effectiveness Across a Variety of
 The Animated Eyes Symbol as Part of the WALK Signal: An Examination of the Generality of its Effectiveness Across a Variety of Intersection Geometries and Timing Parameters by Ron Van Houten Mount Saint
Paper 2.2. Operation of Ultrasonic Flow Meters at Conditions Different Than Their Calibration
 Paper 2.2 Operation of Ultrasonic Flow Meters at Conditions Different Than Their Calibration Mr William Freund, Daniel Measurement and Control Mr Klaus Zanker, Daniel Measurement and Control Mr Dale Goodson,
Efficiency Wages in Major League Baseball Starting. Pitchers Greg Madonia
 Efficiency Wages in Major League Baseball Starting Pitchers 1998-2001 Greg Madonia Statement of Problem Free agency has existed in Major League Baseball (MLB) since 1974. This is a mechanism that allows
March Madness Basketball Tournament
 March Madness Basketball Tournament Math Project COMMON Core Aligned Decimals, Fractions, Percents, Probability, Rates, Algebra, Word Problems, and more! To Use: -Print out all the worksheets. -Introduce
Building an NFL performance metric
 Building an NFL performance metric Seonghyun Paik (spaik1@stanford.edu) December 16, 2016 I. Introduction In current pro sports, many statistical methods are applied to evaluate player s performance and
Section 1: Multiple Choice Explained EXAMPLE
 CFSP Process Applications Section 1: Multiple Choice Explained EXAMPLE Candidate Exam Number (No Name): Please write down your name in the above provided space. Only one answer is correct. Please circle
Exploring Measures of Central Tendency (mean, median and mode) Exploring range as a measure of dispersion
 Exploring range as a measure of dispersion") Unit 5 Statistical Reasoning 1 5.1 Exploring Data Goals: Exploring Measures of Central Tendency (mean, median and mode) Exploring range as a measure of dispersion Data: A set of values. A set of data can
Unit 5 Statistical Reasoning 1 5.1 Exploring Data Goals: Exploring Measures of Central Tendency (mean, median and mode) Exploring range as a measure of dispersion Data: A set of values. A set of data can
Introduction to Waves. If you do not have access to equipment, the following experiments can be observed here:
 Introduction to Waves If you do not have access to equipment, the following experiments can be observed here: http://tinyurl.com/lupz3dh 1.1 There is a tray with water in it. This can model throwing a
Lecture 16: Chapter 7, Section 2 Binomial Random Variables
 Lecture 16: Chapter 7, Section 2 Binomial Random Variables!Definition!What if Events are Dependent?!Center, Spread, Shape of Counts, Proportions!Normal Approximation Cengage Learning Elementary Statistics:
Analysis of Shear Lag in Steel Angle Connectors
 University of New Hampshire University of New Hampshire Scholars' Repository Honors Theses and Capstones Student Scholarship Spring 2013 Analysis of Shear Lag in Steel Angle Connectors Benjamin Sawyer
(JUN10SS0501) General Certificate of Education Advanced Level Examination June Unit Statistics TOTAL.
 General Certificate of Education Advanced Level Examination June Unit Statistics TOTAL.") Centre Number Candidate Number For Examiner s Use Surname Other Names Candidate Signature Examiner s Initials Statistics Unit Statistics 5 Friday 18 June 2010 General Certificate of Education Advanced
Centre Number Candidate Number For Examiner s Use Surname Other Names Candidate Signature Examiner s Initials Statistics Unit Statistics 5 Friday 18 June 2010 General Certificate of Education Advanced
Measuring Relative Achievements: Percentile rank and Percentile point
 Measuring Relative Achievements: Percentile rank and Percentile point Consider an example where you receive the same grade on a test in two different classes. In which class did you do better? Why do we
Chapter 5: Methods and Philosophy of Statistical Process Control
 Chapter 5: Methods and Philosophy of Statistical Process Control Learning Outcomes After careful study of this chapter You should be able to: Understand chance and assignable causes of variation, Explain
Supplementary Online Content
 Supplementary Online Content McEvoy JP, Byerly M, Hamer RM, et al. Effectiveness of Paliperidone Palmitate vs Haloperidol Decanoate for Maintenance Treatment of Schizophrenia: a Randomized Clinical Trial.
Analysis of Gini s Mean Difference for Randomized Block Design
 American Journal of Mathematics and Statistics 2015, 5(3): 111-122 DOI: 10.5923/j.ajms.20150503.02 Analysis of Gini s Mean Difference for Randomized Block Design Elsayed A. H. Elamir Department of Statistics
Review questions CPSC 203 midterm
 Review questions CPSC 203 midterm Online review questions: the following are meant to provide you with some extra practice so you need to actually try them on your own to get anything out of it. For that
Sample Final Exam MAT 128/SOC 251, Spring 2018
 Sample Final Exam MAT 128/SOC 251, Spring 2018 Name: Each question is worth 10 points. You are allowed one 8 1/2 x 11 sheet of paper with hand-written notes on both sides. 1. The CSV file citieshistpop.csv
WATER OIL RELATIVE PERMEABILITY COMPARATIVE STUDY: STEADY VERSUS UNSTEADY STATE
 SCA2005-77 1/7 WATER OIL RELATIVE PERMEABILITY COMPARATIVE STUDY: STEADY VERSUS UNSTEADY STATE 1 Marcelo M. Kikuchi, 1 Celso C.M. Branco, 2 Euclides J. Bonet, 2 Rosângela M.Zanoni, 1 Carlos M. Paiva 1
Evaluation of pedestrians speed with investigation of un-marked crossing
 Evaluation of pedestrians speed with investigation of un-marked crossing Iraj Bargegol, Naeim Taghizadeh, Vahid Najafi Moghaddam Gilani Abstract Pedestrians are one of the most important users of urban
March Madness Basketball Tournament
 March Madness Basketball Tournament Math Project COMMON Core Aligned Decimals, Fractions, Percents, Probability, Rates, Algebra, Word Problems, and more! To Use: -Print out all the worksheets. -Introduce
Fishery Resource Grant Program Final Report 2010
 Fishery Resource Grant Program Final Report 2010 Project title: Improving Gill net Selectivity by Altering Mesh Characteristics 2010 Name of PI: Robert Weagley Telephone: (804) 855-4112 Address: 10201
SUMMARIZING FROG AND TOAD COUNT DATA
 SUMMARIZING FROG AND TOAD COUNT DATA This set of protocols will take you through all the steps necessary for summarizing the frog and toad data for each NAAMP route that was been assigned to you. BEFORE
THE DEVELOPMENTOF A PREDICTION MODEL OF THE PASSENGER CAR EQUIVALENT VALUES AT DIFFERENT LOCATIONS
 THE DEVELOPMENTOF A PREDICTION MODEL OF THE PASSENGER CAR EQUIVALENT VALUES AT DIFFERENT LOCATIONS Nurul Hidayati 1, Ronghui Liu 2 and Frank Montgomery 2 1 Civil Engineering, Postgraduate Program Department,
Gerald D. Anderson. Education Technical Specialist
 Gerald D. Anderson Education Technical Specialist The factors which influence selection of equipment for a liquid level control loop interact significantly. Analyses of these factors and their interactions
Comparing Generalized Variance Functions to Direct Variance Estimation for the National Crime Victimization Survey
 Comparing Generalized Variance Functions to Direct Variance Estimation for the National Crime Victimization Survey Bonnie Shook-Sa, Lance Couzens, Rick Williams, David Heller, and Marcus Berzofsky 2013
Calculation of Trail Usage from Counter Data
 1. Introduction 1 Calculation of Trail Usage from Counter Data 1/17/17 Stephen Martin, Ph.D. Automatic counters are used on trails to measure how many people are using the trail. A fundamental question
The Simple Linear Regression Model ECONOMETRICS (ECON 360) BEN VAN KAMMEN, PHD
 BEN VAN KAMMEN, PHD") The Simple Linear Regression Model ECONOMETRICS (ECON 360) BEN VAN KAMMEN, PHD Outline Definition. Deriving the Estimates. Properties of the Estimates. Units of Measurement and Functional Form. Expected
The Simple Linear Regression Model ECONOMETRICS (ECON 360) BEN VAN KAMMEN, PHD Outline Definition. Deriving the Estimates. Properties of the Estimates. Units of Measurement and Functional Form. Expected
Naval Postgraduate School, Operational Oceanography and Meteorology. Since inputs from UDAS are continuously used in projects at the Naval
 How Accurate are UDAS True Winds? Charles L Williams, LT USN September 5, 2006 Naval Postgraduate School, Operational Oceanography and Meteorology Abstract Since inputs from UDAS are continuously used
Data Set 7: Bioerosion by Parrotfish Background volume of bites The question:
 Data Set 7: Bioerosion by Parrotfish Background Bioerosion of coral reefs results from animals taking bites out of the calcium-carbonate skeleton of the reef. Parrotfishes are major bioerosion agents,
1. In a hypothesis test involving two-samples, the hypothesized difference in means must be 0. True. False
 STAT 350 (Spring 2016) Homework 9 Online 1 1. In a hypothesis test involving two-samples, the hypothesized difference in means must be 0. 2. The two-sample Z test can be used only if both population variances
This e-book version is for an individual. No corporation, training classes, training institutes are allowed to use this e-book.
 2005 2006 sapficoconsultant.com. All rights reserved. No part of this e-book should be reproduced or transmitted in any form, or by any means, electronic or mechanical including photocopying, recording
An Empirical Comparison of Regression Analysis Strategies with Discrete Ordinal Variables
 Kromrey & Rendina-Gobioff An Empirical Comparison of Regression Analysis Strategies with Discrete Ordinal Variables Jeffrey D. Kromrey Gianna Rendina-Gobioff University of South Florida The Type I error