Status review update for Pacific salmon and steelhead listed under the Endangered Species Act
|
|
|
- Jade McKinney
- 5 years ago
- Views:
Transcription
1 StatusreviewupdateforPacificsalmonand steelheadlistedundertheendangeredspeciesact PacificNorthwest 1 MichaelFord(ed.),TomCooney,PaulMcElhany,NormaSands,LaurieWeitkamp, JeffreyHard,MichelleMcClure,RobertKope,JimMyers,AndrewAlbaugh,Katie Barnas,DavidTeel,PaulMoranandJeffCowen * NorthwestFisheriesScienceCenter ConservationBiologyDivision * Operations,ManagementandInformationDivision December10,2010 Citeas:FordMJ(ed.),CooneyT,McElhanyP,SandsN,WeitkampL,HardJ,McClure M,KopeR,MyersJ,AlbaughA,BarnasK,TeelD,MoranP,CowenJ.2010.Status reviewupdateforpacificsalmonandsteelheadlistedundertheendangeredspecies Act:Northwest.DraftU.S.DepartmentofCommerce,NOAATechnicalMemorandum NOAA TM NWFSC XXX. 1 AnequivalentreportforCaliforniaisavailable:Williams,T.H.,S.T.Lindley,B.C. Spence,andD.A.Boughton.Draft(December2010).StatusreviewupdateforPacific salmonandsteelheadlistedundertheendangeredspeciesact:southwest.draft U.S.DepartmentofCommerce,NOAATechnicalMemorandumNOAA TM SWFSC XXX. 1
2 TableofContents TableofContents...2 Introductionandsummaryofconclusions...3 Methods...7 ESUBoundaries...11 Cohosalmon PugetSoundandWashingtonCoastESUs...13 LowerColumbiaRiverandMiddleColumbiaRiverBoundaries...26 ESUstatussummaries...41 UpperColumbiaRiverspring runchinooksalmon...42 UpperColumbiaRiversteelhead...56 SnakeRiverspring/summer runchinooksalmon...68 SnakeRiverFall runchinooksalmon...93 SnakeRiversockeyesalmon SnakeRiverBasinsteelhead PugetSoundChinooksalmon HoodCanalsummer runchumsalmon PugetSoundcohosalmon LakeOzetteSockeyesalmon PugetSoundsteelhead LowerColumbiaRiverChinooksalmon UpperWillametteRiverChinooksalmon ColumbiaRiverchumsalmon LowerColumbiaRivercohosalmon MiddleColumbiaRiversteelhead LowerColumbiaRiversteelhead UpperWillamettesteelhead ClimateChange
3 Introductionandsummaryofconclusions TheEndangeredSpeciesAct(ESA)requiresthattheNationalMarine FisheriesService(NMFS)reviewthestatusoflistedspeciesunderitsauthorityat leasteveryfiveyearsanddeterminewhetheranyspeciesshouldberemovedfrom thelistorhaveitslistingstatuschanged.injuneof2005,nmfsissuedfinallisting determinationsfor16evolutionarilysignificantunits(esus)ofpacificsalmon (Oncorhynchussp.)andinJanuaryof2006NMFSissuedfinallistingdeterminations for10distinctpopulationsegments(dps)ofsteelhead(o.mykiss,theanadromous formofrainbowtrout) 2.NMFSisthereforeconductingareviewin2010andearly 2011of27ofthe28currentlylistedPacificsalmonidESUs/DPSsofWestCoast Pacificsalmon(FR75:13082 seehttp:// Notices/2010/upload/75FR13082.pdf) 3. ThereviewisbeingconductingbytheNMFSNorthwestandSouthwest Regions,andthisreportisinresponsetoa23February2010requestfromthe RegionstotheNorthwestandSouthwestFisheriesScienceCenterstoprovidea scientificsummaryoftheriskstatusofthesubjectesus/dpss.inthelastformal statusreview(goodetal.2005)thebiologicalreviewteam(brt)categorizedeach ESUaseither indangerofextinction, likelytobecomeendangered or notlikely tobecomeendangered,basedontheesu sabundance,productivity,spatial structureanddiversity.inthisreport,foreachlistedesu/dps,wesummarize whetherthereisnewinformationsincethe2005/2006listingstoindicatethatan ESUislikelytohavemovedfromoneofthethreebiologicalriskcategoriesto another.wefocusinparticularon1)informationonesu/dpsboundaries,and2) trendsandstatusinabundance,productivity,spatialstructureanddiversity.the informationinthereportwillbeincorporatedintotheregions review,andthe Regionswillmakefinaldeterminationsaboutanyproposedchangesinlisting status,takingintoaccountnotonlybiologicalinformationbutalsoongoingor plannedprotectiveefforts. Oneofthenotabledifferencesbetween2010/2011andthelaststatusreview in2005(goodetal.,2005)isthedevelopmentofviabilitycriteriaforalllisted salmonesus.nmfsinitiateditssalmonrecoveryplanningin2000,andthe2005 statusreviewincorporatedinformationthatwasavailablefromtherecovery planningprocessatthattime.inparticular,in2000nmfspublishedguidelinesfor developingviability(recovery)criteriaforpacificsalmon(mcelhanyetal.,2000) andlaunchedaseriesofregionaltechnicalrecoveryteamstodevelopviability 2 ForPacificsalmon,NMFSusesits1991ESUpolicy,thatstatesthatapopulationorgroupof populationswillbeconsideredadistinctpopulationsegmentifitisanevolutionarilysignificant Unit.ThespeciesO.mykissisunderthejointjurisdictionoftheNMFSandtheFishandWildlife Service,soinmakingitslistingJanuary2006determinationsNMFSelectedtousethe1996Joint FWS NMFSDPSpolicyforthisspecies. 3 TheOregonCoastcohosalmonESUwasreviewedin2010,andthereforeisnotincludedinthis report. 3
4 criteriaforeachlistedesu/dps(seehttp:// However,atthetimeof2005statusreview,onlyoneTRT(PugetSoundChinook) hadproducedfinalviabilitycriteria,andnoformalrecoverygoalshadbeenadopted foranyesu/dps.incontrast,in2010allesus/dpsshavetrt developedviability criteriaandseveralhaveformalrecoverygoals(table1and Recovery Planning/ESA Recovery Plans/Draft Plans.cfm).Wherepossible,therefore,thisreviewsummarizescurrentinformation withrespecttoboththeviabilitycriteriadevelopedbythetrtsandtherecovery goalsidentifiedinfinalrecoveryplans 4.Wealsoprovidedescriptionsofspawning abundanceandtrendsfollowingthemethodsofthe2005statusreviewtoallow directcomparisontothatreport. InadditiontosummarizingESU/DPSstatus,wealsoprovidesome informationthatwillbeusefulforevaluatingtrendsinthreats.theoriginallistings identifiedarangeoffactorsthatthreatenedtheviabilityoflistedsalmon.although thespecificcompositionofthreatsvariedamongesus,ingeneralmostesuswere threatenedbysomecombinationofthe fourh s harvest,hydropower,habitat degradationandhatcheryproduction.someofthesethreats,suchasharvest,are wellmonitoredandrelativelyeasytoquantify.others,suchashabitatdegradation, arenotmonitoredinacoordinatedwayacrossmultiplejurisdictionsmakingtrend evaluationdifficult.inthisreport,wesummarizetrendsinharvestimpactsand somesimpleaspectsofhatcheryimpactsusingreadilyavailabledata.forhabitat, weusedrecoveryplansanddatabasesofhabitatrestorationactivitiestosummarize thehabitatthreatsidentifiedforesuandthetypesofactivitiesthathavebeen conductedtoaddressthosethreats.thisanalysisisunderreview,andwill thereforebeincludedinasubsequentreport.inaddition,wehaveinitiatedwork thatwillusesatelliteimagerytosummarizetrendsinlanduseforseveralesus.we donotsummarizeinformationrelatedtohydropower,becausethistopic (particularlyinthecolumbiariver)isalreadythesubjectofextensivereview(see Hydropower/index.cfm).Globalclimatechange potentiallyhasfarreachingimpactsonpacificsalmonids,andwethereforeprovide abriefsummaryofnewinformationonhowclimatechangemayaffectesalisted salmonandsteelhead. 4 TherecoveryplansbasedtheirgoalsupontheworkoftheTRTs,sothecriteriaintherecovery plansaresimilartothetrtcriteria.thetrtcriteriawereintendedtobeflexible,however,toallow forlocalcontrolofrecoveryplandevelopment.insomecases,therefore,therecoveryplancriteria arenotidenticaltothetrtcriteria. 4
5 Table1 ListofviabilityreportscompletedbyTechnicalRecoveryTeams.See Domain Puget Sound - Chinook Puget Sound Hood Canal Summer Chum Puget Sound Lake Ozette Sockeye Willamette/Lower Columbia Oregon Coast Interior Columbia Basin North Central California Coast Southern Oregon Northern California Coast Southern-Central California Coast California Central Valley Viability Criteria document name Planning ranges and preliminary guidelines for the delisting and recovery of the Puget Sound Chinook salmon evolutionarily significant unit 2002 Determination of Independent Populations and Viability Criteria for the Hood Canal Summer Chum Salmon Evolutionarily Significant Unit 2009 Viability Criteria for the Lake Ozette Sockeye Salmon Evolutionarily Significant Unit 2009 Revised viability criteria for salmon an steelhead in the Willamette and Lower Columbia Basins 2003 and Biological recovery criteria for the Oregon Coast Coho Salmon Evolutionarily Significant Unit 2007 Viability criteria for application to Interior Columbia Basin salmonid ESUs 2007 A framework for assessing the viability of threatened and endangered salmon and steelhead in North-Central California Coast recovery domain 2007 Framework for assessing viability of threatened Coho salmon in the Southern Oregon/Northern California Coast Evolutionarily Significant Unit 2007 Viability criteria for steelhead of the south-central and southern California coast 2007 Framework for assessing viability of threatened and endangered Chinook salmon and steelhead in the Sacramento-San Joaquin Basin 2007 Year completed AsummaryofourconclusionsispresentedinTable2.Naturalorigin abundanceofmostesus/dpsshasincreasedsincetheoriginalstatusreviewsinthe mid 1990s,butdeclinedsincethetimeofthelaststatusreviewin2005.Risksfrom harvestandhatcheryproductionhaveimprovedconsiderablyformanyesussince themid 1990s,andhaveremainedlargelystablesince2005.Analysisoftrendsin habitatwasnotincludedinthisreport.overall,theinformationwerevieweddoes notsuggestthatachangeinbiologicalriskcategoryislikelyforanyofthecurrently listedesu/dpss. 5
6 Table2 Currentlistingstatusandsummaryofconclusions Species ESU 2005 risk category Chinook Upper Columbia spring In danger of extinction Snake River Likely to become spring/summer endangered Snake River fall Likely to become endangered Upper Willamette Likely to become spring endangered Lower Columbia Likely to become endangered Puget Sound Likely to become endangered Coho Lower Columbia In danger of extinction Puget Sound Not likely to become endangered Sockeye Snake River In danger of extinction Lake Ozette Likely to become endangered Chum Hood Canal Likely to become summer endangered Columbia River Likely to become endangered Steelhead Upper Columbia In danger of extinction Snake River Likely to become endangered Middle Columbia Likely to become endangered Upper Willamette Likely to become endangered Lower Columbia Likely to become endangered Puget Sound Likely to become endangered Listing status Endangered Threatened Threatened Threatened Threatened Threatened Threatened Species of Concern Endangered Threatened Threatened Threatened Threatened Threatened Threatened Threatened Threatened Threatened Update indicates change in risk category? No No No No No No No No No No No No No No No No No No 6
7 Methods Thisreportincludesbothasetofcommonanalysesconductedforeach ESU/DPSaswellasESU/DPSspecificanalysesdevelopedbytheindividualTRTs. Here,wedescribeonlythecommonsetofanalysis;seetheindividualESU/DPS sectionsadescriptionoftheanalysisthatpertaintospecificesus/dpss. Abundanceandtrends AllofthePacificNorthwestTRTsspentconsiderable timeandeffortdevelopingspawningabundancedataforthepopulationsthey identifiedwithinesus.inalmostallcasestheseestimatesarederivedfromstate, tribalorfederalmonitoringprograms.therawinformationuponwhichthe spawningabundanceestimatesweredevelopedconsistofnumeroustypesofdata includingreddcounts,damcounts,carcasssurveys,informationonpre spawning mortality,distributionwithinpopulations,etc,whichthetrtsusedtodevelop estimatesofnaturaloriginspawningabundance.itisimportanttorecognizethat spawningabundanceestimatesandrelatedinformationsuchasthefractionof spawnersthatarenaturaloriginarenot facts thatareknownwithcertainty. Rather,theyareestimatesbasedonavarietyofsourcesofinformation,someknown withgreaterprecisionoraccuracythanothers.ideally,theseestimateswouldbe characterizedbyaknownlevelofstatisticaluncertainty.however,forthemostpart suchastatisticalcharacterizationiseithernotpossibleorhasnotbeenattempted. Thespawningtimeseriessummarizedhereandreferencestothemethodsfortheir developmentareavailablefromthenorthwestfisheriessciencecenter ssalmon PopulationSummarydatabase: Weusedtheabundancetimeseriestocalculateseveralsummarystatistics, followingthemethodsdescribedofthelastmajorstatusreviewupdatein2005 (Goodetal.2005).Recentabundanceofnaturalspawnersisreportedasthe geometricmean(andrange)ofthemostrecentdata.geometricmeanswere calculatedforthemostrecent5years.zerovaluesinthedatasetwerereplaced withavalueof1,andmissingdatavalueswithinamultipleyearrangewere excludedfromgeometricmeancalculations. Short andlong termtrendswerecalculatedfromtimeseriesofthetotal numberofadultspawners.short termtrendswerecalculatedusingdatafrom1995 tothemostrecentyear,withaminimumof10datapoints.long termtrendswere calculatedusingalldatainatimeseries.trendwascalculatedastheslopeofthe regressionofthenumberofnaturalspawners(log transformed)overthetime series;tomediateforzerovalues,1wasaddedtonaturalspawnersbefore transformingthedata.trendwasreportedintheoriginalunitsasexponentiated slope,suchthatavaluegreaterthan1indicatesapopulationtrendingupward,anda valuelessthan1indicatesapopulationtrendingdownward.theregressionwas calculatedas:ln(n+1)=β 0 +β 1 X+ε,whereNisthenaturalspawnerabundance,β 0 istheintercept,β 1 istheslopeoftheequation,andεistherandomerrorterm. Confidenceintervals(95%)fortheslope,intheiroriginalunitsofabundance,were calculatedasexp(ln(b 1 ) t 0.05(2),df s b1 )<β 1 <exp(ln(b 1 )+t 0.05(2),df s b1 ),whereb 1 isthe 7
8 estimateofthetrueslope,β 1,t 0.05(2),dfisthetwo sidedt valueforaconfidencelevel of0.95,dfisequalton 2,nisthenumberofdatapointsinthetimeseries,ands b1 isthestandarderroroftheestimateoftheslope,b 1. Wealsocalculatedshortandlong termpopulationgrowthrates,λ,following themethodsdescribedingoodetal.(2005)andimplementedinthecomputer programspaz( Hatcheryreleases Weplottedtrendsinhatcheriesreleaseswithinthe geographicboundariesofthespawningpopulationsofeachesu.alldatawas obtainedfromtheregionalmarkinformationsystem(rmis)database,maintained bytheregionalmarkprocessingcenter(rmpc)aspartofthepacificstatesmarine FisheriesCommission(PSMFC standardreporting.html).throughinterviewswithindividualsatpsc,wdfw,odfw, USFWS,Tribes,andIDFGitwasdeterminedthatalldata,ornearlyalldatainthe caseofodfw,hasbeensubmittedtothermisfromtheyear1990topresent.inthe caseofodfwallreleasesfrom2004topresentareinrmis,andallcwtreleases areinrmisfrom1990to2003withanunknownamountofnon CWTsubmittedas well. Thefollowingagencies,WDFW,ODFW,USFWS,NWIFC,CRITFC,andIDFG werequeriedinthestatesofwa,orandidtoobtainallreleasesofallspeciesinthe RMISandcreateamasterdataset.Severalattributeswerethenconvertedfrom codeusedwithinrmistoamoreintuitivenomenclature.allspeciesthatwerenot Chinook,Chum,Coho,SockeyeorSteelheadwereremoved. RMISreportsreleasetotalsin4differentcategories, cwt_1st_mark_count, cwt_2nd_mark_count, non_cwt_1st_mark_count,and non_cwt_2nd_mark_count. Thesewereallsummedtoobtainatotalreleaseforeachreleaseevent.Releaseage wascalculatedasreleaseyear broodyear 1forfallspawners(mostsalmon)and asreleaseyear broodyearforspringspawners(steelhead).ageszerowere consideredsub yearlingsandage1orgreaterwereconsideredyearlings. DeterminingreleaselocationbyESUandPacificSalmonCommission(PSC) basinwasamulti stepprocess.allreleasesinrmisareassignedapscregionand PSCBasincode.Thesecodeswereconvertedfromcodetofullnames.After obtaininggisbasinlayerdatafrompscitwasdeterminedthatpscbasinsare largerthantrtdefinedsalmonpopulationboundaries,yetsmallerthanesu boundaries.throughgismappingusingtheesriarcmapsoftwarealistofesus andthepscbasinscontainedwithinthemwascreated.fromthislistitwas possibletosumallreleasesinallpscbasinsthatcorrespondedtoeachesu.some ofthereleaseswerenotdirectlyassociatedinthermisdatabasetoaspecificpsc basinandweregivena Generallocation label.usingreleaselocationcomment fields,hatcherylocations,andotherinvestigativetoolsthese General releaseswere assignedapscbasin. Harvest Wecompileddataontrendsintheadultequivalentexploitation rateforeachesu/dps.itisimportanttonotethatmagnitudeandtrendofan exploitationratecannotbeinterpreteduncriticallyasatrendinlevelofriskfrom harvest.analysesrelatingexploitationratetoextinctionriskorrecovery probabilityhavebeenconductedinaquantitativewayforseveralesus(fordetal., 8
9 2007;NMFS,2001;NWFSC,2010)andqualitativelyforothers(NMFS,2004).See specificesu/dpssectionsfordetails. References FordM,SandsN,McElhanyP,etal.(2007)AnalysestosupportareviewofanESA jeopardyconsultationonfisheriesimpactinglowercolumbiarivertule Chinooksalmon.NationalMarineFisheriesServiceNorthwestFisheries ScienceCenterandNorthwestRegionalOffice,Seattle,WA.October5,2007. GoodTP,WaplesRS,AdamsP(2005)UpdatedstatusoffederallylistedESUsofWest Coastsalmonandsteelhead.U.S.Dept.Commer.,NOAATech.Memo.NMFS NWFSC 66.,p.598. McElhanyP,RuckelshausMH,FordMJ,WainwrightTC,BjorkstedtEP(2000)Viable SalmonidPopulationsandtheRecoveryofEvolutionarilySignificantUnits. NOAATechnicalMemorandumNMFS NWFSC42,156p. NMFS(2001)RAP Ariskassessmentprocedureforevaluatingharvestmortality onpacificsalmonids.nationalmarinefisheriesservice,northwestregion, SustainableFisheriesDivisionandNorthwestFisheriesScienceCenter, ResourceUtilizationandTechnologyDivision. NMFS(2004)NOAAFisheries'approachtomakingdeterminationspursuanttothe EndangeredSpeciesActabouttheeffectsofharvestactionsonlistedPacific salmonandsteelhead.nationalmarinefisheriesservice,northwestregion, SustainableFisheriesDivision. NWFSC(2010)LowerColumbiaRiverTuleChinookSalmonLife cyclemodeling. June1,2010.NorthwestFisheriesScienceCenter.. Sourcesforharvestinformation: CTCinprep.2010annualreportoftheexploitationrateanalysisandmodel calibration.pacificsalmoncommission,chinooktechnicalcommittee. PugetSoundIndianTribesandWashingtonDepartmentofFishandWildlife PugetSoundSteelheadHarvestManagementPlan(draft).Submittedto NMFSNWRegion,January7,2010. TAC JointStaffReport:stockstatusandfisheriesforfallChinook salmon,cohosalmon,chumsalmon,summersteelhead,andwhitesturgeon. JointColumbiaRiverManagementStaff,OregonDepartmentofFish& Wildlife,WashingtonDepartmentofFishandWildlife.July16, p. TAC JointStaffReport:stockstatusandfisheriesforspringChinook, summerchinook,sockeye,steelhead,andotherspecies,andmiscellaneous regulations.jointcolumbiarivermanagementstaff,oregondepartmentof Fish&Wildlife,WashingtonDepartmentofFishandWildlife.February2, p. 9
10 10
11 ESUBoundaries 5 ESUandDPSDefinition Inestablishingwhetherapetitionedbiological entitycanbelistedundertheu.s.endangeredspeciesact(esa)itmustfirstbe determinedwhethertheentitycanbeconsidereda species undertheesa.the ESAallowslistingnotonlyoffulltaxonomicspecies,butalsonamedsubspeciesand distinctpopulationssegments(dpss)ofvertebrates.theesa,asamendedin1978, however,providesnospecificguidancefordeterminingwhatconstitutesadps. Waples(1991)developedtheconceptofEvolutionarilySignificantUnits(ESUs)for defininglistableunitsundertheesa.thisconceptwasadoptedbynmfsin applyingtheesatoanadromoussalmonidsspecies(nmfs1991).thenmfspolicy stipulatesthatasalmonpopulationsorgroupofpopulationsisconsideredadpsifit representsanesuofthebiologicalspecies.anesuisdefinedasapopulationor groupofpopulationsthat1)issubstantiallyreproductivelyisolatedfrom conspecificpopulations,and2)representsandimportantcomponentinthe evolutionarylegacyofthespecies.in2006,thenmfsdepartedfromitspracticeof applyingtheesupolicytoo.mykisspopulations,andinsteadappliedthejoint USFWS NMFSDPSdefinitionindetermining species ofo.mykissforlisting consideration(71fr834;january5,2006).thischangewasinitiatedbecauseo. mykissarejointlyadministeredwiththefwsandthefwsdoesnotusetheesu policyintheirlistingdecisions(71fr834;january5,2006).underthejointu.s. FishandWildlifeService(FWS)andNMFSDPSpolicyagroupoforganismsisaDPS ifitisboth discrete and significant fromothersuchpopulations.evidenceof discretenesscanincludebeing markedlyseparatedfromotherpopulationsofthe sametaxonasaconsequenceofphysical,physiological,ecological,andbehavioral factors,andevidenceofsignificanceincludespersistenceinanunusualorunique ecologicalsetting,evidencethatagroup sextinctionwouldresultinasignificantgap intherangeofthetaxon,ormarkedlydifferentgeneticcharacteristicsfromother populations(seedpspolicy;61fr4722fordetails).thedpspolicywasintended tobeconsistentwiththeesupolicy,andbothpoliciesutilizethesametypesof information.however,nmfshasconcludedthatunderthedpspolicyresidentand anadromousformsofo.mykissarediscrete(andhencearedifferentdpss),whereas biologicalreviewteamshavegenerallyconcludedthatresidentandanadromouso. mykisswithinacommonstreamarepartofthesameesuifthereisnophysical barriertointerbreeding(seegoodetal.2005foranextensivediscussionofthis issue). Informationthatcanbeusefulindeterminingthedegreeofreproductive isolationincludesincidenceofstraying,ratesofrecolonization,degreeofgenetic differentiation,andtheexistenceofbarrierstomigration.insightintoevolutionary significanceordiscretenesscanbeprovidedbydataongeneticandlifehistory 5 Sectionauthors:JimMyers,LaurieWeitkamp,DavidTeel 11
12 12 characteristics,habitatdifferences,andtheeffectsofstockstransfersor supplementationefforts. LifehistorycharacteristicsthathavebeenusefulinestablishingESUandDPS boundariesinclude:juvenileemigrationandadultreturntiming,agestructure, oceanmigrationpatterns,bodysizeandmorphology,andreproductivetraits(i.e. eggsize).populationgeneticstructurecanbeveryinformativeforestimatingthe degreeofreproductiveisolationamongpopulations.similarly,mark/recapture studiesprovideinformationonthelevelofinterpopulationmigration,although straying doesnotnecessarilyresultinsuccessfulintrogression. Habitatandecologicalinformationhasbeenextensivelyusedtoestablish ESUandDPSboundaries,especiallywherethereislittlepopulationspecific informationavailable.giventhehighlevelofhomingfidelityexhibitedby salmonidsandtheassociateddegreeoflocaladaptationinlifehistorytraits,habitat characteristicsbecomeausefulproxyforputativedifferencesinlifehistorytraits. Similarly,biogeographicboundariesandthedistributionandESUstructureof similarspecieshavebeenusedwhereinformationonthe species inquestionis lacking. IninitiallydefiningthestructureofESUsandDPSstheBiologicalReview Teamsanalyzedavarietyofdifferentdatatypesofvaryingquality.Atthetime,the BRTsrecognizedthatESUboundarieswouldnotnecessarilybediscrete,rathera transitionalzonecoveringoneormorebasinsmightexistattheinterfacebetween putativeesus.insomecases,especiallywheretherewasnotageographicfeature torelyupon,therewassomedegreeofuncertaintyintheidentificationofesu boundaries.populationspecificinformationwasfrequentlylimitedandinsome casesnaturalpopulationsinthetransitionalzonehadbeenextirpatedormodified bythetransferoffishbetweenbasins.ultimately,thebrtshaveusedthebest availableinformationtoassigntransitionalpopulationsintoanesus/dpsswiththe understandingthatifadditionalinformationbecameavailablethedecisions regardingtheboundariescouldberevisited. NewInformation ThemajorityoftheESUsandDPSsforPacificsalmonand steelheadwereinitiallydefinedinthelate1990saspartofthecoastwidestatus reviewprocessundertakenbythenmfs.intheintervening15years,themost markedchangeinpopulationmonitoringhasarguablybeenintheanalysisof geneticvariation.initially,themajorityofthegeneticsinformationwasdeveloped usingthestarch gelelectrophoresisofallozymes.theutilizationofdna microsatellitetechnologyinfisheriesduringthelast10yearshasprovidedawealth ofadditionalgeneticinformation.overall,thistechniquehasprovidedafinerlevel ofdiscriminationthanwaspossiblewithallozymes.furthermore,sincetheinitial listingstherehavebeenextensivemonitoringeffortsthroughoutthewestcoast. Thus,thequalityandquantityofgeneticinformationavailabletoaddresstheissue ofesuanddpsdelineationhasimprovedconsiderably. Foranumberofpopulations,monitoringeffortsoverthatlast15yearshave expandedtheexistingdatabasesonabundance,spawntiming,andmigratory patterns.additionally,themass markingofhatchery originjuvenileshasimproved
13 thequalityofthedatacollected,especiallyregardingthelife historydataof naturally producedfish. Informationofalltypes,frompublishedandunpublishedsources,was reviewedinordertoassesswhethersufficientdataexistedtojustifya reconsiderationoftheesuboundary.muchoftherelevantinformationhadalready beensummarizedbythetechnicalrecoveryteams(trts)intheiridentificationof populationswithinlistedesusanddpss(table3).thisreviewwillnotexplicitly discussalloftheinformationthatwasconsidered,butratherfocusesoninformation pertainingtoesusanddpssthatwouldpotentiallyjustifyfurtherinvestigation regardingchangesinboundaries. Table3 TechnicalRecoveryTeamreportsonpopulationstructurewithinlistedPacificNorthwest EvolutionarilySignificantUnits(ESUs)andDistinctPopulationSegments(DPSs).See Domain Population structure document name Year completed Puget Sound - Chinook Puget Sound Hood Canal Summer Chum Puget Sound Lake Ozette Sockeye Willamette/Lower Columbia Oregon Coast Interior Columbia Basin Independent Populations of Chinook Salmon in Puget Sound 2006 Determination of Independent Populations and Viability Criteria for the Hood Canal Summer Chum Salmon Evolutionarily Significant Unit 2009 Identification of an Independent Population of Sockeye Salmon in Lake Ozette, Washington 2009 Historical Population Structure of Pacific Salmonids in the Willamette River and Lower Columbia River Basins 2006 Identification of Historical Populations of Coho Salmon (Oncorhynchus kisutch) in the Oregon Coast Evolutionarily Significant Unit 2007 Independent Populations of Chinook, Steelhead, and Sockeye for Listed Evolutionarily Significant Units Within the Interior Columbia River Domain 2003 Cohosalmon PugetSoundandWashingtonCoastESUs 6 Evolutionarilysignificantunits(ESUs)forWestCoastcohosalmonwere originallydelineatedin1995(weitkampetal.1995).atthattime,sixesuswere identified:1)centralcaliforniacoast,2)northerncalifornia/southernoregon Coasts,3)OregonCoast,4)ColumbiaRiver/SouthwestWashington,5)Olympic Peninsula,and6)PugetSound/StraitofGeorgia(Figure1).In2005,NMFS determinedthatthecolumbiariver/southwestwashingtonesushouldbesplitand 6 CompiledbyLaurieWeitkamp,DavidTeel,andHeatherStout.Northwest FisheriesScienceCenter. 13
14 thecolumbiariverportionwaslistedundertheu.s.esa,leavingthestatusof southwestwashingtoncohosalmonpopulationsinquestion. Sincetheoriginalstatusreview,newgeneticandlifehistoryinformationhas becomeavailablethatprovidesfurtherinsightintohowcohosalmonarelikely adaptedtohabitatsthroughouttheirrange,resultinginreproductiveisolationand phenotypicvariation.thisnewinformationhasyettobeconsideredforthosecoho salmonesuswhichhavenotbeenevaluatedsincetheoriginalstatusreview. Accordingly,thisanalysiswillfocusoncohosalmonpopulationsthatoccupy freshwaterhabitatsalongthewashingtoncoast,straitofjuandefuca,pugetsound, andsouthernbritishcolumbia.possiblechangestoesuboundarieshave previouslybeenconsideredforcohosalmonfromnortherncaliforniaandoregon andwerefoundtobeconsistentwiththebestscientificinformationandtherefore willnotbediscussedhere(stoutetal.2010). Information related to the original delineation of coho ESU boundaries in the Washington State and Southern British Columbia GeographicandEcologicalCharacteristics FreshwaterhabitatsalongtheWashingtonCoast,StraitofJuandeFuca, PugetSound,andsouthernBritishColumbiaarelargelyinfluencedbyelevationand rainfallandfallintotwoecoregionsatlowelevations(omernik1987):thecoastal Range,whichextendsfromtheOlympicPeninsulatoroughlySanFranciscoBay,and PugetLowland,whichencompassestheeasternStraitofJuandeFucaandlowlands ofpugetsound.acrosstheborderinbritishcolumbia,the GeorgiaDepression ecoregionisessentiallythenorthernextensionofthepugetlowlandecoregion,and coversmostofthestraitofgeorgia(demarchi1996). TheWashingtonCoastistypifiedbyabroadhabitatgradientfromthelow elevationwillapahillsinthesouthtothehigherelevationolympicmountainsinthe north.dominantvegetationthroughoutthisareaissitkaspruceandwestern hemlockandrainfallisconsiderable.atthesouthendofthisrange,thereare extensivemud orsandflatswithinthecolumbiariverestuary,willapabay,and GraysHarbor;duetothesharedgeologyoftheWillapaHillsarea(WDNR2003)and thetransportationofcolumbiariversedimentsnorthwardalongthewashington coast. Becauseoftheirhigherelevationsandassociatedgreaterrainfall,rivers drainingtheolympicpeninsulaarecharacterizedbyhighlevelsofprecipitationand colder,glaciallyinfluenced,headwaters,highaverageflowswitharelativelylong durationofpeakflows,includingasecondsummerpeakresultingfromsnowmelt. TheChehalisRiverdisplayscharacteristicsofbothpartsoftheWashingtoncoast tributariesdrainingthenorthsideofthechehalisriverbasinsharethesame hydrology,topography,andclimateasolympicpeninsularivers,whilesouthern tributarieshavemoreincommonwiththesouthwestwashingtoncoast. TheeasternboundaryoftheOlympicPeninsulaoverlaysanextended transitionzonebetweentheextremelywetolympicpeninsulaandthemuchdrier PugetSound/SalishSea.ThetransitionpointbetweenthewetOlympicPeninsula andtherainshadowfarthereastisthoughttooccureastoftheelwhariver. However,theElwhaRiverisphysicallymoresimilartotheDungenessRiverthanto 14
15 thosebasinsfartherwest.theelwhaanddungenessriversarebothrelativelylong andbegininalpineareasoftheolympicmountains,whileriverswestoftheelwha Riveraremuchshorter,drainingthelowridgethatseparatestheSolDucRiverfrom thestraitofjuandefuca(weitkampetal.1995). DrainagesenteringtheSalishSeafrombothsidessharemanyofthephysical andenvironmentalfeaturesthatcharacterizethepugetsoundarea.thisregionis drierthantherainforestareaofthewesternolympicpeninsulaandthewestsideof VancouverIslandandisdominatedbywesternhemlockforests.Streamsaresimilar tothoseoftheolympicpeninsula,beingcharacterizedbycoldwater,highaverage flows,arelativelylongdurationofpeakflows,andasecondsnow meltpeak, althoughflowlevelsperbasinareaaremuchlowerthanintheolympicpeninsula (Weitkampetal.1995). 15
16 Figure1 Evolutionarilysignificantunitsforcohosalmonproposedin1995.Since 2005,LowerColumbiacohoformtheirESU.ReproducedfromWeitkampetal. (1995). LifeHistoryandGeneticalCharacteristics Lifehistorycharacteristics.Weitkampetal.(1995)consideredavarietyof cohosalmonlifehistoryinformationinordertodeterminehowsalmonwere respondingtothevariationinhabitatsdiscussedabove,andthereforeindicatelikely 16
17 locationsforesusboundaries.athoroughreviewofcohosalmonpopulations characteristicsconcludedthatcohosalmonexhibitconsiderablylessvariationin traitssuchasageatmaturityortimingofadultreturnscomparedwithother salmonidspeciesforwhichesushadbeendelineatedatthattime(primarily ColumbiaRiverChinooksalmonandsockeyesalmonandsteelhead).Inessence, cohosalmonappearedtohavea onesizefitsall modelforlifehistoryvariation, whichgreatlylimitedtheuseofthesetraitsinestablishingesuboundaries. Onelifehistorytraitthatdidshowconsiderablevariationwasmarine distributionpatternbasedonrecoveriesofcodedwiretagsinmarinefisheries, groupedbystateorprovinceofrecovery.basedontherecoveryof1.9millioncoho salmonoriginatingfrom66hatcheriesovera20yearperiod,weitkampetal.(1995) foundthatcohosalmonoriginatingfromaparticularfreshwaterregionshareda commonmarinerecoverypattern,whichdifferedfromthatofadjacentregionwith verylittletransitioninpatterns.basedonthisanalysis,eightrecoverypatterns wereidentifiedcoastwide,includingfourinwashingtonstateandsouthernbritish Columbiaconsistingof1)ColumbiaRiver,2)WashingtonCoast,3)PugetSound, HoodCanal,andStraitofJuandeFuca,and4)southernBritishColumbia.Mostof thesefishwererecoveredinwashingtonandbritishcolumbiamarinewaters, althoughtherelativeproportionvariedbyreleaseregion,leadingtodetectable differencesbetweenregions. Geneticalcharacteristics.Aspartofthecohosalmonstatusreviewin1994, Weitkampetal.(1995)reviewedgeneticstudiesofcohosalmoninCalifornia, Oregon,Washington,BritishColumbia,andAlaska.Nearlyallofthegeneticstudies focusedonparticulargeographicregionsandexceptfortwomitochondrialdna studiesofcohosalmoninoregonandinthecolumbiariver,allwereallozyme studiesemployingfewpolymorphiclociandmostlybasedonsmallnumbersof samples.weitkampetal.(1995)alsocompiledanewallozymesdatasetof53 polymorphiclociand101populationsamplesrangingfromcaliforniatoalaska, withaprimaryfocusonoregon,washington,andsouthernbritishcolumbia. Principalcomponentsanalysis(PCA)andananalysisofgeneticdistancesidentified sevenmajorgeneticclusters(figure2). 17
18 Figure2 Dendrogramusing53polymorphicallozymeslociandbasedonpariwisegeneticdistance values(csechorddistance)between101samplesofcohosalmonfromthepacificnorthwest.clustervi includespopulationsfromthenorthernwashingtoncoast,straitofjuandefuca,pugetsound,and southernbritishcolumbia.populationsfromthesouthwestwashingtoncoastandthecolumbiariver areinclustervii.reproducedfromweitkampetal.(1995). 18
19 PopulationsfromPugetSoundandsouthernBritishColumbiagenerally clusteredtogetherandweredistinctfrompopulationsintheinteriorfraserriver. ThesinglepopulationintheStraitofJuandeFuca(HokoRiver)andthosealongthe northernwashingtoncoastclusteredtogetherandweremostgeneticallysimilarto thepugetsound/southernbritishcolumbiacluster.samplesfrompopulations alongthesouthernwashingtoncoastandfromthecolumbiariverformedanother ofthemajorclustersandweredistinctfrombothmorenorthernandsouthern populations.weitkampetal.(1995)notedthattheallozymedataalsorevealedhigh levelsofgeneticheterogeneitywithinthegreaterolympicpeninsula/puget Sound/StraitofGeorgiaareaindicatingfairlyhighreproductiveisolationof individualpopulationsorgroupsofpopulations. SubsequenttotheanalysisconductedbyWeitkampetal.(1995),genetic relationshipsamongcohopopulationsinsouthwestwashingtonandthelower ColumbiaRiverwereinvestigatedaspartofanexaminationofhistoricalpopulation structureofpacificsalmonidsintheregion(myersetal.2006).myersetal.(2006) reviewedastudyconductedbygeneticistsatthecanadiandepartmentoffisheries andoceansthatusedfourmicrosatellitednalociandonehistocompatibilitylocus (Shakleeetal.1999).AlthoughtheShakleeetal.(1999)datasetincludedonlytwo lowercolumbiariver(cowlitzandlewisrivers),thosesamplesformedacluster thatwasdistinctfromtwosamplesfromthesouthwestwashingtoncoastwhich weregeneticallysimilartoseveralsamplesfromthenorthernwashingtoncoast. Myersetal.(2006)alsoanalyzedanallozymedatasetthatincludednewdatanot availableduringthe1994statusreview(teeletal.2003).inthatanalysis,samples fromcolumbiariverandsouthwestwashingtoncohosalmonpopulationsalso formedseparateclusters(figure3). NewInformationonWashingtonStateandSouthernBritishColumbiaESUs LifeHistoryandGeneticalCharacteristics Lifehistorycharacteristics.Asdescribedabove,onelineoflifehistory evidencethatindicatedmajorchangescoastwidewasthemarinedistributionsof cohosalmonbasedonrecoveriesofcodedwiretagged(cwt)hatcheryfish. WeitkampandNeely(2002)redidthisanalysis,usingthesamecodedwiretag (CWT)databasebutincludingmorehatcheries(90vs.60)andsmallerandtherefore morenumerousrecoveryareastohelpunderstandhowmarinedistributionsvaried betweenhatcheriesandregions.theyalsoincluded36wildpopulationsintheir analysistoevaluatetheinfluenceofhatcheryeffectsonmarinedistributions.like theearlieranalysis,theyfoundthatwildandhatcherysalmonfromthesame freshwaterregionsharedacommonrecoverypattern,andthattherecovery patternsabruptlychangedacrossregions,withlittleornotransitionbetween regions. 19
20 Figure3 Figure3.(Myersetal.2006)Multidimensionalscalingandminimumspanningtreeof pairwisechorddistancevalues(cavalli SforzaandEdwards1967)among27samplesofcohosalmon fromlowercolumbiariverandsouthwestwashingtoncoast.analysiswasbasedondatafor61gene loci.samplesfromlowercolumbiariverpopulationsareidentifiedbywhitesquares;thosefrom southwestwashingtonareidentifiedbyblacksquares.numericcodescorrespondtothoseintable1of Myersetal.(2006). ForcohosalmonfromWashingtonandsouthernBritishColumbia,the analysisindicatedseveraldiscretegroupsbasedongeographiclocationofthe populations(figure4).whetheronlyhatcherypopulationswereconsideredor bothhatcheryandwild,thepatternsweresimilar.inparticular,hatcheryandwild cohosalmonpopulationsfromstraitofgeorgia(clusterfinfigure4),pugetsound andeasternstraitofjuandefuca(clusterh),washingtoncoastandwesternstrait ofjuandefuca(clusteri)andlowercolumbiariver(clusterj)eachformedwell separatedclusters.thedividinglinebetweenclustershandi(pugetsoundand Washingtoncoast)occurredbetweentheDungenessandElwhahatcheries (hatcheries55and56,respectively,infigure4). GeneticReviewforCohoSalmon Geneticalcharacteristics.TheDNAdatasetforBritishColumbiacohosalmon reportedbyshakleeetal.(1999)andthesubsequentanalysesofthosedataby Beachametal.(2001)includedseveralsamplesfromtheWashingtoncoast,Straitof JuandeFuca,andPugetSound.Intheiranalyses,Washingtonsampleswere geneticallydistinctfrombritishcolumbiasamples.withinthewashingtoncluster, coastalpopulationsclusteredseparatelyfromaclusterthatincludedpopulationsin 20
21 PugetSound,HoodCanal,andJuandeFuca(DungenessandElwha).Anotherrecent geneticstudyofcohosalmonanalyzed11microsatellitednalociinsamples rangingfromcaliforniatosouthernbritishcolumbiaincluding29populationsin coastalwashingtonandpugetsoundand11inthelowercolumbiariver(van Doorniketal.2007).Theiranalysisrevealedsixmajorclustersofpopulations includingacolumbiarivercluster,awashingtoncoastcluster,aclusterofpuget SoundandHoodCanalpopulationsandasouthernBritishColumbiacluster(Van Doorniketal.2007,Figure5).TheColumbiaRiverpopulationgrouphad Figure4 Dendogrambasedonmarinerecoverypatternsof90hatcheryand36wildcohosalmon population.namesindicatethefreshwaterreleaseregion.reproducedfromweitkampandneely (2002). 21
22 22
. thehighestbootstrapvalueamongtheclusters(97%)illustratingstrongsupportfor geneticdifferentiationfromcoastalpopulations.")
23 Figure5 Neighbor joiningdendrogramgeneratedfromcavalli SforzaandEdwards (1967)chord distancesfor84cohosalmonsamplescollectedwithinsixregionsofthepacificcoast.bootstrapvalues (%)fortheregionsareshown.reproducedfromvandoorniketal.(2007). thehighestbootstrapvalueamongtheclusters(97%)illustratingstrongsupportfor geneticdifferentiationfromcoastalpopulations.lowerbootstrapvalueswere associatedwiththewashingtoncoast(24%),pugetsound/hoodcanal(28%)and southernbritishcolumbia(33%)clusters.vandoorniketal.(2007)discussed theirfindingsrelativetoesudeterminationsandtothepopulationstructuring reportedinpreviousstudies.theyobservedageneralconcurrencewithearlier cohosalmongeneticstudies,includingrelativelyweakgeographicpopulation structureoverall.additionally,concurringwithbeachametal.(2001),theyfound thatpugetsoundpopulationsandthoseinbritishcolumbiawerecloselyrelated, butclusteredseparately.vandoorniketal.(2007)alsonotedthatincontrastto Beachametal.(2001),theyfoundthatsamplesfromtheStraitofJuandeFuca (Hoko,ElwhaandDungenessriversandSnowCreek)weregeneticallymoresimilar towashingtoncoastalpopulationsthanthoseinpugetsound. 23
24 ArecentgeneticstudyofPacificsalmonintheElwhaRiverincluded microsatellitednadataforseveralcohosalmonpopulationsinjuandefuca (Winansetal.2008).WeusedthesenewdatacombinedwiththedataofVan Doorniketal.(2007)toevaluategeneticrelationshipswithinandamongregional groupsofhatcheryandnaturallyproducedcohosalmoninthepacificnorthwest (Table4). Table4 MeanpairwiseFstvaluesbetweenregionalgroupingsofPacificNorthwestcohosalmon populations.valueswerecomputedusing11microsatellitednalociandcomparisonswereconducted betweenindividualpopulationsineachregion.boldvaluesarecomparisonswithineachregion.data arefromvandoorniketal.(2007)andwinansetal.(2008). PopulationorRegion EastVancouverIsland SouthernBCmainland LowerFraserRiver PugetSound/HoodCanal JuandeFuca NorthernWashingtoncoast SouthernWashingtoncoast ColumbiaRiver AverageFstvalues(ametricindicatingtheamountofgeneticdifferentiation) incomparisonsofpopulationswithinregionsweremostlysmallerthanvaluesin among regioncomparisons(range= ).Thelargestwithin regionfst valuewasforeastvancouverisland(0.023)largelyduetothedivergenceeffectof thegoldstreamhatcherypopulation.thesecondlargestwithin regionfstwasthe northernwashingtoncoastgroup(0.021)primarilybecausetheofthenaturaland hatcherysummer runcohosalmonpopulationsinthesolducriver,whichwere geneticoutliers.among regioncomparisonsshowedthatcolumbiariver populationswerethemostgeneticallydistinctgroupofpopulationsintheanalysis ( ).Moderatelevelsofdifferentiationwereevidentforcomparisonsof PugetSound/HoodCanalpopulationswithStraitofGeorgiapopulations( )andwithnorthernWashingtoncoastalpopulations(0.028).Thevaluesfor bothoftheseamong regioncomparisonswerelargerthanthewithin PugetSound/ HoodCanalcomparisons(0.019).AveragevaluesforJuandeFucapopulationsin comparisonswithpugetsound/hoodcanal(0.019)weresmallerthanin comparisonswithnorthernwashingtoncoastalpopulations(0.025).thedifference inthesetwosetsofcomparisonswaslargelyduetocomparisonsinvolvingsolduc summerrunsamples.whenthosesampleswerenotincludedintheanalysis,juan defucapopulationshadthesameaveragefstvaluesincomparisonswiththe northernwashingtoncoastaswithpugetsound/hoodcanal. Otherinformation.BecausecohosalmonwerethefirstPacificsalmon speciesforwhichcoast wideesusweredelineated,boundariesforotherpacific salmonesuswerenotavailableforcomparison.thisbiogeographicinformationis usefulbecauseitindicateshowotherpacificsalmonspeciesrespondtothesame suiteofenvironmentalconditionsthatcohosalmoninteractwith.westcoastesus 24
25 havebeendelineatedforpink(hardetal.1996),chum(johnsonetal.1997), sockeye(gustafsonetal.1997),andchinooksalmon(myersetal.1998),and steelhead(busbyetal.1996).eachnativesockeyesalmonpopulationisconsidered anesu,sothepatternofsockeyesalmonesusprovideslittleinsighttocohosalmon. ForspecieswithmultiplepopulationsperESU,ESUconfigurationsin WashingtonState(excludingtheColumbiaRiver)andsouthernBritishColumbiaare somewhatvariablealthoughmosthaveseveralbreakpointsincommon.for example,withinthesalishsea,esusfortwospecies(chinooksalmon,steelhead) didnotcrosstheborderintocanadabutmoreorlessstoppedattheborder(the NorthForkoftheNooksackRiverbeingthenorthern moststream).bycontrast, oddyearpinkandfallchumsalmonesus,likecohosalmon,includedbothpuget SoundandtheStraitofGeorgia.WhetherSalishSeaESUsdidordidnotinclude Canadianpopulations,however,inallcasestheElwhaRiverwasincludedinthe PugetSoundESU,ratherthanintheOlympicPeninsulaorWashingtonCoastESU. ForWashingtonCoastESUs,therewasconsiderablediversityinESU configurations.chinooksalmonhaveasinglewashingtoncoastesu,which stretchesfromjustwestoftheelwhariverto(butnotincluding)thelower ColumbiaRiver.ChumsalmonhaveasimilarESUconfigurationtoChinooksalmon, exceptthatitalsoincludestheoregoncoasttothesouthernendofthespecies range(alsoexcludingthelowercolumbiariver)andwasappropriatelynamedthe PacificCoastESU.Steelhead,liketheoriginalcohosalmonconfiguration,havetwo ESUsontheWashingtonCoast:anOlympicPeninsulaESUandaWashingtonCoast ESUwhichincludestheColumbiaRiverdownstreamoftheCowlitzRiver. Finally,conservationunits(CUs)havebeententativelydesignedforPacific salmonpopulationsinbritishcolumbia(holtbyandciruna2007).althoughnot identicaltoesus,thefoundationofconservationunitsissimilarinthattheyare basedonhabitat,lifehistoryandgeneticdiversity,andareintendedtocapturethe majorblocksofdiversityexhibitedbypacificsalmonwithinbritishcolumbia. Forcohosalmon,43CUshavebeenidentified,including5withinthe CanadianportionofthePugetSound/StraitofGeorgiaESUs.TheseCUsare:Lower FraserA,LowerFraserB,Howe Burrard(immediatelynorthoftheFraserRiver), BoundaryBay(immediatelysouthoftheFraserRiver),GeorgiaStraitMainland,and GeorgiaStraitEastCoastofVancouverIsland. Conclusions Based on the new genetic and life history information presented here, it appears that there is new information that indicates that the current ESU configuration for Washington Coast, Strait of Juan de Fuca, Puget Sound, and Strait of Georgia coho salmon populations would benefit from additional review. Both genetic and life history (marine distribution) information suggest that there is geographically-based diversity within the Puget Sound/Strait of Georgia ESU which warrants further examination. Doing so may result in a Puget Sound ESU that, like Chinook and steelhead ESUs, does not include Canadian populations. For Washington coast populations, the new information also indicates that a single Washington coast ESU may be most consistent with the data. However, where the boundary for it and the Puget Sound ESU should be placed will need further consideration. 25
26 LowerColumbiaRiverandMiddleColumbiaRiverBoundaries 7 Thissectionreviewsnewinformationregardingtheboundariesbetweenthe LowerColumbiaRiverChinooksalmonESUandtheMiddleColumbiaRiverChinook salmonspringrunesu,betweenthelowercolumbiariversteelheaddpsandthe MiddleColumbiaRiversteelheadDPS(Figure6).Theseboundarieshavebeen uncertainduetolimitedorambiguousdata.here,wehavereviewnewgenetic informationthatmayhelpclarifytheseboundaries.specifically,newanalyseshave utilizedmicrosatellitednabasedmeasuresofgeneticvariationratherthantheless sensitiveallozymebasedmethodsusedinearlierreviews.insomecasesnew sampleshavebeenaddedtotheanalysis,butthemajorityofthesamplesarethe sameonesusedintheinitialbrtassessments. 7 Sectionauthors:JimMyers,JonHess,MelaniePaquin,andPaulMoran. 26

27 Figure6 CurrentboundariesbetweentheLowerandMiddleColumbiaRiversteelheadDPSs.The currentboundarybetweenthelowerandmiddlecolumbiariverchinooksalmonesusrunsbetween thewhitesalmonandtheklickitatriversandthehoodanddeschutesrivers. InformationrelatedtotheoriginaldelineationofsteelheadDPSboundariesinthe ColumbiaRiver Busbyetal(1996)reviewedbiologicalandgeographicinformationon steelheadpopulationsinthecolumbiariver.intheidentificationofdps(thenesu) boundarybetweenthelowercolumbiaandmiddlecolumbiariverdpss,the characteristicsofthebigwhitesalmonriverandklickitatriversteelhead populationswerefoundtobeintermediatetothetwodps,orsharingsome characteristicswitheitherofthedps.fifteenmilecreek,whichisupstreamofthe HoodandKlickitatRiversatRKm309(butbelowthehistoricallocationofCelilo Falls),containsonlywinter runsteelhead.oregondepartmentoffishandwildlife includesseveralsmalltributaries,mosier,mill,andfifteenmilecreeksintheirmid ColumbiaGeneConservationGroup(Kostow1995). DespitethefactthatFifteenmileCreekcontainsonlywinter runsteelhead, Busbyetal(1996)assignedthispopulationtotheMiddleColumbiaRiverDPSbased 27
28 primarilyongeneticsimilaritytointeriorcolumbiariverbasinsteelhead. Alternatively,allozymeanalysisbyShrecketal.(1984)foundthatFifteenmileCreek looselygroupedwithlowercolumbiariverpopulations,althoughthedendrogram clusteredfifteenmilecreekwithskamaniahatcherypopulationsandsomesnake Riverpopulations. SubsequentanalysisbyCurrens(1997)indicatedthatsteelheadfrom FifteenmileCreekareintermediatetoCoastalandInteriorColumbiaBasinsteelhead populationswithanaffinitytointeriorpopulations(figure7).phelpsetal.(1997) groupedadultsteelheadandjuvenileo.mykissfromthebigwhite,littleklickitat, andklickitatriverswiththeinlandmajorancestrallineage(mal)forsteelhead. Samplesfromtheseriversformedtheirowndendrogramclusterrelativetoother Inlandsteelheadsamples.LateranalysisbyPhelpsetal.(2000)indicatedthattheO. mykissfromtheyakimaandklickitatriversweredistinctfromeachother. Additionally,Phelpsetal.(2000)observedthatthereappearedtobelittle introgressionbyhatchery(skamaniahatchery)summerrunsteelheadon presumptive native summersteelheadsamples.alternatively,rawding(1995)in alettertothebrtsuggestedthattheeasternboundaryofthecoastalo.mykiss shouldbeattheklickitatriver.rawdingsuggestedthattheruntiming,age structure,andlifehistoryofklickitatriversteelheadwasmoresimilartocoastal forms. Figure7 Figure6.UPGMAdendrogramofLowerColumbiaandDeschutesRiversteelheadbasedonCSE chorddistances.datafromcurrens(1997).graphfrommcclureetal.(2003).lowercolumbia populationsareingreen,interiorcolumbiapopulationsareinred.eightmilecreeko.mykissare thoughttoberesidentrainbowtrout(currens1997). GeographicandEcologicalCharacteristics 28
29 IncontrasttotheothersteelheadpopulationsintheMiddleColumbia SteelheadDPS,theBigWhiteSalmonandKlickitatriversandFifteenmileCreekare locateddownstreamfromthedallesdam,nearthehistoricallocationofcelilofalls (RKm320),animportanthistoricalmigrationobstacle,whichnowliessubmerged undercelilolakefollowingtheconstructionofthedallesdamin1957.celilofalls alsoliesnearthecascadecrest,whichdemarksthetransitionbetweenthewetter westerncascadeslopesandthedrierinteriorcolumbiariverbasin.thebigwhite SalmonandKlickitatRiverbasinsalsolieinthewithintheEasternCascade EcoregionratherthantheColumbiaBasinEcoregionthatliesimmediatelytothe eastoftheklickitatriver.fifteenmilecreekliesinthecolumbiabasinecoregion. TheBigWhiteSalmonRiverenterstheColumbiaRiveratRKm270,downstreamof themouthofthehoodriver,rkm272(winterandsummersteelheadfromthe HoodRiverweredesignatedasbeingpartoftheLowerColumbiaRiverDPS),while theklickitatriverentersthecolumbiariveratrkm289.shrecketal.(1984) determinedthatenvironmentalconditionsintheklickitatandhoodriverswere mostsimilartofifteenmilecreekusingparameterssuchasgradient,precipitation, landformcategory,geologicalcategory,vegetationtype,soiltype,elevation,and distancetothemouthofthecolumbiariver. LifeHistoryandGeneticalCharacteristics MostMiddleColumbiaRiversteelheadsmoltat2yearsofageandspend1to 2yearsinsaltwaterpriortore enteringfreshwater.withinthemiddlecolumbia RiverSteelheadDPS,theKlickitatRiverisunusualinthatitproducesbothsummer andwintersteelhead,andthesummersteelheadaredominatedby2 ocean steelhead,whereasotherriversinthisregionproduceaboutequalnumbersofboth age 1 and2 oceamsteelhead(table5).busbyetal.(1995)notedthatthebrt considereddifferentscenariosforthecompositionofthemiddlecolumbiariver DPSwithrespecttothedownstreamandupstreamboundaries.Lifehistory informationforklickitatriversteelheadismoresimilartolowercolumbiariver SteelheadthantootherpopulationswithwithintheMiddleColumbiaRiverDPS; additionally,schrecketal.(1986)placedklickitatriversteelheadinthecoastal steelheadbasedongenetic,morphometric,meristicandlifehistorycharacteristics. However,aswasdescribedabove,othergeneticanalyses(Phelpsetal.1994,Leider etal.1995)suggestacloseraffinityforklickitatriversteelheadwiththeinland steelheadgroup.busbyetal.(1996)indicatedthattherewasconsiderable variabilityintherelativerelationshipbetweendifferentsamplesfromtheklickitat River,suggestingthattemporalsamplesmightrepresentfishfromdifferentnative, resident,orhatcherypopulations. Table5 Oceanagefrequencyforselectedsteelheadpopulations.Dataarefromadultsteelheadand indicateageatthefirstspawningmigration.tableisadaptedfrombusbyetal.1996.datafromhowell etal.(1985)exceptwhereindicated. Population Run type N 29
30 CowlitzR. O KalamaR. O KalamaR. S WashougalR. O WindR. S HoodR. O * HoodR. S * KlickitatR. S DeschutesR. S JohnDayR. S *DatafromKostow2003 NewInformationonLowerColumbiaandMiddleColumbiaRiverSteelhead. In1998,theWestCoastSteelheadBRTreviewedinformationregardingthe UpperWillametteandMiddleColumbiaRiverDPSs(Busbyetal1999).Inresponse totheinitialfindingsofthebrt,odfwsuggestedthatthemiddlecolumbiariver DPSbeadjustedsothatthewinter runpopulations(e.g.fifteenmilecreek)be includedinthelowercolumbiariverdps.atthetime,therewasnonewbiological informationavailabletojustifytheredelineationofthedpsboundaries.thebrt didacknowledgethetherewasconsiderableuncertaintyregardingthedps boundariesandthatamoreintensivereviewofexistinggeneticandecological, environmentalandlifehistoryinformationwaswarranted. TherelationshipbetweensteelheadpopulationsintheWhiteSalmon, Klickitat,Hoodrivers,andFifteenmileCreekandCoastalandInlandlineages remainedtopicaloutsideofthebrtdiscussions.o.mykisspopulationsalongthe CascadeCrestwereidentifiedasatransitionalzonebetweencoastalandinland residentandanadromousform(benhke2002). SincetheinitialdelineationoftheDPSboundariessubstantialnewgenetic informationhasbecomeavailable.insomecasespreviouslyanalyzedsampleshave beenreanalyzedusingmicrosatellitednamarkersinsteadofallozymemarkers.in general,microsatellitednaismorevariableandthereforemayprovideafinerlevel ofresolutioninpopulationanalysis.additionally,newgeneticsampleshavebeen acquiredfrompresumptivepopulationsinareaofthecascadecrest.astudyby Winansetal.(2004)indicatedthatsteelheadsamplesfromtheKlickitatRiverwere distinctfromsteelheadinthemiddleanduppercolumbiariveraswellasthesnake River;however,therewerenoLowerColumbiaRiversamplesincludedinthe analysisandthemajorityofthesampleswerecollectedintheearly1990s,aperiod whenthemarkingofhatcherysteelheadwasnotcommonplace.therewas considerablevariabilityintherelationshipsamongthefoursamplesitesinthe KlickitatRiver:LowerKlickitatRiver,BowmanCreek,UpperKlickitatRiver,and LittleKlickitatRiver,suggestingthatdifferentsourcepopulationswerebeing sampled(includingpossiblehatchery originsummerrun).amorerecentstudyby Narumetal.(2006)usingDNAmicrosatelliteanalysis,indicatedthattherehadbeen minimalintegrationbetweennaturally producedandhatcheryorigin(skamania 30
31 Hatchery)summerrunsteelhead.Unfortunately,therewerenoout of basin populationsincludedintheanalysisandtherelationshipbetweennatural populationsintheklickitatriverandthoseinthelowercolumbiaandmiddle ColumbiasteelheadDPSswasnotassessed. Kostow(2003)indicatedthatFifteenmileCreekwastheeasternmostbasin inthecolumbiariverthatcontainedcoastalcutthroattrout(o.clarki).thiswould furtherunderscorethehistoricalimportanceofcelilofallsasabiologicalboundary betweencoastalandinlandassemblages. AstudybyHessetal.(2008)reanalyzedsamplesfromtheKlickitatand WhiteSalmonRivers(includingbothanadromousandresidentO.mykiss).Inthis comparisonthewhitesalmonandklickitatriversampleswereintermediate betweencoastalandinteriorpopulations,withsamplesfrom8and15milecreeks clearlylyingintheinteriorclusterofsteelheadpopulations(figure8).outliersin thewhitesalmonriverwereresidentfishlocatedabovelongstandingnatural barriers(althoughtherewassomesuggestionthatrainbowtroutmayalsohave beenstockedintheseheadwaterregions). Figure8 Principalcomponentsanalysisofallelefrequencydataforsteelheadpopulationinthe ColumbiaRiverBasin.Theanalysisisbasedonallelefrequenciesat12microsatelliteloci.Eachsymbol representsapopulationsample,andthedistancebetweensymbolsisproportionaltothegenetic differencesbetweentherespectivepopulations.colorscorrespondtofourdps:thelower,middleand UpperColumbiaRiver,andtheSnakeRiver.ReproducedfromHessetal.(2008). InformationrelatedtotheoriginaldelineationofChinookDPSboundariesinthe ColumbiaRiver 31
32 ThecoastwideChinooksalmonBRT(Myersetal.1998)initiallyreviewed biologicalandgeographicinformationonchinookpopulationsincalifornia,idaho, Oregon,andWashington.IntheidentificationoftheboundarybetweentheLower ColumbiaandMiddleColumbiaRiverESUs,availablelifehistorycharacteristics werereviewed.theconstructionofconditdam(rkm4)onthebigwhitesalmon Riverin1913eliminatedanadromousaccesstothemajorityofthebasin.Thereis littlehistoricaldocumentationavailableregardingthecharacteristicsofthespring andfall runchinookthatexistedinthebigwhitesalmonriverotherthanthe existenceofthoseruns.fall runfishfromthebigwhitesalmonwereusedto establishtheu.s.bureauoffisheriesspringcreekhatchery,laterthespringcreek NFH,in1901.TheSpringCreekNFHfall runpopulationhasbecomethedefacto representativesampleforthehistoricalwhitesalmonriverpopulations. GeographicandEcologicalCharacteristics TheMiddleColumbiaspring run ChinooksalmonESUincludesonepopulationlocateddownstreamfromtheDalles Dam(CeliloFalls),theKlickitatRiverspringrun.CeliloFallsalsowashistorically locatednearthecascadecrest,whichdemarksthetransitionbetweenthewetter westerncascadeslopesandthedrierinteriorcolumbiariverbasin.thebigwhite SalmonandKlickitatRiverbasinsalsoliewithintheEasternCascadeEcoregion ratherthanthecolumbiabasinecoregionthatliesimmediatelytotheeastofthe KlickitatRiver.TheBigWhiteSalmonRiverenterstheColumbiaRiveratRKm270, downstreamofthemouthofthehoodriver,rkm272(winterandsummer steelheadfromthehoodriverweredesignatedasbeingpartofthelowercolumbia RiverDPSandHoodRiverspringandfall runchinooksalmonarepartofthelower ColumbiaRiverESU),whiletheKlickitatRiverenterstheColumbiaRiveratRKm 289. LifeHistoryandGeneticalCharacteristics Historically,onlyspring run ChinooksalmonwerepresentintheKlickitatRiver.LyleFalls,actuallyaseriesof fallsandcascadesnearthemouthoftheklickitatriver(rkm2),wasapparentlya barriertofall runchinooksalmon(thesefishwouldhavereturnedduringlowflow conditionsatthefalls).rawding(1998)suggeststhatfall runchinooksalmonmay havespawnedinkilometerortwoofriverthatexistedbelowthefalls.muchofthis fall runhabitatwasinundatedwiththefillingofthebonnevillepoolinthe1930s. ThereissomediscussionintheChinookSalmonStatusReview(Myersetal.1998) regardingthestatusoftheklickitatriver.marshalletal.(1995)reportedthatthe springrunintheklickitatriverhassomegeneticandlife historysimilaritiesto LowerColumbiaRiverspringruns(Figure9).WDFWincludedtheKlickitatRiver spring runintheirlowercolumbiarivermajorancestrallineage(mal).genetic analysisofchinooksalmoninthecolumbiariver,runaspartofthecoastwide statusreview,indicatedthatklickitatriverspringrunfishwereintermediate betweenlowercolumbiariverocean typechinooksalmonandmid Columbia Riverstream typechinooksalmon 32
33 Figure9 DendrogramofLowerColumbiaRiverChinookSalmonpopulations.Reproducedfrom Marshall
inalateranalysisofLowerand Mid ColumbiaRiverChinooksalmonsamplesfoundthattheKlickitatRiverspring runchinooksampleclusteredmostcloselywiththenflewisriver,cowlitzriver,")
34 (Figure10)(Myersetal.1998).Marshall(1998)inalateranalysisofLowerand Mid ColumbiaRiverChinooksalmonsamplesfoundthattheKlickitatRiverspring runchinooksampleclusteredmostcloselywiththenflewisriver,cowlitzriver, andkalamariverspring runchinooksalmonsamples. Figure10 Multidimensionalscaling(MDS)ofCavalli SforzaandEdwards(1967)chorddistancesbased on31allozymelocibetween55compositesamplesofchinooksalmonfrompopulationsinthecolumbia Riverdrainage.TheOcean/StreamlinewasaddedsubsequenttothedecisiontoplaceKlickitatspring runinthemiddlecolumbiariverspringrunesu. BasedontherecoveriesfromhatcheryoriginCWTmarkedfish,veryfewfish wererecoveredfromcoastalfisheries,acharacteristicassociatedwithstream type fish.agedatatakenfromscalesduringtheearly1900sindicatedthatklickitatriver springrunfishoutmigratedasyearlings(rich1920).finally,vertebralcountsfrom KlickitatRiverspring runfishclusteredwithinteriorcolumbiariverbasinstreamtypechinookpopulations(schrecketal.1986).usinganindexofgenetic, morphometric,andecologicalinformation,schrecketal.(1986)concludedthatthe KlickitatRiverspringrundidnotclusterwitheitherlowerorupperColumbiaRiver Chinooksalmonpopulations.Theresultsofthestudiesdonepriortothe1998 StatusReviewwerethoughttobeconfoundedbythereleaseofChinooksalmon frombothlower(cowlitzandwillametteriver)andupper(carsonnfh)river sources(myersetal.1998). NewInformationonLowerColumbiaandMiddleColumbiaRiverChinooksalmon ESUs. 34

35 AswiththesteelheadpopulationsintheColumbiaRiverBasin,abasinwide Chinooksalmonmicrosatellitebaselinehasbeenrecentlydeveloped.CWT recoveriesfromklickitathatcheryspringrunchinooksalmonfrom1997to2007 weresimilartothoseexaminedbythebrtinthe1990s;afewspringrunchinook salmonwererecoveredinthecoastalfisheries(fromcaliforniatoalaska).whether theserecoveriesareindicativeofthetransitionalnatureofthepopulation(from oceantostreamtype)orsimplyrandomrecoveriesremainsunclear. ReanalysisofColumbiaRiverChinooksalmonusingmicrosatelliteDNA variabilitypresentsacomplicatedpictureofpopulationstructurewithinthe KlickitatRiver(Hessetal.2010).TheKlickitatHatcherysampleismorealigned withinterior(stream type)springrunpopulations,whilethenaturallyspawning springrunchinooksalmonappeartobeamixturebetweencoastalandinterior lineages(figure11).itisalsonotcleartowhatdegreeout of basinintroductions intotheklickitathatcheryhaveinfluencedthepresentgeneticstructure,orwhether fall runchinooksalmon(providedaccesstotheupperriverviaafishladderbuiltin the1950s)mayhaveinterbredwithspringrunchinookonthenaturalspawning grounds. Figure11 ProportionofsamplethatassignedtothreemajorColumbiaRiverChinooklineages. ReproducedfromHessetal.(2010). Conclusions TheboundarybetweencoastalandinteriorpopulationsofChinooksalmon, cohosalmonandsteelheadcoincideswithamajorbiogeographicbarrierthatlies alongthecascadecrest,andforaquaticspeciesmayhavebeendelineatedbycelilo Falls.Lifehistory,genetic,andecologicalinformationindicatethattheBigWhite SalmonandKlickitatRiverbasinsformpartofatransitionalzonebetweenthetwo regions.atthetimeofthecoastwidestatusreviewsinthemid 1990s,therewas considerabledisagreementontheplacementofpopulationswithinthistransitional zone.newinformation,primarilydnamicrosatellitevariation,underscoresthe transitionalnatureofpopulationsinthisarea.theextirpationandpotential 35
36 alternation(viahatcherytransfers)ofsomepopulationsfurthercloudstheissueof populationassignment.withinthetransitionzoneitisrelativelyclearthatthe HoodRiversteelheadareassociatedwithLowerColumbiaRiverpopulations(based onpreviousandcurrentstudies)andgiventherelativelocationsofthemouthsof thehood,bigwhite,andklickitatrivers,thelackofdefinitivegeneticinformation, andsomelife historyinformationsuggestionsconnectionswiththelowerriver,it maybereasonabletoassignthebigwhiteandklicktatriversteelheadtothelower ColumbiaRiverDPS.The15 milecreekpopulation,however,appearstobeclearly associatedwiththeinteriorcolumbiasteelheadlineage. GiventhetransitionalnatureoftheKlickitatRiverChinooksalmon populationitmightbereasonabletoassignthatpopulationtothelowercolumbia RiverChinooksalmonESU.AscohopopulationsinthegorgeandinteriorColumbia regionshavebeenlargelyextirpated,geneticanalyseshavenotbeenconductedof cohointhisregion.theoriginallowercolumbiacohoesuboundarywasassigned basedlargelyonextrapolationfrominformationabouttheboundariesforchinook andsteelhead.itmaythereforereasonabletoassigntheklickitatpopulationtothe LowerColumbiacohoESU.ThiswouldestablishacommonboundaryforChinook salmon,cohosalmon,chumsalmon,andsteelheadatthecelilofalls(dallesdam). References Beacham,T.D.,J.R.Candy,K.J.Supernault,T.Ming,B.Deale,A.Schulze,D.Tuck,K. H.Kaukauna,J.R.Irvine,K.M.Miller,andR.E.Wither.2001.Evaluationand applicationofmicrosatelliteandmajorhistocompatibilitycomplexvariation forstockidentificationofcohosalmoninbritishcolumbia.transactionsof theamericanfisheriessociety130: Benhke,R.J.2002.TroutandsalmonofNorthAmerica.FreePress,NewYork. Bjorkstedt,E.P.,B.C.Spence,J.C.Garza,D.G.Hankin,D.Fuller,W.E.Jones,J.J.Smith, andr.macedo.2005.ananalysisofhistoricalpopulationstructurefor evolutionarilysignificantunitsofchinooksalmon,cohosalmon,and steelheadinthenorth CentralCaliforniaCoastRecoveryDomain.NOAA TechnicalMemorandumNOAA TM NMFS SWFSC p. Boughton,D.A.,H.Fish,K.Pipal,J.Goin,F.Watson,J.Cadagrande,J.Cadagrande,and M.Stoecker.2005.Contractionofthesouthernrangelimitforanadromous Oncorhynchusmykiss.NOAATechnicalMemorandumNOAA TM NMFS SWFSC p. Boughton,D.A.,P.B.Adams,E.Anderson,C.Fusaro,E.Keller,E.Kelley,L.Lentsch,J. Nielsen,K.Perry,H.Regan,J.Smith,C.Swift,L.Thompson,andF.Watson SteelheadoftheSouth Central/SouthernCaliforniaCoast:population characterizationforrecoveryplanning.noaatechnicalmemorandum NOAA TM NMFS SWFSC p. 36
37 Boughton,D.A.,P.B.Adams,E.Anderson,C.Fusaro,E.Keller,E.Kelley,L.Lentsch,J. Nielsen,K.Perry,H.Regan,J.Smith,C.Swift,L.Thompson,andF.Watson Viabilitycriteriaforsteelheadofthesouth centralandsouthern Californiacoast.NOAATechnicalMemorandumNMFS SWFSC 407. Boughton,D.A.,Fish,H.,Pope,J.,Holt,G.2009.Spatialpatterningofhabitatfor Oncorhynchusmykissinasystemofintermittentandperennialstreams. EcologyofFreshwaterFish Busby,P.J.,T.C.Wainwright,G.J.Bryant,L.J.Lierheimer,R.S.Waples,F.W. Waknitz,andI.V.Lagomarsino.1996.StatusreviewofWestCoaststeelhead fromwashington,idaho,oregon,andcalifornia.u.s.dept.commer.,noaa Tech.Memo.NMFS NWFSC 27. Busby,P.,R.Gustafson,G.Matthews,J.Myers,M.Ruckelshaus,T.Wainwright,R. Waples,J.Willliams,P.Adams,G.Bryant,andC.Wingert.1999.Updated reviewofthestatusoftheupperwillametteriverandmiddlecolumbia RiverESUs[sic]ofsteelhead(Oncorhychusmykiss).WestCoastSteelhead BiologicalReviewTeamreport36p. Clemento,A.J.,E.C.Anderson,D.Boughton,D.Girman,andJ.C.Garza.Inpress (2009).PopulationgeneticstructureandancestryofOncorhynchusmykiss populationsaboveandbelowdamsinsouth centralcalifornia.conservation Genetics. Garza,J.C.,S.M.Blankenship,C.Lemaire,andG.Charrier.(2008)Geneticpopulation structureofchinooksalmon(oncorhynchustshawytscha)incalifornia s CentralValley.82p. Garza,J.C.,andD.E.Pearse.2008.PopulationgeneticstructureofOncorhynchus mykissinthecaliforniacentralvalley.finalreportforcaliforniadepartment offishandgamecontract#po485303withuniversityofcalifornia,santa CruzandNOAASouthwestFisheriesScienceCenter,110ShafferRd.Santa Cruz,CA p. Hess,J.E.,Paquin,M.,Moran,P.,andMyers,J.2008.Phylogeographyandgenetic characterizationofinlandandcoastalsteelheadlineagesinthecolumbia RiverBasin.Posterprestnedatthe2008CoastwideSalmonGenetics Symposium. Hess,J.E.,Myers,J.,andMoran,P.2010.Examinationofthephylogenetic relationshipsamongcollectionsofcolumbiariverbasinchinook, Oncorhynchustshawytscha,andevolutionaryprocessesthatreducedgenetic diversityofstream typecomparedtoocean typelineages.nwfscreport, datedaugust31,
38 Kostow,K.2003.Evolutionarilysignificantunitboundariesandstatusassessmentin ahighlypolymorphicspecies,oncorhynchusmykiss,inthecolumbiabasin. 18August2003draftrep.NOAAFisheriesServiceandOregonDept.Fishand Wildlife.(AvailablefromODFW,P.O.Box59,Portland,OR97207.) Kostow,K.1995.BiennialreportonthestatusofwildfishinOregon.(Availablefrom ODFW,P.O.Box59,Portland,OR97207.) Lawson,P.W.,E.P.Bjorkstedt,M.W.Chilcote,C.W.Huntington,J.S.Mills,K.M.S. Moore,T.E.Nickelson,G.H.Reeves,H.A.Stout,T.C.Wainwright,andL.A. Weitkamp.2007.IdentificationofhistoricalpopulationsofCohosalmon (Oncorhynchuskisutch)intheOregoncoastevolutionarilysignificantunit. U.S.Dept.Commer.,NOAATech.Memo.NMFS NWFSC 79,129p. Lindley,S.T.,R.Schick,B.P.May,J.J.Anderson,S.Greene,C.Hanson,A.Low,D. McEwan,R.B.MacFarlane,C.Swanson,andJ.G.Williams.2004.Population structureofthreatenedandendangeredchinooksalmonesusin Califrornia scentralvalleybasin.noaatechnicalmemorandumnoaa TM NMFS SWFSC p. Lindley,S.T.,R.S.Schick,A.Agrawal,M.Goslin,T.E.Pearson,E.Mora,J.J.Anderson, B.May,S.Greene,C.Hanson,A.Low,D.McEwan,R.B.MacFarlane,C. Swanson,andJ.G.Williams.2006.HistoricalpopulationstructureofCentral Valleysteelheadanditsalterationbydams.SanFranciscoEstuaryand WatershedScience4(1):Article3 Lindley,S.T.,R.S.Schick,E.Mora,P.B.Adams,J.J.Anderson,S.Greene,C.Hanson,B. P.May,D.R.McEwan,R.B.MacFarlane,C.Swanson,andJ.G.Williams FrameworkforassessingviabilityofthreatenedandendangeredChinook salmonandsteelheadinthesacramento SanJoaquinBasin.SanFrancisco EstuaryandWatershedScience5(1):Article4. Marshall,A.1998.GeneticanalysisofmainstemColumbiaRiver,belowBonneville Dam,Chinookspawners.LettertoK.Harlan(WDFW)fromAnneMarshall (WDFW).2p. McClureM,R.Carmichael,T.Cooney,P.Hassemer,P.Howell,D.McCullough,C. Petrosky,H.Schaller,P.Spruell,andF.Utter.2003.IndependentPopulations ofchinook,steelheadandsockeyeforlistedevolutionarilysignificantunits withintheinteriorcolumbiariverdomain.interiorcolumbiabasin TechnicalRecoveryTeam.171p. Myers,J.,C.Busack,D.Rawding,A.Marshall,D.Teel,D.M.VanDoornik,andM.T. Maher.2006.HistoricalpopulationstructureofPacificsalmonidsinthe WillametteRiverandlowerColumbiaRiverbasins.U.S.Dept.Commer., 38
39 NOAATech.Memo.NMFS NWFSC 73.Onlineat Narum,S.,M.S.Powell,R.Evenson,B.Sharp,andA.J.Talbot.2006.Macrosatellites revealpopulationsubstructureofklickitatrivernativesteelheadandgenetic divergencefromandintroducedstock.n.amer.j.fish.man.26: Narum,S.R.,M.Banks,T.D.Beacham,R.Bellinger,M.Campbell,J.DeKoning,A.Elz,C. Guthrie,C.Kozfkay,K.M.Miller,P.Moran,R.Phillips,L.Seeb,C.T.Smith,K. Warheit,S.Young,andJ.C.Garza(2008)Differentiatingpopulationsatbroadand finegeographicscaleswithmicrosatellitesandsnps.molecularecology17: Phelps,S.,S.A.Leider,P.L.Hulett,B.M.Baker,andT.Johnson.1997.Genetic analysesofwashingtonsteelhead:preliminaryresultsincorporating36new collectionsfrom1995and1996.progressreport.wdfw.30pp. Phelps,S.,B.M.Baker,andC.A.Busack.2000.Geneticrelationshipsandstockof structureofyakimariverbasinandklickitatriverbasinsteelhead poulations.wdfw.19pp. Rawding,Dan,1995.Whereistheboundarybetweencoastalandinlandsteelhead? LettertoPeggyBusby(NWFSC)fromThomJohnson(WDFW)March31, p. Ruckelshaus,M.H.,K.P.Currens,W.H.Graeber,R.R.Fuerstenberg,K.Rawson,N.J. Sands,andJ.B.Scott.2006.IndependentpopulationsofChinooksalmonin PugetSound.U.S.Dept.Commer.,NOAATech.Memo.NMFS NWFSC 78,125 p. Schick,R.S.,A.L.Edsall,andS.T.Lindley.2005.Historicalandcurrentdistribution ofpacificsalmonidsinthecentralvalley,ca.noaatechnicalmemorandum NOAA TM NMFS SWFSC p. Schreck,C.B.,H.W.Li,C.S.Sharpe,K.P.Currens,P.L.Hulett,S.L.Stone,andS.B. Yamada.1986.StockidentificationofColumbiaRiverChinooksalmonand steelheadtrout.projectno U.S.Dept.Energy,BonnevillePower Administration,Portland,OR.(AvailablefromBPA,P.O.Box3621,Portland, OR97208.) Seeb,L.W.,A.Antonovich,M.A.Banks,T.D.Beacham,M.R.Bellinger,M.Campbell, N.A.Decovich,J.C.Garza,C.M.GuthrieIII,P.Moran,S.R.Narum,J.J. Stephenson,K.J.Supernault,D.J.Teel,W.D.Templin,J.K.Wenburg,S.F. Young,andC.T.Smith.(2007)DevelopmentofastandardizedDNAdatabase forchinooksalmon.fisheries.32:
40 Shaklee,J.B.,T.D.Beacham,L.Seeb,andB.A.White.1999.Managingfisheriesusing geneticdata:casestudiesoffourspeciesofpacificsalmon.fisheries Research.43: Spence,B.C.,E.P.Bjorkstedt,J.C.Garza,J.J.Smith,D.G.Hankin,D.Fuller,W.E. Jones,R.Macedo,T.H.Williams,andE.Mora.2008.Aframeworkfor assessingtheviabilityofthreatenedandendangeredsalmonandsteelheadin thenorth CentralCaliforniaCoastRecoveryDomain.U.S.Departmentof Commerce,NOAATechnicalMemorandumNMFS 423. Teel,D.J.,D.M.VanDoornik,D.R.Kuligowski,andW.S.Grant.2003.Geneticanalysis ofjuvenilecohosalmon(oncorhynchuskisutch)offoregonandwashington revealsfewcolumbiariverwildfish.fish.bull.101: VanDoornik,D.M.,D.J.Teel,D.R.Kuligowski,C.A.Morgan,andE.Casillas Geneticanalysesprovideinsightintotheearlyoceanstockdistributionand survivalofjuvenilecohosalmon(oncorhynchuskisutch)offthecoastsof WashingtonandOregon.NorthAmericanJournalofFisheriesManagement. 27: Waples,R.1991.Pacificsalmon,Oncorhynchusspp.,andthedefinitionof species undertheendangeredspeciesact.marinefisheriesreview53: Weitkamp,L.A.,T.C.Wainright,G.J.Bryant,G.B.Milner,D.J.Teel,R.G.Kope,andR.S. Waples.1995.StatusreviewofcohosalmonfromWashington,Oregon,and California.U.S.Dep.Commer.NOAATech.Memo.NMFS NWFSC 24,258p. Williams,T.H.,E.P.Bjorkstedt,W.G.Duffy,D.Hillemeier,G.Kautsky,T.E.Lisle,M. Mccain,M.Rode,R.G.Szerlong,R.S.Schick,M.N.Goslin,AndA.Agrawal HistoricalpopulationstructureofcohosalmonintheSouthern Oregon/NorthernCaliforniacoastsevolutionarilysignificantunit.NOAA TechnicalMemorandumNOAA TM NMFS SWFSC 390.xxxp. Winans,G.A.,M.M.Paquin,D.M.VanDoornik,B.M.Baker,P.Thornton,D.Rawding,A. Marshall,P.Moran,andS.Kalinowski.2004.Geneticstockidentificationof steelheadinthecolumbiariverbasin:anevaluationofdifferentmolecular markers.northamericanjournaloffish.management.24: Winans,G.A.,M.L.McHenry,J.Baker,A.Elz,A.Goodbla,E.Iwamoto,D.Kuligowski, K.M.Miller,M.P.Small,P.Spruell,andD.VanDoornik.2008.Genetic InventoryofAnadromousPacificSalmonidsoftheElwhaRiverPriortoDam Removal.NorthwestScience.82:
41 ESUstatussummaries 41
42 UpperColumbiaRiverspring runchinooksalmon 8 TheUpperColumbiaSpring RunChinookSalmonESUincludesnaturally spawningspring runchinooksalmoninthemajortributariesenteringthecolumbia RiverupstreamofRockIslandDamandtheassociatedhatcheryprograms (70FR37160).TheESUwaslistedasEndangeredundertheESAin1998(affirmed in2005). SummaryofpreviousBRTconclusions ThepreviousBRTstatusreviewoftheUpperColumbiaRiverSpring Run ChinookSalmonESUwasreportedinGoodetal.(2005).Aslightmajority(53%)of thecumulativevotescastbythebrtmembersplacedthisesuinthe dangerof extinction category,withthenextcategory, likelytobecomeendangered, receivingasubstantialnumberofvotesaswell(45%).the2005brtreviewnoted thatuppercolumbiaspringchinookpopulationshad reboundedsomewhatfrom thecriticallylowlevels observedinthe1998review.althoughthebrtconsidered thisanencouragingsign,theynotedthattheincreasewaslargelydrivenbyreturns inthetwomostrecentspawningyearsavailableatthetimeofthereview.thebrt ratingswerealsoinfluencedbythefactthattwooutofthethreeextantpopulations inthisesuweresubjecttoextremehatcheryinterventionmeasuresinresponseto theextremedownturninreturnsduringthe1990s.goodetal.(2005)statedthat thesemeasureswere...astrongindicationoftheongoingriskstothisesu,although theassociatedhatcheryprogramsmayultimatelyplayaroleinhelpingtorestore naturallyself sustainingpopulations. BriefReviewofRecoveryPlanning TheInteriorColumbiaBasinTechnicalRecoveryTeamhasidentifiedthree extantpopulationswithinthisesu(ictrt,2003).populationswereidentified basedongeneticanalysisandthedistributionofspawningreachesvs.adispersal curvederivedfromcwtrecoveriesfromreturningsupplementationreleases.the threeextantpopulationsrepresentnaturalproductionoriginatingfromspawning areasintheuppersectionsofthewenatcheeriver,entiatriverandmethowriver. Thelowermainstemsectionsofeachoftheseriversalsosupportproductionof SummerRunChinookfromaseparateChinookSalmonESU.OneotherUpper Columbiadrainagethatremainsaccessibletoanadromousfish,theOkanoganRiver, mayhavehistoricallysupportedanadditionalspringchinookpopulation.the ICTRTclassifiedtheextantpopulationsasasingleMajorPopulationGroup(the NorthCascadesMPG).TwolargemainstemColumbiaRiverdams(ChiefJosephDam andgrandcouleedam)blockanadromousaccesstohistoricaltributaryhabitats upstreamoftheextantpopulations.theictrtconcludedthatitislikelythat additionalpopulationsofuppercolumbiaspringchinooksalmonoccupied tributaryhabitatsupstreamoftheseblockages.basedontheamountand distributionofhabitatthatwouldhavebeenhistoricallysuitedtostreamtype Chinookproduction,uptosixadditionalpopulationsmayhaveexistedhistorically upstreamofthecurrentblockages.theictrtrecognizedthatthereissome 8 Sectionauthor:TomCooney 42
43 uncertaintyaswhethersomeoftheseareaswereoccupiedbyspringchinookvs. summerchinook. TRTandRecoveryPlanCriteria NOAAFisheries(NationalMarineFisheriesServiceadoptedarecoveryplan foruppercolumbiaspringchinookandsteelheadin2007(fr72# ).ThePlanwasdevelopedbytheUpperColumbiaSalmonRecoveryBoard (UCSRB)andisavailablethroughtheirwebsite( UpperColumbiaSalmonRecoveryPlan soverallgoalis...toachieverecoveryand delistingofspringchinooksalmonandsteelheadbyensuringthelong term persistenceofviablepopulationsofnaturallyproducedfishdistributedacrosstheir nativerange. Twoincrementallevelsofrecoveryobjectivesarespecificallyincorporated intotheuppercolumbiasalmonrecoveryplan.increasingnaturalproduction sufficientlytoupgradeeachuppercolumbiariveresufrom endangered to threatened statusisstatedasaninitialobjectiveintheplan.theplanincludes threespecificquantitativereclassificationcriteriaexpressedrelativetopopulation viabilitycurves(ictrt,2007).abundanceandproductivityofnaturallyproduced SpringChinookwithineachoftheextantUpperColumbiapopulations,measuredas 8 yeargeometricmeans(representingapproximatelytwogenerations),mustfall abovetheviabilitycurverepresentingtheminimumcombinationsprojectingtoa 10%riskofextinctionover100years.Theplanalsoincorporatesexplicitcriteria forspatialstructureanddiversityadoptedfromtheictrtviabilityreport.the meanscoreforthethreemetricsrepresentingnaturalratesandspatiallymediated processesshouldresultinamoderateorlowerriskineachofthethreepopulations andallthreatsdefinedashighriskmustbeaddressed.inaddition,themeanscore fortheeightictrtmetricstrackingnaturallevelsofvariationshouldresultina moderateorlowerriskscoreatthepopulationlevel. Achievingrecovery(delisting)ofeachESUviasufficientimprovementinthe abundance,productivity,spatialstructureanddiversityisthelonger termgoalof theucsrbplan.theplanincludestwospecificquantitativecriteriaforassessing thestatusofthespringchinookesuagainsttherecoveryobjective; The12 year geometricmean(representingapproximatelythreegenerations)ofabundanceand productivityofnaturallyproducedspringchinookwithinthewenatchee,entiatand Methowpopulationsmustreachalevelthatwouldhavenotlessthana5% extinction risk(viability)overa100yearperiod and ataminimum,theupper ColumbiaSpringChinookESUwillmaintainatleast4,500naturallyproduced spawnersandaspawner:spawnerratiogreaterthan1:1distributedamongthe threepopulations.theminimumnumberofnaturallyproducedspawners (expressedas12yeargeometricmeans)shouldexceed2,000eachforthe WenatcheeandMethowRiverpopulationsand500withintheEntiatRiver. MinimumproductivitythresholdswerealsoestablishedinthePlan.The12year geometricmeanproductivityshouldexceed1.2spawnersperparentspawnerfor thetwolargerpopulations(wenatcheeandmethowrivers),and1.4forthesmaller EntiatRiverpopulation.TheICTRThadrecommendedthatatleasttwoofthethree extantpopulationsbetargetedforhighlyviablestatus(lessthan1%riskof extinctionover100years)becauseoftherelativelylownumberofextant 43
44 populationsremainingintheesu.theucplanadoptedanalternativeapproachfor addressingthethelimitednumberofpopulationsintheesu 5%orlessriskof extinctionforallthreeextantpopulations. TheUpperColumbiaSalmonRecoveryPlanalsocallsfor..restoringthe distributionofnaturallyproducedspringchinooksalmonandsteelheadto previouslyoccupiedareaswherepractical;andconservingtheirgeneticand phenotypicdiversity. SpecificcriteriaincludedintheUCSRBPlanreflecta combinationofthespecificcriteriarecommendedbytheictrt(ictrt,2007)and intheearlierqareffort(fordetal.2001).theplanincorporatesspatialstructure criteriaspecifictoeachspringchinookpopulationinsection4.4.1.forthe WenatcheeRiverpopulation,thecriteriacallforobservednaturalspawninginfour ofthefivemajorspawningareasaswellasinatleastoneoftheminorspawning areasdownstreamoftumwaterdam.inthemethowriver,naturalspawning shouldbeobservedinthreemajorspawningareas.ineachcase,themajor spawningareasshouldincludeaminimumof5%ofthetotalreturntothesystemor 20redds,whicheverisgreater.TheEntiatRiverSpringChinookpopulationincludes asinglehistoricalmajorspawningarea. ThePlancallsformeetingorexceedingthesamebasicspatialstructureand diversitycriteriaadoptedfromtheictrtviabilityreportforrecoveryasfor reclassification(seeabove). NewDataandUpdatedAnalyses AnnualabundanceestimatesforeachoftheextantpopulationsinthisESU aregeneratedbasedonexpansionsfromreddsurveysandcarcasssampling.index areareddcountshavebeenconductedintheseriversystemssincethelate1950 s. Multiplepasssurveysinindexareascomplementedbysupplementalsurveys coveringthemajorityofspawningreacheshavebeenconductedsincethemid 1980 s.formorerecentyears,estimatesofannualreturnstothewenatcheeriver populationalsoreflectcountsandsamplingdataobtainedatatrapatthetumwater Damonthemainstemriverdownstreamofspringchinookspawningareas.The previousbrtreviewofthisesu(reportedingoodetal.,2005)consideredreturns throughthe2001spawningyear.theictrtcompiledstatusreviewsforupper ColumbiaSpringChinookbasedondatacoveringuptothe2003returnyear(ICTRT, 2009).Estimatesarenowavailableupthroughthe2008spawningyear.In addition,rockyreachandwellsdamcountsofadultspringchinookpassageare availablethroughthecurrentreturnyear(2010).thesecountsareaggregates includingnaturalproduction,returnsfromdirectedsupplementationprogramsand returnsofnon ESUhatcheryChinook. Standardabundanceandtrends Recentyeargeometricmeanspawningabundanceestimatesforeachofthe threeextantuppercolumbiaspringchinookpopulationsaresummarizedintable 6.Totalspawningabundance,includingbothnaturaloriginandhatcheryfish,has increasedrelativetothelevelsreportedinthepreviousbrtreview.thegeometric meanabundancesofbothnaturaloriginandhatcheryspawnersarehigherforeach populationrelativetothepreviousreviewandtothelevelsjustpriortolisting.the relativeincreaseinhatcheryoriginspawnersinthewenatcheeandmethowriver 44
45 populationshasbeendisproportionatelyhighreflectingthelargeincreasein releasesfromthedirectedsupplementationprogramsinthosetwodrainages. ThereisnodirecthatcherysupplementationprogramintheEntiatRiverbasin. HatcheryoriginspawnersintheEntiatRiversystemarepredominatelystraysfrom theentiatnationalfishhatcheryreleases.theentiatnfhspringchinookrelease programwasdiscontinuedin2007.giventhe3 6yearlifespanofUpperColumbia springchinookstocks,thenumberofhatcheryfishonthespawninggroundsinthe EntiatRivershoulddeclinesubstantiallyoverthenextfewyears. Table6.Estimatedspawningabundance(totalspawners,naturaloriginspawners,percentnatural origin)foruppercolumbiaspringchinookpopulations. Population Wenatchee River Total Spawners ( 5 year geometric mean, range) Listing Prior Current ( ) ( ) ( ) 167 Entiat River 89 Methow River (119-4,446) 111 (53-444) 680 (79-9,904) 1,554 (936-2,119) 253 ( ) 1,327 (984-1,801) Natural Spawning Areas Natural Origin ( 5 year geometric mean) Prior ( ) Listing ( ) Current ( ) Listing ( ) % Natural Origin (5 year average) Prior ( ) Current ( ) NA % 58% 31% NA % 58% 46% NA % 41% 29% AnnualspawningescapementsforallthreeoftheextantUpperColumbia SpringChinookpopulationsshowedsteepdeclinesduringthelate1980sandearly 1990s,leadingtoextremelylowabundancelevelsinthemid 1990s(Figure12). Thesteepdownwardtrendreflectstheextremelylowreturnratesfor naturalproductionfromthe broodyears(Figure13).Priortotheearly 1980s,broodyearreturn per spawnerestimatesweregenerallyabovereplacement atlowtomoderateparentescapementlevels.broodyearreplacementrateswere consistentlybelow1.0evenatlowparentspawnerlevelsthroughoutthe1990s. Steeplydecliningtrendsacrossindicesoftotalspawnerabundancewereamajor considerationinthe1997brtriskassessmentpriortoformallistingoftheesu. TheshorttermtrendassessmentdevelopedforthepreviousBRTanalysis(Goodet al.2005)wasslightlypositiveorneutralacrossthepopulations.thetrendintotal spawnerssince1995hasbeenpositiveforallthreepopulations,witharelatively lowprobabilitythatthetruevaluesarebelow1.0(table7). Table7.Shorttermtrend(expressedasslopeoflogsofannualnaturaloriginspawnerabundance Expressedas5yeargeometricmeans(95%CI,probabilitythetrendexceeds1.0).) Population Short-term trend 1998 BRT ( ) Previous ( ) 1998 BRT ( ) Estimate Wenatchee River (CI) Prob> ) 0.43 ( ) Entiat River Estimate
46 Methow River (CI) Prob>1.0 Estimate (CI) Prob>1.0 ( ) ( ) 0.25 Theshorttermindicesofpopulationgrowthrateindicatethatnaturaloriginreturns havetrendedupwardssince1995atahigheraverageratethanduringtheperiod leadinguptothe2005brtreview(table8).estimatedpopulationgrowthrates assumingthathatcheryoriginspawnersandnaturaloriginspawnersare contributingtonaturalproductionatthesameratearebelowreplacementforall threepopulations.possiblecontributingfactorswouldincludedensitydependent effects,differencesinspawningdistributionrelativetohabitatqualityandreduced fitnessofhatcheryoriginspawners. Table8.ShorttermpopulationgrowthrateestimatesforUpperColumbiaSpringChinookpopulations. Population Wenatchee River Entiat River Methow River Short-term Lambda ( ) ( ) Hatchery effectiveness= 0 Hatchery effectiveness= BRT Current 2005 BRT Current ( ) ( ) ( ) ( ) ( ) ( ) ( ) ( ) ( ) ( ) ( ) ( ) ( ) ( ) 0.30 CurrentabundanceestimatesforallthreeUpperColumbiaSpringChinook populationsarewellbelowthelevelsobservedinthe1960s(figure12).expressed asanaverageannualdecline,totalspawningabundancehasdeclinedtheequivalent of2% 4%peryear(Table9).Indicesofpopulationgrowthratehaveshowna similaraveragedecline,withrelativelylowprobabilitiesthattheactualgrowth ratesexceeded1.0. Table9.LongtermtrendmetricsforUpperColumbiaSpringChinookpopulations ( ) ( ) 0.32 Trendintotal Spawners Lambda(HF=0) Lambda(HF=1) Population Years Estimate(CI) Estimate(CI) Prob>1 Estimate(CI) Prob>1 Wenatchee Entiat Methow ( ) 0.96( ) ( ) ( ) 0.98( ) ( ) ( ) 0.96( ) ( )
lineindicatestotalnaturalspawners(includingnaturally spawninghatcheryfish).")
47 Figure12 UpdatedspawningabundanceforUpperColumbiaSpringChinookpopulations.Thedarkline indicatesnaturaloriginspawnernumbers,light(red)lineindicatestotalnaturalspawners(includingnaturally spawninghatcheryfish).thedottedlineisthelong term(wholetimeseries)meanofthetotalspawers,andthe greenshadedareaindicates+/ 1standarddeviationaroundthemean. 47
48 Figure13 TrendofbroodyearspawnertospawnerreturnrateestimatesfortheUpperColumbiaRiverspring ChinooksalmonESUpopulations.Filledmarkers:parentspawnerestimatebelow75%ofminimumabundance threshold.openmarkers:parentescapementgreaterthan75%ofminimumabundancethreshold. Otherdata TheICTRTcurrentproductivitymetricincorporatesarelativeadjustmentforannualSAR estimatestoreducetheimpactofshorttermclimatevariability(ictrt,2007,ictrt, 2010).TheSARindexusedforallthreeUpperColumbiaRiverSpringChinookpopulation dataseriesusesnaturaloriginsmolttoadultestimatesderivedfromsmoltandadult monitoringofproductionfromthechiwawariveralongwithalongerdataseriesofsmolt toadultreturnsurvivalestimatesforleavenworthhatcheryreleases.theindices representcumulativeoutofbasinsurvivals(downstreampassage,oceanlifestages, upstreampassageincludingharvestescapementrates).thesarseriesusedbytheictrt toevaluatepopulationstatusendedwiththe2001broodyear(2003outmigrationyear). FouradditionalyearsofSARestimatesarenowavailableforbothseries(Figure14).SAR estimatesforthe broodoutmigrantswerelowerthantherelativelyhighSARs associatedwiththe1995through1998broodyears,butwellabovetheextremelylow survivalsobservedforthe1990and1991broods. 48
49 Figure14 Smolttoadultreturnrateestimates.ChiwawaRivernaturalproductionSAR:broodyearadult returnstothewenatcheeriverdividedbyestimatedsmoltsproduced.leavenworthhatcheryspringchinook SAR:broodyearadultreturnsdividedbysmoltrelease. SmoltProduction NaturalproductionofspringChinookfromtheChiwawaRivertributarytotheWenatchee Riverhasbeenmonitoredsince1991(Hillmanetal,2010).Smolttrapsatthemouthofthe ChiwawaRiverandinthedownstreamWenatcheeRivermainstemallowforgenerating annualestimatesoftotalsmoltproductionresultingfromspawninginthechiwawariver. MostofthesmoltsleavingtheWenatcheeRiverfromproductionintheChiwawaRiver emigrateasyearlingsinthespringoftheirsecondyearoflife.aportionofchiwawariver productionmovesdownstreaminthesummerandfallandoverwintersinthemainstem WenatcheeRiverbeforeemigratinginthespring(Figure15).Smoltproductionfromthe ChiwawaRiverhasincreasedsincetheearly1990s,withpeakproductionoccurringin 2001and2002. Figure15 EstimatednumberofnaturaloriginsmoltsproducedfromspawningintheChiwawaRiver(tributary withinthewenatcheeriverspringchinookpopulation.fromhillmanetal.2010(table5 15). 49
50 TRTmetrics Table10.ViabilityassessmentsforUpperColumbiaspringChinooksalmonpopulationsintheNorthCascades MPG.SpatialstructureanddiversityriskratingsfromICTRT(2008). Population Wenatchee River Entiat River Methow River Abundance/Productivity Metrics ICTRT Minimum Threshold Natural Spawning Abundance 449 (119-1,050) 222 (18-1,050) 105 (27-291) 59 (10-291) 307 (79-1,979) ICTRT Productivity 0.61 ( ) 0.93 ( ) 1.08 ( ) 0.72 ( ) 0.45 ( ) Integrated A/P Risk High (High) High (High) Spatial Structure and Diversity Metrics Natural Processes Risk Diversity Risk Integrated SS/D Risk Overall Viability Rating Low High High HIGH RISK Moderate High High HIGH RISK (High) (20-1,979) ( ) Okanogan River n/a n/a n/a n/a n/a n/a n/a High Low High High HIGH RISK Overallabundanceandproductivity(A/P)remainsratedatHigh Risk fortheeachofthe threeextantpopulationsinthismpg/esu(table10).the10 yeargeometricmean abundanceofadultnaturaloriginspawnershasincreasedforeachpopulationrelativeto thelevelsforthe seriesbuttheestimatesremainbelowthecorresponding ICTRTthresholds.Estimatedproductivity(spawnertospawnerreturnrateatlowto moderateescapements)wasonaveragelowerovertheyears thanforthe previousperiod(table10).thecombinationsofcurrentabundanceandproductivityfor eachpopulationresultinahighriskratingwhencomparedtotheictrtviabilitycurves. Thecompositespatialstructure/diversity(SS/D)risksforallthreeoftheextant populationsinthismpgareratedathigh(table27).thespatialprocessescomponentof thess/driskislowforthewenatcheeriverandmethowriverpopulationsandmoderate fortheentiatriver(lossofproductioninlowersectionincreaseseffectivedistanceto otherpopulations).allthreeoftheextantpopulationsinthismpgareratedathighriskfor diversity,drivenprimarilybychronicallyhighproportionsofhatchery originspawnersin naturalspawningareasandlackofgeneticdiversityamongthenatural originspawners (ICTRT,2008). Basedonthecombinedratingsforabundance/productivityandspatialstructure/diversity, allthreeoftheextantpopulationsofuppercolumbiaspringchinookremainratedathigh overallrisk(figure16). 50
.")
51 Figure16 NorthCascadesspringChinooksalmonMPGpopulationriskratingsintegratedacrossthefourviable salmonidpopulation(vsp)metrics.viabilitykey:hv HighlyViable;V Viable;M Maintained;HR HighRisk (doesnotmeetviabilitycriteria). Harvest SpringChinooksalmonfromtheupperColumbiabasinmigrateoffshoreinmarinewater andwhereknownimpactsinoceansalmonfisheriesaretoolowtobequantified.theonly significantharvestoccursinthemainstemcolumbiariverintribalandnon tribalfisheries directedathatcheryspringchinookfromthecolumbiaandwillametterivers.priorto 1980,estimatedharvestratesontheaggregaterunofspringChinooksalmontotheupper ColumbiaandSnakeRiverbasinaveragedapproximately55%(WDFW,2002).Fisheries managementmeasureswereimplementedbeginninginthe1970storeduceharvestrates inresponsetoasharpdeclineinannualreturns.exploitationrateshaveremained relativelylow,generallybelow10%,thoughtheyhavebeenincreasinginrecentyears (Figure17).Theincreasesinrecentyearshaveresultedfromincreasedharvestsallowed inresponsetorecordreturnsofhatcheryspringchinooktothecolumbiariverbasin. Figure17 TotalexploitationrateforupperColumbiaRiverspringChinooksalmon.DatafromtheColumbia RiverTechnicalAdvisoryCommittee(TAC2010). 51
52 Hatcheryreleases TrendsinhatcheryreleaseswithinthespawningandrearingareasoftheESUhavebeen fairlyflatsincethemid 1990s,withtheexceptionofcohosalmonreleaseswhichhave increased(figure18).trendssince2005havegenerallybeenflat. 52
53 Figure18 TrendsinhatcheryreleaseswithinthespawningandrearingareaoftheUpperColumbiaspring ChinookESU.Thedottedlineandsharedareaindidatesthelong termmeanandstandarddeviationrespectively. Datasource:RMIS. 53
54 UpperColumbiaSpringChinook:UpdatedRiskSummary TheUpperColumbiaSpringChinookESUisnotcurrentlymeetingtheviability criteria(adaptedfromtheictrt)intheuppercolumbiarecoveryplan.increasesin naturaloriginabundancerelativetotheextremelylowspawninglevelsobservedinthe mid 1990sareencouraging;however,averageproductivitylevelsremainextremelylow. Largescaledirectedsupplementationprogramsareunderwayintwoofthethreeextant populationsintheesu.theseprogramsareintendedtomitigateshort termdemographic riskswhileactionstoimprovenaturalproductivityandcapacityareimplemented.while theseprogramsmayprovideshort termdemographicbenefits,therearesignificant uncertaintiesregardingthelong termrisksofrelyingonhighlevelsofhatcheryinfluence tomaintainnaturalpopulations.theuppercolumbiarecoveryplanincludesanumberof strategiesforimprovingsurvivalintributaryhabitatsandthemainstemmigrationcorridor alongwithcomplementaryharvestmanagementandhatcherymanagementregimes.the timeframesforimplementingactionsandforthoseactionstoresultinimprovedsurvivals varyacrossstrategies.improvedpassagesurvivalsrelativetoconditionsprevalentatthe timeoflistingareexpectedtoberelativelyimmediate.giventheanticipatedaction implementationscheduleandassumptionsregardingtimelagsforrealizingtargethabitat improvementsincorporatedintotheucrecoveryplan,improvementsinsurvivaldueto changesinhabitatconditionsareexpectedaccrueovera10 50yearperiod.Overall,the viabilityoftheuppercolumbiaspringchinooksalmonesuhaslikelyimprovedsomewhat sincethetimeofthelastbrtstatusreview,buttheesuisstillclearlyatmoderate to high riskofextinction. References ICTRT, Independent populations of chinook, steelhead and sockeye for listed evolutionarily significant units within the interior Columbia River domain. Interior Columbia Basin Technical Recovery Team Technical Review Draft. July p. ICTRT, Viability criteria for application to interior Columbia Basin salmonid ESUs. Interior Columbia Basin Technical Recovery Team. Technical Review Draft. March p + appendices and attachments. ICTRT(2008)Currentstatusreviews:InteriorColumbiaBasinsalmonESUsandsteelhead DPSs.Vol.2.UpperColumbiaRiverspringChinooksalmonESUandupper ColumbiaRiversteelheadDPS.167p. Hillman,T.,M.Miller,J.Miller,M.Tonseth,T.MillerandA.Murdoch.2010.Monitoringand evaluationofthechelancountypudhatcheryprograms.rept.tohcphatchery committee.237p.+attachments UpperColumbiaSalmonRecoveryBoard(2007).UpperColumbiaspringchinooksalmon andsteelheadrecoveryplan.307p. Recovery Planning/Recovery Domains/Interior Columbia/Upper Columbia/upload/UC_Plan.pdf 54
55 WashingtonDepartmentofFishandWildlife.2000.Statusreport:ColumbiaRiverfishruns andfisheries WashingtonDept.ofFishandWildlifeandOregonDept.of FishandWildlifejointfisheriesstaffreport.324p. 55
56 56 UpperColumbiaRiversteelhead 9 TheUpperColumbiaSteelheadDPS..includesallnaturallyspawnedanadromousO. mykiss(steelhead)populationsbelownaturalandmanmadeimpassablebarriersin streamsinthecolumbiariverbasinupstreamfromtheyakimariver,washington,tothe US Canadaborder,aswellassixartificialpropagationprograms:theWenatcheeRiver, WellsHatchery(intheMethowandOkanoganRivers),WinthropNFH,OmakCreekandthe Ringoldsteelheadhatcheryprograms.TheUpperColumbiaSteelheadDPSwasoriginally listedundertheesain1997,itiscurrentlydesignatedasthreatenedbynoaafisheries. NOAAFisherieshasdefinedDPSsofsteelheadtoincludeonlytheanadromous membersofthisspecies(70fr67130).ourapproachtoassessingthecurrentstatusofa steelheaddpsisbasedevaluatinginformationtheabundance,productivity,spatial structureanddiversityoftheanadromouscomponentofthisspecies.(goodetal.2005;70 FR67130).Manysteelhead(O.mykiss)populationsalongtheWestCoastoftheU.S.cooccurwithconspecificpopulationsofresidentrainbowtrout.Werecognizethattheremay besituationswherereproductivecontributionsfromresidentrainbowtroutmaymitigate short termextinctionriskforsomesteelheaddpss(goodetal.2005;70fr67130).we assumethatanybenefitstoananadromouspopulationresultingfromthepresenceofa conspecificresidentformwillbereflectedindirectmeasuresofthecurrentstatusofthe anadromousform. SummaryofpreviousBRTconclusions The2005BRTcitedlowgrowthrate/productivityasthemostseriousriskfactorfor theuppercolumbiariversteelheaddps.inparticular,thebrtconcludedthatthe extremelylowreplacementrateofnaturalspawnershighlightedinthe1998review continuedthroughthesubsequentbroodcycle.the2005brtassessmentalsoidentified verylownaturalspawnerabundancevs.interimescapementobjectivesandhighlevelsof hatcheryspawnersinnaturalareasascontributingriskfactors.the2005brtreportdid notethatthenumberofnaturallyproducedsteelheadreturningtospawnwithinthisdps hadincreasedoverthelevelsreportedinthe1998statusreview.aswiththemid ColumbiaandSnakeRiverDPSreviews,the2005BRTrecognizedthatresidentO.mykiss wereassociatedwithanadromoussteelheadproductionareasforthisdps.thereview statedthatthepresenceofresidento.mykisswasconsideredamitigatingfactorbymanyof thebrtmembersinratingextinctionrisk. BriefReviewRecoveryPlanning TheInteriorColumbiaTechnicalRecoveryTeam(ICTRT)identifiedfourextant populationsofanadromouso.mykisswithinthisdps,witheachofthepopulationsusinga majortributarytotheuppercolumbiariverforspawningandjuvenilerearing(the Wenatchee,Entiat,MethowandOkanoganRivers).TheICTRTalsoconcludedthatCrab Creekcouldhavehistoricallysupportedanadditionalpopulation,althoughitisnotclear thatthepopulationwouldhavebeenindependentofproductionintheotherfourupstream drainages.grandecouleeandchiefjosephdamsareupstreamofallfourextant populationswithinthedps.theictrtidentifiedseveraldrainagesenteringthecolumbia Riverabovetheseanadromousblocksthatcouldhavehistoricallysupportedadditional populations. 9 Sectionauthor:TomCooney
57 TRTandRecoveryPlanCriteria NOAAFisheries(NationalMarineFisheriesServiceadoptedarecoveryplanfor UpperColumbiaSpringChinookandsteelheadin2007(FR72# ).The PlanwasdevelopedbytheUpperColumbiaSalmonRecoveryBoard(UCSRB)andis availableat: Recovery Planning/Recovery Domains/Interior Columbia/Upper Columbia/Upper Col Plan.cfm. TheUpperColumbiaSalmonRecoveryPlan(UCRecoveryPlan)hasasanoverall goal...toachieverecoveryanddelistingofspringchinooksalmonandsteelheadby ensuringthelong termpersistenceofviablepopulationsofnaturallyproducedfish distributedacrosstheirnativerange.theucrecoveryplanincludesquantitativemetrics forassessingesustatusbasedonthestatusofcomponentpopulations.thequantitative recoverycriteriaandobjectivesintheplanarebasedonthebiologicalviabilitycriteria recommendedbytheictrt. TheUpperColumbiaSalmonRecoveryPlanincludesthreespecificquantitative reclassificationcriteriaexpressedrelativetopopulationviabilitycurves(ictrt,2007). Abundanceandproductivityofnaturallyproducedsteelheadwithineachoftheextant UpperColumbiapopulations,measuredas8yeargeometricmeans(representing approximatelytwogenerations),mustfallabovetheviabilitycurverepresentingthe minimumcombinationsprojectingtoa10%riskofextinctionover100yearstobe classifiedasviable.inaddition,theplanincorporatesexplicitcriteriaforspatialstructure anddiversityadoptedfromtheictrtviabilityreport.themeanscoreforthethree metricsrepresentingnaturalratesandspatiallymediatedprocessesshouldresultina moderateorlowerriskineachofthethreepopulationsandallthreatsdefinedashighrisk mustbeaddressed.inaddition,themeanscorefortheeightictrtmetricstracking naturallevelsofvariationshouldresultinamoderateorlowerriskscoreatthepopulation level. Achievingrecovery(delisting)ofeachESUviasufficientimprovementinthe abundance,productivity,spatialstructureanddiversityisthelonger termgoalofthe UCSRBPlan.ThePlanincludestwospecificquantitativecriteriaforassessingthestatusof thesteelheaddpsagainsttherecoveryobjective; The12 yeargeometricmean (representingapproximatelythreegenerations)ofabundanceandproductivityofnaturally producedsteelheadwithinthewenatchee,entiatandmethowpopulationsmustreacha levelthatwouldhavenotlessthana5%extinction risk(viability)overa100yearperiod and ataminimum,theuppercolumbiasteelheaddpswillmaintainatleast3,000 naturallyproducedspawnersandaspawner:spawnerratiogreaterthan1:1distributed amongthethreepopulations.theminimumnumberofnaturallyproducedspawners (expressedas12yeargeometricmeans)shouldexceed1,000eachforthewenatcheeand MethowRiverpopulationsand500eachfortheEntiatRiverandOkanoganRiver populations.minimumproductivitythresholdswerealsoestablishedintheplan.these naturalspawnerabundancecriteriareplacetheinterimtargetsreferencedinthe2005brt report.the12yeargeometricmeanproductivityshouldexceed1.1spawnersperparent spawnerforthetwolargerpopulations(wenatcheeriverandmethow),and1.2forthe smallerentiatriverandokanoganpopulations.theictrthadrecommendedthatatleast twoofthefourextantpopulationsbetargetedforhighlyviablestatus(lessthan1%riskof extinctionover100years)becauseoftherelativelylownumberofextantpopulations 57
58 remainingintheesu.theucplanadoptedanalternativeapproachforaddressingthe limitednumberofpopulationsintheesu 5%orlessriskofextinctionforatleastthreeof thefourextantpopulations. TheUpperColumbiaSalmonRecoveryPlanalsocallsfor restoringthe distributionofnaturallyproducedspringchinooksalmonandsteelheadtopreviously occupiedareaswherepractical;andconservingtheirgeneticandphenotypicdiversity. SpecificcriteriaincludedintheUCSRBPlanreflectacombinationofthespecificcriteria recommendedbytheictrt(ictrt,2007)andanearlierpre TRTanalyticalproject(Ford etal.2001).theplanincorporatesspatialstructurecriteriaspecifictoeachsteelhead populationinsection4.4.2.forthewenatcheeriverpopulation,thecriteriarequire observednaturalspawninginfourofthefivemajorspawningareasaswellasinatleast oneoftheminorspawningareasdownstreamoftumwaterdam.inthemethowriver, naturalspawningshouldbeobservedinthreemajorspawningareas.ineachcase,the majorspawningareasshouldincludeaminimumof5%ofthetotalreturntothesystemor 20redds,whicheverisgreater.TheEntiatRiverSpringChinookpopulationincludesa singlehistoricalmajorspawningarea. ThePlancallsformeetingorexceedingthesamebasicspatialstructureand diversitycriteriaadoptedfromtheictrtviabilityreportforrecoveryasfor reclassification(seeabove). NewDataandUpdatedAnalyses The2005BRTreportincludedstatusassessmentsoftheUpperColumbiaSteelhead DPSbasedondatathroughthe2003broodyear(2002runyear).Estimatesofspawning escapementsinuppercolumbiasteelheadpopulationtributariesarenowavailable throughthe2008/2009cycleyears,alongwithpreliminaryestimatesoftheaggregate counts(brokenoutbyhatcheryandwild)overpriestrapidsdamforthe2009/2010cycle year. Standardabundanceandtrends Themostrecentestimates(fiveyeargeometricmean)oftotalandnaturalorigin spawnerabundancearehigherforallfourpopulationsandthepriestrapidsdam aggregaterunrelativetothe2005brtreviewtimeperiod(table11,figure19).annual returnsduringthemostrecentfive yearserieswereallabovethepopulationspecific rangesinreturnsforthefiveyearperiodreportedinthe2005brtreview.inspiteofthe recentincreases,naturaloriginreturnsremainwellbelowtargetlevels. Hatcheryoriginreturnscontinuetoconstituteahighfractionoftotalspawnersin naturalspawningareasforthisdps.estimatesofnaturaloriginspawnerabundanceare higherforthemostrecentcycle.thepatternintheproportionofnatural originspawner amongpopulationsforthemostcurrentfive yearcyclewassimilartothatreportedinthe 2005BRTreview.NaturaloriginproportionswerethehighestintheWenatcheeRiver. EstimatedproportionsofnaturaloriginintheMethowandOkanoganRiverremainedat extremelylowlevels. 58
59 Table11.Recentabundanceandproportionnaturalorigincomparedtoestimatesatthetimeoflistingandinthe previousbrtreview.abundanceestimates(fiveyeargeometricmeanwithrangeinparentheses)corresponding tothetimeoflistingandthe2005brt Population North Cascades MPG Wenatchee River Total Spawners ( 5 year geometric mean, range) Listing Prior Current (1991- ( ) ( ) 1995) 1,880 Entiat River 121 Methow River 1,184 Okanogan River (343-1,655) 265 ( ) 1,935 (1417-3,325) 1,124 (770-1,956) 1,891 ( ) 530 ( ) 3,504 (2,982-4,394) 1,832 (1,483-2,260) Natural Spawning Areas Natural Origin ( 5 year geometric mean) Listing Prior Current (1991- (1997- ( ) 2001) 2009) ( ) 46 (31-97) 162 (68-332) 53 (22-109) 819 ( ) 116 (99-137) 505 ( ) 152 ( ) Listing ( ) % Natural Origin (5 year average) Prior ( ) Current ( ) 24% 48% 47% 48% 19% 23% 21% 9% 15% 12% 5% 9% Aggregate Count at Priest Rapids Dam 8,420 14,592 16,989 1,147 3,007 3,604 14% 19% 19% Table12.Trendinnaturaloriginspawners.UpperColumbiaSpringChinook.Comparisonofcurrenttrendsto priorreviews. Wenatchee River Entiat River Methow River Okanogan River Population Estimate (CI) Prob>1.0 Estimate (CI) Prob>1.0 Estimate (CI) Prob>1.0 Estimate (CI) Prob> BRT ( ) 0.86 ( ) ( ) ( ) ( ) 0.04 Short-term trend Previous ( ) 1.05 ( ) ( ) ( ) ( ) 0.99 Current ( ) 1.11 ( ) ( ) ( ) ( ) 1.00 TheshorttermtrendmetricsforeachoftheUpperColumbiasteelheadpopulationsare alsoabovethelevelsassociatedwiththepriorreview.naturaloriginspawnersincreased atanaveragerateof11% 17%peryearovertheperiod (Table12).The estimatedpopulationgrowthrate,assumingahatcheryeffectivenessof0,increasedata similarannualrateacrossallfourpopulationsovertheperiod (Table13). 59
60 Table13.ShortTerm(since1995)populationgrowthrate(lambda)estimates.Currentestimatesvs.2005BRT shorttermtimeseries. Population Wenatchee River Entiat River Methow River Okanogan River Estimate (CI) Prob>1.0 Estimate (CI) Prob>1.0 Estimate (CI) Prob>1.0 Estimate (CI) Prob>1.0 Short-term Lambda Hatchery effectiveness= 0 Hatchery effectiveness= BRT Current 2005 BRT Current ( ) ( ) ( ) ( ) ( ) ( ) ( ) ( ) ( ) ( ) ( ) ( ) ( ) ( ) ( ) ( ) ( ) ( ) ( ) ( )
lineindicatestotalnaturalspawners(includingnaturallyspawning hatcheryfish).")
61 Figure19 AnnualspawningabundanceforUpperColumbiaSteelheadpopulations.Thedarklineindicates naturaloriginspawnernumbers,light(red)lineindicatestotalnaturalspawners(includingnaturallyspawning hatcheryfish).thedottedlineisthelong term(wholetimeseries)meanofthetotalspawers,andthegreen shadedareaindicates+/ 1standarddeviationaroundthemean. 61
62 Figure20 ReturnperspawnerestimatesforUpperColumbiaRiversteelheadpopulations.Upper)hatchery effectiveness=1.0.lower)hatcheryeffectiveness=0.30.filledmarkers:parentspawnerestimatebelow75%of minimumabundancethreshold.openmarkers:parentescapementgreaterthan75%ofminimumabundance threshold. AnnualspawningescapementestimatesforUpperColumbiaSteelheadpopulationsare availablegoingbacktothelate1970 s(figure19).thelong termtrendsinnaturalorigin spawnersarepositive,rangingfromanannualizedaverageof3%peryearforthe OkanoganRiverrto8%peryearfortheMethowRiverpopulation(Table14).Thelong termpopulationgrowthrate(lambda)estimatesaresubstantiallyaffectedbyassumptions regardingthefitnessofhatcheryfish.ifitisassumedthathatcheryoriginfishare contributingtobroodyearnaturalproductionatthesamerateasnaturaloriginparent spawners,thetheoreticallongtermgrowthrateisstronglynegativeacrossallpopulations. Longtermpopulationgrowthrateestimatescalculatedundertheassumptionthathatchery fisharenotcontributingtoobservednaturalproductionrepresentanindexoftrendsin broodyearnaturalproduction.populationlevelestimatesunderthisassumptionare positiveforallpopulationsandaresimilartotrendsintotalspawners. 62
63 Table14.LongtermtrendsinnaturaloriginspawningabundanceforUpperColumbiaSteelheadpopulations. Trendin naturalorigin Spawners Lambda (HF=0) Lambda(HF=1) Population Years Estimate(CI) Estimate(CI) Prob>1 Estimate(CI) Prob>1 Wenatchee ( ) 1.07( ) ( ) 0.02 Entiat ( ) 1.05( ) ( ) Methow ( ) 1.08( ) ( ) Okanogan ( ) 1.03( ) ( )
64 CurrentStatus:RecoveryPlanandICTRTViabilityCriteria AllfourpopulationsofUpperColumbiasteelheadremainratedathighriskafter incorporatingsixadditionalyearsofstatusinformationintotheassessmentagainstictrt viabilitycriteria(table15,table16).themostrecentestimatesofnaturalorigin abundance(10yeargeometricmean)andnaturaloriginproductivityatlowtomoderate parentabundanceremainwellbelowminimumsdefinedbytheictrtviabilitycurvesfor thedps.spawningescapementsintonaturalareas,especiallyforthemethowand Okanoganpopulations,continuetoshowahighproportionofhatcheryorigin. Productivities,assumingthatthehatcheryoriginandnaturaloriginspawnersare contributingtonaturalproductionatthesameeffectiveness,arebelowreplacementeven atlowtomoderatespawninglevelsforallfourpopulations.recentgeometricmean naturaloriginabundanceandproductivityestimatesarethehighestforthewenatchee River,thepopulationwiththelowestrelativeproportionofhatcheryspawners. Table15.ViabilityassessmentsforUpperColumbiaRiversteelheadpopulations.Updatedtoreflectreturnyears through2009. Population Wenatchee River Entiat River Methow River Okanogan River ICTRT Minimum Threshold Abundance/Productivity Metrics Natural Spawning Abundance 795 ( ) 559 ( ) 112 (52-263) 79 (31-263) 468 ( ) 289 (68-554) 147 (84-212) 95 (22-181) ICTRT Productivity 0.87 ( ) 0.84 ( ) 0.55 ( ) 0.48 ( ) 0.32 ( ) 0.28 ( ) 0.15 ( ) 0.12 ( ) Integrated A/P Risk High (High) High (High) High (High) High (High) Spatial Structure and Diversity Metrics Natural Processes Risk Diversity Risk Integrated SS/D Risk Overall Viability Rating Low High High HIGH RISK Moderate High High HIGH RISK Low High High HIGH RISK High High High HIGH RISK WiththeexceptionoftheOkanoganpopulation,theUpperColumbiapopulationsratedas lowriskforspatialstructure.thehighriskratingsforss/darelargelydrivenbychronic highlevelsofhatcheryspawnerswithinnaturalspawningareasandlackofgenetic diversityamongthepopulations.thebasicmajorlifehistorypatterns(summera run type,tributaryandmainstemspawning/rearingpatterns,andthepresenceofresident populationsandsubpopulations)appeartobepresent.allofthepopulationswereratedat 64
65 highriskforcurrentgeneticcharacteristics.geneticssamplestakeninthe1980sindicate littledifferentiationwithinpopulationsintheuppercolumbiariverdps. Table16 NorthCascadesMPGsteelheadpopulationriskratingsintegratedacrossthefourviablesalmonid population(vsp)metrics.viabilitykey:hv HighlyViable;V Viable;M Maintained;HR HighRisk(doesnot meetviabilitycriteria). SpatialStructure/DiversityRisk VeryLow Low Moderate High VeryLow (<1%) HV HV V M Abundance/ Productivity Risk Low (1 5%) Moderate (6 25%) High (>25%) V V M M M HR V HR HR HR M HR Wenatchee Entiat Methow Okanogan Harvest Summer runsteelheadfromtheinteriorcolumbiariverbasinaredividedinto2 runsbymanagers:thea run,andtheb run.theserunsarebelievedhavedifferencesin timing,butmanagersseparatethemonthebasisofsizealoneinestimatingtheabundance ofeachrun.thea runisbelievedtooccurthroughoutthemiddlecolumbia,upper Columbia,andSnakeRiverBasins,whiletheB runisbelievedtooccurnaturallyonlyinthe SnakeRiverESU,intheClearwaterRiver,MiddleForkSalmonRiver,andSouthFork SalmonRiver. Steelheadwerehistoricallytakenintribalandnon tribalgillnetfisheries,andin recreationalfisheriesinthemainstemcolumbiariverandintributaries.inthe1970s, retentionofsteelheadinnon tribalcommercialfisherieswasprohibited,andinthemid 1980s,tributaryrecreationalfisheriesinWashingtonadoptedmark selectiveregulations. Steelheadarestillharvestedintribalfisheries,inmainstemrecreationalfisheries,and thereisincidentalmortalityassociatedwithmark selectiverecreationrecreational fisheries.themajorityofimpactsonthesummerrunoccurintribalgillnetanddipnet fisheriestargetingchinooksalmon.becauseoftheirlargersize,theb rumfisharemore vulnerabletothegillnetgear.consequently,thiscomponentofthesummerrun experienceshigherfishingmortalitythanthea runcomponent(figure21).inrecent years,totalexploitationratesonthea runhavebeenstableataround5%,while exploitationratesontheb runhavegenerallybeenintherangeof15%to20%. 65
,andfor1999 2008fromTACrun")

66 Figure21 TotalharvestimpactsonnaturalsummersteelheadaboveBonnevilleDam.Datafor from NMFSbiologicalopinion(PeterDygert,NMFS,personalcommunication),andfor fromTACrun reconstruction(cindylefleur,wdfwpersonalcommunication). Hatcheryreleases HatcheryreleasesofUpperColumbiaRiversteelheadhavegenerallyfluctuatedbetween 800,000and900,000yearlingsmoltssincethemid 1990 s.(figure22).releasesinthe WenatcheeRiverbasinhavedecreasedwhilereleasesintotheMethowandOkanogan drainageshaveincreasedoverthesameperiod. Figure22 TrendinhatcheryreleasesofUpperColumbiaRiversteelhead.Source:RMIS. 66
67 UpperColumbiaSteelheadDPS:UpdatedRiskSummary UpperColumbiasteelheadpopulationshaveincreasedinnaturaloriginabundancein recentyears,butproductivitylevelsremainlow.theproportionsofhatcheryorigin returnsinnaturalspawningareasremainextremelyhighacrossthedps,especiallyinthe MethowandOkanoganRiverpopulations.Themodestimprovementsinnaturalreturnsin recentyearsareprobablyprimarilytheresultofseveralyearsofrelativelygoodnatural survivalintheoceanandtributaryhabitats.tributaryhabitatactionscalledforinthe UpperColumbiaRecoveryPlanareanticipatedtobeimplementedoverthenext25years andthebenefitsofsomeofthoseactionswillrequiresometimetoberealized.overall,the newinformationconsidereddoesnotindicateachangeinthebiologicalriskcategorysince thetimeofthelastbrtstatusreview. References ICTRT, Independent populations of chinook, steelhead and sockeye for listed evolutionarily significant units within the interior Columbia River domain. Interior Columbia Basin Technical Recovery Team Technical Review Draft. July p. ICTRT, Viability criteria for application to interior Columbia Basin salmonid ESUs. Interior Columbia Basin Technical Recovery Team. Technical Review Draft. March p + appendices and attachments. ICTRT(2008)Currentstatusreviews:InteriorColumbiaBasinsalmonESUsandsteelhead DPSs.Vol.2.UpperColumbiaRiverspringChinooksalmonESUandupper ColumbiaRiversteelheadDPS.167p. Hillman,T.,M.Miller,J.Miller,M.Tonseth,T.MillerandA.Murdoch.2010.Monitoringand evaluationofthechelancountypudhatcheryprograms.rept.tohcphatchery committee.237p.+attachments UpperColumbiaSalmonRecoveryBoard(2007).UpperColumbiaspringchinooksalmon andsteelheadrecoveryplan.307p. Recovery Planning/Recovery Domains/Interior Columbia/Upper Columbia/upload/UC_Plan.pdf 67
68 68 SnakeRiverspring/summer runchinooksalmon 10 TheSnakeRiverSpring SummerChinooksalmonESUincludesallnaturally spawnedpopulationsofspring/summer runchinooksalmoninthemainstemsnakeriver andthetucannonriver,granderonderiver,imnahariver,andsalmonriversubbasins, aswellasfifteenartificialpropagationprograms.theesuwasfirstlistedundertheesain 1992,andthelistingwasreaffirmedin2005. SummaryofpreviousBRTconclusions The2005BRTreportevaluatedthestatusofSnakeRiverSpring/SummerChinook usingdataonreturnsthrough2001,withthemajorityofbrtriskratingpointsbeing assignedtothemostlikelytobeendangeredcategory.thebrtnotedthatalthoughthere wereanumberofextantspawningaggregationswithinthisesu,asubstantialnumberof historicalspawningpopulationshavebeenlost.themostseriousriskfactorforthedps waslownaturalproductivity(spawnertospawnerreturnrates)andtheassociateddecline inabundancetoextremelylowlevelsrelativetohistoricalreturns.largeincreasesin escapementestimatesformany(butnotall)areasforthe2001returnyearwere consideredencouragingbythebrt.howeverthebrtalsoacknowledgedthatreturn levelsarehighlyvariableandthatabundanceshouldbemeasuredoveratleastan8year periodandthatbythismeasurerecentabundancelevelsacrosstheesufallshortof interimobjectives.thebrtwasconcernedaboutthehighlevelofproduction/mitigation andsupplementationhatcheryprogramsacrosstheesu,notingthattheseprograms representongoingriskstonaturalpopulationsandcanmakeitdifficulttoassesstrendsin naturalproductivityandgrowthrates.thephasingoutofthenon nativerapidriveroriginhatcheryprograminthegranderondebasinwasviewedasapositiveaction. BriefReviewRecoveryPlanning TheICTRTidentified27extantand4extirpatedpopulationsofSnakeRiver Spring/SummerChinookthathistoricallyusedtheaccessibletributaryandupper mainstemhabitatswithinthesnakeriverdrainages(ictrt,2003).thepopulationsare aggregatedintofiveextantmajorpopulationgroupings(mpgs)basedongenetic, environmentalandlifehistorycharacteristics.thelowersnakerivermpgincludesthe TucannonRiverandAsotinCreek(extirpated)populations.TheGrandeRonde/Imnaha RiverMPGincludessixpopulationswithintheGrandeRondeRiverdrainageandtwointhe ImnahaRiver.ThreepopulationswithintheSouthForkSalmonRiverdrainageanda fourthinthelittlesalmonriverformanadditionalmpg.chamberlaincreekalongwith sixpopulationsinthemiddleforkdrainageconstitutethenextupstreammpg.theupper SalmonRiverMPGincludesseveralmajortributarypopulationsalongwithtwomainstem sectionsalsoclassifiedasindependentpopulations. NOAAFisherieshasinitiatedrecoveryplanningfortheSnakeRiverdrainage, organizedaroundasubsetofmanagementunitplanscorrespondingtostateboundaries.a tributaryrecoveryplanforoneofthemajormanagementunits,thelowersnakeriver tributarieswithinwashingtonstateboundaries,wasdevelopedundertheauspicesofthe LowerSnakeRiverRecoveryBoardandwasacceptedbyNOAAFisheriesin2005.The LSRBPlanprovidesrecoverycriteria,targetsandtributaryhabitatactionplansforthetwo populationsofspring/summerchinookinthelowersnakempginadditiontothetouchet 10 Sectionauthor:TomCooney
69 River(Mid ColumbiaSteelheadDPS)andtheWashingtonsectionsoftheGrandeRonde River.PlanningeffortsareunderwayfortheOregonandIdahodrainages.Viabilitycriteria recommendedbytheictrtarebeingusedinformulatingrecoveryobjectiveswithineach ofthemanagementunitplanningefforts. TRTandRecoveryPlanCriteria TherecoveryplansbeingsynthesizedanddevelopedbyNOAAFisherieswill incorporateviabilitycriteriarecommendedbytheictrt(ictrt,2007).theictrt recoverycriteriaarehierarchicalinnature,withesu/dpslevelcriteriabeingbasedonthe statusofnaturaloriginchinooksalmonassessedatthepopulationlevel.adetailed descriptionoftheictrtviabilitycriteriaandtheirderivation(ictrt,2007)canbefound atwww.nwfsc.noaa.gov/trt/col/trt_viability.cfm.undertheictrtapproach,population levelassessmentsarebasedonasetofmetricsdesignedtoevaluateriskacrossthefour viablesalmonidpopulation(vsp)elements abundance,productivity,spatialstructureand diversity(mcelanyetal.2000).theictrtapproachcallsforcomparingestimatesof currentnaturaloriginabundance(measuredasa10yeargeometricmeanofnaturalorigin spawners)andproductivity(estimateofreturnperspawneratlowtomoderateparent spawningabundance)againstpredefinedviabilitycurves.inaddition,theictrt developedasetofspecificcriteria(metricsandexampleriskthresholds)forassessingthe spatialstructureanddiversityrisksbasedoncurrentinformationrepresentingeach specificpopulation.theictrtviabilitycriteriaaregenerallyexpressedrelativeto particularriskthreshold lowriskisdefinedaslessthana5%riskofextinctionovera100 yearperiodandverylowriskaslessthana1%probabilityoverthesametimeperiod. SnakeRiverSpring/SummerChinook:ICTRTExampleRecoveryScenarios TheICTRTrecommendsthateachextantMPGshouldincludeviablepopulations totalingatleasthalfofthepopulationshistoricallypresent,withallmajorlifehistory groupsrepresented.inaddition,theviablepopulationswithinanmpgshouldinclude proportionalrepresentationoflargeandverylargepopulationshistoricallypresent. WithinanyparticularMPG,theremaybeseveralspecificcombinationsofpopulationsthat couldsatisfytheictrtcriteria.theictrtidentifiedexamplescenariosthatwouldsatisfy thecriteriaforallextantmpgs(ictrt,2007;attachment2).ineachcasetheremaining populationsinanmpgshouldbeatorabovemaintainedstatus. LowerSnakeRiverMPG:ThisMPGcontainedtwopopulationshistorically,Asotin Creekiscurrentlyconsideredextirpated.TheICTRTbasiccriteriawouldcallforboth populationsbeingrestoredtoviablestatus.theictrtrecommendedthatrecovery plannersshouldgiveprioritytorestoringthetucannonrivertohighlyviablestatus, evaluatingthepotentialforreintroducingproductioninasotincreekasrecoveryplanning progresses. GrandeRondeMPG:Eighthistoricalpopulations(twocurrentlyconsidered functionallyextirpated).thebasicictrtcriteriacallforaminimumof4populationsat viableorhighlyviablestatus.thepotentialscenarioidentifiedbytheictrtwouldinclude viablepopulationsintheimnahariver(runtiming),thelostine/wallowariver(largesize) andatleastonefromeachofthefollowingpairs:catherinecreekoruppergranderonde (largesizepopulations);andminamriverorwenahariver. SouthForkMPG:TwoofthefourhistoricalpopulationsinthisMPGshouldbe restoredtoviableorhighlyviablestatus.theictrtrecommendsthatthepopulationsin thesouthforkdrainagesshouldbegivenpriorityrelativetomeetingmpgviability 69
70 objectivesgiventherelativelysmallsizeandthehighlevelofpotentialhatcheryintegration forthelittlesalmonriverpopulation. MiddleForkMPG:TheICTRTcriteriacallforatleastfiveoftheninepopulationsin thismpgtoberatedasviable,withatleastonedemonstratinghighlyviablestatus.the ICTRTexamplerecoveryscenarioincludedChamberlainCreek(geographicposition),Big Creek(largesizecategory),BearValleyCreek,MarshCreek,andeitherLoonCreekor CamasCreek. UpperSalmonMPG:ThisMPGincludedninehistoricalpopulationsoneofwhich, PantherCreek,isconsideredfunctionallyextirpated.TheICTRTexamplerecovery scenarioforthismpgincludesthepahsimeroiriver(summerchinooklifehistory);the LemhiRiverandUpperSalmonMainstem(verylargesizecategory);EastForkSalmon River(largesizecategory)andValleyCreek. NewDataandUpdatedAnalyses ThepreviousBRTreview(Goodetal.,2005)analyzedabundancedataseries compiledforasetofindexareasdistributedacrosstheesu.thosedataseriesgenerally coveredtheperiodbeginningintheearly1960 sandendingwiththe2001returnyear. TheICTRTcoordinatedthedevelopmentofrepresentativetimeseriesformostpopulations inthisesuusingexpansionsfromindexareareddcountsandweirestimates(ictrt, 2010).ThecurrentICTRTdataseriesextendthetimeperiodofrecordthroughatleastthe 2008returnyearforpopulationsacrossalloftheMPGsintheSpring/SummerChinook ESU(Figure23 Figure29). Standardabundanceandtrends Estimatesofnaturaloriginabundanceforthemostrecentfive yearbroodcycleare availablefor24populationsinthesnakeriverspring/summerchinookesu(table17). RelativetothepreviousBRTassessment,escapementsarehigherbymorethan25%for13 populations,lowerbymorethan25%for6populationsandwithin25%for5populations. TheMiddleForkandtheUpperSalmonMPGshavethemostpopulationswithrelatively largeincreasesalthougheachalsohasapopulationthatdecreasedbymorethan50%.the majorityofpopulationsinthesouthforkandthelowergranderondempgwerewithin +/ 25%ofthegeometricmeanabundanceestimates( )reportedinthe2005 BRTreport. Short termpopulationtrendsintotalspawnerabundanceweregenerallypositive overtheperiod1995to2008,withsomedifferencesinmagnitudeforpopulationswithin differentmpgs(figure23 Figure29).TrendsformostpopulationsintheMiddleForkand UpperSalmonMPGSarestronglypositive.TwopopulationsintheMiddleForkMPG (MarshCreekandLoonCreek)alongwithone(LemhiRiver)intheUpperSalmonMPGhad relativelyflattrendsintotalabundancesince1995.short termtrendsintotalabundance forthesouthforkmpgwerealsopositivebutatlowerlevelsthaninthemiddleforkand UpperSalmonMPGs,withtheexceptionoftherelativelystrongtrendintheEastFork SouthForkpopulation(Figure25).IntheGrandeRondeMPG,threeofthepopulations exhibitedmoderatelypositivetrends,theremainingthreehadrelativelyflatorslightly negativetrajectoriesintotalspawningabundancesince1995.thesingleextantpopulation inthelowersnakempg,thetucannonriver,hadastronglypositivetrend.relativetothe short termtrendscorrespondingtothetimeperiodsanalyzedbythe2005brt,updated trendsarehigherforamajorityofthepopulations.forthreepopulations(catherine 70
71 Creek,ImnahaRiverandLemhiRiver),themostrecentshort termtrendswereslightly positivebutaresubstantiallybelowthepriorestimates. Thegenerallypositiveshorttermtrendindicesarelargelydrivenbyacommon temporalpatterninthespawningabundanceestimatesacrosspopulationsinthisesu.the startingpointforthecurrentshorttermtrendindexis1995,whichcorrespondstoan extremelowinreturnswithinalmostalloftheindividualpopulationseries.thoselow returnsweretheresultofextremelylowsurvivalsforproductionfromthe broodyears(figure30).theseriesalsoincluderelativelyhighabundanceestimatesin ,reflectingtheaboveaveragesurvivalsforproductionfromspawninginthelate 1990s(Figure30).Spawningescapementsinthemostrecentyearsineachseriesare generallywellbelowthepeakreturnsbutabovetheextremelowlevelsinthemid 1990s. Relativelylongtimeseriesofannualspawningabundanceareavailableformost extantsnakeriverspring/summerchinookpopulations(appendixa).recentreturn levelsareconsistentlylowerthanreturnsintheearlyyearsacrossallseries.when expressedasanaverageannualrateforeachpopulation,thedeclineinspawning escapementsaveragesfrom3%to13%peryear. 71
72 Figure23 SpawningabundancefortheGrandeRonde/ImanaMajorPopulationGroupintheSnakeRiverspring/summer ChinookESU.Thedarklineindicatesnaturaloriginspawnernumbers,light(red)lineindicatestotalnaturalspawners(including naturallyspawninghatcheryfish).thedottedlineisthelong term(wholetimeseries)meanofthetotalspawers,andthegreen shadedareaindicates+/ 1standarddeviationaroundthemean. 72
73 Figure24 SpawningabundancefortheLowerSnakeMajorPopulationGroupintheSnakeRiverspring/summerChinookESU. Thedarklineindicatesnaturaloriginspawnernumbers,light(red)lineindicatestotalnaturalspawners(includingnaturally spawninghatcheryfish).thedottedlineisthelong term(wholetimeseries)meanofthetotalspawers,andthegreenshadedarea indicates+/ 1standarddeviationaroundthemean. Figure25 SpawningabundancefortheSouthForkSalmonMajorPopulationGroupintheSnakeRiverspring/summerChinook ESU.Thedarklineindicatesnaturaloriginspawnernumbers,light(red)lineindicatestotalnaturalspawners(includingnaturally spawninghatcheryfish).thedottedlineisthelong term(wholetimeseries)meanofthetotalspawers,andthegreenshadedarea indicates+/ 1standarddeviationaroundthemean. 73
74 Figure26 SpawningabundancefortheMiddleForkSalmonRiverPopulationGroupintheSnakeRiverspring/summerChinook ESU.Thedarklineindicatesnaturaloriginspawnernumbers,light(red)lineindicatestotalnaturalspawners(includingnaturally spawninghatcheryfish).thedottedlineisthelong term(wholetimeseries)meanofthetotalspawers,andthegreenshadedarea indicates+/ 1standarddeviationaroundthemean. 74
75 Figure27 SpawningabundancefortheMiddleForkSalmonRiver(cont.)MajorPopulationGroupintheSnakeRiver spring/summerchinookesu.thedarklineindicatesnaturaloriginspawnernumbers,light(red)lineindicatestotalnatural spawners(includingnaturallyspawninghatcheryfish).thedottedlineisthelong term(wholetimeseries)meanofthetotal spawers,andthegreenshadedareaindicates+/ 1standarddeviationaroundthemean. 75
76 Figure28 SpawningabundancefortheUpperSalmonRiverMajorPopulationGroupintheSnakeRiverspring/summerChinook ESU.Thedarklineindicatesnaturaloriginspawnernumbers,light(red)lineindicatestotalnaturalspawners(includingnaturally spawninghatcheryfish).thedottedlineisthelong term(wholetimeseries)meanofthetotalspawers,andthegreenshadedarea indicates+/ 1standarddeviationaroundthemean. 76
77 Figure29 SpawningabundancefortheUpperSalmonRiver(cont.)MajorPopulationGroupintheSnakeRiverspring/summer ChinookESU.Thedarklineindicatesnaturaloriginspawnernumbers,light(red)lineindicatestotalnaturalspawners(including naturallyspawninghatcheryfish).thedottedlineisthelong term(wholetimeseries)meanofthetotalspawers,andthegreen shadedareaindicates+/ 1standarddeviationaroundthemean. 77
78 Figure30 SnakeRiverSpring SummerChinook.PopulationrecruitperspawnerestimatesorganizedbyMPG.Recruits expressedasreturnstotributaryspawningareas.filledmarkers:parentspawnerestimatebelow75%ofminimumabundance threshold.openmarkers:parentescapementgreaterthan75%ofminimumabundancethreshold. 78
79 79
80 Table17.Recent(fiveyeargeometricmean)estimatesoftotalandnaturaloriginspawningescapementforSnake Riverspring/summerchinookpopulations,organizedbyMPG.Estimatesforallperiodsbasedonmostcurrent populationleveldatasets.theseestimateswerenotavailableatthetimeoflistingorforthe2005brtreviews. Population (organized by major population group) Total Spawners ( 5 year geometric mean, range) Listing Prior Current ( ) ( ) ( ) Natural Spawning Areas Natural Origin ( 5 year geometric mean) Prior ( ) Listing ( ) Current ( ) Listing ( ) % Natural Origin (5 year average) Prior ( ) Current ( ) Lower Snake River Tucannon (51 894) 469 ( ) (5-672) 276 ( ) 56% 40% 53% Grande Ronde/Imnaha Wenaha Lostine/Wallowa Minam 180 Catherine Creek 69 Upper Grande Ronde 76 Imnaha (84-899) 265 ( ) 277 ( ) 103 (43-512) 34 (4-83) 855 ( ) 364 ( ) ( ) ( ) ( ) (17-419) ( ) (69-756) 218 ( ) 262 ( ) 95 (43-382) 33 (4-83) 347 ( ) 325 ( ) 49% 92% 95% 267 ( ) 70% 88% 41% 414 ( ) 63% 97% 95% 80 (42-122) 63% 95% 34% 19 (13-43) 55% 100% 33% 196 ( ) 50% 46% 25% South Fork Secesh EF/Johnson Cr SF Mainstem ( ) 186 ( ) 1399 ( ) 428 ( ) ( ) ( ) ( ) 146 ( ) 712 ( ) 362 ( ) 97% 96% 93% 113 (63-244) 97% 93% 46% 443 ( ) 58% 58% 47% Middle Fork Bear Valley Marsh Creek Sulphur Creek Loon Creek Camas Creek Big Creek 29 Chamberlain Cr (78-739) 67 (1-507) 20 (0-102) 67 (15-635) 34 (9-294) 121 (49 690) 184 ( ) 295 ( ) (67-182) (15-126) 9 37 (19 100) 7 89 (41-291) (44 248) ( ) (73-733) 69 (0-497) 20 (0-102) 65 (14 611) 33 (9-282) 117 (46 662) 179 ( ) 274 ( ) 100% 100% 100% 105 (61-165) 100% 100% 100% 43 (14-118) 100% 100% 100% 34 (18 94) 100% 100% 100% 83 (39-263) 100% 100% 100% 101 (42 233) 100% 100% 100% 437 ( ) 100% 100% 100% Upper Salmon Lower Salmon Mainstem 32 Lemhi River 25 Pahsimeroi River 49 Upper Salmon Mainstem 82 East Fork Salmon 43 Valley Creek 12 Yankee Fork 6 97 (44-231) 141 (69 607) 126 (72-306) 214 ( ) 137 (79-402) 43 (14 177) 15 (2-95) 118 (94-221) 53 (38 74) 266 ( ) 380 ( ) 214 (77-385) 81 (54 163) 24 (4-341) (37-195) 139 (69 582) 96 (72 233) 203 (98-567) 114 (60-354) 42 (13-171) 14 (2-90) 100 (79-186) 100% 100% 100% 53 (38 73) 100% 100% 100% 156 (80-316) 39% 58% 68% 263 ( ) 83% 78% 79% 188 ( % 95% 100% 79 (53 158) 100% 100% 100% 23 (4-324) 100% 100% 100% 80
81 Figure31 Shorttermtrendinnaturaloriginspawningabundanceexp(slopeofln(naturaloriginspawners)vs.year)forSnakeRiverSpring/Summer Chinooksalmonpopulations.Soliddiamond/bar:pointestimateand95%cffor Opendiamond/bar:equivalentstatisticsforpriorreview. 81
82 Figure32 Shorttermpopulationgrowthrate(lambda)estimatesforSnakeRiverSpring/Summerchinookpopulations.Relativehatcheryeffectivenessset to0.0.soliddiamond/bar:pointestimateand95%cffor Opendiamond/bar:equivalentstatisticsforpriorreview. 82
83 Figure33 Shorttermpopulationgrowthrate(lambda)estimatesforSnakeRiverSpring/Summerchinookpopulations.Relativehatcheryeffectivenessset to0.0.soliddiamond/bar:pointestimateand95%cffor Opendiamond/bar:equivalentstatisticsforpriorreview. 83
84 CurrentStatus:ICTRTViabilityCriteria TheoverallviabilityratingsforallofthepopulationsintheSnakeRiver Spring/SummerChinookESUremainatHighRiskaftertheadditionofmorerecentyear abundanceandproductivitydata.undertheapproachrecommendedbytheictrt,the overallratingforanesudependsuponpopulationlevelratingsorganizedbympgwithin thatesu.thefollowingbriefsummariesdescribethecurrentstatusofpopulationswithin eachoftheextantmpgsintheesu,contrastingthecurrentratingswithassessments previouslydonebytheictrtusingdatathroughthe2003returnyear. LowerSnakeRiverMPG(Table18):Abundanceandproductivityremainthemajor concernforthetucannonriverpopulation.naturalspawningabundance(10year geometricmean)hasincreasedbutremainswellbelowtheminimumabundancethreshold forthesingleextantpopulationinthismpg.poornaturalproductivitycontinuestobea majorconcern. GrandeRondeMPG(Table19):TheWenahaRiver,Lostine/WallowaRiverand MinamRiverpopulationsshowedsubstantialincreasesinnaturalabundancerelativetothe previousictrtreview,althougheachremainsbelowtheirrespectiveminimumabundance thresholds.geometricmeanproductivityestimatesremainrelativelylowforall populationsinthempg.theuppergranderondepopulationisratedathighriskfor spatialstructureanddiversitywhiletheremainingpopulationsareratedatmoderate. SouthForkMPG(Table20):Naturalspawningabundance(10yeargeometricmean) estimatesincreasedforthethreepopulationswithavailabledataseries.productivity estimatesforthesepopulationsaregenerallyhigherthanestimatesforpopulationsin othermpgswithintheesu.viabilityratingsbasedonthecombinedestimatesof abundanceandproductivityremainathighrisk,althoughthesurvival/capacitygaps relativetomoderateandlowriskviabilitycurvesaresmallerthanforotheresu populations.spatialstructure/diversityrisksarecurrentlyratedmoderateforthesouth Forkmainstempopulation(relativelyhighproportionofhatcheryspawners)andlowfor theseceshriverandeastforksouthforkpopulations. MiddleForkSalmonMPG(Table21):Naturaloriginabundanceandproductivity remainsextremelylowforpopulationswithinthismpg.asinthepreviousictrt assessment,abundanceandproductivityestimatesforbearvalleycreekandchamberlain Creek(limiteddataseries)aretheclosesttomeetingviabilityminimumsamong populationsinthempg.spatialstructure/diversityriskratingsformiddlefork populationsaregenerallymoderate,largelydrivenbymoderateratingsforgenetic structureassignedbytheictrtbecauseofuncertaintyarisingfromthelackofdirect samplesfromwithinthecomponentpopulations. UpperSalmonRiverMPG(Table22):Abundanceandproductivityestimatesfor mostpopulationswithinthismpgremainatverylowlevelsrelativetoviabilityobjectives. TheUpperSalmonmainstemhasthehighestrelativeabundanceandproductivity combinationofpopulationswithinthempg.spatialstructure/diversityrisk(ss/d)ratings varyconsiderablyacrossthempg.fouroftheeightpopulationsareratedatlowor moderateriskforoverallspatialstructureanddiversityandcouldachieveviablestatus withimprovementsinaverageabundance/productivity.thehighss/driskratingforthe Lemhipopulationisdrivenbyasubstantiallossofaccesstotributaryspawning/rearing habitatsandtheassociatedreductioninlifehistorydiversity.highss/dratingsfor PahsimeroiRiver,EastForkUpperSalmonandYankeeForkaredrivenbyacombinationof 84
85 habitatlossanddiversityconcernsrelatedtolownaturalabundancecombinedwith chronicallyhighproportionsofhatcheryspawnersinnaturalareas. Table18.LowerSnakeRiverMPG.Summaryofcurrentpopulationstatusvs.ICTRTviabilitycriteria Lower Snake River MPG Population Tucannon ICTRT Minimum Threshold 750 Abundance/Productivity Metrics Natural Spawning Abundance 269 (58-682) ICTRT Productivity 0.74 ( ) Integrated A/P Risk High Natural Processes Risk Spatial Structure and Diversity Metrics Diversity Risk Integrated SS/D Risk Overall Viability Rating Low Moderate Moderate HIGH RISK (11-897) 0.69 ( ) High 85
86 Table19.GrandeRonde/ImnahaMPG.Summaryofcurrentpopulationstatusvs.ICTRTviabilitycriteria Grande Ronde/Imnaha MPG Population Wenaha ICTRT Minimum Threshold 750 Abundance/Productivity Metrics Natural Spawning Abundance 441 ( ) ICTRT Productivity 0.72 ( ) Integrated A/P Risk High Spatial Structure and Diversity Metrics Natural Processes Risk Diversity Risk Integrated SS/D Risk Overall Viability Rating Low Moderate Moderate HIGH RISK Lostine/Wallowa (51-756) 320 ( ) 0.68 ( ) 0.77 ( ) High High Low Moderate Moderate HIGH RISK Minam (33-541) 467 ( ) 0.85 ( ) 0.86 ( ) High High Low Moderate Moderate HIGH RISK Catherine Creek (62-651) 107 (42-382) 1.07 ( ) 0.71 ( ) High High Moderate Moderate Moderate HIGH RISK Upper Grande Ronde (34-382) 32 (13-140) 0.73 ( ) 0.42 ( ) High High High Moderate High HIGH RISK Imnaha River (4-140) 388 ( ) 0.42 ( ) 0.90 ( ) High High Low Moderate Moderate HIGH RISK ( ) ( ) High 86
87 Table20.SouthForkSalmonMPG.Summaryofcurrentpopulationstatusvs.ICTRTviabilitycriteria South Fork MPG Population Secesh River EF/Johnson Cr South Fork Main Little Salmon River ICTRT Minimum Threshold Abundance/Productivity Metrics Natural Spawning Abundance 472 ( ) 342 ( ) 162 ( ) 142 ( ) 791 ( ) 630 ( ) Insufficient data ICTRT Productivity 1.25 ( ) 1.23 ( ) 1.15 ( ) 1.15 ( ) 1.21 ( ) 1.25 ( ) Insufficient data Integrated A/P Risk High High High High High High Insufficient data Spatial Structure and Diversity Metrics Natural Processes Risk Diversity Risk Integrated SS/D Risk Overall Viability Rating Low Low Low HIGH RISK Low Low Low HIGH RISK Low Moderate Moderate HIGH RISK Low Low Low HIGH RISK 87
88 Table21.MiddleForkSalmonMPG.Summaryofcurrentpopulationstatusvs.ICTRTviabilitycriteria Middle Fork Salmon MPG Population Chamberlain Cr Big Creek Lower Middle Fork Salmon Camas Creek Loon Creek Upper Middle Fork Salmon Sulphur Creek Bear Valley Creek Marsh Creek ICTRT Minimum Threshold Abundance/Productivity Metrics Natural Spawning Abundance 605 ( ) 249 ( ) 146 (42-662) 93 (5-662) Insufficient data 30 (9-282) 30 (0-282) 67 (14-611) 49 (0-611) Insufficient data 37 (0-201) 26 (0-201) 363 ( ) 242 ( ) 109 (0-861) 51 (0-861) ICTRT Productivity 1.79 ( ) 1.77 ( ) 0.80 ( ) 1.17 ( ) Insufficient data 0.74 ( ) 0.74 ( ) 1.19 ( ) 1.01 ( ) Insufficient data 0.76 ( ) 1.10 ( ) 1.23 ( ) 1.45 ( ) 0.79 ( ) 1.06 ( ) Integrated A/P Risk High High High High High High High High High High High High High High High High High High Natural Processes Risk Spatial Structure and Diversity Metrics Diversity Risk Integrated SS/D Risk Overall Viability Rating Low Low Low HIGH RISK Very Low Moderate Moderate HIGH RISK Moderate Moderate Moderate HIGH RISK Low Moderate Moderate HIGH RISK Low Moderate Moderate HIGH RISK Low Moderate Moderate HIGH RISK Low Moderate Moderate HIGH RISK Very Low Low Low HIGH RISK Low Low Low HIGH RISK 88
89 Table22.UpperSalmonMPG.Summaryofcurrentpopulationstatusvs.ICTRTviabilitycriteria Upper Salmon River MPG Population North Fork ICTRT Minimum Threshold 500 Abundance/Productivity Metrics Natural Spawning Abundance Insufficient data ICTRT Productivity Insufficient data Integrated A/P Risk High High Spatial Structure and Diversity Metrics Natural Processes Risk Diversity Risk Integrated SS/D Risk Overall Viability Rating Low Low Low HIGH RISK Lemhi River (38-582) 0.94 ( ) High High High High HIGH RISK Pahsimeroi River (10-582) 154 (80-316) 1.13 ( ) 0.58 ( ) High High Moderate High High HIGH RISK Upper Salmon Lower Mainstem (11-298) 120 (37-378) 0.48 ( ) 1.16 ( ) High High Low Low Low HIGH RISK East Fork Salmon River (9-378) 178 (68-784) 1.28 ( ) 1.04 ( ) High High Low High high HIGH RISK Yankee Fork (6-784) 21 (2-324) 1.16 ( ) 0.80 ( ) High High Moderate High High HIGH RISK Valley Creek (0-153) 78 (13-292) 1.01 ( ) 1.21 ( ) High High Low Moderate Moderate HIGH RISK Upper Salmon Mainstem (0-292) 313 (98-743) 1.21 ( ) 1.21 ( ) High High Very Low Moderate Moderate HIGH RISK (9-743) 1.42 ( ) High 89

90 Harvest HarvestimpactsonthespringcomponentofthisESUareessentiallythesameasthoseon theuppercolumbiariver(figure17).allharvestoccursinthelowerportionofthe mainstemcolumbiariver.snakeriversummerchinooksharetheoceandistribution patternsoftheupperbasinspringrunsandareonlysubjecttosignificantharvestinthe mainstemcolumbiariver.harvestofsummerchinookhasbeenmoreconstrainedthan thatofspringchinookwithconsequentlylowerexploitationratesonthesummer componentofthisesu.harvestratesontheaggregaterunsofup riverspringandsummer ChinookSalmonweregenerallyreducedinthe1970sinresponsetoabruptdeclinesin returnsofnaturallyproducedfish.annualharvestratesvariedaround50%inthe1950s and1960s(wdfw,2000). Figure34 TotalexploitationratesforSnakeRiverspring/summerChinooksalmon.DatafromtheColumbia RiveTechnicalAdvisoryTeam(TAC2010). Hatcheryreleases Totalhatcheryreleasesofspring/summerChinookintheESUinrecentyearshave fluctuatedaroundthesamelevelasintheearly1990s.releaselevelsinthelate1990s weregenerallylower,largelydrivenbythetransitionfromrapidriveroriginstockinthe GrandeRondeRiversystemandshortfallsinbroodstockcollectionintheUpperSalmon Riverduetolowadultreturnrates(Figure35).Releasesofhatcherysteelheadhave declinedbyapproximatelyathirdfrompre1995levels. 90
91 Figure35 TrendsinhatcheryreleaseswithinthespawningandrearingareasoftheSnakeRiver spring/summerchinookesu.dottedlineindicatesthemean,andtheshadedareathestandarddeviation.data source:rmis. 91
92 SnakeRiverSpring/SummerChinookESU:UpdatedRiskSummary PopulationlevelstatusratingsremainathighriskacrossallMPGswithintheESU, althoughrecentnaturalspawningabundanceestimateshaveincreased,allpopulations remainbelowminimumnaturaloriginabundancethresholds.relativelylownatural productionratesandspawninglevelsbelowminimumabundancethresholdsremaina majorconcernacrosstheesu.theabilityofpopulationstobeself sustainingthrough normalperiodsofrelativelylowoceansurvivalremainsuncertain.factorscitedbythe 2005BRT(Goodetal.2005)remainasconcernsorkeyuncertaintiesforseveral populations.overall,thenewinformationconsidereddoesnotindicateachangeinthe biologicalriskcategorysincethetimeofthelastbrtstatusreview. References Good, T.P., R.S. Waples and P. Adams (editors) Updated status of federally listed ESUs of West Coast salmon and steelhead. U.S. Dept. of Commer., NOAA Tech. Memo. NMFS-NWFSC-66, 598 p. ICTRT, Independent populations of chinook, steelhead and sockeye for listed evolutionarily significant units within the interior Columbia River domain. Interior Columbia Basin Technical Recovery Team Technical Review Draft. July p. ICTRT, Viability criteria for application to interior Columbia Basin salmonid ESUs. Interior Columbia Basin Technical Recovery Team. Technical Review Draft. March p + appendices and attachments. ICTRT(2010)Currentstatusreviews:InteriorColumbiaBasinsalmonESUsandsteelhead DPSs.Vol.1.SnakeRiverESUs/DPS.786p.+attachments WashingtonDepartmentofFishandWildlife.2000.Statusreport:ColumbiaRiverfishruns andfisheries WashingtonDept.ofFishandWildlifeandOregonDept.of FishandWildlifejointfisheriesstaffreport.324p. 92
93 93 SnakeRiverFall runchinooksalmon 11 TheSnakeRiverfallChinooksalmonESUincludesfishspawninginthelower mainstemofthesnakeriverandthelowerreachesofseveraloftheassociatedmajor tributariesincludingthetucannon,thegranderonde,clearwater,salmonandimnaha Rivers.ThisESUwasoriginallylistedundertheESAin1992(reaffirmedin2005:FR 70FR37160).Historically,thisESUincludedtwolargeadditionalpopulationsspawningin themainstemofthesnakeriverupstreamofthehellscanyondamcomplex.the spawningandrearinghabitatassociatedwiththecurrentextantpopulationrepresents approximately20%ofthetotalhistoricalhabitatavailabletotheesu(double,2000). SummaryofpreviousBRTconclusions ThemostrecentBRTreview(Goodetal.,2005)includedanassessmentofSnake RiverFallChinooksalmonbasedondataforrunsthroughthe2001returnyear.Amajority oftheratingpointsassignedbyindividualbrtmembersfellintothe likelytobecome endangered category(60%).thebrtreviewnotedthat..thisoutcomerepresenteda somewhatmoreoptimisticassessmentofthestatusofthisesuthanwasthecaseatthe timeoftheoriginalstatusreview....reasonscitedforamoreoptimisticratingincluded; thenumberofnaturaloriginspawnersin2001waswellover1,000forfirsttimesince 1975,managementactionshadreducedthenumberofoutsideoriginstrayhatcheryfish passingtothespawninggrounds,theincreasingcontributionofnativelyonsferryfish fromsupplementationprogramsandthefactthatrecentnaturaloriginreturnshadbeen fluctuatingbetween500and1,000spawners somewhathigherthanpreviouslevels.the 2005BRTstatusratingsfortheSnakeRiverfallChinooksalmonESUwerealsoinfluenced byconcernsthatthegeometricmeanabundanceatthetimewasbelow1,000(...averylow numberforanentireesu ),andbecauseofthelargefractionofhatcheryfishonthe spawninggrounds.additionalconcernscitedbythebrtincludedthefactthatalarge portionofhistoricalmainstemhabitatisnowinaccessible.somebrtmemberswere concernedaboutthepossibilitythatanaturalhistoricalbufferbetweensnakeriverfall chinookandothercolumbiariveresusmayhaveexistedandthatithasbeen compromisedbyhatcherystraying. BriefReviewRecoveryPlanning NOAAFisheriesiscurrentlydraftingarecoveryplanforthelistedanadromous speciesinthesnakeriverbasin.therecoveryplanwillbuildonmanagementlevelplans developedforeachofthethreeprimaryregionsinthesnakeriverbasincorrespondingto thesectionofthedrainageinthestatesofwashington,oregonandidaho.the managementplancoveringthewashingtonsectionofthesnakebasinwillbebasedonan updatedversionofthelowersnakeriversalmonrecoveryplanprovidedtonoaa Fisheriesin2005bythestateofWashington. TRTandRecoveryPlanCriteria TheICTRTdevelopedviabilitycriteriaforapplicationtoSnakeRiverfallChinook salmonatthepopulationandesulevels(ictrt,2007).thecriteriawerebasedonthe sameprinciplesastheapplicationsforinteriorbasinspring,spring/summeresusand steelheaddpss.atthepopulationlevel,theictrtabundanceandproductivitycriteriaare expressedasviabilitycurves.thelowermainstempopulationwouldbeconsideredatlow 11 Sectionauthor:TomCooney
94 riskifthecombinationofabundance(recent10yeargeometricmeannaturalorigin spawners)andproductivity(geometricmeanspawnertospawnerratiosforparent escapementslessthan2000spawners 75%oftheminimumabundancethresholdof 3000)exceedsacurvegeneratedbysimulationmodelingthatincorporatesobservedyearto yearvariabilityinreturnrates.inanycase,theictrtcriteriaforlowviabilityrisk stipulatethatthe10yeargeometricmeannaturaloriginescapementshouldexceed3,000, withaminimumof2,500naturaloriginspawnersinthemainstemsnakerivermajor spawningareas.achievingaverylowriskratingforabundanceandproductivityrequires exceedingthesamenaturaloriginabundancethresholdcombinedwithaproductivity estimateof1.5orhigher. TheICTRTappliedthesamegenericframeworkindevelopingpopulationspatial structureanddiversitycriteriaforapplicationtosnakeriverfallchinooksalmon(ictrt, 2007).Severalofthosecriteriarequireadefinitionofwithinpopulationstructure.The ICTRTdescribedfivemajorspawningareaswithintheLowerMainstempopulation three mainstemreaches(salmonriverconfluencetohellscanyondamsite,lowergranitedam tothesalmonriverconfluenceandthemainstemoffofandincludingthelowertucannon River)andtwotributarymainstems(lowerGrandeRondeRiverandtheClearwaterRiver). Inaddition,smallerspawningreachesintheImnahaRiverandSalmonRiverweredefined asminorspawningareas. NewDataandUpdatedAnalyses AnnualestimatesofspawningescapementsfortheextantpopulationofSnakeRiver fallchinookarebasedoncountsandadultsamplingatpassageoverlowergranitedam (reftolfhreport).statisticalmethodsforparsingoutcomponents(e.g.,naturaland hatcheryoriginfish)havegenerallyimprovedsincethe2005brtreview.escapement estimatesarenowavailablethroughthe2008returnyear(figure36). Standardabundanceandtrends ThetotalspawningescapementintonaturalareasaboveLowerGraniteDamhas remainedrelativelyhighsincetherapidincreaseinthelate1990 s.thecurrentfiveyear geometricmeantotalescapementisabove10,000,substantiallygreaterthanthe geometricmeanreportedinthepreviousBRTreview(Table23).Arelativelyhigh proportionoftheestimatedspawnersareofhatcheryorigin(78%forthemostrecentfive yearcycle).howevernaturaloriginreturnshavealsoincreasedsubstantiallyoverboththe geometricmeanestimatesforthe2005brtreviewandthecyclejustpriortothe1997 listingdecision. Table23SnakeRiverFallChinook.Recentabundanceandproportionnaturalorigincomparedtoestimatesat thetimeoflistingandthepreviousbrtreview. Population Snake River Fall Chinook Total Spawners ( 5 year geometric mean, range) Prior Current ( ) ( ) 2164 ( ) ( ) Natural Spawning Areas Natural Origin ( 5 year geometric mean) Prior Current ( ) ( ) 1055 ( ) 2291 ( ) % Natural Origin (5 year average) Prior Current ( ) ( ) 51% 22% 94
lineindicatestotalnaturalspawners(includingnaturallyspawninghatcheryfish).")
95 Figure36 SnakeRiverFallChinook.EstimatedescapementaboveLowerGraniteDam.AdultrunsizetoLower GraniteDamminusfishtrappedandtransferredtohatcheryprograms.Thedarklineindicatesnaturalorigin spawnernumbers,light(red)lineindicatestotalnaturalspawners(includingnaturallyspawninghatcheryfish). Thedottedlineisthelong term(wholetimeseries)meanofthetotalspawers,andthegreenshadedarea indicates+/ 1standarddeviationaroundthemean. Figure37 SnakeRiverFallChinook.Broodyearspawnertospawnerestimates.Filleddiamonds:parent spawnerestimatebelow75%ofminimumabundancethreshold.opensquares:parentescapementgreaterthan 75%ofminimumabundancethreshold. 95
96 Themostrecentshort termtrendinnaturaloriginspawnerswasstronglypositive, increasingatanaveragerateof16%peryear(table24).therateofincreaseisdownfrom the23%peryearestimatedfor Hatcheryoriginescapementsintonatural spawningareascontinuedtoincreasethroughthemostrecentreturnyear(figure36). Althoughnaturaloriginreturnshaveremainedwellabovethelevelsestimatedatthetime oflistingintheearly1990 s,themostrecentescapementshavedroppedfromthepeakin andhavefluctuatedbelowtheICTRTminimumabundancethresholdlevel.The apparentlevelingoffofnaturalreturnsinspiteoftheincreasesintotalbroodyear spawnersmayindicatethatdensitydependenthabitateffectsareinfluencingproductionor thathighhatcheryproportionsmaybeinfluencingnaturalproductionrates. Table24.Shortterm(since1995)trendsinnaturaloriginspawningabundance(slopeofnaturallnadult spawners)forthelowersnakeriverfallchinookpopulation.comparisonswithtimeperiodscorrespondingto priorbrtreviewsincluded. Population Snake River Fall Chinook Estimate (CI) Prob> BRT ( ) 1.12 ( ) 0.97 Short-term trend Previous ( ) 1.23 ( ) Current ( ) 1.16 ( ) Table25.Shortterm(since1995)trendsinspawningabundance(populationgrowthrate)fortheLowerSnake RiverFallChinookpopulation.ComparisonswithtimeperiodscorrespondingtopriorBRTreviewsincluded Population Snake River Fall Chinook Estimate (CI) Prob>1.0 Short-term Lambda Hatchery effectiveness= 0 Hatchery effectiveness= BRT Current 2005 BRT Current ( ) ( ) ( ) ( ) ( ) ( ) ( ) ( )
97 TheSnakeFallChinooksalmonabundanceseriesbeginswiththe1975returnyear. Theaveragelong termtrendinnaturaloriginreturnstothespawninggroundsispositive (averagerateofincreaseof6%peryear),againlargelydrivenbyrecentincreases.the estimatedaveragepopulationgrowthrateassumingthathatcheryoriginparentspawners havebeencontributingatthesamerateasnaturaloriginparentshasbeenlessthan1.0, indicatingthatnaturalproductionhasnotproportionallyincreasedinresponsetothe upwardtrendintotalspawners.thepopulationgrowthrateestimateunderthe assumptionthathatcheryoriginspawnershavenotcontributedtoproductionisan indicatoroftrendsintotalbroodyearproductionacrossreturnyears.thatmetricis positive,indicatingthatonaveragenaturalproductionhasincreasedoverthebroodyears Table26.LongtermtrendestimatesforLowerSnakeRiverFallChinookpopulation. Trendintotal Spawners Lambda (HF=0) Lambda(HF=1) Population Years Estimate(CI) Estimate(CI) Prob>1 Estimate(CI) Prob>1 LowerSnake Fall ( ) 1.04( ) ( )
98 TRTViabilityCriteriaRatings TheICTRTratedthecurrentstatusoftheSnakeRiverfallChinookpopulationand theesubasedondatathroughreturnyear2007.totalabundanceandhatchery contributionestimatesandspawnerdistributionsbasedonreddcountsarenowavailable fortwoadditionalyears. Table27.ViabilityassessmentforLowerSnakeRiverFallChinookpopulationusingICTRTcriteria.Updatedto reflectreturnsthrough2008. Population Snake River Fall Chinook Brood years Abundance/Productivity Metrics ICTRT Minimum Threshold Natural Spawning Abundance ( ) AbundanceandProductivity ICTRT Productivity 1.28 ( ) 1.07 ( ) Integrated A/P Risk Moderate (Moderate) Spatial Structure and Diversity Metrics Natural Processes Risk Diversity Risk Integrated SS/D Risk Overall Viability Rating Low Moderate Moderate Maintained Thecurrentestimate( yeargeometricmean)ofnaturalorigin spawningabundance(10yeargeometricmean)ofsnakeriverfallchinookisjustover 2,200.TheICTRTgenerallyrecommendscalculatingpopulationproductivity(expected spawnertospawnerreturnrateatlowtomoderateparentescapements)usingthemost recent20broodyears.previousictrtstatusreviewsforsnakeriverfallchinook includedestimatesbasedonamorerecenttimeseriestoaccountforpotentialmajor,but un quantifiedchangesindownstreampassageconditions(enhancedflowsandtransport regimes)initiatedin1990.theupdatedproductivitybasedonthe1990topresentseries was1.28,theestimateforthelongerseries broodyears,was1.07(Table27). Combiningthecurrentnaturalspawningescapementestimateof2,200witheitherofthe productivityestimatesresultsinanabundanceandproductivityratingofmoderaterisk usingtheictrtviabilitycurvesforthispopulation. SpatialStructureandDiversity Theadditionoftwoyearsofspawnerdistributionandhatcherycompositiondata doesnotaltertheconclusionsreachedintheictrtstatusreportregardingspatial structureanddiversityratings. TheLowerSnakeRiverfallChinookpopulationwasratedat lowriskforgoala(allowingnaturalratesandlevelsofspatiallymediatedprocesses)and moderateriskforgoalb(maintainingnaturallevelsofvariation)resultinginanoverallspatial structureanddiversityratingofmoderaterisk.themoderateriskratingwasdrivenby changesinmajorlifehistorypatterns,shiftsinphenotypictraitsandhighlevelsofgenetic homogeneityinsamplesfromnatural originreturns.inaddition,thechronichighlevelsof hatcheryspawnersinnaturalspawningareasandsubstantialselectivepressureimposedby 98
99 currenthydropoweroperationsandcumulativeharvestimpactswouldalsoleadtoamoderate rating. ScalesamplesfromnaturaloriginfallChinooktakenatLowerGraniteDamcontinue toindicatethatapproximatelyhalfofthereturnsoverwinteredinfreshwater(milksetal., 2009appendixH). Giventhecombinationofcurrentratingsforabundance/productivityandspatial structure/diversitysummarizedabove,thelowersnakeriverfallchinooksalmon populationwouldberatedasmaintained(figure38).thereisahighlevelof uncertaintyassociatedwiththeoverallratingforthispopulation,primarilydrivenby uncertaintiesregardingcurrentaveragenatural originabundanceandproductivitylevels. Itisdifficulttoseparatevariationsinoceansurvivalfrompotentialchangesinhydropower impactswithoutcomparativemeasuresofjuvenilepassagesurvivalsundercurrent operationsorarepresentativemeasureofoceansurvivalrates. Spatial Structure/Diversity Risk Very Low Low Moderate High Very Low (<1%) HV HV V M Abundance/ Productivity Risk Low (1-5%) V V V M Moderate (6 25%) M M M Lower Main. Snake HR High (>25%) HR HR HR HR Figure38 SnakeRiverLowerMainstemfallChinooksalmonpopulationriskratingsintegratedacrossthefour viablesalmonidpopulation(vsp)metrics.viabilitykey:hv HighlyViable;V Viable;M Maintained;HR High Risk;Shadedcells doesnotmeetviabilitycriteria(darkestcellsareathighestrisk). Harvest SnakeRiverfallChinookhaveaverybroadoceandistributionandhavebeentakenin oceansalmonfisheriesfromcentralcaliforniathroughsoutheastalaska.theyarealso harvestedin riverintribalandnon tribalfisheries.historicallytheyweresubjecttototal exploitationratesontheorderof80%.sincetheywereoriginallylistedin1992,fishery impactshavebeenreducedinbothoceanandriverfisheries(figure39).totalexploitation ratehasbeenrelativelystableintherangeof40%to50%sincethemid 1990s 99
andforin riverharvestratesfromthecolumbiariver")
100 Figure39 TotalexploitationrateforSnakeRiverfallChinooksalmon.Dataformarineexploitationratesfrom thechinooktechnicalcommitteemodel(ctcinprep)andforin riverharvestratesfromthecolumbiariver TechnicalAdvisoryCommittee(TAC2009,andCindyLeFleur,WDFW,personalcommunication). Hatcheryreleases HatcheryreleasesofSnakeRiverfallChinooksalmonhavegenerallybeentrending upwardsincethemid 1990s,ashavereleasesofcohoandsockeye(Figure40). 100

101 Figure40 SnakeRiverhatcheryreleasessince1980.Datasource:FishPassageCenter ( 101
102 SnakeRiverfallChinooksalmon:UpdatedRiskSummary AbundanceandproductivityestimatesforthesingleremainingpopulationofSnake RiverFallChinooksalmonhaveimprovedsubstantiallyrelativetothetimeoflisting. Howeverthecurrentcombinedestimatesofabundanceandproductivitypopulationstill resultinamoderateriskofextinctionofbetween5%and25%in100years.theextant populationofsnakeriverfallchinookistheonlyremainingfromanhistoricalesuthat alsoincludedlargemainstempopulationsupstreamofthecurrentlocationofthehells CanyonDamcomplex.Therecentincreasesinnaturaloriginabundanceareencouraging. However,hatcheryoriginspawnerproportionshaveincreaseddramaticallyinrecentyears onaverage,78%oftheestimatedadultspawnershavebeenhatcheryoriginoverthe mostrecentbroodcycle.overall,thenewinformationconsidereddoesnotindicatea changeinthebiologicalriskcategorysincethetimeofthelastbrtstatusreview. References Good, T.P., R.S. Waples and P. Adams (editors) Updated status of federally listed ESUs of West Coast salmon and steelhead. U.S. Dept. of Commer., NOAA Tech. Memo. NMFS-NWFSC-66, 598 p. ICTRT, Independent populations of chinook, steelhead and sockeye for listed evolutionarily significant units within the interior Columbia River domain. Interior Columbia Basin Technical Recovery Team Technical Review Draft. July p. ICTRT, Viability criteria for application to interior Columbia Basin salmonid ESUs. Interior Columbia Basin Technical Recovery Team. Technical Review Draft. March p + appendices and attachments. ICTRT(2010)Currentstatusreviews:InteriorColumbiaBasinsalmonESUsandsteelhead DPSs.Vol.1.SnakeRiverESUs/DPS.786p.+attachments Milks,D.,M.VarneyandM.Schuck.2009.LyonsFerryHatcheryEvalution:FallChinook salmonannualreport2006.washingtondepartmentoffishandwildifereportto; USFishandWildlifeServiceLowerSnakeRiverCompensationPlanOffice.WDFW p. 20Chinook%20Annual% pdf 102
103 103 SnakeRiversockeyesalmon 12 TheESUincludesallanadromousandresidualsockeyesalmonfromtheSnakeRiver Basin,Idaho,aswellasartificiallypropagatedsockeyesalmonfromtheRedfishLake captivepropagationprogram.thisesuwasfirstlistedundertheesain1991,thelisting wasreaffirmedin2005(70fr37160&37204). SummaryofpreviousBRTconclusions The2005BRTassignedtheSnakeRiverSockeyeESUtothe dangerofextinction category.thishighriskratingwasreflectedinthescoringbyallmembersofthebrt.the BRTratedtheESUatextremelyhighriskacrossallfourbasicriskmeasures(abundance, productivity,spatialstructureanddiversity),notingthatonly16naturallyproducedadults havebeencountedsince1991.thebrtassessmentacknowledgedthattheemergency captivebroodprograminitiatedin1991has,..atleasttemporarily...rescuedthisesufrom thebrinkofextinction.. andthatongoingresearchhassubstantiallyincreasedbiological andenvironmentalinformationabouttheesu. BriefReviewRecoveryPlanning NOAAFisherieshasinitiatedrecoveryplanningfortheSnakeRiverdrainage, includingacomponentaddressingthesnakeriversockeyeesu.adraftrecoveryplanis expectedtobeavailableforreviewin2011.thesnakeriversockeyerecoveryplan componentwillbuildonongoingeffortsincludinghatcheryprogramsandhabitat assessmentactivitiescoordinatedthoughthestanleybasinsockeyetechnicaloversight Committee(SBSTOC).Inaddition,actionstomonitorandimprovejuveniledownstream andadultupstreampassagesurvivalsarebeingevaluatedandimplementedthroughthe FederalColumbiaRiverPowerSystem2008BiologicalOpinion. Theinitialprioritiesestablishedintheearly1990sbytheSBSTOCwereto... protecttheremnantesa listedsnakerivergenepoolexistinginredfishlakethroughthe useofcaptivebroodstocktechnologyandtodevelopanunderstandingofthecarrying capacityofsawtoothvalleylakes. Evaluatingthepotentialsuccessofalternative supplementationstrategieswasrecognizedasanimportant secondtier priority(flagget al.,2004). TRTandRecoveryPlanCriteria TheICTRTdevelopedabundanceandproductivitycriteriaforapplicationtoSnakeRiver sockeyepopulations(ictrt,2007).thecriteriareflectthegeneralframeworkusedbythe ICTRTindevelopingESU/DPSspecificcriteriaforallotherlistedinteriorruns.TheStanley BasinLakesarerelativelysmallcomparedtootherlakesystemsthathistoricallysupported sockeyeproductioninthecolumbiabasin.stanleylakeisassignedtothesmallestsize categoryalongwithpettitandyellowbellylakes.redfishlakeandalturaslakefallinto thenextsizecategory intermediate.theaverageabundancetargetsrecommendedbythe SnakeRiverRecoveryTeam(Bevan,etal.1994)wereincorporatedasminimum abundancethresholdsintoasockeyeviabilitycurvegeneratedusinghistoricalage 12 Sectionauthor:TomCooney
104 structureestimatesfromredfishlakesamplinginthe1950s 60sandyeartoyear variationsinbroodyearreplacementratesgeneratedfromabundanceseriesforlake Wenatcheesockeye.Theminimumspawningabundancethresholdissetat1,000forthe RedfishandAlturasLakepopulations(intermediatecategory),andat500forpopulations inthesmallesthistoricalsizecategory(e.g.,alturasandpetitlakes).theictrt recommendedthatlong termrecoveryobjectivesshouldincluderestoringatleastthreeof thelakepopulationsintheesutoviableorhighlyviablestatus. NewDataandUpdatedAnalyses ThepreviousBRTreviewincludedasummaryofadultreturnsthroughthe2002 runyear.estimatesofannualreturnsarenowavailablethrough2009(table28).adult returnsin2008and2009werethehighestsincethecurrentcaptivebroodbasedprogram beganwithatotalof650and809adultscountedbacktothestanleybasin.approximately twothirdsoftheadultscapturedineachyearweretakenattheredfishlakecreekweir, theremainingadultswerecapturedatthesawtoothhatcheryweironthemainstem SalmonRiverupstreamoftheRedfishLakeCreekconfluence.Returnsfor were relativelylow,similartotherangeobservedbetween1987and1999. Table28 AdultSockeyereturnstoStanleyBasinweirsites.In2008,50adultfishwerecountedinRedfishLake Creekbelowtheweirsite,anadditional2fishpassedtheweirsiteoutsideofthecountingperiod(check). 104
105 Increasedreturnsinrecentyearshavesupportedsubstantialincreasesinthe numberofadultsreleasedabovetheredfishlakecreekweirinrecentyears(table29). Annualadultreleasessince2003haverangedfrom173to969comparedtotherangefor thefiveyearperiodendingin2002(0to190sockeye).thelargeincreasesinreturning adultsinrecentyearsreflectsimproveddownstreamandoceansurvivalsaswellas increasesinjuvenileproductionsincetheearly1990s(table29).presmoltoutplantsinto Redfish,AlturasandPetitLakeswereinitiatedinthemid 1990s,releaseshaveaveraged approximately80,000peryearsince1995.onaverage,approximately30,000peryearof thepresmoltreleasesaredetectedleavingthethreelakesthefollowingspringdirectsmolt plantsinthelowersectionofredfishlakecreekandinthesalmonriver(sawtoothweir) haveincreasedtoover100,000peryear.thenumberofcaptiverearedorreturning anadromousadultsallowedtopassovertheredfishlakeweiroroutplantedintothelake hasalsoincreasedsubstantiallyinrecentyears.unmarkedjuvenilemigrantsemigrating fromthethreelakesystemshavealsodramaticallyincreasedinrecentyears annual estimateshaverangedfrom16,000to61,000overthe2005through2009outmigrations. Estimatesofthetotalannualoutmigrationacrossallofthesecomponentshaveranged from143,500to210,300duringthemostrecentfiveyearperiod( )comparedto arangeof19, ,300for( ),theperiodcorrespondingtothe2005BRT review. 105
106 Table29 EstimatedannualnumbersofsmoltoutmigrantsfromtheStanleyBasin.Includeshatcherysmolt releases,knownoutmigrantsoriginatingfromhatcherypre smoltoutplantsandestimatesofunmarkedjuveniles migratingfromredfish,alturasandstanleylakes. 106
107 Table30 SnakeRiverSockeyeSalmon.ReleasesofprogenyfromRedfishLakecaptivebroodprograminto RedfishLake,RedfishLakeCreekandtheSalmonRiveratorabovetheSawtoothHatcheryweir. Table31 SnakeRiverSockeyeSalmon.ReleasesofprogenyfromRedfishLakecaptivebroodprograminto AlturasandPetitLakes. OngoingstudiesofthelimnologicalcharacteristicsofthethreeStanleybasinlakes andthecurrentdensitiesofo.nerkajuvenileswithineachofthelakesarebeginningto provideinsightsintotherelativecarryingcapacitiesforsockeyeproduction(e.g.,flagg,et. al.2004). Juvenileemigrationrates 107
108 Theincreasedproductionfromthecaptivebroodprogramhasresultedinsufficient releaseandoutplantinglevelsforinitialevaluationsofalternativesupplementation strategies(hebdonetal,2004).hatcheryrearedpre smoltshavebeenoutplantedinto eachofthethreelakessincethemid 1990s(Table30).Estimatesoftheproportionof thoseoutplantsemigratingdownstreamfromeachofthethreerearinglakeshavebeen generatedsince2000(peterson,etal.2010).medianoutmigrationproportionsfor forRedfish,AlturasandPetitlakeswere0.27,0.47and0.46respectively,with considerableannualvariationintheestimatesforeachlake(figure41). Figure41 Estimatedproportionoffallpresmoltplantsoutmigratinginthespringofthefollowingyear( ).Soliddiamonds=medianestimate,lines=rangeofannualestimates.Estimatesfromtable15inPeterson etal.2010 LakestoLowerGraniteDamjuvenilemigrantsurivivals Theincreasednumbersofjuvenilemigrants(primarilyfromhatcheryreleases), haveralsoresultedinimprovedestimatesofdownstreampassagemortality,includingthe generationofconfidencelimitsusingsurphsamplingdesignsbeginningwiththe2008 outmigrationyear(peterson,etal.2010).priorto2008,survivalestimatesforthe aggregatesmoltoutmigrationofsnakeriversockeyejuvenilesweremadebasedon estimatesofthenumberofo.nerkasmoltssampledatlowergranitedamrelativetothe estimatedoutmigrationfromthestanleybasin(table29).annualestimateshavevaried considerably,rangingfrom0.21to0.76(nwfsc,2008).averagedownstreampassage survivalsacrossmigrationgroupsandareasin2008rangedfrom0.22(petitlake unmarkedsmolts)to0.62(alturaslakeunmarkedsmolts).downstreampassagesurvival fromweirstolowergranitedamformarkedandunmarkedmigrantsweregenerally similarforeachofthelakes.survivalfromreleasetolowergranitedamforspring releasesofhatcheryoriginsmoltsintolowerredfishlakeandthesalmonrivernear SawtoothHatcheryweresimilarandfellinthemiddleofrangeforallrelease groups/locations(figure42). 108
109 Figure42 SnakeRiversockeyejuveniledownstreamsurvivalestimatesfor2008migrationyear.Estimated survivalfromtraporreleaselocationtolowergranitedam.closeddiamonds:naturaloriginsmolts,open diamonds:hatcheryoriginsmoltreleases.bars:95%confidencelimits(surphmodel).estimatesfromtable13 inpetersonetal2010. LowerGraniteDamSARestimates Annualestimatesofanindexofsmolttoadultreturnrates(SARs)havebeen generatedforsnakeriversockeyeastheestimatednumberofsmoltsatlowergranite Damingivenyeardividedintothenumberofreturningadultstwoyearslater(NWFSC, 2008).ThemedianSARindexforthe seriesofannualestimateswas0.2%,with annualindicesrangingfromalowof0.07%toahighof1.04.sarestimatesforfiveofthe nineyearsintheserieswerebasedonlessthan50adultsreturningtolowergranitedam; thereforetheseresultsshouldbeinterpretedwithcaution.currentlyavailablesar estimatesdonotincludethefulleffectoftherelativelylargereturnsin2009and2010 observedforrunsreturningtotheuppercolumbia(lakewenatcheeandlakeokanogan) andtothesnakeriver. TheLowerGraniteSARsreflectaggregatereturnratesacrosstwomajor downstreammigrationroutes in riverpassageanddownstreamtransporttobelow BonnevilleDam.Estimatesoftheproportiontransportedoverthe1998to2006 outmigrationyearshaverangedfromapproximately50%toover90%.themedian estimatedsurvivalofjuvenilein rivermigrantsdownriverfromlowergranitedam throughthelowersnakerivertomcnarydamonthemainstemcolumbiariverwas67% fortheperiod ,individualyearestimatesrangedfrom28%to76%(Feguson, 2010).ThemedianestimateofjuvenilepassagesurvivalsfortheMcNaryDamto BonnevilleDamreach( , )was0.54,whichshouldbeinterpretedwith 109
110 cautionduetosmallsamplesizesandassociatedlowdetectionprobabilitiesformanyof theindividualyearestimates(ferguson,2010). AdultupstreampassagesurvivalsthroughthemainstemColumbiaRivertothe mouthofthesnakeriverareassumedtoberelativelyhighbasedoninferencesfrom estimatesofupstreampassageforuppercolumbiariversockeye(nwfsc,2008). ComparisonsofadultsockeyecountsatIceHarborDamandLowerGraniteDamindicate directlossesarealsolowforpassagethroughthelowersnakeriver.adultpassage survivalestimatesbasedonpittagdetectionsatmultipledamsalsoindicaterelativelylow directpassagemortalityupstreamtolowergranitedam(nmfs,2008). However,comparisonsoftheestimatednumberofadultsockeyeatLowerGranite Damvs.returningtotheSawtoothBasinindicaterelativelyhighlossratesthroughthis reachinsomeyears.keeferetal.(2007)conductedanadultradiotaggingstudyofpassage survivalsupstreamfromlowergranitedamin2000andconcludedthathighin river mortalitiesforsnakeriveradultscouldbeexplainedby acombinationofhigh migrationcorridorwatertemperaturesandpoorinitialfishconditionorparasiteloads. Keeferetal.(2007)examinedcurrentruntimingpatternsofSnakeRiversockeyevs. recordsfromtheearly1960s,concludingthattheapparentshifttoanearlierruntimingin morerecentyearsmayreflectincreasedmortalitiesforlatermigratingadults. Harvest OceanfisheriesdonotsignificantlyimpactSnakeRiversockeye.Withinthemainstem ColumbiaRiver,treatytribalnetfisheriesandnon tribalfisheriesdirectedatchinook salmondoincidentallytakesmallnumbersofsockeye.mostofthesockeyeharvestedare fromtheuppercolumbiariver(canadaandlakewenatchee),butverysmallnumbersof SnakeRiversockeyearetakenincidentaltosummerfisheriesdirectedatChinooksalmon. Inthe1980fisheryimpactratesincreasedbrieflyduetodirectedsockeyefisheriesonlarge runsofuppercolumbiariverstocks(figure43) 110
111 Figure43 ExploitationratesonSnakeRiversockeyesalmon.DatafromtheColumbiaRiverJointStaffReport (2010). Hatcheryreleases ReleasesofChinooksalmon,steelheadandsockeyesalmonwithinthespawningand rearingareasofthesnakeriversockeyesalmonesuhaveremainedfairlyflatsince2005 (Figure44). 111
112 Figure44 AnnualhatcheryreleaseswithinthespawningandrearingareasoftheSnakeRiversockeyesalmon ESU.Datasource:RMIS. 112
113 SnakeRiverSockeyesalmon:UpdatedRiskSummary SubstantialprogresshasbeenmadewiththeSnakeRiversockeyecaptivebrood stockbasedhatcheryprogram,butnaturalproductionlevelsofanadromousreturns remainextremelylowforthisesu.inrecentyears,sufficientnumbersofeggs,juveniles andreturninghatcheryadultshavebeenavailablefromthecaptivebroodbasedprogram toallowforinitiationofeffortstoevaluatealternativesupplementationstrategiesin supportofre establishingnaturalproductionofanadromoussockeye.limnological studiesanddirectexperimentalreleasesarebeingconductedtoelucidateproduction potentialinthreeofthestanleybasinlakesthatarecandidatesforsockeyerestoration. Theavailabilityofincreasednumbersofadultsandjuvenilesinrecentyearsissupporting directevaluationoflakehabitatrearingpotential,juveniledownstreampassagesurvivals andadultupstreamsurvivals.althoughthecaptivebroodprogramhasbeensuccessfulin providingsubstantialnumbersofhatcheryproducedo.nerkaforuseinsupplementation efforts,substantialincreasesinsurvivalratesacrosslifehistorystagesmustoccurinorder tore establishsustainablenaturalproduction(e.g.hebdonetal.2004,keeferetal.2008). TheincreasedabundanceofhatcheryrearedSnakeRiversockeyereducestheriskof immediateloss,butlevelsofnaturallyproducedsockeyereturnsremainextremelylow.as aresult,overall,althoughtheriskstatusofthesnakeriversockeyesalmonesuappearsto beonanimprovingtrend,thenewinformationconsidereddoesnotindicateachangein thebiologicalriskcategorysincethetimeofthelastbrtstatusreview. References ICTRT, Independent populations of chinook, steelhead and sockeye for listed evolutionarily significant units within the interior Columbia River domain. Interior Columbia Basin Technical Recovery Team Technical Review Draft. July p. ICTRT, Viability criteria for application to Interior Columbia Basin Salmonid ESUs. Interior Columbia Basin Technical Recovery Team Technical Review Draft. March p + appendices & attachments Ferguson, J.W Preliminary survival estimates for passage during the spring migration of juvenile salmonids through the Snake and Columbia River reservoirs and dams, NWFSC Memo Sept. 13, p. Flagg,T.A.,W.C.McAuley,P.A.Kline,M.S.Powell,D.TakiandJ.C.Gislason.(2004). ApplicationofcaptivebroodstockstopreservationofESA listedstocksofpacific Salmon:RedfishLakeSockeyeSalmoncaseexample.Am.Fish.Soc.Symp.44: Hebdon,J.L.,P.Kline,D.TakiandT.A.Flagg.2004.Evaluatingreintroductionstrategiesfor RedfishLakeSockeyeSalmoncaptivebroodprogeny.Amer.Fish.Soc.Symp. 44: Keefer,M.L.,C.A.PeeryandM.J.Henrich.2008.Temperaturemediatedenroutemigration mortalityandtravelratesofendangeredsnakeriversockeyesalmon.ecol.of FreshwaterFish17: Kohler,A.,B.Griswold,D.TakiandS.Letzing2008.SnakeRiverSockeyeSalmonhabitat andlimnologicalresearch:2008annualprogressreport.projectno ReporttoBonnevillePoweradministration. 113
114 NationalMarineFisheriesService(NMFS).2008.Supplementalcomprehensiveanalysisof thefederalcolumbiariverpowersystemandmainstemeffectsoftheuppersnake andothertributaryactions Adultsurvivalestimatesappendix.May5,2008. NorthwestFisheriesScienceCenter(2009).Factorsaffectingsockeyesalmonreturnstothe ColumbiaRiverin2008.NOAAFisheriesRept.37p. Peterson,M.K.Plaster,L.RedfieldandJ.Heindel.SnakeRiverSockeyeSalmoncaptive broodstockprogram:researchelement.annualprogressreport:january12008 December IDFGRept.#10 08.PreparedforBonnevillePower Administration. 114
115 115 SnakeRiverBasinsteelhead 13 TheSnakeRiverSteelheadDPS.includesallnaturallyspawnedanadromousO. mykiss(steelhead)populationsbelownaturalandmanmadeimpassablebarriersin streamsinthesnakeriverbasinofsoutheastwashington,northeastoregon,andidahoas wellassixartificialproductionprograms:thetucannonriver,dworshaknfh,lolocreek, NorthForkClearwaterRiver,EastForkSalmonRiver,andtheLittleSheepCreek/Imnaha RiverHatcherysteelheadhatcheryprograms (FederalRegisternotice71FR834).Snake Riversteelheadareclassifiedassummerrunbasedontheiradultruntimingpatterns. MuchofthefreshwaterhabitatusedbySnakeRiversteelheadforspawningandrearingis warmeranddrierthanthatassociatedwithothersteelheaddpss.snakeriversteelhead spawnandrearasjuvenilesacrossawiderangeoffreshwatertemperature/precipitation regimes.fisheriesmanagersclassifycolumbiariversummerrunsteelheadintotwo aggregategroups,a runandb run,basedonoceanageatreturn,adultsizeatreturnand migrationtiming.a runsteelheadarepredominatelyspendoneyearatseaandare assumedtobeassociatedwithlowtomid elevationstreamsthroughouttheinterior Columbiabasin.B runsteelheadarelargerwithmostindividualsreturningafter2yearsin theocean. NOAAFisherieshasdefinedDPSsofsteelheadtoincludeonlytheanadromous membersofthisspecies(70fr67130).ourapproachtoassessingthecurrentstatusofa steelheaddpsisbasedevaluatinginformationtheabundance,productivity,spatial structureanddiversityoftheanadromouscomponentofthisspecies.(goodetal.2005;70 FR67130).Manysteelhead(O.mykiss)populationsalongtheWestCoastoftheU.S.cooccurwithconspecificpopulationsofresidentrainbowtrout.Werecognizethattheremay besituationswherereproductivecontributionsfromresidentrainbowtroutmaymitigate short termextinctionriskforsomesteelheaddpss(goodetal.2005;70fr67130).we assumethatanybenefitstoananadromouspopulationresultingfromthepresenceofa conspecificresidentformwillbereflectedindirectmeasuresofthecurrentstatusofthe anadromousform. SummaryofpreviousBRTconclusions The2005BRTreporthighlightedmoderaterisksacrossallfourprimaryfactors (productivity,naturaloriginabundance,spatialstructureanddiversity)forthisdps.a majority(70%)oftheriskassessmentpointsassignedbythebrtwereallocatedtothe likelytobecomeendangered category.thecontinuedrelativelydepressedstatusofbrunpopulationswasspecificallycitedasaparticularconcern.thebrtidentifiedthatthe generallackofdirectdataonspawningescapementsintheindividualpopulation tributariesasakeyuncertainty,renderingquantitativeassessmentofviabilityforthedps difficult.thebrtalsoidentifiedthehighproportionhatcheryfishintheaggregaterun overlowergranitedamcombinedwiththelackoftributaryspecificinformationon relativespawninglevelsasasecondmajoruncertaintyandconcern.thebrtcitedthe upturninreturnlevelsin2000and2001asevidencethatthedps isstillcapableof respondingtofavorableenvironmentalconditions. Howeverthereportalso acknowledgedthatabundancelevelsremainwellbelowinterimtargetsforspawning aggregationsacrossthedps. 13 Sectionauthor:TomCooney
116 BriefReviewRecoveryPlanning TheInteriorColumbiaBasinTechnicalRecoveryTeam(ICTRT)identified24extant populationswithinthisdps,organizedinto5majorpopulationgroups(ictrt,2003).the ICTRTalsoidentifiedanumberofpotentialhistoricalpopulationsassociatedwithtributary habitatabovethehellscanyondamcomplexonthemainstemsnakeriver,abarrierto anadromousmigration.thefivemajorpopulationgroups(mpgs)withextantpopulations are:thelowersnakerivermpg(2populations);thegranderondempg(4populations); theimnahariverpopulation/mpg;theclearwaterrivermpg(5extantpopulations,1 extirpated);andthesalmonrivermpg(12populations).inaddition,theictrtconcluded thatsmalltributariesenteringthemainstemsnakeriverbelowhellscanyondammay havehistoricallybeenpartofalargerpopulationwithacoreareacurrentlycutofffrom anadromousaccess.thatpopulationwouldhavebeenpartofoneofthehistorical upstreammpgs. NOAAFisherieshasinitiatedrecoveryplanningfortheSnakeRiverdrainage organizedaroundasubsetofmanagementunitplanscorrespondingtostateboundaries.a tributaryrecoveryplanforoneofthemajormanagementunits,thelowersnakeriver tributarieswithinwashingtonstateboundaries,wasdevelopedundertheauspicesofthe LowerSnakeRiverRecoveryBoardandwasacceptedbyNOAAFisheriesin2005.The LSRBPlanprovidesrecoverycriteria,targetsandtributaryhabitatactionplansforthetwo populationsofspring/summerchinookinthelowersnakempgalongwiththetouchet River(Mid ColumbiaSteelheadDPS)andtheWashingtonsectionsoftheGrandeRonde River.PlanningeffortsareunderwayfortheOregonandIdahodrainages.Viabilitycriteria recommendedbytheictrtarebeingusedinformulatingrecoveryobjectiveswithineach ofthemanagementunitplanningefforts. TRTandRecoveryPlanCriteria TheNOAAFisherieshasinitiatedrecoveryplanningfortheSnakeRiverdrainage, organizedaroundasubsetofmanagementunitplanscorrespondingtostateboundaries.a tributaryrecoveryplandevelopedundertheauspicesofthelowersnakeriverrecovery Board(WashingtonState)wasacceptedbyNOAAFisheriesin2005).TheLSRBPlan providesrecoverycriteria,targetsandtributaryhabitatactionplansforthetwo populationsofsteelheadinthelowersnakempgalongwiththetouchetriver(mid ColumbiaSteelheadDPS)andtheWashingtonsectionsoftheGrandeRondeRiver. PlanningeffortsareunderwayfortheOregonandIdahodrainages.Viabilitycriteria recommendedbytheictrtarebeingusedinformulatingrecoveryobjectiveswithineach ofthemanagementunitplanningefforts.theictrtrecoverycriteriaarehierarchicalin nature,withesu/dpslevelcriteriabeingbasedonthestatusofnaturaloriginsteelhead assessedatthepopulationlevel.adetaileddescriptionoftheictrtviabilitycriteriaand theirderivation(ictrt,2007)canbefoundat assessmentsarebasedonasetofmetricsdesignedtoevaluateriskacrossthefourviable salmonidpopulationelements abundance,productivity,spatialstructureanddiversity (McElanyetal.2000).TheICTRTapproachcallsforcomparingestimatesofcurrent naturaloriginabundance(measuredasa10yeargeometricmeanofnaturalorigin spawners)andproductivity(estimateofreturnperspawneratlowtomoderateparent spawningabundance)againstpredefinedviabilitycurves.inaddition,theictrt 116
117 developedasetofspecificcriteria(metricsandexampleriskthresholds)forassessingthe spatialstructureanddiversityrisksbasedoncurrentinformationrepresentingeach specificpopulation.theictrtviabilitycriteriaaregenerallyexpressedrelativeto particularriskthreshold lowriskisdefinedaslessthana5%riskofextinctionovera100 yearperiodandverylowriskaslessthana1%probabilityoverthesametimeperiod. SnakeRiverSteelheadDPS:ICTRTExampleRecoveryScenarios TheICTRTrecommendsthateachextantMPGshouldincludeviablepopulations totalingatleasthalfofthepopulationshistoricallypresent,withallmajorlifehistory groupsrepresented.inaddition,theviablepopulationswithinanmpgshouldinclude proportionalrepresentationofatlargeandverylargepopulationshistoricallypresent. WithinanyparticularMPG,theremaybeseveralspecificcombinationsofpopulationsthat couldsatisfytheictrtcriteria.theictrtidentifiedexamplescenariosthatwouldsatisfy thecriteriaforallextantmpgs(ictrt,2007).ineachcasetheremainingpopulationsinan MPGshouldbeatorabovemaintainedstatus. LowerSnakeRiverMPG:TheICTRTrecommendsthatbothpopulations(Tucannon RiverandAsotinCreek)inthisMPGshouldberestoredtoviablestatus,withatleastone meetingthecriteriaforhighlyviable. GrandeRondeMPG:Twoofthefourpopulationsshouldberestoredtoviablestatus tomeetictrtcriteriaforthismpg.theictrtexamplescenarioincludestheupper GrandeRondeRiver(largesize)andeitherJosephCreek(currentlowriskstatus)orthe LowerGrandeRondeRiver. ImnahaRiverMPG:TheImnahaRiverpopulationshouldmeethighlyviablestatus forthisonepopulationmpgtoberatedasviableunderthebasicictrtcriteria. ClearwaterRiverMPG:ThisMPGincludesfiveextantandoneextirpated(North ForkClearwaterRiver)populations.TheICTRTexamplerecoveryscenarioincludesthe LowerClearwaterRiver(largesize)andtwooutofthefollowingthreepopulations(Lochsa River,SelwayRiverandSouthForkClearwaterRiver). SalmonRiverMPG:ThisrelativelylargeMPGincludes11extantand1extirpated (PantherCreek)populations.TheICTRTexamplescenarioforthisMPGincludes considerationforhistoricalpopulationsize,inclusionofbothmajorlifehistorypatterns(a andbruntiming),andachievingadistributionofviablepopulationsacrosstheregion occupiedbyextantpopulations.thescenarioincludeschamberlaincreek,theupper MiddleForkandtheSouthForkpopulationsalongwiththreeadditionalpopulationsat leasttwoofwhichshouldbelargeorintermediateinsize. 117
118 NewDataandUpdatedAnalyses AdultabundancedataseriesfortheSnakeRiverSteelheadDPSarelimitedtoasetof aggregateestimates(total,a runandb runcountedatlowergranitedam),estimatesfor twogranderondepopulations(josephcreekanduppergranderonderiver),andindex areaorweircountsforsubsectionsofseveralotherpopulations.aseriesofjuvenilecounts basedonsnorkeltransectsrepresentativeofproductionwithinseveralpopulation aggregatesarealsoavailablegoingbacktothemid 1980s. TheICTRTidentifiedthemainprioritiesforaddressingkeyuncertaintiesregarding thestatusofthisdpsasgettingpopulationspecificestimatesofannualabundanceand obtaininginformationontherelativedistributionofhatcheryspawnersatthepopulation level(ictrt,2010).twoprojectshavebeeninitiatedtogainmorespecificdataonthe distributionofspawnersamongpopulationsorgeographicaggregationsofpopulations. Preliminaryresultsfromamixedstockanalysisgeneticssamplingapproacharepromising (PeteHassemer,IDFGBoiseoffice,personalcommunication).Inaddition,adultPITtag arraysarebeinginstalledinthelowersectionsofseveraldrainages,allowingformarkrecapturedbasedestimatesforsomepopulationsorpopulationaggregates. Standardabundanceandtrends Populationlevelabundancedataseriesareavailableforjust2populationswithin thisdps,botharewithinthegranderondempg(table32).threeothertypesof abundanceindicesrepresentativeoftheremainingpopulationsareavailableandcanbe usedtoinfertheoverallstatusofthedps. ThetwopopulationleveldatasetsavailablefortheDPSbothshowadropintotal abundancesincethepreviousreview(table32,figure45).naturaloriginabundancein JosephCreekisalsodownrelativetothepreviousreviewwhilenaturaloriginabundance fortheuppergranderondeisup.bothpopulationshaverelativelyhighproportionsof naturaloriginspawners. Longertermtrendestimatesforthepopulationsdifferslightly(Table36).Both seriesbeginwithestimatesfortheearly1970sandextendthrough2009.theaverage trendoverthefulltimeperiodwasanegative1to5%peryearfortheuppergranderonde andapositive1 4%peryearforJosephCreekacrosstherangeoflongtermtrendmetrics (Table36).EstimatesofannualspawningescapementsintotheUpperGrandeRondeRiver fluctuatedaroundlowerlevelsforaprolongedperiodexceptforapeakinthemid 1980s andanincreaseinthemostrecenttwoyears.estimatedescapementsinjosephcreekwere generallylowerinthe1970s,andfluctuatedaroundhigherlevelsafteralsopeakinginthe mid 1980s.TheaggregateLGRabundanceestimatesareavailableforyearsbackto cycle.Thegeneraltrendinreturnshasbeenslightlypositiveacrossallgroups. WiththeexceptionoftheTucannonRiver,allofthepopulationswithinthisDPSare associatedwithtributariesabovelowergranitedam.annualcountsofsteelheadpassing LowerGraniteDamalongwithestimatesoftherelativeproportionsofthehatcheryand naturaloriginareavailableandcanbeusedasanindexoftrendsinaggregateproduction. FisheriesmanagersbreaktherunoverLowerGraniteintoArunandBruntypesbasedon fishlengthdatarecordedalongwiththecounts.arunreturnsarebelievedtoprimarily representreturnstolowerelevationtributariesincludingthegranderonderiver,the ImnahaRiverandsomepopulationtributariesintheClearwaterandSalmonRivers.The 118
119 largerbrunreturnsarebelievedtobeproducedprimarilyinhigherelevationtributariesin theclearwaterandsalmonriverbasins. Themostrecentfive yeargeometricmeantotalrun(wildplushatcheryorigin)to LowerGraniteDamwasupsubstantiallyfromthecorrespondingestimatesfortheprior BRTreviewandthetimeperiodleadinguptolisting(Table33,Figure47).Naturalorigin andhatcheryoriginreturnseachshowedincreases,althoughhatcheryfishincreasedata higherrate.boththeaggregateaandbrunestimateshaveincreasedrelativetothelevels associatedwithpriorassessments.alargeproportionofthehatcheryrunoverlower GraniteDamreturnstohatcheryracksorisremovedbyhatcheryselectiveharvestpriorto reachingspawningareas.asaresult,thehatcheryproportionsintheaggregaterunover LowerGraniteDamarenotindicativeoftheproportionsinspawningescapementsinto mostpopulationtributaries.monitoringtherelativecontributionofhatcheryreturnsto spawninginnaturalareas,particularlythoseareasnearmajorhatcheryreleasesites,isa highpriorityforimprovingfutureassessmentsinthedps. Table32.Recentabundanceandproportionnaturalorigincomparedtoestimatesatthetimeoflistingandinthe previousbrtreview.abundanceestimates(fiveyeargeometricmeanwithrangeinparentheses)corresponding tothetimeoflistingandthe2005brtbasedonbestcurrentlyavailabledata.organizedbympg. Population Joseph Creek Upper Grande Ronde River Total Spawners ( 5 year geometric mean, range) Listing Prior Current ( ) ( ) ( ) ( ) ( ) ( ) ( ) Natural Spawning Areas Natural Origin ( 5 year geometric mean) Prior ( ) 2134 Listing ( ) Current ( ) 1925 ( ) ( ) ( ) ( ) Listing ( ) % Natural Origin (5 year average) Prior ( ) Current ( ) 100% 100% 100% 79% 76% 99% Table33.RecentabundanceandproportionnaturaloriginforaggregatereturnstoLowerGraniteDamwith comparisonstoestimatesatthetimeoflistingandinthepreviousbrtreview.estimatesrepresentrunpriorto upstreamharvestandprespawningmortalitiesandincludefishreturningtohatcheryracksaswellasfishthat willspawninnaturalareas. Population Total Spawners ( 5 year geometric mean, range) Prior Current ( ) ( ) Listing ( ) Natural Spawning Areas Natural Origin ( 5 year geometric mean) Prior ( ) Listing ( ) Current ( ) Listing ( ) % Natural Origin (5 year average) Prior ( ) Current ( ) LGR Run 77,761 85, ,323 11,462 10,693 18,847 15% 13% 10% A Run 61,727 70, ,230 8,869 8,888 15,395 14% 13% 11% B Run 15,104 14,491 33,056 2,505 1,718 3,291 17% 11% 10% Indexareadataseriesrepresentingportionsofthreeadditionalpopulationsinthe GrandeRondeandLowerSnakeMPGsareavailable(Figure46).Allfourseriesarehighly variableandshowsimilartemporalpatternstothepopulationanddpsaggregatelevel datasets. TheIdahoDepartmentofFishandGame(IDFG)hasroutinelycollectedjuvenileO. mykissdensityestimatesacrossaseriesoffixedtransectsdistributedacrosstributary habitatsinidahosincethemid 1980s.Thesamplingdesignandintensitywasnotsetupto generatetotalproductionestimatesatthepopulationorregionallevel,buttheresultsare 119
120 consideredtobegenerallyindicativeoftrendsintotalnaturalproduction.idfgconsiders thesetoftransectsinbchanneltypehabitatasindicativeofsteelheadproductionand aggregatesannualresultsacrosstransectsinfoursubcategories(figure48).average densitiesinareasassignedasarunhabitatstrendeddownwardsfrom1985throughthe mid 1990s,returningtolevelssimilartotheearliestyearsintheseriesafter2000.Similar patternswereobservedintransectsinnatural(areasnearhatcheryproductionrelease sites)vs.areasclassifiedaswild.areasclassifiedasbrunwildappeartofollowasimilar pattern.theaveragejuveniledensitiesinareasclassifiedbyidfgasnaturalfluctuated aroundarelativelyconstantlevelfrom1985throughthemostrecentyearintheseries (2007).).Ingeneral,themediandensitiesacrossindividualtransectserieswerethe highestforlowerelevationpopulationsortributaries(figure48).thehighestmedian densitieswereobservedinthesmalltributariesbelowhellscanyondam,thelower ClearwaterandLochsaRivers(ClearwaterMPG)andtheSecesh,LittleSalmonRiver,North ForkSalmonRiver,PantherCreekandLemhiRiver(SalmonMPG). Table34.Trendintotal(naturalareas)spawners.SnakeRiversteelhead.Comparisonofcurrenttrendstoprior reviews. Estimate (CI) Prob>1.0 Estimate (CI) Prob>1.0 Population 0.84 ( ) ( ) ( ) ( ) BRT ( ) 1.11 ( ) ( ) 0.20 Short-term trend Previous ( ) Current ( ) Table35.ShortTerm(since1995)populationgrowthrate(lambda)estimates.Currentestimatesvs.2005BRT shorttermtimeseries. Population Joseph Creek Upper Grande Ronde River Short-term Lambda Hatchery effectiveness= 0 Hatchery effectiveness= BRT Current 2005 BRT Current ( ) ( ) ( ) ( ) ( ) ( ) ( ) ( ) ( ) ( ) ( ) ( )
121 Table36.LongtermtrendsinspawningabundanceforSnakeRiverSteelheadpopulations. Trendintotal Spawners Lambda(HF=0) Lambda(HF=1) Population Years Estimate(CI) Estimate(CI) Prob>1 Estimate(CI) Prob>1 Joseph ( ) 1.01( ) ( ) 0.56 UGR ( ) 0.97( ) ( )
lineindicatestotalnaturalspawners(includingnaturallyspawninghatcheryfish).")
122 Figure45.SnakeRiverSteelheadpopulationestimates.Thedarklineindicatesnaturaloriginspawnernumbers, light(red)lineindicatestotalnaturalspawners(includingnaturallyspawninghatcheryfish).thedottedlineis thelong term(wholetimeseries)meanofthetotalspawers,andthegreenshadedareaindicates+/ 1standard deviationaroundthemean. 122
123 Figure46.SnakeRiverSteelheadindexareas.Annualspawnerabundanceforindexareaonly(naturalorigin andtotal). 123

124 Figure47.LowerGraniteDamCountsforSnakeRiverSteelhead. 124

125 Figure48.JuvenileSnakeRiverSteelheadparrdensitiesobservedinIDFGsnorkeltransects. 125
126 CurrentStatus:ICTRTViabilityCriteria Onlytwoofthetwenty threeextantpopulationsofsnakeriversteelheadhave estimatesofpopulationspecificspawningabundance.theictrtusedaggregateestimates ofabundanceatlowergranitedamalongwithjuvenileindicesofabundanceavailablefor someareastoinferabundanceandproductivityratingsforpopulationswithoutspecific adultabundancetimeseries(ictrt,2010).bothpopulationswithspecificspawning abundancedataseriesareinthegranderondempg.theratingforthejosephcreek populationoverallviabilityratingremainedashighlyviableafterupdatingtheanalysisto includereturnsthroughthe2009spawningyear.theincreaseinnaturaloriginabundance fortheotherpopulationwithadataseries,theuppergranderonderiver,wasnot sufficienttochangetheabundance/productivitycriteriaratingfrommoderaterisk. Changesinstatusasaresultofupdatingtheaggregateorisolatedindexabundanceseries usedtoassigngenericratingstotheremainingpopulationswererelativelysmall(see discussionundershorttermabundanceandtrendsabove).thereforetheratingsassigned tothosepopulationsinthepreviousictrtstatusreview(ictrt,2010)wereretainedin Table37. TheICTRTidentifiedobtainingannualestimatesofpopulationlevelspawning abundanceandhatchery/wildproportionsasamongthehighestpriorityopportunitiesfor improvedassessmentsofinteriorbasinesus/dpss(ictrt,2010).directsurveymethods forassessingannualspawningescapementintoidahotributarieshavebeentriedinthe pastandhaveprovedextremelydifficulttocarryoutinawaythatproducesconsistent estimatesacrossareasandyears,largelybecauseofvisibilityandaccessconditionsduring thelatespringsteelheadspawningwindow.twodifferentapproacheswithpotentialfor routinelygeneratingrepresentativeannualestimatesofspawningescapementsinto specificorsubgroupingsofpopulationshaverecentlybeeninitiated.firstyearresults frombotheffortsarepromising.initialresultsfromoneoftheapproaches,usingagenetic baselinewithrepresentationofseveralpopulationsorpopulationsubgroupingsto partitionthenaturaloriginreturnestimatesatlowergraniteamongareas,indicatethat somepopulationsassumedtobeeitheraorbrunmaysupportamixtureofthetworun types(p.hassemer,idfgpers.comm.).resultsfromthisongoingeffortandthe companionstudybasedonadultpittagdetectionsshouldallowforimprovedpopulation specificassessmentsforthenextfiveyearstatusreview. Harvest Summer runsteelheadfromtheupperbasinaredividedinto2runsbymanagers: TheA run,andtheb run.theserunsarebelievedhavedifferencesintiming,but managersseparatethemonthebasisofsizealoneinestimatingthesizeoftheruns.thearunisbelievedtooccurthroughoutthemiddlecolumbia,uppercolumbia,andsnakeriver Basins,whiletheB runisbelievedtooccurnaturallyonlyinthesnakeriveresu,inthe ClearwaterRiver,MiddleForkSalmonRiver,andSouthForkSalmonRiver. Steelheadwerehistoricallytakenintribalandnon tribalgillnetfisheries,andin recreationalfisheriesinthemainstemcolumbiariverandintributaries.inthe1970s, retentionofsteelheadinnon tribalcommercialfisherieswasprohibited,andinthemid 1980s,tributaryrecreationalfisheriesinWashingtonadoptedmark selectiveregulations. Steelheadarestillharvestedintribalfisheries,inmainstemrecreationalfisheries,and 126
.")
127 thereisincidentalmortalityassociatedwithmark selectiverecreationrecreational fisheries.themajorityofimpactsonthesummerrunoccurintribalgillnetanddipnet fisheriestargetingchinooksalmon.becauseoftheirlargersize,theb rumfisharemore vulnerabletothegillnetgear.consequently,thiscomponentofthesummerrun experienceshigherfishingmortalitythanthea runcomponent(figure49).inrecent years,totalexploitationratesonthea runhavebeenstableataround5%,while exploitationratesontheb runhavegenerallybeenintherangeof15%to20%. Figure49 TotalharvestimpactsonnaturalsummersteelheadaboveBonnevilleDam.Datafor from NMFSbiologicalopinion(PeterDygert,NMFS,personalcommunication),andfor fromTACrun reconstruction(cindylefleur,wdfwpersonalcommunication). 127
128 Hatcheryreleases SteelheadhatcheryreleaseswithintheESUhavegenerallytrendeddownwardssince1990. Themostrecentfiveyearaveragereleaseisapproximately20%belowthe average(figure50). Figure50 HatcheryreleaseswithintheSnakeRiversteelheadDPS.Dottedlineindicatesthemeanandthe sharedareaindicatesthestandarddeviation.datasource:rmis. 128
129 Table37.CurrentstatusratingsusingICTRTviabilitycriteriaforSnakeRiverSteelheadpopulationsgroupedby MPG. Population Tucannon River Abundance/Productivity Metrics ICTRT Minimum Threshold 1,000 Asotin Creek 500 Natural Spawning Abundance Insufficient data Insufficient data ICTRT Productivity Insufficient data Insufficient data Integrated A/P Risk Natural Processes Risk Spatial Structure and Diversity Metrics Diversity Risk Integrated SS/D Risk Overall Viability Rating High?? Low Moderate Moderate HIGH RISK?? Maintained Low Moderate Moderate MAINTAINED? (HIGH RISK??) Lower Grande Ronde River Joseph Creek Upper Grande Ronde River , Wallowa River 1,000 Insufficient data 2186 ( ) 1878 ( ) 1340 ( ) 1240 ( ) Insufficient data Insufficient data 1.94 ( ) 2.91 ( ) 2.13 ( ) 2.70 ( ) Low Moderate Moderate MAINTAINED? Very Low Very Low Low Low Viable (Moderate) HIGHLY VIABLE Very Low Moderate Moderate MAINTAINED High?? Very Low Low Low HIGH RISK?? Lower Main. Clearwater R. South Fork Clearwater R. 1,500 1,000 Lolo Creek 500 Selway R. 1,000 Lochsa R. 1,000 Insufficient data Insufficient data Insufficient data Insufficient data Insufficient data Insufficient data Insufficient data Insufficient data Insufficient data Insufficient data Moderate? Very Low Low Low MAINTAINED? High Low Moderate Moderate HIGH RISK? High Low Moderate Moderate High Very Low Low Low High Very Low Low Low HIGH RISK? HIGH RISK? HIGH RISK? Little Salmon R. 500 South Fork Salmon R. 1,000 Secesh R. 500 Chamberlain Creek 500 Lower Middle Fork Salmon R. Upper Middle Fork Salmon R. 1,000 1,000 Panther Creek 500 North Fork Salmon R. 500 Lemhi R. 1,000 Pahsimeroi R. 1,000 East Fork Salmon R. 1,000 Up Main. Salmon R. 1,000 Insufficient data Insufficient data Insufficient data Insufficient data Insufficient data Insufficient data Insufficient data Insufficient data Insufficient data Insufficient data Insufficient data Insufficient data Insufficient data Insufficient data Insufficient data Insufficient data Insufficient data Insufficient data Insufficient data Insufficient data Insufficient data Insufficient data Insufficient data Insufficient data Moderate Low Moderate Moderate MAINTAINED? High Very Low Low Low High Low Low Low High Low Low Low High Very Low Low Low High Very Low Low Low Moderate High Moderate High Moderate Low Moderate Moderate Moderate Low Moderate Moderate Moderate Moderate Moderate Moderate Moderate Very Low Moderate Moderate Moderate Very Low Moderate Moderate HIGH RISK? HIGH RISK? HIGH RISK? HIGH RISK? HIGH RISK? HIGH RISK? MAINTAINED? MAINTAINED? MAINTAINED? MAINTAINED? MAINTAINED? 129
130 SnakeRiverSteelhead:UpdatedRiskSummary ThelevelofnaturalproductioninthetwopopulationswithfulldataseriesandtheAsotin Creekindexreachesisencouraging,butthestatusofmostpopulationsinthisDPSremains highlyuncertain.population levelnaturaloriginabundanceandproductivityinferred fromaggregatedataandjuvenileindicesindicatethatmanypopulationsarelikelybelow theminimumcombinationsdefinedbytheictrtviabilitycriteria.agreatdealof uncertaintyremainsregardingtherelativeproportionofhatcheryfishinnaturalspawning areasnearmajorhatcheryreleasesites.thereislittleevidenceforsubstantialchangein ESUviabilityrelativetothepreviousBRTandICTRTreviews.Overall,therefore,thenew informationconsidereddoesnotindicateachangeinthebiologicalriskcategorysincethe timeofthelastbrtstatusreview. References Good, T.P., R.S. Waples and P. Adams (editors) Updated status of federally listed ESUs of West Coast salmon and steelhead. U.S. Dept. of Commer, NOAA Tech. Memo. NMFS-NWFSC-66, 598 p. ICTRT, Independent populations of chinook, steelhead and sockeye for listed evolutionarily significant units within the interior Columbia River domain. Interior Columbia Basin Technical Recovery Team Technical Review Draft. July p. ICTRT, Viability criteria for application to interior Columbia Basin salmonid ESUs. Interior Columbia Basin Technical Recovery Team. Technical Review Draft. March p + appendices and attachments. ICTRT(2010)Currentstatusreviews:InteriorColumbiaBasinsalmonESUsandsteelhead DPSs.Vol.1.SnakeRiverESUs/DPS.786p.+attachments 130
131 PugetSoundChinooksalmon 14 TheESUwasidentifiedandassessedaspartoftheChinooksalmoncoastwidestatus reviewin1998(myersetal.1998)andreassessedin2005(goodetal.2005).theesuwas listedasathreatenedspeciesonmarch24,1999;threatenedstatusreaffirmedonjune28, 2005.TheESUincludesallnaturallyspawnedpopulationsofChinooksalmonfromrivers andstreamsflowingintopugetsoundincludingthestraitofjuandefucafromtheelwha River,eastward,includingriversandstreamsflowingintoHoodCanal,SouthSound,North SoundandtheStraitofGeorgiainWashington,aswellastwenty sixartificialpropagation programs:thekendalcreekhatchery,marblemounthatchery(fall,springyearlings,spring subyearlings,andsummerrun),harveycreekhatchery,whitehorsespringspond,wallace RiverHatchery(yearlingsandsubyearlings),TulalipBay,IssaquahHatchery,SoosCreek Hatchery,IcyCreekHatchery,KetaCreekHatchery,WhiteRiverHatchery,White AcclimationPond,HuppSpringsHatchery,VoightsCreekHatchery,DiruCreek,ClearCreek, KalamaCreek,GeorgeAdamsHatchery,Rick spondhatchery,hammahammahatchery, Dungeness/HurdCreekHatchery,ElwhaChannelHatcheryChinookhatcheryprograms. PreviousStatusReviewsandRecoveryDocuments Inthe2005review(Goodetal.2005),itwasdeterminedthatoverall,thenatural spawningescapementforpugetsoundchinooksalmonpopulationswereimproved relativetothoseatthetimeofthepreviousstatusreviewofpugetsoundchinooksalmon conductedwithdatathrough1997(myersetal.1998).also,theoveralltrendsinnatural spawningescapementsforpugetsoundchinooksalmonpopulationsestimatedin2005 remainedsimilartothatpresentedinthepreviousstatusreview(datathrough1997),with somepopulationsdoingmarginallybetterandothersworse. ArecoveryplanwassubmittedbySharedStrategyandadoptedbyNMFSinJanuary 2007.ThePugetSoundTechnicalRecoveryTeam(TRT)finalizedtheirpopulation identificationforthisesuin2006(ruckelshausetal.2006)anddevelopedtheirviability planningrangesin2002(pstrt2002). ESUStatusataGlance Listing status: Threatened Historical peak run size 690,000 (1908) Historical populations 31 Peak run size since ,000 (1990) Maximum spawners since ,000 (2004) Extant populations 22 Geographic recovery regions 5 Viablespawnerabundanceatequilibrium Forpopulations SeeTable38 ForESU 307,500 Numberofpopulationsperregionwithlow extinctionriskforesutobeviable Sectionauthor:NormaSands 131
132 ESU Structure The Puget Sound Chinook salmon ESU is composed of 31 historically quasi-independent populations, 22 of which are extant (Ruckelshaus et al. 2006). The populations are distributed in 5 geographic regions identified by the TRT (PSTRT 2002) based on similarities in hydrographic, biogeographic, and geologic characteristics of the Puget Sound basin. Maintaining populations in each region is important to the ESU viability. The TRT presented viable spawning abundances for 16 of the 22 populations in their viability report. For this status review, values for the missing populations are extrapolated based on a recovered productivity equal to that of the average for the 16 populations (recruits per spawner (R/S) = 3.2), and maximum sustainable yield (MSY) spawner estimates based on the linear relationship between maximum observed spawners and MSY spawners for the 16 populations, and a linear relationship between MSY spawners and replacement spawners. These are tentative estimates until population specific estimates are available. In Table38, the spawning abundances at replacement (growth rate = 1) are the minimum target viability abundance. It is important to note that these are viability abundances assuming low (replacement only) productivity higher productivity would result in lower viable spawning abundances. For example, spawners at MSY represent the spawning level at MSY under properly functioning habitat conditions. As populations begin to recover, additional viability analysis should be undertaken to determine the variability and viability of each population. Table38 Extant populations of Chinook salmon in the Puget Sound Chinook ESU, grouped by geographic region, and their minimum viability spawning abundance and abundance at equilibrium or replacement, and spawning abundance and productivity (R/S) at maximum sustainable yield (MSY) for a recovered state as determined by EDT analyses of properly functioning conditions and expressed as a Beverton-Holt function (values in regular font are from PSTRT 2002 and those in italics are derived as explained in text). The TRT minimum viability abundance was the equilibrium abundance or 17,000, which ever was less. TRT viability Under Properly Functioning Conditions (PFC) Region & Population min viability abundance equilibrium abundance spawners at MSY prod at MSY Strait of Georgia NF Nooksack 16,000 16,400 3, SF Nooksack 9,100 9,100 2, Whidbey Basin Lower Skagit 16,000 15,800 3, Upper Skagit 17,000 26,000 5, Cascade 1,200 1, Lower Sauk 5,600 5,600 1, Upper Sauk 3,000 3, Suiattle NF Stillaguamish 17,000 18,000 4, SF Stillaguamish 15,000 15,000 3, Skykomish 17,000 39,000 8, Snoqualmie 17,000 25,000 5, Central/South Puget Sound 132
133 Sammamish (1) 10,500 10,500 2, Cedar 11,500 11,500 2, Green 17,000 22,000 4, White 14,200 14,200 3, Puyallup 17,000 18,000 5, Nisqually 13,000 13,000 3, Hood Canal Skokomish 12,800 12,800 2, Mid Hood Canal (2) 11,000 11,000 2, Strait of Juan de Fuca Dungeness 4,700 4,700 1, Elwha 15,100 15,100 3, ESU 261, ,500 70, The Sammamish population was referred to as North Lake Washington population in the TRT viability report. 2. The Mid Hood Canal population consists of spawning aggregations from Dosewallips, Duckabush, and Hamma Hamma. Only the Dosewallips was listed in the TRT viability report. NewDataandUpdatedAnalyses Thisstatusreportreflectsupdatesinpopulationdatathrough2009thatwere receivedasdatafilesfromthecomanagersasresultoftherequestfordatainthefederal register.availabilityofupdatesforageandhatcherycontributiondatavariedfrom populationtopopulationandestimateswereobtainedfromtheannualpost seasonharvest reportsprovidedbycomanagers.agedataarenotavailableforallyearswithescapement data.missingagedistributiondataareestimatedbyweightingtheaveragecohortage distributionbytheescapementabundanceforyearscontributingtothecohortreturn (Sands2007).Itisimportanttonotethatdatacollectionmethodologieshavechanged somewhatoverthecourseofthetimeseriesanalyzed,whichcreatessomeuncertaintyand potentialbiasinthecalculationsoftrends. Thisstatusanalysisstartswithdatafrom1985whenwehaveescapementdata fromallpopulationsintheesu.inadditiontoincludingadditionalrecentyearsof spawningdatacomparedtothe2005statusreview,thereportalsoincorporates updates/correctionsmadeinpastescapement,age,andhatcherycontributiondatafor severalofthepopulations. Harvestrateestimates,agespecificformixedmaturitycatchandmature(terminal) catcharefromthepacificsalmoncommissionchinooktechnicalcommittee sexploitation rateanalysisofcoded wiretaggedhatcheryindicatorstocks.estimateswereavailable throughthe2006broodyearage2catch(catchin2008).tocompleteestimatesforbrood years2004to2006,theaverageage specificrateforthepreviousthreeyearsofavailable datawasused.thusforbroodyear2006,therateismostlyfromthepreviousyears.catch isestimatedasaproductofharvestrateandescapement,sointhemostrecent5yearsas harvestrateshavenotvariedgreatlyfromyeartoyear;variationsincatchareinfluenced morebyvariationsinescapementestimates. ProductivityestimationisfromcohortrunreconstructionusingthePSTRT Abundance&ProductivityExcelFiles(Sands2009). 133
134 Abundance of Natural Spawners and Natural-Origin Pre-Harvest Recruits During the period , for which we have escapement data for all populations in the ESU, ESU natural spawning abundance was at a mid range from , declined during the period from , increased from , and then decreased again from , with 2009 being back down at the 1990 s low levels (Figure51). The highest abundances were in 2002, 2004, and 2006, with 2004 having the highest abundance with 45,000 NOR spawners and 60,000 total (NOR + hatchery) natural spawners. Hatchery fish contributed from 15% to 40% of the natural spawners for the ESU as a whole during these years. Figure51 Totalnaturalspawners(naturalandandhatcheryorigincombined)forthePugetSoundChinookESU (solidline)andthenatural originspawners(dashedline). Averageescapements(geometricmean)forfive yearintervalsaregivenintable39 alongwithestimatesoftrends 15 overtheintervalsfornaturalescapement(hatcheryplus natural origin)andfornatural originonlyescapement.annualescapementdata,bothtotal naturalspawnersandnaturaloriginspawnersaregivenintable44. The most recent 5-year ( ) geometric mean of natural spawners in populations of Puget Sound Chinook salmon ranges from 81 (in the Mid-Hood Canal population) to almost 10,345 fish (in the upper Skagit population) (Table39, Figure52 to Figure57). Most populations contain natural spawners numbering in the high hundreds (median recent natural escapement = 909).NotrendisnotableforthetotalESUescapements;whiletrendsvary fromdecreasingtoincreasingamongpopulations. 15 Trendiscalculatedoverthenaturallogofescapement,takingtheexponentialto transformtheresultbacktonormalnumbers. 134
135 Table39 Abundance Five-year geometric means for adult (age 3+) natural (natural and hatchery origin) and natural origin only spawners for the ESU with ranges and medians given for the populations. The trend is calculated over 5 periods of 5 year averages. Natural Escapement Natural Origin Escapement Year Range ESU pop range pop median ESU pop range pop median , , , , , , , , , , , , , , , , , , , , Trend
136 Figure52 SpawningabundancefortheCentral/SouthMajorPopulationGroupinthePugetSoundChinook salmonesu.thedarklineindicatesnaturaloriginspawnernumbers,light(red)lineindicatestotalnatural spawners(includingnaturallyspawninghatcheryfish).thedottedlineisthelong term(wholetimeseries) meanofthetotalspawners,andthegreenshadedareaindicates+/ 1standarddeviationaroundthemean. 136
137 Figure53 SpawningabundancefortheNorthWestorStraitofJuandeFucaMajorPopulationGroupinthe PugetSoundChinooksalmonESU.Thedarklineindicatesnaturaloriginspawnernumbers,light(red)line indicatestotalnaturalspawners(includingnaturallyspawninghatcheryfish).thedottedlineisthelong term (wholetimeseries)meanofthetotalspawners,andthegreenshadedareaindicates+/ 1standarddeviation aroundthemean. Figure54 SpawningabundancefortheCentralWestorHoodCanalMajorPopulationGroupinthePugetSound ChinooksalmonESU.Thedarklineindicatesnaturaloriginspawnernumbers,light(red)lineindicatestotal naturalspawners(includingnaturallyspawninghatcheryfish).thedottedlineisthelong term(wholetime 137
138 series)meanofthetotalspawners,andthegreenshadedareaindicates+/ 1standarddeviationaroundthe mean. Figure55 SpawningabundancefortheNorthEastorStraitofGeorgiaMajorPopulationGroupinthePuget SoundChinooksalmonESU.Thedarklineindicatesnaturaloriginspawnernumbers,light(red)lineindicates totalnaturalspawners(includingnaturallyspawninghatcheryfish).thedottedlineisthelong term(whole timeseries)meanofthetotalspawners,andthegreenshadedareaindicates+/ 1standarddeviationaroundthe mean. 138
139 Figure56 SpawningabundancefortheCentralEastorWhidbyBasinMajorPopulationGroupinthePuget SoundChinooksalmonESU.Thedarklineindicatesnaturaloriginspawnernumbers,light(red)lineindicates totalnaturalspawners(includingnaturallyspawninghatcheryfish).thedottedlineisthelong term(whole 139
140 timeseries)meanofthetotalspawners,andthegreenshadedareaindicates+/ 1standarddeviationaroundthe mean. Figure57 SpawningabundancefortheCentralEastorWhidbyBasin(continued)MajorPopulationGroupin thepugetsoundchinooksalmonesu.thedarklineindicatesnaturaloriginspawnernumbers,light(red)line indicatestotalnaturalspawners(includingnaturallyspawninghatcheryfish).thedottedlineisthelong term (wholetimeseries)meanofthetotalspawners,andthegreenshadedareaindicates+/ 1standarddeviation aroundthemean. During this period ( ), returns (pre-harvest run size) from the natural spawners was highest in 1985 and showed a decline through 1994, remained low through 1999, increased in 2000 and again in 2001 and has shown a decline through 2009, with 2009 having the lowest returns since Pre-harvest returns reflect productivity of the populations due to environmental conditions, while spawning abundance returns reflects both environmental variation and the pressures from harvest and broodstock take. Short and long term trends and growth rates (lambda) are provided in Table40. Estimates of lambda are provided for two alternative assumptions: that hatchery fish have zero success on the spawning grounds and that their spawning success is equivalent to natural origin fish. For the 140
141 Puget Sound Chinook populations, it makes a big difference as to the estimate of NOR growth and productivity whether the hatchery fish are supporting natural spawning production. It would be good to be able to get estimates of hatchery fish success on the spawning grounds for most all of the populations, except for populations where hatchery fish are only a small component of the natural spawners, such as the Skagit populations. Table40 ShortandlongtermpopulationtrendandgrowthrateestimatesforthePugetSoundChinookESU populations. HatcheryFish Success=0 HatcheryFish Success=1 TrendNatSp RegionsandPopulations Years w/ci Lambdaw/CI p>1 Lambdaw/CI p>1 StraitofGeorgiaRegion Lower NorthFork MiddleForkNooksack earlyrun ( ) ( ) ( ) ( ) ( ) ( ) 0.01 SouthForkNooksack Riverearlyrun ( ) ( ) ( ) ( ) ( ) ( ) 0.07 WidbyBasinRegion LowerSkagitRiverlate run ( ) ( ) ( ) ( ) ( ) ( ) 0.42 UpperSkagitRiverlate run ( ) ( ) ( ) ( ) ( ) ( ) 0.44 LowerSaukRiverlate run ( ) ( ) ( ) ( ) ( ) ( ) 0.49 UpperSaukRiverearly run ( ) ()? ()? ( ) ( ) ( ) 0.35 CascadeRiverearlyrun ( ) 1.02 ( ) ( ) ( ) ( ) ( ) 0.79 SuiattleRiverearlyrun ( ) ( ) ( ) ( ) ( ) ( )
142 NorthForkStillaguamish Riverlaterun ( ) ( ) ( ) ( ) ( ) ( ) 0.02 SouthForkStillaguamish Riverlaterun ( ) ( ) ( ) ( ) ( ) ( ) 0.34 SkykomishRiverlaterun ( ) ( ) ( ) ( ) ( ) ( ) 0.00 SnoqualmieRiver ( ) ( ) ( ) ( ) ( ) ( ) 0.40 Central/SouthPuget SoundRegion SammamishRiverlate run ( ) 1.01 ( ) ( ) ( ) ( ) ( ) 0.05 CedarRiverlaterun ( ) ( ) ( ) ( ) ( ) ( ) 0.09 GreenRiverlaterun ( ) ( ) ( ) ( ) ( ) ( ) 0.00 WhiteRiverearlyrun ( ) ( ) ( ) ( ) 1.02 ( ) ( ) 0.44 PuyallupRiverlaterun ( ) ( ) ( ) ( ) ( ) ( ) 0.03 NisquallyRiverlaterun ( ) 1.01 ( ) ( ) ( ) ( ) ( ) 0.15 HoodCanalRegion Mid HoodCanallaterun ( ) ( ) ( ) ( ) ( ) ( ) 0.06 SkokomishRiverlaterun
143 ( ) ( ) ( ) ( ) ( ) ( ) 0.00 StraitofJuandeFuca Region DungenessRiver summerrun ( ) ( ) ( ) ( ) ( ) ( ) 0.03 ElwhaRiverearlylate run ( ) ( ) ( ) ( ) ( ) ( ) 0.01 Figure58 TotalnaturaloriginreturnsofchinooktoPugetSoundinreturnyearsrepresentingtotalreturn(pre anyharvestandbroodstocktake),terminalreturn(preterminalharvestandbroodstocktake),andnatural originspawnerstothespawninggrounds. Productivity ProductivityisestimatedbasedoncohortrunreconstructionusingthePugetSoundTRT Abundance&ProductivityExcelFiles(Sands2009). Median recruits per spawner and 143
144 spawners per spawner for each population over the five 5-yr intervals are summarized in Table 41 provided in detail in Table45. Recruits are estimated for broodyears through 2006 (Figure 58). Since coded-wire-tag data are only available through 2009, estimates of 2005 age 5 returns and 2006 age 4 and 5 returns are made using forecast methods. The estimates for these two years are not as precise as for earlier years and will be updated as data become available. While NOR escapements have remained fairly constant during this time period ( ), returns and productivity has continued to decline (Figure58, Table41). Median recruits per spawner for the last five-year period (from BY ) is the lowest over any of the five year intervals. Table41 Productivity rangeandmedianforthepopulationsforthe5 yearranges. Recruits per Spawner Spawners per Spawner BY pop range pop median pop range pop median Trend Spatial Structure and Diversity Indices of spatial distribution and diversity have not been developed at the population level. At the ESU level, a diversity index may be used to determine changes in distributions of abundance among the 22 populations and among the 5 geographic regions. The Shannon H diversity index was used to measure diversity of spatial distribution and the results are summarized over 5-year intervals in Table42. For both distribution among populations and among regions, the diversity is declining, due primarily to the increased abundance of returns to the Whidbey Region, Table42 Diversity/SpatialStructureofESU ShannonDiversityIndex 5-year ranges Diversity Indices Populations Regions Trend Population Viability 144
145 The Puget Sound TRT provided a minimum viability spawning target for each population in their viability report (Table 1, Ruckelshaus et al 2002 and Table38 of this report). The TRT report and a Shared Strategy document (Table 1: Chinook Planning Targets and Ranges 5/8/02 on shared Strategy web site) gave parameters for Beverton-Holt spawner recruits developed by the state and tribal comanagers (WDFW&Tribes) using EDT and NMFS properly functioning conditions (Table38). The estimated spawner recruit functions were based on survival patterns experienced in the early 1990 s. Those survival patterns appear to be relevant to current conditions because marine survival (as measured by returns of hatchery releases) has been relatively low since the mid s. Recovery spawner recruit curves have been constructed for each population with observed recruit per spawner points superimposed on the graph (Figure62 -- Figure67). Harvest expressed as Adult Equivalent Exploitation Rate (AEQ ER) PugetSoundChinookareharvestedinPacificOceanfisheries,inPugetSoundfisheries,and interminalfisherieswithinrivers.theymigratetothenorthasjuveniles,sonearlyall oceanfisheryimpactsoccurinoffthecoastsofcanadaandalaskawheretheyaresubject tothepacificsalmontreaty.fisherieswithinpugetsoundaremanagedbythestateand tribalco managersunderaresourcemanagementplan.fisheryimpactratesvarywidely amongregionswithinpugetsoundprimarilybecauseofdifferentterminalarea management.hoodcanalandsouthsoundstockssupportrelativelyintenseterminalarea fisheriesdirectedathatcheryfishproducedlargelytosupporttribalandrecreational fisheries. Cohort exploitation rates, expressed as Adult Equivalent Exploitation Rate (AEQ ER), are estimated separately for each population based on harvest of hatchery indicator stocks and using population specific age estimates applied to the age structure of the population. ESU-level AEQ ER summary data are provided in Table43 and population specific data are found in Table46. Estimated trends in exploitation rates from broodyears 1982 to 2006 exhibited a decreasing trend when measured over the five 5-year intervals. However, further examination of the data shows that exploitation was least over the broodyears and has been increasing over the past 10 years for both ocean and terminal fisheries. Estimates are based on cohort analysis using harvest rate estimates of hatchery indicator stocks from the CTC and applied, using the appropriate indicator stock(s) to each natural population. However, exploitation rates may also be expressed as calendar year rates (proportion of escapement plus catch in a calendar year that is catch). These estimates were made over all populations within each geographical region and are summarized in Figure59 and Figure60 for total and terminal only exploitation rates, respectively. Terminal fisheries are defined as those fishing on the mature portion of the population returning to spawn that year (includes net fisheries in Puget Sound). 145
146 PopulationsfromallregionswithinPugetSoundshowasimilarpatternofdeclining exploitationratesinthe1990sandincreasingexploitationratessincethen.thisis primarilyaresultofcanadianinterceptionsofpugetsoundchinookoffthewestcoastof VancouverIsland(WCVI).Duringthe1990sCanadasharplyreducedfisheriesoffWCVIin responsetodepressedstocks.sincethen,wcvistockstatushasimprovedsomewhatand CanadianmanagershavechangedthetemporalpatternoffishingtoavoidWCVIstocks. ThishasresultedinincreasedimpactsonPugetSoundstocks. Terminal fisheries represented a substantial proportion of the total exploitation rate in the late 1980 s and early 1990 s. The proportion was lowest during the period and has been increasing in all areas again since then. The exception is the North Region (Nooksack) where the proportion of terminal fisheries has always been low; however, the most recent five years has the highest proportion (0.10). Hatchery releases Hatchery releases of all salmon species except sockeye and steelhead have been trending down in Puget Sound since 1990 (Figure61). Puget Sound has a mixture of production (for harvest) and conservation (to supplement natural spawning of the natural populations) hatchery releases. 146
147 Table43 Brood year adult-equivalent exploitation rate ranges and medians for the five 5-year intervals for ocean (mixed-maturity) and terminal (mature) fisheries and total exploitation rate estimated for each of the 22 populations. Trends over the 5-year intervals are also provided. Mix Mat Fishery Mature Fishery Total AEQ ER BY pop range pop median pop range pop median pop range pop median Trend

148 Figure59 TrendsinPugetSoundsalmontotalexploitationrates(proportionoftotalreturntakenbyall fisheriesinreturnyear)bycalendaryearforeachmajorpopulationgroup. 148
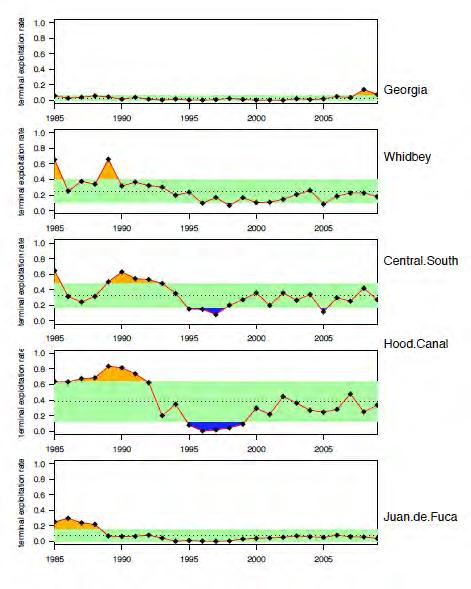
149 Figure60 TrendsinPugetSoundChinooksalmonterminalharvestrates(proportionofterminalruntakenby fisheries)bycalendaryearforeachmajorpopulationgroup. 149
150 Figure61 PugetSoundhatcheryreleases.Datasource:RMIS. 150
151 PugetSoundChinooksalmon:UpdatedRiskSummary AllPugetSoundChinookpopulationsarewellbelowtheTRTplanningrangefor recoveryescapementlevels.mostpopulationsarealsoconsistentlybelowthespawnerrecruitlevelsidentifiedbythetrtasconsistentwithrecovery.acrosstheesu,most populationshavedeclinedinabundancesomewhatsincethelaststatusreviewin2005, andtrendssince1995aremostlyflat.severaloftheriskfactorsidentifiedbygoodetal. (2005)arealsostillpresent,includinghighfractionsofhatcheryfishinmanypopulations andwidespreadlossanddegradationofhabitat.manyofthehabitatandhatcheryactions identifiedinthepugetsoundchinookrecoveryplanareexpectedtotakeyearsordecades tobeimplementedandtoproducesignificantimprovementsinnaturalpopulation attributes,andthesetrendsareconsistentwiththeseexpectations.overall,thenew informationonabundance,productivity,spatialstructureanddiversitysincethe2005 reviewdoesnotindicateachangeinthebiologicalriskcategorysincethetimeofthelast BRTstatusreview. References GoodTP,WaplesRS,AdamsP(2005)UpdatedstatusoffederallylistedESUsofWestCoast salmonandsteelhead.u.s.dept.commer.,noaatech.memo.nmfs NWFSC 66.,p Myers,J.M.,R.G.Kope,G.J.Bryant,D.J.Teel,L.J.Lierheimer,T.C.Wainwright,W.S.Grant, F.W.Waknitz,K.Neely,S.Lindley,R.S.Waples.1998.StatusreviewofChinooksalmon fromwashington,idaho,oregon,andcalifornia.u.s.dept.ofcommerce,noaatech. Memo.,NMFS NWFSC 35,443p. PugetSoundTechnicalRecoveryTeam(PSTRT).April30,2002.Planningrangesand preliminaryguidelinesforthedelistingandrecoveryofthepugetsoundchinook SalmonEvolutionarilySignificantUnit. Ruckelshaus,M.H.,K.P.Currens,W.H.Graeber,R.R.Fuerstenberg,K.Rawson,N.J.Sands,and J.B.Scott.2006.IndependentpopulationsofChinooksalmoninPugetSound.NOAA TechnicalMemorandumNMFS NWFSC pp. Sands, N. J A user s guide to the abundance and productivity (A & P) tablesas developedforpugetsoundsalmon. From the Puget Sound Technical Recovery Team (PS TRT) Abundance and Productivity (A & P) Workgroup. Fourthdraft, 20April, (Available from N. J. Sands, Northwest FisheriesScience Center, 2725 Montlake Blvd. E., Seattle, WA ) Sands,N.J.2007.Estimating missing age data for Pacific salmon cohort run reconstruction using the age engine. Draft,28September,2007.(AvailablefromN.J.Sands,Northwest FisheriesScienceCenter,2725MontlakeBlvd.E.,Seattle,WA98112.) SharedStrategy2007.PugetSoundRecoveryPlan.AdoptedbyNMFSJanuary19, Recovery Planning/Recovery Domains/Puget Sound/PS Recovery Plan.cfm 151
152 152
153 Table44 PugetSoundChinookaveragenatural(naturaloriginandhatchery)andnatural originonlyspawnersandpercenthatcherycontributionsforfiveyearintervals.spawningabundanceaveragesaregeometricmeansandhatcherycontributionaveragesarearithmetic. 8/27/2010 Return Years Populations Nat % NOR Nat % NOR Nat % NOR Nat % NOR Nat % NOR North + Middle Fork % % % 96 3,464 93% 229 1,666 82% 276 Nooksack South Fork Nooksack % % % % % 244 Lower Skagit 2,334 4% ,440 4% 1,385 1,006 4% 968 2,715 3% 2,626 2,163 4% 2,067 Upper Skagit 8,276 4% ,511 4% 5,304 6,087 2% 5,982 12,109 4% 11,678 10,345 6% 9,724 Upper Cascade 186 2% % % % % 329 Lower Sauk 739 4% % % % % 742 Upper Sauk 913 4% % % % % 486 Suiattle 693 3% % % % % 250 North Fork Stillaguamish 802 2% % % 564 1,173 30% % 478 South Fork Stillaguamish 256 0% % % % % 98 Skykomish 3,334 14% ,280 27% 1,626 3,228 47% 1,637 4,760 36% 3,030 3,309 28% 2,358 Snoqualmie % % 839 1,141 33% 710 2,446 13% 2,131 1,592 16% 1,333 Sammamish % % % % % 56 Cedar 809 8% % % % % 716 Green/ Duwamish 6,676 58% ,239 56% 2,214 6,792 68% 2,007 6,335 37% 3,921 3,077 56% 1,288 White 46 8% % % 392 1,353 12% 1,184 1,869 30% 1,306 Puyallup 1,206 20% ,468 16% 2,080 2,287 30% 1,575 1,637 30% 1,137 1,960 60% 775 Nisqually % % % 576 1,295 32% 875 1,892 69%
154 Skokomish 2,215 48% % 456 1,046 60% 406 1,479 54% 455 1,109 55% 456 Mid Hood Canal % % % % % 44 Dungeness % % % % % 161 Elwha Nat Spawners 2,248 42% % % % % 185 ESU 33,260 86% 28,680 23,938 75% 17,905 27,392 63% 17,245 43,192 72% 31,294 34,486 69% 23,938 Table45 PugetSoundChinookpopulationaverageproductivityforfive yearintervalsmeasuredasrecruitsperspawner(r/s)andspawnersperspawner (S/S).Trendoverthefiveintervalsisalsogiven. Brood Years Trend Populations R/S S/S R/S S/S R/S S/S R/S S/S R/S S/S R/S S/S North + Middle Fork Nooksack South Fork Nooksack Lower Skagit Upper Skagit Upper Cascade Lower Sauk Upper Sauk Suiattle North Fork Stillaguamish South Fork Stillaguamish Skykomish Snoqualmie Sammamish Cedar
155 Green/Duwamish White Puyallup Nisqually Skokomish Mid Hood Canal Dungeness Elwha Nat Spawners
156 Table46 Puget Sound Chinook Population average AEQ exploitation rates for five-year intervals for both mixed-maturity catch fisheries (mix) and mature catch fisheries (mat). Trends calculated over the five-year intervals are also given. 8/27/2010 Brood Years Trend Populations Mix Mat Mix Mat Mix Mat Mix Mat Mix Mat Mix Mat Total North + Middle Fork Nooksack South Fork Nooksack Lower Skagit Upper Skagit Upper Cascade Lower Sauk Upper Sauk Suiattle North Fork Stillaguamish South Fork Stillaguamish Skykomish Snoqualmie Sammamish Cedar Green/Duwamish White Puyallup Nisqually Skokomish Mid Hood Canal Dungeness Elwha Nat Spawners
157 Figure62 ObservedreturnsrelativetotheestimatedrecoveryspawnerrecruitrelationshipforthetwopopulationsintheStraitofGeorgiaregion.Themost recentfiveyearsareindicatedbytrianglesandtheprevious5yearsbycircles. 157

158 Figure63 ObservedreturnsrelativetotheestimatedrecoveryspawnerrecruitrelationshipforthesixofthetenpopulationsintheWhidbyBasinregion. Thetoprowarethethreelate runpopulationsandthebottomrowarethethreeearly runpopulationsintheskagitriver.themostrecentfiveyearsare indicatedbytrianglesandtheprevious5yearsbycircles.onedatapointoffgraphforuppersauk(1956by1884spproduced32,337r);ninepointsoffthe graphforsuiattle,alloccurringpriorto

159 Figure64 ObservedreturnsrelativetotheestimatedrecoveryspawnerrecruitrelationshipforthefourofthetenpopulationsintheWhidbyBasinregion. Themostrecentfiveyearsareindicatedbytrianglesandtheprevious5yearsbycircles. 159
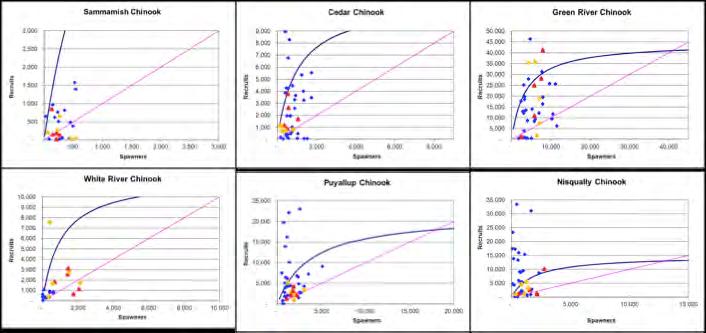
160 Figure65 ObservedreturnsrelativetotheestimatedrecoveryspawnerrecruitrelationshipforthesixpopulationsintheCentral/SouthSoundregion.The mostrecentfiveyearsareindicatedbytrianglesandtheprevious5yearsbycircles. 160
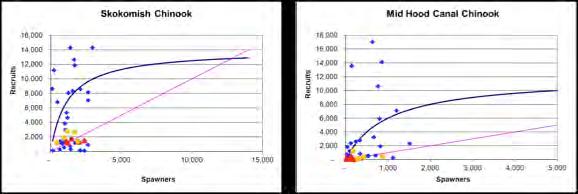
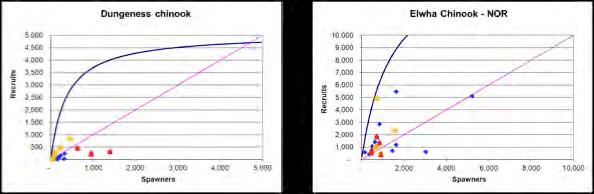
161 Figure66 ObservedreturnsrelativetotheestimatedrecoveryspawnerrecruitrelationshipforthetwopopulationsintheHoodCanalregion.Themost recentfiveyearsareindicatedbytrianglesandtheprevious5yearsbycircles Figure67 ObservedreturnsrelativetotheestimatedrecoveryspawnerrecruitrelationshipforthetwopopulationsintheStraitofJuandeFucaregion.The mostrecentfiveyearsareindicatedbytrianglesandtheprevious5yearsbycircles. 161
162 162
163 HoodCanalsummer runchumsalmon 16 ListedasthreatenedonMarch25,1999;threatenedstatusreaffirmedonJune28,2005. TheESUincludesallnaturallyspawnedpopulationsofsummer runchumsalmoninhood CanalanditstributariesaswellaspopulationsinOlympicPeninsulariversbetweenHood CanalandDungenessBay,Washington,aswellaseightartificialpropagationprograms:the QuilceneNFH,HammaHammaFishHatchery,LilliwaupCreekFishHatchery,Union River/Tahuya,BigBeefCreekFishHatchery,SalmonCreekFishHatchery,ChimacumCreek FishHatchery,andtheJimmycomelatelyCreekFishHatcherysummer runchumhatchery programs. PreviousStatusReviewsandRecoveryDocuments Atthetimeofthelaststatusreviewin2005(Goodetal.2005),thePugetSoundTRThad notyetfinalizedtheirpopulationdesignationsorviabilitycriteriaforthisesu.moststocks atthattimewereshowingpositivegrowthratesandincreasedspawningabundance comparedtothetimeoflisting.therecoveryplan,submittedbythehoodcanal CoordinatingCouncil,wasadoptedbyNMFSMay24 th 2007(HCCC2007).ThePugetSound TRTpopulationidentificationandviabilitydocumentwasfinalizedin2009(Sandsetal. 2009). ESU Status at a Glance Listingstatus:Threatened. Historicalpeakabundance N/A Historicalspawningaggregations 18 Recentpeakrunsizeabundance 259,000(2000) Recentpeakspawningabundance 66,000(2004) Extantpopulations 2(onewith4extantspawningaggregationsandone with10extantspawningaggregations;someof thesearerecentlyreintroduced) ViableabundanceandproductivityDefinedbyspawnerrecruitfunctions seefigure 71andFigure72. ViablepopulationsneededforESU2withhighdiversityamongspawningaggregations withineachpopulation ESU Structure The Puget Sound Technical Recovery Team designated two independent populations for the Hood Canal summer chum, one which includes the spawning aggregations from rivers and creeks draining into the Strait of Juan de Fuca and one which includes spawning aggregations within Hood Canal proper (see Table47). Since each population consists of several spawning 16 Sectionauthor:NormaSands 163
164 aggregations, spatial structure and diversity can be measured using a diversity index to measure population distribution among spawning areas. Table47 Currentpopulationsofsummer runchumsalmoninthehoodcanalchumsalmonesuandtheir associatedhistoricalspawningaggregations.updatedfromsandsetal.(2009).notethatwdfwconsiders salmon/snowonestockandbigandlittlequilceneasonestock(t.johnson,wdfwpers.comm.10/29/10). Notethatreintroductionprogramsstarted3 5yearsbeforenaturalspawningreturnsarenoted. Stock Strait of Juan de Fuca Summer Chum Population Dungeness River Jimmycomelately Creek Salmon Creeks Snow Creek Chimacum Creek Hood Canal Summer Chum Population Big Quilcene Rivers Little Quilcene Rivers Dosewallips River Duckabush River Hamma Hamma River Lilliwaup Creek Big Beef Creek Anderson Creek Dewatto Creek Tahuya River Union River Skokomish River Finch Creek Status Unknown <5 annually recently Extant Extant Extant Extinct but reintroduced with natural spawning reported starting in 1999 Extant Extant Extant Extant Extant Extant Extinct but reintroduced with returns reported starting in 2001 Extinct Extinct, no returns mid 1990 s, some natural recolonization apparent but numbers remain low (<70 annually) Extinct but reintroduced with increased returns reported starting 2006 Extant Extinct, no spawning reported prior to 2001, very low numbers (<40 annually) reported in recent years Extinct NewDataandUpdatedAnalyses Escapementdata,totalnaturalspawnersandhatcherycontribution,agedistribution ofthenaturaloriginescapement,andbroodstocktakearerecordedperspawning aggregation(alsoreferredtoassubpopulation)andcatchisavailableperfisheryarea; mostdataareavailablefrom1971to2009(sandsetal.2009andt.johnson,wdfw, per.comm.).agedatafromscalesamplesareavailablefrom1992to2009;estimatesare madeforearlieryears.eachspawningaggregationorsubpopulationappearstohaveits ownagedistributionsothatagedistributionforeachpopulationisweightedbythe relativeabundanceofthecomponentsubpopulations.hatcherycontributionstothe spawninggroundsareestimatedtohavebegunin1995fromthehatchery supplementationprogramandestimateswereprovidedbywdfw(johnson,percomm) through2009.hatcherycontributionvariesgreatlyfromsubpopulationtosubpopulation. Catchdataareproportionedouttospawningaggregatesbasedonareaofthefishcatchin relationtothespawningtributariesasdeterminedbythecomanagers(wdfw&pnptt 2003).Cohortrunreconstructionisthendoneforeachpopulationtodeterminerecruits 164

165 perspawner,themeasureofproductivityusingthepstrtabundance&productivity ExcelFiles(Sands2009). Relativeabundancesofsubpopulationswithineachpopulationisusedtoestimate theshannondiversityindex,usedasanindicatorofspatialstructureanddiversity,twoof theviablesalmonpopulationfactors. Abundance Spawning abundance is available from 1968 for the Hood Canal population and from 1971 for the Strait of Juan de Fuca population (Figure68). Escapement estimates prior to 1974 are less precise than those afterwards (WDFW & PNPTC 2000) due to sampling procedures. Figure68 SpawningabundanceofHoodCanalsummerchum.Thedarklineindicatesnaturaloriginspawner numbers,light(red)lineindicatestotalnaturalspawners(includingnaturallyspawninghatcheryfish).the dottedlineisthelong term(wholetimeseries)meanofthetotalspawers,andthegreenshadedareaindicates +/ 1standarddeviationaroundthemean. Averageescapements(geometricmeans)forfive yearintervalsaregivenintable 48aswellasestimatesoftrends[exp[trend(ln(esc))]]overtheintervalsforallnatural spawnersandfornatural originonlyspawners.abundancewaslowestforthemidperiod ( )andgreatestforthemostrecent10years.Theoveralltrendispositivefor bothallnaturalspawnersandnatural originonlyspawners. 165
166 Table48 Five geometricmeansofallspawnersandnatural originspawnersonlyforthetwohoodcanalesu summerchumpopulations.trendoverthe5 yearintervalsisalsogiven. Natural Origin AllSpawners Spawners StraitofJuan defuca Population Trend HoodCanal Population Trend Short and long term trends (exp[trend(ln(esc))]) and growth rates (lambda) as estimated by the SPAZ program are given in Table49. The SPAZ programs gives estimates of lambda for both assumptions of hatchery fish having zero success on the spawning grounds and 100% success. The only abundance trend that appears to be positive is that for the Juan de Fuca population for the short time spawn ( ). None of the average growth rate (lambda) estimates indicate positive average growth rates. 166
167 Table49 ShortandlongtermpopulationtrendandgrowthrateestimatesfortheHoodCanalESUsummer chumpopulations. HatcheryFish Success=0 HatcheryFish Success=1 Population Years TrendNatSpw/CI Lambdaw/CI p>1 Lambdaw/CI p>1 Hood Canal ( ) ( ) ( ) ( ) ( ) ( ) 0.34 Juande Fuca ( ) ( ) ( ) ) ( ) ( ) 0.43 Productivity Five year averages of recruits per spawner are given in Table50 and annual estimates are given in Table51 and Table52. Productivity in the last 5-year period has been very low, especially compared to the relatively high productivity in the 5-10 previous years. Table50 5 yeararithmeticmeanofrecruitsperspawnerforthepopulationsandesu BYs Strait Canal ESU Trend
168 Table51 Escapement, catch, and broodstock take data for the Stait of Juan de Fuca Summer Chum population and the estimates of diversity, progeny recruits, and recruits per spawner (R/S). ). Recruits and R/S for brood-year 2006 are estimated by forecasting the returns of age 4 fish. BY Nat Esc % NOR NOR Esc Harvest Broodstock Take(NOR) Diversity Progeny Recruits BYR/S , % 1, , % 1, , % 1, , % 1, , % 1, , % 1, , % 1, , % 3, % , % 5, % , % 2, , % 1, , % 1, % , % 1, , % 1, , % 3, % % % , % 1, % % % % % , % 1, % % ,955 37% 1, ,970 60% 4, ,959 62% 4, ,341 60% 5, ,682 62% 6, ,245 81% 6, ,290 92% 3,
169 2008 3,521 85% 3, ,118 58% 2, Table52 Escapement, catch, and broodstock take data for the Hood Canal summer chum population and the estimates of diversity, progeny recruits, and recruits per spawner (R/S). Recruits and R/S for brood-year 2006 are estimated by forecasting the returns of age 4 fish. NatEsc %NOR NOR Esc Harvest Broodstock Take(NOR) Diversity Progeny Recruits BYR/S , % 17, , % 30, , % 18, , % 12, , % 18, , % 27, , % 10, , % 19, , % 6, , % 3, , % 2, , % 2, % , % 1, , % 1, , % 2, % , % 2, % % % , % 1, % , % 2, ,971 83% 7, ,707 87% 17, ,419 70% 5, ,404 63% 2, ,884 59% 2, ,987 67% 5, ,044 60% 7, ,454 60% 6, ,696 77% 27, ,995 86% 60,
170 ,840 72% 11, ,754 80% 21, ,781 87% 9, ,332 88% 13, ,416 88% 6, Spatial structure and diversity Spatial distribution is measured using the Shannon diversity index (Table53). Table53 Table5.FiveYearArithmeticAveragesofDiversityIndexforthetwopopulationsandtrend measuredoverthe5 yearaverages.notethefirstaverageisforfouryearsonly.trendismeasuredastheslope ofthelineartrendline. Years Strait HoodCanal Trend Higher diversity values indicate a more uniform distribution of the population among spawning sites, which provides greater robustness to the population. Values were generally lower in the 1990s for both populations, indicating that most of the abundance occurred at a few of the spawning sites, The overall linear trend appears to be negative, which is not desirable, however, the last five years has shown the highest average value for both populations. This is partly the result of the addition of one reintroduced spawning aggregation in the Strait of Juan de Fuca population and two reintroduced spawning aggregations in the Hood Canal population. The distribution of spawning aggregations, number and relative abundance, within the populations is shown in Figure69 and Figure
171 '%%#$'%%%&!""#$!""%&!"#$%#%&&' ()**+,-*%./0%.+' 1/.*-#' 1#-2' 34)*/,"*' Figure69 Relative abundance for the spawning aggregations of the Strait of Juan de Fuca summer chum population for the most recent five years of data and the five years prior to listing in 1999.!""#$!"""%!"#"#$%&'( )*'+,*(( -.%#.( /0(1+%234.4( 50(1+%234.4( 5%6(5447(( 8.94:&#.( ;#&4<*22%=&( ;+3"*>+&'(?*$$*(?*$$*( /%22%<*+=( &''#$&''"% Figure70 Relative abundance for the spawning aggregations of the Hood Canal summer chum population for the most recent five years of data and the five years prior to listing in Viability The TRT defined the abundance & productivity viability criteria for the Hood Canal summer chum populations using both 1) the assumption of density independence and replacement growth factor of 1:1 and 2) the assumption of density dependence which provides a series of viable spawner recruit functions (Sands et al. 2009). Brood year data used in these analyses were The minimum viability levels assuming density independence were 12,500 for the Strait of Juan de Fuca population (this has not been attained in the years 1971 to present) and 24,700 for the Hood Canal population (this has been attained four times since 1971, twice since 2003). 171

.")
172 Viable abundance and productivity were also expressed as intrinsic productivity and capacity from Beverton-Holt spawner recruit functions representing a recovered state; different functions were given for different levels of desired harvest exploitation after attaining recovery. These two figures from the 2009 report (Sands et al. 2009) are reproduced below (Figure71 and Figure 72) with currentestimatesofcapacityabundance,intrinsicproductivity,andaverage exploitationrateforthreeoverlappingtimeperiods.thesethreepointsallfallwithinthe non viablesectionofthegraphforbothpopulations.thetimeperiodswerechosento examinedifferenceinestimatesusingsortertimespanofdataaswellasthefullrange ( ). Viability for spatial distribution and diversity was expressed as a need to maintain a diverse aggregation of subpopulations within each population (Sands et al. 2009). If current relatively high diversity index values were to be maintained over time, this would go a long ways to satisfying that criteria. Figure71 Viability curves for the Hood Canal summer chum population for no harvest and three levels of harvest (lines) using the 5%probabilityofextinctionover100years.Capacityabundanceand intrinsicproductivity(betaandalphaparametersofthebeverton Holtspawnerrecruitfunction)are plotted.tobeviable,functionparametersfromcurrentdatashouldlieabovethelineforthe associatedexploitationrate.pointestimatesfromthreetimeperiods(broodyears , ,and )areplottedandallfallbelowthecurveforzeroharvest,indicatingthe populationisnotcurrentlyviable.alsoplottedarecorrespondingpointsforeachpointineachcurve ofaveragevaluesofspawningescapement(from1000simulatedruns).(adaptedfromsandsetal. 2009). 172
are plotted.")
areplottedandallfallbelowthecurveforzeroharvest,indicatingthe populationisnotcurrentlyviable.")
173 Figure72 Viability curves for the Strait of Juan de Fuca summer chum population for no harvest and three levels of harvest (lines) using the 5%probabilityofextinctionover100years.Capacityabundanceand intrinsicproductivity(betaandalphaparametersofthebeverton Holtspawnerrecruitfunction)are plotted.tobeviable,functionparametersfromcurrentdatashouldlieabovethelineforthe associatedexploitationrate.pointestimatesfromthreetimeperiods(broodyears , ,and )areplottedandallfallbelowthecurveforzeroharvest,indicatingthe populationisnotcurrentlyviable.alsoplottedarecorrespondingpointsforeachpointineachcurve ofaveragevaluesofspawningescapement(from1000simulatedruns).(adaptedfromsandsetal. 2009). Harvest TherearenodirectedfisheriesonHoodCanalsummerchum.However,theyaretakenin fisheriesdirectedatotherspeciesinthestraitofjuandefucaandinhoodcanal.because thepopulationsfromtheeasternstraitofjuandefuca(elwhariverthroughdiscovery Bay)arenotsubjecttofisheriesinHoodCanaldirectedatChinookandcohosalmon,they experienceloweroverallharvestratesingeneral.historically,thepopulationsinthe EasternStraitofJuandeFucaexperiencedharvestratesontheorderof20%withratesas highas50%inindividualyears.populationsinhoodcanalproperweresubjecttoharvest ratesthatweretypicallyontheorderof50%to70%withratesinindividualyears approaching90%. 173
.")
174 Inresponsetoseverelydepressedrunsofsummer runchumsalmon,intheearly1990s, thestateofwashingtonandthewesternwashingtontreatytribestookmeasurestocurb theincidentalharvestofsummerchumandharvestratesfelldramatically(figure73).the co managershavecontinuedtoconstrainharvestimpactsasrunshavereturnedtohistoric levels,leadingtoescapementsthatexceedhistoriclevels Figure73 TotalexploitationrateonthecombinedHoodCanal/StraitofJuandeFucasummerchumsalmon ESU.DatafromWDFWrunreconstruction( datafromhttp://wdfw.wa.gov/fish/chum/chum 5e.htm; 2008and2009datafromValerieTribble,WDFW,personalcommunication). Hatcheryreleases Hatcheryreleasesofchum,Chinook,andcohowithintheHoodCanalsummerchumESU spawningandrearingareashavegenerallydeclinedsince2005,whilesteelheadreleases haveremainedfairlyflatandrelativelylow;allhatcheryreleaseshavegenerallydeclined sincethemid 1990s(Figure74).Chumhatcheryreleasesareprimarilyfallrunstocks(not partofthesummerchumesu). 174
175 Figure74 SummaryoftotalhatcheryreleasesperspecieswithinthespawningandrearingareasofHoodCanal summerchumsalmon(notethatmostchumreleasesinarefallrunchum).dottedlineindicatesthelong term meanandshadedareasthelong termstandarddeviation.datasource:rmis. 175
176 Hood Canal summer chum salmon: Updated Risk Summary ThespawningabundanceofthisESUhasclearlyincreasedsincethetimeoflisting, althoughtherecentabundanceisdownfromtheprevious5 years.whilespawning abundanceshaveremainedrelativelyhighcomparedtothelowlevelsintheearly1990 s, productivityhasdecreasedsignificantlyforthelast5broodyears,beinglowerforbrood years thananyprevious5 yearaveragesince1971.thisisaconcernforfuture production.sinceabundanceisincreasingandproductivityisdecreasing,thissuggests thatimprovementsinhabitatandecosystemfunctionisneeded.diversityisincreasing fromthelowvaluesseeninthe1990sduebothtothereintroductionofspawning aggregatesandthethemoreuniformrelativeabundancebetweenpopulations;thisisa goodsignforviabilityintermsofspatialstructureanddiversity.spawningsurveydata showsthatthespawningdistributionwithinmoststreamshasbeenextendedfurther upstreamasabundancehasincreased(wdfwandpnptt2007.overall,thenew informationconsidereddoesnotindicateachangeinthebiologicalriskcategorysincethe timeofthelastbrtstatusreview. References GoodTP,WaplesRS,AdamsP(2005)UpdatedstatusoffederallylistedESUsofWestCoast salmonandsteelhead.u.s.dept.commer.,noaatech.memo.nmfs NWFSC 66.,p HoodCanalCoordinatingCouncil.2007.HoodCanal&EasternStraitofJuandeFuca SummerChumSalmonRecoveryPlan.AdoptedbyNMFSMay24, Recovery Planning/Recovery Domains/Puget Sound/HC Recovery Plan.cfm Johnson, O. W., W. S. Grant, R. G. Kope, K. Neely, F. W. Waknitz, and R. S. Waples Status review of chum salmon from Washington, Oregon, and California. U.S. Dept. Commer., NOAA Tech. Memo. NMFS-NWFSC-32. Sands,N.J.2009.Auser sguidetotheabundanceandproductivity(a&p)tablesas developedforpugetsoundsalmon.fromthepugetsoundtechnicalrecoveryteam (PSTRT)AbundanceandProductivity(A&P)Workgroup.Fourthdraft,20April, 2009.(AvailablefromN.J.Sands,NorthwestFisheriesScienceCenter,2725 MontlakeBlvd.E.,Seattle,WA98112.) Sands,N.J.K.Rawson,K.P.Currens,W.H.Graeber,M.H.Ruckelshaus,R.R.Fuerstenberg,4 andj.b.scott.2009.determinationofindependentpopulationsandviability CriteriafortheHoodCanalsummerChumsalmonEvolutionarilySignificantUnit. NOAATechnicalMemorandumNMFS NWFSC pp. WashingtonDepartmentofFishandWildlifeandPointNoPointTreatyTribes(WDFWand PNPTT).2000.SummerChumSalmonConservationInitiative.Washington DepartmentofFishandWildlifeandPointNoPointTreatyTribes,Olympia,WA.423 pages+appendices.availableathttp://wdfw.wa.gov/fish/chum/library/ WashingtonDepartmentofFishandWildlife(WDFW)andPointNoPointTreatyTribes (PNPTT).2003.Reportonsummerchumsalmonstockassessmentand 176
177 managementactivitiesfor2001and2002.supplementalreportno.4summer ChumSalmonConservationInitiative:Animplementationplantorecoverysummer chuminthehoodcanalandstraitofjuandefucaregion.219pp. WashingtonDepartmentofFishandWildlife(WDFW)andPointNoPointTreatyTribes (PNPTT).2007.Reportonsummerchumsalmonstockassessmentand managementactivitiesfor2006.supplementalreportno.7summerchumsalmon ConservationInitiative:Animplementationplantorecoverysummerchuminthe HoodCanalandStraitofJuandeFucaRegion. 177
178 178 PugetSoundcohosalmon 17 DescriptionofPugetSound/StraitofGeorgiaESU ThePugetSound/StraitofGeorgiawasoriginallydesignatedin1994duringthe WestCoastcohosalmonstatusreview(Weitkampetal.1995);otherthanintheearlier sectionofthisreport,itsboundarieshavenotbeenreconsideredsincethattime.theesu includescohosalmonfromdrainagesofthesalishsea,whichincludepugetsoundand HoodCanal,theeasternOlympicPeninsula(eastofSaltCreek,StraitofSanJuandeFuca), andthefromtheeasternsideofvancouverisland(northtoandincludingcampbellriver) andthebritishcolumbiamainland(northtoandincludingpowellriver)(straitof Georgia),excludingtheupperFraserRiveraboveHope(Figure1). SummaryofPreviousBRTConclusionsPugetSound/StraitofGeorgiaCohoSalmon ESU The1994StatusReview InadditiontodelineatingESUboundaries,the1994BRTexaminedthestatusofall cohosalmonesusalongthewestcoast(weitkampetal.1995).forthepuget Sound/StraitofGeorgia,theBRTnotedthatalthoughpopulationabundancein1994was nearhistoricallevelsandrecenttrendsinoverallpopulationabundancewerenot downward,therewassubstantialuncertaintyrelatingtoseveraloftheriskfactors considered.theseriskfactorsincluded1)widespreadandintensiveartificialpropagation, 2)highharvestrates,3)extensivehabitatdegradation,4)arecentdramaticdeclineinadult size,and5)unfavorableoceanconditions.concernsassociatedwithdecliningadultsize includedreducedfecundity,greaterlikelihoodthatreddswouldbedestroyedbywinter stormsduetotheirshallowerdepth,theinabilityofsalmontosuccessfullyascend challengingriverreaches,andgeneticchangessuchthatpopulationswouldpermanently losetheabilitytoproducelargeindividuals;takentogether,thesewouldresultinlower populationproductivity. TheBRT soverallconclusionfortheesuwasthatifpresenttrendscontinued,the ESUwaslikelytobecomeendangeredintheforeseeablefuture,althoughitalso recommendedthatfurtherinformationwouldlikelyclarifysomeoftheseuncertainties (Weitkampetal.1995). The1995StatusReview WhenitrevisitedthePugetSound/StraitofGeorgiain1995,manyofthequestions the1994brtraisedaboutthestatusofnaturalpopulationswereansweredtovarying degrees.forexample,itwasdeterminedthatthemajorityofnaturalproductionand spawningescapementinpugetsoundoccurredinbasinsmanagedfornaturalescapement andproduction(skagit,stillaguamish,snohomishrivers,andsouthandcentralhood 17 Sectionauthor:LaurieWeitkamp.PugetSoundcohoarenotlistedundertheESA. However,theyareaspeciesofconcern(69FR19975)sowehaveincludedabriefreviewof thisesuinourreport.
179 Canal),andthesenaturalpopulationsappearedtobestable.Hatcheryinfluencewas considerablylessintheseareasthaninthosemanagedforhatcheryproduction,where hatcheryproductionwasextensive(10sofmillionsoffryandsmoltsreleasedannually). Harvestratesonthesenaturalstocksweregenerallylowerthanonstocksinareas managedforhatcheryproduction. SizeofadultsinthisESUincreasedslightlyinthe1994and1995returnyears, althoughtheywerestillgenerallysmallerthantheywerein1990.limiteddataonthesize ofnaturalspawnersindicateddownwardstrends,althoughtheydidnotappeartobe decliningassteeplyassomehatcherystocks. Asof1995,overallabundanceofcohosalmon,includingbothnaturalandartificial production,wasmuchhigherinthisesuthaninanyoftheothercohosalmonesus.inthe U.S.portionalone,estimatedrunsizewasapproximatelyahalfmillionfish.Three drainagesthatweredominatedbynaturalproductionhadspawningescapementsinexcess of10,000fish,ledbythesnohomishriverwithageometricmeanofover75,000. Ontheotherhand,the1995statusreviewfoundthattherecontinuedtobeseveral reasonsforconcernaboutthehealthofnaturalpopulationsofcohosalmoninthisesu. First,the1995BRTlackeddetailedinformationforcohosalmonintheCanadianportionof thisesu,butavailabledataindicatedthatnaturalpopulationsinbritishcolumbiadeclined substantiallyduringtheearly1990 s.second,artificialpropagationofcohosalmonwas conductedonanimmensescaleinboththecanadianandu.s.portionsofthisesu.large geographicareasofpugetsound(e.g.,thenooksackriverandallthesoutherndrainages) weremanagedforhatcheryproduction,andlittlenaturalproductionwasexpected(or encouraged)fromstreamsintheseareas.finally,thedeclineinadultsizeofcohosalmon wasdramaticallysharperinpugetsoundthaninotherareasofthepacificnorthwest. Afterweighingthesevariousfactors,themajorityofthe1995BRTconcludedthat thisesuwasneitheratriskofextinctionnorlikelytobecomesointheforeseeablefuture. AminorityfeltthattheESUwaslikelytobecomeendangered.Akeyfactorwasthe presenceofseveralrelativelylargepopulationsinnaturalproductionareasinnorthpuget Sound,whichsuggestedthattheESUasawholewasnotatsignificantextinctionrisk. However,theBRTwasveryconcernedthatthesenaturalpopulationswerefewinnumber andconcentratedinarelativelysmallportionoftheesu. The1995statusreview(Weitkampetal.,1996)wasneverfinalizedduetoarequest byco managersforfurtherreviewandcomment.atpresent,pugetsoundcohosalmonare notlistedontheendangeredspecieslist,butremainaspeciesofconcern(speciesof Concern4/15/04(69FR19975). New Data and Updated Analyses Because the Puget Sound/Strait of Georgia ESU has not been formally evaluated since 1995, there is a wide variety of new or updated information available for coho salmon within the ESU. For purposes of this review, we have focused on updating key data series used in the previous reviews to provide insight into the overall status of the Puget Sound portion of the ESU, in order to address whether the ESUs overall status has likely changed since the 1995 status review. Accordingly, we examined updated data series of harvest rates, abundance (spawner abundance and run size), adult size, marine survival rates, and smolt production. If examination of this information leads to the conclusion that ESU status has greatly deteriorated, then a wider range of information will be considered as part of a formal status review. 179
180 Abundance and trends The abundance of coho salmon in Puget Sound remains quite high. For Puget Sound as a whole, there returned a geometric mean of 483,000 spawners and a total run size of 851,000 during the period of (PFMC 2010). The single largest natural population (Snohomish River) has a geometric mean of 122,000 spawners during , reaching 252,000 fish in 2004 (PSC 2010). Trends in spawning abundance in the major natural production areas are fairly flat since 2005, but are down from the peaks seen in (Figure 75). Current spawning escapement is similar to levels in the 1990 s. Figure75 SpawningescapementtrendsinthemajorwildpopulationareasofforPugetSoundcohosalmon. DatacompiledfromWDFW. 180
181 Table54 Shortandlong termtrendsforthemajornaturalproductionstocksofpugetsoundcohosalmon. Stock Geometric mean spawners 1 Short-term trend Long-term trend (95% CI) 2 (95% CI) 3 Hood Canal ( ) ( ) Skagit ( ) ( ) Snohomish ( ) ( ) Stillaguamish ( ) ( ) E Strait of Juan de Fuca ( ) ( ) for all except ESJF, which is Trend from Trend from 1981 (Hood Canal), 1977 (Skagit), 1984 (Snohomish, Stillaguamish), and 1986 (ESJF). Based on data compiled from WDFW. Harvest PugetSoundcohosalmonaretakenprimarilyinPugetSoundfisheries.Historically, CanadiancohofisheriesoffofWCVIandintheStraitofGeorgiahadveryhighimpactson PugetSoundcohoaswellandmemberoftheESUaretakeinnorthernBC,southeast Alaska,andinoceanfisheriesoffthecoastofWashington.WithinPugetSound,fisheriesin thesouthsound,andhoodcanalaremanagedforhatcheryproduction,andfisheriesinthe StraitofJuandeFucaandnorthernandcentralPugetSoundaremanagedfornatural production.differencesinexploitationpatternsreflectthesedifferencesinmanagement strategy(figure76).exploitationratesinthevicinityof80%inthelate1980sfell dramaticallyonstocksmanagedfornaturalproductionwithinpugetsoundasaresultof severerestrictionsoncanadianfisheriestoprotectuppercriticallydepressedfraserriver cohosalmon.usfisheriesinwashingtonwatershavealsobeenconstrainedbylimitson upperfrasercohosalmonnegotiatedthroughthepacificsalmontreaty.recreational fisheriesandoceancommercialfisheriesinwashingtonandoregonwatersalsoswitched overtomark selectivefishingbeginningin1999.asaresult,totalexploitationratesonthe PugetSoundcohostocksmanagedfornaturalproductionhavebeenrelativelystablesince 2000intherangeof40%orless. 181
 Artificial Propagation (Hatcheries) In both the")
182 Figure76 TotalexploitationratesonPugetSoundcohostocks.Data basedoncoded wire tag analysis,and fromFisheryRegulationAssessmentModelvalidationruns(LarrieLaVoy,NMFS, personalcommunication) Artificial Propagation (Hatcheries) In both the 1994 and 1995 status review, the BRT had concerns about the level of hatchery influence in the ESU as a whole. Many of the concerns about hatchery influence in basins managed for natural production were addressed in the 1995 review, with the general 182
183 feeling that natural production areas had limited hatchery influence. Current information indicates that hatchery influence is still substantial in the Puget Sound portion of the ESU as a whole, although it has declined substantially since 1995 (Figure 78) as the number of coho salmon released annually has declined. For example, Puget Sound terminal run size was composed of 62% hatchery fish during years , but decreased to 43% during the period from (Figure 77; PFMC 2010). Similarly, the percent of spawners that were of hatchery origin decreased from 47% during the earlier period ( ) to 35% after Hatchery influence in basins managed for natural production (Skagit and Stillaguamish- Snohomish) remains low (19 and 21% for run size and 19% and 8% for spawners, respectively, for years ). Overall coho hatchery production in Puget Sound has declined from an average of 35 million fish released annually in the 1980 s to ~12 million annually during the period Figure77 PercentofPugetSoundcohosalmonofhatcheryoriginestimatedforbothterminalrunsize(before terminalharvest)andforspawners.datafrompfmc

184 Figure78 SummaryofhatcheryreleaseswithinthePugetSoundcohoESUspawningandrearingareas.Source: RMIS. 184
185 Other Factors Marine survival Marine survival rates are estimated annually for four wild Puget Sound coho salmon populations based on coded wire tags: Big Beef Creek, Deschutes River, South Fork Skykomish, and Baker (Table 55, Figure 79; Zimmerman 2009). Big Beef Creek has consistently had the highest marine survival rate (16.0% during ), Deschutes and SF Skykomish have been intermediate (11.8% and 13.5%, respectively) and Baker River the lowest (8.1%). Baker marine survival rates were not estimated prior to 1992, at a time when rates were generally high (mean 18.4%) compared to the period since 1992 (9.8%). For all populations, trends in marine survival rates have been declining, at rates of -0.25%/year (SF Skykomish) to -0.94%/year (Deschutes River). Part of this downward trends comes from consistently low survival rates for coho salmon returning in 2006 (mean = 3.0%) and 2008 (mean = 3.7%). However, as recently as 2004 marine survival rates were still quite high (mean = 13.7%), with Big Beef Creek reaching an impressive 24.4% marine survival rate (Zimmerman 2009). Table55 MarinesurvivalrateinformationforwildPugetSoundcohosalmonpopulations.Regressionslopes thatarestatisticallysignificantatp<0.05areinbold.datafromzimmerman2009. Attribute Population Years for Average marine Slope Regression r 2 estimate survival (%) Big Beef Creek Deschutes River SF Skykomish Baker River
186 Figure79 MarinesurvivalratesforwildcohosalmonpopulationsinPugetSound.DatafromWDFW2010. Smolt production The number of smolts produced in numerous major and minor rivers in Puget Sound is estimated each year (Zimmerman 2009). Rivers for which there are recent smolt production estimates include Dungeness, Skagit, Cedar, Green, and Deschutes Rivers and Big Beef Creek, with a single (2009) estimate for the Nisqually River (135, 512) (Zimmerman 2010). Of these systems, the Skagit produces the most smolts (averaging 1,037,119 annually since 1990), followed by the Green River (79,701), Cedar (50,759), Deschutes (48,144), Dungeness (25,038) and Big Beef Creek (27,015) (Fig. SP). Analysis of the trends of smolt production over time indicate that only the Deschutes River had a significant trend (p < 0.05) with a declining slope of smolts/year (Table 56). The slopes of smolt production over time for other basins were a mix of positive (Skagit, Big Beef Creek) and negative (Dungeness, Cedar, Green River), but none were statistically meaningful (p > 0.10). For many populations, smolt production was low in 2007 and 2008, but rebounded in 2009 such that three basins (Skagit, Cedar, Big Beef Creek) had above average production that year, including the highest smolt production from the Skagit (1,475,065 smolts) since the 2000 outmigration (Figure 80). Table56 SmoltproductionestimatesforPugetSoundpopulations.DatafromM.Zimmerman,WDFW. Population Years Averagesmolt production Slopeofsmolts overtime* Regressionr 2 Dungeness ,
187 Skagit ,037, CedarRiver , BigBeefCreek , GreenRiver ,701** Nisqually ,512 Deschutes , *Slopesthatarestatisticallysignificantlyatp<0.05areindicatedinbold. **Smolt production estimates were not available for smolt outmigration years 2004, 2005 and
188 Figure80 EstimatedsmoltabundancesforvariousPugetSoundcohosalmonpopulations. Adultsize OneoftheconcernsofpreviousreviewsofPugetSoundcohosalmonwastherapid declineinadultsize,discussedabove.updateddataonthesizeofcohosalmoncollectedin fisheries,uponreturntohatcheries(fromthecodedwiretagdatabase),ormeasuredat weirsallindicatethatadultsizereachedminimumlevelsinthemid1990sandhassince increased(figure81,figure82,figure83).formostdataseriesexamined,thesizeofcoho salmoninthelastfewyearsiscomparabletothatinthe1970sand1980s,beforetherapid decline.accordingly,while1994statusreviewprovidedevidencethattrendsinpuget Soundadultsizeweredecliningandmostwerestatisticallysignificant(p<0.05;Weitkamp etal.1995),updatedtrendsindicatebothfewernegativeslopes(only10of26timeseries examined),ofwhichfewonly4werestatisticallysignificant,whilemosttrendswere positive(16of26)includingthreestatisticallysignificantpositivetrends(table57). Althoughwedidnotexaminetrendsinfecundity,wehavenoreasontoassumethat increasingtrendsinadultsizearenotaccompaniedbyaconcurrentincreaseinfecundity. Perhapsmostimportantly,recentincreasesinsizeclearlyindicatethatPugetSoundcoho salmonhavenotlosttheabilitytoproducelargeadultswhentheconditionsareright. 188
189 Figure81 LongtermtrendsinestimatedweightofcohosalmoncaughtinWashingtoncommercialfisheries ( Washingtoncatch )orwashingtoncommercialtrollfisheries( Washingtontroll ).DatafromWright1970, WDF1985,WDF1996,andPFMC2009. Figure82 TrendsofadultcohosalmonsizefrommonitoredwildpopulationsinPugetSound.DatafromM. Zimmerman,WDFW,
190 Figure83 Trendsofadultsizeforsalmoncaughtininriverfisheriesinnorth(top)andcentral(middle)Puget SoundandHoodCanalandtheStraitofJuandeFuca(bottom).DatafromWDFW
191 Table57 Regressionstatisticsforchangesinadultsizeovertime.Includedareyearsconsideredandslopes reportedinourearlieranalysis(weitkampetal.1995).slopesthatarestatisticallysignificantatp<0.05arein boldfont. Population/Fishery Measurement source Measurement type Current Previous Current Slope Previous slope Source years years Washington all weight commercialcatch Washington troll weight commercialtroll BigBeefCreek spawners length 78 98, DeschutesRiver spawners length Nooksack inriver weight Nooksack hatchery length returns Skagit inriver weight Skagit hatchery length returns Skagit testfishery length Snohomish hatchery length (WallaceR) returns Snohomish hatchery length (IssaquahCr) returns Duwamish/Green inriver weight Duwamish/Green hatchery length returns Puyallup inriver weight Puyallup hatchery length returns Nisqually inriver weight Nisqually hatchery length returns MinterCreek hatchery length returns PurdyCreek hatchery length returns BigQuilcene hatchery length returns Skokomish inriver weight SnowCreek spawners length (femalesonly) (incomplete) Dungeness inriver weight Dungeness hatchery length returns Elwha inriver weight Elwha hatchery length returns Sourcesare:1 WDF1985,PFMC2010;2 Wright1970,WDF1985,PFMC2010;3 M.Zimmerman (WDFW),unpublisheddata;4 WDFW2010;5 B.Hayman(SkagitCooperative),unpublisheddata. 191
192 Puget Sound coho salmon: Updated Risk Summary The available information suggests that the status of the Puget Sound coho salmon ESU is similar, or perhaps improved, from its status at the time of the last formal status review in Some of the risk factors identified in the earlier status review, in particular the declining trend in adult size, have reversed. Abundance in the northern populations managed for natural escapement remains as high or higher than it was at the time of the last status review. Harvest rates on natural origin Puget Sound coho salmon have generally declined since Total hatchery releases of coho salmon in the ESU have declined, although the southern portion of the ESU continues to have large number of hatchery returns. This review did not specifically evaluate trends in habitat quality, but many of actions taken as a result of the Chinook and steelhead listings likely provide some benefit to coho salmon as well. Overall, the new information considered does not indicate a change in the biological risk category since the time of the last BRT status review. References NMFS(NationalMarineFisheriesService)1996.Factorsfordecline:Asupplementtothe noticeofdeterminationforwestcoaststeelhead.nmfsprotectedspeciesbranch, Portland,OR.Onlineathttp:// Salmon Listings/Salmon Populations/Reports and Publications/upload/stlhd ffd.pdf. NMFS(NationalMarineFisheriesService)1998.FactordcontributingtothedeclineofWest CoastChinooksalmon:Anaddendumtothe1996WestCoastSteelheadFactorsfor DeclineReport.NMFSProtectedSpeciesBranch,Portland,OR.Onlineat: Salmon Listings/Salmon Populations/Reports and Publications/upload/chnk ffd.pdf PacificFisheriesManagementCouncil(PFMC).2010.Reviewofthe2009oceanfisheries. AvailablefromPFMC,pcouncil.org. PacificSalmonCommission(PSC) PeriodReport.ReportTCCoho (xx) x.draftversionprovidedbywdfw. PugetSoundSalmonRecoveryPlan WashingtonDepartmentofFisheries(WDF).1985.AnnualFisheriesStatistics. WDF,Olympia,Washington. WashingtonDepartmentofFishandWildlife(WDFW).2010.InformationonPuget SoundcohosalmonprovidedtoLaurieWeitkamp. Weitkamp,L.A.,T.C.Wainright,G.J.Bryant,G.B.Milner,D.J.Teel,R.G.Kope,andR.S.Waples StatusreviewofcohosalmonfromWashington,Oregon,andCalifornia.U.S. Dep.Commer.NOAATech.Memo.NMFS NWFSC 24,258p. Weitkamp,L.A.,P.Adams,G.Bryant,P.Busby,R.Emmett,J.Hard,O.Johnson,R.Iwamoto,R. Kope,C.Mahnken,G.Matthews,M.Schiewe,D.Teel,T.Wainwright,W.Waknitz,R. Waples,J.Williams,GWinans,1996.DraftStatusreviewofcohosalmonfrom Washington,Oregon,andCalifornia.AvailablefromDr.LaurieWeitkamp,NMFS 2032SEOSUDrive,Newport,OR97365 Wright,S.1970.Size,age,andmaturityofcohosalmoninWashington soceantroll fisheries.wash.dep.fisheries,fisheriesresearchpapers3(2):
193 Zimmerman, M Wild Coho Forecasts for Puget Sound, Washington Coast, and Lower Columbia. Wash. Dep. Fish. Wildlife Rep Zimmerman,M.2010.SmoltproductionandadultsizeandabundancedataprovidedtoL. Weitkamp.WDFW. 193
194 LakeOzetteSockeyesalmon 18 ListedasathreatenedspeciesonMarch25,1999;threatenedstatusreaffirmedon June28,2005.TheESUincludesallnaturallyspawnedpopulationsofsockeyesalmonin LakeOzetteandstreamsandtributariesflowingintoLakeOzette,Washington,aswellas twoartificialpropagationprograms:theumbrellacreekandbigriversockeyehatchery programs. Since then, the ESA salmon recovery plan was finalized for Lake Ozette sockeye May 29, 2009 and the Puget Sound Technical Recovery Team (TRT) finalized analyses on population identification (Currens et al. 2009) and population/esu viability (Rawson et al. 2009) for this ESU. The Lake Ozette sockeye salmon ESU was determined to consist of only one population which consists of both beach and tributary spawners. Lake Ozette sockeye were an important contributor to fisheries of the Makah and Quileute Tribes in the first half of the 1900s. Estimates of Makah Tribes annual harvest of Lake Ozette sockeye reach 17,000 in 1949; harvest declined sharply in the 1960 s due to declining returns; commercial harvest ended in 1974 and all harvest ended by Harvest records are our best indicators of population abundance in past years. Estimation of returns to the lake are attempted using a weir at the mouth of the Ozette River; however, functioning of the weir and interpretation of the weir counts has been difficult. However, they do indicate that returns to this system have not recovered. PreviousStatusReviewsandRecoveryDocuments The three most recent status reviews of Lake Ozette sockeye (Gustafson et a. 1997; NMFS 1998; Good et al. 2005) all agreed that overall abundance is low; but collection/monitoring methods need to be improved to get a better idea of abundance trends. Five-year geometric means from the three reviews are: , 700 adult sockeye and declining by 10% per year (Gustafson et al. 1997) , 580 adult sockeye and declining by 2% per year (NMFS 1998) , 2,267 adult sockeye and increasing by 28% per year (Good et al. 2005). The increased numbers in the 2005 review could be in part due to changes in methods of counting data through the weir. The hatchery supplementation program was developed in 1982 to plant fry in Umbrella Creek and Big Creek with the intent of starting spawning in the tributaries to augment the traditional beach spawning by the population. Beach spawning seems to be declining, due in part to loss of quantity and quality of adequate beach spawning habitat. Spawning in Umbrella Creek has become self-sustaining as indicated by estimates of natural origin spawners to the tributary. The current hatchery program is limited to releases through 2012, at which time it will be re-evaluated. TherecoveryplanforLakeOzettesockeyewasadoptedbyNMFSin2009(NMFS 2009)andpopulationidentificationandviabilityweredeterminedbythePugetSoundTRT alsoin2009(currensetal.2009andrawsonetal.2009,respectively). 18 Sectionauthor:NormaSands 194
195 NewDataandUpdatedAnalyses ESUStatusataGlance Historicalpeakcatchlevels 15,000 18,000( ) Historicalpopulations 1 Extantpopulations 1 Current5 yraverageescapement 2,679(NOR) Viablepopulationstructure 1populationwithmultiplebeachandtributary spawners Viablemin.spawningabundance 35,500 ESU Structure The Puget Sound TRT considers the Lake Ozette sockeye salmon ESU to be composed of one historical population (Currens et al. 2009), with substantial substructuring of individuals into multiple spawning aggregations. The primary existing spawning aggregations occur in two beach locations Allen s and Olsen s beaches, and in two tributaries, Umbrella Creek and Big River (both tributary-spawning groups were initiated through a hatchery introduction program). NewDataandUpdatedAnalyses NewdataforLakeOzettesockeyearefromtheannualresourcemanagement reportsfromthemakahtribe(peterschmidt&hinton2005,2006,2008andpeterschmidt etal.2007).escapementdataareavailablefrom ,althoughtheescapementweir datafrom2004wasnotexpandedinthereports.estimatesofsockeyereturningtolake Ozettearegenerallymadebasedonweircountsandrepresentthereturnstothelake beforepre spawningmortalitysuchasin lakepredation.estimationofreturnsandof spawnershasbeendifficult;weiroperationhasbeenproblematicandthemethodfor expandingweircountshaschangedperiodically.thelackofreliablespawningestimates makesitdifficulttoassessthestatusoranychangesthatmightbeoccurringovertimefor thispopulation. ThereisnoharvestonLakeOzettesockeyesince1982;therewereonlyminor terminalcatchesfrom1977to1982. Ageofbeachspawnersareassumedtobeallage4whiletheagedistributionof tributaryspawnersisestimatedataweiratthemouthofumbrellacreekandareprovided intheresourcemanagementreports CohortrunreconstructionisdoneusingthePSTRTAbundance&ProductivityExcel Table(Sands2009). Abundance and Productivity Estimates Estimatingspawningabundanceandhatcherycontributionsremainsdifficultfor thepopulation.variousreportsgiveslightlydifferentestimatesandweircountshavenot beenexpandedbythecomanagerssince2003.forthisreportweexpandtheweircounts basedonaverageexpansionfactorsusedinthepast;thesedataareconsideredhighly impreciseandareincludedheretoutilizetheinformationthatisavailablefortheserecent years.estimatesusedherediffersomewhatfromthoseusedbythetrtintheirviability 195
196 report(rawsonetal2009)basedondataprovidedintheannualresourcemanagement PlanReportsfromMakahFisheriesManagementfor The abundance data used are provided in Table58 and Figure84. Escapement numbers that are italic in the table are estimated missing values, or in the case of 2004 to 2007, expanded weir counts based on average expansions, not year specific expansions. These number have high uncertainty but we expect these estimates to be updated by tribal biologists in the future. 196
197 Table58 Naturalspawningescapement(includesnaturaloriginandhatcheryoriginfish),naturalorigin(NOR) fish,thepercentofnaturalescapementthatishatcheryorigin,thepercentofnaturalspawnersthatoccurinthe tributaries Year Total % origin % Spawners Harvest Take 1 Natural Hatchery Tributary Broodstock , % 0% , % 0% , % 0% , % 0% % 0% , % 0% % 0% , % 0% , % 0% , % 0% , % 0% , % 5% , % 5% % 5% , % 5% , % 5% % 10% % 10% % 57% , % 9% , % 47% , % 24% , % 55% , % 71% , % 85% , % 45% , % 36% , % 90% , % 98% , % 43% % 10% TotalnaturalspawningestimatesaretakenfromtheLimitingFactorsAnalysisreportaccompanyingthe LakeOzetteRecoveryPlan,exceptforitalicnumberswhichareestimatedbyvariousmethodsoffillingin missingdata.for1983,1986,1993,1995,valuesweregiveninanearlierversionofthelfareport;all estimatesgiveninthelaterreportwereexpandednumbers;thesefouryearsareexpandedbytheaverage expansionvalue.for1985and1987theaverageoftheprecedingandfollowingyearwasused.for2004to 2007onlyrawweircountsweresuppliedinTribalannualreports;theseweircountswereexpandedbythe averageexpansionusedfrom1997to2003. Averageescapementoverfive yearintervalsisgivenintable59aswellas estimatesoftrends[exp[trend(ln(esc))]]overtheintervals.notrendisnotable,withthe years havingrelativelylowabundancesand havingrelativelyhigh abundances. 197
meanofthetotalspawers,andthegreenshadedarea indicates+/ 1standarddeviationaroundthemean.")
198 Figure84 TrendinspawningabundanceofLakeOzettesockeyesalmon.Thedarklineindicatesnaturalorigin spawnernumbers,light(red)lineindicatestotalnaturalspawners(includingnaturallyspawninghatcheryfish). Thedottedlineisthelong term(wholetimeseries)meanofthetotalspawers,andthegreenshadedarea indicates+/ 1standarddeviationaroundthemean. Table59 Five yeargeometricmeanescaapmentsfornaturaloriginspawnersandnaturalspawners(natural andhatcheryorigin)forlakeozettesockeyeandtrendoverthe5 yearintervals.notethefirstyearrange includes6yearstoincludethestartofavailabledata. Years Natural origin Total ,790 1, ,289 2, ,899 3, ,052 2,291 Trend Shortandlongtermtrends[exp[trend(ln(esc))]]andgrowthrates(lambda)asestimated bythespazprogramaregivenintable60.althoughthespazprogramsgivesestimatesof lambdaforbothassumptionsofhatcheryfishhavingzerosuccessonthespawninggrounds and100%success,thehatcheryfishinlakeozettearehavingadegreeofsuccess.these fisharefromtheconservationhatcheryprogramthatisintroducingspawnersinthe tributaries;thehatcheryfishhavebeensuccessfullyspawningandestablishingspawning aggregatesinthetributaries.neitherthetrendnorgrowthrateshowsanyindicationof increasingpopulationgrowth. Table60 ShortandlongtermpopulationtrendandgrowthrateestimatesfortheLakeOzettesockeye population. Hatchery Fish Success =0 Hatchery Fish Success =1 198
199 Years Trend Nat Sp w/ci Lambda w/ci p>1 Lambda w/ci p> ( ) ( ) ( ) ( ) ( ) ( ) Productivity is measured in terms of recruits from natural spawners. Most Lake Ozette sockeye are age 4, but there are estimates of a few age 5 spawners on the beaches and both age 3-5 spawners returning to the tributaries. Using the age data, cohort run reconstruction is done to provide recruit per spawner (R/S) estimates for brood years As is normal for salmon, productivity various greatly from year to year. However, the most recent brood years ( ) have the lowest average R/S (Table61). 199
200 Table61 RecruitsperspawnerforLakeOzettesockeyebroodyears Brood Year R/S year arithmetic averages BY BY BY BY BY Trend Spatialstructureanddiversity Spatialstructureanddiversityareimportantfactorsindeterminingviabilityof salmonpopulations.theseviabilityfactorsforlakeozettesockeyearemeasuredusing spawninglocationastheindicator.itis,therefore,importanttobemonitoringthe spawningdistributionofthispopulation,notonlybetweenbeachandtributaryspawners, butamonglocationsiteswithineachofthesespawningtypes.thereiscurrentlyaweirat themouthofumbrellacreekwherethereisahatcheryintroductionprogramthat monitorsescapementtothattributary.however,thereiscurrentlynosuccessfully quantitativeprogramtomonitorbeachspawningorspawningatothertributaries. 200
201 Hatchery releases Hatchery releases started in 1983 into Umbrella Creek with the purpose of introducing tributary spawners into this sockeye ESU (Table62). The hatchery program will be re-evaluated in 2012 to see if it has accomplished its purpose and will be stopped, or whether it should be continued. The program does seem to have produced natural spawners returning to these two creeks and to a lesser extent in other tributaries. Because of the reduced quality and quantity of beach spawning habitat, these tributary spawners will be an important contribution to overall ESU viability. Table62 HatcheryreleasesintoUmbrellaCreekandBigCreek. Year Hatchery releases , , , , , , , , , , , , ,748 Harvest OceanfisheriesdonotsignificantlyimpactLakeOzettesockeyesalmon.BothLakeOzette andtheozetteriver,connectingthelakewiththeocean,areclosedtosalmonfishing. Lake Ozette sockeye salmon: Updated Risk Summary EstimatesofpopulationdataforLakeOzettesockeyeremainhighlyvariableand uncertain.thismakesitimpossibletodetectchangesinabundancetrendsorin productivityinrecentyears.itisobvious,though,thatpopulationlevelsremainverylow comparedtohistoricallevelswhenharvestonthesestockswasplentiful.assessment methodsmustimproveinordertoevaluatethestatusofthispopulation/esuandits responsestorecoveryactions.overall,thenewinformationconsidereddoesnotindicatea changeinthebiologicalriskcategorysincethetimeofthelastbrtstatusreview. References Currens,K.P.,R.R.Fuerstenberg,W.H.Graeber,K.Rawson,M.H.Ruckelshaus,N.J.Sands,andJ.B. Scott.2009.IdentificationofanindependentpopulationofsockeyesalmoninLakeOzette, Washington.U.S.Dept.Commer.,NOAATech.Memo.NMFS NWFSC 96,18p.NTISnumber PB
202 GoodTP,WaplesRS,AdamsP(2005)UpdatedstatusoffederallylistedESUsofWestCoast salmonandsteelhead.u.s.dept.commer.,noaatech.memo.nmfs NWFSC 66.,p Gustafson,R.G.,T.C.Wainwright,G.A.Winans,F.W.Waknitz,L.T.Parker,R.S.Waples StatusreviewofsockeyesalmonfromWashingtonandOregon.U.S.Dept.of Commerce,NOAATech.Memo.,NMFS NWFSC 33,282p. NMFS(NationalMarineFisheriesService).1998.Proposedrule:Endangeredand threatenedspecies:proposedthreatenedstatusanddesignatedcriticalhabitatfor OzetteLake,Washingtonsockeyesalmon.FederalRegister[Docket ,10March1998]63(46): NMFS.2009.LakeOzetteSockeyeRecoveryPlan.AdoptedbyNMFSMay29, Recovery Planning/Recovery Domains/Puget Sound/Lake Ozette Plan.cfm Peterschmidt,C.andJ.Hinton.2005.ResourcemanagementplanreportforLakeOzette sockeye2004.makahfisheriesmanagementreportjune pp. Peterschmidt,C.andJ.Hinton.2006.ResourcemanagementplanreportforLakeOzette sockeye2005.makahfisheriesmanagementreport pp. Peterschmidt,C.,J.HintonandC.Eggleston.2007.Resourcemanagementplanreportfor LakeOzettesockeye2006.MakahFisheriesManagementReport pp. Peterschmidt,C.andJ.Hinton.2008.ResourcemanagementplanreportforLakeOzette sockeye2007.makahfisheriesmanagementreportjune pp. Rawson,K.etal.2009.ViabilitycriteriafortheLakeOzettesockeyesalmonevolutionarily significantunit.noaatech.memo.nmfs NWFSC 99.53pp. Sands,N.J.2009.Auser sguidetotheabundanceandproductivity(a&p)tablesas developedforpugetsoundsalmon.fromthepugetsoundtechnicalrecoveryteam (PSTRT)AbundanceandProductivity(A&P)Workgroup.Fourthdraft,20April, 2009.(AvailablefromN.J.Sands,NorthwestFisheriesScienceCenter,2725 MontlakeBlvd.E.,Seattle,WA98112.) 202
203 PugetSoundsteelhead 19 ListedESU/DPS ThisreportcoverstheDistinctPopulationSegment(DPS)ofPugetSoundsteelhead (Oncorhynchusmykiss).ThesefisharetheanadromousformofO.mykissthatoccurin rivers,belownaturalbarrierstomigration,innorthwesternwashingtonstatethatdrainto PugetSound,HoodCanal,andtheStraitofJuandeFucabetweentheU.S./Canadaborder andtheelwhariver,inclusive. ESU/DPSBoundaryDelineationTheDPSboundarydelineationforPugetSound steelheadhasnotbeenreviewedsincethebiologicalreviewteam s(brt)2007status reviewofthisdps(hardetal.2007).thepugetsoundtechnicalrecoveryteam(trt) consideredgeneticandlifehistoryinformationfromsteelheadontheolympicpeninsula andwashingtoncoastbutconcludedthatthereisnocompellingevidencetoalterthedps boundariesdescribedabove. SummaryofPreviousBRTConclusions TheinitialreviewofthisDPS thencalledthepugetsoundevolutionarilysignificantunit (ESU) byabrtwascompletedin1996inresponsetotwolistingpetitionsreceivedby NOAAin1993and1994(Busbyetal.1996).SubsequenttothatBRTreview,NOAAissueda determinationthatlistingofpugetsoundsteelheadwasnotwarranted(61 FR 41451).In responsetoapetitiontolistpugetsoundsteelheadreceivedinseptember2004,anewly convenedbrtcompleteditsreportsummarizingthestatusofthepugetsoundsteelhead DPSinJune2007(Hardetal.2007).SubsequenttotheBRTreview,NOAAissueditsfinal determinationtolistthepugetsoundsteelheaddpsasathreatenedspeciesundertheesa on11may2007(72fr26722);theeffectivedateofthelistingwas11june2007. BriefReviewofTechnicalRecoveryTeamDocumentsandFindings ThePugetSoundSteelheadTechnicalRecoveryTeam(TRT)wasformedinMarch2008.It hasnotyetfinalizeditsviabilitycriteriaforthepugetsoundsteelheaddps;thetrtisstill conductinganalysesofthesedatatoidentifydemographicallyindependentpopulations (DIPs)andMajorPopulationGroups(MPGs)withintheDPS.TheTRTexpectstocomplete itsreportsummarizingthesecriteriainearly2011.consequently,thisreportfocuseson assessingviabilityofpopulationsinthedpsforwhichdemographicdataareavailable,and whichmightreflectadraftsetofputativedipsandmpgsthoughttorepresenthistorical populationstructurewithinthedps.theviabilityassessmentincorporates1)basic analysesofabundanceandtrend,followedby2)asetofsimplepopulationviability Analyses(PVAs)forthesedraftDIPsandMPGswithintheDPS. NewDataandUpdatedAnalyses Abundanceandtrends 19 Sectionauthor:JeffHard 203
204 Thedataconsideredinthisreportincludeestimatesofsteelheadnaturalescapement and/ortotalrunsize,ascalculatedfromreddcountandcatchstatisticsobtainedfromthe WashingtonDepartmentofFishandWildlife.Thesedataareforwinter runsteelhead primarily(thesolesummer runexceptionisfromthetoltriver),anddatefrom1985.at thispoint,thesepopulationsareconsideredbythetechnicalrecoveryteamtobe potentialdips;however,theydonotincludeallpotentialdipsunderconsiderationbythe TRT,sothepopulationsevaluatedhereinshouldbeconsidereddraftDIPs.Wepresent basicanalysesofnaturalescapementdataintable63 Table65below;theseanalyses focusona)datafromtheentiretimeseries,b)datasince1995,andc)fromthemostrecent fiveyears. a) Datafromtheentireseries Since1985,PugetSoundwinter runsteelheadabundancehasshownawidespread decliningtrendovermuchofthedps(table1).onlyfourofthe16populations evaluatedexhibitestimatesoflong termpopulationgrowthrate(λ=r 0 =e r,whereisr 0 isthenetbirthrateandristheintrinsicgeometricgrowthrate)thatarepositive(east HoodCanal,PortAngeles,SamishRiver,andWestHoodCanal),andonlyoneoftheseis significantly(p<0.05)greaterthanone(indicatingpositivepopulationgrowth):west HoodCanal.Thesefourpopulationsareallsmall.Thehighestgrowthratesoverthe entireseriesoccurineasthoodcanal,thegreenriver,portangeles,thesamishand Skagitrivers,andWestHoodCanal;thelowestratesoccurintheElwhaRiver,Lake Washington,andtheStillaguamish,Nisqually,andPuyalluprivers.Trendscouldnotbe calculatedforsouthpugetsoundtributaries. Table63 Estimatesofexponentialtrendinthenaturallogarithm(ln)ofnaturalspawners(λ)forseveral winter runpopulationsofsteelheadinthepugetsounddpsovertheentiredataseries( ).NC,not calculated. Population Exp.Trendln(nat.spawners)(95%CI) SouthSoundtributarieswinter run NC DungenessRiverwinter run 0.926( ) EastHoodCanalwinter run 1.022( ) ElwhaRiverwinter run 0.840( ) GreenRiverwinter run 0.992( ) LakeWashingtonwinter run 0.807( ) NisquallyRiverwinter run 0.914( ) PortAngeleswinter run 1.016( ) PuyallupRiverwinter run 0.919( ) SamishRiverwinter run 1.008( ) SkagitRiverwinter run 0.969( ) SkokomishRiverwinter run 0.956( ) SnohomishRiverwinter run 0.963( ) 204
205 StillaguamishRiverwinter run 0.910( ) WestHoodCanalwinter run 1.101( ) WhiteRiverwinter run ( ) b) Datasince1995 Since1995,PugetSoundwinter runsteelheadabundancehasalsoshownawidespread decliningtrendovermuchofthedps(table2).onlythreeofthe16populations evaluatedexhibitpointestimatesofgrowthratethatarepositive(easthoodcanal, SkokomishRiver,andWestHoodCanal),andonlyoneoftheseissignificantlygreater(P <0.05)thanone(positivepopulationgrowth):WestHoodCanal.Thesefour populationsareallsmall.thehighestgrowthratesovertheentireseriesoccurineast HoodCanal,theSkokomishRiver,andtheSamishandSkagitrivers;thelowestrates occurintheelwhaanddungenessrivers,lakewashington,andthestillaguamish, Nisqually,andPuyalluprivers.TrendscouldnotbecalculatedforsouthPugetSound tributaries. Table64 Estimatesofexponentialtrendinthenaturallogarithm(ln)ofnaturalspawners(λ)forseveral winter runpopulationsofsteelheadinthepugetsounddpssince1995( ).NC,notcalculated. Population Exp.Trendln(nat.spawners)(95%CI) SouthSoundtributarieswinter run NC DungenessRiverwinter run 0.919( ) EastHoodCanalwinter run 1.033( ) ElwhaRiverwinter run 0.750( ) GreenRiverwinter run 0.953( ) LakeWashingtonwinter run 0.731( ) NisquallyRiverwinter run 0.935( ) PortAngeleswinter run 0.964( ) PuyallupRiverwinter run 0.902( ) SamishRiverwinter run 0.966( ) SkagitRiverwinter run 0.978( ) SkokomishRiverwinter run 1.006( ) SnohomishRiverwinter run 0.961( ) StillaguamishRiverwinter run 0.879( ) WestHoodCanalwinter run 1.101( ) WhiteRiverwinter run 0.933( ) c) Datafromthemostrecentfiveyears 205
206 Overthemostrecentfiveyears( ),PugetSoundwinter runsteelhead abundancehasbeenlowovermuchofthedps,withageometricmeanlessthan250 fishannuallyforallbuteightpopulationsofthe15evaluated(table57).fourofthese areinnorthernpugetsound(samish,skagit,snohomishandstillaguamishrivers), threeareinsouthernpugetsound(nisqually,puyallup,andwhiterivers),andoneison theolympicpeninsula(skokomishriver).onlythreepopulationshaveageometric meangreaterthan500fish Green,SkagitandSamishrivers andtwoofthesearein northernpugetsound.theelwhariver,lakewashington,andsouthsoundtributaries populationsallhaveverylowrecentmeanabundances(<15fish). Table65 Geometricmeansofnaturalspawnersforseveralwinter runpopulationsofsteelheadinthepuget SoundDPSoverthemostrecentfiveyears( ).NC,notcalculated. Population Geometricmean(95%CI) SouthSoundtributarieswinter run NC EastHoodCanalwinter run 213( ) ElwhaRiverwinter run NC GreenRiverwinter run 986( ) LakeWashingtonwinter run 12(3 55) NisquallyRiverwinter run 402( ) PortAngeleswinter run 147(53 405) PuyallupRiverwinter run 326( ) SamishRiverwinter run 534( ) SkagitRiverwinter run 4648( ) SkokomishRiverwinter run 355( ) SnohomishRiverwinter run 4573( ) StillaguamishRiverwinter run 327( ) WestHoodCanalwinter run 208( ) WhiteRiverwinter run 265( ) Collectively,thesedataindicaterelativelylowabundance(4of15populationswithfewer than500spawnersannually)anddecliningtrends(6of16populations)innatural escapementofwinter runsteelheadthroughoutpugetsound,particularlyinsouthern PugetSoundandontheOlympicPeninsula. Supplementaryanalyses Wepresentseveraladditionalanalysesofsteelheadabundancedatathatrelyon multivariateauto regressivestate spacemodels(marss;holmesandward2010)to estimatequasi extinctionriskmetricsfromestimatesoftotalnaturalrunsize.themarss analyseswereconductedinr,version2.10(rdct2009).thesestochasticmodelsevaluate 206
207 linearunivariateormultivariatetimeseriestoestimatefuturetrend.theyhaveadistinct advantageinevaluatingecologicalapplicationssuchastimeseriesofabundancebecause theycanaccommodatemissingdataandconsiderbothprocess(e.g.,demographic stochasticity)andnon process(e.g.,measurementerror)errorsinthedata(holmesand Ward2010,Wardetal.2010).Theyalsodonotrequireanassumptionofaspecific underlyingdemographicstructure(e.g.,aspecificspawner recruitrelationship).the MARSSmodelsarefititerativelytothedataviamaximumlikelihood,usingaKalmanfilteredExpectation Maximization(EM)algorithm.Thisalgorithmisespeciallywellsuited todynamicsystemswherehiddenrandomvariablesoccurinthemodel.thekalmanfilter, whichiswidelyusedintheanalysisoftimeseries,usesdiffusionapproximationmethods tosolvefortheexpectedvaluesofthehiddenstates(ofthemultivariateauto regressive processes),conditionedonthedataovertheentiretimeseries.thisapproachis appropriateforsteelheadabundancedataforpugetsoundbecausethesedatainclude primarilyobservedreddcounts,oftenfromindexstreamreaches,andcreelcensusdata, whicharetakenusingconventionalprotocolsbutofteninvolvemissingorinconsistent catchinformation. ThePVAswerebasedonestimatesofnaturalrunsize(oranindexofrunsize)formostof thepugetsoundsteelheadpopulations;theseestimateswereobtainedfromwdfwby addingunexpandedestimatesofnaturalescapement(whichwereoftenbasedonredd countsfromindexreaches)toestimatesofnaturalfishcaughtintribalandsportfisheries between1985and2009.thepvasprovideestimatesofprocessandmeasurementerror, andprobabilitiesofextinctionriskandassociatedconfidenceintervalsarecomputedfrom theestimatesofabundancetrendsandprocesserror.thepvasestimatedbymarssdonot accountfordensitydependenteffectsonproductivityandabundance,butthisisatypical assumptionofpvawhenappliedtosmallordecliningpopulations.ifhabitatcapacityis changingorifalleeeffectsexpressedatlowabundanceareimportantinfluenceson populationtrends,theyarenotdetectedbythesemethods.althoughmissingdataarenot strictlylimitingtotheapproach(solongassufficientdataarepresentinthetimeseries), thepvasdoassumethatapopulationisstationarythroughtime,i.e.,trendsarelinearand environmentalconditionsaffectingmortalityandproduction(includingharvest)are constant.becauseitisastate spaceapproach,amarssanalysiscanprovidemore precisioninestimatesoftrendbecauseobservationerrorisexplicitlyincludedinthe analysis(ignoringobservationerrortendstoleadtoinflatedestimatesofprocess variance).thestate spaceframeworkpartitionsthetotalvarianceintoprocessand observationvariance,whichcanyieldmoreconstrained,realisticestimatesofprocess varianceand,asaresult,morepreciseestimatesofviabilitymetrics. Thefollowingthreegraphs(Figure85 Figure87)examinethetrendsinestimatednatural runsizeforpugetsoundwinter runsteelheadovertheentiredataseries( ),for populationscombinedintothreedraftputativempgsinthedps:northerncascades,south Sound,andOlympic.Ineachcase,thegraphsplotthemaximum likelihoodestimateof log(totalno.naturalsteelhead)forthecandidatepopulationsinthempgagainstthe observeddata,assumingthat1)eachpopulationtimeseriesfollowsasinglempg trajectoryandaresimplyscaledupordownrelativetoit,and2)variancesinthe observationerrorsforeachtimeseriesaremultivariatenormalbutareallowedtobe 207
208 uniqueforeachpopulation.theestimateofthelog(totalmpgcount)(solidblackcurve) hasbeenscaledrelativetothefirstpopulationatthetopofthelegend(i.e.,samishriverfor thenortherncascadesmpg,lakewashingtonforthesouthsoundmpg,andelwhariver fortheolympicmpg).the95%confidenceintervals(ci)aroundthetotalmpgestimate aregivenbythereddashedcurves(note:thesearenottheconfidenceintervalsaroundthe observeddata,whichareexpectedtofalloutsidethecidependingonthedegreeof population specificnon processerror,butareinsteadaroundthecompositeestimate; HolmesandWard2010).TheapproximateCIswerecomputedusingeitheranumerically estimatedhessianmatrix(asquarematrixofsecond orderpartialderivativesofthe function)orviaparametricbootstrapping.therelativelytightcisarisebecausethe estimateofprocessvarianceissmallandbecauseallthetime seriesdataarefittoasingle population trajectory.thetotalmpgestimateaccountsforthebiasestimatedforthefirst populationtimeseries. TheNorthernCascadesMPGshowsaclearlydecliningtrendinwildabundance(Figure 85).Theaveragelong termmpggrowthrate(uest,equivalenttoln(λ);seetables55and 56)isestimatedfromtheslopeoftheregression.Thisgrowthrateisnegative( 0.039), correspondingtoanestimatedlossinabundanceof3.9%peryearandaλof0.962.the processvariance(qest),whichisthetemporalvariabilityinpopulationgrowthratearising fromdemographicstochasticity,isestimatedfromthevarianceofresidualsaroundthe regressionline,andis0.024.thesouthsoundmpgalsoshowsaclearlydecliningtrendin wildabundance(figure86).itsestimatedlong termmpggrowthrateisnegative,witha lossof6.9%peryear(λ=0.933),anditsestimatedprocessvarianceis<0.001.the OlympicMPGshowsanegativelong termpopulationgrowthrateof1.3%peryear(λ= 0.987),withanestimatedprocessvarianceof0.096(Figure87). 208
209 Figure85 PlotoftheestimateoftotalPugetSoundwinter runsteelheadforaputativenortherncascadesmajor PopulationGroup(MPG).Thegraphplotsthemaximum likelihoodestimateoflog(totalno.steelhead)inthempg againsttheobserveddata,assumingasingle populationmodelforthempg.theestimateofthelog(totalmpg count)(solidblackline)hasbeenscaledrelativetothesamishriverpopulation.the95%confidenceintervals aroundthetotalmpgestimatearegivenbythereddashedlines(note:thesearenottheconfidenceintervals aroundtheobserveddata,whichareexpectedtofalloutsidetheci,dependingonpopulation specificnonprocesserror).seetextfordetails.nosuitabledatawereavailablefornooksackriversteelhead. 209
210 Figure86 PlotoftheestimateoftotalPugetSoundwinter runsteelheadforaputativesouthsoundmajor PopulationGroup(MPG).Thegraphplotsthemaximum likelihoodestimateoflog(totalno.steelhead)inthempg againsttheobserveddata.theestimateofthelog(totalmpgcount)(solidblackline)hasbeenscaledrelativeto thelakewashingtonpopulation.the95%confidenceintervalsaroundthetotalmpgestimatearegivenbythe reddashedlines(note:thesearenottheconfidenceintervalsaroundtheobserveddata,whichareexpectedto falloutsidetheci,dependingonpopulation specificnon processerror).seetextfordetails.nosuitabledata wereavailableforsouthsoundtributariessteelhead. 210
211 Figure87 Plotofthemaximum likelihoodestimateoftotalpugetsoundwinter runsteelheadforaputative OlympicMajorPopulationGroup(MPG).Thegraphplotstheestimateoflog(totalno.steelhead)intheMPG againsttheobserveddata.theestimateofthelog(totalmpgcount)(solidblackline)hasbeenscaledrelativeto theelwhariverpopulation.the95%confidenceintervalsaroundthetotalmpgestimatearegivenbythered dashedlines(note:thesearenottheconfidenceintervalsaroundtheobserveddata,whichareexpectedtofall outsidetheci,dependingonpopulation specificnon processerror).seetextfordetails. 211
212 Thenextseveralsetsofmulti plots(startingwithfigure88)summarizemarssanalyses thatevaluatethetrendsinestimatedwildabundancefordraftputativedipsofpuget Soundsteelheadovertheentiredataseries( ;typically,thesepopulation estimatesaretakenfromacombinationofobservedreddcountsfromindexreachesand observedcatches),projectpopulationtrends100yearsintothefuture,andwherepossible evaluatetheseprojectionsagainstspecifiedviabilitycriteria.foreachpopulation,the graphsprovideuptosixplotssummarizingthepopulationviabilityanalyses(pvas).the topleftpanelplotstheobservedcountsagainstyear,givingthemarssmaximumlikelihoodestimateoffittotheabundancedata(redcurve),theestimatedlong term populationgrowthrate(uest,equivalenttoln(λ)),andtheprocessvariance(qest).the toprightpanelplotstheprobabilitythatthepopulationwillreachaquasi extinction threshold(qet)abundanceequalto10%ofitscurrentabundanceoverthenext100years (withapproximate95%confidenceintervals).themiddleleftpanelplotstheprobability densityofthetimeinyearstoreachqetgiventhatitisreachedwithin100years,andthe middlerightpaneldepictstheprobabilityofreachingqetin100years,givenasafunction ofthenumberofindividualsattheendoftheprojection.thebottomleftpanelplots severalofthesamplepopulationprojectionsestimatedbymarss.finally,thebottomright paneldepictstheregionsofhighcertaintyanduncertaintysurroundingthepopulation projections(anextinctionrisk envelope ).Thegreenregioniswheretheupper95%CIsof theprojectionsdonotexceedp=0.05 i.e.,wheretheprobabilityofthespecified populationdeclineis<5%.theredregioniswherethelower95%cisoftheprojections exceedp=0.95 i.e.,wheretheprobabilityofthespecifiedpopulationdeclineis>95%. Thegreyregionsdefinelesscertainareasofparameterspacebetweentheseextremes, withthedarkgreyregionrepresentingtheregionofhighestuncertainty.notethatnotall plotsandcorrespondingestimatescouldbeconstructedforeachpopulation.forexample, wewerenotabletocalculatepvaestimatesforputativewinter runsteelhead DemographicallyIndependentPopulations(DIPs)intheNooksackRiverorinSouthPuget Soundtributaries,norwereweabletodosoforanysummer runsteelheadpopulationsin thepugetsounddpsexceptforthatinthetoltriver. 212
213 Figure88depictspopulationtrendsforSamishRiverwinter runsteelhead.steelhead countsinthesamishriverhavedeclinedsharplyinrecentyears.assumingthatthese countsareareasonablereflectionofspawnerabundance,theestimatedprobabilitythat thissteelheadpopulationwoulddeclineto10%ofitscurrentestimatedabundance(i.e.,to 43fish)ishigh about80%within25years.withanestimatedmeanpopulationgrowth rate(uest)of 0.037(λ=0.964)andprocessvariance(Qest)of0.140,wecanbehighly confident(p<0.05)thata90%declineinthispopulationwillnotoccurwithinthenext5 10years,andthata99%declinewillnotoccurwithinthenext15years.However,beyond thenext25yearswearehighlyuncertainaboutthepreciselevelofrisk. Figure88 PopulationViabilityAnalysis(PVA)forSamishRiverwinter runsteelhead.seetextfordescription. 213
214 Figure89depictspopulationtrendsforSkagitRiverwinter runsteelhead.steelhead countsintheskagitriverhavedeclinedsteadilysincethe1980s.theestimatedprobability thatthissteelheadpopulationwoulddeclineto10%ofitscurrentestimatedabundance (i.e.,to504fish)ishigh about80%within75years.withanestimatedmeanpopulation growthrateof 0.037(λ=0.964)andprocessvarianceof0.005,wecanbehighlyconfident (P<0.05)thata90%declineinthispopulationwillnotoccurwithinthenext30years,and thata99%declinewillnotoccurwithinthenext60years.however,beyondthenext50 yearswearehighlyuncertainaboutthepreciselevelofrisk. Figure89 PopulationViabilityAnalysis(PVA)forSkagitRiverwinter runsteelhead.seetextfordescription. 214
215 Figure90depictspopulationtrendsforStillaguamishRiverwinter runsteelhead. SteelheadcountsintheStillaguamishRiverhavedeclinedsteadilysincethe1980s.The estimatedprobabilitythatthissteelheadpopulationwoulddeclineto10%ofitscurrent estimatedabundance(i.e.,to37fish)ishigh about90%within60years.withan estimatedmeanpopulationgrowthrateof 0.071(λ=0.931)andprocessvarianceof0.016, wecanbehighlyconfident(p<0.05)thata90%declineinthispopulationwillnotoccur withinthenext15years,andthata99%declinewillnotoccurwithinthenext30years. However,a50%declineishighlylikelywithin100years.Beyondthenext30 40years,we arehighlyuncertainaboutthepreciselevelofrisk. 215
216 Figure90 PopulationViabilityAnalysis(PVA)forStillaguamishRiverwinter runsteelhead.seetextfor description. Figure91depictspopulationtrendsforSnohomishRiverwinter runsteelhead.steelhead countsinthesnohomishriverhavedeclinedsincethe1980s.theestimatedprobability thatthissteelheadpopulationwoulddeclineto10%ofitscurrentestimatedabundance (i.e.,to445fish)ismoderatelyhigh about50%within100years.withanestimatedmean populationgrowthrateof 0.024(λ=0.976)andprocessvarianceof0.033,wecanbe highlyconfident(p<0.05)thata90%declineinthispopulationwillnotoccurwithinthe next15years,andthata99%declinewillnotoccurwithinthenext35years.however, beyondthenext40 50yearswearehighlyuncertainaboutthepreciselevelofrisk.. 216
217 Figure91 PopulationViabilityAnalysis(PVA)forSnohomishRiverwinter runsteelhead.seetextfor description. Figure92depictspopulationtrendsforLakeWashingtonwinter runsteelhead.thecounts havebeenverylowsince2000.theestimatedmeanpopulationgrowthrateis 0.23(λ= 0.794)andprocessvarianceis0.380.TheestimatedprobabilitythattheLakeWashington steelheadpopulationwoulddeclineto10%ofitscurrentestimatedabundance(<1fish)is high ~90%within40years.Anextinctionriskenvelopecouldnotbecalculatedforthis populationfromthedata. 217
218 Figure92 PopulationViabilityAnalysis(PVA)forLakeWashingtonwinter runsteelhead.seetextfor description. 218
219 Figure93depictspopulationtrendsforGreenRiverwinter runsteelhead.steelheadcounts inthegreenriverhavedeclinedsteadilysincethe1980sandmostsharplysince2005.the estimatedprobabilitythatthissteelheadpopulationwoulddeclineto10%ofitscurrent estimatedabundance(i.e.,to45fish)ishigh about90%within80years.withan estimatedmeanpopulationgrowthrateof 0.042(λ=0.959)andprocessvarianceof0.001, wecanbehighlyconfident(p<0.05)thata90%declineinthispopulationwillnotoccur withinthenext20years,andthata99%declinewillnotoccurwithinthenext45years. However,beyondthenext50yearswearehighlyuncertainaboutthepreciselevelofrisk. Figure93 PopulationViabilityAnalysis(PVA)forGreenRiverwinter runsteelhead.seetextfordescription. 219
220 Figure94depictspopulationtrendsforPuyallupRiverwinter runsteelhead.steelhead countsinthepuyallupriverhavedeclinedsteadilysincethe1980s.theestimated probabilitythatthissteelheadpopulationwoulddeclineto10%ofitscurrentestimated abundance(i.e.,to29fish)ishigh about90%within25 30years.Withanestimated meanpopulationgrowthrateof 0.092(λ=0.912)andprocessvarianceof0.004,wecanbe highlyconfident(p<0.05)thata90%declineinthispopulationwillnotoccurwithinthe next15 20years(butwilloccurwithin40years),andthata99%declinewillnotoccur withinthenext30 40years(butwilloccurwithin80years).However,forintermediate periodsandothervaluesofdeclinewearehighlyuncertainaboutthepreciselevelofrisk. 220
221 Figure94 PopulationViabilityAnalysis(PVA)forPuyallupRiverwinter runsteelhead.seetextfordescription. Figure95depictspopulationtrendsforNisquallyRiverwinter runsteelhead.steelhead countsinthenisquallyriverdeclinedsteeplyinthe1980sand1990sandhaveremained lowsince.theestimatedprobabilitythatthissteelheadpopulationwoulddeclineto10%of itscurrentestimatedabundance(i.e.,to54fish)ishigh about80%within40years.with anestimatedmeanpopulationgrowthrateof 0.088(λ=0.916)andprocessvarianceof 0.070,wecanbehighlyconfident(P<0.05)thata90%declineinthispopulationwillnot occurwithinthenext6 8years,andthata99%declinewillnotoccurwithinthenext15 18 years.however,beyondthenext20yearswearehighlyuncertainaboutthepreciselevelof risk. 221
222 Figure95 PopulationViabilityAnalysis(PVA)forNisquallyRiverwinter runsteelhead.seetextfordescription. Figure96depictspopulationtrendsforWhiteRiverwinter runsteelhead.steelheadcounts inthewhiteriverhavedeclinedsteadilysincethe1980s.theestimatedprobabilitythat thissteelheadpopulationwoulddeclineto10%ofitscurrentestimatedabundance(i.e.,to 26fish)ishigh about90%within50years.withanestimatedmeanpopulationgrowth rateof 0.062(λ=0.940)andprocessvarianceof0.002,wecanbehighlyconfident(P< 0.05)thata90%declineinthispopulationwillnotoccurwithinthenext25years(butwill occurwithin60years),andthata99%declinewillnotoccurwithinthenext50 55years 222
223 (butwilloccurwithin100years).however,beyondthenext20yearswearehighly uncertainaboutthepreciselevelofrisk. Figure96 PopulationViabilityAnalysis(PVA)forWhiteRiverwinter runsteelhead.seetextfordescription. Figure97depictspopulationtrendsforSkokomishRiverwinter runsteelhead.thecounts havebeenespeciallylowsincethelate1990s.theestimatedprobabilitythatthissteelhead populationwoulddeclineto10%ofitscurrentestimatedabundance(i.e.,to35fish)is high about80%within80years.withanestimatedmeanpopulationgrowthrateof 0.037(λ=0.964)andprocessvarianceof0.019,wecanbehighlyconfident(P<0.05)that 223
224 a90%declineinthispopulationwillnotoccurwithinthenext20yearsandthata99% declinewillnotoccurwithinthenext40years.however,beyondthenext30 40yearswe areuncertainaboutthepreciselevelofrisk. Figure97 PopulationViabilityAnalysis(PVA)forSkokomishRiverwinter runsteelhead.seetextfor description. Figure98depictspopulationtrendsforEastHoodCanalwinter runsteelhead.steelhead countsineasthoodcanalshownocleartrendoverthetimeseries.theestimated probabilitythatthissteelheadpopulationwoulddeclineto10%ofitscurrentestimated abundance(i.e.,to22fish)isrelativelylow about30%within100years.withan 224
225 estimatedmeanpopulationgrowthrateof 0.002(λ=0.998)andprocessvarianceof0.052, wecanbehighlyconfident(p<0.05)thata90%declineinthispopulationwillnotoccur withinthenext10years,andthata99%declinewillnotoccurwithin30years.however, beyondabout30yearswearehighlyuncertainaboutthepreciselevelofrisk. Figure98 PopulationViabilityAnalysis(PVA)forEastHoodCanalwinter runsteelhead.seetextfor description. Figure99depictspopulationtrendsforWestHoodCanalwinter runsteelhead.steelhead countsinwesthoodcanalhaveshownanincreasingtrendsincethemid1990s.the estimatedprobabilitythatthissteelheadpopulationwoulddeclineto10%ofitscurrent 225
226 estimatedabundance(i.e.,to31fish)islow nearzerowithin100years.withan estimatedmeanpopulationgrowthrateof0.093(λ=1.097)andprocessvarianceof0.017, wecanbehighlyconfident(p<0.05)thata50%orgreaterdeclineinthispopulationwill notoccurwithinthenext100years. Figure99 PopulationViabilityAnalysis(PVA)forWestHoodCanalwinter runsteelhead.seetextfor description. Figure100depictspopulationtrendsforPortAngeleswinter runsteelhead.steelhead countsinportangeleshavedeclinedsharplysincethelate1990s.theestimated probabilitythatthissteelheadpopulationwoulddeclineto10%ofitscurrentestimated 226
227 abundance(i.e.,to11fish)ishigh nearly80%within100years.withanestimatedmean populationgrowthrateof 0.033(λ=0.968)andprocessvarianceof0.078,wecanbe highlyconfident(p<0.05)thata90%declineinthispopulationwillnotoccurwithinthe next8 10years,andthata99%declinewillnotoccurwithinthenext20years.However, beyondthenext20yearswearehighlyuncertainaboutthepreciselevelofrisk. Figure100 PopulationViabilityAnalysis(PVA)forPortAngeleswinter runsteelhead.seetextfordescription. Figure101depictspopulationtrendsforDungenessRiverwinter runsteelhead.the countshavebeenverylowandhavesteadilydeclinedsincetheearly1990s.theestimated probabilitythatthissteelheadpopulationwoulddeclineto10%ofitscurrentestimated 227
228 abundance(i.e.,to8fish)within100yearsishighbutcouldnotbecalculated.withan estimatedmeanpopulationgrowthrateof 0.096(λ=0.908)andprocessvarianceof< 0.001,wecanbehighlyconfident(P<0.05)thata90%declineinthispopulationwillnot occurwithinthenext20years(butwilloccurwithin30years),andthata99%declinewill notoccurwithinthenext40years(butwilloccurwithin55 60years).However,forother yearsandvaluesofdeclinewearelesscertainaboutthepreciselevelofrisk. Figure101 PopulationViabilityAnalysis(PVA)forDungenessRiverwinter runsteelhead.seetextfor description. Figure102depictspopulationtrendsforElwhaRiverwinter runsteelhead.thecounts declinedsharplyinthelate1980sandearly1990shavebeenverylowinrecentyears.the 228
229 estimatedprobabilitythattheelwhariversteelheadpopulationwoulddeclineto10%of itscurrentestimatedabundance(i.e.,to10fish)isfairlyhigh ~90%within40years. Withanestimatedmeanpopulationgrowthrateof 0.092(λ=0.912)andprocessvariance of0.013,wecanbehighlyconfident(p<0.05)thata90%declineinthispopulationwill notoccurwithinthenext8 10years(butwilloccurwithin70years),andthata99% declinewillnotoccurwithin25 30years(butmightoccurwithin years). However,forintermediateyearsandothervaluesofdeclinewearehighlyuncertainabout thepreciselevelofrisk. Figure102 PopulationViabilityAnalysis(PVA)forElwhaRiverwinter runsteelhead.seetextfordescription. 229
230 Figure103depictspopulationtrendsforToltRiversummer runsteelhead(theonly summer runpopulationforwhichreddcountdataareavailable).steelheadcountsinthe ToltRiverhavedeclinedsincethelate1990s.Theestimatedprobabilitythatthissteelhead populationwoulddeclineto10%ofitscurrentestimatedabundance(i.e.,to6fish)is high nearly80%within100years.withanestimatedmeanpopulationgrowthrateof 0.040(λ=0.961)andprocessvarianceof0.010,wecanbehighlyconfident(P<0.05)that a90%declineinthispopulationwillnotoccurwithinthenext8 10,andthata99%decline willnotoccurwithinthenext15 18years.However,beyondthenext20yearsweare highlyuncertainaboutthepreciselevelofrisk. Figure103 PopulationViabilityAnalysis(PVA)forToltRiversummer runsteelhead.seetextfordescription. 230
231 Summary ForallbutafewputativedemographicallyindependentpopulationsofsteelheadinPuget Sound,estimatesofmeanpopulationgrowthratesobtainedfromobservedspawneror reddcountsaredeclining typically3to10%annually andextinctionriskwithin100 yearsformostpopulationsinthedpsisestimatedtobemoderatetohigh,especiallyfor draftpopulationsintheputativesouthsoundandolympicmpgs.collectively,these analysesindicatethatsteelheadinthepugetsounddpsremainatriskofextinction throughoutallorasignificantportionoftheirrangeintheforeseeablefuture,butarenot currentlyindangerofimminentextinction. StatusandTrendsintheLimitingFactorsandThreatsFacingESU/DPS TheBiologicalReviewTeamidentifieddegradationandfragmentationoffreshwater habitat,withconsequenteffectsonconnectivity,asaprimarylimitingfactorandthreat facingthepugetsoundsteelheaddps.inthethreeyearssincelisting,thestatusofthis threathasnotchangedappreciably. Hatcheryreleases HatcheryreleasesofsteelheadinPugetSoundhaveremainedrelativelyconstantoverthe last20years,althoughreleasesofchinookandcohohavedeclined(figure104). 231
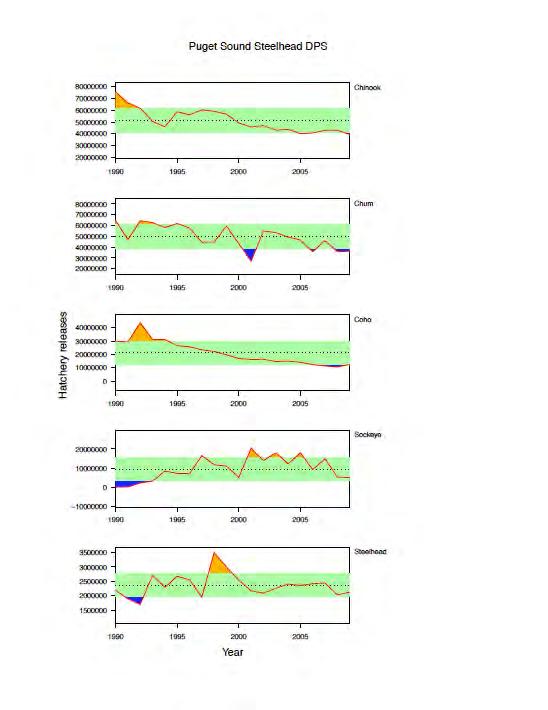
232 Figure104 SummaryofannualhatcheryreleaseswithinthespawningandrearingareasofthePugetSound steelheaddps.datasource:rmis. 232
233 Harvest PugetSoundsteelheadareimpactedinterminaltribalgillnetfisheriesandinrecreational fisheries.fisheriesaredirectedathatcherystocks,butsomeharvestofnaturalorigin steelheadoccursasincidentaltohatcherydirectedfisheries.winter runhatchery steelheadproductionisprimarilyofchamberscreek(southernpugetsound)stockwhich hasbeenselectedforearlierruntimingthannaturalstockstominimizefishery interactions.hatcheryproductionofsummersteelheadisprimarilyofskamaniariver(a lowercolumbiarivertributary)stockwhichhasbeenselectedforearlierspawntiming thannaturalsummersteelheadtominimizeinteractionsonthespawninggrounds.in recreationalfisheries,retentionofwildsteelheadisprohibited,soallharvestimpactsoccur astheresultofreleasemortalityandnon compliance.intribalnetfisheries,mostfishery impactsoccurinfisheriesdirectedatsalmonandhatcherysteelhead. MostPugetSoundstreamshaveinsufficientsufficientcatchandescapementdatato calculateexploitationratesfornaturalsteelhead.populationswithsufficientdatainclude theskagit,green,nisqually,puyallup,andsnohomishrivers(figure105).exploitation ratesdifferwidelyamongthedifferentrivers,butallhavedeclinedsincethe1970sand 1980s.Exploitationratesonnaturalsteelheadinrecentyearshavebeenstableand generallylessthan5%. 233
234 Figure105 TotalexploitationratesonnaturalsteelheadfromPugetSoundRivers.DatafromthePugetSound SteelheadHarvestManagementPlan,AppendixA(BobLeland,WDFW,personalcommunication. 234
235 Conclusions ThestatusofthelistedPugetSoundsteelheadDPShasnotchangedsubstantiallysincethe 2007listing.MostpopulationswithintheDPSareshowingcontinueddownwardtrendsin estimatedabundance,afewsharplyso. References Busby,P.J.,T.C.Wainwright,G.J.Bryant,L.Lierheimer,R.S.Waples,F.W.Waknitz,andI.V. Lagomarsino.1996.StatusreviewofWestCoaststeelheadfromWashington,Idaho, Oregon,andCalifornia.U.S.Dept.Commer.,NOAATech.Memo.NMFS NWFSC 27,261p. Hard,J.J.,J.M.Myers,M.J.Ford,R.G.Kope,G.R.Pess,R.S.Waples,G.A.Winans,B.A. Berejikian,F.W.Waknitz,P.B.Adams.P.A.Bisson,D.E.Campton,andR.R.Reisenbichler StatusreviewofPugetSoundsteelhead(Oncorhynchusmykiss).U.S.Dept.Commer., NOAATech.Memo.NMFS NWFSC 81,117p. Holmes,E.E.,andE.J.Ward.2010.Analysisofmultivariatetime seriesusingthemarss package.technicalreport,northwestfisheriessciencecenter,mathematicalbiology Program,June2010. RDCT(RDevelopmentCoreTeam).2009.R:ALanguageandEnvironmentforStatistical Computing.RFoundationforStatisticalComputing,Vienna,Austria.ISBN , Availableat: project.org. Ward,E.J.,H.Chirakkal,M.González Suárez,D.Aurioles Gamboa,E.E.Holmes,andL. Gerber.2010.Inferringspatialstructurefromtime seriesdata:usingmultivariatestatespacemodelstodetectmetapopulationstructureofcaliforniasealionsinthegulfof California,Mexico.J.Appl.Ecol.47:
236 236
237 LowerColumbiaRiverChinooksalmon 20 ListedESU/DPS TheESUincludesallnaturallyspawnedpopulationsofChinooksalmonfromtheColumbia RiveranditstributariesfromitsmouthatthePacificOceanupstreamtoatransitional pointbetweenwashingtonandoregoneastofthehoodriverandthewhitesalmonriver, andincludesthewillametterivertowillamettefalls,oregon. ESU/DPSBoundaryDelineation Utilizingnewinformation,theESUBoundariesReviewGroup(seeESUBoundaries above)undertookarevaluationoftheboundarybetweenalllowercolumbiaandmid ColumbiaESUsandDPSs.Thereviewconclusionsemphasizethetransitionalnaturethe boundarybetweenthelowercolumbiaesusandthemid ColumbiaESUs.After consideringnewdnadata,thereviewconcludes, Giventhetransitionalnatureofthe KlickitatRiverChinooksalmonpopulationitmightbereasonabletoassignthatpopulation tothelowercolumbiariverchinooksalmonesu. Thisstatusevaluationisbasedonthe existinglowercolumbiaesuboundariesthatdonotincludetheklickitatpopulation, however. SummaryofPreviousBRTConclusions NMFS reviewed the status of the Lower Columbia River Chinook salmon ESU initially in 1998 (Myers et al. 1998), updated it that same year (NMFS 1998a) and then conducted the most recent update in 2005 (NMFS 2005). In the 1998 update, the BRT noted several concerns for this ESU. The 1998 BRT was concerned that very few naturally self-sustaining populations of native Chinook salmon remained in the Lower Columbia River ESU. The 1998 BRT identified naturally reproducing (but not necessarily self-sustaining) populations: the Lewis and Sandy rivers bright fall runs and the tule fall runs in the Clackamas, East Fork Lewis, and Coweeman rivers. These populations were identified as the only bright spots in the ESU. The 1998 BRT did not consider the few remaining populations of spring run Chinook salmon in the ESU to be naturally self-sustaining because of either small size, extensive hatchery influence, or both. The 1998 BRT felt that the dramatic declines and losses of spring-run Chinook salmon populations in the Lower Columbia River ESU represented a serious reduction in life history diversity in the region. The team felt that the presence of hatchery Chinook salmon in this ESU posed an important threat to the persistence of the ESU and obscured trends in abundance of native fish. The team noted that habitat degradation and loss due to extensive hydropower development projects, urbanization, logging, and agriculture threatened the Chinook salmon spawning and rearing habitat in the lower Columbia River. A majority of the 1998 BRT concluded that the Lower Columbia River ESU was likely to become endangered in the foreseeable future. A minority felt that Chinook salmon in this ESU were not presently in danger of extinction, nor were they likely to become so in the foreseeable future. In the 2005 update, a majority of the BRT votes for the Lower Columbia River Chinook salmon ESU fell in the likely to become endangered category, with minorities falling in the danger of extinction and not likely to become endangered categories. The BRT was still concerned about all of the risk factors identified in the 1998 review. The WLC-TRT estimated 20 Sectionauthor:PaulMcElhany 237
238 that 8 to 10 historical populations in this ESU have been extirpated, most of them spring-run populations. Near loss of that important life history type remained an important BRT concern. Although some natural production appeared to occur in 20 or so populations, only one exceeded 1,000 spawners. High hatchery production continued to pose genetic and ecological risks to natural populations and to mask their performance. Most populations in this ESU had not seen as pronounced increases in recent years as occurred in many other geographic areas. SummaryofRecentEvaluations AreportonthepopulationstructureofLowerColumbiasalmonandsteelhead populationswaspublishedbythewlc TRTin2006(Myersetal.2006).TheChinook populationdesignationsinthatreport(figure106andfigure107)areusedinthisstatus updateandwereusedforstatusevaluationsinrecentrecoveryplansbyodfwandlcfrb. LCRChinookpopulationsexhibitthreedifferentlifehistorytypesbaseonreturntiming andotherfeatures:fallrun(a.k.a. tules),latefallrun(a.k.a. brights )andspringrun. In2010,ODFWcompletedarecoveryplanthatincludedOregonpopulationsof LowerColumbiaChinookESU.Alsoin2010,theLCFRBcompletedarevisionofitsrecovery planthatincludeswashingtonpopulationsoflowercolumbiachinook.bothofthese recoveryplansincludeanassessmentofcurrentstatusoflcrchinookpopulations.these assessmentsreliedandbuiltupontheviabilitycriteriadevelopedbythewlc TRT (McElhanyetal2006)andanearlierevaluationofOregonWLCpopulations(McElhanyet al.2007).theseevaluationsassessedthestatusofpopulationswithregardtothevsp parametersofabundanceandproductivity,spatialstructureanddiversity(mcelhanyetal. 2000).TheresultsoftheseanalysesareshowninFigure108 Figure110. Theseanalysesindicatethatforallbutoneofthe21fallChinookpopulationsare mostlikelyinthe veryhighrisk category(alsodescribedas extirpatedornearlyso ). Veryhighrisk isbroadcategoryrangingfrom100%extinctionprobability(already extirpated)to60%probabilityofextinctionin100years(table66).theclatskaniefall Chinookpopulationwasdesignatedmostlikelyinthe highrisk category,butwith substantialpossibilityoffallinginthe veryhighrisk category.oftheninespringchinook populations,eightaremostlikelyat veryhighrisk.thesandyspringchinookwas consideredmostlikelyinthe moderate to high riskrange.thelatefalllifehistory(two populations)wasconsideredthestrongestintheesuwiththelewislatefallpopulation mostlikelyinthe verylowrisk categoryandthesandylatefallpopulationmostlikelyin the lowrisk category. 238
239 Table66 Populationpersistencecategories(fromMcElhanyetal2006). In addition to the recovery plans, two analyses of Lower Columbia fall Chinook have been conducted to inform Biological Opinions related to harvest (Ford et al. 2007, NWFSC 2010). The NWFSC 2010 analysis used a life-cycle modeling approach to estimate how six of the populations targeted by recovery planners for high viability might respond with various recovery scenarios involving harvest, hatchery and habitat changes. The analysis results can be summarized by the first paragraph of the report s discussion section describing current viability: Oneoftheclearestresultsofthismodelingeffortisthestrikingdifferencein apparentviabilityamongthesixpopulationswemodeled.threepopulations Lewis, Coweeman, and Washougal are relatively large and have low estimated risks of quasi extinction under a variety of the scenarios we explored, at least at harvest rates below ~30%. Three other populations Clatskanie, Elochoman and Scappoose appear to be sustained mostly throughhatcherystrayingundercurrentconditions,andarepredictedtobe self sustainingunderthe recovery actionsmodeledonlyatverylowharvest rates.thehoodandmagpopulationswereintermediatebetweenthesetwo cases and could sustain themselves without hatchery input at low harvest ratesundercurrentconditionsandundersomemodeledassumptionsbutnot others. This basic result that the populations differ markedly in their current status and ability to sustain harvest is consistent with previous modelingefforts. Theseresultsprovideamorenuancedviewoftulestatusthanisimpliedbythenearuniform veryhighrisk designationoftherecoveryplans. 239
240 Figure106 Historical LCR fall and late fall Chinook populations (From Myers et al. 2006). 240
.")
241 Figure107 Historical LCR spring Chinook populations (From Myers et al. 2006). 241
,theolderratingisshownasanopendiamondwithadashedoutline.ReproducedfromODFW(2010). 242")
242 Figure108 ExtinctionriskratingsforLCRChinookpopulationsinOregonfortheassessmentattributes abundance/productivity,diversity,andspatialstructureaswellasanoverallratingforpopulationsthat combinesthethreeattributeratings.whereupdatedratingsdifferfromthosepresentedbymcelhanyetal. (2007),theolderratingisshownasanopendiamondwithadashedoutline.ReproducedfromODFW(2010). 242
.")
243 Figure109 CurrentstatusofWashingtonLCRfall( tule )ChinookpopulationsfortheVSPparametersand overallpopulationrisk.(lcfrb2010recoveryplan,chapter6).apopulationscoreofzeroindicatesapopulation extirpatedornearlyso,ascoreof1ishighrisk,2ismoderaterisk,3islowrisk( viable )and4isverylowrisk. 243
and4isverylowrisk.")
244 Figure110 CurrentstatusofWashingtonLCRspringChinookandlatefall( bright )Chinookpopulationsfor thevspparametersandoverallpopulationrisk.(lcfrb2010recoveryplan,chapter6).apopulationscoreof zeroindicatesapopulationextirpatedornearlyso,ascoreof1ishighrisk,2ismoderaterisk,3islowrisk ( viable )and4isverylowrisk. NewDataandAnalyses The2005BRTstatusevaluationincludedabundancedataformostLCRChinook populationsuptotheyear2001.forthecurrentevaluation,wehavecompileddata through2008or2009formostpopulations,thoughdataareavailablefortwopopulations (ClatskaniefallandSandylatefall)onlythrough2006.TrenddataarepresentedinFigure 111 Figure114,withstatisticalsummaryintheAppendix.Sincethelaststatus evaluations,allofthepopulationsincreasedinabundanceduringtheearly2000 sbuthave sincedeclinedbacktoaboutthelevelsseenin2000.anexceptionisthesandyspring Chinook,whichdeclinedfromtheearly2000levels,butarestillhigherthan2000.In general,thepopulationsdonotshowanydramaticchangesinabundanceorfractionof hatcheryoriginspawnerssincethe2005brtevaluation. 244
lineindicatestotalnaturalspawners(includingnaturally spawninghatcheryfish).")
245 Figure111 EstimatedspawningabundancefortheCoastalmajorpopulationgroup(stratum).Thedarkline indicatesnaturaloriginspawnernumbers,light(red)lineindicatestotalnaturalspawners(includingnaturally spawninghatcheryfish).thedottedlineisthelong term(wholetimeseries)meanofthetotalspawners,andthe greenshadedareaindicates+/ 1standarddeviationaroundthemean. 245
lineindicatestotalnaturalspawners(including naturallyspawninghatcheryfish).")
246 Figure112 EstimatedspawningabundancefortheCascadefallandspringmajorpopulationgroup(strata).The darklineindicatesnaturaloriginspawnernumbers,light(red)lineindicatestotalnaturalspawners(including naturallyspawninghatcheryfish).thedottedlineisthelong term(wholetimeseries)meanofthetotal spawners,andthegreenshadedareaindicates+/ 1standarddeviationaroundthemean. 246
lineindicatestotalnaturalspawners (includingnaturallyspawninghatcheryfish).")
247 Figure113 EstimatedspawningabundancefortheCascadefallandspringmajorpopulationgroup(strata) (cont).thedarklineindicatesnaturaloriginspawnernumbers,light(red)lineindicatestotalnaturalspawners (includingnaturallyspawninghatcheryfish).thedottedlineisthelong term(wholetimeseries)meanofthe totalspawners,andthegreenshadedareaindicates+/ 1standarddeviationaroundthemean. 247
lineindicatestotalnaturalspawners(including naturallyspawninghatcheryfish).")
248 Figure114 EstimatedspawningabundancefortheGorgefallrunmajorpopulationgroup(stratum).Thedark lineindicatesnaturaloriginspawnernumbers,light(red)lineindicatestotalnaturalspawners(including naturallyspawninghatcheryfish).thedottedlineisthelong term(wholetimeseries)meanofthetotal spawners,andthegreenshadedareaindicates+/ 1standarddeviationaroundthemean. Harvest LowerColumbiaRiverChinooksalmonincludethreedistinctcomponents:springrunChinook,tulefallChinook,andbrightfallChinook.Thesedifferentcomponentsare subjecttodifferentin riverfisheriesbecauseofdifferencesinriverentrytiming,butshare similaroceandistributions.becauseofthistheyhavesimilarpatternsofexploitation.all sawadropinexploitationratesintheearly1990swithamodestincreasesincethen (Figure115).Fisheryimpactrateshavebeenrelativelystableinthepastfewyears,with theexceptionofthebrightfallcomponentoftheesu.thetuleportionoftheesuhave beensubjecttoseveraldetailedmodelingeffortsaimedatevaluatingtheviabilityimpacts ofalternativeexploitationrates(fordetal.2007,nwfsc2010). 248

249 Figure115 TotalexploitationratesonthethreecomponentsoftheLowerColumbiaRiverChinookESU.Data fortulefallchinookfromexploitationrateanalysisofaggregatetulestockmadeupoftagcodesfromthebig Creek,Cowlitz,Kalama,andWashougalhatcheries.DataforbrightfallChinookfromtheCTCexploitationrate analysis(ctcinprep).dataforspringchinookfromctcmodelcalibrationforcowlitzspringchinook(ctcin prep.)foroceanimpactsandtacrunreconstructiondataforin riverimpacts(cindlylefleur,wdfw,personal communication). Hatcheries TotalhatcheryreleasesofallChinooklife historiesinthelcresuhavebeen relativelystablesincethelaststatusreviewupdate(figure116).althoughrecoveryplans callformultipleactionstothereducetheimpactofhatcheryfishonthelcrchinookesu, provisionsintheplanshaveyettobeimplimentedforallpopulationsandhatcheryfishstill remainasignificantriskfactorinthisesu. Figure116 TotalChinookhatcheryreleasesintheLCRESU.Dottedlineindicatesthemean,andtheshaded areathestandarddeviations.source:rmis. 249
250 LowerColumbiaRiverChinooksalmon:UpdatedRiskSummary ThreestatusevaluationsofLCRChinookstatus,allbasedonWLC TRTcriteria,have beenconductedsincethelastbrtstatusupdatein2005(mcelhanyetal.2007,odfw 2010,LCFRB2010).AllthreeevaluationsconcludedthattheESUiscurrentlyatveryhigh riskofextinction.ofthe32historicalpopulationsintheesu,28areconsideredextirpated oratveryhighrisk.basedontherecoveryplananalyses,allofthetulepopulationsare consideredveryhighriskexceptonethatisconsideredathighrisk.themodeling conductedinassociationwithtuleharvestmanagementsuggeststhatthreeofthe populations(coweeman,lewisandwashougal)areatasomewhatlowerrisk.however, eventhesemoreoptimisticevaluationssuggestthattheremaining18populationsareat substantialriskbecauseofverylownaturaloriginspawnerabundance(<100/population), highhatcheryfraction,habitatdegradationandharvestimpacts. SpringChinookpopulationsremaincut offfromaccesstoessentialspawning habitatbyhydroelectricdams.projectstoallowaccesshavebeeninitiatedinthecowlitz andlewissystemsbutthesearenotclosetoproducingself sustainingpopulations.the SandyspringChinookpopulation,withoutamainstemdam,isconsideredatmoderaterisk andistheonlyspringchinookpopulationnotconsideredextirpatedornearlyso.thehood Rivercurrentlycontainsanout of ESUhatcherystock.Thetwolatefallpopulations,Lewis andsandy,aretheonlypopulationsconsideredatloworverylowrisk.theycontain relativelyfewhatcheryfishandhavemaintainedhighspawnerabundances(especially Lewis)sincethelastBRTevaluation.Overall,thenewinformationconsidereddoesnot indicateachangeinthebiologicalriskcategorysincethetimeofthelastbrtstatusreview. References Ford,M.J.,N.J.Sands,P.McElhany,K.R.G.,D.Simmons,andP.Dygert.2007.Analysesto SupportaReviewofanESAJeopardyConsultationonFisheriesImpactingLower ColumbiaTuleChinookSalmon..inN.F.S.C.NationalMarineFisheriesService, ConservationBiologyDivision;NationalMarineFisheriesService,Northwest RegionalOffice,SustainableFisheriesDivision,editor. Good,T.P.,R.S.Waples,andP.Adams,editors.2005.Updatedstatusoffederallylisted ESUsofWestCoastsalmonandsteelhead.U.S.DepartmentofCommerce,Seattle. LowerColumbiaFishRecoveryBoard.2010.WashingtonlowerColumbiasalmonrecovery andfishandwildlifesubbasinplan.lowercolumbiafishrecoveryboard,olympia, WA. McElhany,P.,C.Busack,M.Chilcote,S.Kolmes,B.McIntosh,J.M.Myers,D.Rawding,A. Steel,C.Steward,D.Ward,T.Whitesel,andC.Willis.2006.Revisedviabilitycriteria forsalmonandsteelheadinthewillametteandlowercolumbiabasins.report, NOAANorthwestFisheriesScienceCenter,Seattle. McElhany,P.,M.Chilcote,J.M.Myers,andR.Beamesderfer.2007.ViabilitystatusofOregon salmonandsteelheadpopulationsinthewillametteandlowercolumbiabasins. NOAA NorthwestFisheriesScienceCenter,Seattle,WA. 250
251 McElhany,P.,M.H.Ruckelshaus,M.J.Ford,T.C.Wainwright,andE.P.Bjorkstedt Viablesalmonidpopulationsandtherecoveryofevolutionarilysignificantunits. TechnicalMemorandumNMFS NWFSC 42,NOAA,Seattle. Myers,J.M.,C.Busack,D.Rawding,A.R.Marshall,D.J.Teel,D.M.VanDoornik,andM.T. Maher.2006.HistoricalpopulationstructureofPacificsalmonidsintheWillamette RiverandlowerColumbiaRiverbasins.NMFS NWFSC 73,NOAANWFSC,Seattle, WA. Myers,J.M.,R.G.Kope,G.J.Bryant,D.J.Teel,L.J.Lierheimer,T.C.Wainwright,W.S.Grant, F.W.Waknitz,K.Neely,S.T.Lindley,andR.S.Waples.1998.Statusreviewof ChinooksalmonfromWashington,Idaho,Oregon,andCalifornia.Tech.Memo. NMFS NWFSC 35,U.S.Dept.Commer,NOAA. NMFS.1998.Endangeredandthreatenedspecies:ThreatenedstatusfortwoESUsof steelheadinwashington,oregon,andcalifornia.[docketno , 19March1998].Page13347.FederalRegister. NWFSC.2010.LowerColumbiaRivertuleChinooksalmonlife cyclemodeling.northwest FisheriesScienceCenter. OregonDepartmentofFishandWildlife,R.Beamesderfer,L.Berg,M.Chilcote,J.Firman,E. Gilbert,K.Goodson,D.Jepsen,T.Jones,S.Knapp,C.Knutsen,K.Kostow,B.McIntosh, J.Nicholas,J.Rodgers,T.Stahl,andB.Taylor.2010.LowerColumbiariver conservationandrecoveryplanfororegonpopulationsofsalmonandsteelhead. OregonDepartmentofFishandWildlife,Salem,OR. 251
252 UpperWillametteRiverChinooksalmon 21 ListedESU/DPS TheESUincludesallnaturallyspawnedpopulationsofspring runchinooksalmoninthe ClackamasRiverandintheWillametteRiver,anditstributaries,aboveWillametteFalls, Oregon,aswellassevenartificialpropagationprograms:theMcKenzieRiverHatchery (OregonDepartmentofFishandWildlife(ODFW)stock#24),MarionForks/NorthFork SantiamRiver(ODFWstock#21),SouthSantiamHatchery(ODFWstock#23)intheSouth ForkSantiamRiver,SouthSantiamHatcheryintheCalapooiaRiver,SouthSantiam HatcheryintheMollalaRiver,WillametteHatchery(ODFWstock#22),andClackamas hatchery(odfwstock#19)spring runchinookhatcheryprograms. ESU/DPSBoundaryDelineation TheESUBoundariesReviewGroup(seeESUBoundariesabove)didnotidentifyany newinformationsuggestingarevaluationoftheuwspringchinookesu.thisstatus evaluationwasconductedbasedonexistingesuboundaries. SummaryofPreviousBRTConclusions NMFS reviewed the status of the Upper Willamette River Chinook salmon ESU initially in 1998 (Myers et al. 1998) and updated it that same year (NMFS 1998). The most recent status review update was in 2005 (Good et al. 2005). In the 1998 update, the BRT noted several concerns for this ESU. The 1998 BRT was concerned about the few remaining populations of spring-run Chinook salmon in the Upper Willamette River ESU, and the high proportion of hatchery fish in the remaining runs. The 1998 BRT noted with concern that the Oregon Department of Fish and Wildlife (ODFW) was able to identify only one remaining naturally reproducing population in this ESU, the spring-run Chinook salmon in the McKenzie River. The 1998 BRT was concerned about severe declines in short-term abundance that occurred throughout the ESU, and that the McKenzie River population had declined precipitously, indicating that it may not be self-sustaining. The 1998 BRT also noted that the potential for interactions between native spring-run and introduced fall-run Chinook salmon had increased relative to historical times due to fall-run Chinook salmon hatchery programs and the laddering of Willamette Falls. The 1998 BRT partially attributed the declines in spring-run Chinook salmon in the Upper Willamette River ESU to the extensive habitat blockages caused by dam construction. A majority of the 1998 BRT concluded that the Upper Willamette River Chinook salmon ESU was likely to become endangered in the foreseeable future. A minority of 1998 BRT members felt that Chinook salmon in this ESU were not presently in danger of extinction, nor were they likely to become so in the foreseeable future. The 2005 BRT considered updated abundance information, habitat accessibility analyses and the results of preliminary WLC-TRT analyses. These analyses supported previous BRT conclusions that the majority of populations in the ESU are likely extirpated or nearly so and that excessive numbers of hatchery and loss of access to historical habitat are important risk factors. The McKenzie River population was the only population identified as potentially self-sustaining and increases in abundance were noted for this population in the most recent returns available at the time (2000 and 2001). However, BRT was concern about the long-term potential for this 21 Sectionauthor:PaulMcElhany 252
253 population. The majority (70%) of the 2005 BRT votes fell in the likely to become endangered category, with a minority in the in danger of extinction and the not likely to become endangered categories. Summary of Recent Evaluations AreportonthepopulationstructureofLowerColumbiaandWillamettesalmonand steelheadpopulationswaspublishedbythewlc TRTin2006(Myersetal.2006).TheUW SpringChinookpopulationdesignationsinthatreport(Figure117)areusedinthisstatus updateandwereusedforstatusevaluationsinarecentrecoveryplanbyodfw(2010). AdraftrecoveryplanforUWChinookandSteelheadwasreleasedforcommentby ODFWin2010.ThestatusevaluationintheODFWrecoveryplanprovidedanupdateofthe statusevaluationofmcelhanyetal.(2007),whichreliedonmethodsandviabilitycriteria developedbythewlc TRT(McElhanyetal.2006).TheresultsoftheMcElhanyetal. (2007)evaluationaresummarizedinFigure118.Theseresultsindicatethattheoverall statusofallpopulationsexcepttheclackamasandmckenziefallinthe veryhighrisk category(alsocalled extirpatedornearlyso).themcelhanyetal(2007)analysisfound thattheclackamaspopulationismostlikelyinthe lowrisk category(thoughwith substantialuncertainty)andthemckenziepopulationmostlikelyinthemoderaterisk category.theodfwrecoveryplanupdateanalysis(2010)foundtheclackamaspopulation mostlikelyinthemoderateriskcategoryandthemckenziemostlikelyinthelowrisk category.themcelhanyetal.analysisandtheodfwanalysesbothusedabundancedata onthemckenzieforyears FortheClackamasanalyses,McEhanyetal.used abundancedataforyears ,whereasODFWuseddataforyears BasedonthestatusofthecomponentpopulationsineithertheMcElhanyetalor ODFWanalyses,theoverallstatusoftheentireESUwasdeterminedtobesubstantially belowtheviabilitycriteriaestablishedbythewlc TRT.Usinga0 4populationviability scale(table67),thewlc TRTcriteriarequireaviableESUtohaveaveragepopulation scoregreaterthan2.25.theaveragefortheuwspringchinookesuwasestimatedat0.71. ThemainfactorscontributingtothehighriskdeterminationforthisESUwerethelow abundanceofnaturaloriginspawners,highfractionofhatcheryoriginspawners(>90%in mostpopulations)andlackofaccesstotheprimaryspawninghabitat.additionalfactors citedincludeahighincidenceofpre spawningmortalityandincreasedhuman developmentintheentirewillamettebasin. 253
254 Figure117 UpperWillamettespringChinookpopulations(fromMyersetal2006). 254
.")
255 Figure118 Status evaluation for UW spring Chinook populations (McElhany et al 2007). 255
consideredtohavesomenaturalproduction.")
256 Table67 Populationpersistencecategories(fromMcElhanyetal2006). NewDataandAnalysis Clackamas TheClackamasRivercontainsoneoftwopopulationintheESU(alongwiththe McKenzie)consideredtohavesomenaturalproduction.Themajorityofnaturalproduction intheclackamasoccursupstreamofthenorthforkdam,thoughthereissomespawning, primarilybyhatcheryoriginfish,downstreamofthedam.since2001,onlyfishwithouta hatcherymarkhavebeenpassedabovenorthforkdam,though,duetoincomplete markingoridentification,somefishclassifiedasunmarkedandpassedoverthedamare actuallyofhatcheryorigin.the2005brtstatusevaluationincludedabundancedatafor theclackamasspringchinookpopulationfortheyears Themostrecent abundancetimeseriesfortheclackamasriverpopulationcombinesthedataintheodfw 2010FMEPreportwithdatafromPortlandGeneralElectric(2010)(Figure119).Summary statisticsforthispopulationareincludedintheappendix.whenthebrtconsideredthis populationin2005,thepopulationwasatthebeginningofwhatturnedouttobeavery short termincreaseinabundance.afterapeakofover12,000returnstothenorthfork Damin2004,thereturnatthedamhasdroppedtoabout2,000.Thegeometricmean numberofnaturaloriginspawnersforthelastfiveyearsis850fish. 256
257 Figure119 ClackamasRiverSpringChinookabundanceestimates.The NFcount isthetotalnumberof ChinookcountedattheNorthForkDam.Since2001,allhatcheryfishreturnshavebeenmarkedwithanadipose finclip.onlyunmarkedfishhavebeenpassedabovenorthforkdam.thecountofunmarkedfishpassedover thedamareshownintheserieslabeled NFunmarked(passed).Studieshaveshownthatbecauseofincomplete marking,onlyabout72%oftheunmarkedfishpassedovernorthforkdamareactuallyofnaturalorigin (labeled NFNat.Or. inthefigure).themajorityofspringchinookspawningoccursabovenorthforkdam,but somespawningisestimatedbelowthedam(labeled SpawnbelowNF ).ThemajorityofthesebelowNorthForks spawnersarelikelyofhatcheryorigin.the Totalpotentialspawners arethefishpassedabovenorthforkdam plustheestimatednumberoffishspawningbelowthedam.datafor arefromODFW2010FMEP report.datafor2010arefromthepgefishcountdatabase ( ult.aspx).notethatthepgedataonlyincludethecountuptoseptember9,2010.peakreturnatnorthforkdam occursmay JulybutthetailofthereturnextendsintoOctober,sothefinalcountfor2010maybeslightlyhigher thanshownhere. WillametteFalls ExceptthosereturningtotheClackamasRiver,allofthefishinthisESUarecounted atwillamettefalls(figure120).thecountdoesnotidentifywhetherreturningchinook areofhatcheryornaturalorigin,butspawninggroundsurveysinwillamettetributaries indicatethatthevastmajorityoffishareofhatcheryorigin.theprimarysourceof naturallyproducespringchinookabovewillamettefallsisthemckenzieriverpopulation upstreamofleaburgdam.figure120showsboththewillamettefallscount(averaging about40,000fish)andtheestimatednumberofunmarked(mostlynaturalorigin) spawnersaboveleaburgdam(averagingabout2,000fish). 257
258 Figure120 WillametteFallstotalspringChinookcount(blueline includesnaturalandhatcheryorigin)and thecountofunmarkedfishatleaburgdamonthemckenzie(redline unmarkedfishareabout70%natural origin).willamettefallsdatafromodfwonlinedatabase ( (2010). McKenzieRiver TheMcKenzieRivercontainsoneoftwopopulations(alongwiththeClackamas) withsomelevelofnaturalproduction.themajorityofnaturaloriginspawningoccurs aboveleaburgdamandinrecentyears,managershavelimitedthepassageofhatchery markedfishabovethedam.the2005brtstatusevaluationincludedabundancedatafor themckenziespringchinookpopulationfortheyears Themostrecent abundancetimeseriesfortheclackamasriverpopulationcombinesthedataintheodfw 2010FMEPreportwithdatafromtheODFWonlinedatabase(Figure121andFigure122). Dataacquiredsincethe2005BRTreportshowinincreaseinabundancepeakingin2004 thatassincedroppedandhascurrentlyreturnedtopreviouslevelsofalittlemorethan 1,000unmarkedfishatLeaburg. ItisinterestingtonotethattheincreaseinreturnsatWillametteFallsobservedin 2010isnotreflectedbyanincreaseinabundanceofnaturaloriginspawnersinthe McKenzie.TheMcKenzieabundanceremainsflatin2010,thoughitdidfollowtheincrease thatpeakedin2004.thismaysignalafailureofthenaturalpopulationtorespondto increasedoceansurvivals,butitisonlyasingledatapointandtheremultiplefactorsat playthathavenotyetbeencompletelyevaluated. 258
259 Figure121 McKenzieRiverspringChinookabundanceestimates.The LeaburgDamCount isthetotalnumber ofchinookcountedatleaburgdam.thecountwithoutahatcherymark(finclip)areshownintheseries labeled Leaburgunmarked.Studieshaveshownthatbecauseofincompletemarking,onlyafractionofthe unmarkedfishareactuallyofnaturalorigin(e.g..only72%ofunmarkedfishintheclackamasareofnatural origin).themajorityofspringchinookspawningoccursaboveleaburgdam,butsomespawningisestimated belowthedam(labeled SpawnersbelowLeaburg ).ThemajorityofthesebelowLeaburgspawnersarelikelyof hatcheryorigin.the Totalpotentialspawners arethefishcountedatleaburgplustheestimatednumberof fishspawningbelowthedam.datafor arefromODFW2010FMEPreport.The2010Leaburgcounts arefromtheodfwfishcountonlinedatabase (( 259
260 Figure122 Naturalorigin(lowerblackline)andtotalspawner(upperredline)estimatesfortheMcKenzie riverbasedontherunreconstructioninodfw2010fmepreport.estimatesdifferfromthoseshowninfigure 121becauseofdifferentextrapolationassumptions. Otherpopulations(Mollala,NorthSantiam,SouthSantiam,Calapooia,MiddleFork) The2005BRTanalysisreportedthatnearlyallthefishreturningandspawningin thesepopulationsareofhatcheryorigin.theanalysisofhatcheryfractiondatacollected sincethe2005brtreportsupporttheviewthatthesepopulationsarehatcherydominated andlikelynotself sustaining(schroederetal.2005,mcelhanyetal.2007,schroederetal. 2007,ODFW2010b).Inaddition,thesepopulationsappeartobeexperiencingsignificant risksfrompre spawningmortality(schroederetal.2005,mcelhanyetal.2007,schroeder etal.2007). Harvest UpperWillametteRiverspringChinookaretakeninoceanfisheriesprimarilyin CanadaandAlaska.TheyarealsotakeninlowermainstemColumbiaRivercommercial gillnetfisheries,andinrecreationalfisheriesinthemainstemcolumbiariverandthe WillametteRiver.Thesefisheriesaredirectedathatcheryproduction,buthistorically couldnotdiscriminatebetweennaturalandhatcheryfish.inthelate1990sodfwbegan mass markingthehatcheryproduction,andrecreationalfisherieswithinthewillamette Riverswitchedovertoretentionofonlyhatcheryfish,withmandatoryreleaseof unmarkedfish.overallexploitationratesreflectthischangeinfisheriesdroppingfromthe 50% 60%rangeinthe1980sandearly1990stoaround30%since2000(Figure123). 260
261 Figure123 TotalexploitationratesonWillametteRiverSpringChinook.DatafromCTC(inprep)exploitation rateanalysisforoceanimpacts,fromtac(2010)forinriverimpactsfrom ,andChrisKern,ODFW, personalcommunicationfor Hatcheries Since1995,totalspringChinookhatcheryproductionhasremainedrelatively constantintheupperwillametteatabout5millionsmolts(figure124).asnotedabove themajoritiyofpopulationsaredominatedhatcheryoriginspawners.nomajorhacthery productionchangeshavebeennotedsincethelast(2005)brtreport. 261
.")
262 Figure124 HatcheryreleasesofChinook,cohoandSteelheadintheareaoftheUpperWillametteChinookESU. Dottedlinesindicatethemeans,shadedareasthestandarddeviations.Datasource:RMIS. UpperWillametteChinooksalmon:UpdatedRiskSummary TworelatedstatusevaluationsofUWChinookhavebeenconductedsincethelast BRTstatusupdatein2005(McElhanyetal.2007,ODFW2010).Bothevaluationswere basedonthewlc TRTviabilitycriteriaandbothconcludedthattheESUiscurrentlyat veryhighriskofextinction.ofthesevenhistoricalpopulationsintheesu,fiveare consideredatveryhighrisk.theremainingtwo(clackamasandmckenzie)areconsidered atmoderatetolowrisk.newdatacollectedsincethelastbrtreporthaveverifiedthehigh fractionofhatcheryoriginfishinallofthepopulationsallintheesu(eventheclackamas andmckenziehavehatcheryfractionsabovewlc TRTviabilitythresholds).Thenewdata havealsohighlightedthesubstantialrisksassociatedwithpre spawningmortality. Althoughrecoveryplansaretargetingkeylimitingfactorsforfutureactions,therehave beennosignificanton the ground actionssincethelastbrtreporttoresolvethelackof accesstohistoricalhabitatabovedamsnorhavetherebeensubstantialactionsremoving hatcheryfishfromthespawninggrounds.overall,thenewinformationconsidereddoes notindicateachangeinthebiologicalriskcategorysincethetimeofthelastbrtstatus review. References 262
263 Good,T.P.,R.S.Waples,andP.Adams,editors.2005.Updatedstatusoffederallylisted ESUsofWestCoastsalmonandsteelhead.U.S.DepartmentofCommerce,Seattle. McElhany,P.,C.Busack,M.Chilcote,S.Kolmes,B.McIntosh,J.M.Myers,D.Rawding,A. Steel,C.Steward,D.Ward,T.Whitesel,andC.Willis.2006.Revisedviabilitycriteria forsalmonandsteelheadinthewillametteandlowercolumbiabasins.report, NOAANorthwestFisheriesScienceCenter,Seattle. McElhany,P.,M.Chilcote,J.M.Myers,andR.Beamesderfer.2007.ViabilitystatusofOregon salmonandsteelheadpopulationsinthewillametteandlowercolumbiabasins. NOAA NorthwestFisheriesScienceCenter,Seattle,WA. Myers,J.M.,C.Busack,D.Rawding,A.R.Marshall,D.J.Teel,D.M.VanDoornik,andM.T. Maher.2006.HistoricalpopulationstructureofPacificsalmonidsintheWillamette RiverandlowerColumbiaRiverbasins.NMFS NWFSC 73,NOAANWFSC,Seattle, WA. Myers,J.M.,R.G.Kope,G.J.Bryant,D.J.Teel,L.J.Lierheimer,T.C.Wainwright,W.S.Grant, F.W.Waknitz,K.Neely,S.T.Lindley,andR.S.Waples.1998.Statusreviewof ChinooksalmonfromWashington,Idaho,Oregon,andCalifornia.Tech.Memo. NMFS NWFSC 35,U.S.Dept.Commer,NOAA. NMFS.1998.Endangeredandthreatenedspecies:ThreatenedstatusfortwoESUsof steelheadinwashington,oregon,andcalifornia.[docketno , 19March1998].Page13347.FederalRegister. ODFW.2010a.Fisheriesmanagementandevaluationfor2009WillametteRiverspring Chinook.inO.D.o.F.a.Wildlife,editor. ODFW.2010b.UpperWillametteconservationandrecoveryplanforChinookand steelhead(draftfebruary23,2010)oregondepartmentoffishandwildlife. Schroeder,R.K.,K.R.Kenaston,andL.K.Krentz.2005.SpringChinooksalmoninthe WillametteandSandyRivers.OregonDepartmentofFishandWildlife,Corvalis,OR. Schroeder,R.K.,K.R.Kenaston,andL.K.McLaughlin.2007.SpringChinooksalmoninthe WillametteandSandyRivers(AnnualProgressReport).inO.D.o.F.a.Wildlife, editor. 263
264 ColumbiaRiverchumsalmon 22 ListedESU/DPS TheESUincludesallnaturallyspawnedpopulationsofchumsalmoninthe ColumbiaRiveranditstributariesinWashingtonandOregon,aswellasthreeartificial propagationprograms:thechinookriver(searesourceshatchery),graysriver,and WashougalRiver/DuncanCreekchumhatcheryprograms. SummaryofPreviousBRTConclusions NMFS provided an updated status report on the Columbia River chum salmon ESU in 1999 (NMFS 1999). As documented in the 1999 report, the previous BRT s were concerned about the dramatic declines in abundance and contraction in distribution from historical levels. Previous BRTs were also concerned about the low productivity of the extant populations, as evidenced by flat trend lines at low population sizes. A majority of the 1999 BRT concluded that the Columbia River chum salmon ESU was likely to become endangered in the foreseeable future, and a minority concluded that the ESU was currently in danger of extinction. The most recent status update for CR chum was in 2005(Good et al. 2005). In the 2005 BRT, nearly all votes for the Columbia River chum salmon ESU fell in the likely to become endangered (63%) or danger of extinction (34%) categories. The BRT had substantial concerns about every VSP element. Most or all risk factors the BRT previously identified remain important concerns. The WLC-TRT estimated that close to 90% of this ESU s historical populations are extinct or nearly so, resulting in loss of much diversity and connectivity between populations. The 2005 BRT was concerned that populations that remained are small, and overall abundance for the ESU was low. The ESU had shown low productivity for many decades, even though the remaining populations were at low abundance and density-dependent compensation might be expected. The BRT was encouraged that unofficial reports for 2002 suggested a large increase in abundance in some (perhaps many) locations, but was unclear on the cause of the increase and whether it would be sustaining for multiple years. SummaryofRecentEvaluations AreportonthepopulationstructureofLowerColumbiasalmonandsteelhead populationswaspublishedbythewlc TRTin2006(Myersetal.2006).Thechum populationdesignationsinthatreport(figure125)areusedinthisstatusupdateandwere usedforstatusevaluationsinrecentrecoveryplansbyodfwandlcfrb. In2010,ODFWcompletedarecoveryplanthatincludedOregonpopulationsofthe ColumbiaRiverchumESU.ConsistentwithpreviousBRTandotheranalyses(e.g. McElhanyetal.2007),theODFWrecoveryplanconcludedthatchumareextirpatedor nearlysoinalloregoncolumbiariverpopulations.afewchumareoccasionally encounteredduringsurveysorreturntohatcherycollectionfacilities,butthisarelikely eitherstraysfromoneofthewashingtonpopulationorpartofafewextremelysmalland erraticremnantpopulations. TheLCFRBcompletedarevisionrecoveryplanin2010thatincludesWashington populationsofcolumbiariverchum.thisplanincludesanassessmentofthecurrentstatus 22 Sectionauthor:PaulMcElhany 264
.theresultofthisanalysisisshowninfigure126.")
265 ofcrchumpopulations.thisassessmentreliedandbuiltupontheviabilitycriteria developedbythewlc TRT(McElhanyetal2006)andanearlierevaluationofOregonWLC populations(mcelhanyetal.2007).thisevaluationassessedthestatusofpopulationswith regardtothevspparametersofabundanceandproductivity,spatialstructureand diversity(mcelhanyetal.2000).theresultofthisanalysisisshowninfigure126.this analysisindicatesthatallofthewashingtonpopulationswithtwoexceptionsareinthe overall veryhighrisk category(alsodescribedas extirpatedornearlyso ).TheGrays riverpopulationwasconsideredtobeatmoderateriskandthelowergorgepopulationbe atlowrisk.theveryhighriskstatusassignedtothethemajorityofwashington populations(andalltheoregonpopulations)reflectstheverylowabundanceobservedin thesepopulations(e.g.<10fish/year). Figure125 Historical Columbia River chum populations (from Myers et al. 2006). 265
and4isverylowrisk.")
266 Figure126 CurrentstatusofWashingtonCRchumpopulationsfortheVSPparametersandoverallpopulation risk.(lcfrb2010recoveryplan,chapter6).apopulationscoreofzeroindicatesapopulationextirpatedor nearlyso,ascoreof1ishighrisk,2ismoderaterisk,3islowrisk( viable )and4isverylowrisk. NewDataandAnalyses PopulationDesignations GeneticstudiessincethelastBRTanalysisindicatethattherehistoricallyexisteda summerrunchumpopulationinthecowlitzriver(smalletal.2006).thispopulation appearstohaveoccupiedtheupperreachesofthechumdistributioninthecowlitz.afew fishdisplayingthissummerrunlife historyareoccasionallyobservedinthecowlitz.the newanalysissuggestsaddinganewpopulationtothecascadestrataofthewlc TRT criteria.thissummerrunpopulationexhibitsauniquelifehistoryinthechumesuand representsanimportantcomponentofchumdiversity. GraysandLowerGorge GraysRiverandtheLowerGorgeareaaretheonlylocationsthathaveconsistently maintainednaturalspawning.surveysforchumareregularlyconductedintheseareas,but 266
267 aconsistentmethodologyforobtainingpopulationlevelabundanceestimatesarestillin development.figure127andfigure128showlong termabundanceindexseriesandafew recentyearswithabsoluteabundanceestimates.thesedataindicateasignificantincrease inabundancein inGraysRiverandLowerGorgepopulation.The2002increase wasnotedbythe2005brtasanencouragingsign.however,recentdataindicatethat abundanceshavereturnedtopreviousrelativelylowlevelsofperhapsafewthousandin thegraysandlessthanathousandinthelowergorge.thegraysdataareconfoundedby theinitiationofahatcheryprogramintheearly1999,sothegraystimeseriescontainsand unknownnumberofhatcheryoriginspawnersstartingin2002(coincidingwiththelarge increaseinabundanceforthatpopulation).thelowergorgepopulationdoesnothavea hatcheryprogram. Figure127 GraysRiverchumspawnertimeseries.Thebluelineanddiamondsare spawnerspermile from thewdfwsasidatabase.thepurplelinesandstarsarethe Totallive countfromthestreamnetdatabase.the reddotsandlinearetheestimateof TotalSpawners fromthewdfwsasidatabase. 267
268 Figure128 LowerGorgechumspawnertimeseries.Thebluediamondsarethe SpawnerIndex fromthe WDFWSaSidatabase.Thepurplesquaresare Spawnerspermile fromthewdfwsasidatabase.thegreen trianglesarethe TotalLive countfromthestreamnetdatabase.theredsquaresare TotalSpawners fromthe WDFWSaSidatabase. Washougal The2005BRTreportnotedthediscoveryofachumspawninggroupinthe mainstemcolumbiabeneaththei 205bridgewithintheareaoftheWashougalRiver population.approximately350spawnerswereobservedin2000.althoughsurveysofthis populationhavebeenconducted,updatedabundanceinformationisnotavailableatthis time. AboveBonneville Inmostyears,asmallnumberofchummigratepastBonnevilleDamtotheUpper Gorgepopulationarea(Figure129).SpawningaboveBonnevilleisthoughttobelimited, however,forthefirsttime,chumfrywereobservedoutmigratingpastbonnevillein2010 (Krasnowpers.com.) 268
269 Figure129 ChumcountatBonnevilleDam.Somechumfallbackoverthedamafterbeingcounted.(datafrom FishPassageCenteronlinedatabase). OtherWashingtonPopulation NewdatasincethelastBRTreport stilloccasionalreportsofafewchum. Oregonpopulations NewdatasincethelastBRTreport stilloccasionalreportsofafewchum. Harvest ColumbiaRiverchumsalmonwerehistoricallyabundantandsubjecttosubstantial harvest.inrecentyearstherehasbeennodirectedharvestofcolumbiariverchum salmon.dataontheincidentalharvestofchumsalmoninlowercolumbiarivergillnet fisheriesexist,butescapementdataareinadequatetocalculateexploitationrates. Commercialharvesthasbeenlessthan100fishperyearsince1993,andallrecreational fisherieshavebeenclosedsince1995. Hatcheries AchumhatcherywasinitiatedinGraysRiverin1999thatcurrentlyreleases approximately200,000fryaspartofanintegratedconservationhatcheryprogram(hsrg 2009)(Figure130).Thehatcheryfisharenotexternallymarked.TheHSRGhas recommendedthatthehatchery sunset inthreegenerations. 269
chumpopulationsremainextirpatedornearlyso.")
270 Figure130 ColumbiaRiverchumhatcheryreleases.Thedottedlineindicatesthemean,andtheshadedarea thestardarddeviation.source:rmis. ColumbiaRiverchumsalmon:UpdatedRiskSummary Thevastmajority(14outof17)chumpopulationsremainextirpatedornearlyso. TheGraysRiverandLowerGorgepopulationsshowedasharpincreasein2002,buthave sincedeclinedbacktorelativelylowabundancelevelsintherangeofvariationobserved overthelastseveraldecades.chinookandcohopopulationsinthelowercolumbiaand Willametteshowsimilarincreasesintheearly2000 sfollowedbydeclinestotypicalrecent levels,suggestingtheincreaseinchummayberelatedtooceanconditions.recentdataon thewashougal/mainstemcolumbiapopulationarenotavailable,butwesuspectthey followapatternsimilartothegraysandlowergorgepopulations.overall,thenew informationconsidereddoesnotindicateachangeinthebiologicalriskcategorysincethe timeofthelastbrtstatusreview. References Good,T.P.,R.S.Waples,andP.Adams,editors.2005.Updatedstatusoffederallylisted ESUsofWestCoastsalmonandsteelhead.U.S.DepartmentofCommerce,Seattle. HSRG.2009.HatcheryScientificReviewGroupreviewandrecommendations:GraysRiver chumpopulationandrelatedhatcheryprograms. LowerColumbiaFishRecoveryBoard.2010.WashingtonlowerColumbiasalmonrecovery andfishandwildlifesubbasinplan.lowercolumbiafishrecoveryboard,olympia, WA. McElhany,P.,C.Busack,M.Chilcote,S.Kolmes,B.McIntosh,J.M.Myers,D.Rawding,A. Steel,C.Steward,D.Ward,T.Whitesel,andC.Willis.2006.Revisedviabilitycriteria forsalmonandsteelheadinthewillametteandlowercolumbiabasins.report, NOAANorthwestFisheriesScienceCenter,Seattle. McElhany,P.,M.Chilcote,J.M.Myers,andR.Beamesderfer.2007.ViabilitystatusofOregon salmonandsteelheadpopulationsinthewillametteandlowercolumbiabasins. NOAA NorthwestFisheriesScienceCenter,Seattle,WA. McElhany,P.,M.H.Ruckelshaus,M.J.Ford,T.C.Wainwright,andE.P.Bjorkstedt Viablesalmonidpopulationsandtherecoveryofevolutionarilysignificantunits. TechnicalMemorandumNMFS NWFSC 42,NOAA,Seattle. 270
271 Myers,J.M.,C.Busack,D.Rawding,A.R.Marshall,D.J.Teel,D.M.VanDoornik,andM.T. Maher.2006.HistoricalpopulationstructureofPacificsalmonidsintheWillamette RiverandlowerColumbiaRiverbasins.NMFS NWFSC 73,NOAANWFSC,Seattle, WA. NMFS.1999.ConclusionsregardingtheupdatedstatusoftheColumbiaRiverchumsalmon ESUandHoodCanalsummer runchumsalmonesu.memo12february1999tow. Stelle,NorthwestFisheriesScienceCenter,andW.Hogarth,SouthwestFisheries ScienceCenter,fromM.H.Schiewe,NorthwestFisheriesScienceCenter,2725 MontlakeBlvd.E.,Seattle,WA OregonDepartmentofFishandWildlife,R.Beamesderfer,L.Berg,M.Chilcote,J.Firman,E. Gilbert,K.Goodson,D.Jepsen,T.Jones,S.Knapp,C.Knutsen,K.Kostow,B.McIntosh, J.Nicholas,J.Rodgers,T.Stahl,andB.Taylor.2010.LowerColumbiariver conservationandrecoveryplanfororegonpopulationsofsalmonandsteelhead. OregonDepartmentofFishandWildlife,Salem,OR. Small,M.P.,A.E.Frye,J.F.VonBargen,andS.F.Young.2006.Geneticstructureofchum salmon(oncorhynchusketa)populationsinthelowercolumbiariver:arechum salmonincascadetributariesremnantpopulations?consevationgenetics7:
272 272 LowerColumbiaRivercohosalmon 23 ListedESU/DPS ThisreportcoverstheEvolutionarilySignificantUnit(ESU)ofLowerColumbia RiverCohoSalmon(Oncorhynchuskisutch).OriginallypartofalargerLowerColumbia River/SouthwestWashingtonESU,LowerColumbiacohowereidentifiedasaseparateESU andlistedasthreatenedonjune28,2005.theesuincludesallnaturallyspawned populationsofcohosalmoninthecolumbiariveranditstributariesinwashingtonand Oregon,fromthemouthoftheColumbiaRiveruptoandincludingtheBigWhiteSalmon andhoodrivers,andincludesthewillametterivertowillamettefalls,oregon,aswellas twenty fiveartificialpropagationprograms:thegraysriver,searesourceshatchery, PetersonCohoProject,BigCreekHatchery,AstoriaHighSchool(STEP)CohoProgram, WarrentonHighSchool(STEP)CohoProgram,ElochomanType SCohoProgram, ElochomanType NCohoProgram,CathlametHighSchoolFFAType NCohoProgram, CowlitzType NCohoProgramintheUpperandLowerCowlitzRivers,CowlitzGameand AnglersCohoProgram,FriendsoftheCowlitzCohoProgram,NorthForkToutleRiver Hatchery,KalamaRiverType NCohoProgram,KalamaRiverType SCohoProgram, WashougalHatcheryType NCohoProgram,LewisRiverType NCohoProgram,Lewis RiverType SCohoProgram,FishFirstWildCohoProgram,FishFirstType NCoho Program,SyversonProjectType NCohoProgram,EagleCreekNationalFishHatchery, SandyHatchery,andtheBonneville/Cascade/Oxbowcomplexcohohatcheryprograms. ESU/DPSBoundaryDelineation Utilizingnewinformation,theESUBoundariesReviewGroup(seeESUBoundaries above)undertookarevaluationoftheboundarybetweenalllowercolumbiaandmid ColumbiaESUsandDPSs.Thereviewconclusionsemphasizethetransitionalnaturethe boundarybetweenthelowercolumbiaesusandthemid ColumbiaESUs.Theoriginal LowerColumbiacohoESUboundarywasassignedbasedlargelyonextrapolationfrom informationabouttheboundariesforchinookandsteelhead.theesuboundariesreview GroupconsidereditreasonabletoassigntheKlickitatChinookandsteelheadpopulations theappropriatelowercolumbiaesu/dps.theesuboundariesreviewgroupconcludes, ItisthereforereasonabletoassigntheKlickitatpopulationtotheLowerColumbiacoho ESU.ThiswouldestablishacommonboundaryforChinooksalmon,cohosalmon,chum salmon,andsteelheadatthecelilofalls(dallesdam). Thisstatusevaluationwas conductedusingexistingesuboundaries. SummaryofPreviousBRTConclusions NMFSreviewedthestatusoftheLowerColumbiaRivercohosalmonESUin1996 (NMFS1996),againin2001(NMFS2001),andmostrecentlyin2005(NMFS2005).Inthe 2001review,theBRTwasveryconcernedthatthevastmajority(over90%)ofhistorical populationsinthelowercolumbiarivercohosalmonesuappeartobeeitherextirpated ornearlyso.thetwopopulationswithanysignificantproduction(sandyandclackamas rivers)wereatappreciableriskbecauseoflowabundance,decliningtrends,andfailureto 23 Sectionauthor:PaulMcElhany
273 respondafteradramaticreductioninharvest.thelargenumberofhatcherycohosalmon intheesuwasalsoconsideredanimportantriskfactor.themajorityofthe2001brt voteswerefor atriskofextinction withasubstantialminority likelytobecome endangered. Anupdatedstatusevaluationwasconductedin2005,alsowithamajorityof BRTvotesfor atriskofextinction andasubstantialminorityfor likelytobecome endangered. SummaryofRecentEvaluations AreportonthepopulationstructureofLowerColumbiasalmonandsteelhead populationswaspublishedbythewlc TRTin2006(Myersetal.2006).Thecoho populationdesignationsinthatreport(figure131)areusedinthisstatusupdateandwere usedforstatusevaluationsinrecentrecoveryplansbyodfwandlcfrb. In2010,ODFWcompletedarecoveryplanthatincludedOregonpopulationsof LowerColumbiacohoESU.Alsoin2010,theLCFRBcompletedarevisionofitsrecovery planthatincludeswashingtonpopulationsoflowercolumbiacoho.bothoftheserecovery plansincludeanassessmentofcurrentstatusoflcrcohopopulations.theseassessments reliedandbuiltupontheviabilitycriteriadevelopedbythewlc TRT(McElhanyetal 2006)andanearlierevaluationofOregonWLCpopulations(McElhanyetal.2007).These evaluationsassessedthestatusofpopulationswithregardtothevspparametersof abundanceandproductivity,spatialstructureanddiversity(mcelhanyetal.2000).the resultsoftheseanalysesareshowninfigure132andfigure133. TheseanalysesindicatethatalloftheWashingtonpopulationsandallbuttwoofthe Oregonpopulationsareintheoverall veryhighrisk category(alsodescribedas extirpatedornearlyso ).TwopopulationsinOregon,theScappooseandClackamas,were consideredbyodfwtomostlikelybeinthemoderateriskcategory.asshowninfigure 132,theseresultsdiffersomewhatfromtheMcElhanyetal.(2007)analysis,whichfound ScappooseandSandyathighrisk,Clackamasbarelyinthelowriskcategoryandallother Oregonpopulationsconsideredveryhighrisk.TheresultsfromOregonandWashington arelargelydrivenbytheverylowabundanceandproductivityofnaturallyproducedlcr coho. 273

274 Figure131 HistoricalpopulationsofLCcoho.FromMyersetal.(2006). 274
,theolderratingisshownasanopendiamondwithadashedoutline.ReproducedfromODFW(2010).")
275 Figure132 ExtinctionriskratingsforLCRcohopopulationsinOregonfortheassessmentattributes abundance/productivity,diversityandspatialstructureaswellasanoverallratingforpopulationsthat combinesthethreeattributesratings.whereupdatedratingsdifferfromthosepresentedbymcelhanyetal. (2007),theolderratingisshownasanopendiamondwithadashedoutline.ReproducedfromODFW(2010). 275

276 Figure133 CurrentstatusofWashingtonLCRcohopopulationsfortheVSPparametersandoverallpopulation risk.(lcfrb2010recoveryplan,chapter6).apopulationscoreofzeroindicatesapopulationextirpatedor nearlyso,ascoreof1ishighrisk,2ismoderaterisk,3islowrisk( viable )and4isverylowrisk. 276
277 NewDataandAnalyses SandyandClackamas The2005BRTstatusevaluationincludedabundancedatafortheClackamas populationfortheyears andfortheSandypopulationfrom The timeseriesusedforthisnewstatusupdateisthesameasthatusedforthe2010oregon recoveryplan,whichincludestheyears forboththeSandyandClackamas populations.thesetimeseriesareshowninfigure134,withsummarystatisticsintable 68.Thetotalabundanceovertheyearssincethelaststatusreview( )have remainedwithinonestandarddeviationofeachpopulationslong termmean,withthe exceptionof2008intheclackamas,whichisslightlyaboveonestandarddeviation.the geometricmeanabundanceforbothpopulationsissubstantiallybelowthelong term MinimumAbundanceThreshold of3,000spawnersidentifiedinthemcelhanyetal.2007 reportusingwlc TRTmethodology.Neitherpopulationshowsaclearlongtermtrendin lognaturaloriginabundanceovertheentiretimeseries,butbothindicateapositivetrend overtheyears Anegativegrowthrate(lambda)wasobservedwhen consideringtheentiretimeseriesassuminghatcheryoriginfishhavethesame reproductivesuccessasnaturaloriginfish.allotherlambdaestimatesshowednotrend. NotethattheClackamasabundancedatacombinesspawnersupstreamoftheNorthFork Dam(whichhasrelativelyfewhatcheryoriginspawners)anddownstreamofthedam (whichhasahigherfractionofhatcheryoriginspawners seetables2 4). 277

of3,000fishforaviablepopulationinalargewatershed.")
278 278 Figure134 AbundanceofLowerColumbiaRivercohopopulations.Thered(upper)solidlineindicatestotal spawners.thegreen(lower)solidlineindicatesnaturaloriginspawners.thedashlineindicatestheoverall geometricmeanabundanceofnaturaloriginspawnerswiththegreenbandshowingonestandarddeviation aboutthemean. Table68 SummarystatisticsforLowerColumbiaCoho.The95%confidenceintervalsareshownin parentheses.cellshighlightedyellowindicatenegativepopulationindicatorsandbluecellsindicatepositive. ThegeometricmeannaturaloriginspawnersarehighlightedbasedoncomparisontotheMcElhanyetal2007 MinimumAbundanceThreshold(MAT)of3,000fishforaviablepopulationinalargewatershed.Themean hatcheryfractionishighlightedbasedoncomparisontotheviabilitystandardof10%hatcheryoriginspawners. Thetrendandlambdavaluesarehighlightedbasedonwhetherthe95%confidenceintervalisentirelyaboveor belowone. Population Analysis Window Years Geomean Nat.Or. Spawners TrendinLog Nat.Or. Spawners Lambda withhat. Repro.=0 Lambda withhat. Repro.=1 Mean hatchery fraction last3 years ,799 (2,450 5,890) 0.35 Since ,534 (752 3,130) ( ) ( ) ( ) Clackamas AllYears ,810 (1,297 2,526) ( ) ( ) ( )
279 279 last3 years (445 1,702) 0 Since ( ) 1.13 ( ) ( ) ( ) 0 Sandy AllYears ( ) ( ) ( ) ( ) OtherOregonPopulations (YoungsBay,BigCreek,Clatskanie,Scappoose.LowerGorge,HoodRiver) In2002,ODFWinitiatedasmonitoringprogramforLowerColumbiacohospawners basedonastratifiedrandomsamplesurveydesign.areportcoveringmonitoringresults theyears waspublishedin2006(Suringetal.).Abundanceestimatesand hatcheryfishfractionsfromthatstudyaresummarizedintable69 Table71.In2010, ODFWpublishedareportcoveringLCRcohomonitoringfortheyears The reportsindicateoverallrelativelylowabundanceofnaturaloriginintheoregonportionof thelcrcohoesu.allofthepopulationsexceptsandyandclackamasaveragelessthan500 spawners.thereareveryhighfractionsofhatcheryoriginfishintheyoungsbay,big Creek,LowerGorgeandHoodRiverpopulations.Itisdoubtfulthatthesepopulationsare self sustaining.theclatskanieshowshighlyvariablefractionsofhatcheryoriginspawners, rangingfromanestimateof0%to80%.thescappooseshowsconsistentlylowfractionsof hatcheryoriginspawnerscomparabletothelowlevelsinthesandy.itappearsthatsome naturalproductionisoccurringintheclatskanieandscappoosepopulations,thoughthe abundancesaresmallrelativetotheminimumabundancethreshold(mat)longterm geometricmeanof1,000spawnersinasmallwatershed(mcelhanyetal.2007).
280 Table69 LowerColumbiaRivercohosalmonescapementestimatesforthe spawningseasons (estimatesarederivedfromcountsinrandomemapspawningsurveys).reproducedfromsuringetal

281 Table70 Markratesbasedonobservationsofadiposefinclipsonliveanddeadcohocohospawnersinrandom cohosurveysduringthe spawningsseasons.ReproducedfromSuringetal Table71 LowerColumibacohoESUestimatedabundanceofadultcohospawningnaturallyby:ESU,stratum, andpopulationforthe runyears.ReproducedfromLewisetal Washingtonpopulations 281

282 (Grays,Elochoman,Mill/Germany/Abernathy,Cispsus,Tilton,UpperCowlitz,LowerCowlitz, NFToutle,SFToutle,Coweeman,Kalama,NFLewis,EFLewis,Salmon,Wahougal,Lower Gorge,WhiteSalmon/Uppergorge) Inthe2005BRTreport,nospawnerdatawereavailableforanypopulationinthe WashingtonportionofthisESU.Startingin2005spawnersurveyswereinitiatedinthe Mill/Germany/Abernathycohopopulation.DatafromWDFWareavailableforthe2006 spawningyear(figure135).thesedatashowanestimated3,150spawnerswithslightly overhalf(51%)ofhatcheryorigin.thisisalargefractionofhatcheryoriginspawnersfora populationnotreceivingdirectoutplantsofhatcheryfishandsuggeststhatother Washingtonpopulationsthatdohavein basinhatcherieshaveevenhigherfractionsof hatcheryoriginspawners.thisobservationisconsistentwiththeconclusionofthe2005 BRTreportandtheLCFRBanalysis(2010)thatWashingtoncohopopulationsare dominatedbyhatcheryoriginspawnersandarenotdemonstrablyself sustaining.dataon cohosmoltproductionarealsocollectedinthemill/germany/abernathypopulation indicatesomenaturalproductiondoesoccurinthesestreams(figure136).thenew Mill/Germany/Abernathysmoltproductiondata( )issimilartothedata( )consideredinthe2005BRTreport Figure135 CohospawnerestimatesfortheMill/Germany/Abernathypopulationin2006.Totalcohospanwer estimateforthepopulationwas3,150with51%ifhatcheryorigin.datasource:wdfw. 282
 Table72 CohosmoltproductionfromCedarCreek(tributaryintheNFLewispopulation).Dataforyears1998 2002from(BRTreport2005);datafor2003from(Seileretal.2004);datafor2004from(Volkhardtetal.")
283 Figure136 CohosmoltproductionestimatesforMill,GermanyandAbernathyCreeks(datafor from 2005BRTreport;datafor fromWDFW Table72 CohosmoltproductionfromCedarCreek(tributaryintheNFLewispopulation).Dataforyears from(BRTreport2005);datafor2003from(Seileretal.2004);datafor2004from(Volkhardtetal.2005); datafor2005from(volkhardtetal.2006);datafor2006from(toppingetal.2008). Year Natural Origin Hatchery Origin Remote Site Incubator 283 Cedar Creek smolts Percent Supplementation (Hatchery + Remote Incubator) ,354? ,987? ,282? ,695? ,695? ,096 8,476 43,572 19% ,999 20,831 1,970 57,800 39% ,770 9,151 58,921 16% ,424 7,584 43,008 18% Smolt trap data are also available for Cedar Creek, a tributary of the NF Lewis population (Table 72). The new data ( ) show similar smolt production levels to the data ( )
284 considered in the 2005 BRT report. Simple calculations suggest that more than a thousand coho spawned in Cedar Creek to produce the observed number of smolts (e.g. if the smolt to adult ratio is less than 30, there were on average at least 1,000 spawners; substantially more if the smolt to adult ratio is much lower.). There is a production hatchery in the NF Lewis and it is likely based on the high hatchery ratios observed in the Mill/Germany/Abernathy population (which does not have a production hatchery) that the majority of spawners in Cedar Creek are of hatchery origin. However, these data do suggest that the habitat is capable of supporting some natural production. Smoltestimatesarealsoavailableforthe2004cohooutmigrantyearfortheCoweeman population(sharpeandglaser2007).theyestimated17,389 smolts (± 1,769), indicating some production potential for this basin. LowerColumbiaRiverHarvest LowerColumbiaRivercohosalmonarepartoftheOregonProductionIndex,andare harvestedinoceanfisheriesprimarilyoffthecoastsoforegonandwashington,withsome harvestthathistoricallyoccurredoffofwcvi.canadiancohosalmonfisherieswere severelyrestrictedinthe1990stoprotectupperfraserrivercoho,andhaveremainedso eversince.oceanfisheriesoffcaliforniawereclosedtocohoretentionin1993andhave remainedcloseeversince.oceanfisheriesforcohooffoforegonandwashingtonwere dramaticallyreducedin1993inresponsetothelistingoforegoncoastnaturalcoho,and movedtomark selectivefishingbeginningin1999.lowercolumbiarivercohobenefitted fromthemorerestrictivemanagementofoceanfisheries.overallexploitationrates regularlyexceeded80%inthe1980s,buthaveremainedbelow30%since1993(figure 137). Figure137 TotalexploitationrateonlowerColumbiaRivernaturalcohosalmon.DatafromTAC(2010). 284
285 LCRCohoHatcheries Hatcheryreleaseshaveremainedrelativelysteadyatbetween10and15millionsincethe 2005BRTreport(Figure138).Overallhatcheryproductionremainsrelativelyhighand mostofthepopulationsintheesucontainasubstantialfractionofhatcheryorigin spawners.inthatregard,littlehaschangedsincethe2005brtreport.recenteffortsto shiftproductionintolocalizedareas(e.g.youngsbayandbigcreek)inordertoreduce hatcheryfishpressureinotherpopulations(e.g.scapposseandclatskanie)areconsidered asintransitionatthistime.itisimportanttonotethatdirectdataonthefactionof hatcheryoriginspawnerareavailableforonlyoneofwashington s17cohopopulations only(mill/germany/abernathy)forasingleyear(2006).thislackofdatacontributes greatlytouncertaintyabouttheesusstatus. 285

286 Figure138 LCRhatcheryreleasesforallsalmonandsteelheadspeciesreleasedwithinthespawningand rearingareaofthelcrcohoesu.dottedlinesindicatemeans,andshadedareasindicatestandarddeviations. LowerColumbiaRiverCohosalmon:UpdatedRiskSummary ThreestatusevaluationsofLCRcohostatus,allbasedonWLC TRTcriteria,havebeen conductedsincethelastbrtstatusupdatein2005(mcelhanyetal.2007,odfw2010, 286
287 LCFRB2010).AllthreeevaluationsconcludedthattheESUiscurrentlyatveryhighriskof extinction.ofthe27historicalpopulationsintheesu,24areconsideredatveryhighrisk. Theremainingthree(Sandy,ClackamasandScapposse)areconsideredathightomoderate risk.allofthewashingtonsidepopulationsareconsideredatveryhighrisk,although uncertaintyishighbecauseofalackofadultspawnersurveys.aswasnotedinthe2005 BRTevaluation,smolttrapsindicatesomenaturalproductioninWashingtonpopulations, thoughgiventhehighfractionofhatcheryoriginspawnerssuspectedtooccurinthese populationsitisnotclearthatanyareself sustaining.overall,thenewinformation considereddoesnotindicateachangeinthebiologicalriskcategorysincethetimeofthe lastbrtstatusreview. References Lewis,M.,E.Brown,B.Sounhein,M.Weeber,E.Suring,andH.Truemper.2010.Statusof Oregonstocksofcohosalmon,2004through2008:theOregonplanforsalmonand watersheds.inw.o.r.a.m.program,editor.oregondepartmentoffishand Wildlife,Salem,OR. LowerColumbiaFishRecoveryBoard.2010.WashingtonlowerColumbiasalmonrecovery andfishandwildlifesubbasinplan.lowercolumbiafishrecoveryboard,olympia, WA. McElhany,P.,M.Chilcote,J.M.Myers,andR.Beamesderfer.2007.ViabilitystatusofOregon salmonandsteelheadpopulationsinthewillametteandlowercolumbiabasins. NOAA NorthwestFisheriesScienceCenter,Seattle,WA. McElhany,P.,M.H.Ruckelshaus,M.J.Ford,T.C.Wainwright,andE.P.Bjorkstedt Viablesalmonidpopulationsandtherecoveryofevolutionarilysignificantunits. TechnicalMemorandumNMFS NWFSC 42,NOAA,Seattle. Myers,J.M.,C.Busack,D.Rawding,A.R.Marshall,D.J.Teel,D.M.VanDoornik,andM.T. Maher.2006.HistoricalpopulationstructureofPacificsalmonidsintheWillamette RiverandlowerColumbiaRiverbasins.NMFS NWFSC 73,NOAANWFSC,Seattle, WA. OregonDepartmentofFishandWildlife,R.Beamesderfer,L.Berg,M.Chilcote,J.Firman,E. Gilbert,K.Goodson,D.Jepsen,T.Jones,S.Knapp,C.Knutsen,K.Kostow,B.McIntosh, J.Nicholas,J.Rodgers,T.Stahl,andB.Taylor.2010.LowerColumbiariver conservationandrecoveryplanfororegonpopulationsofsalmonandsteelhead. OregonDepartmentofFishandWildlife,Salem,OR. Seiler,D.,G.Volkhardt,A.Murdoch,S.Hawkins,H.Fuss,andB.Ehinger Index watershedsalmonrecoverymonitoringreport.washingtondepartmentoffishand WildlifeandWashingtonDepartmentofEcology,Olympia,WA. Seiler,D.,G.Volkhardt,P.Topping,L.Fleischer,T.Miller,S.Schonning,D.Rawding,M. Groesbeck,R.Woodard,andS.Hawkins Juvenilesalmonidproduction evaluationreport:greenriver,wenatcheeriver,andcedarcreek.inf.s.d.a.f.m. Division,editor.WashingtonDepartmentofFishandWildlife,Olympia,Wa. Sharpe,C.andB.Glaser Coweemanriverjuvenilesalmonidproduction evaluation.inf.p.s.division,editor.washingtondepartmentoffishandwildlife, Olympia,WA 287
288 Takata,T.T.2008.OregonlowerColumbiariverfallandwinterChinookspawningground surverys, :focuson2008.inC.R.Management,editor.Oregon DepartmentofFishandWildlife,Salem,OR. Topping,P.,L.Kishimoto,J.Holowatz,D.Rawding,andM.Groesbeck Juvenile salmonidproductionevaluationreport:greenriver,dungenessriver,andcedar creek.inr.fishprogramandf.s.division,editors.washingtondepartmentoffish andwildlife,olympia,wa. Volkhardt,G.,P.Topping,L.Fleischer,T.Miller,S.Schonning,D.Rawding,andM. Groesbeck Juvenilesalmonidproductionevaluationreport:Greenriver, Wenatcheeriver,andCedarcreek.inS.D.a.F.M.Division,editor.Washington DepartmentofFishandWildlife,Olympia,Washington. Volkhardt,G.,P.Topping,L.Kishimoto,D.Rawding,andM.Groesbeck Juvenile salmonidproductionevaluationreport:greenriver,dungenessriver,andcedar creek.ins.d.a.f.m.division,editor.washingtondepartmentoffishandwildlife, Olympia,WA. 288
289 289 MiddleColumbiaRiversteelhead 24 TheMiddleColumbiaRiversteelheaddistinctpopulationsegment(DPS)includesall naturallyspawningpopulationsofsteelhead(oncorhynchusmykiss)usingtributaries upstreamandexclusiveofthewindriver(washington)andthehoodriver(oregon), excludingtheuppercolumbiarivertributaries(upstreamofpriestrapidsdam)andthe SnakeRiver.TheMiddleColumbiaRiversteelheadDPSwaslistedasthreatenedbyNOAA Fisheriesin1999,withthatlistingdesignationbeingaffirmedin2006.NOAAFisherieshas defineddpssofsteelheadtoincludeonlytheanadromousmembersofthisspecies(70fr 67130).OurapproachtoassessingthecurrentstatusofasteelheadDPSisbased evaluatinginformationtheabundance,productivity,spatialstructureanddiversityofthe anadromouscomponentofthisspecies(goodetal.2005;70fr67130).manysteelhead (O.mykiss)populationsalongtheWestCoastoftheU.S.co occurwithconspecific populationsofresidentrainbowtrout.werecognizethattheremaybesituationswhere reproductivecontributionsfromresidentrainbowtroutmaymitigateshort term extinctionriskforsomesteelheaddpss(goodetal.2005;70fr67130).weassumethat anybenefitstoananadromouspopulationresultingfromthepresenceofaconspecific residentformwillbereflectedindirectmeasuresofthecurrentstatusoftheanadromous form. SummaryofpreviousBRTconclusions ResultsofthepreviousBRTreviewofthestatusoftheMiddleColumbiaSteelhead DPSweresummarizedinGoodetal.2005.Aslightmajority(51%)ofthecumulative scoresacrossthebrtwereforassigningthisdpstothe threatenedbutnotendangered category.theremainingvotes(49%)wereforthe notlikelytobecomeendangered designation.thebrtnotedthatthisparticulardpswasdifficulttoscore.reasonscited included:thewiderangeinrelativeabundanceforindividualpopulationsacrossthedps (e.g.,spawningabundanceinthejohndayanddeschutesbasinshasbeenrelativelyhigh, whilereturnstomuchoftheyakimariverdrainagehaveremainedrelativelylow); chronicallyhighlevelsofhatcherystraysintothedeschutesriver,andalackofconsistent informationonannualspawningescapementsinsometributaries(e.g.klickitatriver). ResidentO.mykissarebelievedtobeverycommonthroughoutthisDPS.TheBRTassumed thatthepresenceofresidento.mykissbelowanadromousbarriersmitigatedextinction risktothedpstosomeextent,butthemajorityofbrtmembersconcludedthatsignificant threatstotheanadromouscomponentremained. BriefReview:RecoveryPlanning TheInteriorColumbiaTechnicalRecoveryTeam(ICTRT)hasidentified17extant populationsinthisdps(ictrt,2003).thepopulationsfallintofourmajorpopulation groups:theyakimariverbasin(fourextantpopulations),theumatilla/walla Walla drainages(3extantand1extirpatedpopulations);thejohndayriverdrainage(5extant populations)andtheeasterncascadesgroup(5extantand2extirpatedpopulations). NOAAFisheries(NationalMarineFisheriesService)recentlyadoptedarecovery planforthemid ColumbiaSteelheadDistinctPopulationSegment(DPS).TheNOAA FisheriesMid ColumbiaSteelheadRecoveryPlan( Recovery 24 Sectionauthor:TomCooney
290 Planning/Recovery Domains/Interior Columbia/Mid Columbia/Mid Col Plan.cfm) summarizesinformationfromfourregionalmanagementunitplanscoveringtherangeof tributaryhabitatsassociatedwiththedpsinwashingtonandoregon.eachofthe managementunitplansareincorporatedasappendicestotherecoveryplan,alongwith modulesforthemainstemcolumbiahydropowersystemandtheestuary,whereconditions affectthesurvivalofsteelheadproductionfromallofthetributarypopulationscomprising thedps.therecoveryobjectivesdefinedintheplanarebasedonthebiologicalviability criteriadevelopedbytheictrt.theplanalsoincorporatesinformationoncurrentstatus developedthroughtheictrt(ictrt,2010b). TRTandRecoveryPlanCriteria Recoverystrategiesoutlinedintheplananditsmanagementunitcomponentsare targetedonachieving,ataminimum,theictrtbiologicalviabilitycriteriaforeachmajor populationgroupinginthedps...tohaveallfourmajorpopulationgroupsatviable(low risk)statuswithrepresentationofallthemajorlifehistorystrategiespresenthistorically,and withtheabundance,productivityspatialstructureanddiversityattributesrequiredforlongtermpersistence. Theplanrecognizesthat,atthemajorpopulationgrouplevel,theremay beseveralspecificcombinationsofpopulationsthatcouldsatisfytheictrtcriteria.each ofthemanagementunitplansidentifiesparticularcombinationsthatarethemostlikelyto resultinachievingviablemajorpopulationgroupstatus.therecoveryplanrecognizesthat themanagementunitplansincorporatearangeofobjectivesthatgobeyondtheminimum biologicalstatusrequiredfordelisting. TheICTRTrecoverycriteriaarehierarchicalinnature,withESU/DPSlevelcriteria beingbasedonthestatusofnaturaloriginsteelheadassessedatthepopulationlevel.a detaileddescriptionoftheictrtviabilitycriteriaandtheirderivation(ictrt,2007)can befoundatwww.nwfsc.noaa.gov/trt/col/trt_viability.cfm. UndertheICTRTapproach,populationlevelassessmentsarebasedonasetof metricsdesignedtoevaluateriskacrossthefourviablesalmonidpopulationelements abundance,productivity,spatialstructureanddiversity(mcelanyetal.2000).theictrt approachcallsforcomparingestimatesofcurrentnaturaloriginabundance(measuredasa 10yeargeometricmeanofnaturaloriginspawners)andproductivity(estimateofreturn perspawneratlowtomoderateparentspawningabundance)againstpredefinedviability curves.inaddition,theictrtdevelopedasetofspecificcriteria(metricsandexamplerisk thresholds)forassessingthespatialstructureanddiversityrisksbasedoncurrent informationrepresentingeachspecificpopulation.theictrtviabilitycriteriaare generallyexpressedrelativetoparticularriskthreshold 5%riskofextinctionovera100 yearperiod. MidColumbiaRecoveryPlanMajorPopulationGroupRecoveryScenarios TheMid ColumbiaRecoveryPlanidentifiesasetofmostlikelyscenariostomeetthe ICTRTrecommendationsforlowriskpopulationsatthemajorpopulationgrouplevel.In addition,themanagementunitplansgenerallycallforachievingmoderateriskratings (Maintainedstatus)acrosstheremainingextantpopulationsineachMPG. CascadesEasternSlopesTributariesMPG...theKlickitat,FifteenMileandboththeDeschutesEastsideandWestsidepopulations shouldreachatleastviablestatus.themanagementunitplansalsocallforatleastone populationtobehighlyviable,consistentwithictrtrecommendations.therockcreek populationshouldreachmaintainedstatus(25%orlessrisklevel).mpgviabilitycouldbe 290
291 futherbolsteredifreintroductionofsteelheadintothecrookedriversucceedsandifthe WhiteSalmonpopulationsuccessfullyrecolonizesitshistoricalhabitatfollowingthe upcomingremovalofconditdam. JohnDayRiverMPG...(t)heLowerMainstemJohnDayRiver,NorthForkJohnDayRiverandeitherthe MiddleForkJohnDayRiverorUpperMainstemJohnDayRiverpopulationsshouldachieveat leastviablestatus.themanagementunitplanalsocallsforatleastonepopulationtobe highlyviable,consistentwithictrtrecommendations. YakimaRiverMPG...toachieveviablestatus,twopopulationsshouldberatedasviable,includingatleast oneofthetwoclassifiedaslarge thenachesriverandtheupperyakimariver.the remainingtwopopulationsshould,ataminimummeetthemaintainedcriteria.the managementunitplanalsocallsforatleastonepopulationtobehighlyviable,consistent withictrtrecommendations. Umatilla/WallaWallaMPG..twopopulationsshouldmeetviabilitycriteria.Themanagementunitplanalsocalls foratleastonepopulationtobehighlyviable,consistentwithictrtrecommendations.the UmatillaRiveristheonlylargepopulation,andthereforeneedstobeviable.Inadditioneither thewallawallaortouchetriveralsoneedstobeviable. NewDataandUpdatedAnalyses The2005BRTstatusassessmentoftheMid ColumbiaDPSincludedquantitative estimatesofpopulationabundance,trendsandhatchery/naturalspawnercompositions basedonasetofavailableindicesrepresentingnaturalproductionperformanceinspecific tributaries.sincethatreview,theictrthasworkedwithregionalbiologiststodocument anddevelopastandardsetofpopulationlevelestimatesofspawningabundanceand hatchery/naturalproportionsrepresentingalloftheextantpopulationsinthebasin (ICTRT,2010b).Insomecasesthenewmethodsrepresentanexpansionfromdatasets representingspecificreacheswithinpopulationstotoestimatesoftheannualnumberof totalspawnersinapopulation(e.g.,fifteenmilecreek,thejohndaydrainagepopulations). Inothercasesthecurrentdataseriesrepresentabreakoutofaggregaterunestimatesthat includecontributionsfrommultipleictrtpopulations(e.g.,thedeschutesriverandthe YakimaRiver).Inaddition,the2005reviewwasbasedonreturnsthroughthe2001 spawningyear.currentlyavailabledataseriesformid Columbiasteelheadpopulations generallyextendthroughthe2007/2008return/spawncycleyearwithsomeseries includinganadditionalyear,the2008/2008return(figure139 Figure146). Standardabundanceandtrends Abundancedataseriesareavailableforthreeofthefiveextantpopulationsinthe NorthCascadesMPG(Table73)alongwithtwoyearsofestimatesforafourthpopulation (KlickitatRiver).Totalspawningabundanceforthemostrecentfiveyearseries( )arebelowthelevelsreportedinthe2005BRTanalysisforallthreepopulation series.however,naturaloriginspawnerabundanceishigherforthemorerecentestimates forallthreeseries.basedonmark recaptureanalysis,1,577naturalandhatchery steelheadpassedupstreamofthefallsandintospawningreachesin inthe KlickitatRiver.Estimatesoftheproportionnaturaloriginspawnerswerehigherforall threepopulationsinthemostrecentbroodcycle. 291
292 Totalescapementandnaturaloriginescapementsweredownfromthelevels reportedinthe2005brtreportinfouroutofthefivejohndaypopulations.bothtotal andnaturaloriginspawningescapementsinthesouthforkjohndayriverwerehigherin themorerecentbroodcyclethanin Estimatesofthefractionnaturalorigin spawnerswererelativelyunchangedfortheupstreamjohndaypopulations,buthad increasedforthelowermainstemjohndayriver(table73). Totalandnaturaloriginescapementestimateswerehigherinthemostrecentbrood cycleforallfouroftheyakimariverpopulationsthaninthecycleassociatedwiththe2005 BRTreview(Table73,Figure1).SteelheadescapementsintotheUpperYakimaRiver, althoughincreasedrelativetothepreviousreview,remainverylowrelativetothetotal amountofhabitatavailable.proportionnaturaloriginremainedhighintheyakimabasin (estimatedforaggregaterunatprosserdam). Totalspawningescapementshaveincreasedinthemostrecentbroodcycleoverthe periodassociatedwiththe2005brtreviewforallthreepopulationsintheumatilla WallaWallaMPG(Table73).Naturaloriginescapementsarehigherfortwopopulations (UmatillaRiverandWallaWallaRiver)whileremainingattheapproximatelythesame levelasinthepriorreviewforthetouchetriver. Relativetothebroodcyclejustpriortolisting( spawningyear)current broodcycle(fiveyeargeometricmean)naturalabundanceissubstantiallyhigher(more thantwice)forsevenofthemid Columbiasteelheadpopulationdataseries,lowerforthree populationsandatsimilarlevelsfortheremaining4populations. ShorttermtrendsforallpopulationsintheYakimaRiverMPGswerestrongly positiveovertheperiod (Figure143).TrendsforEastCascades,JohnDayand Umatilla/WallaWallapopulationsweregenerallypositivewiththreeexceptions.The geometricmeantrendestimatesforfifteenmilecreek,themiddleforkjohndayandthe TouchetRiverwereatorslightlybelowone,withtheconfidenceboundsforallthree estimatesincluding1.0. PopulationsinallfouroftheMid ColumbiasteelheadMPGsexhibitedsimilar temporalpatternsinreturnsperspawner(figure140,figure142,figure144,figure 146).Returnratesforbroodyears weregenerallyexceededreplacement(1:1). Spawnertospawnerratiosforbroodyears weregenerallywellbelow replacementformanypopulations.broodyearproductivityestimatesreturnedlevelsator above1:1forthemostrecent1 2broodyearsforpopulationsintheYakimaandJohnDay RiverMPGsbutremainedbelowreplacementfortheEasternCascadesandUmatilla/Walla Wallapopulations.Broodyearreturnratesreflectthecombinedimpactsofyeartoyear patternsinmarinelifehistorystages,upstreamanddownstreampassagesurvivalsaswell asdensitydependenteffectsresultingfromcapacityorsurvivallimitationsontributary spawningorjuvenilerearinghabitats. 292
293 Table73 SummaryofabundanceandhatcheryproportionsforMid ColumbiaSteelheadpopulationsorganizedbyMPG.Estimatesforbroodcycleprior listing( )andthe2005BRTreviewincludedforcomparison.Estimatesforallseriescalculatedusingcurrentdatasets. Population (organized by major population group) Total Spawners ( 5 year geometric mean, range) Prior ( ) Listing ( ) East Side Deschutes MPG Fifteen Mile Cr. East Side Deschutes West Side Deschutes John Day MPG Upper Mainstem North Fork Middle Fork South Fork Lower Mainstem Yakima MPG Satus Creek Toppenish Creek Naches River Upper Yakima ( ) 651 3,114 (1,829-10,005) ( ) (333-1,771) 1,242 2,134 (1021 4,539) ,169 (477-3,478) 293 ( ) 1,001 2,139 (652-6,096) Umatilla/Walla Walla MPG Umatilla River 1,549 Touchet River Walla Walla River ( ) 345 ( ) 471 ( ) 66 (42-171) 2163 ( ) 382 ( ) ( ) Current ( ) 452 (225-1,956) 2,457 (1,720-4,151) 574 ( ) 500 ( ) 1,618 (789 4,072) 400 ( ) 434 ( ) 1,382 (749-4,324) 831 ( ) 482 ( ) 848 ( ) 158 (80-226) 2893 ( ) 497 ( ) 838 ( ) Listing ( Natural Spawning Areas Natural Origin ( 5 year geometric mean) Prior ( ) ( ) 421 1,753 (475-8,637) ( ) (326-1,593) 1,196 1,988 (978 4,083) ,089 (457-3,129) 273 ( ) 964 2,013 (625 5,553) ( ) 318 ( ) 435 ( ) 65 (42-162) 1, ( ) ( ) ( ) Current ( ) 452 (225-1,956) 1,945 (1,600-2,395) 472 ( ) 459 ( ) 1,484 (707 3,878) 367 ( ) 398 ( ) 1,006 (508-3,480) 809 ( ) 469 ( ) 825 ( ) 156 (80-223) 2273 ( ) 347 ( ) 815 ( ) Listing ( % Natural Origin (5 year average) Prior ( ) Current ( ) 65% 62% 80% 71% 70% 82% 96% 93% 92% 96% 93% 92% 96% 93% 92% 96% 93% 92% 96% 94% 73% 91% 92% 97% 91% 92% 97% 91% 92% 97% 91% 99% 99% 72% 61% 79% 88% 90% 70% 99% 98% 97% 293
lineindicatestotalnatural spawners(includingnaturallyspawninghatcheryfish).")
294 Figure139 SpawningabundancefortheEastCascadesMajorPopulationGroupintheMiddleColumbia steelheaddps.thedarklineindicatesnaturaloriginspawnernumbers,light(red)lineindicatestotalnatural spawners(includingnaturallyspawninghatcheryfish).thedottedlineisthelong term(wholetimeseries) meanofthetotalspawers,andthegreenshadedareaindicates+/ 1standarddeviationaroundthemean. 294
295 Figure140 ProductivityoftheEastCascadesMajorPopulationGroupintheMiddleColumbiasteelheadDPS. Filledmarkers:parentspawnerestimatebelow75%ofminimumabundancethreshold.Openmarkers:parent escapementgreaterthan75%ofminimumabundancethreshold. 295
296 Figure141 SpawningabundancefortheJohnDayMajorPopulationGroupintheMiddleColumbiasteelhead DPS.Thedarklineindicatesnaturaloriginspawnernumbers,light(red)lineindicatestotalnaturalspawners (includingnaturallyspawninghatcheryfish).thedottedlineisthelong term(wholetimeseries)meanofthe totalspawers,andthegreenshadedareaindicates+/ 1standarddeviationaroundthemean. 296
297 Figure142 ProductivityoftheJohnDayMajorPopulationGroupintheMiddleColumbiasteelheadDPS.Filled markers:parentspawnerestimatebelow75%ofminimumabundancethreshold.openmarkers:parent escapementgreaterthan75%ofminimumabundancethreshold. 297
lineindicatestotalnaturalspawners (includingnaturallyspawninghatcheryfish).")
298 Figure143 SpawningabundancefortheYakimaMajorPopulationGroupintheMiddleColumbiasteelheadDPS. Thedarklineindicatesnaturaloriginspawnernumbers,light(red)lineindicatestotalnaturalspawners (includingnaturallyspawninghatcheryfish).thedottedlineisthelong term(wholetimeseries)meanofthe totalspawers,andthegreenshadedareaindicates+/ 1standarddeviationaroundthemean. 298
299 Figure144 ProductivityoftheYakimaMajorPopulationGroupintheMiddleColumbiasteelheadDPS.Filled markers:parentspawnerestimatebelow75%ofminimumabundancethreshold.openmarkers:parent escapementgreaterthan75%ofminimumabundancethreshold. 299
300 Figure145 SpawningabundancefortheUmatilla/WallaWallaMajorPopulationGroupintheMiddleColumbia steelheaddps.thedarklineindicatesnaturaloriginspawnernumbers,light(red)lineindicatestotalnatural spawners(includingnaturallyspawninghatcheryfish).thedottedlineisthelong term(wholetimeseries) meanofthetotalspawners,andthegreenshadedareaindicates+/ 1standarddeviationaroundthemean. 300
301 Figure146 ProductivityoftheUmatilla/WallaWallaMajorPopulationGroupintheMiddleColumbiasteelhead DPS.Filledmarkers:parentspawnerestimatebelow75%ofminimumabundancethreshold.Openmarkers: parentescapementgreaterthan75%ofminimumabundancethreshold. 301
302 302
303 Figure147 Thetoppanelillustratestheshort term( )trendsinnaturaloriginspawners.Estimated asslopeofln(naturaloriginabundance)vs.year.populationestimatesorganizedbymajorpopulationgroup (MPG).EasternCascades(EC);JohnDayRiver(JD);Umatilla/WallaWalla(UWW),YakimaRiver(YK).Lines: upperandlower95%confidencelimits.pointestimatesareexp(ln(trend)).themiddlepanelillustratesshort termpopulationgrowthrate(lambda)estimatesformid Columbiasteelheadpopulations.Relativehatchery effectivenesssetto0.0.soliddiamond/bar:pointestimateand95%cffor Thebottompanel illustratesshorttermpopulationgrowthrate(lambda)estimatesformid Columbiasteelheadpopulations. Relativehatcheryeffectivenesssetto1.0.Soliddiamond/bar:pointestimateand95%cffor
304 CurrentStatus:RecoveryPlanViabilityCriteria ThecurrentstatusoftwoofthefivepopulationsintheCascadesEasternSlopeMPG, FifteenMileCreekandtheDeschutesRiver(Eastside),areratedasviableusingtheICTRT criteriaincorporatedintothemid ColumbiaSteelheadRecoveryPlan.TheDeschutes (Westside)populationremainsratedatHighRiskdrivenbyrelativelylowestimatesfor currentproductivityandnaturaloriginabundancevs.thedpsspecificviabilitycurvefor Intermediatesizedpopulations.ThedataseriesfortheKlickitatRiverpopulationisnot sufficienttoallowarating,howeveravailablemark recapturebasedestimatesfortwo recentyearsindicatethatthepopulationmaybefunctioningatornearviablelevels.data arenotavailablefortheremainingextantpopulation(rockcreek).thecurrentratings againstspatialstructureanddiversitycriteriareflecttheassessmentsdoneforthe2008 ICTRTstatusassessments. Table74 SummaryofcurrentstatusofpopulationsusingviabilitycriteriaincorporatedintotheMid Columbia SteelheadRecoveryPlanfortheCascadesEasternSlopeMPG. Cascades Eastern Slope MPG Population Fifteen Mile Klickitat East Side Deschutes West Side Deschutes ICTRT Minimum Threshold Abundance/Productivity Metrics Natural Spawning Abundance 675 ( ) 695 ( ) Insufficient data 2,730 ( ) 1633 ( ) 591 ( ) ICTRT Productivity 1.83 ( ) 1.83 ( ) Insufficient data 2.31 ( ) 2.31 ( ) 0.96 ( ) Integrated A/P Risk Spatial Structure and Diversity Metrics Natural Processes Risk Diversity Risk Integrated SS/D Risk Overall Viability Rating Low Very Low Low Low Viable Moderate 25 Low Moderate Moderate Maintained? Low Low Moderate Moderate Viable High Low Moderate Moderate High Risk ( ) ( ) Rock Creek Insufficient Insufficient 500 data data High 26 Moderate Moderate Moderate High Risk? White Salmon River 500 N/A N/A Extinct 27 N/A N/A N/A Extinct Crooked River 2,250 N/A N/A Extinct N/A N/A N/A Extinct 25 Moderaterating(provisional)forKlickitatRiverpopulationbasedonreddcountsin someyears,relativehatchery/natural originfractionsincatchsamples,andextrapolation fromotherdpspopulations. 26 Annualsurveysnotconducted;thereforeweassumedaprovisionalA/PratingofHigh. 27 Assumedtobefunctionallyextinct(upstreamhabitatcutoffbyConditDam). 304
305 TheNorthForkJohnDaypopulationcontinuestoberatedHighlyViablewhenthe dataupdatesthroughthe2009spawningyearareincorporatedintotheassessment againstrecoveryplan/ictrtcriteria.theremainingfourpopulationsinthejohnday RiverMPGremainratedasMaintained.Naturaloriginabundanceestimates(tenyear geometricmeans)arehigherinthecurrentassessmentsforfourpopulationsandlowerfor themiddleforkjohndayriver.productivityestimates(geometricmeanbroodyear spawner/spawneratlowtomoderateparentescapements)weregenerallylowerinthe updateddataseriesthantheestimatesgeneratedfortheictrtstatusreviewsendingin spawningyear2005.thecurrentratingsagainstspatialstructureanddiversitycriteria reflecttheassessmentsdoneforthe2008ictrtstatusassessments. Table75 SummaryofcurrentstatusofpopulationsusingviabilitycriteriaincorporatedintotheMid Columbia SteelheadRecoveryPlanfortheJohnDayRiverMPG. John Day MPG Population Upper Mainstem North Fork Middle Fork South Fork Lower Mainstem ICTRT Minimum Threshold Abundance/Productivity Metrics Natural Spawning Abundance 558 ( ) 524 ( ) 1826 ( ) 1740 ( ) 672 ( ) 756 ( ) 443 ( ) 259 ( ) 1881 ( ) 1800 ( ) ICTRT Productivity 0.90 ( ) 2.14 ( ) 2.53 ( ) 2.41 ( ) 2.28 ( ) 2.45 ( ) 1.52 ( ) 2.06 ( ) 2.55 ( ) 2.99 ( ) Integrated A/P Risk Moderate Moderate Very Low Very Low Moderate Moderate Moderate Moderate Moderate Moderate Natural Processes Risk Spatial Structure and Diversity Metrics Diversity Risk Integrated SS/D Risk Overall Viability Rating Very Low Moderate Moderate Maintained Very Low Low Low Highly Viable Low Moderate Moderate Maintained Very Low Moderate Moderate Maintained Very Low Moderate Moderate Maintained 305
306 Table76 SummaryofcurrentstatusofpopulationsusingviabilitycriteriaincorporatedintotheMid Columbia SteelheadRecoveryPlanfortheUmatilla/WallaWallaMPG. Umatilla/Walla Walla MPG Abundance/Productivity Metrics Spatial Structure and Diversity Metrics ICTRT Natural ICTRT Integrated A/P Natural Diversity Integrated Population Minimum Spawning Productivity Risk Processes Risk SS/D Risk Threshold Abundance Risk Willow Creek N/A N/A N/A Extinct N/A N/A N/A Extinct Umatilla River ( ) 1.21 ( ) Moderate Overall Viability Rating Moderate Moderate Moderate Maintained Touchet River ( ) 394 ( ) 414 ( ) 1.50 ( ) 0.96 ( ) 1.19 ( ) Moderate High Moderate? 28 Low Moderate Moderate High Risk Walla Walla River ( ) 1.15 ( ) Moderate Moderate Moderate Moderate Maintained ( ) 1.34 ( ) Moderate TheratingsforindividualpopulationsintheYakimaMPGshouldbeinterpretedwith cautiongiventhebasisforestimatingpopulationspecificreturnsfromprosserdamcounts. TheoverallviabilityratingshaveincreasedfromMaintainedtoViableforthetwobasic sizedpopulationsinthismpg,remainingatmaintainedforthenachesriverandhighrisk fortheupperyakimariverpopulation.thechangesinratingsreflecttherelativelyhigh annualreturnsinmostyearssince2001.productivityestimatesbasedonthereturnseries updatedthrough2009(previouslythrough2005)haveincreasedorremainedat approximatelythesamelevelsasestimatedintherecoveryplan/ictrtstatus assessments.thecurrentratingsforspatialstructureanddiversitycriteriareflectthe assessmentsdoneforthe2008ictrtstatusassessments. 28 AnnualabundancedataseriesfortheTouchetRiversteelheadpopulationisrelatively shortandhasseveralmissingyears.productivityestimatesofa/{ratingareprovisional andshouldbeinterpretedwithcaution. From2007CSA 306
307 Table77 SummaryofcurrentstatusofpopulationsusingviabilitycriteriaincorporatedintotheMid Columbia SteelheadRecoveryPlanfortheYakimaMPG. Yakima MPG Population Satus Creek Toppenish Creek Naches River Upper Yakima ICTRT Minimum Threshold ,500 1,500 Abundance/Productivity Metrics Natural Spawning Abundance 660 ( ) 379 ( ) 599 ( ) 322 ( ) 840 ( ) 472 ( ) 151 (60-265) 85 (40-265) ICTRT Productivity 1.79 ( ) 1.73 ( ) 2.84 ( ) 1.60 ( ) 1.59 ( ) 1.12 ( ) 1.52 ( ) 1.12 ( ) Integrated A/P Risk Moderate Moderate Moderate Moderate High High High High Natural Processes Risk Spatial Structure and Diversity Metrics Diversity Risk Integrated SS/D Risk Low Moderate Moderate Low Moderate Moderate Overall Viability Rating Viable (Maintained) Viable (Maintained) Low Moderate Moderate High Risk Moderate High High High Risk OverallstatusratingsfortheUmatillaRiverandWallaWallapopulationsremainedat Maintainedafterincorporationoftheupdatedabundanceandproductivitydata.The currentstatusofthetouchetriverpopulationremainedathighrisk,primarilydrivenby relativelylowgeometricmeanproductivity.naturaloriginabundanceestimateshave increasedfortheumatillariverandthewallawallariverpopulationsrelativetothelevels reportedintherecoveryplan/ictrtcurrentstatusreviews(throughreturnyear2005). ProductivityestimatesforallthreeextantpopulationsinthisMPGarelowerthaninthe previousreviews.thecurrentratingsagainstspatialstructureanddiversitycriteriareflect theassessmentsdoneforthe2008ictrtstatusassessments. 307

308 Harvest Summer runsteelheadfromtheupperbasinaredividedinto2runsbymanagers: TheA run,andtheb run.theserunsarebelievedhavedifferencesintiming,but managersseparatethemonthebasisofsizealoneinestimatingthesizeoftheruns.thearunisbelievedtooccurthroughoutthemiddlecolumbia,uppercolumbia,andsnakeriver Basins,whiletheB runisbelievedtooccurnaturallyonlyinthesnakeriveresu,inthe ClearwaterRiver,MiddleForkSalmonRiver,andSouthForkSalmonRiver. Steelheadwerehistoricallytakenintribalandnon tribalgillnetfisheries,andin recreationalfisheriesinthemainstemcolumbiariverandintributaries.inthe1970s, retentionofsteelheadinnon tribalcommercialfisherieswasprohibited,andinthemid 1980s,tributaryrecreationalfisheriesinWashingtonadoptedmark selectiveregulations. Steelheadarestillharvestedintribalfisheries,inmainstemrecreationalfisheries,and thereisincidentalmortalityassociatedwithmark selectiverecreationrecreational fisheries.themajorityofimpactsonthesummerrunoccurintribalgillnetanddipnet fisheriestargetingchinooksalmon.becauseoftheirlargersize,theb runfisharemore vulnerabletothegillnetgear.consequently,thiscomponentofthesummerrun experienceshigherfishingmortalitythanthea runcomponent(figure148).inrecent years,totalexploitationratesonthea runhavebeenstableataround5%,while exploitationratesontheb runhavegenerallybeenintherangeof15%to20%. Figure148 TotalharvestimpactsonnaturalsummersteelheadaboveBonnevilleDam.Datafor fromnmfsbiologicalopinion(peterdygert,nmfs,personalcommunication),andfor fromTACrun reconstruction(cindylefleur,wdfwpersonalcommunication). 308
309 Hatcheryreleases Totalhatcheryreleasesofsteelhead,Chinookandcohohaveremainedsimilarsince 2005.Releasesforcohoandsteelheadfellsubstantiallyfromtheirlevelsinthemid 1990s (Figure149). 309
310 Figure149 SummaryofhatcheryreleasesbyspecieswithinthespawningandrearingboundariesoftheMid ColumbiaRiversteelheadESU.Datasource:RMIS. MiddleColumbiasteelhead:UpdatedRiskSummary Therehavebeenimprovementsintheviabilityratingsforsomeofthecomponent populations,butthemid ColumbiaSteelheadDPSisnotcurrentlymeetingtheviability 310
311 criteria(adoptedfromtheictrt)inthemid ColumbiaSteelheadRecoveryPlan.In addition,severalofthefactorscitedbythe2005brt(goodetal.2005)remainasconcerns orkeyuncertainties.naturaloriginspawningestimatesarehighlyvariablerelativeto minimumabundancethresholdsacrossthepopulationsinthedps.updatedinformation indicatesthatstraylevelsintoatleastthelowerjohndayriverpopulationarealsohigh. ReturnstotheYakimaRiverbasinandtotheUmatillaandWallaWallaRivershavebeen higheroverthemostrecentbroodcyclewhilenaturaloriginreturnstothejohndayriver havedecreased.outofbasinhatcherystrayproportions,althoughreduced,remainvery highinthedeschutesriverbasin.overallthenewinformationconsidereddoesnot indicateachangeinthebiologicalriskcategorysincethetimeofthelastbrtstatusreview. References Good, T.P., R.S. Waples and P. Adams (editors) Updated status of federally listed ESUs of West Coast salmon and steelhead. U.S. Dept. of Commer., NOAA Tech. Memo. NMFS-NWFSC-66, 598 p. ICTRT, Independent populations of chinook, steelhead and sockeye for listed evolutionarily significant units within the interior Columbia River domain. Interior Columbia Basin Technical Recovery Team Technical Review Draft. July p. ICTRT, Viability criteria for application to interior Columbia Basin salmonid ESUs. Interior Columbia Basin Technical Recovery Team. Technical Review Draft. March p + appendices and attachments. ICTRT(2008)Currentstatusreviews:InteriorColumbiaBasinsalmonESUsandsteelhead DPSs.Vol.3.MiddleColumbiaRiversteelheaddistinctpopulationsegment.300p. 311
312 LowerColumbiaRiversteelhead 29 ListedESU/DPS TheDPSincludesallnaturallyspawnedanadromousO.mykiss(steelhead) populationsbelownaturalandmanmadeimpassablebarriersinstreamsandtributariesto thecolumbiariverbetweenthecowlitzandwindrivers,washington(inclusive),andthe WillametteandHoodRivers,Oregon(inclusive),aswellastenartificialpropagation programs:thecowlitztrouthatchery(inthecispus,uppercowlitz,lowercowlitz,and TiltonRivers),KalamaRiverWild(winter andsummer run),clackamashatchery,sandy Hatchery,andHoodRiver(winter andsummer run)steelheadhatcheryprograms. ExcludedareO.mykisspopulationsintheupperWillametteRiverBasinaboveWillamette Falls,Oregon,andfromtheLittleandBigWhiteSalmonRivers,Washington. ESU/DPSBoundaryDelineation Utilizingnewinformation,theESUBoundariesReviewGroup(Myersetal,this report)undertookarevaluationoftheboundarybetweenalllowercolumbiaandmid ColumbiaESUsandDPSs.Thereviewconclusionsemphasizethetransitionalnaturethe boundarybetweenthelowercolumbiaesusandthemid ColumbiaESUs.After consideringnewdnadata,thereviewconcludes, itisreasonabletoincludetheklickitatin thelowercolumbiaesusanddps,thusestablishingacommonboundaryforchinook salmon,chumsalmon,cohosalmonandsteelheadatthehistoricallocationofcelilofalls (currentlythedallesdam). ThisstatusevaluationisbasedontheexistingLowerColumbia ESUboundariesthatdonotincludetheKlickitatpopulation. SummaryofPreviousBRTConclusions NMFS initially reviewed the status of the Lower Columbia River steelhead ESU in 1996 (Busby et al. 1996) and most recently in 1998 (NMFS 1998). In the 1998 review, the BRT noted several concerns for this ESU, including low abundance relative to historical levels, universal and often drastic declines observed since the mid-1980s, and widespread occurrence of hatchery fish in naturally spawning steelhead populations. Analysis also suggested that introduced summer-run steelhead may negatively affect native winter-run steelhead in some populations. A majority of the 1998 BRT concluded that steelhead in the Lower Columbia River steelhead ESU were at risk of becoming endangered in the foreseeable future. LCR steelhead were most recently reviewed by the BRT in 2005 (Good et al. 2005). A large majority (over 73%) of the BRT votes for this ESU fell in the likely to become endangered category, with small minorities falling in the danger of extinction and not likely to become endangered categories. The BRT found moderate risks in all the VSP categories. All of the major risk factors identified by previous BRTs still remained. Most populations were at relatively low abundance, and those with adequate data for modeling were estimated to have a relatively high extinction probability. Some populations, particularly summer run, had higher returns in the most recent years included in the 2005 report (years 2001 and 2002). TheWLC- TRT (Myers et al. 2002) estimated that at least four historical populations were extirpated. The hatchery contribution to natural spawning remained high in many populations. 29 Sectionauthor:PaulMcElhany 312
areusedinthisstatusupdateandwere usedforstatusevaluationsinrecentrecoveryplansbyodfwandlcfrb.")
313 SummaryofRecentEvaluations AreportonthepopulationstructureofLowerColumbiasalmonandsteelhead populationswaspublishedbythewlc TRTin2006(Myersetal.2006).Thesteelhead populationdesignationsinthatreport(figure150)areusedinthisstatusupdateandwere usedforstatusevaluationsinrecentrecoveryplansbyodfwandlcfrb.lcrchinook populationsexhibittwodifferentlifehistorytypesbaseonreturntimingandother features:winterrunandsummerrun. In2010,ODFWcompletedarecoveryplanthatincludedOregonpopulationsof LowerColumbiasteelheadDPS.Alsoin2010,theLCFRBcompletedarevisionofits recoveryplanthatincludeswashingtonpopulationsoflowercolumbiasteelhead.bothof theserecoveryplansincludeanassessmentofcurrentstatusoflcrsteelheadpopulations. TheseassessmentsreliedandbuiltupontheviabilitycriteriadevelopedbytheWLC TRT (McElhanyetal2006)andanearlierevaluationofOregonWLCpopulations(McElhanyet al.2007).theseevaluationsassessedthestatusofpopulationswithregardtothevsp parametersofabundanceandproductivity,spatialstructureanddiversity(mcelhanyetal. 2000).TheresultsoftheseanalysesareshowninFigure151andFigure152. Theseanalysesindicatethatonlytwoofthe26LCRsteelheadpopulations(Wind summerandclackamaswinter)arecurrentlyconsidered viable (i.e.<95%riskof extinction).17ofthe26populations(65%)areintheveryhighorhighriskcategory,with 11ofthepopulationsmostlikelyintheveryhighriskcategory(alsodescribedas extirpatedornearlyso ).Thepoorestperformingpopulationswerethosehabitatisabove impassibledams(e.g.nflewis)orinhighlyurbanizedwatersheds(e.g.salmoncreek). 313
. From Myers et al. (2006).")
314 Figure150 Populations of LCR winter steelhead (upper) and summer steelhead (Lower). From Myers et al. (2006). 314

315 Figure151 OregonLCRsteelheadpopulationstatusfromODFWLCRrecoveryplan(2010). 315
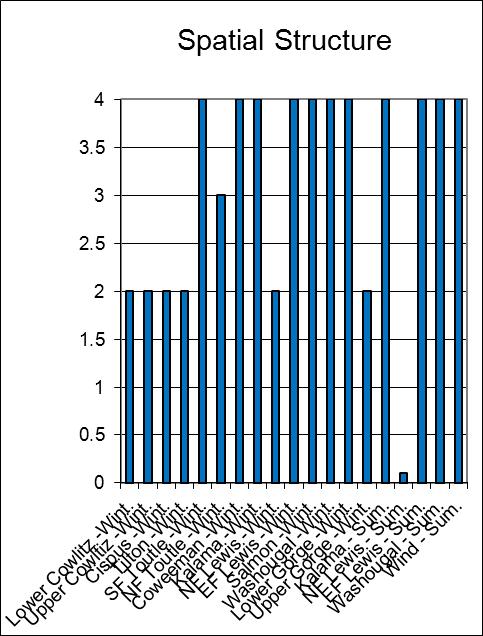
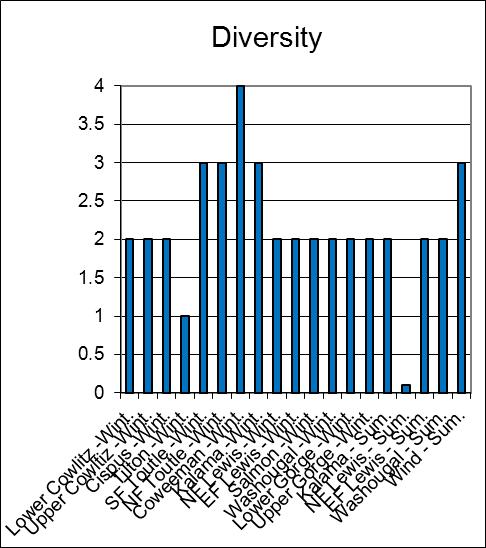
316 Figure152 CurrentstatusofWashingtonLCRsteelheadpopulationsfortheVSPparametersandoverall populationrisk.(lcfrb2010recoveryplan,chapter6).apopulationscoreofzeroindicatesapopulation extirpatedornearlyso,ascoreof1ishighrisk,2ismoderaterisk,3islowrisk( viable )and4isverylowrisk. NewDataandAnalyses 316
317 The2005BRTstatusevaluationincludedabundancedataformostoftheLCR steelheadpopulationsuptotheyear2001.forthecurrentevaluation,wehavecompiled datathrough2008formostpopulations.trenddataarepresentedinfigure153,with statisticalsummaryinappendixa.sincethelaststatusevaluations,allofthepopulations increasedinabundanceduringtheearly2000 s,generallypeakingin2004.most populationshavesincedeclinedbacktolevelswithinonestandarddeviationofthelong termmean.exceptionsarethewashougalsummerrunandnftoutlewinterrun,which arestillhigherthanthelongtermaverageandthesandywhichislower.thenftoutle winterrunappearstobeexperiencinganlongertermincreasingtrendsince1990,whichis partiallyattributedtowatershedrecoveryfromtheeruptionofmt.st.helensin1980.the Sandywintersteelheadpopulationisbelowonestandarddeviationfromthelong term meananddidnotsothe2004increasespikeoftheotherpopulationsintheesu, suggestingthatthepopulationlackresilience.ingeneral,thepopulationsdonotshowany sustaineddramaticchangesinabundanceorfractionofhatcheryoriginspawnerssincethe 2005BRTevaluation. 317

318 318
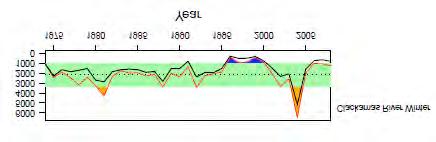
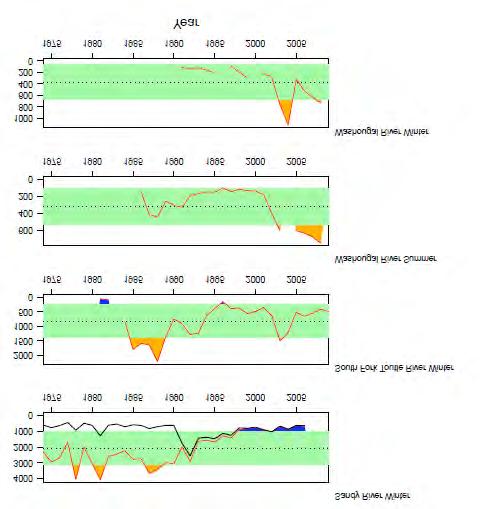
319 319
meanofthetotalspawers,andthegreenshadedareaindicates+/ 1standard deviationaroundthemean.")
320 Figure153 LCRsteelheadtrendsinabundance.Thedarklineindicatesnaturaloriginspawnernumbers,light (red)lineindicatestotalnaturalspawners(includingnaturallyspawninghatcheryfish).thedottedlineisthe long term(wholetimeseries)meanofthetotalspawers,andthegreenshadedareaindicates+/ 1standard deviationaroundthemean. Harvest WinterRun Fewwinter runfishmigrateabovebonnevilledamwheretribalfisheriesoccur.in addition,winter runsteelheadareinthemainstemriveratatimewhenthereisgenerally littleornofishingoccurringthere.recreationalfisheriesinwashingtontributarieshave beenmarkselectivesincethemid 1980s.Thereisnodirectedwintersteelheadfisheryin thewillametteriver.wintersteelheadfisheriesusedtotargethatcheryrunsthathadan earlierruntimingbutthosehatcheryprogramswerediscontinuedintheperiodfrom BecauseveryfewofthefishascendaboveBonnevilleDam,therewaslittle focusonthisrunpriortolisting.totalfisheryexploitationratesforthenaturalcomponent areonlyavailablebackto2001(figure154).inthattimeperiodexploitationrateshave beenbelowtheconsultationstandardof2%inallyearsexcept
.")
321 Figure154 TotalexploitationratesonnaturalwintersteelheadfromtheColumbiaBasin.Wintersteelhead includethelowercolumbiariveresu,upperwillametteriveresu,andportionsofthemiddlecolumbiariver andwashingtoncoastalesus.datafromtac(2010). Hatcheries ThetotalsteelheadhatcheryreleasesintheLCRESUhaveincreasedsincethelast statusevaluationin2005fromabout2milliontoaround3million(figure155).some populations(e.g.hoodriver,kalama)haverelativelyhighfractionsofhatcheryorigin spawnerswhereasothers(e.g.wind)haverelativelyfewhatcheryoriginspawners. AlthoughrecoveryplansandtheHSRGrecommendsomechangesinhatcheryprograms, therehavenotbeensubstantialchangesfromthelaststatusreview. Figure155 AnnualLCRsteelheadhatcheryreleases.Thedottedlineindicatesthemeanandtheshadedareathe standarddeviation.datasource:rmis. 321
322 LowerColumbiaRiversteelhead:UpdatedRiskSummary ThreestatusevaluationsofLCRsteelheadstatus,allbasedonWLC TRTcriteria, havebeenconductedsincethelastbrtstatusupdatein2005(mcelhanyetal.2007,odfw 2010,LCFRB2010).AllthreeevaluationsconcludedthattheESUiscurrentlyathighriskof extinction.ofthe26historicalpopulationsintheesu,17areconsideredathighorvery highrisk.populationsintheupperlewis,cowlitzandwhitesalmonwatershedsremain cut offfromaccesstoessentialspawninghabitatbyhydroelectricdams.projectstoallow accesshavebeeninitiatedinthecowlitzandlewissystemsbutthesehavenotyet producedself sustainingpopulations.thepopulationsgenerallyremainatrelativelylow abundancewithrelativelylowproductivity.overall,thenewinformationconsidereddoes notindicateachangeinthebiologicalriskcategorysincethetimeofthelastbrtstatus review. References Busby,P.J.,T.C.Wainwright,G.J.Bryant,L.J.Lierheimer,R.S.Waples,F.W.Waknitz,andI. V.Lagomarsino.1996.StatusreviewofWestCoaststeelheadfromWashington, Idaho,Oregon,andCalifornia.U.S.Dept.Commer.,NOAATech.Memo.NMFS NWFSC 27. Good,T.P.,R.S.Waples,andP.Adams,editors.2005.Updatedstatusoffederallylisted ESUsofWestCoastsalmonandsteelhead.U.S.DepartmentofCommerce,Seattle. LowerColumbiaFishRecoveryBoard.2010.WashingtonlowerColumbiasalmonrecovery andfishandwildlifesubbasinplan.lowercolumbiafishrecoveryboard,olympia, WA. McElhany,P.,C.Busack,M.Chilcote,S.Kolmes,B.McIntosh,J.M.Myers,D.Rawding,A. Steel,C.Steward,D.Ward,T.Whitesel,andC.Willis.2006.Revisedviabilitycriteria forsalmonandsteelheadinthewillametteandlowercolumbiabasins.report, NOAANorthwestFisheriesScienceCenter,Seattle. McElhany,P.,M.Chilcote,J.M.Myers,andR.Beamesderfer.2007.ViabilitystatusofOregon salmonandsteelheadpopulationsinthewillametteandlowercolumbiabasins. NOAA NorthwestFisheriesScienceCenter,Seattle,WA. McElhany,P.,M.H.Ruckelshaus,M.J.Ford,T.C.Wainwright,andE.P.Bjorkstedt Viablesalmonidpopulationsandtherecoveryofevolutionarilysignificantunits. TechnicalMemorandumNMFS NWFSC 42,NOAA,Seattle. Myers,J.M.,C.Busack,D.Rawding,andA.R.Marshall.2002.Identifyinghistorical populationsofchinookandchumsalmonandsteelheadwithinthelowercolumbia RiverandUpperWillametteRiverevolutionarilysignificantunits.May10draft reporttothecomanagersfromthewillamette/lowercolumbiarivertechnical RecoveryTeam,NorthwestFisheriesScienceCenter,2725MontlakeBlvd.E.,Seattle, WA Myers,J.M.,C.Busack,D.Rawding,A.R.Marshall,D.J.Teel,D.M.VanDoornik,andM.T. Maher.2006.HistoricalpopulationstructureofPacificsalmonidsintheWillamette RiverandlowerColumbiaRiverbasins.NMFS NWFSC 73,NOAANWFSC,Seattle, WA. 322
323 NMFS.1998.StatusreviewupdatefordeferredandcandidateESUsofWestCoaststeelhead (LowerColumbiaRiver,UpperWillametteRiver,OregonCoast,KlamathMountains Province,NorthernCalifornia,CentralValley,andMiddleColumbiaRiverESUs). PredecisionalESAdocument,NationalMarineFisheriesService. OregonDepartmentofFishandWildlife,R.Beamesderfer,L.Berg,M.Chilcote,J.Firman,E. Gilbert,K.Goodson,D.Jepsen,T.Jones,S.Knapp,C.Knutsen,K.Kostow,B.McIntosh, J.Nicholas,J.Rodgers,T.Stahl,andB.Taylor.2010.LowerColumbiariver conservationandrecoveryplanfororegonpopulationsofsalmonandsteelhead. OregonDepartmentofFishandWildlife,Salem,OR. 323
324 UpperWillamettesteelhead 30 ListedESU/DPS TheDPSincludesallnaturallyspawnedanadromousO.mykiss(steelhead)populations belownaturalandmanmadeimpassablebarriersinthewillametteriver,oregon,andits tributariesupstreamfromwillamettefallstothecalapooiariver(inclusive). ESU/DPSBoundaryDelineation TheESUBoundariesReviewGroup(seeESUBoundariesabove)didnotidentifyany newinformationsuggestingarevaluationoftheupperwillamettesteelheadesu.this statusevaluationwasconductedbasedonexistingesuboundaries. SummaryofPreviousBRTConclusions NMFS initially reviewed the status of the Upper Willamette River steelhead ESU in 1996 (Busby et al. 1996), with an update in 1999 (NMFS 1999). In the 1999 review, the BRT noted several concerns for this ESU, including relatively low abundance and steep declines since The previous BRT was also concerned about the potential negative interaction between nonnative summer-run steelhead and native winter-run steelhead. The previous BRT considered the loss of access to historical spawning grounds because of dams to be a major risk factor. The 1999 BRT reached a unanimous decision that the Upper Willamette River steelhead ESU was at risk is of becoming endangered in the foreseeable future. In the most recent status update (Good et al. 2005), a majority (over 71%) of the BRT votes for this ESU fell in the likely to become endangered category, with small minorities falling in the danger of extinction and not likely to become endangered categories. The BRT did not identify any extreme risks for this ESU but found moderate risks in all the VSP categories. On a positive note, the 2005 BRT noted that after a decade in which overall abundance (Willamette Falls count) hovered around the lowest levels on record, adult returns for 2001 and 2002 were up significantly, on par with levels seen in the 1980s. Still, the total abundance was considered small for an entire ESU, resulting in a number of populations that were each at relatively low abundance. Summary of Recent Evaluations AreportonthepopulationstructureofLowerColumbiaandWillamettesalmonand steelheadpopulationswaspublishedbythewlc TRTin2006(Myersetal.2006).TheUW steelheadpopulationdesignationsinthatreport(figure156)areusedinthisstatusupdate andwereusedforstatusevaluationsinarecentrecoveryplanbyodfw(2010). AdraftrecoveryplanforUWChinookandSteelheadwasreleasedforcommentby ODFWin2010.ThestatusevaluationintheODFWrecoveryplanprovidedanupdateofthe statusevaluationofmcelhanyetal.(2007),whichreliedonmethodsandviabilitycriteria developedbythewlc TRT(McElhanyetal.2006).TheresultsoftheMcElhanyetal. (2007)evaluationaresummarizedinFigure157.Theseresultsindicatethatthemostlikely overallstatusofallpopulationswasinthe moderaterisk category.theodfwrecovery planupdateanalysis(2010)indicatedthatthemostlikelycategoryforthenorthandsouth 30 Sectionauthor:PaulMcElhany 324

325 Santiampopulationswas lowrisk ratherthan moderaterisk.themcelhanyetal. analysisuseddataupto2005,whereastheodfwanalysisuseddatathrough2008. ExtinctionriskmodelingintheODFW2010recoveryplansuggeststhat,basedonlyon biologicalinformation,theesuisviable.however,therecoveryplanindicatesthat increasingthreatstoesuplaceitatconsiderablerisk. Figure156 Upper Willamette steelhead populations (from Myers et al. 2006) 325

326 Figure157 Status of UW steelhead populations (from McElhany et al. 2007). NewDataandAnalysis Willamette Falls All steelhead in the UW steelhead ESU pass Willamette Falls (Figure158). In the 2005 BRT report, data were only available to the year 2002 when the ESU appeared to be increasing. However, population abundance peaked in 2002 and since returned to the relatively low abundance of the 1990s. The late-returning abundance for the entire ESU in 2009 was 2,110 fish. 326
327 Figure158 Count of winter steelhead at Willamette falls. The upper (orange) line shows the total winter steelhead run. The lower (black) line show the late winter steelhead run, which is considered the native life history. Hatchery releases of winter run steelhead in the Willamette were discontinued in Data from ODFW online Willamette Falls count database ( Steelhead Populations The 2005 BRT report used abundance data for the years for the Mollala population and years for the other three populations. The current analysis uses data through 2008 (Figure159). The population estimates mirror the patterns at Willamette Falls with declines in the most recent years. In the 2008, the total abundance of winter steelhead at Willamette Falls was 4,915, which were distributed (minus in basin mortality) into the four populations. 327
 line indicates total natural spawners (including naturally spawning hatchery fish).")
328 Figure159 Spawner abundance of UW steelhead populations. The dark line indicates natural origin spawner numbers, light (red) line indicates total natural spawners (including naturally spawning hatchery fish). The dotted line is the longterm (whole time series) mean of the total spawners, and the green shaded area indicates +/- 1 standard deviation around the mean. Harvest ThereisnodirectedwintersteelheadfisheryintheWillametteRiver.Wintersteelhead fisheriesusedtotargethatcheryrunsthathadanearlierruntimingbutthosehatchery programswerediscontinuedintheperiodfrom Totalfisheryexploitationrates forthenaturalcomponentareonlyavailablebackto2001(figure160).inthattime 328
329 periodexploitationrateshavebeenbelowtheconsultationstandardof2%inallyears except2002. Figure160 Figure#.5:TotalexploitationratesonnaturalwintersteelheadfromtheColumbiaBasin.Winter steelheadincludethelowercolumbiariveresu,upperwillametteriveresu,andportionsofthemiddle ColumbiaRiverandWashingtonCoastalESUs.DatafromTAC(2010). Hatcheries Winter steelhead hatchery releases in the UW ceased in However, there is still a substantial hatchery program for non-native summer steelhead. In recent years, returning summer steelhead have outnumber the native winter run steelhead, which raises genetic and ecological concerns (Figure161). Total steelhead releases in the basin are shown in Figure

330 Figure161 Non-native, summer steelhead count at Willamette Falls. (data from ODFW online Willamette Falls count database.) Figure162 Steelhead hatchery releases in the upper Willamette basin. UpperWillamettesteelhead:UpdatedRiskSummary Since the last BRT status update, UW steelhead initially increased in abundance but subsequently declines and current abundance is at the levels observed in the mid-1990s when the DPS was first listed. The DPS appears to be at lower risk than the Upper Willamette Chinook ESU, but continues to demonstrate the overall low abundance pattern that was of concern during the last BRT review. The elimination of winter run hatchery release in the basin reduces hatchery 330
ESCA. Endangered Species Conservation Act of 1969 Changed in 1973 to ESA Amended several times
 ESCA Endangered Species Conservation Act of 1969 Changed in 1973 to ESA Amended several times International Efforts http://www.cites.org/ Convention on International Trade in Endangered Species of Wild
Summary of HSRG Findings for Chum Populations in the Lower Columbia River and Gorge
 Summary of HSRG Findings for Chum Populations in the Lower Columbia River and Gorge The Congressionally-established Hatchery and Scientific Review Group (HSRG) developed a foundation of salmon hatchery
Perspectives of a State Director Selective fisheries as a tool in fisheries management and salmon recovery
 Perspectives of a State Director Selective fisheries as a tool in fisheries management and salmon recovery Jeffrey P. Koenings, PhD. Washington Department of Fish and Wildlife American Fisheries Society
Salmon Challenge. Salmon evolution and obstacles to survival
 Salmon Challenge Salmon evolution and obstacles to survival Over erview iew Students become salmon and, in two different activities, experience many of the obstacles that salmon face while swimming upstream
Salmon Recovery Planning in Washington
 Salmon Recovery Planning in Washington Chris Drivdahl Governor s Salmon Recovery Office January 17, 2006 Where Are We Going? State & State Agencies Water Legislation Policy Picture Independent Science
September 4, Update on Columbia basin Salmon and Steelhead Recovery Planning
 Bill Bradbury Chair Oregon Henry Lorenzen Oregon W. Bill Booth Idaho James A. Yost Idaho Jennifer Anders Vice Chair Montana Pat Smith Montana Tom Karier Washington Phil Rockefeller Washington September
Strategies for mitigating ecological effects of hatchery programs
 Strategies for mitigating ecological effects of hatchery programs Some case studies from the Pacific Northwest Kathryn Kostow Oregon Department of Fish and Wildlife Ecological risks occur when the presence
PRESEASON REPORT III COUNCIL ADOPTED MANAGEMENT MEASURES
 PRESEASON REPORT III COUNCIL ADOPTED MANAGEMENT MEASURES AND ENVIRONMENTAL ASSESSMENT PART 3 FOR 2018 OCEAN SALMON FISHERY REGULATIONS REGULATION IDENTIFIER NUMBER 0648-BH22 Pacific Fishery Management
PRESEASON REPORT III COUNCIL ADOPTED MANAGEMENT MEASURES
 PRESEASON REPORT III COUNCIL ADOPTED MANAGEMENT MEASURES AND ENVIRONMENTAL ASSESSMENT PART 3 FOR 2017 OCEAN SALMON FISHERY REGULATIONS REGULATION IDENTIFIER NUMBER 0648-BG59 Pacific Fishery Management
 Informational Report 1 USFWS Mass Marking Update April 2005 Update on USFWS 2005 Mass Marking Initiative Background Under Section 138 of FY 2003 Omnibus Appropriations Act (PL 108-7), Congress directed
PRESEASON REPORT III ANALYSIS OF COUNCIL ADOPTED MANAGEMENT MEASURES
 PRESEASON REPORT III ANALYSIS OF COUNCIL ADOPTED MANAGEMENT MEASURES FOR 2011 OCEAN SALMON FISHERIES PREPARED BY THE SALMON TECHNICAL TEAM Pacific Fishery Management Council 7700 NE Ambassador Place, Suite
29.0 CALIFORNIA CENTRAL VALLEY STEELHEAD ESU
 29.0 CALIFORNIA CENTRAL VALLEY STEELHEAD ESU 29.1 BACKGROUND 29.1.1 Description of the ESU The California Central Valley Steelhead (CCVS) ESU includes all naturally spawned populations of steelhead (and
ESTIMATED RETURNS AND HARVEST OF COLUMBIA RIVER FALL CHINOOK 2000 TO BY JOHN McKERN FISH PASSAGE SOLUTIONS
 ESTIMATED RETURNS AND HARVEST OF COLUMBIA RIVER FALL CHINOOK 2000 TO 2007 BY JOHN McKERN FISH PASSAGE SOLUTIONS ESTIMATED RETURNS AND HARVEST OF COLUMBIA RIVER FALL CHINOOK 2000 TO 2007 This analysis of
PRESEASON REPORT III ANALYSIS OF COUNCIL ADOPTED MANAGEMENT MEASURES
 PRESEASON REPORT III ANALYSIS OF COUNCIL ADOPTED MANAGEMENT MEASURES FOR 2010 OCEAN SALMON FISHERIES PREPARED BY THE SALMON TECHNICAL TEAM Pacific Fishery Management Council 7700 NE Ambassador Place, Suite
PRESEASON REPORT II PROPOSED ALTERNATIVES
 PRESEASON REPORT II PROPOSED ALTERNATIVES AND ENVIRONMENTAL ASSESSMENT PART 2 FOR 2018 OCEAN SALMON FISHERY REGULATIONS REGULATION IDENTIFIER NUMBER 0648-BH22 Pacific Fishery Management Council 7700 NE
PRESEASON REPORT II ANALYSIS OF PROPOSED REGULATORY OPTIONS FOR 2009 OCEAN SALMON FISHERIES
 PRESEASON REPORT II ANALYSIS OF PROPOSED REGULATORY OPTIONS FOR 2009 OCEAN SALMON FISHERIES Pacific Fishery Management Council 7700 NE Ambassador Place, Suite 101 Portland, OR 97220-1384 (503) 820-2280
Draft Central Valley Salmon and Steelhead Recovery Plan
 Draft Central Valley Salmon and Steelhead Recovery Plan for Sacramento River winter-run Chinook salmon Central Valley spring-run Chinook Salmon Central Valley Steelhead National Marine Fisheries Service
PRESEASON REPORT II PROPOSED ALTERNATIVES
 PRESEASON REPORT II PROPOSED ALTERNATIVES AND ENVIRONMENTAL ASSESSMENT PART 2 FOR 2019 OCEAN SALMON FISHERY REGULATIONS REGULATION IDENTIFIER NUMBER 0648- BI05 Pacific Fishery Management Council 7700 NE
PRESEASON REPORT III COUNCIL ADOPTED MANAGEMENT MEASURES
 PRESEASON REPORT III COUNCIL ADOPTED MANAGEMENT MEASURES AND ENVIRONMENTAL ASSESSMENT PART 3 FOR 2016 OCEAN SALMON FISHERY REGULATIONS REGULATION IDENTIFIER NUMBER 0648-BF56 Pacific Fishery Management
"Recommended Improvements for the Next Pacific Salmon Treaty"
 "Recommended Improvements for the Next Pacific Salmon Treaty" Randall M. Peterman School of Resource and Environmental Management Simon Fraser University Burnaby, British Columbia, Canada Web site: http://www.rem.sfu.ca/fishgrp/
PRESEASON REPORT III COUNCIL ADOPTED MANAGEMENT MEASURES
 PRESEASON REPORT III COUNCIL ADOPTED MANAGEMENT MEASURES AND ENVIRONMENTAL ASSESSMENT PART 3 FOR 2015 OCEAN SALMON FISHERY REGULATIONS REGULATION IDENTIFIER NUMBER 0648-XD843 Pacific Fishery Management
PRESEASON REPORT II PROPOSED ALTERNATIVES
 PRESEASON REPORT II PROPOSED ALTERNATIVES AND ENVIRONMENTAL ASSESSMENT PART 2 FOR 2016 OCEAN SALMON FISHERY REGULATIONS REGULATION IDENTIFIER NUMBER 0648-BF56 Pacific Fishery Management Council 7700 NE
Application of IP Models for Salmon and Steelhead Recovery Planning in California
 Application of IP Models for Salmon and Steelhead Recovery Planning in California Brian Spence and David Boughton NMFS Southwest Fisheries Science Center Uses of IP models in technical recovery planning
OREGON AND WASHINGTON DEPARTMENTS OF FISH AND WILDLIFE JOINT STAFF REPORT - WINTER FACT SHEET NO.
 OREGON AND WASHINGTON DEPARTMENTS OF FISH AND WILDLIFE JOINT STAFF REPORT - WINTER FACT SHEET NO. 3a Columbia River Compact/Joint State Hearing February 21, 2018 Fisheries under consideration: Mainstem
PRESEASON REPORT III ANALYSIS OF COUNCIL ADOPTED MANAGEMENT MEASURES
 PRESEASON REPORT III ANALYSIS OF COUNCIL ADOPTED MANAGEMENT MEASURES FOR 2009 OCEAN SALMON FISHERIES PREPARED BY THE SALMON TECHNICAL TEAM Pacific Fishery Management Council 7700 NE Ambassador Place, Suite
Of the Salmon and For the Salmon
 Of the Salmon and For the Salmon for millions of years the wild salmon has helped nourish the plant and animal life of the temperate rain forest. Born in the streams and rivers of the forest, the salmon
Addressing Critical Uncertainties in the Reintroduction of Chum Salmon to Oregon Tributaries of the Columbia River. Kris Homel
 Addressing Critical Uncertainties in the Reintroduction of Chum Salmon to Oregon Tributaries of the Columbia River Kris Homel NW Fish Culture Concepts Wilsonville, OR 2015 Historic distribution and abundance
Press Release New Bilateral Agreement May 22, 2008
 Informational Report 3 June 2008 Press Release New Bilateral Agreement May 22, 2008 The Pacific Salmon Commission is pleased to announce that it has recommended a new bilateral agreement for the conservation
NOAA Technical Memorandum NMFS VIABILITY ASSESSMENT FOR PACIFIC SALMON AND STEELHEAD LISTED UNDER THE ENDANGERED SPECIES ACT: SOUTHWEST
 doi:10.7289/v5/tm-swfsc-564 NOAA Technical Memorandum NMFS JULY 2016 VIABILITY ASSESSMENT FOR PACIFIC SALMON AND STEELHEAD LISTED UNDER THE ENDANGERED SPECIES ACT: SOUTHWEST Thomas H. Williams Brian C.
We recommend that whenever possible you use the following guidelines for choosing the most sustainable options in 2010.
 Ocean Wise Seasonal salmon report 2010 NOTE: THE FOLLOWING RECOMMENDATIONS ARE BASED ON EARLY TEST FISHERY RESULTS. ACTUAL IN-SEASON RUN STRENGTH CAN CHANGE AND WILL BE UPDATED AS NECESSARY. Returns of
Pacific Fishery Management Council NEWS RELEASE WEST COAST SALMON SEASON DATES SET
 Pacific Fishery Management Council NEWS RELEASE FOR IMMEDIATE RELEASE: Tuesday, April 11, 2017 Contact: Ms. Jennifer Gilden, Communications Officer, Jennifer.gilden@noaa.gov Mr. Mike Burner, Deputy Director,
Old Document: Sandy River Coho Final HGMP 78 pages (1.18 MB) 12/10/2013 3:11:23 PM
 12/10/2013 3:11:23 PM") Summary 12/10/2013 3:11:56 PM Differences exist between documents. New Document: sandy_co_hgmp_11-6-13_final 76 pages (841 KB) 12/10/2013 3:11:23 PM Used to display results. Old Document: Sandy River Coho
Summary 12/10/2013 3:11:56 PM Differences exist between documents. New Document: sandy_co_hgmp_11-6-13_final 76 pages (841 KB) 12/10/2013 3:11:23 PM Used to display results. Old Document: Sandy River Coho
CHAPTER II CHINOOK SALMON MANAGEMENT CENTRAL VALLEY CHINOOK STOCKS. Management Objectives. Regulations to Achieve Objectives.
 CHAPTER II CHINOOK SALMON MANAGEMENT CENTRAL VALLEY CHINOOK STOCKS Central Valley Chinook stocks include fall, late-fall, winter, and spring stocks of the Sacramento and San Joaquin rivers and their tributaries.
Brian Missildine Natural Resource Scientist Hatchery Evaluation and Assessment Team Lead Washington-British Columbia Annual General Meeting Kelowna,
 Brian Missildine Natural Resource Scientist Hatchery Evaluation and Assessment Team Lead Washington-British Columbia Annual General Meeting Kelowna, BC March 19-22 REFORMER REFORMED WA Dept. of Fish and
MEMORANDUM. Joan Dukes, NPCC. Michele DeHart. DATE: August 5, Data Request
 FISH PASSAGE CENTER 1827 NE 44 th Ave., Suite 240, Portland, OR 97213 Phone: (503) 230-4099 Fax: (503) 230-7559 http://www.fpc.org/ e-mail us at fpcstaff@fpc.org MEMORANDUM TO: Joan Dukes, NPCC FROM: Michele
June 3, 2014 MEMORANDUM. Council Members. Stacy Horton, Policy Analyst, Washington. SUBJECT: Final 2012 Hatchery Fin Clip Report
 Bill Bradbury Chair Oregon Henry Lorenzen Oregon W. Bill Booth Idaho James A. Yost Idaho Jennifer Anders Vice Chair Montana Pat Smith Montana Tom Karier Washington Phil Rockefeller Washington June 3, 2014
Stock Assessment of Anadromous Salmonids, 2003 Report Number: OPSW-ODFW
 THE OREGON PLAN for Salmon and Watersheds Stock Assessment of Anadromous Salmonids, 3 Report Number: OPSW-ODFW-- The Oregon Department of Fish and Wildlife prohibits discrimination in all of its programs
Early Marine Migrations. General geography Four general patterns Influence of genetics
 Early Marine Migrations General geography Four general patterns Influence of genetics Coastal range of anadromous Pacific salmon and trout Techniques employed to study salmon at sea Recently developed
Endangered and Threatened Wildlife and Plants; Recovery Plan for the. SUMMARY: We, the U.S. Fish and Wildlife Service (Service), announce the
, announce the") This document is scheduled to be published in the Federal Register on 09/30/2015 and available online at http://federalregister.gov/a/2015-24670, and on FDsys.gov Billing Code 4310 55 DEPARTMENT OF THE
This document is scheduled to be published in the Federal Register on 09/30/2015 and available online at http://federalregister.gov/a/2015-24670, and on FDsys.gov Billing Code 4310 55 DEPARTMENT OF THE
for Salmon and Watersheds
 for Salmon and Watersheds Stock Assessment of Anadromous Salmonids, Report Number: OPSW-ODFW-3- The Oregon Department of Fish and Wildlife prohibits discrimination in all of its programs and services on
Backgrounder and Frequently Asked Questions
 Backgrounder and Frequently Asked Questions Who Sent the Letter? The 60-day Notice of Intent to File Suit was sent by Conservation Angler, Wild Fish Conservancy, Snake River Waterkeeper, Friends of the
Proposed 2018 Fisheries Management Measures to Support Recovery of Interior Fraser River Steelhead
 Proposed 2018 Fisheries Management Measures to Support Recovery of Interior Fraser River Steelhead 22-March-2018 Spawning escapements of two Interior Fraser River steelhead stocks, Thompson and Chilcotin
The following language describing the performance standards was taken from the Reasonable and Prudent Alternative Table of Actions in the 2008 BIOP:
 FISH PASSAGE CENTER 1827 NE 44 th Ave., Suite 240, Portland, OR 97213 Phone: (503) 230-4099 Fax: (503) 230-7559 http://www.fpc.org/ e-mail us at fpcstaff@fpc.org MEMORANDUM TO: FROM: Michele DeHart Margaret
Michael Tehan, Assistant Regional Administrator, Interior Columbia Basin Office
 UNITED STATES DEPARTMENT OF COMMERCE National Oceanic and Atmospheric Administration NATIONAL MARINE FISHERIES SERVICE Northwest Fisheries Science Center Fish Ecology Division 2725 Montlake Boulevard East
Throughout the Pacific Northwest, salmon and steelhead have been listed under the Endangered Species Act because their existence is either threatened
 Throughout the Pacific Northwest, salmon and steelhead have been listed under the Endangered Species Act because their existence is either threatened or endangered. The Upper Willamette River Basin s spring
[FWS R1 ES 2015 N076; FXES FF01E00000] Endangered and Threatened Wildlife and Plants; Revised Draft Recovery Plan for
![[FWS R1 ES 2015 N076; FXES FF01E00000] Endangered and Threatened Wildlife and Plants; Revised Draft Recovery Plan for](/thumbs/87/96960993.jpg "[FWS R1 ES 2015 N076; FXES FF01E00000] Endangered and Threatened Wildlife and Plants; Revised Draft Recovery Plan for") This document is scheduled to be published in the Federal Register on 06/04/2015 and available online at http://federalregister.gov/a/2015-13624, and on FDsys.gov DEPARTMENT OF THE INTERIOR Fish and Wildlife
This document is scheduled to be published in the Federal Register on 06/04/2015 and available online at http://federalregister.gov/a/2015-13624, and on FDsys.gov DEPARTMENT OF THE INTERIOR Fish and Wildlife
COMPREHENSIVE MANAGEMENT PLAN FOR PUGET SOUND CHINOOK: HARVEST MANAGEMENT COMPONENT. Puget Sound Indian Tribes. And
 COMPREHENSIVE MANAGEMENT PLAN FOR PUGET SOUND CHINOOK: HARVEST MANAGEMENT COMPONENT Puget Sound Indian Tribes And The Washington Department of Fish and Wildlife March 1, 2004 i Table of Contents Executive
Okanagan Sockeye Reintroduction
 Okanagan Sockeye Reintroduction Backgrounder Elders accounts, and other forms of Traditional Ecological Knowledge (TEK) tell us that many species of salmon once came into the Okanagan Valley and tell us
CHAPTER 4 DESIRED OUTCOMES: VISION, GOALS, AND OBJECTIVES
 CHAPTER 4 DESIRED OUTCOMES: VISION, GOALS, AND OBJECTIVES Vision One of the first steps in developing this Plan was articulating a vision - a clear statement of what the Plan strives to achieve and what
Implementation Toolkit
 Conservation and Recovery Plan for Oregon Steelhead s in the Middle Columbia Steelhead Distinct Segment: Implementation Toolkit Oregon Department of Fish & Wildlife September 2012 0 Introduction The Implementation
Pacific Fishery Management Council NEWS RELEASE
 Pacific Fishery Management Council NEWS RELEASE FOR IMMEDIATE RELEASE: Monday, March 13, 2017 Contact: Ms. Jennifer Gilden, Communications Officer, 503 820 2418 or jennifer.gilden@noaa.gov Mr. Mike Burner,
Report on Science Center Activities
 Agenda Item E.1.b Supp NMFS PowerPoint March 2016 Report on Science Center Activities Columbia River Estuary Habitat Puget Sound Harbor Seal Predation West Coast Salmon GSI Climate Update Evaluating the
Discussion Paper: February 15, 2018
 Discussion Paper: February 15, 2018 Proposed 2018 Salmon Fishery Management Measures to Support Chinook Salmon Prey Availability for Southern Resident Killer Whales Contents 1. Purpose... 2 1.0 Background...
Maintaining biodiversity in mixed-stock salmon fisheries in the Skeena watershed
 Maintaining biodiversity in mixed-stock salmon fisheries in the Skeena watershed A 130-year history Chris C. Wood Principle: Mixed-stock transboundary fisheries impose special requirements on management
May 28, SUBJECT: Management Recommendations from ISRP/ISAB s Tagging Report #2009-1
 W. Bill Booth Chair Idaho James A. Yost Idaho Tom Karier Washington Dick Wallace Washington Bruce A. Measure Vice-Chair Montana Rhonda Whiting Montana Melinda S. Eden Oregon Joan M. Dukes Oregon May 28,
Conservation and Consumption: Nez Perce Tribe Duty and Obligation
 Conservation and Consumption: Nez Perce Tribe Duty and Obligation Our fate and the fate of the fish are linked. Dan Landeen and Allen Pinkham, Salmon and His People Fish provide us with both physical and
SALMON FACTS. Chinook Salmon. Oncorhynchus tshawytscha
 SALMON FACTS Chinook Salmon Oncorhynchus tshawytscha Other names: king, tyee, blackmouth (immature) Average size: 10-15 lbs, up to 135 lbs Fall spawner; fall, spring, and summer runs Chinook salmon are
2012 Bring Back the Natives Awarded Projects
 2012 Bring Back the Natives Awarded Projects EZG # Organization Project Title Project Description Location Description Total Award Amount Grantee Non- Federal Match 31904 Sanctuary Forest, Inc. Mattole
Declining patterns of Pacific Northwest steelhead trout spawner abundance and marine survival
 Declining patterns of Pacific Northwest steelhead trout spawner abundance and marine survival Neala Kendall, Gary Marston, and Matt Klungle Washington Department of Fish and Wildlife Presented by: Erik
Washington Trollers Association
 Washington Trollers Association P.O. Box 2185 Westport, WA 98595 Phone/Fax 360-648-2414 Email: dsaul@centurytel.net January 11, 2006 Dear Representative Dicks: Members of the Washington Trollers Association
Covered Species Accounts Central Valley Spring-Run Chinook Salmon
 A.18 CENTRAL VALLEY SPRING-RUN CHINOOK SALMON (ONCORHYNCHUS TSHAWYTSCHA) A.18.1 Legal and Other Status Central Valley Chinook salmon are composed of several genetically distinct races, or evolutionarily
Endangered and Threatened Species; Take of Anadromous Fish. AGENCY: National Marine Fisheries Service (NMFS), National Oceanic and Atmospheric
, National Oceanic and Atmospheric") This document is scheduled to be published in the Federal Register on 11/15/2017 and available online at https://federalregister.gov/d/2017-24690, and on FDsys.gov BILLING CODE: 3510-22-P DEPARTMENT OF
This document is scheduled to be published in the Federal Register on 11/15/2017 and available online at https://federalregister.gov/d/2017-24690, and on FDsys.gov BILLING CODE: 3510-22-P DEPARTMENT OF
Comparative Survival Study
 Comparative Survival Study SARs and Productivity Presenter: Charlie Petrosky CRSO Workshop September 21, 2017 1 Smolt to Adult Survival Rate (SAR) Goals PATH (1998); NMFS 2000 BiOp: 2% SAR met interim
HATCHERY AND GENETIC MANAGEMENT PLAN (HGMP)
") HATCHERY AND GENETIC MANAGEMENT PLAN (HGMP) Hatchery Program: SAFE Spring Chinook Species or Hatchery Stock: Spring Chinook stocks 022 and 024 (Willamette Stocks) Agency/Operator: Oregon Department of
HATCHERY AND GENETIC MANAGEMENT PLAN (HGMP) Hatchery Program: SAFE Spring Chinook Species or Hatchery Stock: Spring Chinook stocks 022 and 024 (Willamette Stocks) Agency/Operator: Oregon Department of
LOWER COLUMBIA SALMON AND STEELHEAD RECOVERY AND SUBBASIN PLAN. Technical Foundation Executive Summary
 LOWER COLUMBIA SALMON AND STEELHEAD RECOVERY AND SUBBASIN PLAN Technical Foundation Executive Summary Prepared For Northwest Power And Conservation Council MAY 28, 2004 DRAFT Prepared By: Lower Columbia
Salmon and Steelhead Spawning Survey Methods Stratification of Estimates
 Salmon and Steelhead Spawning Survey Methods Stratification of Estimates Oregon Department of Fish and Wildlife Oregon Adult Salmonid Inventory and Sampling Project Corvallis Research Lab September 2016
Union Pacific Railroad
 Input Questions: 404/401 Pre Application Meeting, December 18, 2013, Portland, Oregon 1. What is the project purpose and need? The purpose of the project is to improve the efficiency and average velocity
THE OREGON. PLAN for Salmon and Watersheds. Stock Assessment of Anadromous Salmonids, Report Number: OPSW-ODFW
 THE OREGON PLAN for Salmon and Watersheds Stock Assessment of Anadromous Salmonids, Report Number: OPSW-ODFW-1- The Oregon Department of Fish and Wildlife prohibits discrimination in all of it s programs
March 6, SUBJECT: Briefing on Columbia River Basin salmon and steelhead returns for 2017 and run forecasts for 2018
 James Yost Chair Idaho W. Bill Booth Idaho Guy Norman Washington Tom Karier Washington Jennifer Anders Vice Chair Montana Tim Baker Montana Ted Ferrioli Oregon Richard Devlin Oregon March 6, 2018 MEMORANDUM
FINAL HATCHERY AND GENETIC MANAGEMENT PLAN (HGMP)
") FINAL HATCHERY AND GENETIC MANAGEMENT PLAN (HGMP) Hatchery Program: Sandy River Coho Salmon Program Species or Hatchery Stock: Coho Salmon (Stock 11) Agency/Operator: Oregon Department of Fish and Wildlife
FINAL HATCHERY AND GENETIC MANAGEMENT PLAN (HGMP) Hatchery Program: Sandy River Coho Salmon Program Species or Hatchery Stock: Coho Salmon (Stock 11) Agency/Operator: Oregon Department of Fish and Wildlife
The Salmonid Species. The Salmonid Species. Definitions of Salmonid Clans. The Salmonid Species
 The Salmonid Species The Salmonid Species N. American salmon (2 more Asian species) Chinook ( King ) Coho ( Silver ) Sockeye Chum ( Dog ) Pink ( Humpy ) Sea-run trout Steelhead, Cutthroat, Dolly Varden
Ned Currence, Nooksack Indian Tribe
 Ned Currence, Nooksack Indian Tribe Problem Status Distribution Habitat Hatcheries Harvest 25000 20000 Natural-Origin Spawners 15000 10000 22500 5000 0 Historic catch Spawners (2011-2015) Problem Status
Coded Wire Tag Elimination from Management Questions
 Coded Wire Tag Elimination from Management Questions Hatchery...1 Habitat...2 Hydro...3 Harvest...4 Total Indicators Total Indicators Impacted FW rogram Indicators Impacted Current rimary Data Source Current
HOW HEALTHY ARE HEALTHY STOCKS?
 HOW HEALTHY ARE HEALTHY STOCKS? Case Studies of Three Salmon and Steelhead Stocks in Oregon and Washington, including Population Status, Threats, and Monitoring Recommendations Prepared for the Native
The Blue Heron Slough Conservation Bank
 1 The Blue Heron Slough Conservation Bank CONSERVATION BANKING July 19-23, 2010 CASE STUDY SERIES The Blue Heron Slough Conservation Bank (Washington) I. OVERVIEW & BACKGROUND: Location: Snohomish River
UNIT 4E. SALMON SUPPLEMENTAL INFORMATION
 UNIT 4E. SALMON SUPPLEMENTAL INFORMATION In the STUDENT HANDOUTS/TEACHER PAGES Section of this unit, we have provided you with a host of information from various sources to supplement not only this unit,
How Do We Know How Many Salmon Returned to Spawn? Implementing the California Coastal Salmonid Monitoring Plan in Mendocino County, California
 How Do We Know How Many Salmon Returned to Spawn? Implementing the California Coastal Salmonid Monitoring Plan in Mendocino County, California Sean P. Gallagher 1 and David W. Wright 2 Abstract California
California Steelhead: Management, Monitoring and Recovery Efforts
 California Steelhead: Management, Monitoring and Recovery Efforts Jonathan Nelson Steelhead Restoration & Management Program Oncorhynchus mykiss irideus California Steelhead Distinct Population Segments
? 13. Okanogan River Sockeye (15) 1 Not Warranted Not Available Sockeye Salmon. Lake Wenatchee Sockeye (16) 1 Not Warranted Not Available Steelhead
 1 Not Warranted Not Available Sockeye Salmon. Lake Wenatchee Sockeye (16) 1 Not Warranted Not Available Steelhead") Columbia River Basin? 17 Status and Trends of Salmon and Steelhead in the Columbia River Basin 2 1 11 4 7? 14 5? 19? 15? 16 12 9 12? 18 8 10 ESA Listing Status and Trends Salmon (ESU) Steelhead (DPS) Not
Columbia River Basin? 17 Status and Trends of Salmon and Steelhead in the Columbia River Basin 2 1 11 4 7? 14 5? 19? 15? 16 12 9 12? 18 8 10 ESA Listing Status and Trends Salmon (ESU) Steelhead (DPS) Not
August 2, 2016 MEMORANDUM. Council Members. SUBJECT: Bull trout ESA litigation update
 Henry Lorenzen Chair Oregon Bill Bradbury Oregon Phil Rockefeller Washington Tom Karier Washington W. Bill Booth Vice Chair Idaho James Yost Idaho Pat Smith Montana Jennifer Anders Montana August 2, 2016
10/29/ :08 AM. Mountain Whitefish, Mussels (freshwater) and Eulachon (candlefish)(smelt) The current Program makes no mention of these species
 and Eulachon (candlefish)(smelt) The current Program makes no mention of these species") Staff summary of Issues and Recommendations Species Specifics (other than Salmon, Steelhead and wildlife) *Preliminary draft, please refer to full recommendations for complete review 10/29/2013 10:08 AM
Staff summary of Issues and Recommendations Species Specifics (other than Salmon, Steelhead and wildlife) *Preliminary draft, please refer to full recommendations for complete review 10/29/2013 10:08 AM
CHINOOK SALMON SACRAMENTO RIVER WINTER-RUN ESU, CENTRAL VALLEY SPRING-RUN ESU, AND CENTRAL VALLEY FALL AND LATE FALL-RUN ESU
 CHINOOK SALMON SACRAMENTO RIVER WINTER-RUN ESU, CENTRAL VALLEY SPRING-RUN ESU, AND CENTRAL VALLEY FALL AND LATE FALL-RUN ESU Oncorhynchus tshawytscha USFWS: Endangered (Winter); Threatened (Spring); Candidate
High Seas CWT Recoveries in 2012 and 2013
 High Seas CWT Recoveries in 2012 and 2013 Adrian Celewycz Auke Bay Laboratories, Alaska Fisheries Science Center Juneau, AK 99801 Annual Meeting of the Regional Committee on Marking and Tagging, Santa
PRE-SEASON PLANNING FOR FRASER SALMON and STOCKS OF CONCERN. Forum on Conservation and Harvest Planning for Fraser Salmon January 22, 2010
 PRE-SEASON PLANNING FOR FRASER SALMON and STOCKS OF CONCERN Forum on Conservation and Harvest Planning for Fraser Salmon January 22, 2010 2 Outline South Coast Chinook Status Management Actions Recovery
Wild Steelhead Coalition Richard Burge Conservation VP September 11, 2006
 Wild Steelhead Coalition Richard Burge Conservation VP September 11, 2006 The following are talking points for the WDFW SEPA Scoping Meetings regarding the preparation of the State-wide and the Puget Sound
California Steelhead: Management, Monitoring and Recovery Efforts
 California Steelhead: Management, Monitoring and Recovery Efforts Jonathan Nelson Steelhead Management, Research and Restoration Program Oncorhynchus mykiss irideus California Steelhead - Hot Topics Implementation
Agenda Item E.2.g Supplemental Public Comment 2 April 2012
 Agenda Item E.2.g Supplemental Public Comment 2 April 2012 O Laughlin & Paris LLP Attorneys at Law SENT VIA ELECTRONIC MAIL March 26, 2012 Pacific Fishery Management Council 7700 NE Ambassador
NMFS salmon management support projects presented by Steve Lindley and Pete Lawson
 NMFS salmon management support projects presented by Steve Lindley and Pete Lawson California Current System ecological modeling Sacramento, Klamath, and Columbia River lifecycle modeling Stream temperature
WFC 50 California s Wild Vertebrates Jan. 11, Inland Waters (Lakes and Streams) Lisa Thompson
 Lisa Thompson") Inland Waters: Lakes and Streams WFC 50 11 January 2011 Lisa Thompson Fisheries Extension Specialist Wildlife, Fish, & Conservation Biology Department University of California, Davis Take home messages
Inland Waters: Lakes and Streams WFC 50 11 January 2011 Lisa Thompson Fisheries Extension Specialist Wildlife, Fish, & Conservation Biology Department University of California, Davis Take home messages
A.19 CENTRAL VALLEY SPRING-RUN CHINOOK SALMON (ONCORHYNCHUS TSHAWYTSCHA)
") A. CENTRAL VALLEY SPRING-RUN CHINOOK SALMON (ONCORHYNCHUS TSHAWYTSCHA) A.. Legal and Other Status 0 Central Valley Chinook salmon are composed of several genetically distinct races, or evolutionarily significant
A. CENTRAL VALLEY SPRING-RUN CHINOOK SALMON (ONCORHYNCHUS TSHAWYTSCHA) A.. Legal and Other Status 0 Central Valley Chinook salmon are composed of several genetically distinct races, or evolutionarily significant
COLUMBIA RIVER SALMON AND STEELHEAD HARVEST 1980 TO by John McKern for The Columbia-Snake River Irrigators Association
 COLUMBIA RIVER SALMON AND STEELHEAD HARVEST 198 TO 26 by John McKern for The Columbia-Snake River Irrigators Association COLUMBIA RIVER SALMON AND STEELHEAD HARVEST 198 THROUGH 26 By John McKern FISH PASSAGE
APPROVED WORK WINDOWS FOR FISH PROTECTION FOR ALL MARINE/ESTUARINE AREAS. excluding THE MOUTH OF THE COLUMBIA RIVER (BAKER BAY)
") APPROVED FOR FISH PROTECTION FOR ALL MARINE/ESTUARINE AREAS excluding THE MOUTH OF THE COLUMBIA RIVER (BAKER BAY) BY August 21, 2017 (1) The general work window is given by Tidal Reference Area. Figure
APPROVED FOR FISH PROTECTION FOR ALL MARINE/ESTUARINE AREAS excluding THE MOUTH OF THE COLUMBIA RIVER (BAKER BAY) BY August 21, 2017 (1) The general work window is given by Tidal Reference Area. Figure
Salmon Enhancement Program
 An Overview of Coho and Chinook Hatchery Facilities in the Strait of Georgia Fisheries and Oceans Canada Mel Sheng Salmon Enhancement Program Quinsam Puntledge Sliammon Powell R Big Qualicum Little Qualicum
TABLE OF CONTENTS. -i-
 TABLE OF CONTENTS 1. INTRODUCTION... 2 1.1 Background... 2 1.2 Consultation History... 2 1.3 Proposed Action... 8 1.3.1 Overview of Water Quality Standards... 8 1.3.2 Details of Proposed Action... 9 1.4
Management Strategies for Columbia River Recreational and Commercial Fisheries: 2013 and Beyond
 Management Strategies for Columbia River Recreational and Commercial Fisheries: 2013 and Beyond Recommendation of the Columbia River Fishery Management Workgroup to the Fish and Wildlife Commissions of
Coho. Oregon Native Fish Status Report 13
 12 Coho Coho salmon are widespread in small, low gradient streams of the coast and lower Columbia. They enter freshwater and spawn after fall rains raise river levels, typically from September through
Past, Present and Future Activities Being Conducted in the Klamath River Basin Related to the Protection and Recovery of Fish and Their Habitat
 Past, Present and Future Activities Being Conducted in the Klamath River Basin Related to the Protection and Recovery of Fish and Their Habitat National Marine Fisheries Service March 2003 The Department
Columbia River Sturgeon in Decline. Recommendation for Harvest Reform
 Columbia River Sturgeon in Decline Recommendation for Harvest Reform Significant Recent Declines The lower Columbia River (LCR) white sturgeon population has declined significantly in recent years. Estimated
Fish Tech Weekly Outline January 14-18
 Fish Tech Weekly Outline January 14-18 TOPICS: salmon, trout, and char in Southeast Alaska salmonid identification overview salmonid life cycle and stages salmonid freshwater and marine distribution/residence
Hatcheries: Role in Restoration and Enhancement of Salmon Populations
 Hatcheries: Role in Restoration and Enhancement of Salmon Populations Hatcheries play a large role in the management, ecology, and evolution of Pacific salmon. Why were/are they built? What are the assumptions