Fish Species Presence and Abundance Of the Table River, 1995
|
|
|
- Rodney Brooks
- 5 years ago
- Views:
Transcription
1 Fish Species Presence and Abundance Of the Table River, 1995 R. J. Zemlak and A. R. Langston March 1998 PWFWCP Report No. 173
2 The Peace/Williston Fish & Wildlife Compensation Program is a cooperative venture of BC Hydro and the provincial fish and wildlife management agencies, supported by funding from BC Hydro. The Program was established to enhance and protect fish and wildlife resources affected by the construction of the W.A.C. Bennett and Peace Canyon dams on the Peace River, and the subsequent creation of the Williston and Dinosaur Reservoirs. Peace/Williston Fish and Wildlife Compensation Program, 1011 Fourth Ave. 3 rd Floor, Prince George B.C. V2L 3H9 Website: This report has been approved by the Peace/Williston Fish and Wildlife Compensation Program Fish Technical Committee. Citation: R. J. Zemlak and A. R. Langston. March Fish species presence and abundance of the Table River, Peace/Williston Fish and Wildlife Compensation Program, Report No pp plus appendices. Author(s): Randy J. Zemlak 1 and Arne Langston 1 Address(es): 1 Peace/Williston Fish and Wildlife Compensation Program, 1011 Fourth Ave., 3rd Floor Prince George, B.C. V2L 3H9
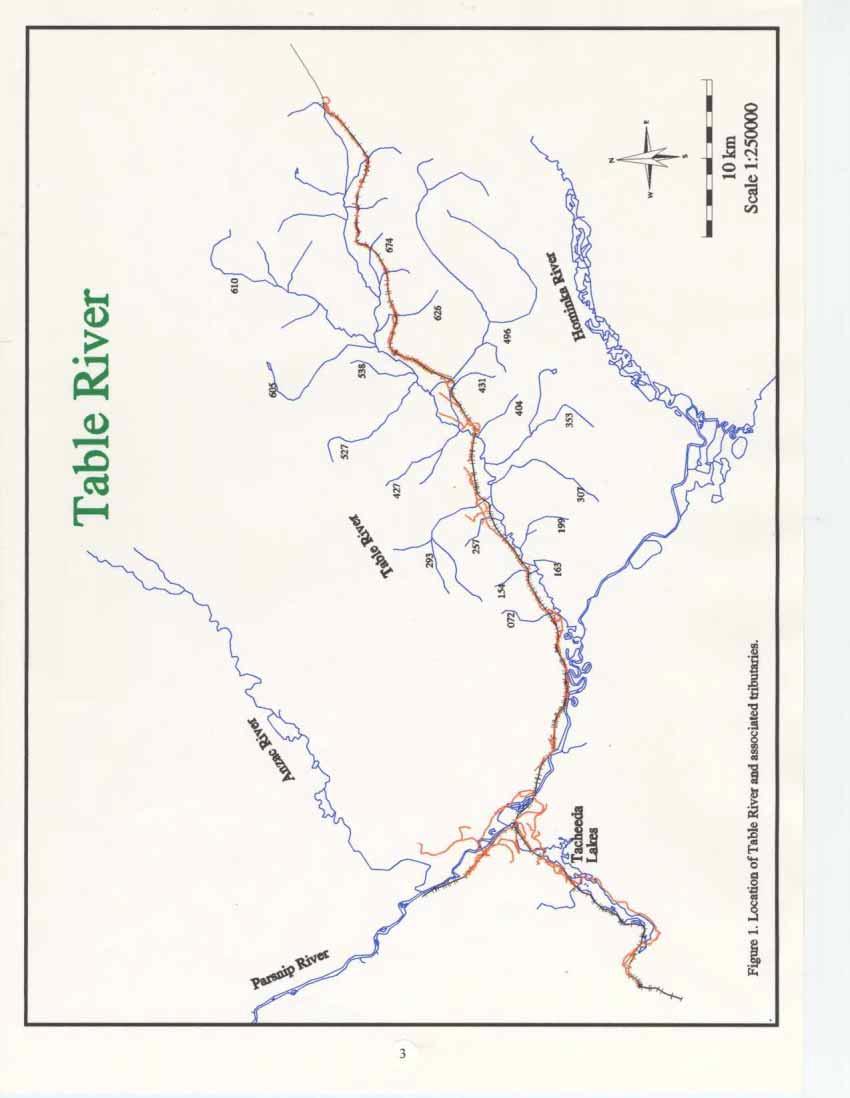
3 ABSTRACT A reconnaissance level survey of the Table River and its tributaries was conducted from July to September, The Table River is located in north-eastern B.C. and flows into the Parsnip River. A major component of this survey included: fish habitat (biophysical) evaluations, collecting water temperature data, and videotaping habitat features from a helicopter. Another component of this survey, and the focus of this report, was to use a combination of angling, electrofishing, and underwater fish counts to identify fish species presence and abundance of the Table River. A major emphasis was on Arctic grayling (Thymallus arcticus) due to its recent ranking (1995) as being critically imperilled within the Williston Reservoir watershed by the B.C. Conservation Data Centre. Captured fish in the Table River watershed include: Arctic grayling, bull trout (Salvelinus confluentus), burbot (Lota Iota), dace (Rhinichthys spp.), northern squawfish (Ptychocheilus oregonensis), rainbow trout (Oncorhynchus mykiss), sculpins (Cottus spp.), suckers (Catostomus spp.) and whitefish (Prosopium spp.). Angling efforts produced a total of 189 adult fish with Arctic grayling comprising 66% of the total catch. Electrofishing efforts captured a total of 964 fish, of which sculpins were the most abundant (69.6%). Numerous fish (n=3,624) were observed during a single pass underwater fish count of 23.5 km of river. Mountain whitefish comprised 73 % of this underwater count. A mark-recapture fish population estimate for Arctic grayling from km 35.5 to 32.0 from the mouth of the Table River was estimated at 251 fish. Areas of difficult fish passage exist at km 37.6, 42.7, and 54.0 from the mouth which inhibit upstream fish movement. Bull trout were the only fish species observed as far upstream as 54. km from the mouth. Arctic grayling were only encountered in the mainstem and none were observed in the tributaries. A noticeable number of Arctic grayling were observed in reaches 3 and 4 (approximately km 32.0 to 37.6 from the mouth) of the mainstem. Further studies will be conducted in 1996 to determine the habitat preference and distribution of Arctic grayling and other fish in the Table River system.

4 TABLE OF CONTENTS Page No. ii
5 LIST OF TABLES AND FIGURES Tables Page No. 1 Total number of fish captured by electrofishing. 9 2 Comparison of game fish densities and population estimates Gee trapping results Total number of captured and tagged fish by section Total fish densities, for all fish, using two pass fish counts Total fish densities, for tagged fish greater than 20 cm, using two pass fish counts Table River mark - recapture results with correction factors for Arctic grayling, bull and rainbow trout Fish catch statistics Table River Arctic grayling growth rate comparison with three Williston Reservoir systems. 20 Figures 1 Location of the Table River and associated tributaries. 3 2 Location of the upper and lower survey sections on the Table River. 6 3 Estimated number of fish by kilometre section using single pass underwater counts Mean fork length-at-age for Arctic grayling, bull and rainbow trout. 18 III
6 INTRODUCTION A reconnaissance level survey of the Table River was conducted in the summer of The Table River is tributary to the Parsnip River which drains into the Parsnip Reach of Williston Reservoir. This reservoir is located in north-eastern British Columbia. The main objectives of the survey were: 1. to gather life history information of fish species encountered, and their habitat requirements; 2. to identify current limitations to the fish populations, and habitat alterations/damage resultant from activities within the watershed (logging, road construction, railway construction); and 3. to develop management, mitigative, compensatory, and enhancement plans to restore the productive capacity of the Table River fish resource. The Table River contains many fish species, two of which are of increasing concern. The Arctic grayling (Thymallus arcticus) population is one of them. Arctic grayling are currently "red listed" (QS1). This species' status indicates that within the Williston Reservoir watershed, the species is critically imperilled because of extreme rarity or some factors making it vulnerable to extirpation or extinction (Anonymous 1995). Life history information on Arctic grayling populations within the Williston Reservoir watershed is lacking. In order to protect this population, the Ministry of Environment, Lands and Parks established a catch and release regulation in 1995 for Arctic grayling within the Williston Reservoir watershed. Due to the fact that little information exists on the Arctic grayling population in the Williston Reservoir watershed, these fish will be investigated intensively in the Table River in relation to the objectives of this reconnaissance level survey. The other species of concern in the Table River is bull trout (Salvelinus confluentus). Bull trout are currently "blue listed" (S3). This species' status indicates that the species is rare or uncommon, and may be susceptible to large-scale disturbances (Anonymous 1995). Life history information on bull trout populations within the Williston Reservoir watershed is also lacking. The information gathered from bull trout during this Table River study may be useful for future enhancement, protection, and management applications for the Table River population and other populations in the watershed. This data report summarises the 1995 fish enumeration activities and results. The purpose of this report is to briefly analyse, and provide a record of, the fish species presence and abundance data collected during the 1995 reconnaissance level survey of the Table River. The Arctic grayling and bull trout life history information collected will be vital to their future management and may also be applicable to compare with other similar fish populations within the Williston Reservoir watershed. A second detailed report entitled "A Reconnaissance Survey of the Table River: 1995 Status Report" by Langston (1998) provides further detailed methods and results on the remaining 1995 field surveys. I
7 Study Area The Table River is situated in British Columbia's central interior, approximately 100 km north of Prince George (Fig. 1). The Table River is tributary to the Parsnip River. The confluence of these two rivers is situated 75 km upstream from the southern end (Parsnip Reach) of Williston Reservoir. The Table River is 56 km long, and drains a watershed of 50,600 ha (506 km 2 ). The watershed is situated in the Misinchinka Ranges of the Rocky Mountains. The Williston Reservoir watershed is located within the Sub-Boreal Spruce biogeoclimatic zone. The surficial substrate of the Table River area is composed of colluvial materials found in the valley walls and lacustine materials in the valley floor (Anonymous 1984). The upper one third (18 km) of the river flows through a narrow valley with steep mountain walls. The stream bed in this section is comprised primarily of gravel and cobble with occasional bedrock outcroppings. The lower two thirds (38 km) of the river meanders through a one to two kilometre wide valley flat. The stream bed in this section consists of mainly fines and gravel. A near zero gradient with long sections of glides are common in the lower part of the river, subsequently velocities are reduced and areas of sediment deposition are frequent. No continuous discharge monitoring stations have been set up on the Table River system. Past logging practices and railroad construction activities have occurred within the Table River watershed. For approximately the last 30 years, logging activities have taken place which are mainly silviculture in nature. These harvesting practices have primarily occurred in the lower two thirds of the watershed where the valley is mainly flat. Within this section, timber harvesting has taken place inside some riparian zones. The headwaters of the Table River has steep sides to the valley and thus harvesting is minimal. Railroad operation and maintenance activities are present within the Table River watershed but timber harvesting has ceased since The BCR electric railroad construction initiated in 1981 and the line extends from Tacheeda Lakes to Tumbler Ridge, B.C. This railroad follows within close proximity of the Table River for most of its length. Due to the railroads close proximity, the line crosses the mainstem once and many of the Table Rivers tributaries. In addition to the railroad, a secondary road runs parallel to the railroad to facilitate railroad maintenance. This road was also used for past logging access. METHODS Fish Sampling and Abundance Surveys Various methods of fish capture and observations were used for surveying the Table River fish population. These methods include: angling, electrofishing, gee trapping, and underwater fish counts. Each method utilised was for a specific reason, based on the objectives of the study. 2
8
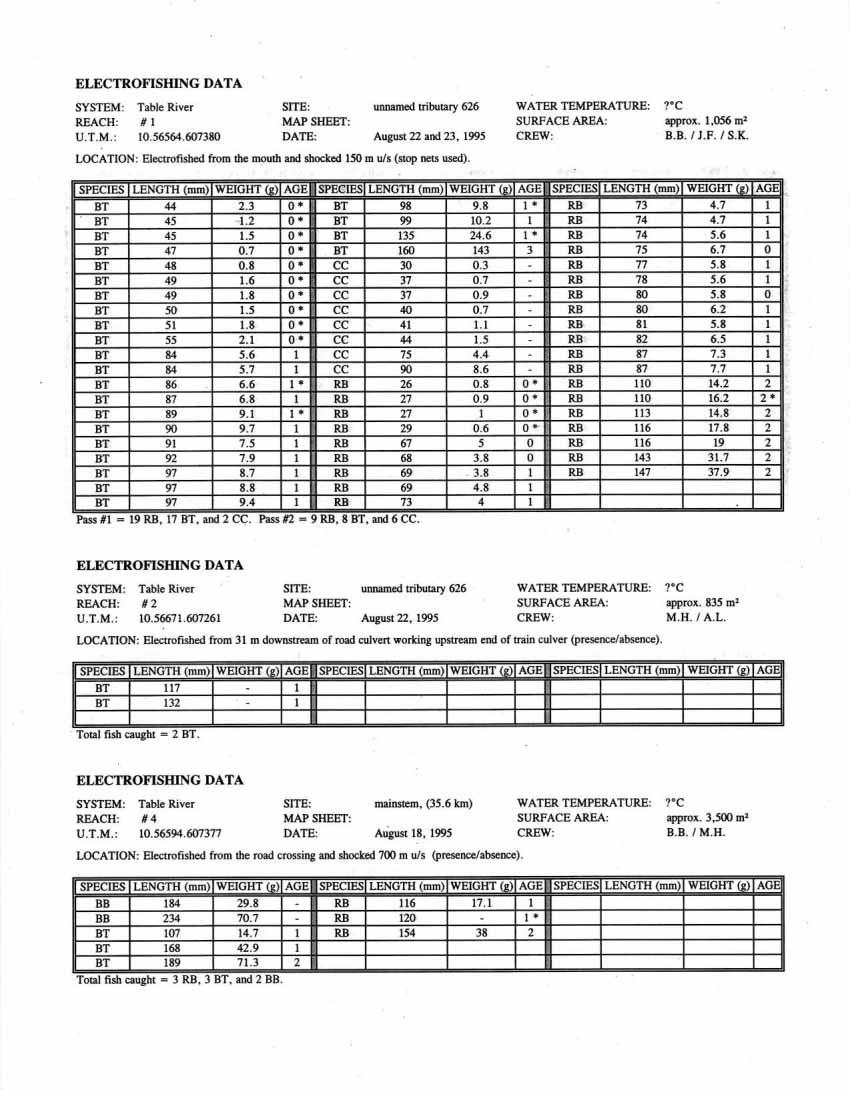
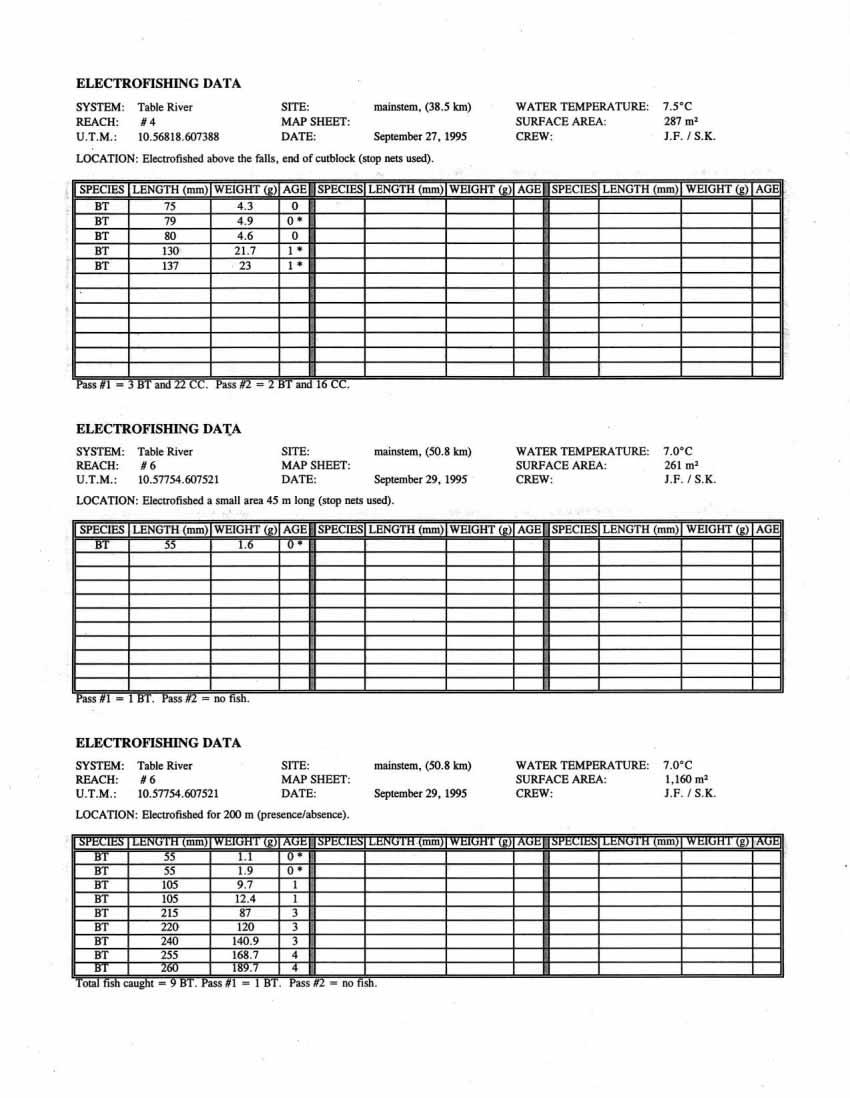
9 Electrofishing To obtain information on fish species presence in the Table River watershed, electrofishing was conducted in the tributaries and in the mainstem. Two methods of electrofishing were used to identify: 1) fish species presence/absence, and 2) fish density estimates. To identify fish presence, the stream was electrofished without the use of stop nets (open site). To determine fish density estimates, stop nets were used along a section of stream (closed site), and either a two or three pass method was used to capture fish. The total electrofished area was then recorded. Population estimates (# per m 2 ) were generated by the American Fisheries Society program "Microfish 3.0" (Van Deventer and Platts 1985). All captured fish were identified, enumerated, and sampled. Fish were treated with a solution of one Alka Seltzer tablet dissolved in 3 litres of fresh water. Fork lengths were measured to an accuracy of 1.0 mm and weights were measured to an accuracy of 0.1 g. Scale samples (for age analysis) were obtained from all Arctic grayling, and a representative sample of bull trout and rainbow trout (Oncorhynchus mykiss). After the fish was sampled, it was revived and released back into the stream. Gee Trapping Another method used to collect information on fish species presence in the Table River watershed was the use of gee traps. These traps were baited with either fish roe or sardines and were set during the daylight hours on one day and left to fish overnight. They were placed in a variety of habitats such as weed beds, under overhanging vegetation, or amongst submerged logs. Captured fish were identified by species, enumerated, measured, and weighed as described in the previous section. No scale samples were taken for age determination. Underwater Fish Counts (single pass) Single pass underwater fish counts were used to identify fish species presence and to determine population estimates for fish in the Table River. An underwater fish count was conducted from the 35.5 km point of the river to the mouth (0 km), with the exception of km 29 to 24 which was not surveyed due to difficult access. Two experienced swimmers, equipped with dry suits, masks, and snorkels, floated downstream in pre-assigned lanes, and recorded all fish observed for each one kilometre length of stream. Swimmers lanes were situated so as to encompass the mid-channel and near shore zone of the river. While floating downstream, swimmers would look ahead to count fish and also to the left and right. Arctic grayling, bull trout, rainbow trout, and whitefish (Prosopium spp.) were enumerated by size category (0-10 cm, cm, cm, cm, cm, cm, and cm). Tagged fish were recorded and its colour of tag was noted. Northern squawfish (Ptychocheilus oregonensis), sculpins (Cottus spp.), and suckers (Catostomus spp.) were only enumerated and no size breakdown was undertaken. Approximately five measurements of the wetted width of the river was taken for each kilometre section and an average was calculated. 4
10 When performing underwater fish counts, the total wetted width of the river needs to be observed by the combined visibility of all swimmers in order to obtain an accurate fish count. Otherwise, not all fish have a chance of being observed and the fish counts would then be underestimated. The mean wetted width and the limit of visual observation for each section was measured for the Table River. Once all the fish were enumerated for each kilometre section, fish counts were then expanded, if necessary, based on the total visible length of the two swimmers. The underwater "visibility" is the longest distance a swimmer is able to accurately identify a fish by species and estimate its length when looking in either direction. If the combined visibility of the swimmers was equal to or greater than the entire wetted width of the stream, then the swimmers had a chance of observing every fish present and no expansion was applied to that kilometre section. Results from the single pass survey were used to determine species abundance and the distribution of fish within the lower 2/3 of the river. Underwater Fish Counts (two pass) Once the single pass underwater fish count was completed, replicate underwater fish counts were used to determine population estimates of select fish species in the Table River. Two representative sites on the Table River were established to perform the multiple pass surveys. Due to difficult access, the upper 1/3 of the river could not be surveyed. Therefore, the lower 2/3 of the Table River, was divided into two representative segments (upper segment and lower segment) of the river. These segments were chosen as they were representative of the two generalised type of mainstem habitat encountered in the lower 2/3 of the Table River. Underwater fish counts were then conducted which followed the methodology outlined in Slaney and Martin (1987) and are further explained in the results section of this report. Selection of these two segments were based on habitat characteristics. The upper river segment was represented by the section of river from km 37.6 to In this upper segment, the habitat characteristics of the Table River has a relatively fast velocity (between 0.5 and 1.0 m/sec), large substrate (gravel/cobble), narrow wetted width ( <20 m), and short meandering riffles. The lower river segment was represented by the section of river from km 26.7 to km 0. In this lower segment, the habitat characteristics of the Table River is low velocity (< 0.5 m/sec), small substrate (fines/gravel), wide wetted width (> 20 m), and long straight glides. Within each segment, a smaller section or subsection of river was to be surveyed for replicate fish counts (Fig. 2). The sections selected were km 35.5 to 32.0 (upper river section) and km 9.8 to 5.0 (lower river section). Two and three swimmers were assigned to the upper and lower sections of the river respectively. Underwater fish counts were conducted twice for each section to provide replicate fish counts. Swimmers were situated equally apart within the wetted width of the river. While floating downstream, swimmers would look straight ahead to count fish and also to the left and right. The visibility of the water was recorded for each kilometre of stream surveyed. Fish were enumerated and an estimate of its length was recorded. Tagged fish were also recorded and its colour of tag was noted. While conducting the two pass underwater fish counts, not all fish could be observed. Inevitably some fish were not counted by the swimmers. Fish may not have been detected due to factors such as fish "hiding" and the attention of the swimmer being distracted by observing 5
11
12 other fish. Therefore, correction factors were applied to the two pass underwater count results to compensate for "hiding" fish. The correction factor for each fish species was calculated based on the methodology outlined in Slaney and Martin (1987). These calculations are quite extensive, and the mark-recapture procedures require that they meet two different criteria to provide an unbiased estimate of a population of fish. This information is further explained in the results section of this report. Mark-Recapture Petersen mark-recapture population estimates were generated for Arctic grayling, bull and rainbow trout by Floy tagging fish greater than 200 mm in length. Twenty percent of the population of each species was required to be marked (Vincent 1971). A hooking mortality estimate of 4% was used based on Wydoski's 1977 fly-fishing hooking mortality study. Underwater fish counts were conducted twice for each section to provide replicate counts. Data collected from the two pass survey was then used to determine fish population estimates. Prior to swimming the two sections, fish were marked to facilitate the mark-recapture study. Angling techniques were employed to capture fish in the upper and lower river sections. Fish captured in the lower section were marked with green coloured tags while fish captured in the upper section were marked with blue coloured tags. Additional fish were captured at the upper falls site (km 37.6) with red tags but are not included in the mark recapture fish estimates. Artificial flies, lures (spinners and spoons), and various baits were utilised. Since a major component of this Table River survey was focused on Arctic grayling, the capture of fish was slightly biased towards these fish. The majority of the angling effort was with the use of artificial flies. Arctic grayling, bull and rainbow trout larger than 200 mm were Floy tagged as described by Slaney and Martin (1987). Scale samples (for age analysis) were taken from Arctic grayling and rainbow trout of all sizes, and bull trout less than 350 mm in length. Fin ray samples (also for age analysis) were obtained from bull trout greater than 350 mm in length. The fork length and weight of each tagged fish was also recorded. Age versus Length Analysis Age and fork length data collected for all Arctic grayling, bull and rainbow trout from the Table River watershed was used for analysis. Mean fork lengths were calculated for each age group of fish species. This data was used to graphically depict the mean length-at-age for each of the three species of fish. Length-at-age of Arctic grayling from the Table River were then compared to Arctic grayling in the Mesilinka, Nation, and Parsnip rivers. Since the sample size of each age of fish for each species can be small (< 30), standard error bars were used to visually represent the margin of error or degree of uncertainty for each mean length at age. These error bars show how precise the actual mean length is for the data set and depends on the number of samples used. For example, a four year old Arctic grayling that has only 3 or 4 samples for length are generally going to show larger error bars around the mean length when compared to an age four rainbow trout which may have 35 samples for length. With the larger sample size for rainbow trout, the mean length will generally be more precise and present smaller error bars.
13 RESULTS Fish Species Presence Many fish species (n=9) were observed in the Table River watershed. These fish include: Arctic grayling, bull trout, burbot (Lota Iota), dace (Rhinichthys spp.), northern squawfish, rainbow trout, sculpins, suckers, and whitefish (Prosopium spp.), Members of the dace, sculpin, sucker, and whitefish families were not keyed out to the species level of fish identification. Fish from these four groups have been placed into their respective families and reported accordingly. Fish identification of the non keyed out fish is still somewhat possible to the species level. One species of dace (Rhinichthys cataractae or longnose dace) is known to inhabit the Parsnip River (Anonymous 1978b). Two species of sculpins are also known to occur in the Parsnip River which include the slimy sculpin (Cottus cognatus) and the prickly sculpin (Cottus asper), (Anonymous 1978b). Three sucker species are known to inhabit the Parsnip River (Anonymous 1978b). These three species are the large-scale sucker (Catostomus macrocheilus), longnose sucker (Catostomus catostomus), and white sucker (Catostomus commersoni). According to a 1980 Sigma Resources Consultants Ltd. report, mountain whitefish (Prosopium williamsoni) is listed as a species of whitefish inhabiting the Table River. All or some of these previously mentioned fish species could also inhabit the Table River. Not all of the previously mentioned fish species were captured throughout the mainstem Table River and its tributaries. The Table River mainstem contains three areas of difficult fish passage which have an affect on species distribution throughout the river. At 37.6 km upstream from the mouth, a 2.0 m vertical waterfall exists and is an area of difficult upstream fish passage. A second area of difficult fish passage exists at km 42.7 (cascade, 1.0 m waterfall, and chute). The third area of difficult fish passage exists at km 54 of the mainstem (approximately 10% gradient change). These obstructions limit fish distribution and upstream migration. Fish species distribution within the Table River varies by species. Suckers were generally located only in the lower 20 km of the mainstem and its associated tributaries. Downstream of the first fish obstruction (km 37.6), sculpins, rainbow trout, and whitefish were distributed throughout the entire mainstem and associated tributaries. Arctic grayling were only encountered in the mainstem of the Table River below the falls (km 37.6). Burbot, dace, and northern squawfish were observed too infrequently to define their distribution; although, burbot were generally observed as far upstream as 35.6 km of the mainstem and its associated tributaries. Dace (n=5) were only observed in tributary 072. Northern squawfish were generally located only in the first 11 km of the mainstem river. In-between the first and second obstruction, a few sculpins were found. Above the second obstruction, only bull trout were observed in the mainstem. The area above the third obstruction (54 km) was not surveyed. 8
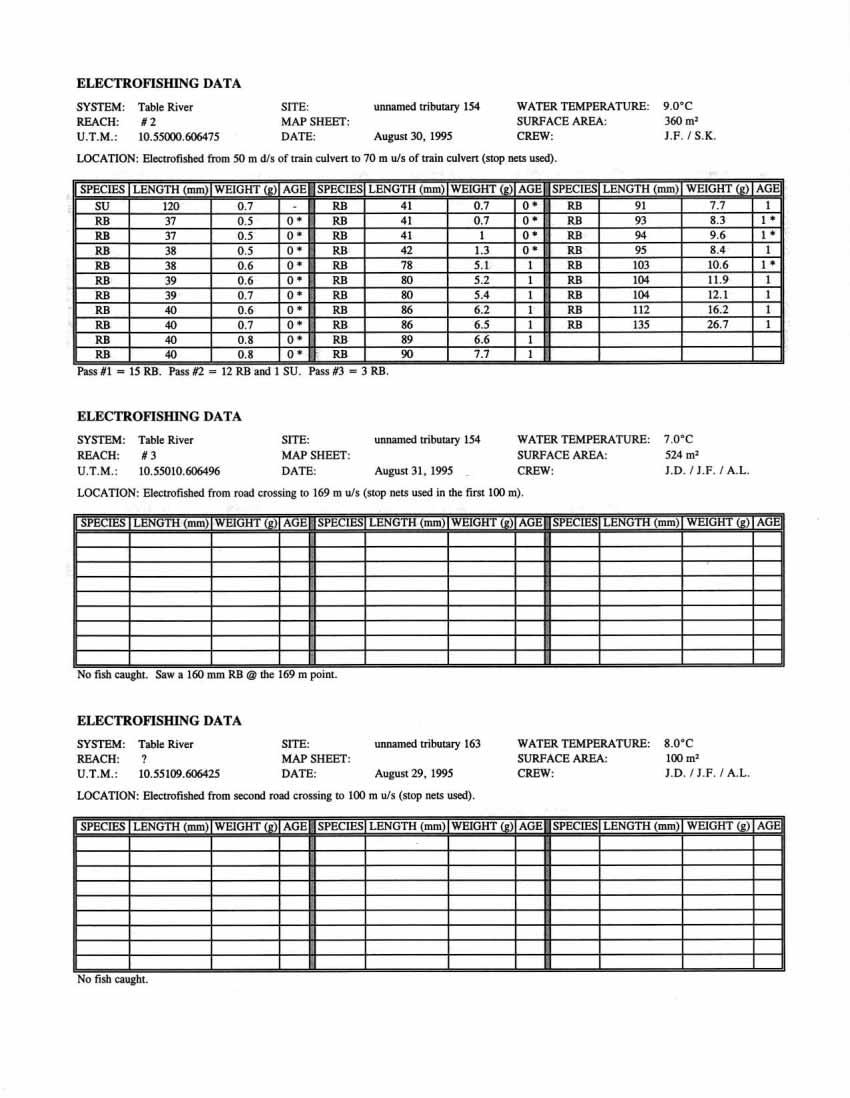
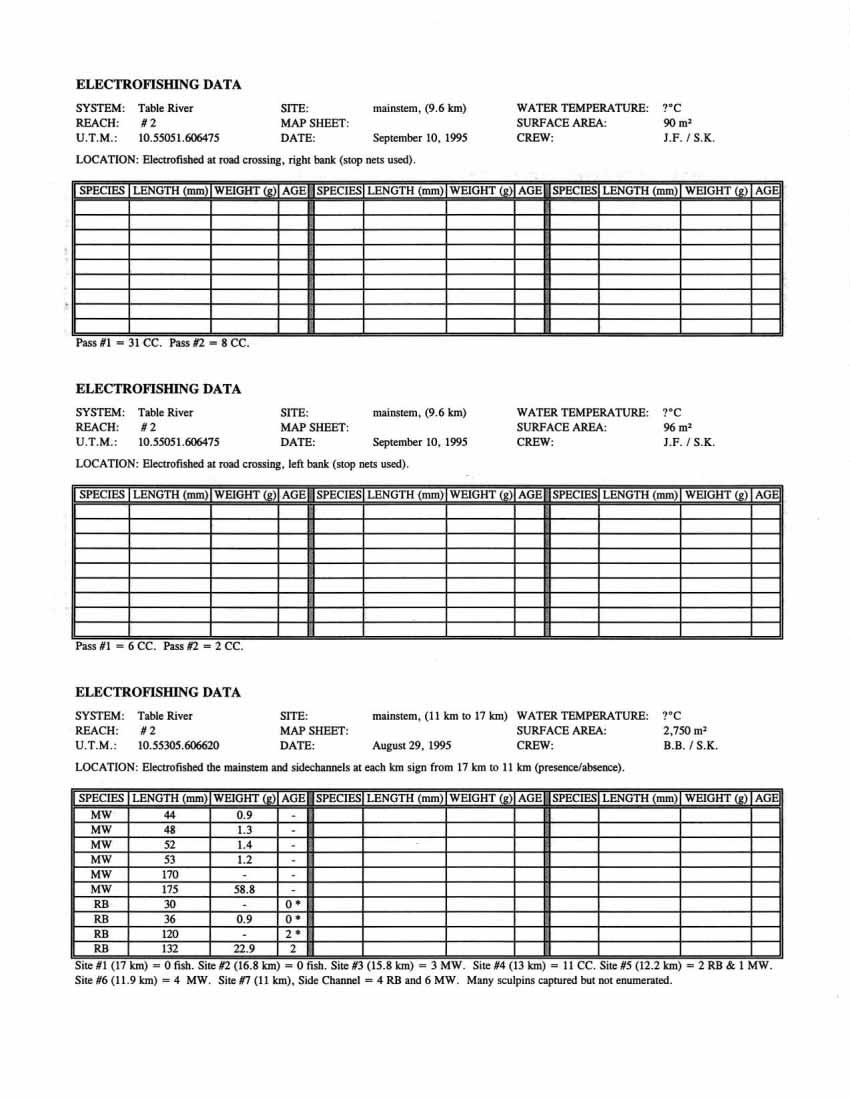
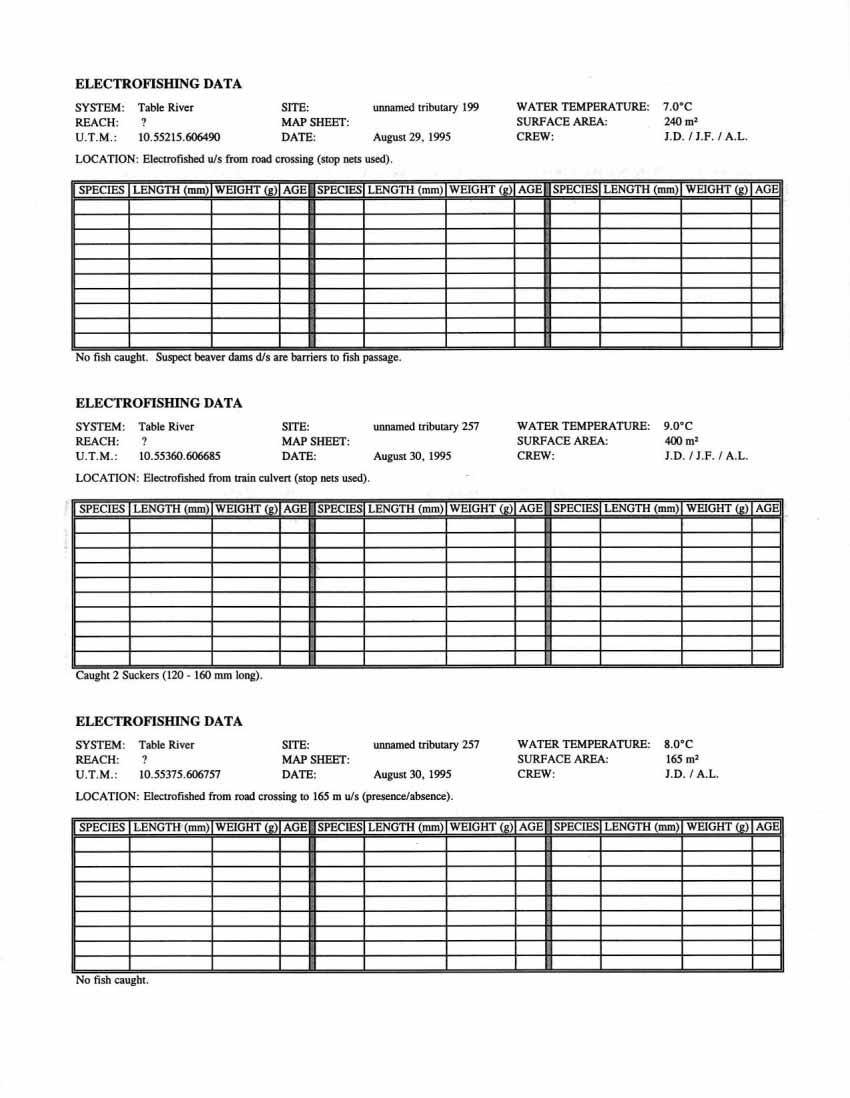
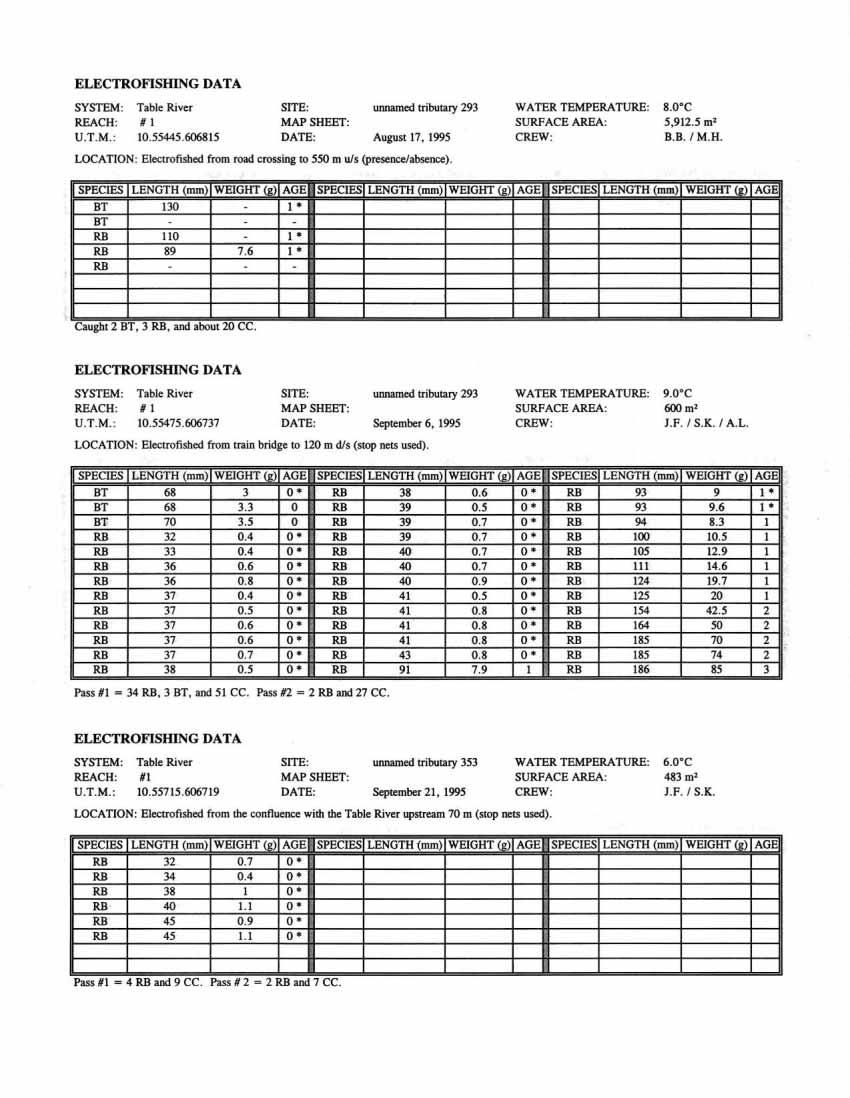
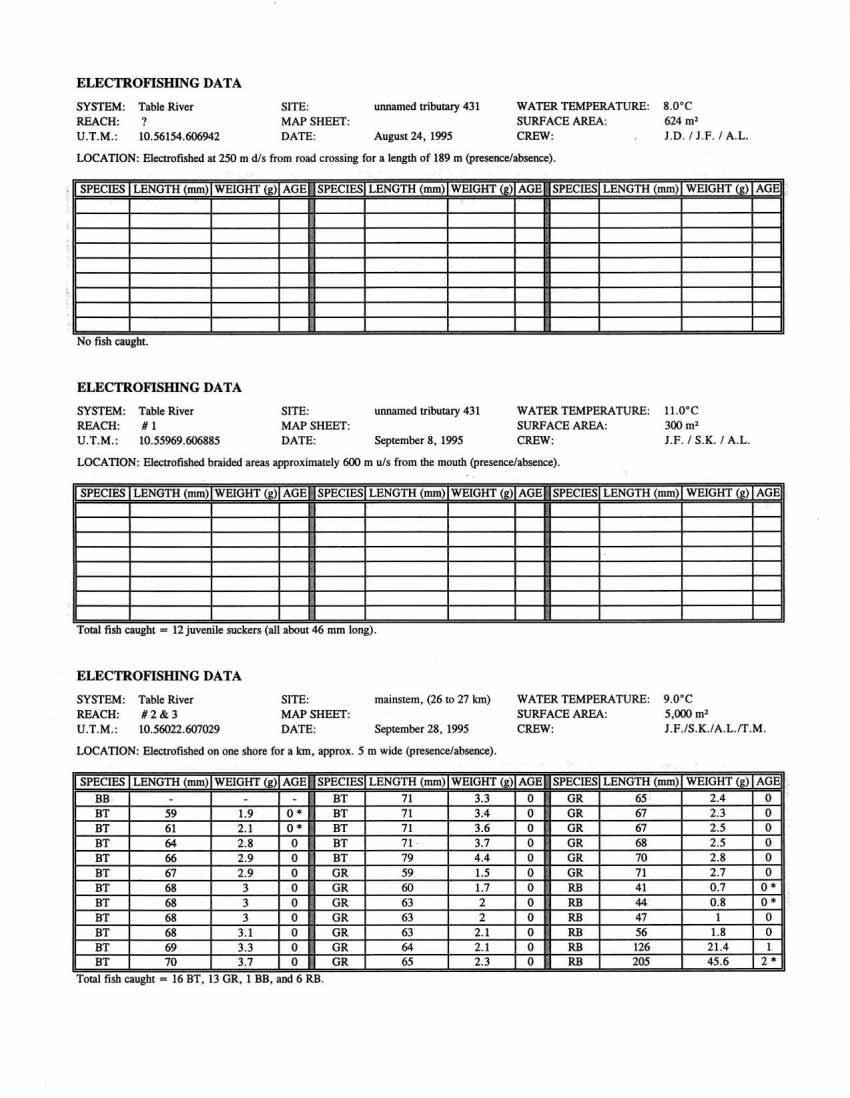
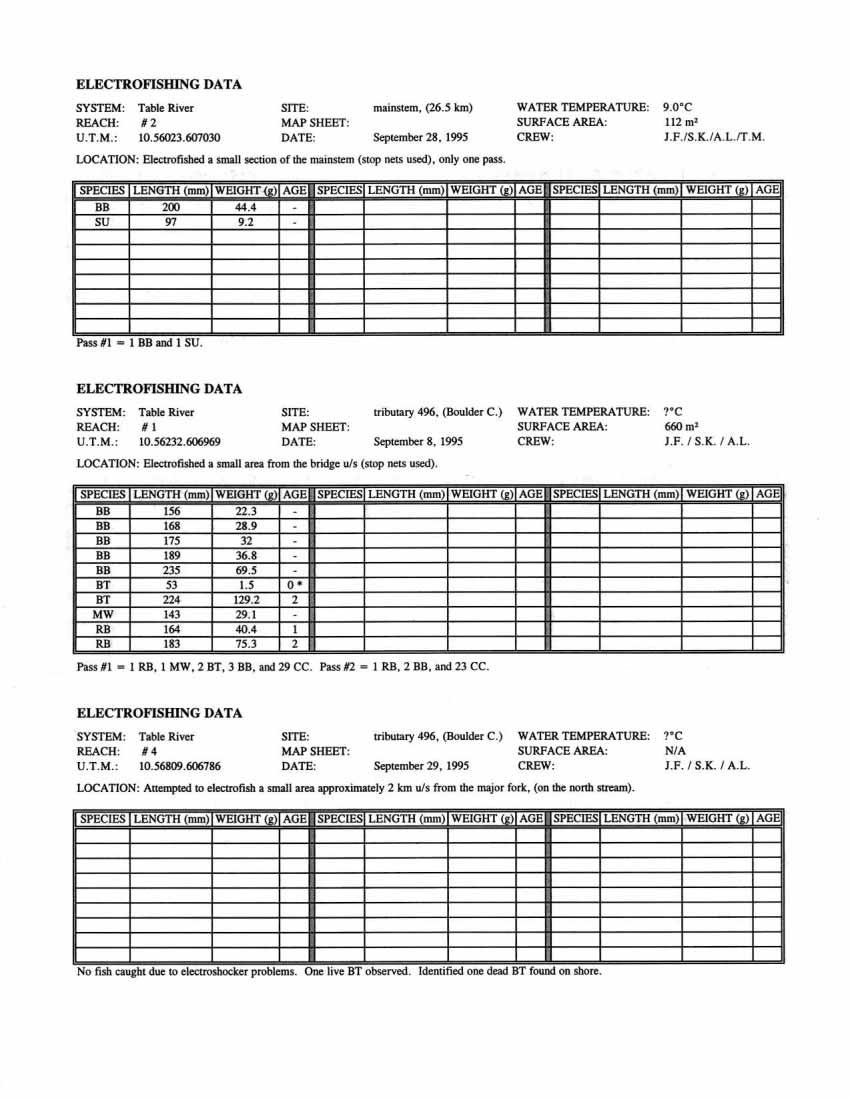
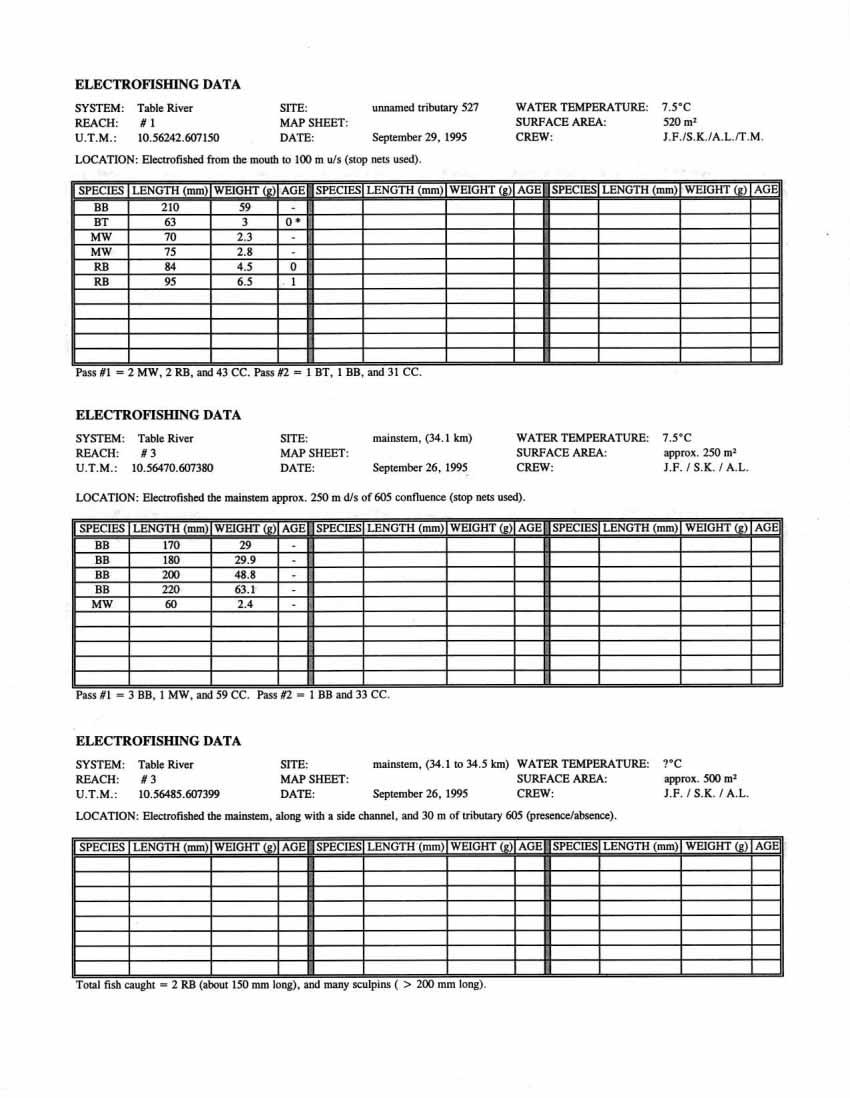
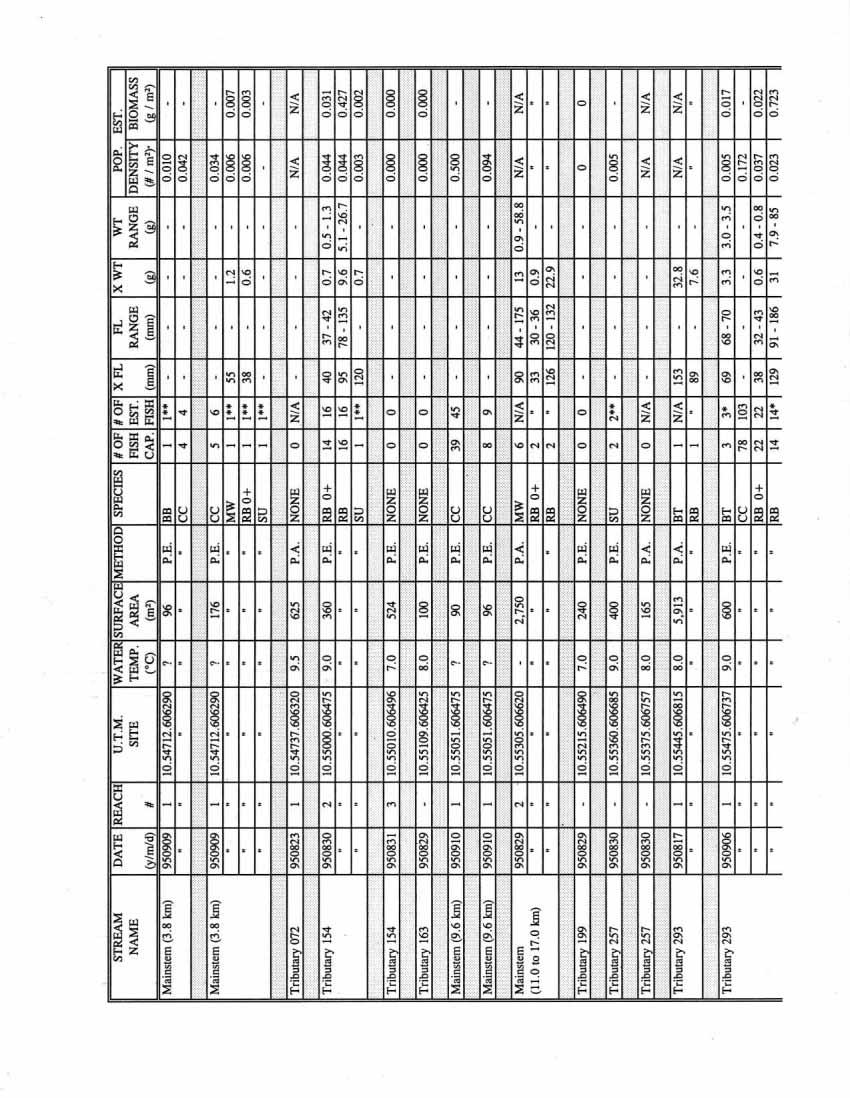
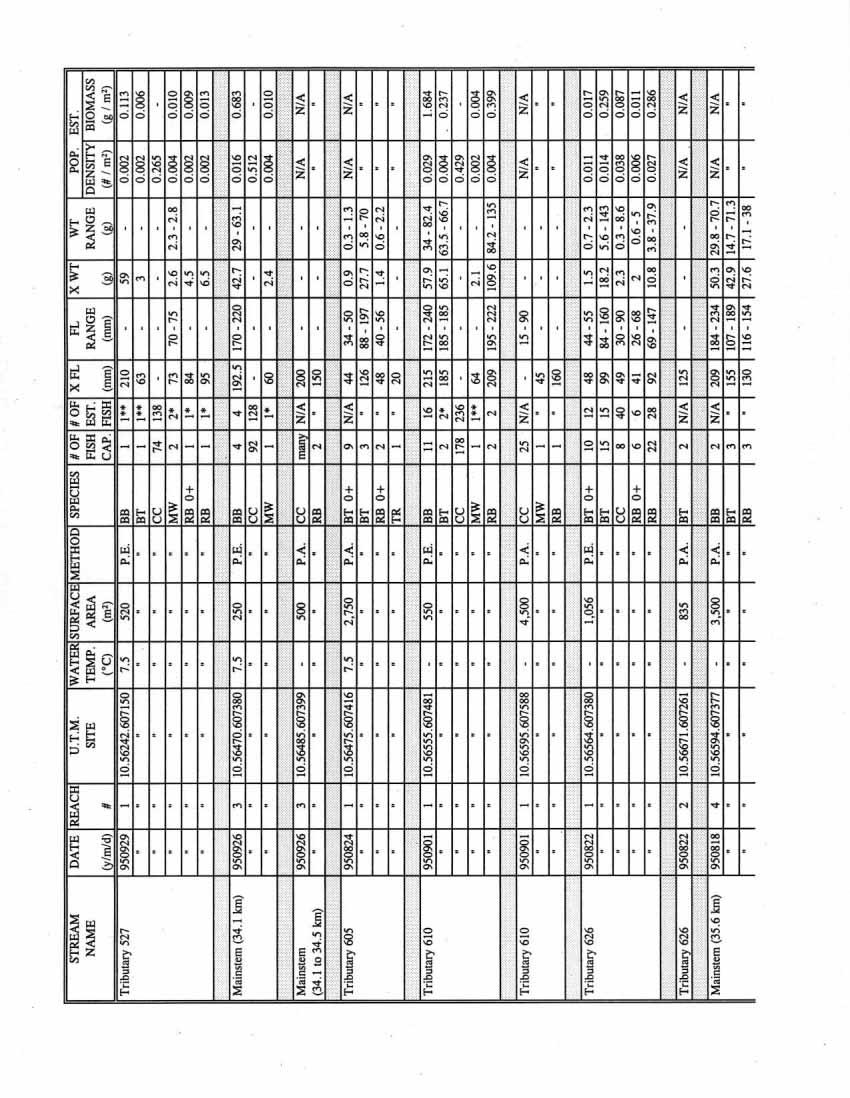
14 Fish Sampling and Abundance Survey Results Various methods of fish capture along with visual observations were used for surveying the Table River fish population. These methods include: angling, electrofishing, gee trapping, and underwater fish counts. Each method utilised on the Table River was for a specific reason, based on the goals of the survey. Electrofishing results Juvenile fish were found exclusively by electrofishing with the exception of sculpins which have been included here for ease of reporting (Table 1). Electrofishing was undertaken at 40 locations within the watershed (Appendix I). Sixteen sites were located on the Table River mainstem, and 24 sites were situated on 15 of the tributaries. The total surface area electrofished was 39,983 m 2 with more electrofishing effort put on the tributaries. Surface area electrofished in the tributaries was 24,785 m 2, or 62% of the total effort. Mainstem electrofishing covered 15,198 m 2, representing the remaining 38% of the electrofishing effort. Table 1. Total number of fish captured by electrofishing. Fish Number of fish Number of fish captured in the captured in the mainstem tributaries * Indicates that not all captured sculpins were enumerated. Total number of fish captured Arctic grayling burbot bull trout rainbow trout sculpin (family) 224* * sucker (family) whitefish (family) Total number of fish Nine hundred and sixty-four, fish were captured in the Table River watershed by electrofishing. Sculpins comprised a large percentage, approximately 70%, of the fish. Sixtyseven percent of the enumerated sculpins were captured in tributaries. The number of sculpins enumerated in the mainstem (Table 1) is only an estimate. Sculpins captured at one mainstem site (km 34.1 to 34.5) were not enumerated by the field crew. Instead, the number of sculpins captured was recorded as "many" (Appendix I). Arctic grayling were the least numerous fish captured and were observed only in one spot of the mainstem. No Arctic grayling were captured by electrofishing within the tributaries of the Table River. Fish density estimates were determined for 12 sites in, the Table River by electrofishing (Appendix II). These sites were deemed representative of the stream reach in which they were surveyed, thereby allowing fish density extrapolation into the entire stream reach. The two or three pass removal method was used to collect fish. These closed sites averaged approximately 440M 2 in size. Density estimates for all species were calculated, but only game fish (except whitefish) will be referred to in this section of the report. 9
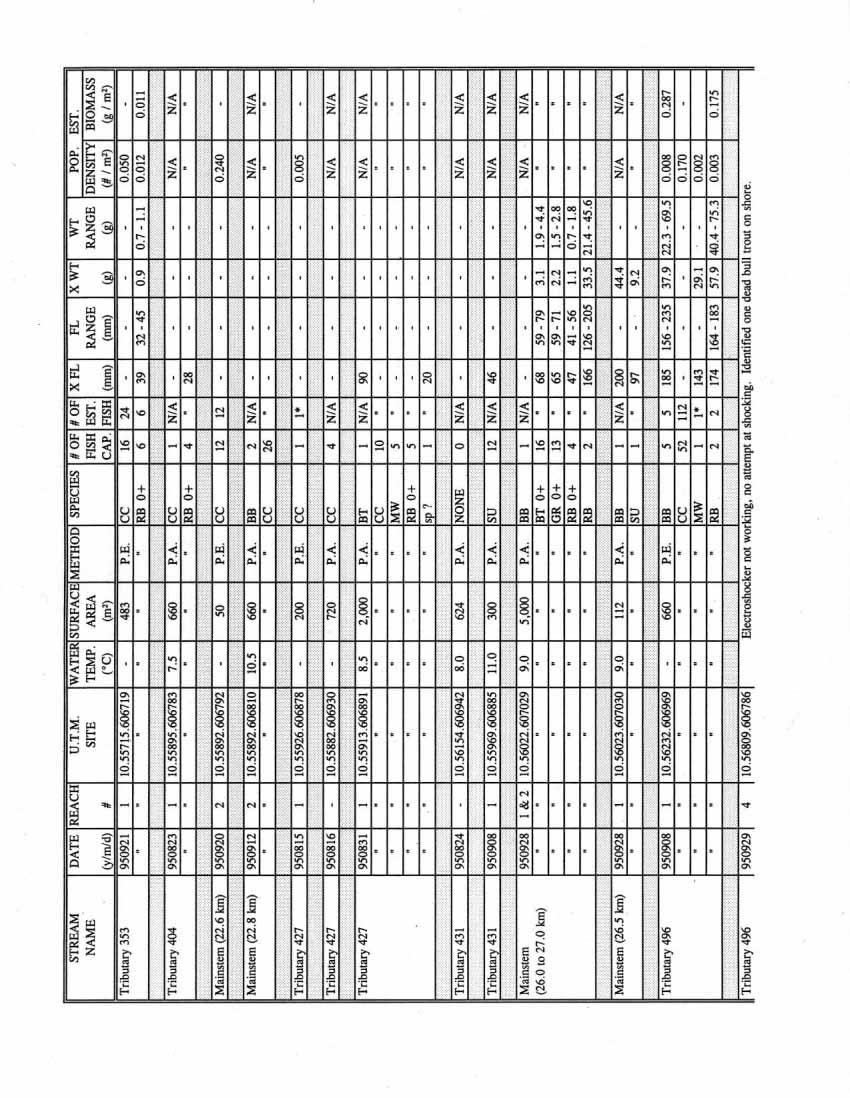
15 The highest bull trout density was observed in tributary 626 at fish per m 2 for young-of-the-year fish and fish per m 2 for juvenile bull trout (Table 2). The highest rainbow trout density was observed in tributary 154 at fish per m 2 for each, of the two age classes. No Arctic grayling were captured in any of the closed site areas. Table 2. Comparison of game fish densities and population estimates. ' The fish species column is broken down into two age categories. Fish aged 0 + are strictly young-of-the-year fish while all other fish consist of ages 1 year and older combined (juveniles). This breakdown provides a better comparison between young-of-the-year and juvenile fish. BT = bull trout and RB = rainbow trout. Sixteen additional open sites were electrofished to determine fish presence or absence (Appendix II). Captured fish include: Arctic grayling, bull trout, burbot, rainbow trout, sculpin spp., sucker spp., and whitefish spp. Most sites contained few fish, although one particular site produced 16 bull trout, 13 Arctic grayling, 6 rainbow trout, and 1 burbot. This higher populated site (mainstem km 26 to 27) was the only place where Arctic grayling were captured during electrofishing. This electrofishing site was within habitat not expected, by the field crew, to support significant fish populations. The area could best be described as a receding riffle. The site was located on the downstream end of a long glide/pool, and just upstream of a riffle. Habitat characteristics of this site contained shallow water (10 cm or less), primarily small cobble substrate, and little to no flow. 1 0
16 Gee Trapping Results Gee traps were used minimally. Only three sites, within tributaries, were chosen to sample fish in the Table River system (Table 3). No mainstem sites were chosen for gee trapping. Fish were captured at all three sites, but no juvenile game fish were captured. Table 3. Gee trapping results. Location Date Habitat Fish Number of type captured fish caught Tributary 353 Aug. 10, 1995 wetland area sucker (family) 5 Tributary 072 Aug. 15, 1995 swamp dace (family) 5 Tributary 427 " Aug. 16, mouth area sculpin (family) whitefish (family) 1 1 The location of the first gee trapping site was located in a wetland area adjacent to tributary 353 (approximately 600 m from the mouth). The second location was a swamp located 100 m downstream of the road crossing on tributary 072. The third location of gee traps were set at the mouth of tributary 427. No significant habitat difference was noted between these three sites. The most numerous fish species captured by gee trapping were suckers and dace (each with 5). Underwater Fish Count Results (single pass) Single pass, two person underwater fish counts were conducted on the following dates: July 6 and 7 from km 35.5 to 29, July 9 from km 24 to 17, and July 18 and 19 from km 17 to the mouth (km 0) of the Table River. These surveys were used to determine the distribution of fish species throughout the mainstem. A five kilometre section (km 29 to 25) was not surveyed due to difficult access. Mean wetted widths and visibility for each section were measured to provide an expanded fish count. Observed fish species included: Arctic grayling, bull trout, northern squaw fish, rainbow trout, suckers, and whitefish. The total number of fish observed per kilometre by each fish species was enumerated (Appendix III). In the single pass survey, many fish were observed. Whitefish (n=2,627) was the most numerous species observed. The next highest count was suckers at 693, Arctic grayling at 165, rainbow trout at 66, northern squawfish at 51, and bull trout at 22. The greatest number of fish observed per kilometre occurred between km 24 to 23 (n=491). Since the swimmers could not see the entire wetted width, the actual numbers of fish observed in each kilometre section were then expanded (Fig. 3) to the number of fish believed present (Appendix III). The highest expanded count of fish believed to be present occurred between km 36 to 35 (790 total). Note that the expanded values for kilometre 36 to 35 have been doubled as only the lower 500 m of this section was surveyed. Spikes or locations of dramatic increase in fish numbers (Fig. 3), occur at km 36 (Arctic grayling), km 24 (whitefish), km 20 (suckers), km 17 (whitefish and suckers), and km 7 (rainbow trout). Arctic grayling populations were highest in the upper river, while sucker observations were noticeably higher in the lower sections of the river. Bull trout distribution 11
17
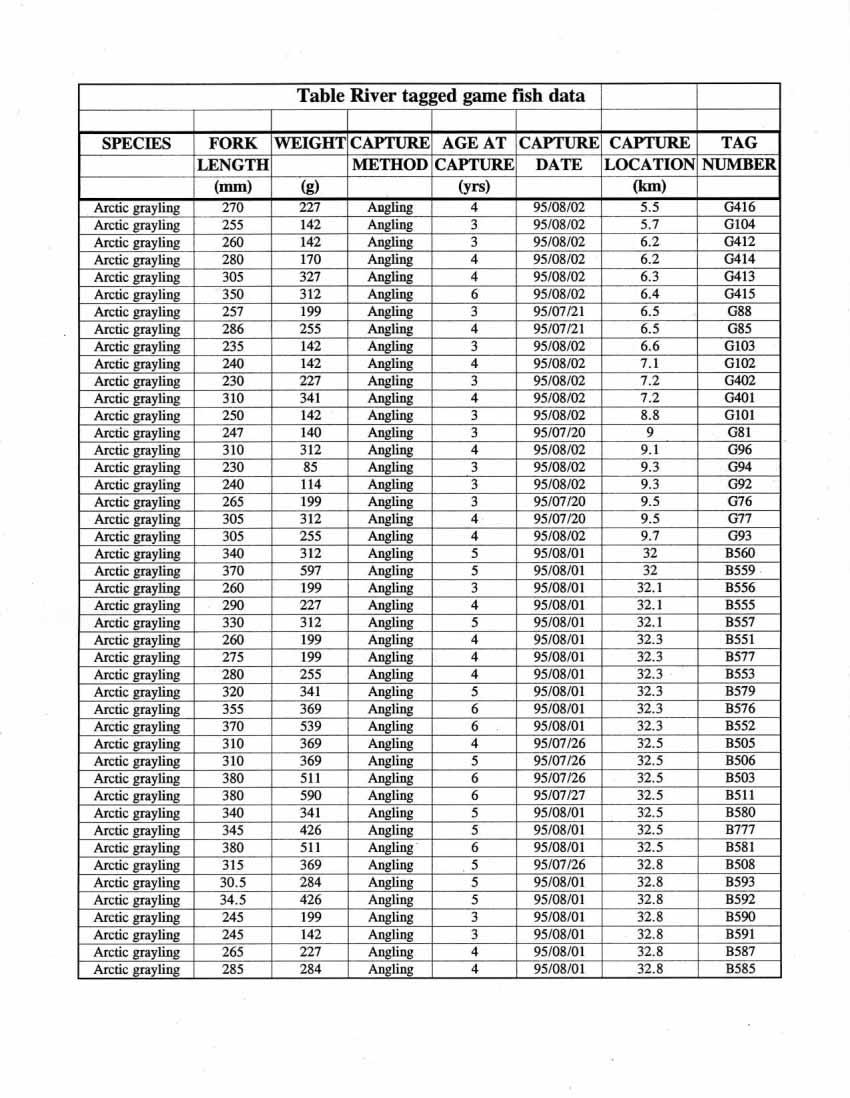
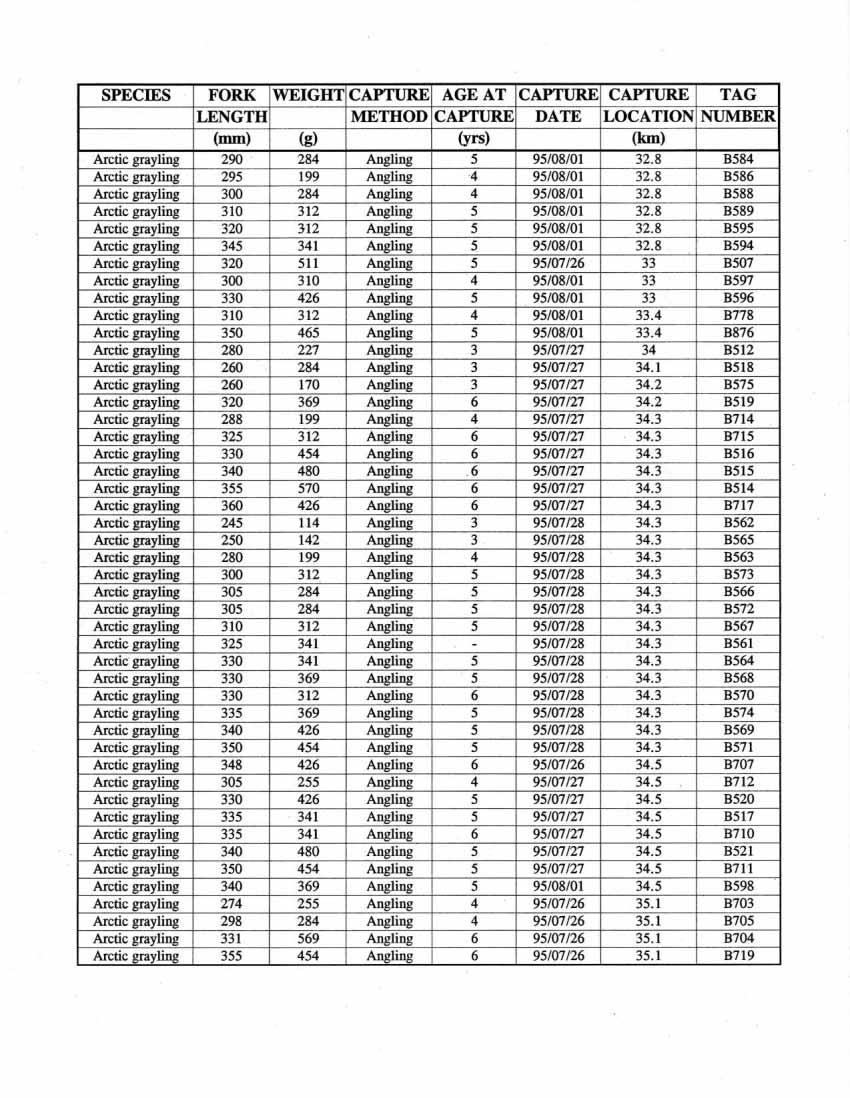
18 was uniform in low concentrations along the entire length of the river. Rainbow trout numbers were also uniform in distribution along the length of the river though increase slightly in the lower sections. Whitefish appear in slightly higher numbers in the upper sections. Northern squawfish were found only in the first 11 km. Underwater Fish Count Results (two pass) To facilitate the mark-recapture study, Arctic grayling, bull and rainbow trout were marked with Floy tags. Tagging efforts were initiated on July 20 and ended on August 3 with the majority of tags being placed from July 27 to August 2. One hundred seventy-six adult fish were angled throughout the two representative sections of the mainstem (Table 4). Floy tags were applied to 147 of these fish (Appendix IV). Table 4. Total number of captured and tagged fish by section. Location Arctic Grayling Bull Trout Rainbow Trout captured tagged captured tagged captured tagged Lower Section Upper Section Total fish tagged Angling for adult fish revealed that species abundance was quite different between the upper and lower sections (Table 4). The majority of Arctic grayling and bull trout were caught in the upper section while the majority of rainbow trout were captured in the lower section. Angling effort was slightly higher in the upper section. Floy tags were applied to 103 Arctic grayling, 32 rainbow trout, and 12 bull trout. From these capture results, angling may be biased towards Arctic grayling. A two pass underwater fish count was conducted on August 9 and 11, These counts were in the upper (km 35.5 to 32.0) and lower (km 9.8 to 5.0) sections. The data from these two swims (Appendix V) was used to determine fish population estimates (Appendix VI). Arctic grayling, bull trout, and whitefish were observed in higher concentrations in the upper section as compared to the lower section. Arctic grayling observations were more distinct as 222 fish (total for both passes) were seen in the upper section as compared to 64 fish (total) observed in the lower section. Bull trout observations revealed 39 fish (total) in the upper section and 28 fish (total) in the lower section. Whitefish numbers were also more distinct as 1,594 fish (total) were seen in the upper section while 1,037 fish (total) were observed in the lower section. Rainbow trout, northern squawfish, and suckers were observed in the lower section more than they were observed in the upper section. Total rainbow trout numbers were 168 (total) in the lower section and 23 (total) in the upper section. No northern squawfish or suckers were observed in the upper section. Total fish densities were derived for all fish in the upper and lower river sections of the Table River (Table 5). These numbers represent an estimate of fish numbers observed at each section. The entire stream width was visually covered by the swimmers on the upper section. Therefore, all fish could theoretically be counted and were not subject to any visual limitation 1 3
19 expansion factor. The entire stream width was not visually covered by the swimmers on the lower section. Therefore, not all fish could theoretically be counted and therefore, counts were subject to a visual limitation expansion factor. This expansion factor was 1.33 for the lower river section. Table 5. Total fish densities, for all sizes of fish, using two pass fish counts. Arctic bull northern rainbow sucker whitefish grayling trout squawfish trout (family) (family) # of fish / area ha km ha km ha km ha km ha km ha km Upper Section Lower Section In the upper section (where the entire wetted width was visually observed by all swimmers), whitefish (227.7) had the highest number of fish per kilometre. The next highest count was Arctic grayling (31.7 fish per km) and then bull trout (5.6 fish per km). Rainbow trout came next at 3.3 fish per km. No northern squawfish or suckers were observed in the upper section during the replicate underwater fish counts. In the lower section, (where the fish counts had to be expanded), whitefish (144.0) were again the highest number of fish observed per kilometre. The next highest observed was rainbow trout (23.3 fish per km) and then Arctic grayling (8.9 fish per km). Total fish density estimates for tagged fish greater than 20 cm in length were generated (Table 6). Population estimates for certain fish species in the Table River were determined from mark-recapture results of fish greater than 20 cm, (Appendix VI). From the two pass fish count results, only Arctic grayling, bull and rainbow trout were marked. Of these three tagged fish, Arctic grayling had the highest fish density in the upper section (31.7 fish per km). In the lower section, rainbow trout had the highest fish density (18.2 fish per km). Table 6. Total fish densities, for tagged fish greater than 20 cm, using two pass fish counts. Arctic grayling bull trout rainbow trout # of fish per area ha km ha km ha km Upper Section Lower Section Mark Recapture Mark-recapture results were used to develop correction factors that would provide accurate estimates on fish populations (Table 7) if statistically valid. These results must meet two different criteria. First, to be statistically valid, a mark-recapture study requires the initial marking of fish (M) to be 20% or more of the total estimated fish population (N). Secondly, to avoid any bias due to low fish numbers, the total number of marked fish multiplied by the number of fish captured (C) should be more than four times the total estimated fish population (Robson and Regier 1964). This correction factor, if statistically valid, provides an accurate 14
20 estimate on the number of actual fish to expect for a certain area sampled. Even though the combination of all swimmers may be able to visually see fish within the entire wetted width of the stream, fish can be hiding and thus not counted. Based on the above two criteria, the only valid mark-recapture result which provides a reliable correction factor was for Arctic grayling in the upper section. In this area, 81 Arctic grayling were tagged. On the first underwater fish count, 107 Arctic grayling were observed where 50 of these fish were tagged. On the second underwater fish count, 115 Arctic grayling were observed where 58 fish were tagged. With these results, the data passed the two criteria tests and provided a correction factor of 1.5 for Arctic grayling in the upper survey section. Correction factors for bull and rainbow trout were calculated; however, they did not meet the requirements of the mark-recapture test and are not statistically valid. Table 7. Table River mark-recapture results with correction factors for BT, GR, and RB. - BT = bull trout, GR = Arctic grayling, and RB = rainbow trout. - Total tagged includes a 4% reduction attributed to hooking and tagging mortality rate. - Total fish N = (M + 1)(C + 1)/ (R +1). - M/N = % of total population that was tagged. The minimum number to tag is 20% where the population (N) is less than 1000 (Vincent 1971). - For a mark-recapture to provide an unbiased estimate, MC should be > 4N, or M + C equal or > N (Robson and Regier 1964). - Enlarged numbers in bold are significant based on M/N > 20% and MC > 4N and are statistically correct. - Only fish minimum 20 cm were tagged, all data including total observed, refer to fish equal to and greater than 20 cm long. - (a) m/r calculation is where m = Mean N, and r = hectares of the section - where area of upper section = 4.9 ha., area of lower section = 13.4 ha. - (b) u/w swim calculation refers to expanded underwater census results (see Table 6). Only the correction factor of 1.5 in the upper section for Arctic grayling is statistically valid. This value indicates that the average number of fish actually observed (n=167.4) had to be multiplied by 1.5 to provide a better representation of the number of fish present. This correction factor indicates that 50% of the Arctic grayling present were not observed by the swimmers. Therefore, the estimated population for Arctic grayling within the upper section (km 35.5 to 32.0) of the Table River is 251 fish. The remaining correction factors can not be used to estimate accurate fish populations because they are not statistically valid. 1 5
21 Arctic Grayling Observations Arctic grayling were observed only in the first 37.6 km of the mainstem of the Table River. The first set of falls are a barrier to upstream migration of Arctic grayling. No evidence of fish use by Arctic grayling in the tributaries, side channels, or back channel habitat was observed. No spawning activity by Arctic grayling was observed, and no locations of spawning identified. Although, it is important to note that field work did not commence until July. Arctic grayling spawning likely occurs in mid-may, as observed in the Sukunka River (Stuart and Chislett 1979). Thirteen young-of-the-year Arctic grayling (age 0+) were captured between km 26 and 27 of the Table River. The fish were captured in locations with shallow water (10 cm or less), primarily small cobble substrate, and with little to no flow. The Arctic grayling were located in receding riffle habitat associated with the downstream end of large glides or pools. This location, in particular one 60 m 2 site within it, contained the highest concentrations of age 0+ Arctic grayling encountered in the Table River watershed. The number of Arctic grayling observations were higher in the upper section of the Table River (Appendix IV and V). The population of Arctic grayling in the upper section was comprised of older and larger individuals in comparison to the lower section (Appendix VII). In the upper section, Arctic grayling averaged 316 mm in fork length and 4.8 years. In the lower section, the average length of Arctic grayling was smaller at 241 mm and the average age was 3.1 years. However, it is noted that ageing Arctic grayling scale samples older than age 4 is a problem and is probably not valid (Doug Fleming, Alaska Department of Fish and Game, pers. comm.). Arctic grayling spawning locations were not observed. The highest concentration of adult Arctic grayling observed was in the confluence pool of Tributary 605 and the Table River. The observations were made in July and August, after the suspected peak spawning period from May to June. Therefore, it is not known if this site is a prime spawning area, or in close proximity to one. The site appears to have optimal adult rearing and feeding habitat. Bull Trout Observations Juvenile bull trout. were captured in both the mainstem and in the tributaries. More juveniles (n=49) were caught within the 15 tributaries as compared to the number of bull trout captured in the mainstem (n=35), which may be a result of more electrofishing effort on the tributaries (an additional 9,587M 2 ). Juvenile bull trout were found as far upstream as 54 km from the mouth, but observations of fish presence from km 37.6 to 54.0 was not surveyed intensively due to access limitations. One site on the mainstem (km 27.0 to 26.0) contained sixteen juvenile bull trout. This location, in particular one 60 m 2 site within it, contained the highest concentrations of age 0+ bull trout encountered in the Table River watershed. Juvenile bull trout appeared to be evenly distributed throughout the mainstem from km 37.6 to the mouth, and they did not appear to congregate in any single site. Juvenile bull trout were also caught throughout many of the Table Rivers tributaries. Within these inhabited tributaries, it is unknown how far upstream the juvenile bull trout have migrated. 1 6
22 Adult bull trout were found throughout the mainstem as far upstream as 37.6 km from the mouth survey end. Within the mainstem, bull trout observations were higher in the upper section than in the lower section (Appendix IV and V). The population in the upper section was comprised of older and larger individuals as compared to the population in the lower section (Appendix VII). In the upper section, bull trout averaged 498 mm in length and 5.3 years in age. In the lower section, the average length of bull trout was smaller at 395 mm and the average age was 4.5 years old. Although no adult bull trout were observed past the first obstruction on the mainstem, it is safe to say that they are present up to 54 km from the mouth as juveniles were observed this far upstream. Rainbow Trout Observations Juvenile rainbow trout were captured in the mainstem and in the tributaries. More juvenile rainbow trout (n=132) were caught in the Table River system by electrofishing in comparison to Arctic grayling and bull trout (Table 1). The number of juvenile rainbow trout (117) was significantly higher in the tributaries when compared to the number of fish (n=15) caught throughout the mainstem. Again, electrofishing effort was emphasised more on the tributaries. Within the mainstem, juvenile rainbow trout were caught from the mouth up to the first set of falls. Juvenile rainbow trout were also caught throughout the lower associated tributaries. It is unknown how far upstream rainbow trout have migrated into these tributaries. No adult rainbow trout were observed or captured in any of the 15 surveyed tributaries of the Table River. Adult rainbow trout were observed only in the mainstem from the mouth upstream to the falls (km 37.6). Rainbow trout numbers were higher in the lower section of the Table River (Appendix IV and V). The population in the lower section was comprised of shorter but older individuals in comparison to the upper section (Appendix VII). In the lower section, the average fork length of rainbow trout was 237 mm and the average age was 3.0 years old. In the upper section, rainbow trout averaged 271 mm in length and 2.9 years old. Age versus Length Analysis Data was collected for Arctic grayling age 0 to 7 fish (no age 1 data was collected), bull trout age 0 to 8 fish (no age 6 data was collected), and rainbow trout age 0 to 4 fish. Age and fork length measurements collected from all of these three fish species within the Table River watershed was used for analysis. Although, age analysis of Arctic grayling scales have been proven to be inaccurate after four years of age (Doug Fleming, Alaska Department of Fish and Game, pers. comm.). The annulus only appears on the scales up to the fourth year. Even though Arctic grayling grow in size over time, the annulus does not form continuously each year on the scale, thus resulting in the same age fish as the previous one. Therefore, age data after four years for Arctic grayling is likely not valid and should be used with caution. Since all age classes of each fish species do not have the same number of samples, the calculated mean lengths had to be weighted for comparison purposes. The precision of the calculated mean lengths for each age group of fish are indicated by the standard error (Fig. 4, Table 8). Mean lengths for some age classes of fish are few and should be used with caution. 17
23
24 Table 8. Fish catch statistics. Species Age (yrs) 'Mean fork length (mm) Standard Deviation Rainbow trout 0 67(8) (30) (27) (18) (17) 'Sample size (n) immediately follows mean fork length value. When examining the growth rate of the three Table River game fish species (Fig. 4), bull trout had the largest mean length-at-age 0 (73 mm). Rainbow trout was the next largest with 67 mm as the mean length-at-age 0. Arctic grayling had a mean length of 65 mm at age 0. Data exists only as old as age 4 for examining the growth rates of these three fish species together. Bull trout appear to grow the fastest (Table 8). At age 4, bull trout had an average fork length of 302 mm, Arctic grayling was 289 mm in fork length, and rainbow trout was 279 mm in fork length. Although, these values are dependant on the number of representative samples collected for each species. Length-at-age of Arctic grayling from the Table River (Table 9) was compared to other systems in the Williston Reservoir watershed (unpubl. data). Comparisons of fish in one system with those in another are difficult due to differences among times of collection, in sample sizes, in methods of analysis, and in age interpretation. In general, the growth rate of a fish species can be determined by plotting the mean fork lengths by age. For comparison purposes, thorough data on Arctic grayling in the four systems of the Williston Reservoir only exists for aged 2 to 5 year old fish. Age 5 data should be used with discretion due to ageing problems. On average, the Nation River Arctic grayling appear to have the larger growth rate of the four systems while the Parsnip River Arctic grayling appear to have a smaller growth rate of the four systems. (SD) Standard Error (SE) length (mm) Arctic grayling 0 65(13) (9) (25) (30) (35) (22) (l) Bull trout 0 73(19) (21) (4) (5) (5) (6) (l) (2)
25 Table 9. Table River Arctic grayling growth rate comparison with three Williston systems. Age (yr.) Mean fork length (mm) Table River Mesilinka River Nation River Parsnip River Std. Dev. No. of fish Mean fork length (mm) Std. Dev. No. of fish Mean fork length (mm) Std. Dev. No. of fish Mean fork length (mm) Std. Dev No. of fish DISCUSSION Fish observed in the Table River watershed include: Arctic grayling, bull trout, burbot, dace, northern squawfish, rainbow trout, sculpins, suckers, and whitefish. Dace, sculpins, suckers, and whitefish were not keyed out to species level during the 1995 field studies. Previous studies by the Resource Analysis Branch of the Ministry of Environment identified sculpins captured in the Table River as slimy sculpins. The 1980 Sigma Resources Consultants Ltd. report indicate the presence of large-scale suckers, longnose suckers, mountain whitefish, prickly sculpins, and white suckers in the Table River. Dace have not previously been observed in the Table River; however, the 1980 Sigma Resources Consultants Ltd. report identified the presence of longnose dace in the Parsnip River. All of the previously mentioned fish species could possibly inhabit the Table River. The electrofishing efforts did identify a number of tributaries (072, 199 and 431) where no fish were present in suitable habitat due to access barriers (dams) produced by beavers. An old cutblock exists at the lower end of tributary 431. Beaver activity appears to have increased in tributary 431 after the harvesting operation returned the forest stand around the stream to an early successional stage, predominated by beaver food such as willows. The stream above these dams was evaluated in 1995 and was deemed suitable fish habitat. These obstructions to fish will have to be removed if fish are to gain access and utilize this upstream fish habitat. Underwater fish counts of game fish species in river systems do provide an indication of species composition. In the upper section, the species relative abundance observed from the underwater counts was 78% Arctic grayling, 14% bull trout, and 8 % rainbow trout. The species composition from angling was similar - 80% Arctic grayling, 10% bull trout, and 10% rainbow trout. In the lower section, the species relative abundance observed during the underwater count was 63 % rainbow trout, 25 % Arctic grayling, and 12 % bull trout. The species composition from angling was relatively the same - 50% rainbow trout, 45% Arctic 20
26 grayling, and 5 % bull trout. With the species composition similar to the distributions obtained from these salmonids captured with angling gear, this underwater census on the Table River could be useful for evaluating the effects of the fishery regulations (Slaney and Martin 1987). Upstream fish migration on the Table River appears to be restricted for some species. A barrier (2.0 m vertical waterfall) to most fish species is located 37.6 km upstream from the mouth of the Table River. Only bull trout and sculpins were captured above the waterfall. A further 5.1 km upstream (km 42.7) a series of cascades, including a one metre waterfall, present another area of difficult fish passage. Bull trout were captured upstream of 42.7 km indicating successful migration past these cascades; however, sculpins were not. Sculpins could not have migrated unaided past the first 2.0 m waterfall at km It is unknown how the sculpins were initially seeded upstream of the first waterfall. The population of sculpins upstream of the waterfall at km 37.6 are isolated within the 5.1 km between the two areas of difficult fish passage. At km 54, the gradient is very steep on the mainstem. Only juvenile bull trout were observed up to this gradient barrier. No surveys were conducted further upstream of the 54 km point. A complete record of game fish distribution in the tributaries of the Table River was not attained. It is not known how much of the tributaries fish are utilising, as not all tributaries were studied. Some of the tributaries are known to have beaver dams or waterfalls on them. No single tributary was completely electrofished until fish distribution ceased. Only single, and sometimes two sections were electrofished on a tributary. Instead, more effort was placed on trying to determine species presence/absence within the tributaries. Most of the electrofishing sites were focused at the mouth of the tributary and at vehicle access points. Other areas that are less accessible may need to be electrofished to more accurately determine species presence/absence and distribution. The distribution between juvenile and adult fish observed for each species in the Table River varies. Juvenile Arctic grayling were observed as far upstream as km 27 while the adults were observed as far upstream as km Juvenile rainbow trout were observed as far upstream as km 35.6 while the adults were observed as far upstream as km Juvenile bull trout were observed as far upstream as km 54. Although adult bull trout were only observed as far upstream as km 37.6, it is somewhat safe to assume that adult bull trout are located as far upstream as km 54. The first two obstructions are areas of difficult fish passage. It is still unknown if these two obstructions inhibit upstream migration of bull trout. The population of bull trout above these two obstructions could be a resident population. Spikes or locations of dramatic increase in fish numbers occur at km 24, km 17, and kin 7 sections. These sites are similar in that they contain deep pools or deep pools associated with a large debris jam. It has not been determined at this point if ideal adult summer rearing/feeding habitat such as these pools is a limiting factor to the overall fish population size of the Table River. These sites do have the capacity, due to their large size and depth of pools, to provide suitable overwintering habitat. If further investigations identify that this type of habitat is limiting the population size; the opportunity to enhance the fish populations through "debris catchers" and pool creation will be examined. Additional spikes occur at km 2 1
27 36 and km 20. It is postulated that these two areas offer ideal summer feeding areas for Arctic grayling (km 36) and suckers (km 20). No adult bull or rainbow trout were observed in any of the 15 surveyed tributaries; however, juvenile bull and rainbow trout were observed in tributaries associated with the mainstem as far upstream as tributary 626. No tributaries enter the Table River between tributary 626 and the waterfall located at km It would appear that the first set of falls on the mainstem is a barrier to upstream rainbow trout migration thereby eliminating the use of tributaries upstream of km 37.6 by rainbow trout. Bull trout are located as far upstream as 54 km on the mainstem, although, their utilisation of the associated tributaries is unknown. Thorough examination of these tributaries was not undertaken as there is limited ground access to this area for survey crews. Most sites were accessible only by helicopter. Bull trout were observed in low numbers in both the upper and lower sections. However, a bull trout density of 3.29/km for fish in the 40+ cm size class was observed in the upper section as opposed to a density of 0.3/km for fish in the lower section indicating a much higher use of the upper section by this size class. The large bull trout present in the upper section are probably spawners seeking out preferred spawning habitat, or "staging sites" prior to spawning as outlined by Hass (1997). McPhail and Baxter (1995) identified preferred habitat as having a predominance of small gravel (< 20 mm diameter), relatively low water velocity ( m/s), and proximity to cover. This preferred habitat would likely be the relatively stable flows and reduced sediment content in the upper section as compared to the more turbid lower section. These large piscivorous fish could also be remaining in this area after spawning to feed on the mountain whitefish and Arctic grayling. The densities of these prey are at least four times greater in the upper section as compared to the lower section. Suckers were observed in high concentrations at two areas of the mainstem. A pronounced specific sucker spike occurs at the 20 km section. Very large schools of suckers were observed in this section. This one kilometre section is essentially a low gradient glide with no cover. The fish may have recently completed spawning; however, it is not known if the fish had spawned in this location or recently moved to it. In addition, a large school of suckers were observed at the 23 km section of the river immediately downstream of the bridge crossing. These fish were observed frequently at this location prior to the July 6-19 survey. This site may be an important spawning location for suckers. The size of Arctic grayling was larger the further upstream they were located. There was a noticeable number of Arctic grayling in the upper area (km ) of the mainstem, especially in the confluence pool of Tributary 605 and the Table River. This occurrence of larger (hence older) Arctic grayling in the upper reaches of a stream has been previously noted by Northcote (1978) and Tack (1980) and is believed to be a component of an Arctic grayling migratory sequence. This sequence suggests that the adult fish migrate to the upper reaches of the stream with sub-adult fish occupying the middle reaches of the river, and finally juveniles inhabiting the lower reaches of the river. In addition, this trend of observing older Arctic grayling in the upper reaches may be attributed to their migration to feeding areas as reported by Armstrong (1982). 22
28 Other explanations on why larger Arctic grayling are observed in the upper reaches of a stream may be based on energetics. The similarity between the positions predicted and those selected by the Arctic grayling supports the idea that Arctic grayling choose positions which maximise their net energy rate (Hughes and Dill 1990). There appears to be an important trade-off between the number of prey items that a fish sees, and the proportion of these it is able to capture. The number of prey fish sees increases with water depth and velocity. The upper reaches of the Table River have areas of relatively fast velocity and narrow wetted widths. Salmonids generally move into faster, deeper water as they grow, and change their positions daily and seasonally (N.F. Hughes and L.M. Dill unpubl. data). Migrations to feeding areas may vary depending on the age of Arctic grayling, type of system in which they overwinter, and the type of system in which they spawn. Arctic grayling that migrate to feeding areas in unsilted rapid-runoff rivers tend to go to different areas, depending on their age and maturity. Juveniles (ages 1 to 3) move into or remain in the lower portions of these rivers and their associated tributaries; the subadults (ages 4, 5, and sometimes 6) tend to move to the middle portions of the river; and post-spawning adults either move upstream to feed in the upper reaches of the river or, if they spawned in the upper reaches, remain there throughout the summer (Armstrong 1982). This theory appears to be related to the Table River as the first 26.7 km of the river was originally identified as a "lower portion" part of the river. The only juvenile Arctic grayling found in the Table River system was within this lower portion (km 26). Therefore, the area in which these juveniles were found may be indicative of a prime feeding area for juvenile Arctic grayling. The majority of the larger Arctic grayling observed in the Table River came from the upper accessible reaches. Adult and sub-adult Arctic grayling were most often observed in small pools or glides containing at least some large woody debris. The Arctic grayling were usually observed not in the expected debris/cover, but a few metres to the side or behind the debris. Arctic grayling were usually situated very close to the thalweg through the pools, and stationed approximately 10 cm off the bottom. The preferred depth and velocity of Arctic grayling (n=59, fork length > 10 cm) was 136 cm and 0.36 m/sec respectively (Langston 1998). Only sub-adult Arctic grayling were located in water depths less than one metre. Arctic grayling were not captured/observed in any of the 15 tributaries of the Table River that were surveyed in It is known that Arctic grayling are found as far upstream as km 37.6 of the mainstem. Tributaries 072, 163, 199, 203, 243, 257, 307, 528, 538, and 549 were not electrofished during It is possible that these 10 tributaries could have contained Arctic grayling within them. More electrofishing effort will have to be completed during the summer of 1996 within these associated tributaries to determine if Arctic grayling are utilising tributaries in the Table River system. Arctic grayling of the Table River are similar in size at age to Arctic grayling of the Mesilinka River as reported by Koning, Ashley, and Slaney (1995). In addition, the Table River Arctic grayling are comparable in size as the Parsnip River Arctic grayling as reported by Bruce and Starr (1985). Arctic grayling in the Table River were smaller than the Arctic grayling in the Nation River (unpubl. data). These comparisons are based on the number of fish collected for each age group. Some age groups in a system have considerably more fish 2 3
29 samples than the same age group in another system. Size differences of Arctic grayling are likely due to the warmer water temperatures of the Nation River as compared to the other systems (Langston 1992, 1993, 1995; Langston and Zemlak 1994). Warm water systems generally induce the growth rates of fish. Further information on preferred spawning locations, feeding, and overwintering habitat locations of adult Arctic grayling will be determined by a radio telemetry project to be initiated in the summer of The radio tracking program will help determine locations of overwintering, spawning, and summer feeding of Arctic grayling in the Table River area. An Arctic grayling genetics study will also be initiated in This genetic project will determine if there are genetically unique Arctic grayling stocks within the Table River. If unique genetic stocks do occur within the Table River Arctic grayling population, specific protection measures may be required. In addition, rehabilitation of degraded habitat at locations found to be important/critical for each stock encountered may be necessary. 24
30 ACKNOWLEDGEMENTS The Table River reconnaissance survey was co-funded by Forest Renewal B.C. through the Watershed Restoration Program (File #PG /W), and the Peace/Williston Fish and Wildlife Compensation Program (PWFWCP). Several individuals from the B.C. Conservation Foundation, Prince George, assisted in collecting the field data for this study. These people include: Joe delaronde, Josh Foerderer, Mark Hunter, Tracey Martin, and Steve Kristoffy. Their hard work and determination was much appreciated. Methodology used to generate fish population estimates from an underwater fish census was developed by Wendell Koning (B.C. Environment, Research Branch). British Columbia Railway contributed towards this project in the form of reduced accommodation charges at their Tacheeda Camp for the field personnel. In particular, we would like to thank all the BCR staff at the Tacheeda Camp, and Charlene Danielson, for their assistance and information freely given towards this project. We also thank the following people for critical review of this report: Nick Baccante (Ministry of Environment, Lands and Parks, Fort St. John), Brian Blackman (MELP, Prince George), Don Cadden (MELP, Prince George), Carol Lamont (B.C. Hydro, Vancouver), and Bob Westcott (BCH, Hudson's Hope). Their comments were of much benefit. 2 5
31 LITERATURE CITED Anonymous. 1978b. Report on environmental studies for the McGregor River diversion project. Vol Prepared by Reid, Crowther and Partners Ltd. for B.C. Hydro and Power Authority. Anonymous Environmental aspects of proposed BCR Anzac/Quintette branch line, stage two assessment. Vol Sigma Resource Consultants Ltd. for B.C. Ministry of Industry and Small Business Development, and Government of Canada Dept. of Regional Economic Expansion. Anonymous Hydraulic and fishery evaluation Table, Sukunka and Wolverine Rivers. Acres Consulting Services Ltd. For B.C. Rail. Anonymous Tracking lists for vertebrate animals, vascular plants and plant communities. British Columbia Conservation Data Centre, Wildlife Branch, Ministry of Environment, Lands and Parks, Victoria, B.C. Armstrong, R.H A review of Arctic grayling studies in Alaska, Biol. Pap. Univ. Alaska. No p. Bruce, P.G. and P.J. Starr Fisheries resources and potential of Williston Reservoir and it's tributary streams, Volume II. Fisheries resources of Williston Lake tributaries - a preliminary overview. Fish Tech Circ. No. 69 Ministry of Environment, Fish and Wildlife Branch. Hass, G Bull trout and Dolly Varden identification and biology workshop. Notes from Ministry of Environment, Lands and Parks, Fisheries Branch - Research and Development, workshop. 12p. Hughes, N.F., and L.M. Dill Position choice by drift-feeding salmonids: model and test for Arctic grayling (Thymallus arcticus) in subarctic mountain streams, interior Alaska. Can. J. Fish. Aquat. Sci. 47: Koning, C.W., K.I. Ashley, P.A. Slaney, R.W. Land and P.W. Davidson Development of a premier northern river fishery: Mesilinka River pre-fertilization 26
32 progress Peace/Williston Fish and Wildlife Compensation Program, Report No pp plus appendices. Langston, A.R Water temperatures of the Nation and Mesilinka River systems Peace/Williston Fish and Wildlife Compensation Program, Report No p. Langston, A.R Water temperatures of the Nation and Mesilinka River systems Peace/Williston Fish and Wildlife Compensation Program, Report No p. Langston, A.R. and R.J. Zemlak Water temperatures of the Nation and Mesilinka River systems Peace/Williston Fish and Wildlife Compensation Program, Report No p. Langston, A.R Water temperatures of the Nation and Mesilinka River systems Peace/Williston Fish and Wildlife Compensation Program, Report No p. Langston, A.R A reconnaissance survey of the Table River: 1995 status report. Peace/Williston Fish and Wildlife Compensation Program, Report No pp plus appendices. McPhail, J.D., and J. S. Baxter A review of bull trout (Salvelinus confluentus) lifehistory and habitat use in relation to compensation and improvement opportunities. Report prepared for the Habitat Management Division, Department of Fisheries and Oceans, Vancouver, British Columbia. 47p. Northcote, T.G Migratory strategies and production in freshwater fishes, p In S.D. Gerking [ed.] Ecology of freshwater fish production, Blackwell Scientific Publications, Oxford. Robson and Regier Sample size in Petersen mark-recapture experiments. Trans. Amer. Fish. Soc. 93(3): Slaney, P.A., and A.D. Martin Accuracy of underwater census of trout populations in a large stream in British Columbia. North Amer. J. Fish. Man. 7:
33 Stuart, K.M., and G.R. Chislett Aspects of the life history of Arctic grayling in the Sukunka drainage. Prov. B.C., Fish. Br., Prince George, Internal Rep., 11lp. Tack, S. L Migrations and distributions of Arctic grayling in interior and Arctic Alaska. Alaska Dept. Fish and Game, Ann. Rep. of Prog , Proj. F-9-12, 21 (R-I): 32p. Van Deventer, J.S., and W. S. Platts Microfish 3.0. A Software Package for Processing Electrofishing Data obtained by the Removal Method. Forestry Sciences Laboratory. Boise, Idaho. Vincent, E.R River electrofishing and population estimates. Prog. Fish. Cult. 33(3): Wydowski, R.S Relation of hooking mortality and sublethal hooking stress to quality fishery management. Pages in R.A. Bernhart and T.D. Roelofs, editors, Proceedings of a national sport fishing symposium: catch and release fishing. Humboldt University, Arcata, California. 2 8
34 APPENDIX I Electrofishing data
35
36
37
38
39
40
41
42
43
44
45
46
47
48
49
50 APPENDIX II Electrofishing summary and population estimates
51
52
53
54
55
56 APPENDIX III Single pass underwater fish count data
57 Single pass underwater fish count data Location Width Visibility Observed Fish Count Expanded Fish Count (km) (m) ( m) BT GR WG RB SU NSC Total/km BT GR WG RB SU NSC Total/km Observed values for km have been doubled since only half of this section was surveyed. BT = bull trout GR = Arctic grayling WG = whitefish (general) RB = rainbow trout SU = suckers (general) NSC = northern squawfish
58 APPENDIX IV Table River tagged game fish data
59
60
Firth Creek Habitat Enhancement Project 1993
 Firth Creek Habitat Enhancement Project 1993 A. R. Langston December 1993 PWFWCP Report No. 77 The Peace/Williston Fish & Wildlife Compensation Program is a cooperative venture of BC Hydro and the provincial
An Overview and Summary of Methodologies of Arctic grayling ( Thymallus arcticus
 PEACE REGION An Overview and Summary of Methodologies of Arctic grayling (Thymallus arcticus) Projects Conducted in the Parsnip, Table, and Anzac rivers from 1995 to 2007 D.M. Cowie and B.G. Blackman September
Data Report : Russian River Basin Steelhead and Coho Salmon Monitoring Program Pilot Study
 Data Report 1999-1: Russian River Basin Steelhead and Coho Salmon Monitoring Program Pilot Study Sonoma County Water Agency 215 West College Avenue Santa Rosa, California 951 Prepared by David Cook Senior
Dinosaur Reservoir 2002 Fish Collection Summary
 Dinosaur Reservoir 2002 Fish Collection Summary E.B. Murphy, 1 B.G. Blackman 2, D.M. Cowie 2 and Nick Baccante 3 November 2004 PWFWCP Report No. 297. The Peace/Williston Fish & Wildlife Compensation Program
Study Update Fish Distribution and Species Composition
 Study Update Fish Distribution and Species Composition Goals and Study Area Gain a better understanding of fish species composition and abundance in waters associated with the Packwood Lake Hydroelectric
P/FR/SK/41-B HATLEVIK, S. P. CREEL SURVEY OF UNCHA AND BINTA LAKES CQJF c. 1 mm SMITHERS A CREEL SURVEY OF UNCHA AND BINTA LAKES.
 P/FR/SK/41-B HATLEVIK, S. P. CREEL SURVEY OF UNCHA AND BINTA LAKES CQJF c. 1 mm SMITHERS A CREEL SURVEY OF UNCHA AND BINTA LAKES June August, 1982 BY S.P. HATLEVIK BRITISH COLUMBIA MINISTRY OF ENVIRONMENT
Study Update Tailrace Slough Use by Anadromous Salmonids
 Study Update Tailrace Slough Use by Anadromous Salmonids Goals and Objectives Identify what anadromous salmonids use the tailrace slough by: Life Stage (Juvenile, migrating and spawning adults) Timing
Evaluation of the 1992 and 1993 Arctic Grayling (Thymallus Arcticus) Transplants to Little Calais Lake and Current Fish Population Status, 1998
 Transplants to Little Calais Lake and Current Fish Population Status, 1998") Evaluation of the 99 and 99 Arctic Grayling (Thymallus Arcticus) Transplants to Little Calais Lake and Current ish Population Status, 998 A. R. Langston April 999 PWWCP Report No. 99 The Peace/Williston
Evaluation of the 99 and 99 Arctic Grayling (Thymallus Arcticus) Transplants to Little Calais Lake and Current ish Population Status, 998 A. R. Langston April 999 PWWCP Report No. 99 The Peace/Williston
Bull Trout Studies in the Salmo River Watershed: 2001
 Bull Trout Studies in the Salmo River Watershed: 2001 Report Prepared For: BC Hydro Kootenay Generation Area 601 18 th Street Castlegar, B.C. V1N 4A2 Report Prepared By: James Baxter Baxter Environmental
Final Bull Trout Genetics Monitoring Plan for the Wallowa Falls Hydroelectric Project. (FERC No. P-308) June 2017
 June 2017") Final for the Wallowa Falls Hydroelectric Project (FERC No. P-308) June 2017 Prepared by: Jeremiah Doyle PacifiCorp 825 NE Multnomah Street Portland, OR 97232 June, 2017 Page 1 of 8 Table of Contents 1.0
Final for the Wallowa Falls Hydroelectric Project (FERC No. P-308) June 2017 Prepared by: Jeremiah Doyle PacifiCorp 825 NE Multnomah Street Portland, OR 97232 June, 2017 Page 1 of 8 Table of Contents 1.0
SITE C FISHERIES STUDY UPPER HALFWAY RIVER WATERSHED BULL TROUT SPAWNING SURVEY 2008
 SITE C FISHERIES STUDY UPPER HALFWAY RIVER WATERSHED BULL TROUT SPAWNING SURVEY 2008 Note: This report has been redacted for protection of the bull trout (Salvelinus confluentus). Prepared for: B.C. Hydro
Abundance of Steelhead and Coho Salmon in the Lagunitas Creek Drainage, Marin County, California
 scanned for KRIS Abundance of Steelhead and Coho Salmon in the Lagunitas Creek Drainage, Marin County, California Prepared for: Marin Municipal Water District 220 Nellen Drive Corte Madera, California
MINISTRY OF ENVIRONMENT ENVIRONMENTAL STEWARDSHIP DIVISION FISH AND WILDLIFE BRANCH. Horsefly River Angling Management Plan
 MINISTRY OF ENVIRONMENT ENVIRONMENTAL STEWARDSHIP DIVISION FISH AND WILDLIFE BRANCH Horsefly River Angling Management Plan January 30 th, 2006 Area/Fishery Description The Horsefly River watershed provides
Final Bull Trout Redd Monitoring Report for the Wallowa Falls Hydroelectric Project
 Final for the Wallowa Falls Hydroelectric Project East Fork Wallowa River barrier to upstream fish migration, photo courtesy of Kendrick Moholt (FERC No. P-308) December 18, 2017 Prepared by: Jeremiah
Clowhom Project Water Use Plan
 Clowhom Project Water Use Plan Fish Productivity Monitoring Implementation Year 4 Reference: COMMON-2 Fish Productivity Monitoring Year 4 Data Summary 2010 Study Period: September 16 to October 6, 2010
* * * * * * * * * * * *
 Excerpts from Idaho Department of Fish and Game, 2003 Fishery Management Report. Southwest Region Nampa 2003. Brian J. Flatter, Regional Fishery Biologist, Kurtis Plaster, Senior Fishery Technician, Jeff
Ecology and control of invasive Northern Pike in the Columbia River, Canada
 Ecology and control of invasive Northern Pike in the Columbia River, Canada Brian Heise, Daniel Doutaz, Matthias Herborg, Matt Neufeld, David Derosa, Jeremy Baxter 19 th International Conference on Aquatic
Monitoring of Downstream Fish Passage at Cougar Dam in the South Fork McKenzie River, Oregon February 8, By Greg A.
 Monitoring of Downstream Fish Passage at Cougar Dam in the South Fork McKenzie River, Oregon 1998- February 8, 2 By Greg A. Taylor Oregon Dept. of Fish & Wildlife 315 E. Main Street Springfield, OR 97478
Interim Guidance Fish Presence Absence
 Interim Guidance Fish Presence Absence Source: Forest Practices Act Guidance for Division 635 of the forest practices act dealing with stream classification when no fish surveys have been done (referenced
NEVADA DEPARTMENT OF WILDLIFE STATEWIDE FISHERIES MANAGEMENT
 NEVADA DEPARTMENT OF WILDLIFE STATEWIDE FISHERIES MANAGEMENT FEDERAL AID JOB PROGRESS REPORTS F-20-52 2016 Lake Tahoe Rainbow Trout Study WESTERN REGION NEVADA DEPARTMENT OF WILDLIFE, FISHERIES DIVISION
Clowhom Project Water Use Plan. Fish Productivity Monitoring. Reference: COMMON-2. Fish Productivity Monitoring Year 2 Data Summary 2008
 Clowhom Project Water Use Plan Fish Productivity Monitoring Reference: COMMON-2 Fish Productivity Monitoring Year 2 Data Summary 2008 Study Period: August 25 to October 16, 2008 D.J. Bates Resource Management
Alberta Conservation Association 2009/10 Project Summary Report. Project Name: North Saskatchewan and Ram Rivers Bull Trout Spawning Stock Assessment
 Alberta Conservation Association 2009/10 Project Summary Report Project Name: North Saskatchewan and Ram Rivers Bull Trout Spawning Stock Assessment Fisheries Program Manager: Peter Aku Project Leader:
Peace River Water Use Plan. Monitoring Program Terms of Reference. GMSMON-1 Peace River Creel Survey
 Peace River Water Use Plan Monitoring Program Terms of Reference GMSMON-1 Peace River Creel Survey April 10, 2008 Terms of Reference for the Peace River Water Use Plan Monitoring Program: Peace River Creel
Alberta Conservation Association 2017/18 Project Summary Report
 Alberta Conservation Association 2017/18 Project Summary Report Project Name: Abundance, Distribution, Spawning, and Thermal Habitat of Westslope Cutthroat Trout and Bull Trout in the Stimson Creek Watershed
The Blue Heron Slough Conservation Bank
 1 The Blue Heron Slough Conservation Bank CONSERVATION BANKING July 19-23, 2010 CASE STUDY SERIES The Blue Heron Slough Conservation Bank (Washington) I. OVERVIEW & BACKGROUND: Location: Snohomish River
Jason Blackburn, Paul Hvenegaard, Dave Jackson, Tyler Johns, Chad Judd, Scott Seward and Juanna Thompson
 Alberta Conservation Association (ACA) Date: 2014-2015 Project Name: Owl River Walleye and Aquatic Habitat Assessment Fisheries Program Manager: Peter Aku Project Leader: Tyler Johns Primary ACA staff
Alberta Conservation Association 2009/10 Project Summary Report. Project Name: Crowsnest Drainage Sport Fish Population Assessment Phase 1
 Alberta Conservation Association 2009/10 Project Summary Report Project : Crowsnest Drainage Sport Fish Population Assessment Phase 1 Fisheries Program Manager: Peter Aku Project Leader: Jason Blackburn
Rivers and Streams Investigations
 Rivers and Streams Investigations Brian J. Flatter, Regional Fisheries Biologist Lance Hebdon, Regional Fisheries Biologist Jeff Dillon, Regional Fishery Manager ABSTRACT Three sections of the lower Boise
1997 FRY EMERGENCE. NECHAKO FISHERIES CONSERVATION PROGRAM Technical Report No. M96-6
 1997 FRY EMERGENCE NECHAKO FISHERIES CONSERVATION PROGRAM Technical Report No. M96-6 Prepared by: Triton Environmental Consultants Ltd. June 22 Contents List of Figures... i List of Tables... iii List
Final Fish Salvage & Temporary Tailrace Barrier Report for the Wallowa Falls Hydroelectric Project Tailrace. (FERC No. P-308) December 18, 2017
 December 18, 2017") Final for the Wallowa Falls Hydroelectric Project Tailrace (FERC No. P-308) December 18, 2017 Prepared by: Jeremiah Doyle PacifiCorp 825 NE Multnomah Street Portland, OR 97232 December 18, 2017 Page 1
Final for the Wallowa Falls Hydroelectric Project Tailrace (FERC No. P-308) December 18, 2017 Prepared by: Jeremiah Doyle PacifiCorp 825 NE Multnomah Street Portland, OR 97232 December 18, 2017 Page 1
SITE C FISHERIES STUDIES 2011 REVELSTOKE RESERVOIR FISH INVENTORY DATA REPORT
 Project number: 4534 Version: 2 January 13, 2012 SITE C FISHERIES STUDIES 2011 REVELSTOKE RESERVOIR FISH INVENTORY DATA REPORT Prepared for: Bruce Mattock, R.P. Bio. Fisheries and Aquatic Lead Site C Clean
Trip Report: Eagle Creek, Arizona
 Trip Report: Eagle Creek, Arizona 15-17 June 2009 Participants: Abraham Karam, Brian Kesner, and Mike Childs Native Fish Lab Marsh & Associates, LLC 5016 South Ash Avenue Suite 108 Tempe, Arizona 85282
Fish Passage Culvert Assessment for Cahilty Creek Watershed FIA Project #
 Fish Passage Culvert Assessment for Cahilty Creek Watershed FIA Project # 4602004 Prepared for Weyerhaeuser Company Ltd. Jason Ladyman R.P.F. 1550 Mission Flats Road PO Box 40 Kamloops BC V2C 5K3 Prepared
Job 1. Title: Estimate abundance of juvenile trout and salmon.
 STUDY PERFORMANCE REPORT State: Michigan Project No.: F-53-R-13 Study No.: 461 Title: Population dynamics of juvenile rainbow trout and coho salmon in Lake Superior tributaries Period Covered: April 1,
FISH POPULATION AND RIVERINE HABITAT INVENTORY OF THE ELK RIVER, SPARWOOD, BRITISH COLUMBIA
 FISH POPULATION AND RIVERINE HABITAT INVENTORY OF THE ELK RIVER, SPARWOOD, BRITISH COLUMBIA Submitted to: UMA Engineering Ltd. Calgary Alberta Submitted by: Applied Aquatic Research Ltd. Calgary, Alberta
Chinook Salmon Spawning Study Russian River Fall 2005
 Chinook Salmon Spawning Study Russian River Fall 2005 Sonoma County Water Agency 2150 West College Avenue Santa Rosa, California 95401 Prepared by David Cook - Senior Environmental Specialist March 27,
Kispiox River Steelhead: Summary of Current Data and Status Review, James S. Baxter 1
 Kispiox River Steelhead: Summary of Current Data and Status Review, 1997 James S. Baxter 1 British Columbia Ministry of Environment, Lands, and Parks Fisheries Branch Skeena Region Box 5000 Smithers, B.C.
BOGUS CREEK SALMON STUDIES 2002
 BOGUS CREEK SALMON STUDIES 2002 BY: JEANNINE RICHEY California Department of Fish and Game KLAMATH RIVER PROJECT 303 SOUTH STREET YREKA, CALIFORNIA 96097 (530) 842-3109 California Department of Fish and
SITE C CLEAN ENERGY PROJECT FISHERIES STUDIES 2010 DINOSAUR RESERVOIR SAMPLING AND LITERATURE REVIEW
 SITE C CLEAN ENERGY PROJECT FISHERIES STUDIES 00 DINOSAUR RESERVOIR SAPLING AND LITERATURE REVIEW Prepared for: B.C. Hydro, Site C Project, Corporate Affairs Suite 00, Four Bentall Centre 0 Dunsmuir Street
Review of Fish and Fish Habitat Information from the Bearberry Creek Drainage. Alberta Conservation Association Activity Report.
 Review of Fish and Fish Habitat Information from the Bearberry Creek Drainage. Alberta Conservation Kevin Fitzsimmons 1 2005 1 Alberta Conservation Association, Box 1420, Cochrane, Alberta, Canada, T4C
A Reconnaissance Survey Of Tobin Lake
 A Reconnaissance Survey Of Tobin Lake A. R. McLean 1990 PWFWCP Report No. 95 The Peace/Williston Fish & Wildlife Compensation Program is a cooperative venture of BC Hydro and the provincial fish and wildlife
1998 Thompson River Steelhead Angler Survey
 Prepared for: The Ministry of Environment, Lands and Parks Fisheries Branch, Southern Interior Region 1259 Dalhousie Dr. Kamloops, BC V2C 5Z5 Prepared by: Stacy L. Webb (B.NRSc.) and Sean Bennett (R.P.Bio)
Final Fish Salvage & Temporary Tailrace Barrier Report for the Wallowa Falls Hydroelectric Project Tailrace. (FERC No. P-308) December 20, 2018
 December 20, 2018") Final Fish Salvage & Temporary Tailrace Barrier Report for the Wallowa Falls Hydroelectric Project Tailrace (FERC No. P-308) December 20, 2018 Prepared by: Jeremiah Doyle PacifiCorp 825 NE Multnomah Street
Final Fish Salvage & Temporary Tailrace Barrier Report for the Wallowa Falls Hydroelectric Project Tailrace (FERC No. P-308) December 20, 2018 Prepared by: Jeremiah Doyle PacifiCorp 825 NE Multnomah Street
Steelhead Society of BC. Thompson River Watershed Restoration and Enhancement Project #4 Nicola River Bank Stabilization and Enhancement Project
 Steelhead Society of BC Presents: Thompson River Watershed Restoration and Enhancement Project #4 Nicola River Bank Stabilization and Enhancement Project Application for Funding December 2013 1.0 BACKGROUND
Minnesota Department of Natural Resources Fisheries Division, Lake Superior Area
 Minnesota F-9-R(P)- Study 4 Job 616 Minnesota Department of Natural Resources Fisheries Division, Lake Superior Area Coaster Brook Trout Status in Minnesota-Lake Superior Tributaries Following Regulation
Study 9.5 Fish Distribution and Abundance in the Upper Susitna River
 Initial Study Report Meeting Study 9.5 Fish Distribution and Abundance in the Upper Susitna River October 15, 2014 Prepared by R2 Resource Consultants, Inc. 10/15/2014 1 Study 9.5 Objectives 1. Describe
CUSHMAN RESERVOIRS. Skokomish Watershed Monitoring Conference - Public Meeting Florian Leischner 9/17/2015
 CUSHMAN RESERVOIRS Skokomish Watershed Monitoring Conference - Public Meeting Florian Leischner 9/17/2015 CUSHMAN RESERVOIRS MONITORING Management and monitoring of Tacoma Power reservoirs Lake Cushman
Project Name: Distribution of Sport Fish in the Waterton River Tailwater, 2014
 Alberta Conservation Association (ACA) Date: 2014-2015 Project Name: Distribution of Sport Fish in the Waterton River Tailwater, 2014 Fisheries Program Manager: Peter Aku Project Leader: Jason Blackburn
MINNESOTA DEPARTMENT OF NATURAL RESOURCES DIVISION OF FISHERIES AND WILDLIFE. Gamefish Assessment Report
 Minnesota DNR F-29-R(P) Area F312 February 1, 2013 MINNESOTA DEPARTMENT OF NATURAL RESOURCES DIVISION OF FISHERIES AND WILDLIFE Gamefish Assessment Report Spring Gamefish Assessment on the Mississippi
index area in Pine Creek mainstem to establish redd-life
 Pine Creek Bull Trout - 2011 1. Swift Reservoir adult migration estimate 2. Half-duplex Passive Integrated Transponder (PIT) tag antenna arrays in Pine and Rush Creeks 3. Yale tailrace collection and transport
Rehabilitation of Grimes Creek, a Stream Impacted in the Past by Bucket-lined Dredge Gold Mining, Boise River Drainage, July 2008 to August 2011.
 Rehabilitation of Grimes Creek, a Stream Impacted in the Past by Bucket-lined Dredge Gold Mining, Boise River Drainage, July 2008 to August 2011. Pam Harrington TU,1020 W. Main Street Suite 440, Boise,
Steelhead Spawning Ground Surveys on the Entiat River, 2015.
 Steelhead Spawning Ground Surveys on the Entiat River, 2015. Kenneth Poczekaj and R.D. Nelle U.S. Fish and Wildlife Service Mid-Columbia River Fishery Resource Office Leavenworth, WA 98826 On the cover:
Parasitic Copepods (Salmincola sp.) and Fish Species Composition in Upper Willamette Reservoirs
 and Fish Species Composition in Upper Willamette Reservoirs") Parasitic Copepods (Salmincola sp.) and Fish Species Composition in Upper Willamette Reservoirs Jeremy D. Romer* Ryan Emig* Fred R. Monzyk Oregon Department of Fish and Wildlife Corvallis Research Lab
Parasitic Copepods (Salmincola sp.) and Fish Species Composition in Upper Willamette Reservoirs Jeremy D. Romer* Ryan Emig* Fred R. Monzyk Oregon Department of Fish and Wildlife Corvallis Research Lab
STREAM SURVEY File form No..
 scanned for KRIS THE RESOURCES AGENCY OF CALIFORNIA California Department of Fish and Game STREAM SURVEY File form No.. Date: September 4, 1969. NAME: North Fork Schooner Gulch Creek COUNTY: Mendocino.
DRYWOOD AND YARROW CREEKS - FISHERIES ASSESSMENTS, 2010 Trout Unlimited Canada Technical Report No. AB-023
 DRYWOOD AND YARROW CREEKS - FISHERIES ASSESSMENTS, 2010 Trout Unlimited Canada Technical Report No. AB-023 Prepared by: Lesley Peterson and Brian Meagher Trout Unlimited Canada February 2011 Acknowledgements
Surveys for Bull Trout Presence in the Waptus River Basin, 2003
 Surveys for Bull Trout Presence in the Waptus River Basin, 2003 U.S. Fish and Wildlife Service Mid-Columbia River Fishery Resource Office 7501 Icicle Road Leavenworth, WA 98826 August 2004 Abstract The
SITE C CLEAN ENERGY PROJECT FISH AND FISH HABITAT TECHNICAL DATA REPORT
 SITE C CLEAN ENERGY PROJECT FISH AND FISH HABITAT TECHNICAL DATA REPORT Prepared for BC Hydro Power and Authority 333 Dunsmuir Street Vancouver, BC V6B 5R3 By Mainstream Aquatics Ltd. 6956 Roper Road Edmonton,
Fraser River. FISH SURVEY AND MANAGEMENT INFORMATION Jon Ewert - Aquatic Biologist (Hot Sulphur Springs)
") Fraser River FISH SURVEY AND MANAGEMENT INFORMATION Jon Ewert - Aquatic Biologist (Hot Sulphur Springs) General Information: The Fraser River is a highly diverse river offering many transitions in habitat
Fraser River FISH SURVEY AND MANAGEMENT INFORMATION Jon Ewert - Aquatic Biologist (Hot Sulphur Springs) General Information: The Fraser River is a highly diverse river offering many transitions in habitat
FINAL Fish Salvage Plan for the Wallowa Falls Hydroelectric Project Tailrace. (FERC No. P-308) April 19, 2017
 April 19, 2017") FINAL for the Wallowa Falls Hydroelectric Project Tailrace (FERC No. P-308) April 19, 2017 Prepared by: Jeremiah Doyle PacifiCorp 825 NE Multnomah Street Portland, OR 97232 April 19, 2017 Page 1 of 10
FINAL for the Wallowa Falls Hydroelectric Project Tailrace (FERC No. P-308) April 19, 2017 Prepared by: Jeremiah Doyle PacifiCorp 825 NE Multnomah Street Portland, OR 97232 April 19, 2017 Page 1 of 10
Columbia Lake Dam Removal Project
 Columbia Lake Dam Removal Project The Columbia Lake dam located 1/4 mile upstream of the Paulins Kill River's confluence with the Delaware River in Knowlton Township, Warren County has been proposed for
Don Pedro Project Relicensing
 Don Pedro Project Relicensing M ODESTO I RRIGATION D ISTRICT TURLOCK I RRIGATION D ISTRICT FERC PROJECT N O. 2299 Resident Fish in Don Pedro Reservoir Don Pedro Reservoir Fish Stocking (1971-Present) CDFG
Lower Dolores River Corridor Planning Meeting Jim White Colorado Division of Wildlife
 Lower Dolores River Corridor Planning Meeting Jim White Colorado Division of Wildlife Objectives Overview of cold and warm water fishes in the Dolores River including: Flow and Fish Management Distribution
STEELHEAD SURVEYS IN OMAK CREEK
 STEELHEAD SURVEYS IN OMAK CREEK 2002 Annual Report Prepared by Chris Fisher John Arterburn Colville Confederated Tribes Fish and Wildlife Department P.O. Box 150 Nespelem, WA 99155 Prepared for Project
Site 4 PEESHOO. Approx. Head = 10 m Design Flow = 70 m 3 /s Capacity = 6 MW. Peeshoo. Kabinakagami River. Rogers Road HWY 11.
 Kabinakagami River Site 4 PEESHOO Rogers Road Peeshoo Approx. Head = 10 m Design Flow = 70 m 3 /s Capacity = 6 MW N 0 2 4 6 HWY 11 Kilometers Site 4 - PEESHOO Looking Downstream Looking Downstream Site
Fisheries Enhancement Options for Dinosaur Lake, A Review
 Fisheries Enhancement Options for Dinosaur Lake, A Review R. Pattenden and G. Ash April 1993 PWFWCP Report No. 72 The Peace/Williston Fish & Wildlife Compensation Program is a cooperative venture of BC
Elementa: Science of the Anthropocene
 Elementa: Science of the Anthropocene http://dx.doi.org/10.12952/journal.elementa.000042.s003 Figure S3. Supporting information for the article Recovery of a mining-damaged stream ecosystem by Mebane,
Red Salmon Lake Data Report 2011
 Red Salmon Lake Data Report 2011 Prepared by: Nathan Weber, Biologist February 2012 The Red Salmon Lake Project was made possible through an Alaskan Sustainable Salmon Fund grant received from the Alaska
2011 Haha Lake Northern Pike Control
 2011 Haha Lake Northern Pike Control Prepared By: Christin Davis Ministry of Forests, Lands, and Natural Resource Operations #401-333 Victoria Street Nelson, BC V1L 4K3 Summary In 2005, northern pike (Esox
River Guardian Compliance Monitoring and Angler Survey on the Elk River Winter 2006 Quality Waters Strategy (River Guardian Program)
") River Guardian Compliance Monitoring and Angler Survey on the Elk River Winter 2006 Quality Waters Strategy (River Guardian Program) K. D. Heidt and B. Stalker British Columbia Ministry of Environment,
River Guardian Compliance Monitoring and Angler Survey on the Elk River Winter 2006 Quality Waters Strategy (River Guardian Program) K. D. Heidt and B. Stalker British Columbia Ministry of Environment,
August 11 Snorkel SCC side channel network (SBA, SCC3) feet 707
 feet 707") Date Survey Type Habitat July 29 Snorkel (reconnaissance) Table 1. Fish use survey schedule 2004 Water temperature 1 (ºC) Estimated Mean visibility 2 discharge 3 (cfs) Mainstem (units #1 42) ND ND 814
Date Survey Type Habitat July 29 Snorkel (reconnaissance) Table 1. Fish use survey schedule 2004 Water temperature 1 (ºC) Estimated Mean visibility 2 discharge 3 (cfs) Mainstem (units #1 42) ND ND 814
Big Spring Creek Habitat Enhancement and Fishery Management Plans
 Big Spring Creek Habitat Enhancement and Fishery Management Plans November 5, 2012 Big Spring Events and Activities Center Newville, PA Charlie McGarrell Regional Habitat Biologist Pennsylvania Fish and
3. The qualification raised by the ISRP is addressed in #2 above and in the work area submittal and review by the ISRP as addressed in #1.
 Please find attached a response from The Confederated Tribes of the Warm Springs Reservation of Oregon (CTWSRO) for Project # 2008-301-00, Habitat Restoration Planning, Design and Implementation within
Amendment to a Biological Assessment/Evaluation completed for the Coon Creek Land Disposal completed December Grand Valley Ranger District
 Amendment to a Biological Assessment/Evaluation completed for the Coon Creek Land Disposal completed December 2007 Grand Valley Ranger District Grand Mesa, Uncompahgre, Gunnison National Forests Prepared
Review of Site C Environmental Impact Statement (EIS) - Fish and Fish Habitat
 - Fish and Fish Habitat") 470 Granville Street, Suite 630, Vancouver, BC V6B 1N3 t 604-629-9075 Memorandum Date: December 18, 2013 To: Jesse McCormick Donovan & Company Project: Site C Project From: Palmer Environmental Consulting
470 Granville Street, Suite 630, Vancouver, BC V6B 1N3 t 604-629-9075 Memorandum Date: December 18, 2013 To: Jesse McCormick Donovan & Company Project: Site C Project From: Palmer Environmental Consulting
Project Name: Distribution and Abundance of the Migratory Bull Trout Population in the Castle River Drainage (Year 4 of 4)
") Alberta Conservation Association (ACA) Date: 2014-2015 Project Name: Distribution and Abundance of the Migratory Bull Trout Population in the Castle River Drainage (Year 4 of 4) Fisheries Program Manager:
Alberta Conservation Association (ACA) Date: 2014-2015 Project Name: Distribution and Abundance of the Migratory Bull Trout Population in the Castle River Drainage (Year 4 of 4) Fisheries Program Manager:
Summer Steelhead Surveys North Fork Trinity River Trinity County, California
 KRIS edition Summer Steelhead Surveys North Fork Trinity River Trinity County, California 1978-1997 By Loren Everest Fishery Biologist Weaverville Ranger District Shasta-Trinity National Forests October
Stony Creek Creel Census
 Stony Creek Creel Census conducted for Division of Fisheries Illinois Department of Conservation 600 North Grand Ave. West Springfield, IL 62706 by R. Weldon Larimore, Principal Investigator Jack A. Swanson,
Trout Unlimited Comments on the Scope of Environmental Impact Statement for the Constitution Pipeline Project, Docket No. PF12-9
 October 9, 2012 Kimberly D. Bose, Secretary Federal Energy Regulatory Commission 888 First Street, NE, Room 1A Washington, DC 20426 RE: Trout Unlimited Comments on the Scope of Environmental Impact Statement
Prepared for: The Ministry of Water, Land and Air Protection Fish and Wildlife Science and Allocation Kamloops, BC. Prepared by: Andy Morris
 Summary of the 2002 Bonaparte River fishway operation and enumeration of anadromous and non-anadromous Oncorhynchus mykiss. Prepared for: The Ministry of Water, Land and Air Protection Fish and Wildlife
STREAM CLASSIFICATION AND MAPPING. Prepared For. MacMillan Bloedel Ltd. Menzies Bay Division BOX 6000, Campbell River V9W 5E1.
 STREAM CLASSIFICATION AND MAPPING OF STREAMS IN MENZIES AND OYSTER BAY Prepared For MacMillan Bloedel Ltd. Menzies Bay Division BOX 6000, Campbell River V9W 5E1 September 1998 a a North Island Biological
Little Kern Golden Trout Status:
 Little Kern Golden Trout Status: The Little Kern Golden trout (LKGT) was proposed for federal listing as Threatened under the Endangered Species Act (ESA) on September 1, 1977 by the U. S. Fish and Wildlife
Warner Lakes Redband Trout
 Warner Lakes Redband Trout Existing Populations Warner Valley is an endorheic basin that contains a complex series of interconnected lakes, marshes, sloughs, and potholes, all of which are remnants of
2013 Electrofishing Program Summary. Miramichi Salmon Association In collaboration with the Department of Fisheries and Oceans
 2013 Electrofishing Program Summary Miramichi Salmon Association In collaboration with the Department of Fisheries and Oceans Prepared by: Alex Parker Biologist Miramichi Salmon Association 485, Route
NEVADA DEPARTMENT OF WILDLIFE STATEWIDE FISHERIES MANAGEMENT
 NEVADA DEPARTMENT OF WILDLIFE STATEWIDE FISHERIES MANAGEMENT FEDERAL AID JOB PROGRESS REPORTS F-20-48 2012 LAKE TAHOE WESTERN REGION Contents NEVADA DEPARTMENT OF WILDLIFE, FISHERIES DIVISION ANNUAL PROGRESS
1998 Willow Creek Downstream Migrant Trap Report. Draft. Prepared By: C. A. Walker. Lower Trinity Ranger District. Six Rivers National Forest
 1998 Willow Creek Downstream Migrant Trap Report Draft Prepared By: C. A. Walker Lower Trinity Ranger District Six Rivers National Forest September 1998 Executive Summary The downstream migrant trap was
Discussion on the Selection of the Recommended Fish Passage Design Discharge
 Discussion on the Selection of the Recommended Fish Passage Design Discharge Introduction The provision of fish passage is a requirement for most proposed culvert and bridge installations in Alberta, depending
THE OREGON PLAN for. Salmon and Watersheds. Smith River Steelhead and Coho Monitoring Verification Study, Report Number: OPSW-ODFW
 THE OREGON PLAN for Salmon and Watersheds Smith River Steelhead and Coho Monitoring Verification Study, 2007 Report Number: OPSW-ODFW-2009-11 The Oregon Department of Fish and Wildlife prohibits discrimination
NEVADA DEPARTMENT OF WILDLIFE STATEWIDE FISHERIES MANAGEMENT
 NEVADA DEPARTMENT OF WILDLIFE STATEWIDE FISHERIES MANAGEMENT FEDERAL AID JOB PROGRESS REPORTS F-20-52 2016 REDBAND TROUT EASTERN REGION NEVADA DEPARTMENT OF WILDLIFE, FISHERIES DIVISION ANNUAL JOB PROGRESS
Fish population survey report
 Fish population survey report Upper River Avon Catchment This report provides a summary of results from recent fish population surveys on the Tetbury Avon, Sherston Avon and River Marden The surveys were
5B. Management of invasive species in the Cosumnes and Mokelumne River Basins
 5B. Management of invasive species in the Cosumnes and Mokelumne River Basins Cosumnes River The Cosumnes River basin has a number of distinct habitat types that require different management strategies
WFC 10 Wildlife Ecology & Conservation Nov. 29, Restoration Ecology: Rivers & Streams. Lisa Thompson. UC Cooperative Extension
 Restoration Ecology: Rivers and Streams WFC 10 29 Nov 2010 Restoration of ecosystems often involves creating new systems with only partial resemblance to the original ecosystems Lisa Thompson Fisheries
Application of a New Method for Monitoring Lake Trout Abundance in Yukon: Summer Profundal Index Netting (SPIN)
") Application of a New Method for Monitoring Lake Trout Abundance in Yukon: Summer Profundal Index Netting (SPIN) Prepared by: Lars Jessup Nathan Millar November 2011 Application of a New Method for Monitoring
Application of a New Method for Monitoring Lake Trout Abundance in Yukon: Summer Profundal Index Netting (SPIN) Prepared by: Lars Jessup Nathan Millar November 2011 Application of a New Method for Monitoring
Peace Project Water Use Plan
 Peace Project Water Use Plan Fish Index Implementation Year 4 Reference: GMSMON #2 Peace River Fish Index Project 211 Studies Study Period: August 24, 211 September 24, 211 Rick Pattenden, Senior Biologist
Juvenile Steelhead and Stream Habitat Conditions Steelhead and Coho Salmon Life History Prepared by: DW ALLEY & Associates, Fishery Consultant
 Juvenile Steelhead and Stream Habitat Conditions Steelhead and Coho Salmon Life History Prepared by: DW ALLEY & Associates, Fishery Consultant I-1. Steelhead and Coho Salmon Ecology Migration. Adult steelhead
Striped Bass and White Hybrid (x) Striped Bass Management and Fishing in Pennsylvania
 Striped Bass Management and Fishing in Pennsylvania") Striped Bass and White Hybrid (x) Striped Bass Management and Fishing in Pennsylvania Prepared by R. Lorantas, D. Kristine and C. Hobbs PFBC Warmwater Unit 2005 (stocking numbers updated after 2005) Goal:
Striped Bass and White Hybrid (x) Striped Bass Management and Fishing in Pennsylvania Prepared by R. Lorantas, D. Kristine and C. Hobbs PFBC Warmwater Unit 2005 (stocking numbers updated after 2005) Goal:
Deschutes Bull Trout
 Deschutes Bull Trout Existing Populations The Deschutes Bull Trout SMU is comprised of eight populations, three of which are classified as extinct (Table 1). Populations are identified according to those
Distribution. PFBC Northcentral Region Law Enforcement Office, Attention: WCO Kraynak, 1150 Spring Creek Road, Bellefonte, PA 16823
 Distribution Pennsylvania Department of Environmental Protection, Northcentral Region Office, Attention: Steve Means, 208 West Third St. Suite 101, Williamsport, PA 17701 PFBC Northcentral Region Law Enforcement
NEVADA DEPARTMENT OF WILDLIFE STATEWIDE FISHERIES MANAGEMENT
 NEVADA DEPARTMENT OF WILDLIFE STATEWIDE FISHERIES MANAGEMENT FEDERAL AID JOB PROGRESS REPORT F-20-50 2014 LAHONTAN CUTTHROAT TROUT STUDY WESTERN REGION NEVADA DEPARTMENT OF WILDLIFE, FISHERIES DIVISION
Coquitlam Water Use Plan
 Coquitlam Water Use Plan Assessment of Fisheries Access to Streams Tributary To Coquitlam Reservoir COQMON#1 Study Period: September 1, 2006 May 31, 2007 Report Date: January 2008 Scott Ducharme Aquatec
Newaukum Watershed Culvert Assessment
 Newaukum Watershed Culvert Assessment Water Resource Inventory Area 23 Lewis County Conservation District Final Report By: Kelly Verd and Nikki Wilson July 2002 Funded by: Chehalis Fisheries Restoration