Fishery Statistics 2006
|
|
|
- Ambrose Bruce
- 5 years ago
- Views:
Transcription
1 D404 Statistisk sentralbyrå Statistics Norway Oslo Kongsvinger
2 This series consists mainly of primary statistics, statistics from statistical accounting systems and results of special censuses and surveys, for reference and documentation purposes. Presentation is basically in the form of tables, figures and necessary information about data, collection and processing methods, and concepts and definitions. In addition, a short overview of the main results is given. The series also includes Statistical Yearbook of Norway. Statistics Norway, november 2008 Symbols in tables Symbol When using material from this publication, Category not applicable. Statistics Norway shall be quoted as the source. Data not available.. Data not yet available... ISBN Printed version Not for publication : ISBN Electronic version Nil - ISSN Printed version Less than 0.5 of unit employed 0 ISSN X Electronic version Less than 0.05 of unit employed 0.0 Provisional or preliminary figure * Topic: Break in the homogeneity of a vertical series Break in the homogeneity of a horzontal series Print: Statistics Norway Decimal punctuation mark.
3 Preface This publication presents a statistical survey of the fishing industry and comprises a sample of accessible statistics. From the sea fisheries the publication presents statistics of fishermen, fishing vessels, catches and economic results. This edition also contains landings in Norway from foreign vessels. It also includes statistics of fish processing industry, external trade of fish and an overview of the state of some important fish stocks. The Directorate of Fisheries issued the publication until The 1977 issue was the first one published by Statistics Norway. The Directorate of Fisheries still produces a considerable part of the database for the tables presented in the publication, as well as contributing to the text of chapter 1, 2, 4 and 6. No changes has been made in the 2006-edition compared to the 2005-edition. The 2005-edition was thoroughly examined and some considerable changes and simplifications were made. In return, more details are now published on the Internet. A Norwegian edition for 2006 was published in May Preliminary figures for fisheries 2007 were presented on Statistics Norway's web pages February The entire publication is presented on the web in PDF format, but the tables can be downloaded in Excel format. The Internet-address is: For more information the Directorate of Fisheries has web pages on the Internet. The Internet-address is: The publication has been prepared under the supervision of Senior Executive Officer Rune Skolbekken. Responsible for this publication is Head of Division Ole O. Moss, Division for Primary Industry Statistics. Statistics Norway, 30 October 2008 Oslo/Kongsvinger, Øystein Olsen Nils Håvard Lund Statistics Norway 3
4 Contents Preface... 3 Contents... 4 List of figures... 5 List of tables Background and purpose Purpose and history Users and applications Fishermen and fishing vessels Main results Statistics production Concepts, variables and classifications Sources of error and uncertainty Comparability and coherence Stocks Main results Statistics production Concepts, variables and classifications Sources of error and uncertainty Comparability and coherence The catch Main results Statistics production Concepts, variables and classifications Sources of error and uncertainty Comparability and coherence Processing and foreign trade Main results Statistics production Concepts, variables and classifications Sources of error and uncertainty Comparability and coherence Profitability Main results Statistics production Concepts, variables and classifications Sources of error and uncertainty Comparability and coherence Appendices A. Main groups of fish species B. A selection of conversion factors C. ICES Fishery statistical divisions D. Fishing grounds. Northwest Atlantic E. Fishing grounds. Northeast Atlantic F. Fishing grounds G. Commodity groups in the tables of exports and imports H. The name of some marine animal species translated into different languages I. Card over some marine animals. cm Statistics Norway
5 List of figures 1. Fishermen, by fishing as source of livelihood and county Total and spawning stock biomass. Northeast Arctic cod tonnes Total and spawning stock biomass. Northeast Arctic haddock tonnes Total and spawning stock biomass. Northeast Arctic saithe tonnes Spawning stock biomass. Norwegian spring-spawning herring tonnes Stock biomass of Barents Sea capelin (fish aged one year and over) tonnes Spawning stock biomass. Blue whiting tonnes Quotas and catches. Northeast Arctic cod tonnes Quantity, by main group of target species tonnes Quantity of catch, by main group of target species and landing county Tonnes Catch quantity and value, by disposition of the catch. Per cent Establishments and employees in fish processing industry Export of fish and fish products Export of fish and fish products, by country of destination Per cent Value added of fishery, and as percentage of gross national product (GNP) Average operating revenues and -expenses, and operating margin of whole-year operated fishing vessels 8 metres and above Statistics Norway 5
6 List of tables 1. Fishermen, by fishing as source of livelihood Fishermen, by fishing as source of livelihood and county Registered fishing vessels, by county Registered fishing vessels, by length of vessel and county Fishing vessels, by building year and county Number of licenses and participating vessels, by county Quantity and value of catch, by main group of target species Total catch, by disposition of the catch Average price for first hand sales of fish Catch, by fishing gear and target species Tonnes live weight Quantity and value of catch, by disposition and target species Quantity and value of catch, by main group of target species and fishing ground Quantity and value of catch, by main group of target species and landing county Quantity and value of catch, by sales co-operative Sealing Coastal whaling World catch of fish, by disposition. Fish farming is included Million tonnes live weight Total world catch by countries with the largest catches. Quantity Mill. tonnes Quantity and value of catch landed in Norway by foreign vessels, by main group of target species Quantity and value of catch landed in Norway by foreign vessels, by main group of target species and nationality of the vessel Establishments and employed persons in fish processing industry, by industrial subclass Establishments, employed persons, value added etc. in fish processing industry, by industrial subclass and county a. Export of fish and fish products, by country of destination and commodity group NOK million b. Export of fish and fish products, by country of destination and commodity group NOK million a. Export of fish and fish products, by country of destination and commodity group tonnes b. Export of fish and fish products, by country of destination and commodity group tonnes Import of fish and fish products from various countries. Quantity and value National account figures for fisheries *. NOK million Average operating results of whole-year operated fishing vessels 8 metres and above, by length of vessel, county and type of fishery NOK Statistics Norway
7 1. Background and purpose 1.1. Purpose and history The Fishery statistics presents an overview of fishermen, fishing vessels, fish stocks, catches, employment and the economy. The fishery statistics were first displayed in a publication of its own in The Directorate of Fisheries took over the preparation of the publication in As from 1977, Statistics Norway has been the responsible publisher in co-operation with the Directorate of Fisheries. Up to the 2004-edition, the directorate still produced a considerable part of the tables. As of 2005, Statistics Norway receives the catch data on a detailed level and produces the tables itself. This gives Statistics Norway more alternatives in what to publish, and it also makes it easier to answer various requests from the public. The paper edition includes fewer tables compared with earlier editions, on the other hand one can now find figures on a more detailed level on the Internet. Fishermen and fishing vessels Chapter 2 presents an overview of fishermen and fishing vessels engaged in professional fishery, sealing and whaling. The statistics are based upon administrative data sources founded by legislation and regulations. Fishermen Participation in income-producing fishery, sealing and whaling is regulated by the law of January 2000 (law of participation). The law is used to adapt the catching capacity to the variable resources, by regulation of participation. Further details are given in chapter 4.2. The Directorate of Fisheries collected yearly, before 1982, information about the number of fishermen from the municipal fishery committees. This information was mainly based upon the municipal register of fishermen. The registration rules were changed in As from 1 January 1981 the responsibility for the Register of Fishermen was transferred from the National Insurance Institution to the Directorate of Fisheries. The local fishery committees deal with the content in application forms. The approved application forms are sent to the Directorate of Fisheries for registration on electronic data processing. Vessels The law of December 1917 states that all vessels engaged in fishery must be registered in the Register of Norwegian Fishing Vessels. The law of March also states that a vessel can not be used in income-producing fishing or catching without a permit from the authorities. All licences, except for sealing and whaling, are assigned to one particular person or company and for one particular vessel. In other words, a licence does not automatically follow the vessel with change of ownership. Licences for sealing and whaling are assigned only to persons and not vessels. All licences are rights given by the Ministry of Fisheries and Coastal Affairs on application. A new set of rules came into force in 2006 with the law of October The law regulates fishing with trawl, shrimp trawl, purse seine and purse seine and saithe. This regulation replaces several other regulations. The Directorate of Fisheries publishes the Register of Norwegian Fishing Vessels each year on the Internet: The Directorate of Fisheries also publishes a booklet cover called Norwegian fishing vessels, fishermen and licences. This can be found on the Internet: Statistics Norway 7
8 In some fisheries participation is conditioned by licence from the authorities. The Directorate of Fisheries records such licences. Statistics Norway carried out fishery censuses in 1948, 1960 and The figures from these censuses represent the most reliable information about fishermen and fishing vessels for the census years. No new fishery census is planned. Stocks Catches Chapter 3 presents an overview of the development in some of the fish stocks in the Norwegian maritime zone. The figures are prepared by the Institute of Marine Research (IMR), which publishes the report Havets ressurser og miljø each year. The IMR has published this report since the early seventies. The legal acts relating to seawater fisheries, and to the marketing of raw fish, are the basis for collecting landing- and contract notes, which the catch statistic is based on. The catch statistics of chapter 4 cover all catches of marine fish delivered in Norway or abroad by Norwegian fishermen. Catches of marine fish delivered by Norwegian vessels which have bought quotas from other countries are included. Catches for the purpose of research are also included. Figures from foreign vessels delivering catches in Norway can be found in separate tables. The statistical committee of UN decided in 1954 that the responsibility for the collection of information from landings and the production of the corresponding catch statistics should be linked to the flag state of the vessel. According to a law of 17. June 1966 there was a general prohibition on vessels from foreigner countries to bring their catches to Norwegian harbours. Exemptions were, upon application, given by the Ministry of Fishery. In 1993 the law was amended, and foreign vessels were allowed to deliver their catches to Norwegian harbours. Chapter 4 also comprises sealing, whaling and the fisheries in other countries. Norway established an economic zone of 200 nautical miles from 1. January 1977, and a fishery protection zone of 200 nautical miles around Svalbard from 15. June From 23. May 1980 Norway established an economic zone around Jan Mayen. There is a general prohibition on foreign fishermen to fish in the Norwegian economic zones. Norway and Russia has since 1978 each year negotiated an agreement that regulates the fisheries in the Barents Sea between the two states (Gråsoneavtalen). Norway has entered the following fishery agreements with other countries: Long-term agreements on reciprocal fishing rights with EU, Russia, Greenland and the Faroe Islands. Phasing-out agreements providing for transitional fishing rights to Poland. For the Skagerrak and the northern part of the Kattegat there is a special tripartite agreement between Denmark, Sweden and Norway. EU, Russia, Iceland, the Faroe Islands and Norway are allowed to fish Norwegian spring-spawning herring in Norwegian waters. Greenland, Iceland and Norway can fish capelin in each other s zones. Norway is a member of NEAFC (The North East Atlantic Fisheries Commission) and NAFO (Northwest Atlantic Fisheries Organization), which administer the fisheries in the North East- and North West Atlantic. Each year The Advisory Committee on Fishery Management (ACFM) gives recommendations for total allowable catch (TAC) of the different fish species, which are the basis for Norway s agreements with other countries. 8 Statistics Norway
9 Processing and external trade Chapter 5 comprises establishments, employment and some economic relations in the fish processing industry. It also comprises export and import of fish and fish products. Please note that the tables comprise all processing and trade of fish and fish products, irrespective whether the fish originates from fisheries or fish farming. The figures of establishments, employment and the fish processing industry are prepared by Statistics Norway, Division for Energy and Industry Production Statistics. The manufacturing statistics offer a detailed overview on employment and value added by industry and region. The manufacturing statistics were published for the first time in 1876 for the reference years The figures of export and import are prepared by Statistics Norway, Division for External Trade. The purpose of the external trade statistics is to give information about the commodity flows between Norway and other countries. The monthly statistics on external trade in goods have been published since Profitability Chapter 6 deals with national accounts figures of the fishing industry and operating profit of the fishing fleet. The national accounts figures are prepared by Statistics Norway, Division for National Accounts. The statistics are designed to provide a consistent and comprehensive survey of the overall national economy. The first national accounts for Norway based on modern principles were published by Statistics Norway in In the 1950s, national accounts figures were compiled back to The figures of operating profit for whole year operating vessels come from the Directorate of Fisheries Profitability Survey of the Fishing Fleet. The survey is based on the accounts of a sample of owners of such vessels. Statistics Norway has carried out the sample and method of estimation. As of 2004, the survey has been done entirely by the Directorate of Fisheries, and is a continuance of the survey published by the Budget Commission of Fishery since Users and applications The purpose of collecting data from catches is to gather information necessary to secure a viable administration of the marine resources. This is done by controlling resources and quotas, and by having fishery statistics of good quality. The data forms the basis for research work in connection with regulations, strategic analysis, analysis of structure of the fishing fleet, and also the consequences of administrative actions on the industrial economy. The data also forms the basis of fulfilling Norway s obligation to report to international organisations. Estimates on the stocks and catch statistics are used to make agreements between countries when deciding on quotas and catch regulations, while scientists use statistics in their assessments of the stocks. Figures from the fishery statistics are feeded into the national accounts, which are an essential information source for the analysis of the economic development and economic structure in Norway. The Directorate of Fisheries has in connection with the Profitability Survey, set up a reference group. The reference group shall ensure that the users need for relevant information of high quality is available. The reference group has consultative authority when it comes to presentations, contents and the use of methodology in the survey. Statistics Norway 9
10 The fishery statistics is otherwise used by public authorities and the general public, research institutions, students, media, financial analysts, interest groups and national and international organisations. 10 Statistics Norway
11 2. Fishermen and fishing vessels 2.1. Main results Constantly fewer fishermen are participating in the fisheries, a trend that has been lasting for a while. Since 2000 it is those with fishing as a secondary occupation which has declined relatively the most. In 2006, persons were registered in the Register of Norwegian Fishermen. In 1990 there were more than twice as many fishermen. Compared with 2005, 4.7 per cent fewer fishermen were registered in Close to 80 per cent were registered with fishing as main occupation, and Nordland and Møre og Romsdal counties had most fishermen. The number of fishing vessels is also declining. The large reduction in the last years has several causes. The Directorate of Fisheries has carried out an extensive quality control of the Register of Norwegian Fishing Vessels. In 2004 a yearly fee for all vessels in the register was induced. In 2003 a condemnation system for smaller vessels with licence to fish on the coast were introduced. A structural rearrangement among larger vessels fishing on the coast and in the deep-sea fleet is another cause. In 2006, a total of vessels were listed in the Register of Norwegian Fishing Vessels. This was 5.4 per cent less than the previous year. 65 new vessels were built in More than half of the vessels, in total, were smaller than 10 meter. Nordland County had most vessels, in total, while Møre og Romsdal was the county with most vessels above 28 meter. There were 625 licences in total, distributed to 344 vessels in the Register of Norwegian Fishing Vessels. Møre og Romsdal had most licences. Population 2.2. Statistics production The statistics comprises all fishermen registered in the Register of Norwegian Fishermen. The register ensures that every fisherman engaged in sea fisheries, whaling and sealing in Norway are registered. Fishermen are divided into those with fishery as main occupation (section B) and those where fishery is secondary occupation (section A). The statistics comprise all vessels registered in the Register of Norwegian Fishing Vessels. Data sources Sources are the Register of Norwegian Fishermen, Register of Norwegian Fishing Vessels and the Register of Norwegian Fishing Licences. The Directorate of Fisheries is responsible for all the registers. The Directorate of Fisheries regional offices deal with the content in application forms. The approved application forms are sent to the Directorate of Fisheries for registration on electronic data processing. The Directorate of Fisheries registers all vessels that are used in commercial fishing in the Registers of Norwegian Fishing Vessels. The vessel owner is obliged to report the vessel to the register and report removal by sale, condemnation and withdrawing from fishing activities. Collection of data The registers are continuously updated, and Statistics Norway receives data as per 31. December each year from the Directorate of Fisheries. The Register of Norwegian Fishermen and Register of Norwegian Fishing Vessels are also available on the Directorate of Fisheries website. Statistics Norway 11
12 Control and revision Definitions Control and revision of the data are carried out by the Directorate of Fisheries. As from 1. March 2003, the local representatives of the Directorate of Fisheries have taken over the responsibility of maintaining the information in the Register of Norwegian Fishing Vessels and the Register of Norwegian Fishing Licences Concepts, variables and classifications Fishermen comprise all fishermen engaged in sea fisheries, whaling and sealing. Even crews on fishing vessels not directly taking part in fishing are included. Main occupation. Persons listed in section B must have, among others, minimum 20 weeks of work in the fisheries or have an income from fisheries of at least the national insurance s basic amount. Secondary occupation. Persons listed in section A must, among others, work in the fisheries and have a minimum income of half the national insurance s basic amount. Vessels are classified by their largest length. Measurement and processing errors 2.4. Sources of error and uncertainty Information from the Register of Norwegian Fishermen and the Register of Norwegian Fishing Vessels are counted 31. December each year. Information about vessels with licences is taken by combining the Register of Norwegian Fishing Vessels and the Register of Norwegian Fishing Licences. Delegating the operations of the Register of Norwegian Fishing Vessels and the Register of Norwegian Fishing Licences to local representatives of the Directorate of Fisheries has reduced the lag in registering new information. Comparability over time and space 2.5. Comparability and coherence The selection of tables for this edition has changed compared with earlier years, but the data sources are the same. Figures on fishermen and vessels have also been published in NOS Historical Statistics 1978 and 1994, with time series going back to Coherence with other statistics The Directorate of Fisheries was responsible for publishing fishery statistics up to As from 1977, Statistics Norway has published this statistic under the name NOS Fishery Statistics. Each year the Directorate of Fisheries publishes figures on fishermen, vessels and licences on their website: The division for statistics in the Directorate of Fisheries also presents an overview of the development in the number of fishermen, vessels and licences in the publication Norwegian fishing vessels, fishermen and licences. 12 Statistics Norway
13 Figure 1. Fishermen, by fishing as source of livelihood and county Nr. Fylke County 01 Østfold 02 Akershus 03 Oslo 04 Hedmark 05 Oppland 06 Buskerud 07 Vestfold 08 Telemark 09 Aust-Agder 10 Vest-Agder 11 Rogaland 12 Hordaland 14 Sogn og Fjordane 15 Møre og Romsdal 16 Sør-Trøndelag 17 Nord-Trøndelag 18 Nordland 19 Troms 20 Finnmark Fiskarar Fishermen Eineyrke og hovudyrke Sole and main occupation Attåtyrke Secondary occupation Counties Source: The Directorate of Fisheries.. Statistics Norway 13
14 1. Fishermen, by fishing as source of livelihood Number of fishermen, total Main occupation Secondary occupation Revision of the register Fiskarmanntalet has resulted in changes compared to earlier published statstics for the years Source: The Directorate of Fisheries. 2. Fishermen 1, by fishing as source of livelihood and county Number of fishermen, total Main occupation Secondary occupation Total Østfold Akershus Oslo Hedmark Oppland Buskerud Vestfold Telemark Aust-Agder Vest-Agder Rogaland Hordaland Sogn og Fjordane Møre og Romsdal Sør-Trøndelag Nord-Trøndelag Nordland Troms Romsa Finnmark Finnmárku Revision of the register Fiskarmanntalet has resulted in changes compared to earlier published statstics for the year Source: The Directorate of Fisheries. 14 Statistics Norway
15 3. Registered fishing vessels, by county Total Østfold Akershus Oslo Hedmark Oppland Buskerud Vestfold Telemark Aust-Agder Vest-Agder Rogaland Hordaland Sogn og Fjordane Møre og Romsdal Sør-Trøndelag Nord-Trøndelag Nordland Troms Romsa Finnmark Finnmárku Revision of the register of vessels has resulted in changes compared to earlier published statistics. Source: The Directorate of Fisheries. 4. Registered fishing vessels, by length of vessel and county Vessels total Under 10 metres metres metres metres 28 metres and over Total Østfold Akershus Oslo Hedmark Oppland Buskerud Vestfold Telemark Aust-Agder Vest-Agder Rogaland Hordaland Sogn og Fjordane Møre og Romsdal Sør-Trøndelag Nord-Trøndelag Nordland Troms Romsa Finnmark Finnmárku Source: The Directorate of Fisheries. 5. Fishing vessels, by building year and county Vessels, By year of construction total Before Unknown Total Østfold Akershus Oslo Hedmark Oppland Buskerud Vestfold Telemark Aust-Agder Vest-Agder Rogaland Hordaland Sogn og Fjordane Møre og Romsdal Sør-Trøndelag Nord-Trøndelag Nordland Troms Romsa Finnmark Finnmárku Source: The Directorate of Fisheries. Statistics Norway 15
16 6. Number of licenses and participating vessels, by county Licenses Participating County Total Purse Blue Industri Spring Macker Capelin Cod Shrimp Saithe North Other 2 vessels 1 seine whiting al trawl spawnin el trawl trawl trawl trawl trawl Sea trawl g trawl 3 Total (87) (90) Eastern Norway (41) - 50 Rogaland (28) 1 47 Hordaland (11) 4 60 Sogn og Fjordane Møre og Romsdal (4) Sør-Trøndelag Nord-Trøndelag Nordland (3) Troms Romsa (2) 1 34 Finnmark Finnmárku (1) Some vessels may have supplemantary licenses. 2 Purse seine fishing for saithe, danish seine, trawl license for argentines and beamtrawl. 3 The figure in paranthesis shows licenses of North Sea trawl which are limited. Source: The Directorate of Fisheries. 16 Statistics Norway
17 3. Stocks 3.1. Main results The Norwegian fish stocks are divided in three important areas; the Barents Sea, the Norwegian Sea and the North Sea/Skagerrak. The stocks in the Barents Sea are in good conditions, except for capelin and redfish, and unregistered cod-fishing is a big problem. In the Norwegian Sea all the pelagic stocks are in good conditions, while many stocks in the North Sea/Skagerrak have a poor recruitment. The development of the stock of northeast arctic cod is shown in figure 2. The total stock increased to 2.4 million tonnes in 1993, after the eighties which were characterized by a heavy exploitation of the stock. Up to 1999 the stock declined again, but has recovered in recent years. The 2006 stock estimate is 1.3 million tonnes. The estimate of the spawning stock this year is tonnes. Earlier sexual maturity has been an important reason for the rise in spawning stock biomass. The limit biomass for spawning stock (B lim) is tonnes, while the precautionary biomass for spawning stock (B pa) is tonnes. The stock is assessed to have a good reproduction capacity, but there is a risk for too high exploitation. The total stock of northeast arctic haddock increased from a little over tonnes in 1984 to tonnes in 1986 (figure 3). After 1986 the stock size decreased for some years, but had a substantial growth up to 1994 (about tonnes). The estimate of the total stock in 2005 is tonnes with a spawning stock of tonnes. The estimation for the stock in 2006 is unreliable and not published, but the stock is considered to be in good condition. The spawning stock of northeast arctic saithe in 2006 was tonnes (figure 4). The limit biomass for spawning stock (B lim) is tonnes, while the precautionary biomass for spawning stock (B pa) is tonnes. The stock is considered to be in good condition. The development of the stock of Norwegian spring-spawning herring is shown in figure 5. The variation is caused by a combination of over-exploitation and natural causes. In 1987 the majority of the numerous 1983-year class reached maturity, and the spawning stock increased from about 1 million tonnes in 1987 to 2.9 million tonnes in The spawning stock in 2006 is estimated to be 10.3 million tonnes. The stock is in a positive trend with recruitment expected to increase in the coming years due to the strong 2002-year class. The limit biomass for spawning stock (B lim) is 2.5 million tonnes, while the precautionary biomass for spawning stock (B pa) is 5 million tonnes. The capelin stock in the Barents Sea collapsed in , partly as a result of overfishing, but also from natural causes. It recovered rapidly after this, but dropped sharply again in The stock size of one year old and older capelin by autumn 2006 is estimated to tonnes (figure 6). The estimate of the spawning stock is tonnes, while the limit biomass for spawning stock (B lim) is tonnes. This can be characterized as a collapse, but not assessed to be caused by fishing. The spawning stock of blue whiting had its peak in 2003, but has since then declined (figure 7). This is mainly because of overfishing, and quotas were introduced in The estimate of the spawning stock in 2006 is 4.8 million tonnes. The limit biomass for spawning stock (B lim) is 1.5 million tonnes, while the precautionary biomass for spawning stock (B pa) is 2.25 million tonnes. The stock is assessed to be in good condition, but the exploitation is too high, which gradually will affect the spawning stock. Statistics Norway 17
18 Population Data sources Estimation 3.2. Statistics production The statistic includes a selection of important stocks in the Norwegian maritime zone. These species are northeast arctic cod, northeast arctic haddock, northeast arctic saithe, Norwegian spring-spawning herring, capelin and blue whiting. Total stock and spawning stock, as well as limit biomass for spawning stock and precautionary biomass for spawning stock are mentioned. The data comes from the Institute of Marine Research (IMR) and the International Council for the Exploration of the Sea (ICES). ICES draws up several reports with an overview of the development of each fish stock. The Institute of Marine Research publishes annually a report Marine resources and environment, with information on the most important fish stocks. Measurements from cruises, catch statistics and biological samplings from catches form the basis for stock estimations of northeast arctic cod, haddock and saithe. These figures are used by both ICES and IMR in their calculations when determining quotas. IMR carries out annual cruises where the Norwegian spring-spawning herring spend the winter. Measurements are maid using trawl haul and echo sounder. The total stock of capelin is measured acoustic each autumn. The cruise covers the Barents Sea and adjacent areas. The stock estimation from the cruises is used as direct measure of stock size, and prognosis and advices on quotas are made based on models. Calculations of blue whiting are based on many cruises, which use acoustic methods. Definitions 3.3. Concepts, variables and classifications B lim is the limit biomass for a spawning stock. If the spawning stock is below this level, there is a higher risk that the stock reaches a level where it suffers from severely reduced productivity. B pa is the precautionary biomass for a spawning stock. This level is set to avoid the risk of the spawning stock to decrease to or below the B lim because of uncertainties in the assessment. Measurement and processing errors 3.4. Sources of error and uncertainty The models used in stock estimations are advanced and take into consideration mortality rate, growth, sexual maturity, predation and temperature. This can sometimes make the outcome and interpretations difficult. There are some problems with estimating several of the important fish stocks because of varying quality of catch statistics. This is mainly because of discard and unregistered fishing. Comparability over time and space Coherence with other statistics 3.5. Comparability and coherence Figures on stock sizes were first published in NOS Fishery Statistics The selection of tables for this edition has changed compared with earlier years, but the data sources are the same. This edition is extended with text and figure on the blue whiting stock. The working groups of ICES publish different reports on their website, describing conditions of stocks and advices on how to manage the stocks. These reports cover about 135 different stocks: 18 Statistics Norway
19 Institute of Marine Research publishes Marine resources and environment, a survey report on Norwegian maritime zones: Statistics Norway also refers to fish stocks in the publication National Resources and the Environment : Figure 2. Total and spawning stock biomass. Northeast Arctic cod tonnes tonnes Total stock biomass Spaw ning stock biomass Source: Institute of Marine Research and ICES. Figure 3. Total and spawning stock biomass. Northeast Arctic haddock tonnes tonnes Total stock biomass Spaw ning stock biomass Source: Institute of Marine Research and ICES Statistics Norway 19
20 Figure 4. Total and spawning stock biomass. Northeast Arctic saithe tonnes tonnes Total stock biomass Spaw ning stock biomass Source: Institute of Marine Research and ICES Figure 5 Spawning stock biomass. Norwegian spring-spawning herring tonnes Source: Institute of Marine Research and ICES. 20 Statistics Norway
21 Figure 6. Stock biomass of Barents Sea capelin (fish aged one year and over) tonnes Figure 7. Spawning stock biomass. Blue whiting tonnes Source: Institute of Marine Research and ICES Statistics Norway 21
22 4. The catch 4.1. Main results Almost 2.26 million tonnes of fish, shellfish and molluscs were caught in This is almost 6 per cent less than in The total value of the catch was NOK 11.7 billion, the same as previous year. Pelagic fish dominated in quantity and also had the highest value. Cod however, was the most valued species at NOK 3.3 billion, while herring was worth NOK 2.2 billion. The catch in quantity has dropped in the last years, but except for 2003 the value has not. This means that the average prices have risen in the same period. A closer look at the average price for some of the species shows better prices for important species such as cod, haddock, saithe, blue whiting and deep water prawn. The average price of herring and mackerel have also increased, but dropped from 2005 till Seventy per cent of the total quantity of the catch was used for consumption, while the rest went to production of meal and oil. For consumption, herring is the most important fish measured by quantity, while cod is the most important fish when it comes to value. Blue whiting is the most important trashfish. Most of the catch is taken with trawl and seine. In quantity, the catch was divided equally on most of the fishing grounds, while the counties with the largest landings were Møre og Romsdal and Rogaland. When it comes to the value of the catch, the northern fishing grounds both at sea and along the coast dominate. Møre og Romsdal and Nordland were the counties with the highest value of landings. The largest sales co-operatives were Norges Sildesalgslag and Norges Råfisklag. Over seals and 545 whales were caught in In 2006, foreign vessels landed tonnes of fish and other species in Norway. This is tonnes more than the previous year. The rise is mainly caused by larger deliverances of both pelagic fish and codfishes. The total value was close to NOK 1.9 billion. Russian vessels delivered tonnes, mainly codfishes. United Kingdom delivered tonnes, almost solely pelagic fish. The world catch of fish is not changing much from one year to the next. Total production in 2006 was approximately 92 million tonnes, down one million from China is dominating with 17 million tonnes, while Norway is in 11 th place with 2.3 millions. About ¾ of the world catch is used for human consumption. Population Data sources, collection of data, control and revision 4.2. Statistics production The statistic cover all catches of marine fish delivered in Norway or abroad by Norwegian-registered vessels and catches of marine fish delivered in Norway by foreign vessels. Included are also sealing, whaling, catches of seaweed, oysters and mussels, while delivering outside the sales co-operatives and none-registered sales are not included. Fish farming and fishing for own use is not included either. The Directorate of Fisheries produces catch statistics based on information from approved sales co-operatives. According to law, officially approved sales cooperatives have the sole right of first hand sale of most fish species and other animals caught in the sea. Excepted from this are salmon, sea trout and seal. The sole right also applies to all sales of fish which comes directly from the sea and are sold in Norway by foreign vessels. When landed the catch is weighted before sold. A legal document called contract note (bill) is filled in showing quantities and values of the landed fish species, type 22 Statistics Norway
23 of fishing gear, disposition of the catch, fishing ground, landing place and the register identification of the vessel. The sales co-operatives submit this information electronically to the Directorate of Fisheries for producing statistics. In addition, information is obtained from the yearly enquiry of the salmon and sea trout fisheries done by Statistics Norway and information from a few other sources. The information from the sales co-operatives also comprises Norwegian catches landed abroad. In addition, the sales co-operatives deliver information about landings of foreign vessels. These catches are presented in separate tables. Catch journals In some fisheries the vessel owners are obliged to keep catch journals. This concerns e.g. trawling of codfish and shrimps, and catch of small whales. From these journals the Directorate of Fisheries produces statistics. The Directorate of Fisheries does an extensive control and revision of the data. When the control and revision is finished, the Directorate of Fisheries considers the data ready to produce final statistics. Statistics Norway receives this data as a direct output from the database of contract notes as per 1. October the year following year of the catch. Statistics Norway controls that all the data is received before producing the tables. Although the data is regarded as final for statistical purposes, the database of contract notes in the Directorate of Fisheries is constantly updated whenever needed. These late updates are non-significant and do not affect the quality of the statistics. Yearbook of Fishery Statistics This publication from FAO (Food and Agriculture Organisation of the United Nations) gives main figures of the fisheries in all countries. The catch figures in the publication also comprise fishery for own consumption, as well as fresh water fisheries and fish farming. The Internet address is Estimation Definitions Before the data is sent to Statistics Norway, the Directorate of Fisheries converts all the different types of landed catch to live weight Concepts, variables and classifications As from 1977 the quantities are given in live weight. Live weight is the weight of the fish in the condition it is caught. The weight of fish that is landed without head, in gutted condition, as fillet or salted etc. is converted into live weight. Annex B shows the conversion factors. FAO uses the concept of nominal catch instead of live weight. The word catch is also often used without further explanation. In catch journals this is interpreted as estimated quantity in live weight. For further details see FAO Yearbook of Fishery Statistics (Catch concepts: Diagrammatic presentation). Catch value is the amount paid to the fishermen for the catch. This includes freight and price subsidies and production tax, but not tax to the sales co-operatives. Value added tax is not included. Pelagic means living in the water masses. Clarifications and concept on quotas Each year The Advisory Committee on Fishery Management (ACFM) gives recommendations for total allowable catch (TAC) of different fish species. Consultations between Norway and other countries are based upon these recommendations. Statistics Norway 23
24 Norway and Russia are acting jointly to set national quotas for stocks of northeast arctic cod, northeast arctic haddock and capelin. Quotas given to a third country are taken into consideration before Norway and Russia set their own national quotas. Norway and EU do not give quotas to a third country before consulting on mutual stocks. Quotas to a third country are a result of consultations between Norway and the third country based on Norway s quota. After all consultations a national quota is given. National disposable quota is the quota Norwegian fishermen can use after all consultations and possible purchase and sales of quotas to other nations are final. This quota should be used when comparing quotas and catches for each country. For more information about agreements on quotas, see the yearly Reports to the Storting Om de fiskeriavtalene Norge har gjort med andre land. Standard classifications Measurement and processing errors Standard names and grouping of species caught (target species), classification of major fishing areas and conversion factors are listed in the annexes Sources of error and uncertainty The statistic is based on a legal document called contract notes signed by both the fishermen and the buyers as a part of the settlement. The quality of the contract notes are checked by the sales co-operatives, before submitted to the Directorate of Fisheries. These notes contain information about quantity and value together with other information used in resource management and statistics. The information on the contract notes may vary in quality, and extensive verification is a necessity was the first year the primary data was of such a quality that it could be used as basis for catch statistics in the publication NOS Fishery Statistics, and there is still some information lacking on the contract notes. Vessels using more than one type of fishing gear on one trip, can only report one type of fishing gear on the contract note, and vessels fishing in more than one fishing ground can only report one fishing ground. This must be considered when reading the tables. This is also the explanation for possible discrepancies between catch statistics based on contract notes and those based on catch journals from trawlers. Information from catch journals can sometimes be missing due to the loss of catch journals prior to submission. Non-response errors It is not possible to estimate figures for landings which have not been registered trough official channels. This concerns for instance some sales of the edible crab. There is also some non-response of catch journals due to different reasons like shipwreck, change of ownership and bankruptcy. Comparability over time and space 4.5. Comparability and coherence The selection of tables for this edition has been changed compared with earlier years, but the data sources are the same. As from 2005 a new grouping of target species is used, and the list of specified species is slightly changed as well as the categories for disposition of the catch. Time series of catches in quantity and value all the way back to 1977 are published in the series NOS Fishery Statistics. Furthermore, comparable time series going back to 1866 are presented in NOS Historical Statistics 1978 and 1994, and in the Statbank. Up and to 1974 the quantity is given in fresh weigh, as from 1975 quantity is given in live weight. Statistics Norway publishes preliminary figures of catches in quantity and value for the whole year and for the first 6 months of a year in the 6 th and 35 th week respectively. 24 Statistics Norway
25 In the series NOS Fishery Statistics , landings from foreign vessels in Norway were dealt with in a separate chapter (chapter 4). Coherence with other statistics The Directorate of Fisheries publishes preliminary figures on Internet: The Directorate also submits catch statistics to several international organisations such as FAO, Eurostat, ICES, NAFO and OECD. Many international organisations also publish statistics of catches in quantity and value, e.g. FAO: and Eurostat: Figure 8. Quotas and catches. Northeast Arctic cod tonnes tonnes Total quota Norw egian quota Total catch Norw egian catch Source: The Directorate of Fisheries, Institute of Marine Research and ICES Figure 9. Quantity, by main group of target species tonnes tonnes I alt Total Pelagic Cod fish Other Source: The Directorate of Fisheries Statistics Norway 25
26 Figure 10. Quantity of catch, by main group of target species and landing county Tonnes Nr. Fylke County 01 Østfold 02 Akershus 03 Oslo 04 Hedmark 05 Oppland 06 Buskerud 07 Vestfold 08 Telemark 09 Aust-Agder 10 Vest-Agder 11 Rogaland 12 Hordaland 14 Sogn og Fjordane 15 Møre og Romsdal 16 Sør-Trøndelag 17 Nord-Trøndelag 18 Nordland 19 Troms 20 Finnmark tonn tonnes Pelagisk Pelagic Torsk og torskefisk Cod fish Anna fisk Other species Counties Source: The Directorate of Fisheries 26 Statistics Norway
27 Figure 11 Catch quantity and value, by disposition of the catch. Per cent Mengd Feeding stuff, bait and other dispositions 0,3 % Meal and oil 32,8 % Consumption 67,0 % Feeding stuff, bait and other dispositions 8,1 % Value Meal and oil 0,0 % Consumption 91,8 % Source: The Directorate of Fisheries Statistics Norway 27
28 7. Quantity and value of catch, by main group 1 of target species Year Total (incl. seaweed) Seaweed Fish and crustaceans Total Pelagic fish Codfishes Flatfishes and other demersal fishes tonnes live weight Deep-sea Crustacean species s and molluscs NOK million See appendix A. Source: The Directorate of Fisheries. Other fishes 28 Statistics Norway
29 8. Total catch 1, by disposition of the catch Year Total Consumption Meal and oil Feeding stuff, bait etc tonnes live weight Per cent Seaweed is not included. Source: The Directorate of Fisheries. Statistics Norway 29
30 9. Average price 1 for first hand sales of fish Target species NOK per kg All species Capelin Norway pout Blue whiting Sandeel Horse mackerel AtlanticMackerel Herring Sprat Pelagic fish nei Cod Haddock Saithe Tusk Ling Blue ling Pollack Hake Whiting Greenland halibut Halibut Plaice Common sole Witch Common dab Lemon dab Brill Turbot Other flatfish Eel Redfish Lesser and greater argentines Catfish Angler Lumpsucker Groundfishes nei Picked dogfish Porbeagle Basking shark Sharks nei Skate, ray Deep-sea species nei Atlantic salmon Species not else-where included Crab King crab Lobster Norway lobster Deep water prawn Mussels Crustaceans and molluscs nei Refer to average price for the whole country. The prices will vary between districts and disposition of the catch. Source: The Directorate of Fisheries and Statistics Norway. 30 Statistics Norway
31 10. Catch, by fishing gear and target species Tonnes live weight Target species Total Seine Gillnet Hand line Long line Danish seine Trawl Other Total Capelin Norway pout Blue whiting Sandeel Horse mackerel Mackerel Herring Sprat Pelagic fish nei Cod Haddock Saithe Tusk Ling Blue ling Pollack Hake Whiting Greenland halibut Halibut Plaice Common sole Witch Common dab Lemon dab Brill Turbot Other flatfish Eel Redfish Lesser and greater argentines Catfish Angler Lumpsucker Groundfishes nei Picked dogfish Porbeagle Basking shark Sharks nei Skate, ray Deep-sea species nei Atlantic salmon Species not elsewhere included Crab King crab Lobster Norway lobster Deep water prawn Mussels Crustaceans and molluscs nei Source: The Directorate of Fisheries. Statistics Norway 31
32 11. Quantity and value of catch, by disposition and target species Target species Total Consumption Meal and oil Feeding stuff, bait etc Quantity Value Quantity Value Quantity Value Quantity Value Target species Tonnes NOK Tonnes NOK Tonnes NOK Tonnes NOK Total Capelin Norway pout Blue whiting Sandeel Horse mackerel Mackerel Herring Sprat Pelagic fish nei Cod Haddock Saithe Tusk Ling Blue ling Pollack Hake Whiting Greenland halibut Halibut Plaice Common sole Witch Common dab Lemon dab [Brill Turbot Other flatfish Eel Redfish Lesser and greater argentines Catfish Angler Lumpsucker Groundfishes nei Picked dogfish Porbeagle Basking shark Sharks nei Skate, ray Deep-sea species nei Atlantic salmon Species not elsewhere included Crab King crab Lobster Norway lobster Deep water prawn Mussels Crustaceans and molluscs nei Source: The Directorate of Fisheries. 32 Statistics Norway
33 12. Quantity and value of catch, by main group of target species and fishing ground Fishing ground Total Pelagic fish Codfishes Flatfishes and other demersal fishes Tonnes Deep-sea species Crustaceans and molluscs Other Total Offshore fishing, total The Norwegian Sea/Barents Sea/Svalbard The North Sea/Skagerrak Other areas in the Northeast Atlantic Ocean Northwest Atlantic Ocean Outside the North Atlantic Ocean Coastal fishing, total The Norwegian Sea/Barents Sea/Svalbard The North Sea/Skagerrak Unknown NOK Total Offshore fishing, total The Norwegian Sea/Barents Sea/Svalbard The North Sea/Skagerrak Other areas in the Northeast Atlantic Ocean Northwest Atlantic Ocean Outside the North Atlantic Ocean Coastal fishing, total The Norwegian Sea/Barents Sea/Svalbard The North Sea/Skagerrak Unknown Offshore fishing is all kinds of fishing outside the 12 n. mile zone. Source: The Directorate of Fisheries. Statistics Norway 33
34 13. Quantity and value of catch, by main group of target species and landing county County Total Pelagic fish Codfishes Flatfishes and other demersal fishes Quantity Value Quantity Value Quantity Value Quantity Value Tonnes NOK Tonnes NOK Tonnes NOK Tonnes NOK Total Østfold Akershus Oslo Buskerud Vestfold Telemark Aust-Agder Vest-Agder Rogaland Hordaland Sogn og Fjordane Møre og Romsdal Sør-Trøndelag Nord-Trøndelag Nordland Troms Finnmark Finnmárku Unknown or landed abroad Deep-sea species Crustaceans and molluscs Other Quantity Value Quantity Value Quantity Value Tonnes NOK Tonnes NOK Tonnes NOK Total Østfold Akershus Oslo Buskerud Vestfold Telemark Aust-Agder Vest-Agder Rogaland Hordaland Sogn og Fjordane Møre og Romsdal Sør-Trøndelag Nord-Trøndelag Nordland Troms Finnmark Finnmárku Unknown or landed abroad Source: The Directorate of Fisheries. 14. Quantity and value of catch, by sales co-operative Sales co-operatives Tonnes live weight NOK Total Skagerrakfisk S/L Rogaland Fiskesalgslag S/L Vest-Norges Fiskesalslag Sunnmøre og Romsdal Fiskesalslag The Norwegian Fishermen's Sales Organisation Norges Sildesalgslag Catch notified in another way Comprise catch of fish species of which the sales co-operatives do not have monopoly of first-hand sale. Some figures for catch value are partly estimated. Source: The Directorate of Fisheries. 34 Statistics Norway
35 15. Sealing Number of animals caught, total Harp seal, total Hooded seal, total Other 1 Total production of blubber Value of catch, total. Tonnes NOK Bearded seal, ringed seal and polar bear. 2 Not included 295 seals for scientific purpose and harp seals accidently caught in gillnets in Varangerfjorden. 3 Included subsidies with NOK 1.50 per kg. 4 The seal catch was not sold. 5 Included 60 seals for scientific purpose. Source: The Directorate of Fisheries. 16. Coastal whaling Vessels Whales caught Production Total Meat Blubber Animal feed Quantity Value 1 Quantity Value Quantity Value Quantity Value Tonnes NOK Tonnes NOK Tonnes NOK Tonnes Included subsidies to whaler. 2 The low values is due to that no blubber was sold for human consumption. 3 Animals caught for research purposes. 4 Included 69 animals for research purposes. 5 Included 70 animals for research purposes. Source: The Directorate of Fisheries. NOK Statistics Norway 35
36 17. World catch of fish, by disposition. Fish farming is included Million tonnes live weight Total catch For human consumption, total Fresh Frozen Salted etc Canned For other purposes, total Reduction Other Source: FAO: Yearbook of Fishery Statistics. 18. Total world catch by countries with the largest catches. Quantity Mill. tonnes World, total China Peru USA Indonesia Japan Chile India Russian Fed Thailand Philippines Norway Myanmar Viet Nam Korea Rep Bangladesh Source: FAO: Yearbook of Fishery Statistics. 36 Statistics Norway
37 19. Quantity and value of catch landed in Norway by foreign vessels, by main group 1 of target species Year Total Pelagic fish Cod fish Flatfishes and other demersal fishes Tonnes live weight Deep-sea species Crustaceans and molluscs NOK See appendix A. Source: The Directorate of Fisheries. Other Statistics Norway 37
38 20. Quantity and value 1 of catch landed in Norway by foreign vessels, by main group of target species and nationality of the vessel Country Total Pelagic fish Codfishes Flatfishes and other demersal fishes Tonnes live weight Deep-sea species Crustaceans and molluscs Total Russia United Kingdom Denmark Ireland Faroe Islands Sweden Other countries NOK Total Russia United Kingdom Denmark Ireland Faroe Islands Sweden Other countries Some target species which are by-catches in consumption landings have no value specified. 2 Including amongst others Iceland, Germany, Greenland, Poland and Lithuania. Source: The Directorate of Fisheries. Other 38 Statistics Norway
39 5. Processing and foreign trade 5.1. Main results The number of establishments and employees in the fish processing industry are continuously in decline. There were 558 establishments in 2006, down almost 100 establishments since In total persons were employed in the industry in 2006, which is more than fewer than in Nordland is the county with most establishments and employees. The export of fish and fish products has the last couple of years increased in value, while the quantity of the export has been about the same. The export of fish from fisheries is still dominating both in quantity and value. However, the export of farmed fish is growing steadyily, and represents the largest growth in value, as the salmon prices has been high. The total export value of fish and fish products in 2006 was NOK 35.7 billion, up 11 per cent from the previous year. The export quantity was 1.9 billion tonnes, down 7 per cent from the previous year. Approximately half of the quantity was sold to EU, which in value accounted for close to 64 per cent. Countries with the largest import measured in quantity were Denmark, Russia, United Kingdom and France. Apart from farmed salmon, the highest value comes from other frozen fish, exclusive fillets, which primarily was sold to non-eu countries. Norway imported tonnes of fish at a value of NOK 5.4 billion in Population 5.2. Statistics production The statistics on establishments and employees cover all establishments in manufacturing, subgroup 15.2 Processing and preserving of fish and fish products, as defined by the Norwegian Standard Industrial Classification. The statistics on external trade of fish and fish products cover customs declared shipments, fish products from fish farming included. The list of commodity numbers is shown in appendix G. Data sources The manufacturing statistics are based on information from questionnaires and data from administrative registers. The standard financial report that the tax authorities collect from the enterprises (the Standard Industry Form) are an important source for enterprises with at least ten employees. The Standard Industry Form covers income statement and balance. For the remaining establishments total figures are estimated based on annual accounts, employment and sales. All joint-stock companies are required to send their annual accounts to the Norwegian Register of Company Accounts in Brønnøysund. The annual accounts include the income statement as well as the balance sheet, but the specifications vary and are not as detailed as the Standard Industry Form. The majority of entries to the Central Register of Establishments and Enterprises of Statistics Norway have been taken from the Central Coordinating Register for Legal Entities in Brønnøysund. The Central Coordinating Register for Legal Entities contains all enterprises in the Value Added Tax Register of the Directorate of Taxes and the Register of Employers of the National Insurance Administration. The statistic on export and import of fish and fish products are based on administrative data from customs declarations collected by the customs authority under the Customs Act. Statistics Norway 39
40 Collection of data, control and revision Manufacturing statistic: The questionnaires are sent to the enterprises and optically read upon return. Standard industry forms that have not been received electronically are manually registered. The data collected are edited at establishment level. Consistency controls are conducted between items on the form, against information for the previous year, against production statistics, against the Central Register of Establishments and Enterprises, against the standard industry form and against the annual reports. External trade: The relevant data are transmitted electronically from the Directorate of Customs and Excise to Statistics Norway twice a week. The data go through automatic controls in the electronic customs declaration system. The controls are partly determined by the customs and partly in cooperation with Statistic Norway. In the subsequent revision in Statistic Norway e.g. procedure codes and commodity numbers are examined by a system which intends to catch and correct the most serious errors in the data. Definitions 5.3. Concepts, variables and classifications An establishment is defined as a functional unit, which at a single physical location is engaged mainly in activities within a specific activity group. This definition corresponds to the definition in ISIC Rev. 3. An enterprise is defined as an organisational unit comprising all economic activities engaged in by one and the same owner. Hence an enterprise is a legal entity covering one or more productive units (establishments). Export comprise goods declared for exports directly from free circulation and from customs warehouses. Imports comprise goods that are declared directly at the border crossing or via a customs warehouse. Goods going directly from abroad to regular installations on the Norwegian Continental Shelf are not included, whereas goods via Norwegian customs district are included. The Norwegian commodity classification for customs and statistical purposes is based on the international customs and statistical nomenclature Harmonised System (HS). Standard classifications Norwegian Standard Industrial Classification, which is based on the industrial classifications approved by the EU (NACE Rev. 1.1) and the UN (ISIC Rev. 3). The Harmonised System classifies goods mainly according to their type of physical material. In addition to the six-digit code of the HS, the Norwegian nomenclature has a national seventh digit for customs purposes and an eight for statistical needs. The nomenclature is published annually in the series NOS (Official Statistics Norway) Commodity List. The country nomenclature follows the international standard ISO Measurement and processing errors 5.4. Sources of error and uncertainty Manufacturing Statistics: Common errors occur during processing such as coding, data entry, data editing, imputation, etc. There are also errors in the register, during optical reading, different accounting and different interpretation of concepts. External trade: Collection errors may occur in the data due to misunderstandings etc., unless discovered and corrected in the customs controls. Errors may be misclassification of goods, estimation and mistaken country codes etc. 40 Statistics Norway
41 Non-response errors Sampling errors Comparability over time and space Manufacturing statistics: There is response from 95 per cent of the units in the sample, so problems caused by non-response are small. The item non-response is slightly higher, i.e. that the unit has failed to respond to some but not all the questions in the survey. Manufacturing statistics: Sampling errors arise from the fact that the estimates are based on a sample and not a census of the entire population Comparability and coherence The series NOS Fishery Statistics has published time series on establishments and employment since Figures of export and import have been published since Mainly, the data are comparable when it concerns coverage and variables. However, there have been changes in the Standard Industry Classification, sample size and minor adjustments in a few definitions. The same applies to the eightdigit, HS-based commodity classification, which is subject to revisions regularly due to development of commodities in the world trade. There are also yearly modifications at national level. Coherence with other statistics The statistics in this chapter are based on figures from the Division for Energy and Industrial Production and the Division for External Trade. More information about these statistics is available on the Internet: og Figure 12. Establishments 1 and employees in fish processing industry Establishments Employees Inclusive sole proprietors. Source: Statistics Norway and The Directorate of Fisheries. Statistics Norway 41
42 Figure 13 Export of fish and fish products tonnes Quantity Value NOK million Source: Statistics Norway and The Directorate of Fisheries. Figure 14. Export of fish and fish products, by country of destination Per cent. Quantity Russia 15 % Others 35 % Denmark 16 % USA 2 % Brazil 2 % Portugal 2 % Sw eden 3 % Germany 3 % Poland 5 % Japan 5 % France 6 % United Kingdom 6 % Value Russia 9 % Others 32 % France 11 % Denmark 10 % Brazil 3 % Japan 5 % USA 3 % Germany 4 % Poland 5 % Sw eden 5 % United Kingdom 8 % Portugal 5 % Source: NOS External Trade 42 Statistics Norway
43 21. Establishments 1 and employed persons in fish processing industry, by industrial subclass Industrial subclass Establishments, total Employed persons, total Salting, drying and smoking of fish Establishments Employed persons Freezing of fish Establishments Employed persons Canning of fish and fish products Establishments Employed persons Manufacture of fish oil, fish meal and other fish products Establishments Employed persons Inclusive sole proprietor. Source: NOS Manufacturing Statistics. Statistics Norway 43
44 22. Establishments 1, employed persons, value added etc. in fish processing industry, by industrial subclass and county Industrial subclass County/region Establishments Employed persons Compensation of employees Gross value of production NOK million Value added Gross investment Establishments, total Salting, drying and smoking of fish Establishments, total Skagerrakkysten mv : : : : Rogaland Hordaland Sogn og Fjordane : : : : Møre og Romsdal Sør-Trøndelag Nord-Trøndelag Nordland Troms Finnmark Finnmárku Freezing of fish Establishments, total Skagerrakkysten mv Rogaland Hordaland Sogn og Fjordane Møre og Romsdal Sør-Trøndelag Nord-Trøndelag : : : : Nordland : : : : Troms Finnmark Finnmárku Canning of fish and fish products Establishments, total Skagerrakkysten mv : : : : Rogaland : : : : Hordaland : : : : Sogn og Fjordane : : : : Møre og Romsdal : : : : Sør-Trøndelag : : : : Nordland : : : : Troms : : : : Finnmark Finnmárku : : : : Manufacture of fish oil, fish meal and other fish products Establishments, total Skagerrakkysten mv Rogaland Hordaland Sogn og Fjordane Møre og Romsdal Sør-Trøndelag Nord-Trøndelag Nordland Troms Finnmark Finnmárku Inclusive sole proprietors. 2 Comprising the counties: Østfold, Akershus, Oslo, Hedmark, Oppland, Buskerud, Vestfold, Telemark, Aust-Agder and Vest-Agder. Source: NOS Manufacturing Statistics. 44 Statistics Norway
45 23.a. Export of fish and fish products, by country of destination and commodity group NOK million EU Of which Commodity group Export, total countries, Denmark France Portugal United total Kingdom Sweden Germany Reared salmon, fresh, chilled or frozen Herring and sprat, fresh, chilled or frozen, incl. fillets Other fresh or chilled fish, incl. fillets Other frozen fish, excl. fillets Frozen fillets of fish, excl. herring Salted herring excl. fillets Other salted fish, incl. fillets (also fillets of herring) Stockfish (dried fish) Klipfish (salted and dried) Crustaceans and molluscs, not canned Oil of herring and other fish Fish liver oil, excl. waste oil Fish,processed or preserved incl, caviare and caviare substitutes Crustaceans and molluscs, processed or preserved Meal and powder of fish, crustanceans or molluscs Other products See appendix G. Source: NOS External Trade. 23.b. Export of fish and fish products, by country of destination and commodity group NOK million Countries, Of which Commodity group Export, total except EUcountries, Japan Russia Poland USA Brazil total Reared salmon, fresh, chilled or frozen Herring and sprat, fresh, chilled or frozen, incl. fillets Other fresh or chilled fish, incl. fillets Other frozen fish, excl. fillets Frozen fillets of fish, excl. herring Salted herring excl. fillets Other salted fish, incl. fillets (also fillets of herring) Stockfish (dried fish) Klipfish (salted and dried) Crustaceans and molluscs, not canned Oil of herring and other fish Fish liver oil, excl. waste oil Fish,processed or preserved incl, caviare and caviare substitutes Crustaceans and molluscs, processed or preserved Meal and powder of fish, crustanceans or molluscs Other products See appendix G. Source: NOS External Trade. Statistics Norway 45
46 24.a. Export of fish and fish products, by country of destination and commodity group tonnes EU Of which Commodity group Export, total countries, Denmark France Portugal United total Kingdom Sweden Germany Reared salmon, fresh, chilled or frozen Herring and sprat, fresh, chilled or frozen, incl. fillets Other fresh or chilled fish, incl. fillets Other frozen fish, excl. fillets Frozen fillets of fish, excl. herring Salted herring excl. fillets Other salted fish, incl. fillets (also fillets of herring) Stockfish (dried fish) Klipfish (salted and dried) Crustaceans and molluscs, not canned Oil of herring and other fish Fish liver oil, excl. waste oil Fish,processed or preserved incl, caviare and caviare substitutes Crustaceans and molluscs, processed or preserved Meal and powder of fish, crustanceans or molluscs Other products See appendix G. Source: NOS External Trade. 24.b. Export of fish and fish products, by country of destination and commodity group tonnes Countries, Of which Commodity group Export, total except EUcountries, Japan Russia Poland USA Brazil total Reared salmon, fresh, chilled or frozen Herring and sprat, fresh, chilled or frozen, incl. fillets Other fresh or chilled fish, incl. fillets Other frozen fish, excl. fillets Frozen fillets of fish, excl. herring Salted herring excl. fillets Other salted fish, incl. fillets (also fillets of herring) Stockfish (dried fish) Klipfish (salted and dried) Crustaceans and molluscs, not canned Oil of herring and other fish Fish liver oil, excl. waste oil Fish,processed or preserved incl, caviare and caviare substitutes Crustaceans and molluscs, processed or preserved Meal and powder of fish, crustanceans or molluscs Other products See appendix G. Source: NOS External Trade. 46 Statistics Norway
47 25. Import of fish and fish products 1 from various countries. Quantity and value EU Imports, countries, total total Denmark Of which United Kingdom Sweden 2 Other countries, total Of which Peru Russia 3 Iceland USA tonnes NOK million Included products from fish farming, animal food and animal oil and fats. 2 Before 1995 figures for Sweden are included in the figures for other countries, total. As from 1995 figures for Sweden are included in the figures for EU-countries, total. 3 Sovjet Union up to and including Source: NOS External Trade. Statistics Norway 47
48 6. Profitability 6.1. Main results Figures from the National Accounts show that the value added in the fisheries at basis prices was NOK million in This is an increase of close to 4 per cent compared with the previous year. Operating surplus was NOK million, up 11 per cent from The Profitability Survey of the Directorate of Fisheries shows an average operating profit for vessels 8 metres and above of NOK in This is the largest profit ever and up 7.5 per cent from The operating margin was 15.5 per cent, the same as in The survey also shows that vessels registered in Hordaland, and vessels 28 metres and above, in average have the biggest operating profit. The operating margin in 2006 was the same as in the peak years 1998, 2001 and 2005 (figure 16). The development of the operating margin since 1990 has in general been positive. Main causes for this development have been large fish stocks and good prices of important species. A reduction of the fishing fleet with lower operating expenses and higher productivity is also a cause. Population 6.2. Statistics production The coverage of the National Accounts is defined by international guidelines of the System of National Accounts (SNA 1993), and the European System of Accounts (ESA 1995). The real accounts in current and constant prices give a structured overview of the supply and use of products (goods and services) in the economy. In addition, information on fixed assets is included, as well as wages etc. Furthermore, the real accounts provide the basis for the calculation of the Gross National Product (GNP) and other important macro economic measures. The Profitability Survey of the Fishing Fleet covers Norwegian fishing vessels 8 metres and above operating on a whole year basis. The survey is based on the accounts from a sample of such fishing vessels. The vessels shall fulfil some conditions; to have landed catches in minimum 7 months, to have a minimum income from the catches and that the owner is work able. Data sources, collection of data, control and revision The calculation of the annual national accounts is based on statistics from several sources, such as the Structural Business Statistics for manufacturing and other industries, accounting statistics for general government and enterprises, statistics on wages and earnings, external trade statistics, household consumer surveys and labour statistics. The annual national accounts for fish and fish products are mainly based on primary statistics collected by the Directorate of Fisheries. The sources are critically evaluated and compared with alternative sources. In some areas, the statistics have to be adjusted in order to satisfy the requirements of the national accounts. In areas where the statistics are incomplete, assessments are essential. In the process of estimating national accounts data, the figures are critically evaluated and controlled in several steps. The Profitability Survey of the Fishing Fleet is carried out by the Directorate of Fisheries. A mapping of which vessels are operating on a whole year basis is carried out in advance. The mapping is done with information from the Register of Norwegian Fishing Vessels, Register of Norwegian Fishing Licences and the Register of Landings. A sample of vessels from this mapping is asked to send in information from their accounts. Not all the owners respond to the request, while some of the information is of to poor quality to be used in the survey. 48 Statistics Norway
49 Definitions 6.3. Concepts, variables and classifications The value added of an industry at basic prices is calculated as output at basic prices less intermediate consumption at purchasers prices. Operating profit is operating revenues minus operating expenses. Operating margin is operating profit/operating revenues * 100. Standard classifications Measurement and processing errors The accounting systems of the Norwegian National Accounts are based on the international standards for national accounts, i.e. SNA 1993 and ESA The accounting system outlines the framework and contents for the production of national accounts statistics. In addition to accounting structure, the accounting system contains a number of groupings or classifications used in the national accounts, such as: Activity classification Classification of non-financial assets Product classification of national accounts Classification of individual consumption by purpose 6.4. Sources of error and uncertainty The national accounts are based on various statistical sources. The sources are either survey data from establishments, enterprises or households, or data from registers. National accounts statistics reflect the inaccuracy in the statistical sources and the methods of compilation. Weaknesses and inaccuracy in the statistical sources are normally described in the documentation of the relevant sources. Fishermen sometimes misunderstand questions of the Profitability Survey, while errors in assessment during the revision also occur. The Directorate of Fisheries seeks to eliminate these errors and continously improves the quality. The nonresponse of the survey in 2006 was 16 per cent. There is uncertainty because the statistics are based on a sample of vessels and not the whole population. Comparability over time and space 6.5. Comparability and coherence The series NOS Fishery Statistics has published time series on national accounts since Users of national accounts figures must be aware that changes in the statistical systems etc. may lead to minor breaks in more detailed time series. As of the 2005-edition, figures from fish farming is no longer included in table 27. This times series is therefore not comparable with previous editions in NOS Fishery statistics. Up to 2004 figures from The Fishing Sector Account was published in the series NOS Fishery statistics. The account was made for the Budget Commission of Fishery which was dissolved in Figures from the Profitability Survey of the Fishing Fleet operating on a whole year basis has been published since Coherence with other statistics The statistics of national accounts are worked out by the Division for National Accounts. More supplementary information about these statistics can be found on the Internet: More details from the profitability survey of the fishing fleet can be found on the Internet: iskefl_ten. Statistics Norway 49
50 The survey was earlier published by the Budget Commission of Fishery, but as from 2004 this has been carried out by the Directorate of Fisheries. After the Budget Commission was dissolved, the Directorate has established a reference group to ensure the various users need for data on profitability. Figure 15. Value added of fishery, and as percentage of gross national product (GNP) NOK million Value added Percentage of GDP Per cent 0,60 0, , , , , ,00 Source: NOS National Accounts. 50 Statistics Norway
51 Figure 16 Average operating revenues and -expenses 1, and operating margin of whole-year operated fishing vessels 8 metres and above Operating revenues Operating expenses Operating revenues and -expenses are converted to NOK 2006 value by means of the Consumer Price Index Source: The Directorate of Fisheries. Statistics Norway 51
52 26. National account figures for fisheries *. NOK million * Value added Consumption of fixed capital Taxes on production Subsidies on production Compensation of employees Operating surplus Gross capital formation Of which Fishing vessels Machinery and equipment Utførte timeverk. Mill. Man-hours worked. Million Norwegian consumption of fish and fish products Source: NOS National Accounts. 27. Average operating results of whole-year operated fishing vessels 8 metres and above, by length of vessel, county and type of fishery NOK Operating revenues Operating expenses Operating profit Profit before extraordinary items Total Length of vessel 8-9,9 metres ,9 metres ,9 metres ,9 metres metres and over County of vessel Agder/Østlandet Rogaland Hordaland Sogn og Fjordane Møre og Romsdal Trøndelag Nordland Troms Finnmark Demersal fish Pelagic fishery Source: The Direktorate of Fisheries. 52 Statistics Norway
53 Appendix A Main groups of fish species Pelagic fish Herring Sprat Capelin Norway pout Blue whiting Atlantic horse mackerel Sandeel Atlantic mackerel and others Codfishes Atlantic cod Tusk Hake Ling Blue ling Haddock Saithe Pollack Whiting and others Deep-sea fishes Picked dogfish Porbeagle Basking shark Skate, ray and others Crustaceans and molluscs Crab King Crab Lobster Norway lobster Deep water prawn Mussels and others Unspecified 1 Flatfishes and other demersal fishes Argentines Eel Wolffishes Redfish Lumpsucker Halibut European plaice Greenland halibut Witch flounder Common sole Common dab Lemon sole Brill Turbot Angler and others 1 Seaweed is not included. Statistics Norway 53
54 Appendix B A selection of conversion factors 1 Conversion factors to live weight 2 Condition by landing Gutted Gutted Gutted without Fillets with skin Fillets without Fillets without with head without head head and ear-bones and bones skin, with bones skin and bones Salted Halibut Plaice Greenland halibut Witch Other flatfish Tusk Spawning cod Cod Hake Ling Blue ling Haddock Saithe Pollack Whiting Catfish Redfish Monk Tuna Porbeagle Picked dogfish Squid As from 1. February The publication Omrekningsfaktorar frå levert produktvekt til rundvekt, issued by the Directorate of Fisheries, presents a complete survey of conversion factors. 54 Statistics Norway
55 Appendix C ICES Fishery statistical divisions Statistics Norway 55

56 Appendix D Fishing grounds. Northwest Atlantic 56 Statistics Norway


57 Appendix E Fishing grounds. Northeast Atlantic Statistics Norway 57
58 Appendix F Fishing grounds The Norwegian Sea/Barents Sea/Svalbard FAO-area Norwegian area Westfjord (Lofoten) Kanin Bank Coast of Murmansk East Finnmark West Finnmark Røst-Bank to Malang Ground Helgeland Bank Storegga - Frøya Bank Skolpen Bank Gåse Bank Nordkapp Bank Thor Iversens Bank Britvin Ground Central Bank Admirality Ground Northeast Area North of Novaya Zemlya Bear Island West Spitsbergen Storfjord/Hinlopen Strait Hopen Great Bank Northwest Spitsbergen Greenland Sea Southwest of Spitsbergen Southern Norwegian Sea Central Norwegian Sea South of Jan Mayen Western Norwegian Sea Eastern Norwegian Sea Northwest Norwegian Sea West of Tromsø Bank Southwest Norwegian Sea The North Sea/Skagerrak FAO-area Norwegian area Eigersund Bank Skagerrak Viking Bank Southern North Sea Central North Sea Shetland Other areas in the Northeast Atlantic Ocean FAO-area Norwegian area The Baltic East of Faroe Islands West of Scotland Irish Sea Bristol Channel Outside Cornwall Rockall West of Ireland Southwest of Ireland Southeast of Iceland Southwest of Iceland Northwest of Iceland North of Horn (Iceland) North of Iceland Northeast of Iceland West of Faroe Islands Faroe Islands Bank East of Iceland Skjoldungen Denmark Strait Gammelock East of Queen Louise Land Reykjanes Ridge Azores Plateau West-European Basin Bay of Biscay Iberian Basin Northwest Atlantic Ocean FAO-area Norwegian area Baffin Island Disko Hellefisk Bank Banan Bank Fyllas Bank Fredrikshaab Bank Cap Farewell Labrador North Labrador South Hamilton Bank Ritu Bank North Grand Bank Flemish Cap Southeast Grand Bank Southwest Grand Bank St. Pierre Cape Ray Newfoundland West Anticosti Prince Edward North Sidney Banquerau Sable Island Bay of Fundy Gulf of Maine West of Chesapeake Bay North of Bermuda Outside the North Atlantic Ocean FAO-area Norwegian area East of Novaya Zemlya Eastern Central Atlantic Ocean (West-Africa) Southwest Atlantic Ocean Southeast Atlantic Ocean Western Indian Ocean Southwest Pacific Ocean (Australia/New Zealand) Pacific, Antartic 58 Statistics Norway
59 Appendix G Commodity groups in the tables of exports and imports Commodity group 1. Reared salmon, fresh, chilled or frozen 2. Herring and sprat, fresh, chilled or frozen, incl. fillets 3. Other fresh or chilled fish, incl. fillets 4. Other frozen fish, excl. fillets 5 Frozen fillets of fish, excl. herring 6. Salted herring, excl. fillets 7. Other salted fish, incl. fillets (also fillet of herring) 8. Stockfish (dried fish) 9. Klipfish (salted and dried) Commodity number , , , 4002, 4003, , 5002, 5003, , 2061, , , 1901, , 2105, 2106, , 2300, 2901, , 3200, 3300, 3400, 3500, 3600, 3900, , 5002, 5009, 6200, , 6502, 6503, 6504, , 6901, 6902, , 6905, 6906, 6907, , 1019, 1021, , 1040, 1051, 1059, , 1089, 1091, 1092, , , 2109, , 2909, 3101, , 3300, , 4200, 4300, 4400, 4500, 4600, 4900, , 7200, 7300, 7401, , , 7700, , 7902, 7903, , 7907, , 2020, 2033, , 2049, 2053, 2059, 2070, , 2092, 2093, 2094, , 6102, 6103, , 2009, 3003, 3004, , 3007, 3008, 3009, 6200, , 6902, 6903, 6904, , 5102, 5103, , 5902, 5904, , 5905, 5906, 5908 Statistics Norway 59
60 Varegrupper i tabellane om eksport og import (framh.) Commodity group 10. Crustaceans and molluscs, not canned 11. Oil of herring and other fish 12. Fish liver oil, excl. waste oil 13. Fish, prepared or canned, incl. caviare and caviare substitutes 14. Crustaceans and molluscs, prepared or canned 15. Meal and powder of fish, crustaceans or molluscs 16. Other products Commodity number , 1200, 1301, 1302, , 1409, 2100, , 2302, 2309, 2401, , 2101, 2109, 2901, , 3900, 4100, , 5900, 6000, 9101, 9102, 9109, , 2031, , 1093, , 1102, , 1202, 1203, 1204, 1205, 1206, 1301, 1309, 1400, 1500, , 1903, 1904, 1905, , 2002, 2004, 2005, 2006, 2007, 2009, 3001, , 2004, 2005, , 4000, 9001, , , , 9100, 9200, , 9902, , , 4200, , 9112, 9113, , 9192, 9193, , 1020, , , 3021, 3030, , , 0020, Statistics Norway
61 Appendix H The name of some marine animal species translated into different languages 1 Norwegian name Zoological name English name French name German name Fisk og skaldyr Pisces Crustacea Fish and crustaceans Poisson et crustacé Fisch und Krustentier Augepål Trisopterus esmarkii Norway pout Tracaud norvégien Stintdorsch Blåkveite Reinhardtius Greenland Flétan noir Schwarzer Heilbutt hippoglossoides halibut Blålange Molva dypterygia Blue ling Lingue bleue Blauleng Breiflabb Lophius piscatorius Anglerfish Baudroie Seeteufel Brisling Sprattus sprattus Sprat Esprot Sprott Brosme Brosme brosme Tusk, cusk Brosme Lumb Brugde Cetorhinus maximus Basking shark Pélerin Riesenhai Djupvassreke Pandalus borealis Deep water prawn Crevette nordique Tiefwasser Garnele Flekksteinbit Anarhichas minor Spotted catfish Loup tacheté Gefleckter Katfisch Gråsteinbit Anarchichas lupus Atlantic wolffish Loup atlantique Gestreifter katfisch (Catfish) Havål Conger conger Conger eel Congre Meeraal Hestmakrell Trachurus trachurus Horse mackerel Chirchard Bastardmakrele Hummar Homarus gammarus European lobster Homard Hummer Hyse Melanogrammus Haddock Eglefin Schellfish aeglefinus Håbrann Lamna nasus Porbeagle Taupe Heringshai Håkjerring Somniosus Greenland shark Laimargue Eishai microcephalus Kolmule Micromesistius poutassou Blue whiting Poutassou Blauer Wittling Kongekrabbe Paralithodes camtschaticus King crab Crabe royal Königskrabbe Krabbe (sjå Taskekrabbe) Kveite Hippoglossus hippo- Halibut Fletan Heilbutt glossus Kviting Merlangius merlangus Whiting Merlan Wittling Laks Salmo salar Salmon Saumon Lachs Lange Molva molva Ling Lingue Leng Lodde Mallotus villosus Capelin Capelan Lodde Lomre Microstomus kitt Lemon sole Limande sole Limande Lusuer Sebastes viviparus Red fish Petit sébaste - Kleiner Rotbarsch Lyr Pollachius pollachius Pollack Lieu jaune Pollack Lysing Merluccius merluccius Hake Merlu Seehecht Makrell Scomber scombrus Mackerel Maquereau Makrele Makrellhai Isurus oxyrinchus Mako shark Mako Makrelen hai Makrellstørje Thunnus thynnus Tunny, tuna Thon Thunfisch Pigghå Squalus acanthias Picked dogfish Aiguillat Dornhai Piggskate Raja clavata Thornback ray Raie bouclée Nagelrochen Piggvar Scophtalmus maximus Turbot Turbot Steinbutt Pir, årsmakrell Scomber scombrus Young mackerel Maquereau jeune Junge Makrele Polartorsk Boreogadus saida Polar cod Morue polaire Polardorsch Raudspette Pleuronectes platessa Plaice Plie, carrelet Scholle Regnbogeaure Oncorhynchus mykiss Rainbow trout Truite arc-en-ciel Regenbogenforelle Reke = sjå Djupvassreke Rognkjeks Cyclopterus lumpus Lumpsucker Lompe Seehase Røye Salvelinus alpinus Char Omble chevalier Seesaibling Sandflyndre Limanda limanda Dab Limande Kliesche Sei Pollachius virens Saithe Lieu noir Köhler, Seelachs Sild Clupea harengus Herring Hareng Hering Sjøaure Salmo trutta Sea trout Truite de mer Meerforelle Sjøkreps Nephrops norvegicus Norway lobster Langoustine Kaisergranat Skater (rokker) Rajiformes Skates and rayes Raie Rochen Skrei Gadus morhua Spawning cod Morue en fraie Laichdorsch Slettvar Scophthalmus rhombus Brill Barbue Glattbutt 1 Some of these species are not specified in the landing statistics. Statistics Norway 61
62 The name of some marine animal species translated into different languages 1 Norwegian name Zoological name English name French name German name Fisk og skaldyr (framh.) Smørflyndre Glyptocephalus cynoglossus Witch Plie grise Rotzunge Småsil, tobis Ammodytes tobianus Lesser sandeel Lançon équille Tobisfisch Snabeluer Sebastes mentella Deep-sea redfish Sébaste du nord Schnabelbarsch Steinbit Anarhichas spp. Catfishes Loup de mer Katfische Storskate Raja batis Common skate Pocheteau Glattrochen Straumsild Argentina sphyraena Lesser silver smelt Argentine Glasauge Taskekrabbe Cancer pagurus Edible crab Tourteau Taschenkreps Tobis (sjå Småsil og havsil) Torsk Gadus morhua Cod Morue Kabeljau, Dorsch Tretrådet tangbrosme Gaidropsarus vulgaris Three-bearded Motelle commune Dreibärtlige Seequappe rockling Tunge Solea vulgaris Sole Sole Seezunge Uer Sebastes marinus Golden redfish Sébaste Rotbarsch Vassild (Kvitlaks) Argentina silus Gr. silver smelt Grande argentine Goldlachs Vårtorsk Gadus morhua Finnmark young cod Morue du Finnmark Finnmarkdorsch Ål Anguilla anguilla Eel Anguille Aal Blautdyr Mollusca Mollusc Mollusque Molluske Akkar Ommastrephes sagittatus Flying squid Calmar Kalmar Blåskjell Mytilus edulis Blue mussel Moule commune Miesmuschel Hjerteskjell Cerastoderma edule Cockle Coque Herzmuschel Kamskjell Pecten maximus Scallop Coquille Saint Jacques Kammuschel O-skjell Modiolus modiolus Horse mussel Moule appatell Grosse Miesmuschel Sandskjell Mya arenaria Sand gaper Mye commune Sandmuschel Østers Ostrea edulis Common oyster Huitre plate Auster Sel Pinnipedia Seal Phoque Robbe Fjordsel Phoca vitulina Common seal Phoque commun Seehund Grønlandssel Phoca groenlandica Harp seal Phoque de Groenland Sattelrobbeicus Havert (gråsel) Halichoerus grypus Grey seal Phoque gris Kegelrobbe Kvalross Odobenus rosmarus Walrus Morse Walross Klappmyss Cystophora cristata Hooded seal Phoque a capuchon Klappmütze Ringsel Phoca hispida Ringed seal Phoque annelé Ringelrobbe Storkobbe Erignathus barbatus Bearded seal Phoque a barbe Bartrobbe Kval Cetacea Whale Baleine Walfisch Blåkval Balaenoptera musculus Blue whale Baleine bleue Blauwal Delfin Delphinus delphis Common dolphin Dauphin commun Gemeiner Delphin Finnkval Balaenoptera physalus Fin-whale Rorqual commun Finwal Grindkval Globicephala melaena Pilot whale Globicéphale Grindwale Grønlandskval Balaena mysticetus Greenland right Baleine franche Grönlandwal whale Kvitkval Delphinapterus leucas White whale (beluga) Dauphin blanc (béluga) Weisswal Knølkval Megaptera novaeangliae Humpback whale Jubarte Buckelwal Kvitnos Lagenorhynchus White beaked Dauphin a nez Weisschnauzenalbirostris dolphin blanc Delphin Kvitskjeving Lagenorhynchus acutus White-sided dolphin Dauphin a flancs Weisseiten Delphin blanc Narkval Monodon monoceros Narwhal Narval Narwal Nebbkval Hyperoodon rostratus Bottlenose Hyperoodon Entenwal Nise Phocoena phocoena Porpoise Marsouin Kleiner Tümmler Nordkaper Eubalaena glacialis Black right whale Baleine de Nordkaper Biscaie Seikval Balaenoptera borealis Sei whale Rorqual de Rudolphi Seiwal Spekkhoggar Orcinus orca Killer whale Orque Schwertwal Spermkval Physeter macrocephalus Sperm whale Cachalot Pottwal Tumler Tursiops truncatus Bottle-nosed Dauphin a gros nez Grosser Tümmler dolphin Vågekval Balaenoptera Minke whale Petit rorqual Zwergwal acutorostrata 1 Some of these species are not specified in the landing statistics. 62 Statistics Norway


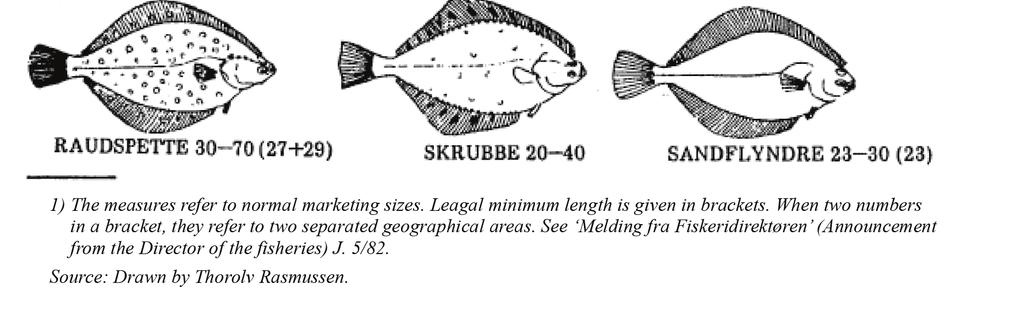
63 Appendix I Card over some marine animals 1. cm Statistics Norway 63

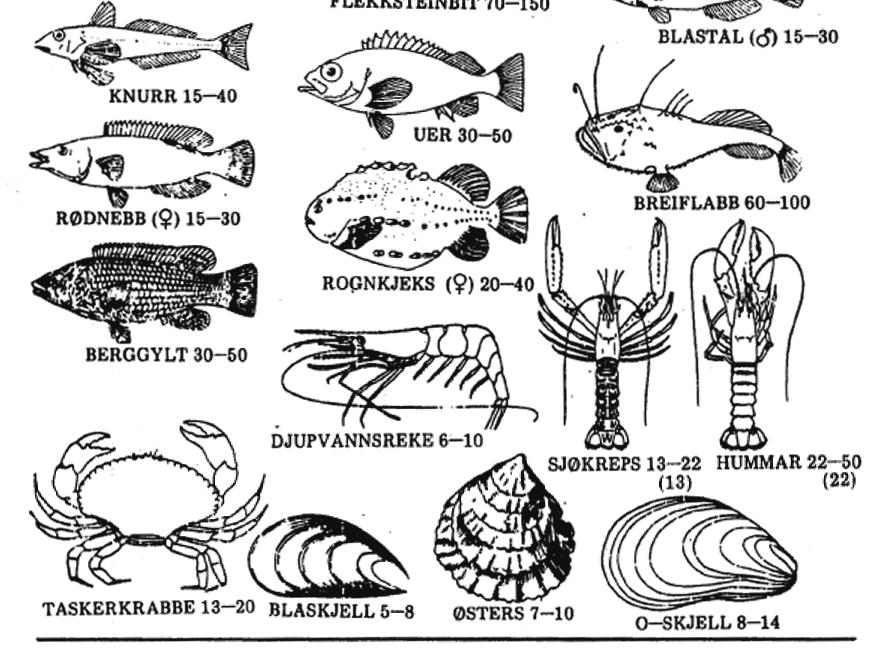
64 64 Statistics Norway
Fishery Statistics 2007
 Official Statistics of Norway D 428 Fishery Statistics 2007 Statistisk sentralbyrå Statistics Norway Oslo Kongsvinger Official Statistics of Norway This series consists mainly of primary statistics, statistics
Official Statistics of Norway D 422. Aquaculture Statistisk sentralbyrå Statistics Norway Oslo Kongsvinger
 Official Statistics of Norway D 422 Aquaculture 2007 Statistisk sentralbyrå Statistics Norway Oslo Kongsvinger Official Statistics of Norway This series consists mainly of primary statistics, statistics
Contents. Norwegian seafood production consumption and export 2. Fisheries and catches 8. Aquaculture 22. Research and innovation 30
 7 8 9 10 11 12 13 14 1 15 16 17 18 19 20 21 22 23 24 25 26 27 28 29 30 31 32 33 34 35 36 Facts about Fisheries and Aquaculture 2008 www.government.no Contents Norwegian seafood production consumption and
Nøkkeltall fra norsk havbruksnæring
 Nøkkeltall fra norsk havbruksnæring Key figures from aquaculture industry 2016 Livet i havet vårt felles ansvar Tittel (norsk/engelsk): Key figures from Norwegian aquaculture industry 2016 Ansvarlig avdeling:
Fishing mortality in relation to highest yield. Fishing mortality in relation to agreed target
 3.4 Stock summaries 3.4. Northeast Arctic cod State of the stock Spawning biomass in relation to precautionary limits Full reproductive capacity Fishing mortality in relation to precautionary limits/management
Contents. Norwegian seafood production consumption and export 2. Fisheries and catches 8. Aquaculture 22. Research and innovation 30
 Facts about Fisheries and Aquaculture 2009 www.government.no Contents Norwegian seafood production consumption and export 2 Fisheries and catches 8 Aquaculture 22 Research and innovation 30 Norwegian seafood
Effective Collaboration Between Scientists, Managers and Policy Makers
 2009/FWG/WKSP/007 Effective Collaboration Between Scientists, Managers and Policy Makers Submitted by: World Bank Workshop on Implementing Ecosystem Approaches to Fisheries in the Context of the Broader
3.4.3 Advice June Barents Sea and Norwegian Sea Cod in Subareas I and II (Norwegian coastal waters cod)
") 3.4.3 Advice June 2013 ECOREGION STOCK Barents Sea and Norwegian Sea Cod in Subareas I and II (Norwegian coastal waters cod) Advice for 2014 ICES advises on the basis of the Norwegian rebuilding plan,
3.4.3 Advice June 2013 ECOREGION STOCK Barents Sea and Norwegian Sea Cod in Subareas I and II (Norwegian coastal waters cod) Advice for 2014 ICES advises on the basis of the Norwegian rebuilding plan,
Norwegian fisheries and aquaculture management
 Norwegian fisheries and aquaculture management Tromsø, 21. September2017 The Ministry of Trade, Industry and Fisheries Minister of Trade and Industry Stat Sekretaries Political Adviser Minister of Fisheries
3.3.2 Cod (Gadus morhua) in subareas 1 and 2 (Northeast Arctic)
 in subareas 1 and 2 (Northeast Arctic)") ICES Advice on fishing opportunities, catch, and effort Barents Sea and Norwegian Sea Ecoregions Published 10 June 2016 3.3.2 Cod (Gadus morhua) in subareas 1 and 2 (Northeast Arctic) ICES stock advice
ICES Advice on fishing opportunities, catch, and effort Barents Sea and Norwegian Sea Ecoregions Published 10 June 2016 3.3.2 Cod (Gadus morhua) in subareas 1 and 2 (Northeast Arctic) ICES stock advice
FACTS ABOUT THE NORWEGIAN FISHERIES INDUSTRY
 FACTS ABOUT THE NORWEGIAN FISHERIES INDUSTRY 2000 m f acts about the Norwegian Fisheries Industry Norway is a coastal state with both a right and an obligation to manage one of the most productive sea
4.9.5 Norwegian spring-spawning herring
 4.9.5 Norwegian springspawning herring State of the stock Spawning biomass in relation to precautionary limits Acceptable Fishing mortality in relation to precautionary limits Acceptable Fishing mortality
Stock characteristics, fisheries and management of Greenland halibut (Reinhardtius hippoglossoides (Walbaum)) in the Northeast Arctic
) in the Northeast Arctic") The 10 th Norwegian Russian Symposium Stock characteristics, fisheries and management of Greenland halibut (Reinhardtius hippoglossoides (Walbaum)) in the Northeast Arctic by Kjell H. Nedreaas (IMR) &
The 10 th Norwegian Russian Symposium Stock characteristics, fisheries and management of Greenland halibut (Reinhardtius hippoglossoides (Walbaum)) in the Northeast Arctic by Kjell H. Nedreaas (IMR) &
9.4.5 Advice September Widely distributed and migratory stocks Herring in the Northeast Atlantic (Norwegian spring-spawning herring)
") 9.4.5 Advice September 212 ECOREGION STOCK Widely distributed and migratory stocks Herring in the Northeast Atlantic (Norwegian spring-spawning herring) Advice for 213 ICES advises on the basis of the
9.4.5 Advice September 212 ECOREGION STOCK Widely distributed and migratory stocks Herring in the Northeast Atlantic (Norwegian spring-spawning herring) Advice for 213 ICES advises on the basis of the
3.4 Stock Summaries Advice June 2011
 3.4 Stock Summaries 3.4.1 Advice June 211 ECOREGION STOCK Barents Sea and Norwegian Sea Cod in Subareas I and II (Northeast Arctic cod) Advice for 212 ICES advises on the basis of the Joint Russian Norwegian
Cod (Gadus morhua) in subareas 1 and 2 (Northeast Arctic)
 in subareas 1 and 2 (Northeast Arctic)") ICES Advice on fishing opportunities, catch, and effort Arctic Ocean, Barents Sea, Faroes, Greenland Sea, Published 13 June 2018 Icelandic Waters, and Norwegian Sea ecoregions https://doi.org/10.17895/ices.pub.4412
ICES Advice on fishing opportunities, catch, and effort Arctic Ocean, Barents Sea, Faroes, Greenland Sea, Published 13 June 2018 Icelandic Waters, and Norwegian Sea ecoregions https://doi.org/10.17895/ices.pub.4412
REDFISH in Sub-areas I and II. Nominal catch (t) by countries in Sub-area I, Divisions IIa and IIb combined as officially reported to ICES.
 by countries in Sub-area I, Divisions IIa and IIb combined as officially reported to ICES.") .1. Redfish in Sub-areas I and II Table.1..1 REDFISH in Sub-areas I and II. Nominal catch (t) by countries in Sub-area I, Divisions IIa and IIb combined as officially reported to ICES. Year Can Den Faroe
.1. Redfish in Sub-areas I and II Table.1..1 REDFISH in Sub-areas I and II. Nominal catch (t) by countries in Sub-area I, Divisions IIa and IIb combined as officially reported to ICES. Year Can Den Faroe
Arctic Frontiers, Tromsø, January 24 th Thorbjørn Thorvik, Senior adviser. The Norwegian Directorate of Fisheries.
 Sustainable harvesting at lower trophic levels: The Norwegian management plan for Calanus finmarchicus and the framework for utilizing mesopelagic species Thorbjørn Thorvik, Senior adviser. The Norwegian
The extent of IUU fishing in the Barents Sea
 The extent of IUU fishing in the Barents Sea Maren Esmark, WWF- Norway Anna Filippova, WWF- Russia Chatham House, London 10. november 2006 The Barents Sea a unique and rich marine ecosystem Atlantic cod
2.3.1 Advice May Capelin in Subareas V and XIV and Division IIa west of 5 W (Iceland East Greenland Jan Mayen area).
.") 2.3.1 Advice May 2014 ECOREGION Iceland and East Greenland STOCK Capelin in Subareas V and XIV and Division IIa west of 5 W (Iceland East Greenland Jan Mayen area) Advice for 2014/2015 ICES advises on
2.3.1 Advice May 2014 ECOREGION Iceland and East Greenland STOCK Capelin in Subareas V and XIV and Division IIa west of 5 W (Iceland East Greenland Jan Mayen area) Advice for 2014/2015 ICES advises on
Beaked redfish (Sebastes mentella) in subareas 1 and 2 (Northeast Arctic)
 in subareas 1 and 2 (Northeast Arctic)") ICES Advice on fishing opportunities, catch, and effort Arctic Ocean, Barents Sea, Faroes, Greenland Sea, Published 13 June 2017 Icelandic Waters, and Norwegian Sea Ecoregions DOI: 10.17895/ices.pub.3212
ICES Advice on fishing opportunities, catch, and effort Arctic Ocean, Barents Sea, Faroes, Greenland Sea, Published 13 June 2017 Icelandic Waters, and Norwegian Sea Ecoregions DOI: 10.17895/ices.pub.3212
Norwegian coastal fisheries An overview of the coastal fishing fleet of less than 21 meters
 Report 14/214 Published February 214 Norwegian coastal fisheries An overview of the coastal fishing fleet of less than 21 meters Edgar Henriksen Nofima is a business oriented research institute working
The surveillance and control programme
 Annual Reports 2008 The surveillance and control programme for Gyrodactylus salaris in Atlantic salmon and rainbow trout in Norway Tor Atle Mo Ann-Marit Kristensen Kari Norheim Peder Andreas Jansen Editor
Beaked redfish (Sebastes mentella) in subareas 1 and 2 (Northeast Arctic)
 in subareas 1 and 2 (Northeast Arctic)") ICES Advice on fishing opportunities, catch, and effort Arctic Ocean, Barents Sea, Faroes, Greenland Sea, Published 28 September 2018 Icelandic Waters, and Norwegian Sea Ecoregions DOI: 10.17895/ices.pub.4538
ICES Advice on fishing opportunities, catch, and effort Arctic Ocean, Barents Sea, Faroes, Greenland Sea, Published 28 September 2018 Icelandic Waters, and Norwegian Sea Ecoregions DOI: 10.17895/ices.pub.4538
Pelagic fishery for Sebastes mentella in the Irminger Sea
 3.2.6.d Pelagic fishery for Sebastes mentella in the Irminger Sea The stock structure of deep-sea redfish S. mentella in Sub-area XII, Division Va and Sub-area XIV and NAFO Div. 1F remains generally uncertain.
Advice June 2012
 2.4.1 Advice June 212 ECOREGION STOCK Iceland and East Greenland Beaked redfish (Sebastes mentella) in Subareas V, XII, and XIV and NAFO Subareas 1+2 (Deep pelagic stock > 5 m) Advice for 213 The advice
Implementation of fish transport and sailing patterns in NEMO SINTEF Technology and Society
 STF50 A05010 Open REPORT Implementation of fish transport and sailing patterns in NEMO SINTEF Technology and Society Transport safety and Informatics February 2005 2 TABLE OF CONTENTS PREFACE...4 1 BACKGROUND
SUMMARY OF ICES 2009 ADVICE FOR PELAGIC SPECIES incl Blue whiting, capelin, herring, Norway pout, sandeel and sprat
 SUMMARY OF ICES ADVICE FOR PELAGIC SPECIES incl Blue whiting, capelin, herring, Norway pout, BLUE WHITING Blue whiting combined stock Sub-areas I-IX, XII and XIV Status of stock in October 543,043 Due
ICES advice on fishing opportunities
 ICES Advice on fishing opportunities, catch, and effort Northeast Atlantic and Arctic Ocean Published 22 October 2018 Version 2: 25 October 2018 https://doi.org/10.17895/ices.pub.4568 Herring (Clupea harengus)
9.4.5 Advice October Widely Distributed and Migratory Stocks Herring in the Northeast Atlantic (Norwegian spring-spawning herring)
") 9.4.5 Advice October 21 ECOREGION STOCK Widely Distributed and Migratory Stocks Herring in the Northeast Atlantic (Norwegian spring-spawning herring) Advice for 211 Management Objective (s) Landings in
9.4.5 Advice October 21 ECOREGION STOCK Widely Distributed and Migratory Stocks Herring in the Northeast Atlantic (Norwegian spring-spawning herring) Advice for 211 Management Objective (s) Landings in
FISHERY BY-PRODUCT REPORT
 FISHERY BY-PRODUCT REPORT IFFO GLOBAL STANDARD FOR RESPONSIBLE SUPPLY OF FISHMEAL AND FISH OIL FISHERY By-Product: LOCATION: Cod (Gadus morhua) North-East Atlantic (Norway) DATE OF REPORT: 10/11/15 ASSESSOR:
The surveillance and control programme
 Annual Reports 2009 Surveillance and control programmes for terrestrial and aquatic animals in Norway The surveillance and control programme for Gyrodactylus salaris in Atlantic salmon and rainbow trout
5. purse seines 3 000
 Sea Bass Q and A Latest News What have the 28 Member States decided on 2 July? The EU has today taken another step to protect sea bass. The 28 EU member states agreed to the Commission's proposal to increase
THE NORWEGIAN STRUCTURAL POLICY - MAINTAINING PRODUCTIVITY GROWTH WITH A LIMITED NATURAL RESOURCE.
 THE NORWEGIAN STRUCTURAL POLICY - MAINTAINING PRODUCTIVITY GROWTH WITH A LIMITED NATURAL RESOURCE. Rolv Dahl-Jørgensen, The Norwegian Ministry of Fisheries and Coastal Affairs, rdj@fkd.dep.no ABSTRACT
Northeast Atlantic Mackerel, Handlines
 Northeast Atlantic Mackerel, Handlines Northeast Atlantic Mackerel, Handlines Content last updated 3rd Apr 2017 Stock: Mackerel (Scomber scombrus) in subareas 1 7 and 14, and in divisions 8.a e and 9.a
The surveillance programme for Gyrodactylus salaris in Atlantic salmon and rainbow trout in Norway 2013
 Annual Report 2013 Surveillance programmes for terrestrial and aquatic animals in Norway The surveillance programme for Gyrodactylus salaris in Atlantic salmon and rainbow trout in Norway 2013 Sigurd Hytterød
While oil and gas is the nations largest export product in value, fish is the second largest. Both activities are crucial for the Norwegian economy.
 Oil and fish in Norwegian waters conflict or coexistence? Kristoffersen Arne, Norwegian Coastal Fishermen Union representative, Norway 1. Presentation: Arne Helge Kristoffersen: Representative from the
Blue whiting (Micromesistius poutassou) in subareas 1 9, 12, and 14 (Northeast Atlantic and adjacent waters)
 in subareas 1 9, 12, and 14 (Northeast Atlantic and adjacent waters)") ICES Advice on fishing opportunities, catch, and effort Ecoregions of the Northeast Atlantic and Arctic Ocean Published 29 September 2017 DOI: 10.17895/ices.pub.3030 Blue whiting (Micromesistius poutassou)
ICES Advice on fishing opportunities, catch, and effort Ecoregions of the Northeast Atlantic and Arctic Ocean Published 29 September 2017 DOI: 10.17895/ices.pub.3030 Blue whiting (Micromesistius poutassou)
FISHERIES CO-OPERATION ICELAND AND NORWAY WITH. Presented by Philip Rodgers ERINSHORE ECONOMICS
 FISHERIES CO-OPERATION WITH ICELAND AND NORWAY Presented by Philip Rodgers 17/12/2013 Fisheries Cooperation with Norway and Iceland 1 Objective To consider the current situation in the fishery for highly
Sustainable Fisheries for Future Generations The Fisheries White Paper
 Sustainable Fisheries for Future Generations The Fisheries White Paper Key messages The Fisheries White Paper Sustainable Fisheries for Future Generations charts the course for a sustainable and profitable
Annual Report Norwegian Veterinary Institute. Norwegian Veterinary Institute
 Annual Report 2014 Surveillance programmes for terrestrial and aquatic animals in Norway Annual report 2014 Project managers at the : Ståle Sviland (Terrestrial animals) Anne-Gerd Gjevre (Aquatic animals)
Blue whiting (Micromesistius poutassou) in subareas 1 9, 12, and 14 (Northeast Atlantic and adjacent waters)
 in subareas 1 9, 12, and 14 (Northeast Atlantic and adjacent waters)") ICES Advice on fishing opportunities, catch, and effort Ecoregions of the Northeast Atlantic and Arctic Ocean Published 28 September 2018 nea https://doi.org/10.17895/ices.pub.4536 Blue whiting (Micromesistius
ICES Advice on fishing opportunities, catch, and effort Ecoregions of the Northeast Atlantic and Arctic Ocean Published 28 September 2018 nea https://doi.org/10.17895/ices.pub.4536 Blue whiting (Micromesistius
3.3.2 Advice June 2014
 3.3.2 Advice June 2014 ECOREGION STOCK Barents Sea and Norwegian Sea Cod in Subareas I and II (Northeast Arctic cod) Advice for 2015 ICES advises on the basis of the Joint Russian Norwegian Fisheries Commission
BY CATCH IN NORWAY. HOW IT WORKS?
 BY CATCH MANAGEMENT Discard ban in Norway : BY CATCH IN NORWAY. HOW IT WORKS? All catches that are dead or dying viable fish can be released back to the sea.(except snow crabs) List of species under the
Collaboration between the Institute of Marine Research, the fishing fleet and the fishing industry
 Collaboration between the Institute of Marine Research, the fishing fleet and the fishing industry Leif Nøttestad Principal scientist (PhD) Institute of Marine Research Bergen, Norway Chartered vessels
Saithe (Pollachius virens) in subareas 4 and 6, and in Division 3.a (North Sea, Rockall and West of Scotland, Skagerrak and Kattegat)
 in subareas 4 and 6, and in Division 3.a (North Sea, Rockall and West of Scotland, Skagerrak and Kattegat)") ICES Advice on fishing opportunities, catch, and effort Celtic Seas, Faroes, and Greater North Sea Ecoregions Published 30 June 2017 DOI: 10.17895/ices.pub.3206 Saithe (Pollachius virens) in subareas 4
ICES Advice on fishing opportunities, catch, and effort Celtic Seas, Faroes, and Greater North Sea Ecoregions Published 30 June 2017 DOI: 10.17895/ices.pub.3206 Saithe (Pollachius virens) in subareas 4
ICES Advice on fishing opportunities, catch, and effort Celtic Seas and Greater North Sea ecoregions Published 30 June 2016
 ICES Advice on fishing opportunities, catch, and effort Celtic Seas and Greater North Sea ecoregions Published 30 June 2016 5.3.57 Sea bass (Dicentrarchus labrax) in divisions 4.b c, 7.a, and 7.d h (central
FAO Congress Director Spain; Hildegunn Fure Osmundsvåg 06/10/2017
 FAO Congress 2017 Director Spain; Hildegunn Fure Osmundsvåg 06/10/2017 Kilde ; The institute of marine research 06.10.2017 Presentasjonstittel 2 The Norwegian Seafood Council Who are we? Established in
Spurdog (Squalus acanthias) in the Northeast Atlantic
 in the Northeast Atlantic") ICES Advice on fishing opportunities, catch, and effort Northeast Atlantic Published 11 October 2016 9.3.17 Spurdog (Squalus acanthias) in the Northeast Atlantic ICES stock advice ICES advises that when
ICES Advice on fishing opportunities, catch, and effort Northeast Atlantic Published 11 October 2016 9.3.17 Spurdog (Squalus acanthias) in the Northeast Atlantic ICES stock advice ICES advises that when
Report No. 27 to the Storting
 Ministry of Fisheries Report No. 27 to the Storting (2003-2004) Norway s policy on marine mammals Recommendation from the Ministry of Fisheries, 19 March 2004, approved in the Council of State on the same
OCEAN2012 Transforming European Fisheries
 OCEAN2012 Transforming European Fisheries European fisheries in crisis healthy oceans with abundant fish and wildlife Decades of intensive fishing in European waters have led to dramatic declines in once
Why has the cod stock recovered in the North Sea?
 Why has the cod stock recovered in the North Sea? Summary The expansion of European fisheries during the 1970s and 1980s resulted in high fishing pressure on stocks of cod, haddock, whiting and saithe
Advice June Capelin in Subareas V and XIV and Division IIa west of 5 W (Iceland East Greenland Jan Mayen area).
.") 2.4.12 Advice June 2012 ECOREGION Iceland and East Greenland STOCK Capelin in Subareas V and XIV and Division IIa west of 5 W (Iceland East Greenland Jan Mayen area) Advice for 2013 ICES advises on the
2.4.12 Advice June 2012 ECOREGION Iceland and East Greenland STOCK Capelin in Subareas V and XIV and Division IIa west of 5 W (Iceland East Greenland Jan Mayen area) Advice for 2013 ICES advises on the
Herring (Clupea harengus) in subdivisions and 32 (central Baltic Sea, excluding Gulf of Riga)
 in subdivisions and 32 (central Baltic Sea, excluding Gulf of Riga)") ICES Advice on fishing opportunities, catch, and effort Baltic Sea Ecoregion Published 31 May 2016 8.3.14 Herring (Clupea harengus) in subdivisions 25 29 and 32 (central Baltic Sea, excluding Gulf of Riga)
ICES Advice on fishing opportunities, catch, and effort Baltic Sea Ecoregion Published 31 May 2016 8.3.14 Herring (Clupea harengus) in subdivisions 25 29 and 32 (central Baltic Sea, excluding Gulf of Riga)
Fishery. Fishing vessels (Dept. of Finance)
") Fishery Fishing vessels (Dept. of Finance) The Newfoundland and Labrador fishery recorded a difficult year in 29 due to low market prices, continued pressure from low-cost producers, and an appreciating
Fishery Fishing vessels (Dept. of Finance) The Newfoundland and Labrador fishery recorded a difficult year in 29 due to low market prices, continued pressure from low-cost producers, and an appreciating
EcoQO on spawning stock biomass of commercial fish species 1
 EcoQO on spawning stock biomass of commercial fish species 1 Background Spawning stock biomass of commercial fish species is one of the Ecological Quality Objectives (EcoQOs) in the EcoQO system of the
Herring (Clupea harengus) in subdivisions 20 24, spring spawners (Skagerrak, Kattegat, and western Baltic)
 in subdivisions 20 24, spring spawners (Skagerrak, Kattegat, and western Baltic)") ICES Advice on fishing opportunities, catch, and effort Baltic Sea and Greater North Sea Ecoregions Published 31 May 2017 DOI: 10.17895/ices.pub.3126 Herring (Clupea harengus) in subdivisions 20 24, spring
ICES Advice on fishing opportunities, catch, and effort Baltic Sea and Greater North Sea Ecoregions Published 31 May 2017 DOI: 10.17895/ices.pub.3126 Herring (Clupea harengus) in subdivisions 20 24, spring
10.4 Advice May 2014
 10.4 Advice May 2014 ECOREGION STOCK North Atlantic Atlantic salmon at West Greenland Advice for 2014 The previous advice provided by ICES (2012) indicated that there were no mixed-stock fishery catch
REGULATIONS RELATING TO MESH SIZES, BYCATCHES AND MINIMUM SIZES, ETC., DURING FISHING OPERATIONS IN THE FISHERIES PROTECTION ZONE AROUND SVALBARD
 REGULATIONS AMENDING THE REGULATIONS RELATING TO MESH SIZES, BYCATCHES AND MINIMUM SIZES, ETC., DURING FISHING OPERATIONS IN THE FISHERIES PROTECTION ZONE AROUND SVALBARD On 5 January 2011, under sections
REGULATIONS RELATING TO SEA-WATER FISHERIES ************* REGULATIONS AMENDING PROVISIONS ON INFRINGEMENT FINES IN VARIOUS REGULATIONS
 REGULATIONS RELATING TO SEA-WATER FISHERIES ************* REGULATIONS AMENDING PROVISIONS ON INFRINGEMENT FINES IN VARIOUS REGULATIONS Adopted by the Ministry of Trade, Industry and Fisheries on 27 January
The Fisheries and Aquaculture Sector in LITHUANIA
 The Fisheries and Aquaculture Sector in LITHUANIA Introduction Source: Baltlanta Lithuania has a relatively short coastline of 90 km, and its territorial waters and exclusive economic zone in the Baltic
Sprat (Sprattus sprattus) in subdivisions (Baltic Sea)
 in subdivisions (Baltic Sea)") ICES Advice on fishing opportunities, catch, and effort Baltic Sea Ecoregion Published 31 May 2016 8.3.18 Sprat (Sprattus sprattus) in subdivisions 22 32 (Baltic Sea) ICES stock advice ICES advises that
ICES Advice on fishing opportunities, catch, and effort Baltic Sea Ecoregion Published 31 May 2016 8.3.18 Sprat (Sprattus sprattus) in subdivisions 22 32 (Baltic Sea) ICES stock advice ICES advises that
The Potential Economic Impact on Selected Fishing Fleet Segments of TACs Proposed by ACFM for 2004 (EIAA-model calculations)
") COMMISSION OF THE EUROPEAN COMMUNITIES Brussels, 21.2004 SEC(2004) 61 COMMISSION STAFF WORKING PAPER REPORT OF THE SCIENTIFIC, TECHNICAL AND ECONOMIC COMMITTEE FOR FISHERIES Subgroup on Economic Assessment
COMMISSION OF THE EUROPEAN COMMUNITIES Brussels, 21.2004 SEC(2004) 61 COMMISSION STAFF WORKING PAPER REPORT OF THE SCIENTIFIC, TECHNICAL AND ECONOMIC COMMITTEE FOR FISHERIES Subgroup on Economic Assessment
Statistical News Release
 PRE-RELEASE ACCESS - RESTRICTED UNTIL 9.30 AM on MAY 25, 2017 Statistical News Release A National Statistics Publication for Scotland May 25, 2017 PROVISIONAL SCOTTISH SEA FISHERIES STATISTICS 2016 Provisional
Atlantic cod, Norwegian Coastal cod, Gillnet
 Atlantic cod, Norwegian Coastal cod, Gillnet Content last updated 1st Aug 2017 Stock: Norwegian Coastal cod Management: Norway Atlantic cod, Norwegian Coastal cod, Gillnet Overview Atlantic cod, Gadus
SA2 + Div. 3K Redfish
 Fisheries and Oceans Pêches et Océans Canada Canada DFO Science Stock Status Report A2-15(21) entered the fishery in 1975 and averaged about 16,5 t from 1978-1986. The steady reduction in catches from
Herring (Clupea harengus) in subdivisions 20 24, spring spawners (Skagerrak, Kattegat, and western Baltic)
 in subdivisions 20 24, spring spawners (Skagerrak, Kattegat, and western Baltic)") ICES Advice on fishing opportunities, catch, and effort Baltic Sea and Greater North Sea Ecoregions Published 31 May 2018 https://doi.org/10.17895/ices.pub.4390 Herring (Clupea harengus) in subdivisions
ICES Advice on fishing opportunities, catch, and effort Baltic Sea and Greater North Sea Ecoregions Published 31 May 2018 https://doi.org/10.17895/ices.pub.4390 Herring (Clupea harengus) in subdivisions
EU request to ICES on in-year advice on haddock (Melanogrammus aeglefinus) in Division 7.a (Irish Sea)
 in Division 7.a (Irish Sea)") ICES Special Request Advice Celtic Seas Ecoregion Published 1 March 2017 EU request to ICES on in-year advice on haddock (Melanogrammus aeglefinus) in Division 7.a (Irish Sea) Advice summary Please note:
ICES Special Request Advice Celtic Seas Ecoregion Published 1 March 2017 EU request to ICES on in-year advice on haddock (Melanogrammus aeglefinus) in Division 7.a (Irish Sea) Advice summary Please note:
The surveillance programme for Gyrodactylus salaris in Atlantic salmon and rainbow trout in Norway 2017
 Annual Report The surveillance programme for Gyrodactylus salaris in Atlantic salmon and rainbow trout in Norway 2017 Norwegian Veterinary Institute The surveillance programme for Gyrodactylus salaris
COMMISSION OF THE EUROPEAN COMMUNITIES COMMUNICATION FROM THE COMMISSION. Fishing Opportunities for 2009 Policy Statement from the European Commission
 EN EN EN COMMISSION OF THE EUROPEAN COMMUNITIES Brussels, 30.5.2008 COM(2008) 331 final COMMUNICATION FROM THE COMMISSION Fishing Opportunities for 2009 Policy Statement from the European Commission EN
Task II historical data mining on bluefin tuna (BFT) caught. in Norway Introduction
 caught. in Norway Introduction") Task II historical data mining on bluefin tuna (BFT) caught in Norway 1950-1954 Magnus Tangen 1, Øyvind Tangen 2 and Leif Nøttestad 2 1 Årvollvegen 47, 4270 Åkrehamn, Norway 2 Institute of Marine Research,
Task II historical data mining on bluefin tuna (BFT) caught in Norway 1950-1954 Magnus Tangen 1, Øyvind Tangen 2 and Leif Nøttestad 2 1 Årvollvegen 47, 4270 Åkrehamn, Norway 2 Institute of Marine Research,
Overview 10/8/2015. October Pelagic Advice Pelagic AC 7 October 2015
 October Pelagic Advice Pelagic AC 7 October 2015 John Simmonds ICES ACOM Vice Chair Overview WG 1 Blue whiting NSS herring North Sea horse makerel WG 2 Stocks Northeast Atlantic mackerel Western horse
North East Atlantic Fisheries Baltic Sprat Whitepaper March 2011
 North East Atlantic Fisheries Baltic Sprat Whitepaper March 2011 1. Introduction Sprat is a clupeid fish found widely in the North East Atlantic area. Sprat is a relatively short-lived species. The stock
Screening report Serbia
 ORIGIN: COMMISSION WP ENLARGEMENT + COUNTRIES NEGOTIATING ACCESSION TO EU MD 103/15 20.05.15 Screening report Serbia Chapter 13 Fisheries Date of screening meetings: Explanatory meeting: 30 September 2014
QUOTAS -Setting and Sharing
 QUOTAS -Setting and Sharing A North East Atlantic Gordic Knot 1.Simpósio Internacional sobre o Manejo da Pesca Marinho no Brasil Brasilia, 06 a 08 de Julho de 2015 Johán H Williams Diretor Technico, Pesca
Leif Nøttestad, Øyvind Tangen and Svein Sundby
 Possible mechanisms and explanations for the drastic decline and disappearance of Atlantic bluefin tuna in the Norwegian fisheries since the early 1960s: What went wrong and what can we do? Leif Nøttestad,
Norway lobster (Nephrops norvegicus) in Division 4.a, Functional Unit 7 (northern North Sea, Fladen Ground)
 in Division 4.a, Functional Unit 7 (northern North Sea, Fladen Ground)") ICES Advice on fishing opportunities, catch, and effort Greater North Sea Ecoregion Published 11 November 2016 6.3.27 (update) Norway lobster (Nephrops norvegicus) in Division 4.a, Functional Unit 7 (northern
ICES Advice on fishing opportunities, catch, and effort Greater North Sea Ecoregion Published 11 November 2016 6.3.27 (update) Norway lobster (Nephrops norvegicus) in Division 4.a, Functional Unit 7 (northern
Mackerel (Scomber scombrus) in subareas 1 8 and 14, and in Division 9.a (the Northeast Atlantic and adjacent waters)
 in subareas 1 8 and 14, and in Division 9.a (the Northeast Atlantic and adjacent waters)") ICES Advice on fishing opportunities, catch, and effort Ecoregions in the Northeast Atlantic and Arctic Ocean Published 29 September 2017 DOI: 10.17895/ices.pub.3023 Mackerel (Scomber scombrus) in subareas
ICES Advice on fishing opportunities, catch, and effort Ecoregions in the Northeast Atlantic and Arctic Ocean Published 29 September 2017 DOI: 10.17895/ices.pub.3023 Mackerel (Scomber scombrus) in subareas
Advice June 2014
 5.3.23 Advice June 2014 ECOREGION STOCK Celtic Sea and West of Scotland Plaice in Division VIIa (Irish Sea) Advice for 2015 Based on ICES approach to data-limited stocks, ICES advises that catches should
Advice June, revised September Herring in Division IIIa and Subdivisions (Western Baltic spring spawners)
") 6.4.15 Advice June, revised September 21 ECOREGION STOCK North Sea and Baltic Herring in Division IIIa and Subdivisions 22 24 (Western Baltic spring spawners) Advice for 211 Management Objective (s) Catches
6.4.15 Advice June, revised September 21 ECOREGION STOCK North Sea and Baltic Herring in Division IIIa and Subdivisions 22 24 (Western Baltic spring spawners) Advice for 211 Management Objective (s) Catches
Fish Stock Status. 10 th November 2016 Seafish Common Language Group Friend s House, Euston Road, London NW1 2BJ
 Fish Stock Status 10 th November 2016 Seafish Common Language Group Friend s House, 173-177 Euston Road, London NW1 2BJ Dr Carl O Brien Defra Chief Fisheries Science Adviser UK Delegate to ICES Three main
6.3.8 Advice May 2014 Version 2, ECOREGION North Sea STOCK Herring in Division IIIa and Subdivisions (western Baltic spring spawners)
") 6.3.8 Advice May 2014 Version 2, 04-07-2014 ECOREGION North Sea STOCK Herring in Division IIIa and Subdivisions 22 24 (western Baltic spring spawners) Advice for 2015 ICES advises on the basis of the MSY
6.3.8 Advice May 2014 Version 2, 04-07-2014 ECOREGION North Sea STOCK Herring in Division IIIa and Subdivisions 22 24 (western Baltic spring spawners) Advice for 2015 ICES advises on the basis of the MSY
Golden redfish (Sebastes norvegicus) in subareas 5, 6, 12, and 14 (Iceland and Faroes grounds, West of Scotland, North of Azores, East of Greenland)
 in subareas 5, 6, 12, and 14 (Iceland and Faroes grounds, West of Scotland, North of Azores, East of Greenland)") ICES Advice on fishing opportunities, catch, and effort Arctic Ocean, Celtic Seas, Faroes, Greenland Sea, Icelandic Waters, Published 13 June 2017 Norwegian Sea, and Oceanic Northeast Atlantic Ecoregions
ICES Advice on fishing opportunities, catch, and effort Arctic Ocean, Celtic Seas, Faroes, Greenland Sea, Icelandic Waters, Published 13 June 2017 Norwegian Sea, and Oceanic Northeast Atlantic Ecoregions
Comparison of EU and US Fishery management Systems Ernesto Penas Principal Adviser DG Mare
 Comparison of EU and US Fishery management Systems Ernesto Penas Principal Adviser DG Mare Stock and Fisheries Status Seminar Brussels, 26 September 2017 Why comparing the EU and the US? Need to put the
(Non-legislative acts) REGULATIONS
 REGULATIONS") 31.10.2017 L 281/1 II (Non-legislative acts) REGULATIONS COUNCIL REGULATION (EU) 2017/1970 of 27 October 2017 fixing for 2018 the fishing opportunities for certain fish stocks and groups of fish stocks
31.10.2017 L 281/1 II (Non-legislative acts) REGULATIONS COUNCIL REGULATION (EU) 2017/1970 of 27 October 2017 fixing for 2018 the fishing opportunities for certain fish stocks and groups of fish stocks
Sandeel (Ammodytes spp.) in Divisions 3a, 4a, and 4b, SA 3 (Skagerrak and Kattegat, North and Central North Sea)
 in Divisions 3a, 4a, and 4b, SA 3 (Skagerrak and Kattegat, North and Central North Sea)") ICES Advice on fishing opportunities, catch and effort Greater North Sea Ecoregion Published 22 February 2016 6.3.39 Sandeel (Ammodytes spp.) in Divisions 3a, 4a, and 4b, SA 3 (Skagerrak and Kattegat,
ICES Advice on fishing opportunities, catch and effort Greater North Sea Ecoregion Published 22 February 2016 6.3.39 Sandeel (Ammodytes spp.) in Divisions 3a, 4a, and 4b, SA 3 (Skagerrak and Kattegat,
Map Showing NAFO Management Units
 Map Showing NAFO Management Units Biology Are 6 species of seals in Atlantic Canadian waters, all of which occur in Newfoundland Two Arctic Species (Ringed, Bearded) Two temperate (Grey, Harbour) Two migratory
ICES advice on fishing opportunities. ICES advises that when the MSY approach is applied, total removals in 2018 should be no more than 880 tonnes.
 ICES Advice on fishing opportunities, catch, and effort Celtic Seas and Greater North Sea ecoregions bss.27.4bc7ad-h Published 29 June 2018 Version 2: 2 July 2018 https://doi.org/10.17895/ices.pub.4472
Recent stock recovery and potential future developments in. Sebastes mentella in the Barents- and Norwegian Seas.
 Recent stock recovery and potential future developments in the fishery, The rise management, of the assessment beaked and redfish population of Sebastes mentella in the Barents- and Norwegian Seas. Benjamin
Plaice (Pleuronectes platessa) in Subarea 4 (North Sea) and Subdivision 20 (Skagerrak)
 in Subarea 4 (North Sea) and Subdivision 20 (Skagerrak)") ICES Advice on fishing opportunities, catch, and effort Greater North Sea Ecoregion Published 14 November 2017 DOI: 10.17895/ices.pub.3529 Plaice (Pleuronectes platessa) in Subarea 4 (North Sea) and Subdivision
ICES Advice on fishing opportunities, catch, and effort Greater North Sea Ecoregion Published 14 November 2017 DOI: 10.17895/ices.pub.3529 Plaice (Pleuronectes platessa) in Subarea 4 (North Sea) and Subdivision
Please note: The present advice replaces the advice given in June 2017 for catches in 2018.
 ICES Advice on fishing opportunities, catch, and effort Greater North Sea Ecoregion Published 14 November 2017 Version 2: 6 December 2017 DOI: 10.17895/ices.pub.3528 Sole (Solea solea) in Subarea 4 (North
Sprat (Sprattus sprattus) in Division 3.a (Skagerrak and Kattegat)
 in Division 3.a (Skagerrak and Kattegat)") ICES Advice on fishing opportunities, catch, and effort Greater North Sea Ecoregion Published 07 April 2017 DOI: 10.17895/ices.pub.3256 Sprat (Sprattus sprattus) in Division 3.a (Skagerrak and Kattegat)
ICES Advice on fishing opportunities, catch, and effort Greater North Sea Ecoregion Published 07 April 2017 DOI: 10.17895/ices.pub.3256 Sprat (Sprattus sprattus) in Division 3.a (Skagerrak and Kattegat)
Use of a reference fleet of fishing vessels for collection of data
 The 11 th Joint Russian-Norwegian Symposium. ECOSYSTEM DYNAMICS AND OPTIMAL LONG-TERM HARVEST IN THE BARENTS SEA FISHERIES. Murmansk, PINRO, 15-17 August 2005 Use of a reference fleet of fishing vessels
6.4 Stock summaries Advice June 2012
 6.4 Stock summaries 6.4.1 Advice June 2012 ECOREGION STOCK North Sea Cod in Division IIIa East (Kattegat) Advice for 2013 ICES advises on the basis of precautionary considerations that there should be
Sprat (Sprattus sprattus) in Subarea 4 (North Sea)
 in Subarea 4 (North Sea)") ICES Advice on fishing opportunities, catch, and effort Greater North Sea Ecoregion Published 30 June 2016 6.3.51 Sprat (Sprattus sprattus) in Subarea 4 (North Sea) ICES stock advice ICES provides catch
ICES Advice on fishing opportunities, catch, and effort Greater North Sea Ecoregion Published 30 June 2016 6.3.51 Sprat (Sprattus sprattus) in Subarea 4 (North Sea) ICES stock advice ICES provides catch
Council CNL(14)45 The management approach to salmon fisheries in Norway (Tabled by Norway)
45 The management approach to salmon fisheries in Norway (Tabled by Norway)") Agenda Item 6.2 Agenda Item 6.2 For Information Council CNL(14)45 The management approach to salmon fisheries in Norway (Tabled by Norway) 1983 1985 1987 1989 1991 1993 1995 1997 1999 2001 2003 2005 2007
Agenda Item 6.2 Agenda Item 6.2 For Information Council CNL(14)45 The management approach to salmon fisheries in Norway (Tabled by Norway) 1983 1985 1987 1989 1991 1993 1995 1997 1999 2001 2003 2005 2007
Proposal for a COUNCIL REGULATION
 EUROPEAN COMMISSION Brussels, 31.8.2018 COM(2018) 608 final 2018/0320 (NLE) Proposal for a COUNCIL REGULATION fixing for 2019 the fishing opportunities for certain fish stocks and groups of fish stocks
Council CNL(14)29. Annual Progress Report on Actions Taken Under Implementation Plans for the Calendar Year Russian Federation
29. Annual Progress Report on Actions Taken Under Implementation Plans for the Calendar Year Russian Federation") Agenda Item 6.1 For Information Council CNL(14)29 Annual Progress Report on Actions Taken Under Implementation Plans for the Calendar Year 2013 Russian Federation CNL(14)29 Annual Progress Report on Actions
Agenda Item 6.1 For Information Council CNL(14)29 Annual Progress Report on Actions Taken Under Implementation Plans for the Calendar Year 2013 Russian Federation CNL(14)29 Annual Progress Report on Actions
Advice June Sole in Division IIIa and Subdivisions (Skagerrak, Kattegat, and the Belts)
") 6.3.26 Advice June 2014 ECOREGION STOCK North Sea Sole in Division IIIa and Subdivisions 22 24 (Skagerrak, Kattegat, and the Belts) Advice for 2015 ICES advises on the basis of the MSY approach that catches
6.3.26 Advice June 2014 ECOREGION STOCK North Sea Sole in Division IIIa and Subdivisions 22 24 (Skagerrak, Kattegat, and the Belts) Advice for 2015 ICES advises on the basis of the MSY approach that catches
85% 57% Towards the recovery of European Fisheries. Healthy stocks produce more fish. of European fish stocks are below healthy levels
 Towards the recovery of European Fisheries NOVEMBER 2016 Healthy stocks produce more fish To get the full picture of European fisheries, Oceana has commissioned the most comprehensive scientific study