Implementation of fish transport and sailing patterns in NEMO SINTEF Technology and Society
|
|
|
- Elizabeth Anabel Reynolds
- 5 years ago
- Views:
Transcription
1 STF50 A05010 Open REPORT Implementation of fish transport and sailing patterns in NEMO SINTEF Technology and Society Transport safety and Informatics February 2005
2
3 2 TABLE OF CONTENTS PREFACE BACKGROUND AND DELIMITATIONS BACKGROUND DELIMITATIONS DATA SOURCES NETWORK OD MATRICES COSTS COMMODITY GROUPS FISHING VESSELS OVERALL STATISTICS TRANSPORT OF FISH FREIGHT MATRICES VESSEL TRANSPORT PATTERN NETWORK MODE FISHING GROUNDS (ZONES) FISHING HARBOURS (NODES) LINKS TRANSFERS COST FUNCTIONS LINK COST VEHICLE COST FUNCTION TEST SCENARIO 0: CURRENT SITUATION SCENARIO 1: REDUCTION IN NUMBER OF FISHING HARBOURS SAILING PATTERN EVALUATION AND CONCLUDING REMARKS EVALUATION OF THE FISHERY MODEL FUTURE UTILISATION OF SATELLITE-BASED VESSEL MONITORING SYSTEMS CONCLUDING REMARKS REFERENCES...37 APPENDIX A: MAPS OF FISHING GROUNDS...38 APPENDIX B: FISH CATEGORIES...47 APPENDIX C: CONSERVATION CATEGORIES...53 APPENDIX D: GEOGRAPHICAL DISTRIBUTION OF THE CATCH...54 APPENDIX E: NEMO FISHERY ZONES...56 APPENDIX F: DELIVERY ZONES WITH LESS THAN 100 TONNES CATCH DELIVERED PER YEAR.58
4 3 APPENDIX G: COST FUNCTIONS AND PARAMETER VALUES IN THE FISHERY MODEL...60 APPENDIX H: ASSIGNMENT PLOTS SCENARIO APPENDIX I: ASSIGNMENT PLOTS SCENARIO
5
6
7 5 1 Background and delimitations 1.1 Background The national freight transport model in Norway is named NEMO. Until now, transport of fish from catching to landing has not been included in the model. In a tendering procedure, NTP-Transportanalyser chose SINTEF to implement transport of fish from catching to landing, and the corresponding sailing patterns in NEMO. The implementation is carried out by developing a sub model, hereafter named the fishery model, in NEMO. The fishery model handles all transport of fish from the fishing grounds to Norwegian landing municipalities, and describe movements of the fishing fleet. This report describes the work with establishing the fishery model. The main part of the report contains a description of the data sources and methods used. The report also describes results from function tests of the model, represented by two cases and a demonstration of using the model for assignment of vessel movements. Details regarding the model input are put in appendices. NEMO is composed of four major elements: 1. Networks, representing links, zones, transfers, etc. in the infrastructure for road, sea and rail 2. Cost functions, representing costs related to freight transport on links and transfers 3. Annual freight volume matrices describing transport for 13 different commodity groups between pairs of municipalities on the mainland (domestic transport), between zones on the continental shelf and municipalities on the mainland (offshore transport), and between Norwegian municipalities and abroad zones (transport related to import/export) 4. Optimization algorithms, allowing the model to choose the transport solution which minimize total transport costs in the system A detailed presentation of NEMO is provided by Vold et al (2002) and Madslien and Andersen (2004). 1.2 Delimitations The fishery model covers all catch of wild fish and shellfish. The following delimitations have been made: River and river systems fishery are not included Farmed fish and shellfish, both land and sea based constructions, are not included Catch registered in the foreign trade statistics is not included 1. Therefore, catch from foreign vessels and catch delivered directly to non-norwegian regions is not taken into account. There are no one-to-one relationships between the landed fish volumes and the consecutive transport volumes from the production facilities to the market. After the fish has been processed and packed, both volumes and product values will have changed. A total implementation of this in NEMO requires a detailed study of the volumes to and from the production facilities, and an elaboration of how to implement this in the model. Harmonization of matrices is also required due to the fact that NEMO matrices are based on transport of production volumes that exceeds consume in one region. This means that only the fish that is not consumed in the landed region 1 To enable later full integration and simultaneous assignments in NEMO it is important to avoid double-counting volumes
8 6 should be considered in a full-integrated NEMO. For these reasons, it was decided to develop the fishery model as a sub model in NEMO. The land-based domestic network in existing NEMO is based on matrices describing transport between municipalities, as illustrated in the upper box in Figure 1. The fishery model however, is based on matrices describing transport from the fishing grounds to the landing municipalities, as illustrated in the lower box. Municipality 1 Municipality 2 Municipality 3. Municipality n Municipality 1 Municipality 2 Municipality 3... Municipality n Fishing ground 1 Fishing ground 2 Fishing ground 3. Fishing ground n Figure 1: Model focus Municipality 1 Municipality 2 Municipality 3... Municipality n The fishery model covers transport from the fishing ground to the landing municipality only, as illustrated in the lower box in Figure 1. In this project, actually two variants of the model are established: One describes the distribution of tonnes of fish and corresponds to NEMO. The other describes the sailing patterns (distribution of trips) made by the fishing vessels. This latter model includes all trips that is, both the transport with fish from the fishing grounds to the delivery harbour and the trips made without fish (from home harbour to the fishing grounds and the return from the delivery harbour to home harbour). The two variants will use the same networks and optimization algorithms, but will have different sets of matrices and cost functions. The unit of the assignment results will differ between the two variants; the first will assign tonnes, while the other will assign trips. Both variants are described in this report.
9 7 2 Data sources 2.1 Network When establishing sea networks for use in strategic models, one of the main challenges is that the vessels will not follow any particular route. Freighters can be assumed to follow defined fairways, but this is not the situation regarding most fishing vessels. Any attempt to establish a traditional network and forcing the vessels to stay on it will result in wrong estimations of travel distance. In the beginning of this project, various solutions regarding construction of a sea network were discussed. In the end it was decided to establish a network with direct links between the fishing grounds and each landing municipality and between the home municipality of the vessels and the fishing grounds. One important reason for this decision was the fact that Statistics Norway had already established a GIS model calculating lengths between the fishing grounds and a set of municipalities based on 1996 statistics from the Directorate of Fisheries. The results from these calculations are already used in official reports (Flugsrud and Rypdal, 1996 and Tornsjø, 2001). The results were made available to us. To establish such a model is very time-consuming and not possible within this project. The estimates from the Statistics Norway model were assumed to be more reliable than any other estimates of distances it would be possible to come up with within the time available in this project. However, the input from Statistics Norway can only be used in networks with direct links. Unfortunately, the estimates from Statistics Norway did not cover all the relations required in the fishery model, so it was necessary to estimate the remaining distances manually. Another advantage by choosing a network of direct links is that it can be very efficiently established by a simple batch file. This makes it simple to implement and simple to change. The disadvantages of a direct link network are poor plots and poor possibilities of visual presentation of the transport patterns. An evaluation of the network type is given in section OD matrices Several possible data sources were examined, but in the end it was clear that the statistics produced by the Directorate of Fisheries would constitute our main source of information. This statistics contains information on each landing made by Norwegian vessels and all landing to Norwegian harbours. The figures both describe the characteristics of the catch and characteristics of the vessel that makes the landing. In this project, it was necessary to obtain information on both the catch and the number of trips made by different types of vessels. Usually, one document is filled in per landing, but when there are several buyers or the vessel has been in areas with different quota regulations etc, more than one document are filled in. Thus, there is no one-to-one relationship between the number of documents and the number of trips. In order to calculate these figures correctly and avoid double-counting of tonnes or trips, two separate extracts were made from this statistics. In addition to the information from the Directorate of Fisheries, we have been in contact with the foreign trade statistics at Statistics Norway and the Directorate of Customs and Excise to clarify the definition of the various catch statistics produced by different organisations. It is important to know exactly what is included and excluded in order to avoid double-counting catch in NEMO. In order to avoid random fluctuations to influence the results, the estimates were based on average values for 2001 and During the project period, only preliminary figures for 2003 were
10 8 available. These preliminary figures will be corrected before the status are changed from preliminary to final - among other things the origin of the catch will be examined, and changes will be done to improve the declaration of fishing grounds. For some of the vessel types this may affect our model input significantly. Hence, it was decided to use average of the final figures for 2001 and 2002 in the model. When it comes to geographical level of detail, the catch is reported on zone 2 level. Each fishing ground is divided into a set of zones. Maps of the fishing grounds and zones are presented in appendix A. Each zone is the jurisdiction of a country. Hence, a main sector may be composed by zones where several countries have interests. Norway has interests in three categories of zones with the following notation: NOR (Norwegian economic zone) XSV (protection zone around Svalbard) XJM (fisheries zone around Jan Mayen) The country jurisdiction has not been taken into account in the modelling. All catch by Norwegian vessels landed in Norwegian harbours is included, regardless of origin zone or jurisdiction. The reason for this is that all catch landed in Norway will give load to and put strain on Norwegian infrastructure, and should consequently be taken into account when making plans for fishing harbours. An important reason for working on main sector level is that the statistics are not very reliable on a more detailed level, in particular for the larger vessels. These vessels often cover several zones on one trip, but the landing documents gives room for only one zone. Hence, it is not recommended to use the statistics on zone level. Furthermore, only a limited number of centroids can be included in NEMO. Thus using the smaller fishing areas for zones in NEMO would exceed this limit. The Directorate of Fisheries continuously works on improving the quality of the statistics. At present, details about the actual harbour receiving the catch are being implemented. However this work is not completed, so for now it is only possible to point out the place of landing by municipality. 2.3 Costs The cost functions already implemented in NEMO have formed the basis for the cost functions applied in the fishery model. NEMO contains of 13 commodity groups, where group 1 is general food (including fish that is not fresh or frozen), group 2 is frozen fish, and group 11 is fresh fish. To have consistency, the cost functions in the fishery model should not deviate too much from the corresponding cost functions already implemented in NEMO. The cost functions must be compared and calibrated to avoid unexpected and unreliable choices of transport solutions in future simultaneous network assignments. The existing cost functions were studied carefully and cost terms were adjusted only when better and more relevant information for the particular transport of fish by fishing vessels was found. Several phone calls and contacts to various producers of vessels, interest groups and industrial bodies etc were made, but it was very difficult to find figures on time-dependent or distance- 2 Be aware that zone in this aspect is not equivalent with the NEMO zones, presented in section 6.2.
11 9 dependent costs for this particular type of transport. Finally, average estimates 3 of speed, use of fuel, insurance and vessel maintenance were calculated based on combining results from Statistics Norway (Flugsrud and Rypdal, 1996 and Tornsjø, 2001) and the profitability analysis from the Directorate of Fisheries. The assumptions and conclusions have been presented and discussed with fishermen to have their opinion and trade knowledge on discounts on fuel etc. 3 The costs are in 2002 prices in order to match the OD matrices in the fishery model. It is important to notice that this does not correspond with the time basis for matrices and prices in existing NEMO. Analysing results of simultaneous assignment of all commodity groups should take this into account.
12 10 3 Commodity groups There are numerous species of fish and shellfish. Various principals for categorization of collected data have been discussed, and the following four categories were chosen due to their relatively homogeneous character from a logistical point of view: a. Pelagic fish (mackerel, herring, sardinellas, anchovy, blue whiting, etc.) b. Other fish (salmon, trout, tuna, redfishes, halibut, flounders, cod, pollock, catfish, etc.) c. Prawns d. Other shellfish and molluscs (krill, crab, lobster, oysters, clams, scallops, squid etc.) The logistical homogeneity will be reduced when aggregating the groups. A detailed description of the various fish species in each of the four categories is given in appendix B. As already mentioned, in the existing version of NEMO there are already three commodity groups that involve fish: Fresh fish in commodity group 11 Frozen fish in commodity group 2 Processed fish in commodity group 1 In order to reflect these principles in the fishery model, it was decided to use similar categories of conservation: Fresh fish (fresh, ice-covered, rfw/rsw/sws 4 in tank) Frozen fish (frozen, boiled in brine, etc) Other (smoked, salted, dried, etc.) A detailed description of the various ways of conservation belonging to each of these categories is given in appendix C. The two dimensions of fish category and conservation gives altogether 12 OD matrices. Ideally, for planning of strategic fishery harbours this level of detail would ensure possibilities for landing of all types of fish in the fishery model. However, the existing OD matrices for each commodity group are separated in domestic and international flows. Hence, already 26 matrices are included in the NEMO data bank to describe this transport (Madslien and Andersen, 2004), and it will not be possible to simultaneously assign 12 more matrices. Thus, the matrices are aggregated to reflect the three main categories of conservation. It is defined three new commodity groups for use in the fishery model: Commodity group 14: Fresh fish catch 5 (includes fresh products of pelagic, other fish, prawns, other shellfish and molluscs, numbered a-d above) Commodity group 15: Frozen fish catch 6 (includes frozen products of pelagic, other fish, prawns, other shellfish and molluscs, numbered a-d above) Commodity group 16: Other fish catch 7 (includes other conservations of pelagic, other fish, prawns, other shellfish and molluscs, numbered a-d above) One main reason for introducing new commodity groups is that transport of fish from catching to landing cannot be done by land-based modes. In order to allow the pricing out of land-based 4 Rfw: refrigerated fresh water, Rsw: refrigerated sea water, Sws: Seawater slush 5 Norwegian: Fiskefangst fersk 6 Norwegian: Fiskefangst frosset 7 Norwegian: Fiskefangst annet
13 modes for catch of fish, the catch must be defined as separate commodity groups. In the existing NEMO commodity groups 1, 2 and 11 are allowed to use all modes in the model. Thus, when simultaneously assigning all commodity groups, fish catch cannot be excluded from the landbased modes if not defined as separate commodity groups. To allow this commodity to use landbased modes would result in unrealistic mode use. For separate assignments of fish catch, it would be necessary to change cost functions related to commodity group 1, 2 and 11 to make them better reflect the characteristics of fish catch. However, such changes must be removed before assignments of the original commodity groups can be done. By introducing separate commodity groups for fish catch, the problem with land-based modes and mixing of cost functions are avoided. 11
14 12 4 Fishing vessels Making a consistent and clear categorization of the fleet turned out to be difficult. Even the Directorate of Fisheries uses various groupings dependent on the type of information that is to be presented. Initially, we wanted information reflecting the vessels with various sailing patterns: Vessels with ring nets (mainly pelagic fishery), recognised as a dynamic fleet (mostly industrial catch), and characterised by long distances and unpredictable routes due to selling of fish by auctions Fresh fish trawlers with trips of 7-10 days length Factory trawlers that can have trips of 6 weeks length Smacks that will return with the catch on the same day It was necessary to compromise based on what we initially wanted and what could be established from official statistics. The vessels were therefore categorized by the two dimensions: fishing tool and length of the vessel. In earlier studies, 28 meters has been used to separate the coastal fishing fleet from the deep sea fishing fleet. It was decided to use 28 meters to separate these two fleets also in the fishery model. For further grouping, the vessels were categorized by the type of tools used to catch the fish. Four tool categories were used: Seine Trawl Conventional Other The two dimensions length and tool category will in theory give 8 combinations describing the trip patterns. However, no vessel of length over 28 meters has reported catch by any other tool than seine, trawl or conventional tools, so in practice there are only 7 combinations present in the data material Due to capacity restrictions in NEMO, it was necessary to aggregate the information during implementation. The representation of fishing vessels in the model is presented in section 6.1.
15 13 5 Overall statistics 5.1 Transport of fish In total, the data material holds information about catch reported from 56 different fishing grounds. The geographical distribution on fishing grounds of various types of catch can be seen in appendix D. The fish is landed to 213 municipalities. Table 1 presents the distribution of catch by the various categories defined by fish type and conservation method. Table 1: Conservation method Average catch quantities per year *) per fish type and conservation method Pelagic [tonne] Other fish [tonne] Fish type Prawn [tonne] Other shellfish [tonne] Total [tonne] Fresh Frozen Other Total *) Average of 2001 and 2002 As seen in Table 1, the conservation method varies between the fish types. For Pelagic fish the main part, about 97%, is landed fresh. Also for Prawns the main part (90%) is landed fresh. Other shellfish mainly consists of crabs, while Other fish is mostly pollock and cod. For these categories the main part of the catch is landed with conservation method other, which means that the catch is smoked, salted, dried or similar. 5.2 Freight matrices This section gives a brief presentation of comparison of freight matrices including fish in the existing NEMO model and the new fishery model. As mentioned, the NEMO commodity groups 2 and 11 represent frozen and fresh fish respectively, while commodity group 1 consists of other categories of food, including fish which has undergone other kinds of processing. The fishery model introduces three new commodity groups: fresh fish catch (commodity group 14), frozen fish catch (group 15) and other fish catch (group 16). Intuitively, it can be worthwhile to compare the volumes on commodity groups 14 and 15 with the corresponding in the NEMO model, commodity groups 2 and 11. The other food products in NEMO cannot be directly compared to the other fish catch category in the fishery model, and these are therefore left out from this section. The NEMO fish matrices hold information of about nearly 6.2 million tonnes of fish products shipped from Norwegian municipalities (see Table 2). Table 2: Volumes (1000 tonnes) from Norwegian municipalities in domestic and foreign trade matrices for existing NEMO commodity groups for fish TOTAL Of this: Internal in zone Resulting for assignment In NEMO Domestic Foreign SUM Domestic Foreign SUM Domestic Foreign SUM Fresh fish (11) Frozen fish (2) SUM
16 14 Roughly 1/3 of this volume is fresh and 2/3 is frozen fish. Slightly more than 1 million tonnes are excluded from the network assignment in NEMO, as the origin and destination zone is the same. Thus, some 5.1 million tonnes of fresh and frozen fish is assigned to the network in the NEMO model. The matrices in the fishery model hold information about fish catch transported to Norwegian municipalities from the fishing grounds (see Table 1). The freight matrices in the fishery model are given in units of 1000 tonnes. Volumes in freight matrices are also given in Table 1 in section 5.1). The volumes for fresh and frozen fish in Table 2 and Table 1 differ considerably. There are several reasons why the volumes in the respective matrices for fresh and frozen fish cannot be expected to be equal: The figures in Table 2 include fish from fish farms, whereas the figures in Table 1 comprise wild fish only no products from fish farms. The conventional NEMO fish matrices hold information about fish which has been processed in one way or another. Depending of type of processing, the weight of the final fish product may be reduced to only a fraction of the live weight of the fish. For example, for Norway haddock, the conversion factor from fillet (without skin and bones) to live weight is , indicating an estimated weight loss of nearly 80%. In the estimation of the NEMO matrices, all consumption of a commodity within a zone is assumed to be based on the production of the same commodity within the zone. Freight of a commodity between zones occurs only where the estimated production and consumption of a commodity within a given zone differ in volumes. Any excess production is exported to other zones, while lack of, or too low production, leads to import from other zones. Any zoneinternal freight is not assigned in STAN only freight from and to zones. The processing of the catch after it has been delivered, may lead to a shift in category. E.g. fresh catch in the fishery model may be forwarded as frozen fish products in NEMO. As long as the current NEMO matrices do not supply information about the total volumes of fish within NEMO (fresh, frozen and other categories), it is not possible to make a useful comparison of volumes between the two models. 5.3 Vessel transport pattern It have been constructed matrices describing the vessels round trip from their home municipality to the fishing ground, from the fishing ground to the landing municipality, and the return from the landing municipality to their home municipality. As mentioned, catch is registered from 55 different fishing grounds to 213 various municipalities. These landings are made by vessels from 251 various home municipalities. Table 3 shows the number of estimated landings by vessel characteristics of length and tool. 8 Fiskeridirektoratet: Norske omregningsfaktorer, versjon IV, gjeldende fra 1/
17 15 Table 3: Average number of estimated landings *) per length and tool category Tool category Vessel category Seine Trawl Conventional Other Total Length under 28m Length over 28m Total *) Average of 2001 and 2002 As shown, most landings are made by the smaller vessels with trawl or conventional tools. The number of landings made by these two categories alone constitutes about 91% of all landings. However, there are large differences in the quantities delivered by the smaller and the larger vessels. Table 4 shows the number of tonnes delivered per category of vessel. Table 4: Average number of tonnes *) per length and tool category Tool category Vessel category Seine Trawl Conventional Other Total Length under 28m Length over 28m Total *) Average of 2001 and 2002 According to Table 4, the main part of the catch is delivered by the larger vessels with seine and trawl. A comparison between the two previous tables indicates that the larger vessels will deliver significantly more tonnes per landing than the smaller vessels. The size of an average landing for each length category is calculated and presented in Table 5. Table 5: Average number of tonnes *) per landing Tool category Vessel category Seine [tonnes/landing] Trawl [tonnes/landing] Conventional [tonnes/landing] Other [tonnes/landing] Total [tonnes/landing] Length under 28m Length over 28m As shown in Table 5, the larger vessels with seine or trawl deliver by far the most tonnage per landing.
18 16 6 Network Due to limited remaining capacity in the data bank in existing version of NEMO, a new data bank with extended capacity had to be established. An overview of the main data bank characteristics is presented in Table 6. Table 6: The NEMO data bank, new capacity and estimated requirements Existing NEMO Estimated new requirements Data item Status Max Free capacity Fishery part of the model Model Total New NEMO version extended to Max in license 6 Centroids Conventional nodes Links Transfers Mode Fishing vessels are allowed to use the harbours and links defined in the NEMO short sea network, where this has been defined. The short sea network mode is named s. For additional network needed in the fishery model, a new network mode t has been defined. Using only the s mode would not allow us to exclude other commodity groups access to the fishery part of the network, which is necessary in order to produce realistic model assignments. The t mode was introduced in order to control that only fishing vessels were able to use the network. The t mode is linked to the short sea network in harbours or at the closest short sea node (see section 6.5). 6.2 Fishing grounds (zones) Fishing grounds are indexed with a 4-digits code in the statistics. The first two digits state in which main area the fish has been caught (named fishing grounds in section 2.2). The last two digits represent a further division of the grounds (named zones in section 2.2). In the model, the fishing grounds are represented by the first two digits only. There are a total of 98 fishing grounds on a two-digit level, whereof only 55 are being used by the catch landed in Norwegian harbours by Norwegian fishing vessels. Each of these main fishing areas (and a few more for practical reasons) was defined as a zone in NEMO. 61 fishing zones are defined, with centroid numbers , the two last digits corresponding to the main fishing area number. For each of the 61 fishing zones, a corresponding node was defined. These nodes are numbered , with the two last digits corresponding to the main fishing area number. Appendix E gives an overview of the numbering of each fishing ground, centroids and nodes.
19 Fishing harbours (nodes) Localisation of landing harbour is reported on a municipal level. Thus, municipalities are being used as the zone level in the model. This corresponds to the structure of the existing NEMO. Some new harbours had to be defined in NEMO: 92 new harbours were defined in zones where there was no harbour defined in the existing NEMO network 2 new harbours were defined in zones with too few available transfers in the defined harbour (Kristiansand and Bergen) Node numbers for the new harbours are Links A total of new links have been added to the NEMO data bank. All links which will be used by vessels with catch (links from fishing zones to delivery zone) are defined by link type 931, while the remaining links, primarily to be used by empty vessels sailing from delivery harbour to home harbour or from home harbour to fishing zones, are defined by link type 930. Table 7 presents an overview of the links added to the NEMO data bank. Table 7: Link description Link description mode link type function set N. of links Connector out of fishing zone t Link from fishing area to delivery harbour t Connector from new delivery harbour to delivery zone t Connector from delivery zone to new delivery harbour t Links between new harbours and short sea network t Connectors from home harbour to home zone t Connectors from home zone to home harbour t Link from home harbour to fishing area t Connector into fishing zone t TOTAL A graphical plot of the new links of mode t, link type 931, is presented in Figure 2.

20 18 Figure 2: New links of mode t, link type 931, defined in NEMO As illustrated in Figure 2, the new parts of the network are not well suited for illustrating the total picture, with all pairs of fishing zone and delivery zone in the same plot. If one reduces the number of relations, the picture gets less blurred, as shown in Figure 3. Figure 3: New links of mode t, link type 931, from NEMO fishing zone 24020, (Bjørnøya)
21 19 Link length As mentioned in section 2.1, sailing distances (link length) for many of the OD relations used in the model have been estimated by Statistics Norway. A GIS based model has been used for this purpose. Some of the fishing grounds cover zones in both coastal and deep sea areas, and for some of these, Statistics Norway had estimated separate link lengths from the freight centre of gravity in both coastal and deep sea area of each fishing ground. However, only one length per fishing ground can be implemented in the fishery model. This has been solved by using the average link length for links with two length estimates. The distance estimates from Statistics Norway did not cover all relevant pairs of fishing zone and delivery zone. Out of 1591 relations in the freight matrices, distances were still missing for 831. These lacking distances have been estimated manually by SINTEF, using the freight centre of gravity in each fishing ground as basis. In addition to the combinations of fishing zone and delivery zone, the model should also include all combinations of home harbour to fishing ground (trips with empty vessels). A total of 1374 relations used for trips from home harbour to fishing ground were lacking distance. These distances have been set to the nearest known distances gained from the GIS based method or the manual estimation. Table 8 presents an overview of the different link length estimation. Table 8: Link length estimation Number of links Distance estimated by Estimation method Distance quality 760 Statistics Norway GIS based method based on real OD relations from each location within each main fishing ground Good 831 SINTEF 485 SINTEF 584 SINTEF 305 SINTEF Manual estimation based on one point representing centre of gravity within each fishing ground Automatic estimation by using known distances 9 to neighbour harbours Automatic estimation by using known distances 8 to further away neighbour harbours Manual estimation by using the nearest known distance 10 Medium Medium Medium / poor As indicated in Table 8, the quality of distance estimates varies a lot. Statistics Norway provides the best estimates, while the manual and automatic estimations made by SINTEF represent lower quality due to a less sophisticated estimation method and less detailed available input data. The last row in Table 8 represents the poorest quality on distance estimates. These are distances which cannot be defined by any of the manual estimations (second row) or by using any of the defined neighbour harbours (third and fourth row). Link speed Average speed is 14.8 km/h for coastal vessels (<28m) and 20.4 km/h for deep sea vessels (>28m). Poor 9 "Known distance" are distances gained from the GIS based method or the manual estimation method. 10 This method is used for the distances which cannot be estimated by any of the other methods. The nearest harbour with a known distance can be located far away from the destination harbour.
22 20 Link speed on the short sea network (mode s) is 18.5 km/h. Due to the allowance for fish transport to use this network as well, the same link speed has been chosen for mode t. The speed is later adjusted by a correction factor in the cost functions on links (see section 7). 6.5 Transfers Transfers between the fishery (t) and short sea (s) networks have been defined for all existing and new harbours. A total of transfers have been defined between the two modes, of which accommodate shift from the fishery to the short sea network, and the remaining transfers allow shifts from short sea to fishery links. Transfers had to be defined differently for the already existing harbours, and for the harbours which had to be defined especially for the fishery model. Figure 4 and Figure 5 show the main principles for the definition of transfers in the two situations respectively, with the movements and transfers allowed between the sea modes s and t in the model. There are no costs related to the transfers. Fishing area t t s s Home harbour s s s Home zone s Delivery zone Delivery harbour s s t short sea network fishery network transfer between fishery and short sea network transfer node Figure 4: Fishing and short sea network connections at existing harbours At existing harbours (Figure 4), transfers in both directions have been defined in the harbour. At new harbours (Figure 5), transfers in both directions have been defined in the nearest node in the short sea network. At these harbours links for connecting the harbours to the zone centroids (named Home zone and Delivery zone in the figure) have been defined.
23 21 Fishing area t s t s t s Home harbour t t s t Home zone Delivery zone t Delivery harbour t s t short sea network fishery network transfer between fishery and short sea network transfer node Figure 5: Fishing and short sea network connections at new harbours
24 22 7 Cost functions As mentioned, the basis for the cost functions for the new links was the already existing cost functions in NEMO. The most relevant functions for the transport covered in the fishery model were the costs related to mode s and commodity groups 1 (food), 2 (frozen fish) and group 11 (fresh fish). A general description of cost functions and their parameters in NEMO is presented in Madslien and Andersen, The following presentation includes changes and considerations concerning the specific elements in the functions and the parameter values. A total presentation of the cost functions (including both function sets and parameter values) is given in appendix G. 7.1 Link cost It is necessary to adjust the speed-dependent costs on links. As mentioned in section 6.4 weighted average link speed for fishing vessels is 18.2 km/h. The weighting is based on the total calls for each vessel category. The corresponding link speed in the network is 18.5 km/h, and a correction factor in the link cost function is therefore introduced. The relevant element in the cost functions is related to the calculation of travel time on the link 11 : Where length / (ul1 * ul2) ul1: Factor that adjusts the speed at the link (is multiplied by ul2). Default value=1 ul2: Speed at the link [km/hour] Both ul1 and ul2 are specified directly on each link. Because fish catch is allowed to use both network mode s and t, the specification for network mode t uses the same parameter values as for mode s. Thus, the correction factor is added to the same element in the cost function for both modes. This gives the resulting cost function element: length / (ul1 * ul2 * 18.2/18.5) It can be argued that the effect of the correction factor is negligible. However, it has been introduced in order to establish the structure and allow for potential larger adjustments in the future. 7.2 Vehicle 12 cost Four cost parameters on vehicles are relevant: uv1: Distance dependent operative cost (NOK/tonnekm) uv2: Time dependent operative cost (NOK/tonne and hour) uv3a: Handling cost in the centroid (NOK/tonne) uv3b: Time used for loading/unloading in a centroid (hour) uv3a and uv3b have not been adjusted in the fishery model. The same parameter values as for mode s have been used. 11 The various cost functions are defined by different elements. Thus, the cost function element presented here represents one of the building stones in the cost functions. 12 Vehicle is the NEMO nomenclature for all kinds of vehicles, vessels, rails, etc. In the fishery model, vehicles will be the NEMO term for fishing vessels.
25 23 Distance-dependent costs on vehicles In the estimation of this parameter value, costs of fuel, maintenance of the vessel and vessel insurance have been taken into account. Statistics Norway provided a worksheet giving input parameters for their calculations of emission (Flugsrud, K. and K. Rypdal (1996)). Among these parameters were estimates on average speed for different types and sizes of vessels on their way from the fishing grounds to the landing municipalities, and also estimates on corresponding fuel use. From this a weighted average speed and resulting fuel use were calculated for vessels under and over 28 meters respectively (column Fuel consumption in Table 9). Statistics from the Directorate of Fisheries formed the basis for calculation of average landing sizes in tonnes (column Average landing in Table 9). In addition, fishermen have been contacted to get a realistic estimate (including common discounts) of costs per litre of fuel. The resulting estimations of costs per tonne-km related to fuel use are shown in column Fuel costs in Table 9. Table 9: Input for estimation of costs per year related to fuel use Vessel category Fuel consumption [l/km] Average landing [tonnes] Fuel costs [NOK/tonnekm] Length under 28m Length over 28m The Directorate of Fisheries produces a profitability analysis each year. From this it is possible to extract key figures on cost elements like fuel, maintenance and insurance for various categories of vessels. The available figures and calculated weighted average cost for maintenance and insurance have been used to get an estimate of the costs. For use in conversion from total cost to cost per tonnekm, weighted average cost for fuel has also been calculated based on this statistics. These input data are shown in Table 10. Table 10: Input for estimation of costs per year related to maintenance and insurance of vessel and fuel Maintenance Insurance Fuel Vessel category [NOK] [NOK] [NOK] Length under 28m Length over 28m By comparing the figures for fuel costs (column Fuel in Table 10) with the estimates based on figures from the Statistics Norway (Table 9), an estimate of maintenance and insurance costs per tonnekm can be obtained. The various cost elements are summarized in Table 11. Table 11: Estimated cost elements Fuel Maintenance Insurance Total Vessel category [NOK/tonnekm] [NOK /tonnekm] [NOK /tonnekm] [NOK /tonnekm] Length under 28m Length over 28m
26 24 The overall weighted total (based on information of population in the profitability statistics) is NOK/tonnekm. The corresponding values in the existing cost functions for commodity group 1, 2 and 11 in NEMO are: NOK /tonne for food NOK /tonne for frozen fish NOK /tonne for fresh fish Different cost parameters for the three commodity groups can be explained by the heterogeneity of the commodity groups. Food is a very wide group and includes all kinds of food except frozen or fresh fish. It is therefore expected that cost parameters for food differ from the cost parameters for fish. In the fishery model, the category other conservation is assumed to have much in common with fresh and frozen fish, so it was decided to use the same cost parameter for all three commodity groups 14, 15 and 16. Thus, the cost parameter uv1 is set to 0,265 for commodity group 14, 15 and 16. Time-dependent costs on vehicles A similar argumentation has been used for the time-dependent operative costs on vehicles. We do not have data for recalculating the costs, but we argue that the time-dependent cost should be similar for all three commodity groups in the fishery model. Thus, we have chosen the value for commodity group 2 and 11 (frozen and fresh fish) to be used for the commodity groups 14, 15 and 16. The cost parameter uv2 is therefore set to 13.8 NOK/tonnekm). Costs on vehicles with catch versus empty vehicles Costs on vehicles are related to costs per tonnekm. This cost unit is not relevant for trips with empty vehicles, due to the lack of tonnes. NEMO is primarily developed for assigning freight transport, thus the existing NEMO does not include empty vehicle movements. However, we are asked to do an assignment of trips made by empty vessels. There is a lack of input data which separates costs on empty vessels and vessels with catch. Thus, average costs per tonnekm representing an average of empty trips and trips with catch, has been applied.

27 25 8 Function test The model has been tested on two situations: Scenario 0: Current situation Scenario 1: Reduction in number of fishing harbours According to requests from NTP-Transportanalyser, the function test of the fishery model also includes sailing patterns. A limited numbers of plots are presented in this section. Additional plots are presented in appendix G (scenario 0) and appendix H (scenario 1). 8.1 Scenario 0: Current situation The current situation uses the base network, which includes all harbours and links implemented in the fishery model. Table 12 shows the tonnekilometres assigned to the network for each of the three commodity groups. Table 12: Total tonnekm assigned to modal links for each category of fish catch Mode Fresh fish catch Frozen fish catch Other fish catch Total l s t Total Figure 6 presents a plot of assignment of total amount of fresh fish (commodity group 14) on the base network. Figure 6: Assignment of fresh catch fish on base network
 are related to the southern part")
28 26 Due to the direct link network, visual presentation of total assignments like the one in Figure 6, is somewhat confusing. However, the figure shows that many links are used in the assignment, and that the single most important links regarding landing of fresh fish (measured in volumes) are related to the southern part of Norway. Figure 7 presents an easier readable plot of assignment of all catch fish from one single fishing ground, Bjørnøya. The figure shows that fish catch from Bjørnøya is landed in many municipalities along the Norwegian coast. Figure 7: Assignment of all catch fish from Bjørnøya on base network The fishery model can also be used for illustrating differences in volumes. Figure 8 illustrates the differences in volumes of fresh fish catch and frozen fish catch, commodity group 14 and 15 respectively, from one single fishing ground, Egersundsbanken.

29 27 Figure 8: Assignment of the difference in fresh catch fish and frozen catch fish from Egersundsbanken on base network The red lines indicate majority of fresh fish, while the green lines indicate majority of frozen fish. The figure shows that fresh fish is landed in the nearby harbours to a larger extend than frozen fish. This is an expected result, due to the fact that time-dependent costs on fresh fish exceed the respective costs on frozen fish. As mentioned in section 5.2, the volumes of fish products in the existing NEMO matrices do not necessarily match the volumes of the new fish catch matrices. This is illustrated in Figure 9, showing the volumes of fresh fish catch delivered into the municipality of Eigersund from the fishing grounds, and the volumes of fresh fish products shipped from the same zone.
.")

30 28 Figure 9: Assignment of fresh catch fish delivered to and fresh fish products shipped from Eigersund, zone Scenario 1: Reduction in number of fishing harbours Catch is delivered to 213 zones located in 17 of the 19 counties in Norway (Table 13). Table 13: Total annual catch (kg) delivered per county Fish category County N of delivery zones Pelagic Other fish Prawns Other shellfish Total 1 Østfold Akershus Oslo Buskerud Vestfold Telemark Aust-Agder Vest-Agder Rogaland Hordaland Sogn og Fjordane Møre og Romsdal Sør-Trøndelag Nord-Trøndelag Nordland Troms Finnmark In the case study defined in this project, the harbours in municipalities with less than 100 tonnes of total catch delivered per year, are removed. However, if this applies to all zones in a county, the largest zone in this county, measured in total catch delivered, is kept, in order to accommodate a minimum level of landing facilities within the area.
31 29 The 80 zones listed in Appendix F all have an annual average of total delivered catch of less than 100 tonnes. None of the zones in the counties of Akershus and Buskerud received more than 100 tonnes of catch per year. With a strict 100 tonne-limit, these two counties would be left without a delivery zone. To avoid this, the municipalities of Vestby in Akershus ( tonnes) and Hurum in Buskerud (1.140 tonnes) were kept. The 80 zones removed represent 0,048% of total catch, and are relatively large for shellfish. Table 14 provides the total tonnage per county which will have to be re-directed to a different landing harbour in the case study. Table 14: county Total annual catch (kg) delivered to zones with less than 100 tonnes catch delivered per year, per Fish category County N of delivery zones < 100 tonnes Pelagic Other fish Prawns Other shellfish Total 1 Østfold Akershus Oslo Buskerud Vestfold Telemark Aust-Agder Vest-Agder Rogaland Hordaland Sogn og Fjordane Møre og Romsdal Sør-Trøndelag Nord-Trøndelag Nordland Troms Finnmark SUM, < 100 tonnes % of total within category 0,016 % 0,125 % 0,127 % 1,840 % 0,048 % Table 15 presents the total amount of tonnekilometres resulting from an assignment where the smaller harbours are removed. Table 15: Total tonnekm assigned to modal links for each category of fish catch 13 Mode Fresh fish catch Frozen fish catch Other fish catch Total l s t Total The difference in tonnekilometres between the current situation with many small harbours and scenario 1 where these are removed is shown in Table 16. The figures show that for most products 13 Total tonnekm assigned in Table 12 and Table 15 should be identical. However, differences in the tables is caused by rounding errors in the model.
32 30 the amount of tonnekilometres will increase when harbours are removed. This is as expected, because the vessels will no longer be allowed to use the direct link. For one product however; frozen fish catch, the transport made by the fishing vessels (mode t) will decrease. This means that when smaller harbours are removed, the fishermen will land the frozen fish to a harbour with shorter distance from the fishing grounds. This corresponds to the observation from section 8.1 that fresh fish is landed in the nearby harbours to a larger extend than frozen fish. Table 16: Total tonnekm assigned to modal links for each category of fish catch. Difference between sc.0 and sc.1 Mode Fresh fish catch Frozen fish catch Other fish catch Total l s t Total Table 17 shows the amount of fish that is assigned to modal transfers that is, the amount of fish that will use more than one modal network. In scenario 0, the vessels are allowed to travel directly to the landing municipality. The only change of network that will take place is related to vessels that are directed towards landing municipalities already included in NEMO. These vessels will enter the short sea shipping network (s) to reach the final destination. In scenario 1, the smaller harbours are removed; hence the vessels may not be allowed to use the harbour closest to their final destination and may choose to use the short sea shipping network (s) or the road network (l) to reach the destination. The comparison of the two scenarios show that removal of the smallest harbours will result in a transfer of about tonnes of fish from sea transport to road transport, and about 430 tonnes of fish will be redirected from the direct link in the fishery network to the short sea shipping network. Table 17: Total amount of fish [1000 tonnes] assigned to modal transfers: Sum for all categories of fish catch (scenario 0, scenario 1 and change) Scenario 0 Scenario 1 Scenario 1 - Scenario 0 From To Mode From To Mode From To Mode Mode l s t Total Mode l s t Total Mode l s t Total l l l s s s t t t Total Total Total Figure 10 illustrates difference in volumes when comparing volumes of all catch fish from Egersundsbanken in scenario 0 and 1.
33 31 Figure 10: Comparison of scenario 0 and 1, all catch fish from Egersundsbanken Red lines indicate reduced volumes when removing harbours under 100 tonnes, while green lines indicate increased volumes. As can be seen, scenario 1 implies a concentration of volumes to a limited number of harbours, as expected. A closer study of the effect in one single harbour (Ølen) is presented in Figure 11. Here an analysis of assigned paths is used to create the graphical result. Figure 11: Comparison of assigned paths in scenario 0 and 1, fresh catch fish from Egersundsbanken to Ølen The left part of Figure 11 shows assignment in the basis scenario (scenario 0). The blue line indicates that the transport is using the s mode for connecting to the zone. When removing the harbour in Ølen in scenario 1, one gets the assignment shown in the right part of Figure 11. Here one can see that the fresh catch fish is using another harbour than in Ølen. However, due to fixed matrices, the fish has to be assigned all the way to Ølen even though this harbour does not exist in the network. Thus, after connecting to the new harbour (where the pink line meets the red dot), the volumes are assigned on modes s and l (lorry) to get to its final destination.
34 32 The same assignment in volumes is presented in Figure 12. Here green lines illustrate reduced volumes in scenario 1 and red lines increased volumes in scenario 1. Figure 12: Comparison of scenario 0 and 1, fresh catch fish from Egersundsbanken to Ølen 8.3 Sailing pattern Average tonnage per vessel is estimated to 10.9 tonnes. This is based on average number of tonnes (Table 4) and estimated landings (Table 3) per length and tool category. The matrix comprises a total of vessel movements. 7 % of these were movements with unknown origin or destination, and a further 18 % were zone internal movements. Thus, only 75 % of the matrix could be assigned. The assignment is shown in Figure 13.

35 33 Figure 13: Assignment of matrices describing sailing patterns According to Figure 13, a major amount of the movements are carried out along the Norwegian coast. The majority of trips along the coast are related to transport between landing and home harbour. The assignment results for sailing patterns suffer under two conditions: The sailing distances for links from home harbour to fishing ground are not of a satisfying quality 14. Furthermore, cost functions with average values for vessels with and without catch on board do not reflect the true cost situation for the vessels 15. Together, these two conditions contribute to a series of sailing paths which are not logical. 14 This problem is addressed in Table 8: Link length estimation. 15 See section 7.2, Vehicle cost
36 34 9 Evaluation and concluding remarks 9.1 Evaluation of the fishery model Basis matrices Both freight and trip matrices are based on information provided by the department of statistics at the Directorate of Fisheries. We found this source to the best and most complete regarding information about volumes and trips related to fish transport. The statistics is made from information in notes provided by the fishermen at each landing, and the information describes the trip, the catch and the vessel. We consider the quality of the OD matrices describing the flows in tonnes to be of good quality. In order to obtain estimates of the number of trips, a specially designed extract of the statistics had to be made. Usually, one document is filled in per landing, but when there are several buyers or the vessel has been in areas with different quota regulations etc, more than one document are filled in. For these reasons, some uncertainty is introduced to the estimation of the number of trips. However, there is no official statistics that will result in a better estimate so we decided to establish also the OD matrices describing the trips on the statistics from the Directorate of Fisheries. Network A direct link network was chosen in the present fishery model. This allowed us to utilise distance estimates available from Statistics Norway, and use efficient input procedure of links in the model. The direct link network is appropriate for the required analyses, but inclusions of further relations should be considered. In the present network, we have included all links that are in use either for transporting the fish from catching to landing, or for transporting the vessels from home harbour to fishing ground. All the other possible zone relations have not been included in the network, due to the time and cost limits on this project. Supplementing the network with these missing links is easy if distance estimates are available. We therefore suggest that cooperation with Statistics Norway for establishing reliable link length estimates on the whole fishery network is considered. This also includes updated distance estimates on present links. Another network alternative is representing the t mode on a spider-network. A spider-network makes re-routing of fish transport easier and more realistic than by using direct links. In addition, a spider-network allows a more elegant graphical result presentation. Thus establishing a spider network could be considered in order to improve the model. It is however necessary to gain reliable distance estimates on also in this case. Full model integration Simultaneous assignment of all commodity groups is possible. Thus the fishery model can be run together with the existing NEMO. The sub model is however not fully integrated in NEMO, and the fishery model matrices are not harmonized with the existing NEMO matrices. If this should be done, it is necessary to conduct a further study to reveal what happens in the harbours, and how it affects the quantities of fish and shellfish that will need further transport to reach the market. Such further model development can be relevant for strategic planning issues. It is however important to test the model on relevant planning aspect before concluding with limitation and possible needs for further development. Cost functions Cost parameters have been updated or corrected according to available information. To our knowledge, we have utilised the most relevant available information for this. For some aspects,
37 35 we did not have the necessary information to make such corrections. In those cases, we have used the already implemented cost parameters. Transfer costs have not been corrected, due to the fact that transfers between modes are not relevant in the fishery model with the exception of transfers between mode t and s. If a full model integration should be developed, it will be necessary to correct transfer costs based on a detailed study of the cost structure in transfers. As mentioned, costs on vessels are related to costs per tonnekm, and there is a lack of input data which separates costs on empty vessels and vessels with catch. Therefore average costs per tonnekm have been used for representing an average of empty trips and trips with catch. This is a weakness with the model. A separate cost study should be performed to obtain necessary input data for these cost functions and parameters, allowing an increase of the model reliability. Model results The assignment of the base matrices on the present network will only reflect the information from the underlying statistics and recreate today s situation. It is not really possible to assess the quality of the model from this type of assignment it will be limited by the quality of the official statistics as discussed earlier in this report. From this assignment one can show that the model is functioning technically, and verify that the input is implemented correctly. 9.2 Future utilisation of satellite-based vessel monitoring systems Satellite-based vessel monitoring systems for fishery management was introduced in Norway in year All Norwegian vessels of length 24 m or more must have satellite-based tracking equipment installed. Satellite tracking is meant for managing the fisheries not only in Norway, but also in the countries we cooperate with regarding fisheries. Satellite monitoring and control implies that communication equipment installed on the vessel regularly sends signals containing information about the geographical position, the course and speed to the vessel s flag authority message central (FMC). The Norwegian FMC is located at the Directorate of Fisheries. The equipment sends signals once per hour, and in addition a signal is sent when the vessel either enters or leaves zones under other countries jurisdiction. So far, the information from the satellite tracking is mostly used for monitoring and control. However, they have also been used for special analysis when oil companies ask for documentation of activities related to fisheries in various areas. When modelling the transport patterns of the fishing fleet, the data from satellite tracking is very interesting and would constitute a valuable input. However, there is no official statistics published based on this material available today. In the future, most likely the landing documents will be electronic. When this is implemented, the information in these documents can be linked to the data from satellite tracking. This will both give us valuable new information and enable us to make quality checks of already existing information. In addition to the more technical challenges included in linking of these data sets it is also necessary to check out the legal aspects concerning the publication of information from satellite tracking: The tracking data gives very detailed information about each vessel and it is necessary to aggregate the information in order to be allowed to publish it. The group at the Directorate of Fisheries produces statistics from satellite tracking for internal use. For this internal statistics, they use fishing tool to categorize the vessels. If this will form the
38 36 basis on which they will publish the data in the future, this might be a very useful and comprehensive material to be used for calibration of the fishery model. 9.3 Concluding remarks A fishery model is developed and implemented as a sub model in NEMO. We have made a thorough job checking data availability and discussing various categorization and definitions with experts. During the model development we have emphasized flexibility, so adjustments and updates of the input should not be too time-consuming. All input data are organised in a database and the network is created using batch files. The model has been tested and has proven useful for strategic analysis of fishing harbours. Using the model for assignment of sailing pattern has also been demonstrated.
39 37 10 References Fiskeridirektoratet (2002) Lønsemdundersøking ( Flugsrud, K. and K. Rypdal (1996): Utslipp til luft fra innenriks sjøfart, fiske og annen sjøtrafikk mellom norske havner. SSB Report 96/17. Madslien, A. and Andersen, J. (2004): Structure of network and cost functions in NEMO after integration of the domestic and the international model TØI working paper TØ/1674/2004 Tornsjø, B (2001): Utslipp til luft fra innenriks sjøfart, fiske og annen sjøtrafikk mellom norske havner. SSB Report 2001/6. ( Vold, A.; Andersen, J.; Hovi, I.B.; Ivanova, O.; Jean-Hansen, V.; Lervåg, L.E.; Meland, S. and Wahl, R. (2002): NEMO Nettverksmodell for godstransport innen Norge og mellom Norge og utlandet, versjon 2 TØI report 581/2002
40 38 Appendix A: Maps of fishing grounds All maps are provided by Skantrykk AS.
41 39
42 40
43 41
44 42
45 43
46 44


47 45

48 46
49 47 Appendix B: Fish categories Fish category Subgroups Fish type - Norwegian Fish type - English Fish type - Latin Pelagic Pelagisk fisk Sild Atlantic herring Clupea harengus Norsk vårgytende sild Trondheimsfjordsild Mussa Nordsjøsild Skagerraksild Sild vest av 4 graden Fjordsild Annen sardin Sardinellas Sardinella spp Atlantic menhaden Atlantic menhaden Brevoortia tyrannus Sardinella European pilchard Sardina pilchardus Brisling European sprat Sprattus sprattus Havbrisling Kystbrisling Ansjos European anchovy Engraulis encrasicolus Bairds slickhead (smooth-head) Alepocephalus bairdii Annen sildefisk Clupeoids Clupeoidei Lodde Capelin Mallotus villosus Barentshavslodde Island/Ø Grønl./Jan M Polartorsk Polar cod Boreogadus saida Øyepål Norway pout Trisopterus esmarkii Kolmule Blue whiting Micromesistius poutassou Taggmakrell (hestmakrell) Atlantic horse mackerel Trachurus trachurus Leerfish Lichia amia Annen taggmakrell Jack and horsemackerel Trachurus spp Tobis og annen sil Sandeels (= Sandlances) Ammodytes spp Spansk makrell Chub mackerel Scomber japonicus Makrell Atlantic mackerel Scomber scombrus Annen makrell Mackerels Scombridae Shrimp Other shellfish and molluscs Skalldyr og bløtdyr Reke (dypvanns ) Northern prawn Pandalus borealis Reke av Penaeusslekten Penaeus shrimps Penaeus spp Reke av Pandalusslekten Pink (= Pandalid) shrimps Pandalus spp Reke av Palaemonidaeslekten Palaemonid shrimps Palaemonidae Strandreke Common prawn Palaemon serratus Reke av Crangonidaeslekten Crangonid shrimps Crangonidae Hestereke Common shrimp Crangon crangon Skalldyr og bløtdyr Krill Norwegian krill Euphausiidae Raudåte Calanus finmarchicus Langust Palinurid spiny lobster Palinurus spp Krabbe Edible crab Cancer pagurus Hankrabbe Hunkrabbe Svømmekrabber Swim crab Portunus spp Kongekrabbe King crab Paralithodes camtscatica Trollkrabbe Stone king crab Lithodes maja
50 48 Fish category Subgroups Fish type - Norwegian Fish type - English Fish type - Latin Annen krabbe Marine crabs Reptantia Sjøkreps Norway lobster Nephrops norvegicus Hummer European lobster Homarus gammarus Amerikansk hummer American lobster Homarus americanus Andre krepsdyr Marine crustaceans Crustacea Østers European flat oyster Ostrea edulis Annen Cupped oysters Cupped oysters Crassostrea spp Kuskjell Ocean Quahog Cyprina islandica Sandskjell Soft clam Mya arenaria Kamskjell Common scallop Pecten maximus Harpeskjell Queen scallop Chlamys opercularis Blåskjell Blue mussel Mytilus edulis Oskjell Horse mussel Modiolus spp Surf clam Spisula solidissima Haneskjell Islandic scallop Chlamys islandica Hjerteskjell Common cockle Cardium edule Albuskjell Lipmets Patellidae Annen skjell Scallops Pectinidae Blekksprut Common squid Loglio spp Longfinned squid Loglio pealei Shortfin (Northern) squid Illex illecebrosus Akkar European flying squid Todarodes sagittatus sagittat Octopuses Octopodidae Annen blekksprut Squids Loliginidae, Ommastrephidae Cuttlefishes Sephiidae, Sepiolidae Kråkebolle Sea urchins Echinoidea Andre pigghuder Echinoderms Echinodermata Strandsnegle Periwinkles Littorinidae Annet bløtdyr Marine molluscs Mollusca Other fish Annen og uspesifisert fisk Villaks Atlantic salmon Salmo salar Coho laks Coho salmon Oncorhynchus kisutch Sjøørret Sea trout Salmo trutta Regnbueørret Rainbow trout Oncorhynchus mykiss/ Salmo gairdneri Annen ørret Trouts Salmo spp Røye Arctic char Salvelinus alpinus Annen røye Chars Salvelinus spp Harr Grayling Thymallus arcticus Annen laksefisk Salmonoids Salmonoidei Horngjel Garfish Belone belone Makrellgjedde Atlantic saury Scomberesox saurus Bluefish Pomatomus saltratix Annen marulk Beloniformes Mora Moras Moridae Skjellbrosme Greater forkbeard Phycis blennoides Forkbeard Phycis phycis Navagotorsk Wachna cod Eleginus navaga Skjeggtorsk Pouting Trisopterus luscus Isgalt Roughhead grenadier Macrourus berglax Skolest Roundnose grenadier Coryphaenoides rupestris Annen torskefisk Gadiformes Gadiformes Stingsild Sticklebacks Gasterosteus spp Trompetfisk Slender snipefish Macroramphosus scolopax
51 49 Fish category Subgroups Fish type - Norwegian Fish type - English Fish type - Latin Annen multe Mullets Mugilidae Stripefisker Silverside smelts Atherinidae Dusky grouper Epinephelus guaza Vrakfisk Wreckfish Polyprion americanus Havabbor Seabass Dicentrarchus labrax Stripet havabbor Striped bass Morone saxatilis Grunt Grunts, sweetlips, etc. Haemulidae (Pomadasyidae) Ørnefisk Meagre Argyrosomus regius Flekkpagell Red seabream Pagellus bogaraveo Rødpagell Common pandora Pagellus erythrinus Axillary seabream Pagellus acarne Largeeye dentex Dentex macrophthalmus Common dentex Dentex dentex Dentex Dentex spp Gilthead seabream Sparus aurata Oksøyefisk Bogue Boops boops Annen havkaruss Porgies, seabreams etc. Sparidae Mulle Surmullet Mullus surmuletus Red mullet Mullus barbatus Fjesing Greater weever Trachinus draco Sølvbrasme Atlantic pomfret Brama brama Picarels Spicara spp Berggylt Ballan wrasse Labrus bergylta Annen leppefisk Wrasses, hogfish Labridae Bergnebb Gold-sinny wrasse Ctenolabrus rupestris Grøngylt Corkwing wrasse Crenilabrus melops Blåstål Cuckoo wrasse Labrus bimaculatus Rødnebb Cuckoo wrasse Labrus bimaculatus Annen piggfinnefisk Perciformes Slirefisk Silver scabbardfish Lepidopus caudatus Dolkfisk/trådstjert Black scabbardfish Aphanopus carbo Ryggstripet pelamide Atlantic bonito Sarda sarda Atl. spansk makrell Atlantic spanish mackerel Scomberomorus maculatus Auxid Frigate and bullet tunas Auxis thazard,a. rochei Tunnin Atlantic black skipjack Euthynnus alletteratus Bukstripet pelamide Skipjack tuna Katsuwonus pelamis Makrellstørje Northern bluefin tuna Thunnus thynnus Albakor Albacore Thunnus alalunga Yellowfin tuna Thunnus albacares Bigeye tuna Thunnus obesus Seilfisk Atlantic sailfish Istiophorus albicans Atlantic blue marlin Makaira nigricans Atlantic white marlin Tetrapturus albidus Sverdfisk Swordfish Xiphias gladius Annen tunfisk Tunas Thunnini Kutling Gobies Gobiidae Annen marin fisk Marine fishes Osteichthyes Uspesifisert fisk Unidentified Indeterminus Laksestørje Opah Lampris guttatus Common (blue) warehou Seriolella brama Silver warehou Seriollella punctata Giant stargazer, monkfish Kathetostoma giganteum Frostfish Lepidopus caudatus Kingfish, yellowtail Seriola lalandi Black oreo Allocyttus niger
52 50 Fish category Subgroups Fish type - Norwegian Fish type - English Fish type - Latin Oreo dories nei. Oreosomatidae spp. Hoki Macruronus novaezelandiae Hake Merluccius australis Hakes nei. Merluccius spp. Ling Genypterus blacodes Diverse dypvannsarter Håbrann Porbeagle Lamna nasus Brugde Basking shark Cetorhinus maximus Makrellhai Shortfin mako Isurus oxyhinchus Blåhai Blueshark Prionace glauca Blackmouth catshark Galeus melastomus Small-spotted catshark Scyliorhinus canicula Deep-water catsharks Apristurus spp. False catshark Pseudotriakis microdon Crest-tail catsharks nei. Galeus spp. Catcharks, nursehounds nei Scyliorhinus spp. Håkjerring Greenland shark Somniosus microcephalus Pigghå Picked(= Spiny)dogfish Squalus acanthias Dogfish sharks Squalidae Annen hå Dogfishes and hounds Squalidae Scyliorhinidae Islandshå Black dogfish Centroscyllium fabriciil Little sleeper shark Somnius rostratus Kitefin shark Dalatias licha Bramble shark Echinorhinus brucus Dogfishes nei. Squalidae Havengler Angelshark, sand devil Squatinidae Brunhå Shark gulper, leafscale Centrophorus squamosus Dypvannshå Portugese dogfish Squamosus Gråhå Squale savate Deania calceus Bunnhå Longnose velvet dogfish Centroscymnus crepidater Stor svarthå Canternsharks nei. Etmopterus spp. Annen hai Sharks Selachimorpha (Pleurotremata) Storskate Blue skate Raja batis Piggskate Thornback ray Raja clavata Flekkskate Spotted ray Raja montagui Nebbskate Shagreen ray Raja fullonica Gjøkskate Cuckoo ray Raja naevus Spisskate Longnose skate Raja oxyrinchus Little skate Raja erinacea Barndoor skate Raja laevis Winter skate Raja ocellata Thorny skate/ Starry ray Raja radiata Smooth skate Raja senta Spinytail skate Raja spinicauda Blonde ray Raja brachyura Sandy ray Raja circularis Round ray Raja fyllae Small-eyed ray Raja microocellata Undulate ray Raja undulata White skate Raja alba Skate, uspesifisert Skates Raja spp. Ørneskate Eagle rays Myliobatidae Elrokke Torpededos Torpedo spp Annen skate og rokke Skates and rays, nei. Rajiformes Havmus Rabbit fish (ratfish) Chimaera monstrosa
53 51 Fish category Subgroups Fish type - Norwegian Fish type - English Fish type - Latin Ratfishes nei. Hydrolagus spp. Knife-nosed chimaeras Rhinochimaera spp. Longnose chimaeras Harriotta spp. Brun havmus Ratfishes nei. Hydrolagus spp. Flatfisk og bunnfisk Strømsild/Vassild Argentines Argentina spp Ål European eel Anguilla anguilla Havål European conger Conger conger Annen ål Congers, eels Congridae Beryx, alfonsinos Alfonsinos Beryx spp Orange roughy Orange Roughy Hoplostethus atlanticus Sanktpetersfisk John dory Zeus faber Gråsteinbit Atlantic wolffish (= Catfish) Anarhichas lupus Flekksteinbit Spotted wolffish (= Catfish) Anarhichas minor Blåsteinbit Northern wolffish (Blue sea-cat) Anarhichas denticulatus ( latifrons) Steinbiter Wolffishes (= Catfishes) Anarhichas spp Ålekvabbe Eelpout Zoearces viviparus Annen slimfisk Blennoidei Uer uspes. Atlantic redfishes Sebastes spp Uer (vanlig) Golden redfish Sebastes marinus Snabeluer Beaked redfish Sebastes mentella Lusuer Scorpionfish Sebastes viviparus Blåkjeft Bluemouth Helicolerus dactylopterus Knurr uspes. Gurnards, searobins Triglidae Knurr Grey gurnard Eutrigla (= Trigla) gurnardus Tverrstripet knurr Red gurnard Aspitrigla (= Trigla) cuculus Rognkjeks (felles) Lumpfish (=Lumpsucker) Cyclopterus lumpus Rognkall (han) Lumpfish (= Lumpsucker) Cyclopterus lumpus Rognkjeks (hun) Lumpfish (= Lumpsucker) Cyclopterus lumpus Annen ulkefisk Cottoidei Kveite Atlantic halibut Hippoglossus hippoglossus Rødspette European plaice Pleuronectes platessa Blåkveite Greenland halibut Reinhardtius hippoglossoides Smørflyndre Witch flounder Glyptocephalus cynoglossus Gapeflyndre Amer. plaice Hippoglossoides platessoides Yellowtail flounder Limanda ferruginea Sandflyndre Common dab Limanda limanda Lomre Lemon sole Microstomus kitt Skrubbe European flounder Platichthys flesus Winter flounder Pseudopleuronects americanus Annen flyndre Right eye flounders Pleuronectoidei Tunge Common sole Solea vulgaris Sandtunge Sand sole Solea lascaris Wedge sole (Senegal) Dicologoglossa cuneata Annen tunge Soles Soleidae Glassvar Megrim Lepidorhombus whiffiagonis Slettvar Brill Scophthalmus rhombus Windowpane flounder Scophthalmus aquosus Piggvar Turbot Psetta maxima Summer flounder Paralichthys dentatus Annen var Left eye flounders Bothidae Annen flatfisk Flatfishes Pleuronectiformes Breiflabb Angler (= Monk) Lophius piscatorius American angler Lophius americanus Andre av breiflabbfamilien Anglerfishes Lophiidae
54 Fish category Subgroups Fish type - Norwegian Fish type - English Fish type - Latin Torsk og torskeartet fisk Brosme Tusk(= Cusk) Brosme brosme Torsk Atlantic cod Gadus morhua Skrei Norsk arktisk torsk Kysttorsk Annen torsk Lange Ling Molva molva Blålange Blue ling Molva dypterygia Hyse Haddock Melanogrammus aeglefinus Norsk arktisk hyse Kysthyse Nordsjøhyse Annen hyse Rød lysing Red hake Urophycis chuss Hvit lysing White hake Urophycis tenuis Sei Saithe (= Pollock) Pollachius virens Lyr Pollack Pollachius pollachius Hvitting Whiting Merlangius merlangus Lysing European hake Merluccius merluccius Silver hake Merluccius bilinearis 52
55 53 Appendix C: Conservation categories Conservation category Code Norwegian description Comments Frozen 5 Frossen 6 Frossen saltkokt 7 Frossen sjøkokt Fresh 2 Fersk/ukonservert 3 Fersk saltkokt 4 Fersk sjøkokt 9 Iset 10 Rfw (refrigerated fresh water) 11 Rsw (refrigerated sea water) 18 Rsw + is Rsw (refrigerated sea water) i tank 19 Rsw + ozon Rsw (refrigerated sea water) i tank 20 Rfw + ozon Rfw (refrigerated fresh water) i tank. 21 Rfw + is Rfw (refrigerated fresh water) i tank. 22 Rfw + syre Rfw (refrigerated fresh water) i tank. 23 Rfw + syre + is Rfw (refrigerated fresh water) i tank. 24 Rfw + syre + ozon Rfw (refrigerated fresh water) i tank. 25 Sws Seawater slush (saltvanns is-sørpe) i tank (notbåter uten Rsw) 26 Rfw + FishForm Konserv.middel for industrifisk og fiskeprodukter. 27 Rfw + "Soft Eddik" Konserv.middel av fiskeråstoff for produksjon av fiskemel til dyrefor (SoftAcid Aqua E). 28 Rsw + "Soft Eddik" Konserv.middel av fiskeråstoff for produksjon av fiskemel til dyrefor (SoftAcid Aqua E). 29 Rsw + FishForm Konserv.middel for industrifisk og fiskeprodukter. Other 0 Uspesifisert 1 Ensilert 8 Gravet 12 Røkt 13 Saltet 14 Saltet og tørket (klippfisk) 15 Speket 16 Sukkersaltet 17 Tørket 99 Uspesifisert
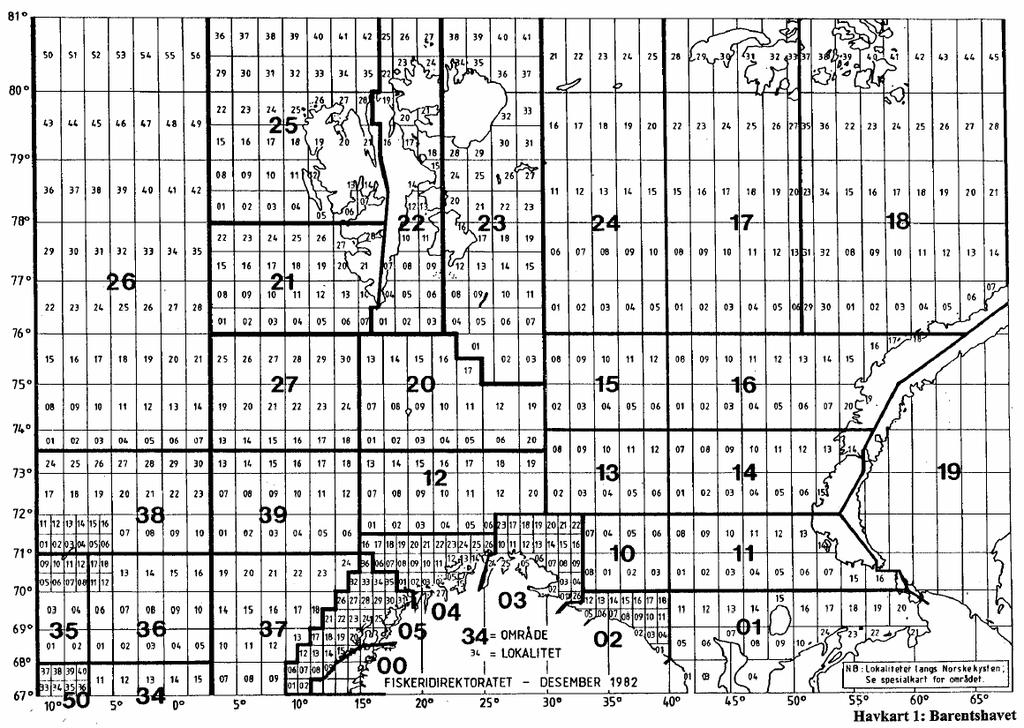
56 54 Appendix D: Geographical distribution of the catch Fishing ground N. of landings Pelagic [tonnes/yr] Fish category Other fish Shrimps [tonnes/yr [tonnes/yr Other shellfish [tonnes/yr Total [tonnes/yr 0 VESTFJORDEN (LOFOTEN) KANINBANKEN - Sørøstlige Barentshav MURMANSKKYSTEN ØST-FINNMARK VEST - FINNMARK RØSTBANKEN TIL MALANGSGRUNNEN HELGELANDSBANKEN STOREGGA-FRØYABANKEN - Møre EGERSUNDBANKEN - Nordsjøen SKAGERRAK SKOLPENBANKEN - Barentshavet GÅSEBANKEN NORDKAPPBANKEN / TROMSØFLAKET THOR IVERSENS BANK - Barentshavet BRITVINFELTET SENTRALBANKEN - Nordøstlige Barentshav BJØRNØYA - Barentshavet VEST SPITSBERGEN Vernesonen ved Svalbard STORFJORD/HINLOPENSTREDET - Vest Spitsbergen HOPEN - Spitsbergen Øst/Vernesonen STORBANKEN - Barentshavet NORD - VEST SPITSBERGEN / VEST SPITSBERGEN SØRVEST AV SPITSBERGEN VIKINGBANKEN - Nordsjøen SØRLIGE NORSKEHAV ØST AV FÆRØYANE SENTRALE NORSKEHAV SØR AV JAN MAYEN ØSTLIGE NORSKEHAV NORDVESTLIGE NORSKEHAV VEST AV TROMSØFLAKET SØRLIGE NORDSJØEN SENTRALE NORDSJØEN+D SHETLAND VEST AV SKOTTLAND/HEBRIDENE ROCKALL VEST AV IRLAND SØRVEST AV IRLAND SØRVESTLIGE NORSKEHAV SØRØST AV ISLAND SØRVEST AV ISLAND NORDVEST AV ISLAND - Danskestredet/Østgrønland NORD AV HORN, ISLAND NORD AV ISLAND NORDØST AV ISLAND
57 55 Fishing ground N. of landings Pelagic [tonnes/yr] Fish category Other fish Shrimps [tonnes/yr [tonnes/yr Other shellfish [tonnes/yr Total [tonnes/yr 57 VEST AV FÆRØYANE FÆRØYBANKEN ØST AV ISLAND SKJOLDUNGEN/REYKJANESRYGGEN DANMARKSTREDET - Østgrønland GAMMELOCK - ØSTGRØNLAND ØST FYLLAS BANK REYKJANESRYGGEN NORDLEGE GRAND BANK FLEMISH CAP Totalt
58 56 Appendix E: NEMO fishery zones Main fishing grounds NEMO zone NEMO node at zone 00 VESTFJORDEN (LOFOTEN) KANINBANKEN - Sørøstlige Barentshav MURMANSKKYSTEN ØST-FINNMARK VEST - FINNMARK RØSTBANKEN TIL MALANGSGRUNNEN HELGELANDSBANKEN STOREGGA-FRØYABANKEN - Møre EGERSUNDBANKEN - Nordsjøen SKAGERRAK SKOLPENBANKEN - Barentshavet GÅSEBANKEN NORDKAPPBANKEN / TROMSØFLAKET - Barentshavet THOR IVERSENS BANK - Barentshavet BRITVINFELTET SENTRALBANKEN - Nordøstlige Barentshav BJØRNØYA - Barentshavet VEST SPITSBERGEN Vernesonen ved Svalbard STORFJORD/HINLOPENSTREDET - Vest Spitsbergen HOPEN - Spitsbergen Øst/Vernesonen STORBANKEN - Barentshavet NORD - VEST SPITSBERGEN / VEST SPITSBERGEN - nord om 78gr N SØRVEST AV SPITSBERGEN VIKINGBANKEN - Nordsjøen SØRLIGE NORSKEHAV ØST AV FÆRØYANE SENTRALE NORSKEHAV SØR AV JAN MAYEN ØSTLIGE NORSKEHAV NORDVESTLIGE NORSKEHAV VEST AV TROMSØFLAKET SØRLIGE NORDSJØEN SENTRALE NORDSJØEN+D SHETLAND VEST AV SKOTTLAND/HEBRIDENE ROCKALL VEST AV IRLAND SØRVEST AV IRLAND SØRVESTLIGE NORSKEHAV SØRØST AV ISLAND SØRVEST AV ISLAND NORDVEST AV ISLAND - Danskestredet/Østgrønland NORD AV HORN, ISLAND NORD AV ISLAND NORDØST AV ISLAND VEST AV FÆRØYANE FÆRØYBANKEN ØST AV ISLAND SKJOLDUNGEN/REYKJANESRYGGEN - Irmigerhavet/Nordlige Atlanterhav DANMARKSTREDET - Østgrønland GAMMELOCK - ØSTGRØNLAND ØST
59 57 Main fishing grounds NEMO zone NEMO node at zone 68 FYLLAS BANK REYKJANESRYGGEN NORDLEGE GRAND BANK FLEMISH CAP
60 58 Appendix F: Delivery zones with less than 100 tonnes catch delivered per year Zone(Municipality) County Pelagic Other fish Prawns Other shellfish Grand Total 1852 Tjeldsund Stryn Røyken Drammen Utsira Forsand Bærum Eid Vevelstad Vega Luster Førde Tønsberg Norddal Halden Sømna Ballangen Ulvik Fjaler Skodje Stjørdal Lier Hamarøy Sande Frogn Suldal Evenes Vindafjord Stordal Gratangen Malvik Vestnes Nærøy Etne Nesna Sandnes Sykkylven Dyrøy Snillfjord Orkdal Halsa Radøy Målselv Rennesøy Rauma Surnadal Bokn Moss Meland Tingvoll Lindesnes Fosnes
61 Zone(Municipality) County Pelagic Other fish Prawns Other shellfish Grand Total 1519 Volda Skaun Strand Namdalseid Rana Rissa Ørskog Skånland Fedje Bindal Lindås Austrheim Inderøy Hyllestad Samnanger Gulen Sveio Sola Tysnes Finnøy Os Namsos Agdenes Hemne Fjell Ølen Bjarkøy Flatanger SUM, < 100 tonnes % of TOTAL 0,016 % 0,125 % 0,127 % 1,840 % 0,048 % 59
62 60 Appendix G: Cost functions and parameter values in the fishery model Detailed description of the variables is given in the STAN User s manual, release 6. modes l 'lastebil ' r 'jernbane ' s 'kystfart ' v 'sjøfart Europa ' o 'oversjøisk ' e 'jernbaneferge ' i 'indre vannveier ' f 'ferge ' b 'bulk-nett ' a 'flyfrakt ' p 'rørnettverk ' t 'fiskeri ' products p= 1 descr='mat inkl bearb fisk ' p= 2 descr='frossen fisk ' p= 3 descr='termovarer ' p= 4 descr='transpmidl/maskiner ' p= 5 descr='div. stykkgods ' p= 6 descr='tommer og trelast ' p= 7 descr='kull,koks, sand etc ' p= 8 descr='kjemiske produkter ' p= 9 descr='malmer/metall ' p=10 descr='flytende bulk ' p=11 descr='fersk fisk ' p=12 descr='gass ' p=13 descr='flyvare ' p=14 descr='fiskefangst fersk ' p=15 descr='fiskefangst frosset ' p=16 descr='fiskefangst annet ' p=17 descr='fiskefartoy ' vehicles for relevant combinations of product and mode p= 1 m=s p= 1 m=t p= 2 m=s p= 2 m=t p=11 m=s p=11 m=t p=14 m=s p=14 m=t p=15 m=s p=15 m=t p=16 m=s p=16 m=t p=17 m=s p=17 m=t
63 61 link function sets for the t mode a 301 1:299 2:299 3:299 4:299 5:299 6:299 7: :299 2:299 3:299 4:299 5:299 6:299 7: :299 2:299 3:299 4:299 5:299 6:299 7: :299 9:299 10:299 11:299 12:299 13:299 14: :299 9:299 10:299 11:299 12:299 13:299 14: :299 9:299 10:299 11:299 12:299 13:299 14: :299 16:299 17: :299 16:299 17: :299 16:299 17:290 a 311 1:299 2:299 3:299 4:299 5:299 6:299 7: :299 2:299 3:299 4:299 5:299 6:299 7: :299 2:299 3:299 4:299 5:299 6:299 7: :299 9:299 10:299 11:299 12:299 13:299 14: :299 9:299 10:299 11:299 12:299 13:299 14: :299 9:299 10:299 11:299 12:299 13:299 14: :111 16:111 17: :121 16:121 17: :290 16:290 17:290 a 321 1:299 2:299 3:299 4:299 5:299 6:299 7: :299 2:299 3:299 4:299 5:299 6:299 7: :299 2:299 3:299 4:299 5:299 6:299 7: :299 9:299 10:299 11:290 12:299 13:299 14: :299 9:299 10:299 11:290 12:299 13:299 14: :299 9:299 10:299 11:290 12:299 13:299 14: :290 16:290 17: :290 16:290 17: :290 16:290 17:290 a 331 1:299 2:299 3:299 4:299 5:299 6:299 7: :299 2:299 3:299 4:299 5:299 6:299 7: :299 2:299 3:299 4:299 5:299 6:299 7: :299 9:299 10:299 11:299 12:299 13:299 14: :299 9:299 10:299 11:299 12:299 13:299 14: :299 9:299 10:299 11:299 12:299 13:299 14: :290 16:290 17: :290 16:290 17: :290 16:290 17:290 Functions for products on the t mode a fl111=phil * (uv1 * length + uv2 * length / (ul1 * ul2 * (18.2 / 18.5) ) * (1 + um1 / 1000)) * um3 a fl112=phil * (uv1 * length + uv2 * length / (ul1 * ul2 * (18.2 / 18.5) ) * (1 + um1 / 1000)) * um3 * 10.9 a fl121=up3 * length / (ul1 * ul2 * (18.2 / 18.5)) * (1 + um1 / 1000) a fl290=0 a fl299=999999

64 62 Appendix H: Assignment plots scenario 0 Fish, commodity group 14, 15 and 16, base network Fresh fish, commodity group 14, base network
65 63 Frozen fish, commodity group 15, base network Other fish, commodity group 16, base network
 and 14 (fishery model), base")
 and 15 (fishery model), base")
66 64 Fresh fish, commodity group 11 (NEMO) and 14 (fishery model), base network Frozen fish, commodity group 2 (NEMO) and 15 (fishery model), base network
67 65 Appendix I: Assignment plots scenario 1 Fish, commodity group 14, 15 and 16, reduced numbers of fishery harbours Fresh fish, commodity group 14, reduced numbers of fishery harbours

68 66 Frozen fish, commodity group 15, reduced numbers of fishery harbours Other fish, commodity group 16, reduced numbers of fishery harbours
Nøkkeltall fra norsk havbruksnæring
 Nøkkeltall fra norsk havbruksnæring Key figures from aquaculture industry 2016 Livet i havet vårt felles ansvar Tittel (norsk/engelsk): Key figures from Norwegian aquaculture industry 2016 Ansvarlig avdeling:
Fishery Statistics 2006
 D404 Statistisk sentralbyrå Statistics Norway Oslo Kongsvinger This series consists mainly of primary statistics, statistics from statistical accounting systems and results of special censuses and surveys,
Official Statistics of Norway D 422. Aquaculture Statistisk sentralbyrå Statistics Norway Oslo Kongsvinger
 Official Statistics of Norway D 422 Aquaculture 2007 Statistisk sentralbyrå Statistics Norway Oslo Kongsvinger Official Statistics of Norway This series consists mainly of primary statistics, statistics
Contents. Norwegian seafood production consumption and export 2. Fisheries and catches 8. Aquaculture 22. Research and innovation 30
 7 8 9 10 11 12 13 14 1 15 16 17 18 19 20 21 22 23 24 25 26 27 28 29 30 31 32 33 34 35 36 Facts about Fisheries and Aquaculture 2008 www.government.no Contents Norwegian seafood production consumption and
Fishery Statistics 2007
 Official Statistics of Norway D 428 Fishery Statistics 2007 Statistisk sentralbyrå Statistics Norway Oslo Kongsvinger Official Statistics of Norway This series consists mainly of primary statistics, statistics
Contents. Norwegian seafood production consumption and export 2. Fisheries and catches 8. Aquaculture 22. Research and innovation 30
 Facts about Fisheries and Aquaculture 2009 www.government.no Contents Norwegian seafood production consumption and export 2 Fisheries and catches 8 Aquaculture 22 Research and innovation 30 Norwegian seafood
Annual Report Norwegian Veterinary Institute. Norwegian Veterinary Institute
 Annual Report 2014 Surveillance programmes for terrestrial and aquatic animals in Norway Annual report 2014 Project managers at the : Ståle Sviland (Terrestrial animals) Anne-Gerd Gjevre (Aquatic animals)
The surveillance and control programme
 Annual Reports 2008 The surveillance and control programme for Gyrodactylus salaris in Atlantic salmon and rainbow trout in Norway Tor Atle Mo Ann-Marit Kristensen Kari Norheim Peder Andreas Jansen Editor
Norwegian coastal fisheries An overview of the coastal fishing fleet of less than 21 meters
 Report 14/214 Published February 214 Norwegian coastal fisheries An overview of the coastal fishing fleet of less than 21 meters Edgar Henriksen Nofima is a business oriented research institute working
The surveillance and control programme
 Annual Reports 2009 Surveillance and control programmes for terrestrial and aquatic animals in Norway The surveillance and control programme for Gyrodactylus salaris in Atlantic salmon and rainbow trout
The surveillance programme for Gyrodactylus salaris in Atlantic salmon and rainbow trout in Norway 2013
 Annual Report 2013 Surveillance programmes for terrestrial and aquatic animals in Norway The surveillance programme for Gyrodactylus salaris in Atlantic salmon and rainbow trout in Norway 2013 Sigurd Hytterød
The Fisheries and Aquaculture Sector in LITHUANIA
 The Fisheries and Aquaculture Sector in LITHUANIA Introduction Source: Baltlanta Lithuania has a relatively short coastline of 90 km, and its territorial waters and exclusive economic zone in the Baltic
The surveillance programme for Gyrodactylus salaris in Atlantic salmon and rainbow trout in Norway 2017
 Annual Report The surveillance programme for Gyrodactylus salaris in Atlantic salmon and rainbow trout in Norway 2017 Norwegian Veterinary Institute The surveillance programme for Gyrodactylus salaris
GERMANY IN THE WORLD AND IN THE EU (2015, source: FAO and Eurostat) FISHING FLEET (2015, source: JRC and Annual Economic Report)
 FISHING FLEET (2015, source: JRC and Annual Economic Report)") GERMANY IN THE WORLD AND IN THE EU (2015, source: FAO and Eurostat) Germany is the EU s 6th largest producer of fisheries and 10th largest of aquaculture products. (1000 tonnes) World EU-28 Germany % World
GERMANY IN THE WORLD AND IN THE EU (2015, source: FAO and Eurostat) Germany is the EU s 6th largest producer of fisheries and 10th largest of aquaculture products. (1000 tonnes) World EU-28 Germany % World
IRELAND IN THE WORLD AND IN THE EU (2015, source: FAO and Eurostat)
") IRELAND IN THE WORLD AND IN THE EU (2015, source: FAO and Eurostat) Ireland is the 7 th EU producer of fisheries and aquaculture products. (1.000 tonnes) World EU-28 Ireland % world % EU-28 Catches 104.635
IRELAND IN THE WORLD AND IN THE EU (2015, source: FAO and Eurostat) Ireland is the 7 th EU producer of fisheries and aquaculture products. (1.000 tonnes) World EU-28 Ireland % world % EU-28 Catches 104.635
DIRECTORATE OF FISHERIES, NORWAY. Report. March Status report for 2005 Russian cod and haddock fishing / transshipment at sea COASTGUARD NORTH
 DIRECTORATE OF FISHERIES, NORWAY Report March 2006 Status report for 2005 Russian cod and haddock fishing / transshipment at sea COASTGUARD NORTH CONTENTS 1 Introduction 1.1 Background of analysis 1.2
FACTS ABOUT THE NORWEGIAN FISHERIES INDUSTRY
 FACTS ABOUT THE NORWEGIAN FISHERIES INDUSTRY 2000 m f acts about the Norwegian Fisheries Industry Norway is a coastal state with both a right and an obligation to manage one of the most productive sea
Scale and nature of emissions from fisheries
 Scale and nature of emissions from fisheries Seas at Risk Climate and the Ocean Impact and Mitigation Challenges for Fishing and Shipping Brussels, 5th November 2008 Harald Ellingsen Department of Marine
POLAND IN THE WORLD AND IN THE EU (2015, source: FAO and Eurostat)
") POLAND IN THE WORLD AND IN THE EU (2015, source: FAO and Eurostat) Poland is the EU s 10th largest producer of fisheries and 9th largest of aquaculture products. (1.000 tonnes) World EU-28 Poland % World
POLAND IN THE WORLD AND IN THE EU (2015, source: FAO and Eurostat) Poland is the EU s 10th largest producer of fisheries and 9th largest of aquaculture products. (1.000 tonnes) World EU-28 Poland % World
Can trawling effort be identified from satellite-based VMS data?
 Not to be cited without prior reference to the author International Council for the Exploration of the Seas Theme session N: Technologies for monitoring fishing activities and observing catch Can trawling
Brexit and fisheries. fishing resources and markets at stake
 Brexit and fisheries fishing resources and markets at stake SÉBASTIEN METZ SAKANA CONSULTANTS January 2018 BREXIT AND FISHERIES: FISHING RESOURCES AND MARKETS AT STAKE. 2 Brexit and fisheries: two major
Norwegian fisheries and aquaculture management
 Norwegian fisheries and aquaculture management Tromsø, 21. September2017 The Ministry of Trade, Industry and Fisheries Minister of Trade and Industry Stat Sekretaries Political Adviser Minister of Fisheries
UK IN THE WORLD AND IN THE EU (2015, source: FAO and Eurostat)
") UK IN THE WORLD AND IN THE EU (2015, source: FAO and Eurostat) The UK is the EU s 3rd largest producer for fisheries and 2nd largest for aquaculture products. (1.000 tonnes) World EU-28 United Kingdom
UK IN THE WORLD AND IN THE EU (2015, source: FAO and Eurostat) The UK is the EU s 3rd largest producer for fisheries and 2nd largest for aquaculture products. (1.000 tonnes) World EU-28 United Kingdom
Statistical News Release
 PRE-RELEASE ACCESS - RESTRICTED UNTIL 9.30 AM on MAY 25, 2017 Statistical News Release A National Statistics Publication for Scotland May 25, 2017 PROVISIONAL SCOTTISH SEA FISHERIES STATISTICS 2016 Provisional
SWEDEN IN THE WORLD AND IN THE EU (2015, source: FAO and Eurostat)
") SWEDEN IN THE WORLD AND IN THE EU (2015, source: FAO and Eurostat) Sweden is the EU s 8 th largest producers of fisheries and 15 th largest of aquaculture products. (1.000 tonnes) World EU-28 Sweden %
SWEDEN IN THE WORLD AND IN THE EU (2015, source: FAO and Eurostat) Sweden is the EU s 8 th largest producers of fisheries and 15 th largest of aquaculture products. (1.000 tonnes) World EU-28 Sweden %
Fish Landings in Shetland and by the Shetland Fleet in 2012
 Port Arthur, Scalloway, Shetland ZE1 UN, Scotland. Tel: 1595 772 Email: info@nafc.ac.uk WWW: www.nafc.ac.uk Fish Landings in Shetland and by the Shetland Fleet in 212 Ian R. Napier ( ian.napier@nafc.uhi.ac.uk
Fisheries and Aquaculture in Croatia
 Fisheries and Aquaculture in Croatia The World Trade Organization (WTO) and fisheries St. Petersburg, 29 31 October 2013 CROATIA Ministry of Agriculture Directorate of Fisheries Božena Vidović, bozena.vidovic@mps.hr
REGULATIONS RELATING TO MESH SIZES, BYCATCHES AND MINIMUM SIZES, ETC., DURING FISHING OPERATIONS IN THE FISHERIES PROTECTION ZONE AROUND SVALBARD
 REGULATIONS AMENDING THE REGULATIONS RELATING TO MESH SIZES, BYCATCHES AND MINIMUM SIZES, ETC., DURING FISHING OPERATIONS IN THE FISHERIES PROTECTION ZONE AROUND SVALBARD On 5 January 2011, under sections
FINLAND IN THE WORLD AND IN THE EU (2015, source: FAO and Eurostat) FISHING FLEET (2015, source: JRC and Annual Economic Report)
 FISHING FLEET (2015, source: JRC and Annual Economic Report)") FINLAND IN THE WORLD AND IN THE EU (05, source: FAO and Eurostat) Finland is the EU s th largest producer of fisheries and 4th largest of aquaculture products. (000 tonnes) World EU-8 Finland % World %
FINLAND IN THE WORLD AND IN THE EU (05, source: FAO and Eurostat) Finland is the EU s th largest producer of fisheries and 4th largest of aquaculture products. (000 tonnes) World EU-8 Finland % World %
Sustainable Fisheries for Future Generations The Fisheries White Paper
 Sustainable Fisheries for Future Generations The Fisheries White Paper Key messages The Fisheries White Paper Sustainable Fisheries for Future Generations charts the course for a sustainable and profitable
Food and Agriculture Organization of the United Nations. Organización de las Naciones Unidas para la Agricultura y la Alimentación
 FISHERY COUNTRY PROFILE Food and Agriculture Organization of the United Nations FID/CP/GNB PROFIL DE LA PÊCHE PAR PAYS Organisation des Nations Unies pour l'alimentation et l'agriculture October 2001 RESUMEN
NETHERLANDS IN THE WORLD AND IN THE EU (2015, source: FAO and Eurostat)
") Netherlands NETHERLANDS IN THE WORLD AND IN THE EU (2015, source: FAO and Eurostat) The Netherlands rank 5 th production. in the EU in terms of fisheries and 6 for farmed (1.000 tonnes) World EU-28 Netherlands
Netherlands NETHERLANDS IN THE WORLD AND IN THE EU (2015, source: FAO and Eurostat) The Netherlands rank 5 th production. in the EU in terms of fisheries and 6 for farmed (1.000 tonnes) World EU-28 Netherlands
REGULATIONS RELATING TO SEA-WATER FISHERIES ************* REGULATIONS AMENDING PROVISIONS ON INFRINGEMENT FINES IN VARIOUS REGULATIONS
 REGULATIONS RELATING TO SEA-WATER FISHERIES ************* REGULATIONS AMENDING PROVISIONS ON INFRINGEMENT FINES IN VARIOUS REGULATIONS Adopted by the Ministry of Trade, Industry and Fisheries on 27 January
COUNTRY NOTE ON NATIONAL FISHERIES MANAGEMENT SYSTEMS -- SPAIN
 COUNTRY NOTE ON NATIONAL FISHERIES MANAGEMENT SYSTEMS -- SPAIN Box 1. Short overview to the fisheries sector 2001 Production level: Landings Aquaculture Canned fish 929 933 tonnes 313 175 tonnes 260 280
LATVIA IN THE WORLD AND IN THE EU (2015, source: FAO and Eurostat) FISHING FLEET (2015, source: JRC and Annual Economic Report)
 FISHING FLEET (2015, source: JRC and Annual Economic Report)") LATVIA IN THE WORLD AND IN THE EU (2015, source: FAO and Eurostat) Latvia is the EU s 13th largest producer of fisheries and 21st largest of aquaculture products. (1.000 tonnes) World EU-28 Latvia % World
LATVIA IN THE WORLD AND IN THE EU (2015, source: FAO and Eurostat) Latvia is the EU s 13th largest producer of fisheries and 21st largest of aquaculture products. (1.000 tonnes) World EU-28 Latvia % World
ESTONIA IN THE WORLD AND IN THE EU (2015, source: FAO and Eurostat)
") ESTONIA IN THE WORLD AND IN THE EU (2015, source: FAO and Eurostat) Estonia is the EU s 16th largest producer of fisheries and 26th largest of aquaculture products. (1.000 tonnes) World EU-28 Estonia %
ESTONIA IN THE WORLD AND IN THE EU (2015, source: FAO and Eurostat) Estonia is the EU s 16th largest producer of fisheries and 26th largest of aquaculture products. (1.000 tonnes) World EU-28 Estonia %
PRESENTATION ON WILD CAUGHT SHRIMP OF INDIA BY MR. A.J. THARAKAN PRESIDENT OF THE SEAFOOD EXPORTERS ASSOCIATION OF INDIA
 PRESENTATION ON WILD CAUGHT SHRIMP OF INDIA BY MR. A.J. THARAKAN PRESIDENT OF THE SEAFOOD EXPORTERS ASSOCIATION OF INDIA 1 INDIAN COASTLINE SHOWING SEAFOOD PROCESSING CLUSTERS Indian Union 29 states, 9
FAO Congress Director Spain; Hildegunn Fure Osmundsvåg 06/10/2017
 FAO Congress 2017 Director Spain; Hildegunn Fure Osmundsvåg 06/10/2017 Kilde ; The institute of marine research 06.10.2017 Presentasjonstittel 2 The Norwegian Seafood Council Who are we? Established in
Figure 1. Structure of Estonian commercial fishing and fish farming in 2010 (% of the total volume)
") Estonia FISHERIES Estonia is a sea and coastal country on the Eastern shore of the Baltic Sea. The territory of Estonia is small 45 227 km 2 the length of our coastline, however, is 3794 km. Good location
Estonia FISHERIES Estonia is a sea and coastal country on the Eastern shore of the Baltic Sea. The territory of Estonia is small 45 227 km 2 the length of our coastline, however, is 3794 km. Good location
Fish Landings in Shetland and by the Shetland Fleet in 2013
 Port Arthur, Scalloway, Shetland ZE1 0UN, Scotland. Tel: 01595 772000 Email: nainfo@uhi.ac.uk WWW: www.nafc.ac.uk Fish Landings in Shetland and by the Shetland Fleet in 2013 Ian R. Napier ( ian.napier@uhi.ac.uk
EFFECTS OF IMPORT AND INVENTORY AMOUNTS ON CHANGES IN WHOLESALE PRICES OF SALMON IN JAPAN
 EFFECTS OF IMPORT AND INVENTORY AMOUNTS ON CHANGES IN WHOLESALE PRICES OF SALMON IN JAPAN Ikutaro Shimizu National Salmon Resources Center, ikutaro@salmon.affrc.go.jp ABSTRACT Japanese salmon fishery is
Figure 1. Structure of Estonian commercial fishing and fish farming in 2011 (% of the total volume)
") Estonia FISHERIES Estonia is a sea and coastal country on the Eastern shore of the Baltic Sea. The territory of Estonia is small 45 227 km 2 ; the length of our coastline, however, is 3794 km. Good location
Estonia FISHERIES Estonia is a sea and coastal country on the Eastern shore of the Baltic Sea. The territory of Estonia is small 45 227 km 2 ; the length of our coastline, however, is 3794 km. Good location
FRANCE IN THE WORLD AND IN THE EU (2015, source: FAO and Eurostat) FISHING FLEET (2015, source: JRC and Annual Economic Report)
 FISHING FLEET (2015, source: JRC and Annual Economic Report)") FRANCE IN THE WORLD AND IN THE EU (2015, source: FAO and Eurostat) France is the EU s 4th largest producer for fisheries and 3rd largest for aquaculture products. (1000 tonnes) World EU-28 France % World
FRANCE IN THE WORLD AND IN THE EU (2015, source: FAO and Eurostat) France is the EU s 4th largest producer for fisheries and 3rd largest for aquaculture products. (1000 tonnes) World EU-28 France % World
3.4.3 Advice June Barents Sea and Norwegian Sea Cod in Subareas I and II (Norwegian coastal waters cod)
") 3.4.3 Advice June 2013 ECOREGION STOCK Barents Sea and Norwegian Sea Cod in Subareas I and II (Norwegian coastal waters cod) Advice for 2014 ICES advises on the basis of the Norwegian rebuilding plan,
3.4.3 Advice June 2013 ECOREGION STOCK Barents Sea and Norwegian Sea Cod in Subareas I and II (Norwegian coastal waters cod) Advice for 2014 ICES advises on the basis of the Norwegian rebuilding plan,
By far the majority of New Zealand s fisheries are performing well
 The Status of New Zealand s Fisheries 214 February 215 Introduction This report summarises the status of New Zealand s fish stocks relative to the requirements of the Harvest Strategy Standard for New
Arctic Frontiers, Tromsø, January 24 th Thorbjørn Thorvik, Senior adviser. The Norwegian Directorate of Fisheries.
 Sustainable harvesting at lower trophic levels: The Norwegian management plan for Calanus finmarchicus and the framework for utilizing mesopelagic species Thorbjørn Thorvik, Senior adviser. The Norwegian
NFR 8. Tuna fisheries in French Polynesia in SCTB16 Working Paper
 SCTB16 Working Paper NFR 8 Tuna fisheries in French Polynesia in 2002 Christophe Misselis Fisheries Department (Service de la Pêche) Tahiti, French Polynesia June 2003 Tuna fisheries in French Polynesia
PORTUGAL IN THE WORLD AND IN THE EU (2015, source: FAO and Eurostat)
") Portugal updated on 16-04-18 PORTUGAL IN THE WORLD AND IN THE EU (2015, source: FAO and Eurostat) Portugal ranks 11 th in the EU for fisheries production and has a lower ranking for aquaculture production.
Portugal updated on 16-04-18 PORTUGAL IN THE WORLD AND IN THE EU (2015, source: FAO and Eurostat) Portugal ranks 11 th in the EU for fisheries production and has a lower ranking for aquaculture production.
1 MATERIAL AND METHOD
 ICES Working Group on the assessment of Mackerel, Horse Mackerel, Sardine and Anchovy. Galway, 5-14 September 26 Working Document The French sardine fishery Erwan Duhamel 1 (1) IFREMER, lab. Fisheries
SCIENTIFIC COMMITTEE SIXTH REGULAR SESSION August 2010 Nuku alofa, Tonga
 SCIENTIFIC COMMITTEE SIXTH REGULAR SESSION 1-19 August 21 Nuku alofa, Tonga Recent status of Japanese skipjack fishery in the vicinity of Japan WCPFC-SC6-21/SA- WP-7 K. Uosaki, H. Kiyofuji, Y. Hashimoto,
Fishery. Fishing vessels (Dept. of Finance)
") Fishery Fishing vessels (Dept. of Finance) The Newfoundland and Labrador fishery recorded a difficult year in 29 due to low market prices, continued pressure from low-cost producers, and an appreciating
Fishery Fishing vessels (Dept. of Finance) The Newfoundland and Labrador fishery recorded a difficult year in 29 due to low market prices, continued pressure from low-cost producers, and an appreciating
ENHANCED PARKWAY STUDY: PHASE 2 CONTINUOUS FLOW INTERSECTIONS. Final Report
 Preparedby: ENHANCED PARKWAY STUDY: PHASE 2 CONTINUOUS FLOW INTERSECTIONS Final Report Prepared for Maricopa County Department of Transportation Prepared by TABLE OF CONTENTS Page EXECUTIVE SUMMARY ES-1
BSAC recommendations for the fishery in the Baltic Sea in 2018
 Copenhagen 7 th July 2017 BSAC recommendations for the fishery in the Baltic Sea in 2018 The BSAC recommends setting the catch levels for the Baltic stocks in 2018 at the values indicated in the table
By far the majority of New Zealand s fisheries are performing well
 The Status of New Zealand s Fisheries 2017 January 2018 Introduction This report summarises the status of New Zealand s fish stocks relative to the requirements of the Harvest Strategy Standard for New
Gas Transportation Planning System in the Department of Economy of Gazprom
 Gas Transportation Planning System in the Department of Economy of Gazprom Victor Dochin Deputy head of the Department, Head of gas balance section Gazprom! The company is the world's largest gas company,
FISH IN - FISH OUT RATIOS EXPLAINED
 FISH IN - FISH OUT RATIOS EXPLAINED BY ANDREW JACKSON One of the long continued debates in aquaculture is the use of fishmeal and fish oil in feeds and the amount of wild fish it takes to produce farmed
RURAL COMMUNITY QUOTAS IN NORWAY - INTENTIONS AND IMPACTS
 RURAL COMMUNITY QUOTAS IN NORWAY - INTENTIONS AND IMPACTS Oystein Hermansen Nofima Market, Tromso, Norway, oystein.hermansen@nofima.no Bent Dreyer Nofima Market, Tromso, Norway, bent.dreyer@nofima.no ABSTRACT
Leif Nøttestad, Øyvind Tangen and Svein Sundby
 Possible mechanisms and explanations for the drastic decline and disappearance of Atlantic bluefin tuna in the Norwegian fisheries since the early 1960s: What went wrong and what can we do? Leif Nøttestad,
Aquaculture growth potential in Azerbaijan
 Aquaculture growth potential in Azerbaijan Policy brief for FAO TCP/AZE/372/C2 Assessment of state-owned fish farms for sustainable development of the aquaculture sector in Azerbaijan (prepared by Junning
Fishery Statistics. Value of fish production million in December 2002
 23 December 2002 Fish production Value 2001 Fishery Statistics 2001 nland Sea Inland Total landings Aquaculture catches production a l e 2000 188.9m 95.4m 3.4m 287.6m 2001 206.2m 107.1m 3.0m 316.3m % change
Fisheries Control Regulations
 Fisheries Control Regulations Traceability and consumer information requirements Note: These regulations include the consumer information requirements currently provided under Commission Regulation (EC)
Energy Consumption of Small Scale Fishing Vessel Operations in Indonesia A Case Study in Palabuhanratu, Indonesia
 Energy Consumption of Small Scale Fishing Vessel Operations in Indonesia A Case Study in Palabuhanratu, Indonesia Vita R KURNIAWATI Richard W BIRMINGHAM Alan J MURPHY School of Marine Science and Technology
Best Practice Guidance for Assessing the Financial Performance of Fishing Gear: Industry-led gear trials
 Best Practice Guidance for Assessing the Financial Performance of Fishing Gear: Industry-led gear trials Prepared for The UK Fisheries Economic Network (UKFEN) by Seafish Introduction and Background Reducing
SEEA Flow Accounts for Fisheries SEEA- AFF and IEEA for Fisheries: Experiences from the Seychelles
 SEEA Flow Accounts for Fisheries SEEA- AFF and IEEA for Fisheries: Experiences from the Seychelles 2016 London Group Oslo, Norway 28-30 September 2016 Session E, Item 15 Julie L. Hass, Ph.D. Independent
Creating Value from Cod Processing in Norway
 Creating Value from Cod Processing in Norway H. Manuel & R. Hayter, Marine Institute November 29, 2017 Gander, NL Red & White Creating Value from Salmon and Cod Processing in Norway Site Visits in Norway
Roundabouts along Rural Arterials in South Africa
 Krogscheepers & Watters 0 0 Word count: 00 text + figures = 0 equivalent words including Title and Abstract. Roundabouts along Rural Arterials in South Africa Prepared for: rd Annual Meeting of Transportation
STECF EXPERT WORKING GROUP EWG 18-09
 STECF EXPERT WORKING GROUP EWG 18-09 on a fishing effort regime for demersal fisheries in the western Mediterranean Sea 18-22 June 2018, Arona, Italy DG MARE focal point: Amanda Perez Perera Chair: Clara
CORPORATE SOCIAL RESPONSIBILITY. The Best Fish from the Best Fishermen
 CORPORATE SOCIAL RESPONSIBILITY The Best Fish from the Best Fishermen Wild-caught Fish Organisations worldwide are checking fish stocks, inspecting waters, measuring fish and tracking down illegal fishermen
AGEC 604 Natural Resource Economics
 AGEC 64 Natural Resource Economics Photo NOAA Fishery Management Issues Fisheries Renewable Resource Whose Stock can be Continuously Replenished Renewable but exhaustible Example of common property resources
THE NORWEGIAN STRUCTURAL POLICY - MAINTAINING PRODUCTIVITY GROWTH WITH A LIMITED NATURAL RESOURCE.
 THE NORWEGIAN STRUCTURAL POLICY - MAINTAINING PRODUCTIVITY GROWTH WITH A LIMITED NATURAL RESOURCE. Rolv Dahl-Jørgensen, The Norwegian Ministry of Fisheries and Coastal Affairs, rdj@fkd.dep.no ABSTRACT
Council CNL(17)33. Annual Progress Report on Actions Taken Under the Implementation Plan for the Calendar Year EU - Denmark
33. Annual Progress Report on Actions Taken Under the Implementation Plan for the Calendar Year EU - Denmark") Agenda item 6.3 For information Council CNL(17)33 Annual Progress Report on Actions Taken Under the Implementation Plan for the Calendar Year 2016 EU - Denmark CNL(17)33 Annual Progress Report on Actions
Agenda item 6.3 For information Council CNL(17)33 Annual Progress Report on Actions Taken Under the Implementation Plan for the Calendar Year 2016 EU - Denmark CNL(17)33 Annual Progress Report on Actions
New England Fishery Management Council MEMORANDUM
 New England Fishery Management Council 50 WATER STREET NEWBURYPORT, MASSACHUSETTS 01950 PHONE 978 465 0492 FAX 978 465 3116 John Pappalardo, Chairman Paul J. Howard, Executive Director MEMORANDUM DATE:
SEAFISH ECONOMIC ANALYSIS
 SEAFISH ECONOMIC ANALYSIS UK 15m & over Scallop Fleet Area VII Economic analysis of the UK 15m and over scallop fishing fleet in ICES Area VII March 2016 AUTHORS: Arina Motova (Seafish) Hazel Curtis (Seafish)
STOCK ASSESSMENT AND FISHERY EVALUATION REPORT FOR THE GROUNDFISH FISHERIES OF THE GULF OF ALASKA AND BERING SEA/ALEUTIAN ISLAND AREA:
 STOCK ASSESSMENT AND FISHERY EVALUATION REPORT FOR THE GROUNDFISH FISHERIES OF THE GULF OF ALASKA AND BERING SEA/ALEUTIAN ISLAND AREA: ECONOMIC STATUS OF THE GROUNDFISH FISHERIES OFF ALASKA, 1998 by Terry
Seafood Industry Factsheet
 Seafood Industry Factsheet Cod Market overview: Cod The three species, tuna salmon and cod dominate the UK retail seafood market by volume. This report summarises both the UK imports and exports of cod
Risk Assessments in the Pacific Fisheries for BC & Yukon
 Risk Assessments in the Pacific Fisheries for BC & Yukon MARCH, 2017 CONTENTS Introduction to Risk Assessments... 2 Q&As on the Risk Assessment Process... 3 Overview of the Risk Assessment Tool... 4 Example
GENERAL INFORMATION ON TOGO RELATED TO FISHERIES
 51 TOGO 1. INTRODUCTION This document is aimed at providing reference information on the present status of fishery information and data collection in Togo for the discussion during the FAO FishCode- STF/CECAF/FCWC
North Pacific Fishery Management Council. Community considerations in Federally-managed fisheries. April 2005
 North Pacific Fishery Management Council Community considerations in Federally-managed fisheries April 2005 Why are Fisheries Off Alaska so important to communities? Would rank in the top 10 producing
IPHC Regulatory Area 2A Directed Commercial Pacific Halibut Fishery Sample Vessel Fishing Period Limit Options for Longer Fishing Periods
 Agenda Item G.1.a IPHC Report 1 September 2017 IPHC Report September 2017 IPHC Regulatory Area 2A Directed Commercial Pacific Halibut Fishery Sample Vessel Fishing Period Limit Options for Longer Fishing
Structural Adjustment in Australia s South East Trawl Fishery. Frank Meere
 Structural Adjustment in Australia s South East Trawl Fishery Frank Meere 1 What are we talking about? 2 Australian fisheries 3 The South East Trawl Fishery 4 What am I going to talk about? Some background
Council CNL(14)45 The management approach to salmon fisheries in Norway (Tabled by Norway)
45 The management approach to salmon fisheries in Norway (Tabled by Norway)") Agenda Item 6.2 Agenda Item 6.2 For Information Council CNL(14)45 The management approach to salmon fisheries in Norway (Tabled by Norway) 1983 1985 1987 1989 1991 1993 1995 1997 1999 2001 2003 2005 2007
Agenda Item 6.2 Agenda Item 6.2 For Information Council CNL(14)45 The management approach to salmon fisheries in Norway (Tabled by Norway) 1983 1985 1987 1989 1991 1993 1995 1997 1999 2001 2003 2005 2007
SPAIN IN THE WORLD AND IN THE EU (2015, source: FAO and Eurostat)
") SPAIN IN THE WORLD AND IN THE EU (2015, source: FAO and Eurostat) Spain is the EU s largest producer for fisheries and for aquaculture products. (1.000 tonnes) World EU-28 Spain % world % EU-28 Catches
SPAIN IN THE WORLD AND IN THE EU (2015, source: FAO and Eurostat) Spain is the EU s largest producer for fisheries and for aquaculture products. (1.000 tonnes) World EU-28 Spain % world % EU-28 Catches
Use of a reference fleet of fishing vessels for collection of data
 The 11 th Joint Russian-Norwegian Symposium. ECOSYSTEM DYNAMICS AND OPTIMAL LONG-TERM HARVEST IN THE BARENTS SEA FISHERIES. Murmansk, PINRO, 15-17 August 2005 Use of a reference fleet of fishing vessels
Beamex. Calibration White Paper. Weighing scale calibration - How to calibrate weighing instruments
 Beamex Calibration White Paper info@beamex.com Weighing scale calibration - How to calibrate weighing instruments Weighing scale calibration - How to calibrate weighing instruments Weighing scales, weighing
The fishery for jack mackerel in the Eastern Central Pacific by European trawlers in 2008 and 2009
 Eighth International Meeting: SWG: Jack Mackerel Sub-Group SP-08-SWG-JM-01 The fishery for jack mackerel in the Eastern Central Pacific by European trawlers in 2008 and 2009 Ad Corten Corten Marine Research
SA2 + Div. 3K Redfish
 Fisheries and Oceans Pêches et Océans Canada Canada DFO Science Stock Status Report A2-15(21) entered the fishery in 1975 and averaged about 16,5 t from 1978-1986. The steady reduction in catches from
Maximising net economic returns in mixed fisheries: how many species do we need to control?
 Maximising net economic returns in mixed fisheries: how many species do we need to control? Trevor Hutton, Sean Pascoe, James Innes, Satoshi Yamazaki and Tom Kompas Contributed presentation at the 60th
3. DYNAMICS OF GLOBAL CLIMATIC INDICES AND MAIN COMMERCIAL CATCHES
 11 3. DYNAMICS OF GLOBAL CLIMATIC INDICES AND MAIN COMMERCIAL CATCHES An important question is whether the main commercial stock production is affected by common factors, which also control the synchronous
Management advisory for the Bay of Bengal Indian mackerel fishery
 Management advisory for the Bay of Bengal Indian mackerel fishery What is the BOBLME RFMAC The BOBLME Project is supporting countries to implement an ecosystem approach to fisheries management of shared
SUSTAINABLE SEAFOOD MATCHING
 RAINY DAY KITS FOR ENVIRONMENTAL EDUCATION This Lesson Created in Partnership with: SUSTAINABLE SEAFOOD MATCHING Overview Students play a matching game to learn about different fish species and whether
Value of time, safety and environment in passenger transport Time
 TØI report 1053B/2010 Author(s): Farideh Ramjerdi, Stefan Flügel, Hanne Samstad and Marit Killi Oslo 2010, 324 pages Norwegian language Summary: Value of time, safety and environment in passenger transport
UK Seafood Value Chain 2017 Provisional
 UK Seafood Value Chain 2017 Provisional Sources: Nielsen ScanTrack GB Total Coverage including Discounters and Northern Ireland including Musgraves 30.12.17, Nielsen HomeScan GB 30.12.17, The NPD Group/CREST
WF4133 Fisheries Science. Housekeeping. Random selection from lab WHAT EXACTLY IS FISHERIES SCIENCE?
 WF4133 Fisheries Science WHAT EXACTLY IS FISHERIES SCIENCE? Module 1:Introduction to class, fisheries profession, & fisheries science Class 2 Random selection from lab 25 big fish & 75 small fish 0.25
Effects on traffic and emissions of densification in nodes in Bergen, Kristiansand and Oslo
 Summary Effects on traffic and emissions of densification in nodes in Bergen, Kristiansand and Oslo TØI Report 1575/2017 Authors: Aud Tennøy, Frants Gundersen, Oddrun Helen Hagen, Marianne Knapskog & Tanu
Advice June Capelin in Subareas V and XIV and Division IIa west of 5 W (Iceland East Greenland Jan Mayen area).
.") 2.4.12 Advice June 2012 ECOREGION Iceland and East Greenland STOCK Capelin in Subareas V and XIV and Division IIa west of 5 W (Iceland East Greenland Jan Mayen area) Advice for 2013 ICES advises on the
2.4.12 Advice June 2012 ECOREGION Iceland and East Greenland STOCK Capelin in Subareas V and XIV and Division IIa west of 5 W (Iceland East Greenland Jan Mayen area) Advice for 2013 ICES advises on the
Recommendations for the Risk Assessment of Buffer Stops and End Impact Walls
 Recommendations for the Risk Assessment of Buffer Stops and End Synopsis This document gives details of a recommended method which, if followed, would meet the requirements of section 11, Buffer Stops
2.3.1 Advice May Capelin in Subareas V and XIV and Division IIa west of 5 W (Iceland East Greenland Jan Mayen area).
.") 2.3.1 Advice May 2014 ECOREGION Iceland and East Greenland STOCK Capelin in Subareas V and XIV and Division IIa west of 5 W (Iceland East Greenland Jan Mayen area) Advice for 2014/2015 ICES advises on
2.3.1 Advice May 2014 ECOREGION Iceland and East Greenland STOCK Capelin in Subareas V and XIV and Division IIa west of 5 W (Iceland East Greenland Jan Mayen area) Advice for 2014/2015 ICES advises on
While oil and gas is the nations largest export product in value, fish is the second largest. Both activities are crucial for the Norwegian economy.
 Oil and fish in Norwegian waters conflict or coexistence? Kristoffersen Arne, Norwegian Coastal Fishermen Union representative, Norway 1. Presentation: Arne Helge Kristoffersen: Representative from the
OCEAN2012 Fish Dependence Day - UK
 OCEAN2012 Fish Dependence Day - UK Europeans are now so dependent on fish products originating from external waters that half the fish they consume are sourced outside the EU Fish dependence: The EU s
Organisation de Coopération et de Développement Economiques Organisation for Economic Co-operation and Development
 For Official Use AGR/FI(2000)16/ADD1/REV1 AGR/FI(2000)16/ADD1/REV1 For Official Use Organisation de Coopération et de Développement Economiques Organisation for Economic Co-operation and Development 21-Sep-2001