Roundabouts along Rural Arterials in South Africa
|
|
|
- Dwayne Beasley
- 6 years ago
- Views:
Transcription
1 Krogscheepers & Watters 0 0 Word count: 00 text + figures = 0 equivalent words including Title and Abstract. Roundabouts along Rural Arterials in South Africa Prepared for: rd Annual Meeting of Transportation Research Board, Washington D.C., January -, Prepared by: JC Krogscheepers Pr.Eng, Ph.D. ITS Engineers (Pty) Ltd, Imperial Bank Terraces, Tyger Waterfront, Bellville, Cape Town, 00 Tel: + ; christoff@itse.co.za M Watters Pr.Eng Western Cape Government, Dorp Street, Cape Town, 000, Tel + malcolm.watters@westerncape.gov.za Corresponding Author: JC Krogscheepers Paper No: - Submission Date: November
2 Krogscheepers & Watters 0 0 ABSTRACT The use of roundabouts in both an urban and rural context have been gaining ground over the past twenty years not only in South Africa, but also in many other parts of the world. Apart from the geometric design details and the operational characteristics of roundabouts there is also no clear guidance in terms of the spacing of roundabouts, specifically when it comes to using them along a high order road. Often the spacing requirements for signals along arterials are being used as a guideline to determine the spacing of roundabouts. This paper explores the practical use of roundabouts along arterials and specifically along high speed rural arterials with relatively high commuter traffic volumes. This is done for a rural arterial in the Western Cape, South Africa. The focus of the evaluation is specifically done in the context of operational efficiencies, access management and future capacity requirements of the arterial. The operational efficiencies of the roundabouts along the corridor, currently and under future higher demand scenarios, was evaluated using micro-simulation analysis where roundabout control is compared with traffic signal control. The comparison of the simulation results clearly highlights the operational advantages of using roundabouts, but is also illustrates possible future capacity constraints for the roundabout scenarios. Based on the simulation results it is evident that roundabouts could play a role in the rural arterial context, not only operationally but also in terms of safety and future capacity expansions. INTRODUCTION Over the past decade, roundabouts have been considered increasingly as an important type of intersection control at major intersections. Mostly because of the low average delay to vehicles when considered for the full day and also because of the many safety advantages. As part of the development of an Arterial Management Plan for the R0 that connects the town of Stellenbosch in the Western Cape with the N and Malmesbury further to the north, the question was raised how to deal with the major intersections along the route (). Although the route runs mostly through a rural area, the demand for direct access off the R0 is steadily increasing due to the number of wine farms along the route and the owners that are looking to increase the tourist potential of the properties. Not only is there a demand for direct access to individual properties, but there are a number of current and planned future roads that are and will be intersecting with the R. Most of the intersections, except one that is currently signalised, are stop controlled on the minor approaches or even stop controlled on all approaches. The R0 is a strategic north-south link between the N through Malmesbury via the N and Stellenbosch to the N in Somerset West. The locality of the route is shown in the following figure. Primary Objectives The objective of this study was firstly to evaluate the operational impacts of roundabouts as the primary intersection control along a rural arterial and to compare that with other types of intersection control, specifically traffic signals. Secondly, the objective was to evaluate the spacing requirements of roundabouts when compared to that of traffic signalised intersections, specifically in the light of existing guidelines which are mostly silent on the spacing requirements of roundabouts (). The safety and other benefits of roundabouts are widely publicised and are not considered specifically in this study (,). Study Roadway The study roadway includes the R0 or Provincial Main Road (MR ) between the N Freeway and the town of Stellenbosch. The study only covered the southern section of the R0 between KM.0 and KM 0.0, i.e. approximately.0 kilometres. There are six major intersections along the study roadway as well as many direct property accesses. For the purposes of this study only the six major intersections were included. The actual distances between the intersections are illustrated in Figure and vary from 0 metres to nearly kilometres.
.")
3 Krogscheepers & Watters Figure : Locality Map STUDY APPROACH The study investigated the operational efficiencies of traffic signals and roundabouts at the major intersections along this rural arterial. The Paramics micro-simulation model was used to simulate operations during a typical weekday (). A typical daily demand profile was used as input to the model and a -hour period was modelled. The model was validated to ensure that the modelled volumes, queue lengths and average speeds were similar to the existing. The following traffic volume scenarios were evaluated: Short Term Scenario: Existing traffic plus % growth ( - year horizon) Medium Term Scenario: Existing traffic plus 0% growth (- year scenario) Long Term Scenario: Existing traffic plus 0% growth ( year scenario) The traffic control and actual lane configuration at the intersections were adjusted with the increase in volumes to ensure realistic capacities for the intersections. For the roundabout options, this was only done up to a double lane roundabout with left-turn slip lanes where necessary. ROAD NETWORK AND INTERSECTION CONTROL The R0 is currently a two-lane two-way roadway for most of its length with turning lanes at some of the intersections. There are many passing opportunities since the topography is mainly flat and many slower motorists allow faster vehicles to pass by moving to the shoulder. The roadway cross-section consist of what is defined as a Class type by the Western Cape Government and which typically consist of two.-metre travel lanes with.0 metre shoulders on both directions (Refer to Figure ).


4 Krogscheepers & Watters Figure : Typical Cross Sections along the R0 All the intersections are currently unsignalised with stop control on the minor approaches, i.e. free flow along the R0. The only exceptions are the Bottelary Road intersection, which is signalised with dedicated turning lanes and the Welgevonden Intersection which was recently signalised. The latter happened after this study was completed. Many of the intersections are experiencing capacity constraints and with an increase in traffic volumes, this situation will naturally deteriorate to a point where another type of control will be required like a traffic signal or a roundabout. Many of the direct accesses to farms and other uses do not have dedicated turning lanes and turning vehicles have to stop in the through lane to wait for an acceptable gap in the opposing traffic to turn. From previous work, it has already been established that the road will require dualling within the near future to ensure that acceptable levels of service are maintained, not only along the mainline sections, but also at the intersections. For the purposes of the evaluation, it was assumed that the road would remain a single lane roadway, but that the intersections will be upgraded to allow the maximum capacity at the intersections within the constraints of a single lane arterial. TRAFFIC VOLUMES The current daily volumes vary from less than 000 vehicles per day north of the N Interchange to approximately 000 vehicles per day south of Bottelary Road. The volumes between the interchange and Bottelary road vary around 000 vehicles per day. The variation in traffic volumes over a typical day along the section north of Bottelary Road where the daily volumes vary around 000 vehicles is illustrated in Figure. The morning and evening peak hour volumes of between 00 and 00 vehicles per hour are typically between. and. percent of the AADT. The traffic volumes during the evening peak are slightly higher than during the morning peak Traffic Volumes (veh/hour) Modeled Actual 0 0 Time of Day Figure : Variation in daily traffic volumes along the R0 between Old Paarl Road and Bottelary Road
5 Krogscheepers & Watters The variation in traffic volumes as modelled over a typical day was increased with the following percentages to replicate future demand scenarios: % Increase = percent growth per annum over to year period [Short Term] 0% Increase = percent growth per annum over to year period [Medium Term] 0% Increase = percent growth per annum over to year period [Long Term] o MODELLING The network that was included in the modelling was a collapsed version of the actual network as illustrated in Figure. The long distances between the Old Paarl and Bottelary Road intersections as well as between the Bottelary Road and Welgevonden Road intersections were reduced from. km to. km and from. km to 00 metres respectively. This was done to reduce the modelling time and to create a more compact network. The more compact network should be an advantage to the traffic signal control scenario since it supports synchronisation of signal timings. However, once intersections are spaced more than.0 km apart, the efficiency of synchronisation disappears since platoons disperse to the extent that arrivals can be considered random. The signal timings of the individual intersections were optimised for the different demand scenarios and also synchronised as far as possible. For the purposes of this exercise, the model was built using the recommended default values available for the variables in Paramics. It was then visually checked to ensure that the queues that develop at the control intersections correspond with what is observed in the field. The modelled speeds and volumes were also checked against the actual counted volumes and the observed free flow speeds. There are no locally available calibration parameters for simulating driver behaviour in Paramics, specifically such as gap acceptance at roundabouts. The simulation model results, specifically the queue lengths were compared against estimates provided by the analytical HCM and Sidra methodologies. The Paramics model is based on the assigning of vehicular trips between origin and destination zones. The OD-matrices for both alternatives were exactly the same in terms of the volume as well as the variation over the hour and the day. The model was setup to run a short warm-up time before the actual demand files were introduced. However, since the whole day was modelled from early morning when the network is essentially empty to late evening, the impact of the warm-up period on the modelling results was negligible. Each of the scenarios was simulated with at least five different seed numbers and an average of the five runs was used for comparison of the results. RESULTS For the purposes of this study the following network performance measures were used: Average speeds of all vehicles in the system Standard deviation of the speeds of all the vehicles in the system Average delay per vehicle in the system Average travel times between defined origins and destinations The time-space movement of selected individual vehicles. Average Speeds The average speeds for all vehicles in the network and for the two alternatives are illustrated in Figure and Figure. In Figure, the average speed is shown for each minute interval over a normal weekday, while in Figure these speeds were averaged for the specific demand period and in addition to the average speeds, the standard deviation during a demand period is also illustrated. These results are only for the first demand scenario with percent growth. It is evident from both figures that in general, the average system speeds for the roundabout option are higher than those of the signal control alternative. The difference in average speeds is significantly more during the off- and evening periods where it is generally 0 percent higher for the roundabout option. During the peak hours the average speeds for the roundabout option are nearly 0 percent higher. As the demand increases the difference in average speeds during the off-peak hours remain more or less similar to the percent scenario. However, during
6 Krogscheepers & Watters the peak hours, the average speeds for the roundabout options decrease to the point where, during the p.m. peak hour with a 0 percent increase in demand, the average speed for the roundabout option becomes less than that for the traffic signal option. The decrease in speeds for the roundabout option is essentially due to the capacity constraints of the Bottelary intersection where the 0 percent increase in demand scenario will result in the capacity of the roundabout being exceeded Average System Speed (km/h) Roundabout Traffic Signal 0 0:00 :00 :00 :00 :00 :00 :00 :00 :00 :00 :00 :00 :00 :00 :00 :00 :00 :00 :00 :00 :00 :00 :00 Time of Day Figure : Average Speeds of All Vehicles (% Increase in Volumes) per minute of a weekday Average System Speed (km/h) Traffic Signal Average Roundabout Average 0 0:00 :00 :00 :00 :00 :00 :00 :00 :00 :00 :00 :00 :00 :00 :00 :00 :00 :00 :00 :00 :00 :00 :00 :00 Time of Day Figure : Average Speeds and Speeds within one Standard Deviation per demand period of a weekday (% Increase in Volumes) Apart from the average speed per time interval as simulated, the variation in the average speeds from time interval to interval should be noted. The impact of the delay of a single vehicle during a time interval with low demand is more significant during a low demand interval, compared to when there are several vehicles during the interval. The variation during the low demand periods is similar for both alternatives, but during the peak hours and the midday period, the variation in average speeds is much more significant for the traffic signal option than for the roundabout option. The variation in average speeds for the traffic signal option is due to the impact of the traffic signal phasing. During intervals when the signals are red and the majority of the vehicles are stopped, the average speed will be low, while during a green interval the average speeds will be high. The signals were coordinated with red and greens at all signals displayed in a constant pattern. The phasing was optimised to ensure that the optimum cycle length and phasing was used for the current demand during all hours, except during the midday peak period, where a longer cycle length (0 seconds) was used compared to that used in the off-peak hours (0 seconds). The demand during the off-peaks and midday period was similar. The longer cycle length during the midday peak period resulted in higher average speeds, but also in much more variation in average speeds.
7 Krogscheepers & Watters It is evident from these comparisons that the roundabouts option will ensure higher average speeds during most times of the day and also more reliable travel times for all vehicles. Under the traffic signal control option, some drivers can experience relatively low speeds and long travel times when having to stop at red signals compared to other vehicles who might encounter mostly green signal phases resulting in higher average speeds and shorter travel times. As the demand increases to levels where the capacity of the roundabouts are approached, the average speeds on the capacity constrained approaches will impact the average speeds of the system. Average Delay The average delay per vehicle over the entire simulation day is illustrated in Figure for the percent demand scenario. 0 Average delay per Vehicle (Seconds/vehicle) Roundabout Traffic Signal 0 0:00 :00 :00 :00 :00 :00 :00 :00 :00 :00 :00 :00 :00 :00 :00 :00 :00 :00 :00 :00 :00 :00 :00 0 Time of Day Figure : Average delay per vehicle (% Increase in Volumes) over a normal weekday For the percent demand scenario, the average delay per vehicle during the off-peak hours is similar ( seconds per vehicle) for the two scenarios, although it is slightly lower for the roundabout control scenario. Once the peak hours start and the higher volumes are introduced the average delay per vehicle for the traffic signal scenarios increases to more than 0 seconds while for the roundabout scenario it increases to less than 0 seconds. As the demand volumes increase to more than 0 percent of the current demand, the delay per vehicle for the two options is similar for most of the day until the p.m. peak period. During the latter period, the demand at the Bottelary Road intersection exceeds the capacity of the two-lane roundabout, resulting in significantly higher delays for the roundabout option compared to the signal option. The comparison of the average delays clearly indicates that the delay per vehicle for the roundabout options is generally lower than the traffic signal option, until the capacity of one or more of the roundabouts is exceeded. Average Travel Times between Major Origins and Destinations The average travel times and average delay per vehicle discussed in the above sections, report on a system-wide measure which includes data for all vehicles in the system and from all origins to all destinations for a specific time interval. A more detailed evaluation of the traffic operations between the major origins and destinations was also done and specifically between the N and Stellenbosch, and between Bottelary Road and Stellenbosch. The results of the evaluation are summarized in Figure for the scenario with a percent increase in demand. The graph shows the difference in travel times for the specific origin-destination pair indicated on the x-axis of the graph. A positive number indicates that the traffic signal control option resulted in shorter travel times, while a negative number indicates that the roundabout option resulted in the shorter travel time.
8 Krogscheepers & Watters Time Difference (s) (Traffic Signals Roundabouts) 0 0 OFF AM MD PM 0 N to Stellenbosch Bottelary to Stellenbosch Stellenbosch to N Origin to Destination Stellenbosch to Bottelary Figure : Differences in Average Travel Time (% increase in demand) For the scenario with a percent increase in demand, the roundabout option resulted in shorter travel time for all the O-D pairs and for all times of the day, except for the N to Stellenbosch and back during the off-peak hours. This means that during these low speed periods, it is possible to travel faster through the system along the R0 and on average arrive at the traffic signals on green without having to stop. As the traffic volumes increase with 0 and 0 percent, the benefits of the roundabout option decrease with a relatively smaller difference in travel speed when comparing the two alternatives. This is the case for all time periods, except during the p.m. peak hour where it is evident that the demand at one or more of the roundabouts reached the capacity of the roundabout/s with the associated impact on travel time. The capacities of the roundabouts were not increased beyond that of the two-lane roundabout which is obviously not sufficient when compared to that of the signal controlled option. More detailed investigation revealed that the constraint occurred at different roundabouts depending on the time of day. Figure : Differences in Average Travel Time (0% increase in demand)


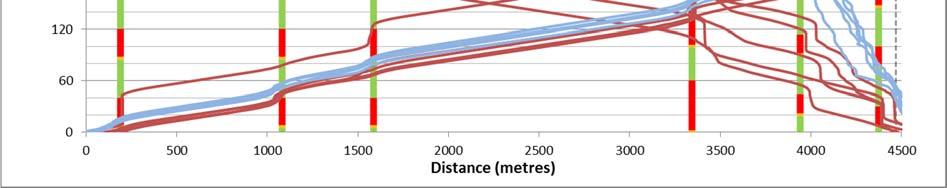
9 Krogscheepers & Watters From the above figure it is evident that the roundabout scenario is optimal even with a 0 percent increase in demand for all the major origin-and-destination pairs except for the following: o During the a.m. peak period for vehicles travelling from the N to Stellenbosch o During the p.m. peak period for vehicles leaving Stellenbosch to both N and Bottelary. Travel Times of Individual Vehicles To understand the reason for the change in average travel times with an increase in demand as outlined above, the path of individual vehicles were tracked through the network and specifically from the N to Stellenbosch and back. The simulated vehicles were selected randomly and the time-distance profiles are presented in several graphs. The profiles for the a.m. and p.m. peak period and for the scenario with a percent increase in demand are illustrated in Figure and Figure, respectively. These figures illustrate the time on the y-axis that it takes to cover a specific distance (x-axis) for different randomly selected vehicles and for the two control scenarios. The blue paths are vehicles tracked through the roundabout scenario and the red paths are for vehicles tracked through the traffic signal scenario. The paths for both directions of travel are plotted with the traffic signal phasing indicated at each of the intersections. The signal timing is obviously only relevant to the traffic signal scenario. The vehicle paths start at time zero and increase over time as the vehicle travels along the route. The steeper the gradient of the path the slower the vehicle moves, with a vertical line indicating a stationary vehicle. From these profiles the following are evident for the percent increase in demand scenario: Vehicles generally travel along the arterial at a constant speed except for slower speeds at the roundabouts and zero speeds whenever they stop at a signal. Whenever vehicles are not stopped by the red phases the travel times are shorter than that of the roundabout option. However, it generally just takes one stop to increase the travel time to more than that of the roundabout option. The larger variation in travel times for the traffic signal option is evident when compared to the roundabout option, with some vehicles stopping on red and others not. 0 Figure : Time-Distance profiles of Individual Vehicles - AM Peak (% increase in demand)


10 Krogscheepers & Watters Figure : Time-Distance profiles of Individual Vehicles - PM Peak (% increase in demand) In Figures and are illustrated the vehicle paths for the scenario where there is an increase in demand of 0 percent, again for the a.m. and p.m. peak periods. The paths are significantly different from the percent increase in demand scenario and it is evident that: During the a.m. peak period, the roundabout at Bottelary Road cannot accommodate the eastbound demand resulting in long delays for vehicles travelling from the N to Stellenbosch. The remainder of the network operates acceptably during the a.m. peak period for both the roundabout and traffic signal control scenarios. During the p.m. peak period, the constraint is the intersection at Welgevonden Road, specifically the westbound direction through the roundabouts but to some extent for the signal option also. The remainder of the network operates acceptably, with the roundabout options outperforming the signal option in terms of travel times. It is evident from the modelling results that roundabouts offer various benefits compared to traffic signal control: More predictable travel times, i.e. less variation in travel times and delays Less delay and faster travel times for most times of the day and for a variation in traffic demand. On the other hand it is also evident that the capacities of some of the two-lane roundabouts (used in the simulation) were reached at lower levels of demand than when compared with that of the traffic signal option. These capacities were reached with an increase in demand of approximately 0 percent beyond current levels, which represents a design life of to years depending on the actual growth in traffic.


11 Krogscheepers & Watters Figure : Time-Distance profiles of Individual Vehicles - AM Peak (0% increase in demand) Figure : Time-Distance profiles of Individual Vehicles - PM Peak (0% increase in demand)
12 Krogscheepers & Watters 0 CONCLUSIONS The aim of this study was to evaluate the operational impacts of roundabouts as the primary intersection control along a rural arterial and to compare that with specifically traffic signals. From the results of the study it can be concluded that: Roundabouts offer significant operational benefits when compared with traffic signals even along high volume major arterials. Roundabouts could result in more reliable average travel times and speeds when compared to traffic signals. Roundabouts are self-regulating and the operations are directly impacted by the presence of other vehicles, which is specifically evident during low demand periods. Low demand periods exist for a large part of the normal day. The operational benefits throughout the day when roundabouts are used compared to traffic signals, should emphasize the use of roundabouts along arterials. Note that this is concluded based on the specific scenarios evaluated as part of this study and should not be applied blindly without a detailed engineering evaluation. The safety benefits of roundabouts for all road users are widely reported, and combined with the operational benefits outlined in this study, make a compelling case for the use of roundabouts even along high volume arterials. Roundabouts have less capacity than traffic signals and could result in worse operating conditions during some of the peak periods of the day when compared to traffic signals. This holds specifically for two lane roundabouts compared to traffic signals with four lanes per approach, i.e. turning lanes and through lanes. The possible capacity constraints need to be considered during the design and evaluation process, while also bearing in mind future upgrade alternatives such as grade separation and/or the possible conversion to traffic signals. REFERENCES. An Access Management Plan for MR, ITS Engineers, January.. Western Cape Government, Road Access Guidelines and Policy, February 0.. Roundabouts: An Informative Guide. FHWA-RD-00-, Federal Highway Administration, Washington, DC, 00.. Roundabouts in the United States. National Cooperative Highway Research Program (NCHRP) Report, Transportation Research Board of the National Academies, Washington, D.C., 0.. Paramics User Guide, Quadstone, November.
LYNNWOOD ROAD ARTERIAL STUDY The effect of intersection spacing on arterial operation
 LYNNWOOD ROAD ARTERIAL STUDY The effect of intersection spacing on arterial operation A J Joubert*, S L Burnett**, and T Ueckermann* *PWV Consortium, PO Box 1109, Sunninghill 2157 **Gautrans, Gauteng Department
EFFICIENCY OF TRIPLE LEFT-TURN LANES AT SIGNALIZED INTERSECTIONS
 EFFICIENCY OF TRIPLE LEFT-TURN LANES AT SIGNALIZED INTERSECTIONS Khaled Shaaban, Ph.D., P.E., PTOE (a) (a) Assistant Professor, Department of Civil Engineering, Qatar University (a) kshaaban@qu.edu.qa
SIDRA INTERSECTION 6.1 UPDATE HISTORY
 Akcelik & Associates Pty Ltd PO Box 1075G, Greythorn, Vic 3104 AUSTRALIA ABN 79 088 889 687 For all technical support, sales support and general enquiries: support.sidrasolutions.com SIDRA INTERSECTION
Project Report. South Kirkwood Road Traffic Study. Meadows Place, TX October 9, 2015
 Meadows Place, TX October 9, 2015 Contents 1 Introduction... 1 2 Data Collection... 1 3 Existing Roadway Network... 2 4 Traffic Volume Development... 2 5 Warrant Analysis... 3 6 Traffic Control Alternative
Appendix B: Forecasting and Traffic Operations Analysis Framework Document
 Existing Conditions Report - Appendix Appendix B: Forecasting and Traffic Operations Analysis Framework Document This document defines the methodology and assumptions that will be used in the traffic forecasting
DUNBOW ROAD FUNCTIONAL PLANNING
 DUNBOW ROAD FUNCTIONAL PLANNING Final Report August 3, 216 #31, 316 5th Avenue NE Calgary, AB T2A 6K4 Phone: 43.273.91 Fax: 43.273.344 wattconsultinggroup.com Dunbow Road Functional Planning Final Report
TOWARDS A BETTER UNDERSTANDING OF MODERN ROUNDABOUTS
 TOWARDS A BETTER UNDERSTANDING OF MODERN ROUNDABOUTS C KROGSCHEEPERS, M WATTERS*, C TICHAUER**, F VAN RENSSEN** and G MATTHEE*** ITS Engineers (Pty) Ltd, 5 th Floor, Imperial Bank Terraces, Carl Cronje
TECHNICAL MEMORANDUM VDOT Central Region On Call Task Order
 Kittelson & Associates, Inc. T R A N S P O R T A T I O N E N G I N E E R I N G / P L A N N I N G 1850 Centennial Park Drive, Suite 130, 20191 P 703-885-8970 F 703-885-8971 TECHNICAL MEMORANDUM VDOT Central
1 Introduction. COPY John Denney FROM Chris Morahan DATE 2 November 2015 FILE 6-XT177.62/305DC SUBJECT Stanley Street Network Traffic Modelling
 Opus International Consultants Ltd Christchurch Office 20 Moorhouse Avenue PO Box 1482, Christchurch Mail Centre, Christchurch 8140 New Zealand TO Reece Gibson COPY John Denney FROM Chris Morahan DATE
METHODOLOGY. Signalized Intersection Average Control Delay (sec/veh)
") Chapter 5 Traffic Analysis 5.1 SUMMARY US /West 6 th Street assumes a unique role in the Lawrence Douglas County transportation system. This principal arterial street currently conveys commuter traffic
Chapter 5 Traffic Analysis 5.1 SUMMARY US /West 6 th Street assumes a unique role in the Lawrence Douglas County transportation system. This principal arterial street currently conveys commuter traffic
RIGHT TURNS AT INTERSECTIONS: ARE THERE ALTERNATIVES?
 RIGHT TURNS AT INTERSECTIONS: ARE THERE ALTERNATIVES? R.C. Pyke, J.D. Sampson and K.G. Schmid Stewart Scott International, P O Box 784506, Sandton, 2146 TTT Africa, P.O.Box 109, Sunninghill, G.D.P.T.R.W,
A Traffic Operations Method for Assessing Automobile and Bicycle Shared Roadways
 A Traffic Operations Method for Assessing Automobile and Bicycle Shared Roadways A Thesis Proposal By James A. Robertson Submitted to the Office of Graduate Studies Texas A&M University in partial fulfillment
The calibration of vehicle and pedestrian flow in Mangalore city using PARAMICS
 Urban Transport XX 293 The calibration of vehicle and pedestrian flow in Mangalore city using PARAMICS S. K. Prusty, R. Phadnis & Kunal National Institute Of Technology Karnataka, India Abstract This paper
Design of Turn Lane Guidelines
 Design of Turn Lane Guidelines CTS Transportation Research Conference May 24, 2012 Howard Preston, PE Minnesota Department of Transportation Research Services Office of Policy Analysis, Research & Innovation
Evaluating Roundabout Capacity, Level of Service and Performance
 Roundabouts with Metering Signals ITE 2009 Annual Meeting, San Antonio, Texas, USA, August 9-12, 2009 Evaluating Roundabout Capacity, Level of Service and Performance Presenter: Rahmi Akçelik rahmi.akcelik@sidrasolutions.com
TRANSPORTATION ANALYSIS REPORT US Route 6 Huron, Erie County, Ohio
 TRANSPORTATION ANALYSIS REPORT US Route 6 Huron, Erie County, Ohio December 12, 2012 Prepared for: The City of Huron 417 Main Huron, OH 44839 Providing Practical Experience Technical Excellence and Client
Chapter 4 Traffic Analysis
 Chapter 4 Traffic Analysis PURPOSE The traffic analysis component of the K-68 Corridor Management Plan incorporates information on the existing transportation network, such as traffic volumes and intersection
Figure 1: East West Connector Alignment Alternatives Concept Drawing
 Page 2 of 9 Figure 1: East West Connector Alignment Alternatives Concept Drawing The Montebello Drive extension will run north south and connect Wilsonville Road to the Boones Ferry Road to Brown Road
Traffic Impact Study. Westlake Elementary School Westlake, Ohio. TMS Engineers, Inc. June 5, 2017
 TMS Engineers, Inc. Traffic Impact Study Westlake Elementary School Westlake, Ohio June 5, 2017 Prepared for: Westlake City Schools - Board of Education 27200 Hilliard Boulevard Westlake, OH 44145 TRAFFIC
ENHANCED PARKWAY STUDY: PHASE 2 CONTINUOUS FLOW INTERSECTIONS. Final Report
 Preparedby: ENHANCED PARKWAY STUDY: PHASE 2 CONTINUOUS FLOW INTERSECTIONS Final Report Prepared for Maricopa County Department of Transportation Prepared by TABLE OF CONTENTS Page EXECUTIVE SUMMARY ES-1
ANALYSIS OF SIGNALISED INTERSECTIONS ACCORDING TO THE HIGHWAY CAPACITY MANUAL FROM THE POINT OF VIEW OF THE PROCESSES APPLIED IN HUNGARY
 2nd Int. Symposium in Civil Engineering 1998 Budapest ANALYSIS OF SIGNALISED INTERSECTIONS ACCORDING TO THE HIGHWAY CAPACITY MANUAL FROM THE POINT OF VIEW OF THE PROCESSES APPLIED IN HUNGARY István Styevola
Introduction Roundabouts are an increasingly popular alternative to traffic signals for intersection control in the United States. Roundabouts have a
 HIGH-CAPACITY ROUNDABOUT INTERSECTION ANALYSIS: GOING AROUND IN CIRCLES David Stanek, PE and Ronald T. Milam, AICP Abstract. Roundabouts have become increasingly popular in recent years as an innovative
Operational Performance Comparison between Three Unconventional Intersection Designs: Left-turn Bypass, Diverging Flow and Displaced Left-turn
 Ninth LACCEI Latin American and Caribbean Conference (LACCEI 2011), Engineering for a Smart Planet, Innovation, Information Technology and Computational Tools for Sustainable Development, August 3-5, 2011,
Simulation Analysis of Intersection Treatments for Cycle Tracks
 Abstract Simulation Analysis of Intersection Treatments for Cycle Tracks The increased use of cycle tracks also known as protected bike lanes has led to investigations of how to accommodate them at intersections.
DESIGN BULLETIN #66/2010
 DESIGN BULLETIN #66/2010 Highway Geometric Design Guide Chapter B, Climbing Lane Warrants for Two Lane Undivided and Four Lane Divided Highways - Revised Summary This Design Bulletin is being issued as
Evaluation of Work Zone Strategies at Signalized Intersections
 Evaluation of Work Zone Strategies at Signalized Intersections Khaled Shaaban Qatar University/Department of Civil and Architectural Engineering, Doha, Qatar Email: kshaaban@qu.edu.qa Dina Elnashar Qatar
1.3.4 CHARACTERISTICS OF CLASSIFICATIONS
 Geometric Design Guide for Canadian Roads 1.3.4 CHARACTERISTICS OF CLASSIFICATIONS The principal characteristics of each of the six groups of road classifications are described by the following figure
USA Parkway Traffic Operations Analysis, Roundabout Option. Pedro Rodriguez, NDOT; Bryan Gant, Jacobs; Randy Travis, NDOT
 Technical Memorandum TO: Hoang Hong, NDOT DATE: September 21, 2012 FROM: SUBJECT: COPIES: John Karachepone, Jacobs USA Parkway Traffic Operations Analysis, Pedro Rodriguez, NDOT; Bryan Gant, Jacobs; Randy
An Analysis of the Travel Conditions on the U. S. 52 Bypass. Bypass in Lafayette, Indiana.
 An Analysis of the Travel Conditions on the U. S. 52 Bypass in Lafayette, Indiana T. B. T readway Research Assistant J. C. O ppenlander Research Engineer Joint Highway Research Project Purdue University
Gap Acceptance Cycles for Modelling Roundabout Capacity and Performance
 15th Scientific and Technical Conference Transport Systems Theory and Practice Department of Transport Systems and Traffic Engineering, Faculty of Transport, Silesian University of Technology, Katowice,
Operational Comparison of Transit Signal Priority Strategies
 Operational Comparison of Transit Signal Priority Strategies Revision Submitted on: November, 0 Author: Adriana Rodriguez, E.I Assistant Engineer Parsons Brinckerhoff 0 South Orange Avenue, Suite 00 Orlando,
EXAMINING THE EFFECT OF HEAVY VEHICLES DURING CONGESTION USING PASSENGER CAR EQUIVALENTS
 EXAMINING THE EFFECT OF HEAVY VEHICLES DURING CONGESTION USING PASSENGER CAR EQUIVALENTS Ahmed Al-Kaisy 1 and Younghan Jung 2 1 Department of Civil Engineering, Montana State University PO Box 173900,
TECHNICAL NOTE THROUGH KERBSIDE LANE UTILISATION AT SIGNALISED INTERSECTIONS
 TECHNICAL NOTE THROUGH KERBSIDE LANE UTILISATION AT SIGNALISED INTERSECTIONS Authors: Randhir Karma NDip: Eng (Civil) B. Tech Eng (Civil) M Eng (Hons) (Transportation) Auckland Traffic Service Group Manager
An Analysis of Reducing Pedestrian-Walking-Speed Impacts on Intersection Traffic MOEs
 An Analysis of Reducing Pedestrian-Walking-Speed Impacts on Intersection Traffic MOEs A Thesis Proposal By XIAOHAN LI Submitted to the Office of Graduate Studies of Texas A&M University In partial fulfillment
PROVISION OF A LEFT SLIP LANE TO THE NORTHERN SECTION OF THE HAASENDAL DEVELPOMENT, KUILSRIVIER
 Date: 10 August 2016 Contact: Liezl du Plooy (tel 082 338 6466) Our ref: D122 Transport for Cape Town PO Box 19 Somerset West 7129 Attention: Mr. Bill Jones Sir PROVISION OF A LEFT SLIP LANE TO THE NORTHERN
Access Location, Spacing, Turn Lanes, and Medians
 Design Manual Chapter 5 - Roadway Design 5L - Access Management 5L-3 Access Location, Spacing, Turn Lanes, and Medians This section addresses access location, spacing, turn lane and median needs, including
Rural Highway Overtaking Lanes
 Rural Highway Overtaking Lanes Kah Wai Ng School of Civil and Resource Engineering, University of Western Australia Song Wang School of Mathematics and Statistics, University of Western Australia Doina
Lane changing and merging under congested conditions in traffic simulation models
 Urban Transport 779 Lane changing and merging under congested conditions in traffic simulation models P. Hidas School of Civil and Environmental Engineering, University of New South Wales, Australia Abstract
133 rd Street and 132 nd /Hemlock Street 132 nd Street and Foster Street MINI ROUNDABOUTS. Overland Park, Kansas
 133 rd Street and 132 nd /Hemlock Street 132 nd Street and Foster Street MINI ROUNDABOUTS Overland Park, Kansas September 1, 2017 TABLE OF CONTENTS 1. INTRODUCTION... 1 2. LITERATURE REVIEW... 1 3. CONCEPT
Defining Purpose and Need
 Advanced Design Flexibility Pilot Workshop Session 4 Jack Broz, PE, HR Green May 5-6, 2010 Defining Purpose and Need In your agency s project development process, when do design engineers typically get
5.0 Roadway System Plan
 Southwest Boise Transportation Study Page 16 5.0 Roadway System Plan The Roadway System Plan outlines roadway improvements in the Initial Study Area. It forecasts future deficiencies on the arterial system,
Roundabouts in Australia: the state of the art on models and applications
 Roundabouts in Australia: the state of the art on models and applications Seminar Presentation One-day International Meeting on Roundabouts Università di Pisa - Corso di TECNICA del TRAFFICO, Livorno,
Simulating Street-Running LRT Terminus Station Options in Dense Urban Environments Shaumik Pal, Rajat Parashar and Michael Meyer
 Simulating Street-Running LRT Terminus Station Options in Dense Urban Environments Shaumik Pal, Rajat Parashar and Michael Meyer Abstract The Exposition Corridor transit project is a light rail project
Traffic Impact Study WestBranch Residential Development Davidson, NC March 2016
 Traffic Impact Study WestBranch Residential Development Davidson, NC March 216 TRAFFIC IMPACT STUDY FOR THE WestBranch Residential Development LOCATED IN DAVIDSON, NC Prepared For: Lennar Carolinas, LLC
Roundabouts in Edmonton - A Comparison to the State-of-the-Art
 Roundabouts in Edmonton - A Comparison to the State-of-the-Art Authors: Carl Clayton, P.Eng. P.E. PTOE Stantec Consulting Ltd. Chuan Kua, P.Eng. City of Edmonton, Transportation and Streets Brice Stephenson,
Assessing the Traffic and Energy Impacts of Connected and Automated Vehicles (CAVs)
") Assessing the Traffic and Energy Impacts of Connected and Automated Vehicles (CAVs) Steven E. Shladover, Sc.D. (Retired from) California PATH Program University of California, Berkeley SIP-adus Workshop
Assessing the Traffic and Energy Impacts of Connected and Automated Vehicles (CAVs) Steven E. Shladover, Sc.D. (Retired from) California PATH Program University of California, Berkeley SIP-adus Workshop
ScienceDirect. Microscopic Simulation on the Design and Operational Performance of Diverging Diamond Interchange
 Available online at www.sciencedirect.com ScienceDirect Transportation Research Procedia 6 (2015 ) 198 212 4th International Symposium of Transport Simulation-ISTS 14, 1-4 June 2014, Corsica, France Microscopic
DOWNTOWN TUPELO MAIN STREET: ROAD DIET STUDY
 DOWNTOWN TUPELO MAIN STREET: ROAD DIET STUDY Since mid-2009, RPM Transportation Consultants (RPM) has worked with the Downtown Tupelo Main Street Association to evaluate traffic conditions and potential
The Effect of Additional Lane Length on Roundabout Delay
 The Effect of Additional Lane Length on Roundabout Delay Samuel Hammond Graduate Research Assistant Transportation Engineering University of Rhode Island, Kingston, RI 02881 (401) 874-2692; Fax: (401)
Updated Roundabout Analysis Methodology
 Updated Roundabout Analysis Methodology In 1998, the Transportation Planning Analysis Unit (TPAU) working as part of the Roundabout Task Group selected the interim roundabout methodologies of the SIDRA
Roundabout Design 101: Roundabout Capacity Issues
 Design 101: Capacity Issues Part 2 March 7, 2012 Presentation Outline Part 2 Geometry and Capacity Choosing a Capacity Analysis Method Modeling differences Capacity Delay Limitations Variation / Uncertainty
Introduction to Roundabout Analysis Using ARCADY
 Introduction to Roundabout Analysis Using ARCADY Toronto SimCap User Group Technical Event and ITE Toronto Section Social Event July 22, 2014 Phil Weber, P.Eng. GHD Inc. (The Home of Ourston Roundabout
Traffic Academy: IJS & IMS FAQ/RULES OF THUMB
 FAQ/RULES OF THUMB HCS intersection analysis criteria See LDM Figure 401-14aE Cycle lengths between 60 to 120 seconds No impractical phases, i.e., 1 second green time Yellow + All Red must be no less than
Low Level Road Improvements Traffic Analysis. Report
 Low Level Road Improvements Traffic Analysis Report June, 22 Table of Contents. INTRODUCTION.... LOW LEVEL ROAD PROJECT....2 STUDY AREA....2. West-End Corridor Improvements... 2.2.2 East-End Corridor Improvements...
TRAFFIC IMPACT ANALYSIS OF PROPOSED CHESTNUT HILL COLLEGE MASTER PLAN DEVELOPMENT
 TRAFFIC IMPACT ANALYSIS OF PROPOSED CHESTNUT HILL COLLEGE MASTER PLAN DEVELOPMENT Prepared by Orth-Rodgers & Associates, Inc. December 14, 2009 Updated November 9, 2010 230 South Broad Street Philadelphia
Intersection of Massachusetts Avenue and Maple Street in Lexington Signalized Intersection and Roundabout Comparison
 Intersection of Massachusetts Avenue and Maple Street in Lexington Signalized Intersection and Roundabout Comparison Michael Wallwork, Roundabout Expert, Orange Park, Florida Tom Bertulis (MS, PE, PTOE),
Geometric and Trafc Conditions Summary
 2 Geometric and Trafc Conditions Summary m, RETHNKNG -94 APPENDX T2 GEOMETRC AND TRAFFC CONDTONS SUMMARY ntroduction This memorandum summarizes the geometric and traffic conditions within the Rethinking
IMPACTS OF TRAFFIC RESTRICTIONS AND INFRASTRUCTURE IMPROVEMENTS ON DOWNTOWN PEAK HOUR CONGESTION: A SYNCHRO ANALYSIS FOR BELLEVUE, WASHINGTON
 Final Technical Report TNW2009-06 IMPACTS OF TRAFFIC RESTRICTIONS AND INFRASTRUCTURE IMPROVEMENTS ON DOWNTOWN PEAK HOUR CONGESTION: A SYNCHRO ANALYSIS FOR BELLEVUE, WASHINGTON Chris Masek, P.E. Nancy Nihan,
3 ROADWAYS 3.1 CMS ROADWAY NETWORK 3.2 TRAVEL-TIME-BASED PERFORMANCE MEASURES Roadway Travel Time Measures
 ROADWAYS Approximately 6 million trips are made in the Boston metropolitan region every day. The vast majority of these trips (80 to percent, depending on trip type) involve the use of the roadway network
ROUNDABOUT MODEL COMPARISON TABLE
 Akcelik & Associates Pty Ltd PO Box 1075G, Greythorn, Vic 3104 AUSTRALIA info@sidrasolutions.com Management Systems Registered to ISO 9001 ABN 79 088 889 687 ROUNDABOUT MODEL COMPARISON TABLE Prepared
Design Traffic Technical Memorandum
 State Road 7 Extension PD&E Study Design Traffic Technical Memorandum Palm Beach County, FL October 2010 State Road 7 Extension PD&E Study Design Traffic Technical Memorandum Palm Beach County, FL Prepared
Traffic Signal Design
 Traffic Signal Design Instructor: S. M. Mahdi Amiripour m.amiripour@gmail.com 2 Introduction Intersection is an area shared by two or more roads Designated for the vehicles to turn to different directions
3 TRAFFIC CONTROL SIGNAL TIMING AND SYNCHRONIZATION
 Report No. 8 of the Transportation Services Committee Regional Council Meeting of October 20, 2011 3 TRAFFIC CONTROL SIGNAL TIMING AND SYNCHRONIZATION The Transportation Services Committee recommends:
NO BUILD TRAFFIC OPERATIONS
 3. 23 NO BUILD TRAFFIC OPERATIONS This section addresses the operations of the transportation system and details how it would be expected to function under year 23 No Build conditions with the projected
Alberta Highway 881. Corridor Management Plan. Session Forum 1 - Highways. Tri-Party Transportation Conference Moving Alberta Into the Future
 Tri-Party Transportation Conference Moving Alberta Into the Future Alberta Highway 881 Corridor Management Plan Lac La Biche to Anzac Session Forum 1 - Highways March 2017 INTRODUCTION + 241 km long, 2
Traffic Impact Analysis (TIA) Process and Procedures Manual. September 2017
 Process and Procedures Manual. September 2017") Traffic Impact Analysis (TIA) Process and Procedures Manual Post Office Box 664 101 Huntersville-Concord Road Huntersville, NC 28070 Phone 704-766-2220 Fax 704-992-5528 www.huntersville.org (c) 2017, Town
Traffic Impact Analysis (TIA) Process and Procedures Manual Post Office Box 664 101 Huntersville-Concord Road Huntersville, NC 28070 Phone 704-766-2220 Fax 704-992-5528 www.huntersville.org (c) 2017, Town
Stanley Street/Shotover Street, Queenstown. Traffic Modelling Report
 Stanley Street/Shotover Street, Queenstown Traffic Modelling Report Stanley Street/Shotover Street, Queenstown Traffic Modelling Report Prepared By Chris Morahan Transportation Engineer/Traffic Modeller
Tokyo: Simulating Hyperpath-Based Vehicle Navigations and its Impact on Travel Time Reliability
 CHAPTER 92 Tokyo: Simulating Hyperpath-Based Vehicle Navigations and its Impact on Travel Time Reliability Daisuke Fukuda, Jiangshan Ma, Kaoru Yamada and Norihito Shinkai 92.1 Introduction Most standard
Appendix E-2: Microsimulation Report
 Appendix E-2: Microsimulation Report London Bus Rapid Transit Transit Project Assessment Process Environmental Project Report DRAFT April 2018 P R E PA R E D BY LONDON BUS RAPID TRANSIT PROJECT TRAFFIC
RETROFITTING CLOSELY SPACED INTERSECTIONS USING THE PEANUT- TURBO ROUNDABOUT CONCEPT
 PAPER NO. IRC3-0060 RETROFITTING CLOSELY SPACED INTERSECTIONS USING THE PEANUT- TURBO ROUNDABOUT CONCEPT Michael Trueblood, P.E., PTOE Senior Traffic Engineer Trafficware, Ltd. 14019 Southwest Freeway
Existing Conditions. Date: April 16 th, Dan Holderness; Coralville City Engineer Scott Larson; Coralville Assistant City Engineer
 Date: April 16 th, 2015 To: From: Re: Dan Holderness; Coralville City Engineer Scott Larson; Coralville Assistant City Engineer Darian Nagle-Gamm, Traffic Engineering Planner Highway 6 (2 nd Street) /
DRIVING ON THE HARD SHOULDER A SAFETY ASSESSMENT ABSTRACT
 DRIVING ON THE HARD SHOULDER A SAFETY ASSESSMENT P LOUW and M SINCLAIR Address of both authors: Department of Civil Engineering University of Stellenbosch, Private bag X1, Matieland, 7602 Emails: Perot
Alternative Intersection Analysis Using SIDRA INTERSECTION
 Alternative Intersection Analysis Using SIDRA INTERSECTION ITEANZ Innovative Intersections Seminar Melbourne, 5 Nov 2015 Rahmi Akçelik and Mark Besley sidrasolutions.com youtube.com/sidrasolutions Alternative
MUTCD Part 6G: Type of Temporary Traffic Control Zone Activities
 MUTCD Part 6G: Type of Temporary Traffic Control Zone Activities 6G.01 Typical Applications Each temporary traffic control (TTC) zone is different. Many variables, such as location of work, highway type,
SELECTED ROADWAY CAPACITY ANALYSIS
 CHAPTERFOUR SELECTED ROADWAY CAPACITY ANALYSIS 4.1 SELECTED ROADWAY CAPACITY ANALYSIS Introduction Capacity analysis was performed on six selected roadways within the Dearborn County study area using the
PRELIMINARY DRAFT WADDLE ROAD / I-99 INTERCHANGE PROJECT ALTERNATIVE ANALYSIS FINAL TRAFFIC SUMMARY REPORT
 PRELIMINARY DRAFT WADDLE ROAD / I-99 INTERCHANGE PROJECT ALTERNATIVE ANALYSIS FINAL TRAFFIC SUMMARY REPORT Prepared by: In Association with: November 2013 EXECUTIVE SUMMARY Patton Township, in partnership
Transportation Impact Study for Abington Terrace
 Transportation Impact Study for Abington Terrace Abington Township, Montgomery County, PA Sandy A. Koza, P.E., PTOE PA PE License Number PE059911 Prepared by McMahon Associates, Inc. 425 Commerce Drive,
Tight Diamond Interchange versus Single Point Urban Interchange: Pedestrians Prospective
 Tight Diamond Interchange versus Single Point Urban Interchange: Pedestrians Prospective Ahmed Amer, M.S. Ph.D. Candidate Graduate Research/Teaching Assistant Department of Civil & Environmental Engineering
aasidra for Roundabouts INTRODUCTION
 aasidra for Roundabouts INTRODUCTION Rahmi Akçelik Director, Akcelik & Associates Pty Ltd Adjunct Professor, Monash University Mark Besley Director, Akcelik & Associates Pty Ltd TRB Roundabout Conference
Issues in Performance Assessment of Sign-Controlled Intersections
 Akcelik & Associates Pty Ltd PO Box 1075G, Greythorn, Vic 3104 AUSTRALIA info@sidrasolutions.com Management Systems Registered to ISO 9001 ABN 79 088 889 687 REPRINT Issues in Performance Assessment of
QUEUE DISCHARGE BEHAVIOR AT SIGNALIZED INTERSECTION: A COMPARISON BETWEEN FIELD MEASUREMENTS WITH ANALYTICAL AND MICRO-
 QUEUE DISCHARGE BEHAVIOR AT SIGNALIZED INTERSECTION: A COMPARISON BETWEEN FIELD MEASUREMENTS WITH ANALYTICAL AND MICRO- SIMULATION MODELS Mohsin Shahzad CHAUDHRY PhD Student Civil and Environmental Engineering
Classification Criteria
 SCHEDULE D TO RECOMMENDED OFFICIAL PLAN AMENDMENT NO. 40 SCHEDULE C-4 Road Criteria Criteria Traffic Service Objective Land Service/Access Typical Daily Traffic Volume Flow characteristics Travel Speed
APPENDIX H EXISTING TRAFFIC CONDITIONS ANALYSIS
 APPENDIX H EXISTING TRAFFIC CONDITIONS ANALYSIS MEMO : Peter Steacy, P.Eng. Date: December 3, 2014 : Ian Borsuk, P.Eng. Job No.: 3414015-000 Subject: City of Ottawa O-Train Extension Planning & EA Study
Mathematics of Planet Earth Managing Traffic Flow On Urban Road Networks
 Mathematics of Planet Earth Managing Traffic Flow On Urban Road Networks Adrian George Manager Network Improvements Anthony Fitts Manager Signal Design Melbourne s transport demands are growing 5m people
Memorandum 1. INTRODUCTION. To: Cc: From: Denise Marshall Northumberland County
 255 Adelaide Street West Toronto, ON M5H 1X9 www.hdrinc.com File: 4.0 Memorandum To: Cc: From: Denise Marshall Northumberland County Tony Reitmeier HDR Guinevere Ngau HDR Andrew O Connor HDR Date: August
Subject: Solberg Avenue / I-229 Grade Separation: Traffic Analysis
 MEMORANDUM Transportation Bill Troe, AICP Jason Carbee, AICP 12120 Shamrock Plaza Suite 300 Omaha, NE 68154 (402) 334-8181 (402) 334-1984 (Fax) To: Project File Date: Subject: Solberg Avenue / I-229 Grade
Alternative Intersection Analysis Using SIDRA INTERSECTION
 Alternative Intersection Analysis Using SIDRA INTERSECTION ITEANZ Innovative Intersections Seminar Melbourne, 5 Nov 2015 Rahmi Akçelik and Mark Besley SIDRA SOLUTIONS Presenter: David Nash TRAFFINITY sidrasolutions.com
A New Lane-Based Model for Platoon Patterns at Closely-Spaced Signalised Intersections
 Akcelik & Associates Pty Ltd PO Box 1075G, Greythorn, Vic 3104 AUSTRALIA info@sidrasolutions.com Management Systems Registered to ISO 9001 ABN 79 088 889 687 REPRINT A New Lane-Based Model for Platoon
Evaluation and further development of car following models in microscopic traffic simulation
 Urban Transport XII: Urban Transport and the Environment in the 21st Century 287 Evaluation and further development of car following models in microscopic traffic simulation P. Hidas School of Civil and
Toronto SimCap Toronto, ON, Canada, July 2014 SIDRA INTERSECTION 6. sidrasolutions.com sidrasolutions.com/forums youtube.
 Toronto SimCap Toronto, ON, Canada, July 2014 SIDRA INTERSECTION 6 sidrasolutions.com sidrasolutions.com/forums youtube.com/sidrasolutions Our company Multi-Award Winning Company 2010 Victorian Small Business
COUNTY ROAD 22 HORSESHOE VALLEY ROAD. Municipal Class Environmental Assessment. simcoe.ca
 OCTOBER 2014 Municipal Class Environmental Assessment COUNTY ROAD 22 HORSESHOE VALLEY ROAD Project A Truck Climbing Lanes Project B Intersection Improvements simcoe.ca CORPORATE COMMUNICATIONS DEPARTMENT
Enclosure 1. Crimson Drive Traffic Safety and Calming Review Report
 Enclosure 1 Crimson Drive Traffic Safety and Calming Review Report Prepared by: Tahir Hameed, P.Eng. Traffic Safety Engineer Planning Engineering and Safety Transportation Planning and Engineering Date:
OTTAWA TRAIN YARDS PHASE 3 DEVELOPMENT CITY OF OTTAWA TRANSPORTATION IMPACT STUDY. Prepared for:
 OTTAWA TRAIN YARDS PHASE 3 DEVELOPMENT CITY OF OTTAWA TRANSPORTATION IMPACT STUDY Prepared for: The Ottawa Train Yards Inc. 223 Colonnade Road South, Suite 212 Nepean, Ontario K2E 7K3 January 17, 2012
Traffic Impact Analysis
 Traffic Impact Analysis Isle of Capri Casinos, Inc. Waterloo, Iowa SEH No. A-CLAAS0501.00 November 16, 2004 Table of Contents (Continued) Table of Contents Certification Page Table of Contents Page 1.0
Modern Roundabouts: a guide for application
 Modern Roundabouts: a guide for application Kentucky Community Transportation Innovation Academy 2005 The contents of this booklet reflect the views of the authors who are responsible for the facts and
Preliminary Transportation Analysis
 Preliminary Transportation Analysis Goals of a Robust, Multimodal Transportation Network Safe Accessible/Connected Efficient Comfortable Context-Sensitive Motor Vehicle: Continue to analyze the data to
Truck Climbing Lane Traffic Justification Report
 ROUTE 7 (HARRY BYRD HIGHWAY) WESTBOUND FROM WEST MARKET STREET TO ROUTE 9 (CHARLES TOWN PIKE) Truck Climbing Lane Traffic Justification Report Project No. 6007-053-133, P 101 Ι UPC No. 58599 Prepared by:
Traffic circles. February 9, 2009
 Traffic circles February 9, 2009 Abstract The use of a traffic circle is a relatively common means of controlling traffic in an intersection. Smaller Traffic circles can be especially effective in routing
Chapter Capacity and LOS Analysis of a Signalized I/S Overview Methodology Scope Limitation
 Chapter 37 Capacity and LOS Analysis of a Signalized I/S 37.1 Overview The Highway Capacity Manual defines the capacity as the maximum howdy rate at which persons or vehicle can be reasonably expected
Transportation Advisory Board
 C I T Y O F WEATHERFORD Transportation Advisory Board AGENDA REPORT Meeting Date: October 15,2015 Staff Contact: Manny Palacios Jr. Phone: E-mail: 817-598-4296 mpalacios@weatherfordtx.gov SUBJECT: Discuss