Gulf Apex Predator-prey Study (GAP) Final Report FY NOAA Grant NA16FX1270
|
|
|
- Kelly Nichols
- 6 years ago
- Views:
Transcription

1 Gulf Apex Predator-prey Study (GAP) Final Report FY NOAA Grant NA16FX1270 University of Alaska Fairbanks School of Fisheries and Ocean Sciences Kodiak, Alaska 30 January 2005
2
3 Gulf Apex Predator-prey Study (GAP) Final Report FY NOAA Grant NA16FX1270 Principal Investigators: Kate M. Wynne 1 Robert Foy 2 Loren Buck 2 University of Alaska Fairbanks School of Fisheries and Ocean Sciences 1 Marine Advisory Program 2 Fishery Industrial Technology Center Kodiak, Alaska 30 January 2005 Prior to citation: please contact specific authors regarding this report. Analyses are on-going and a more appropriate version may be available. Chapters of this report are being prepared for peerreviewed publication.
4 I. EXECUTIVE SUMMARY The Gulf Apex Predator-prey (GAP) program represents a multidisciplinary effort to assess the status, environment, prey, and potential competitors of Steller sea lions in waters near Kodiak, Alaska. GAP s distinct but interrelated studies broadly assess the diets, distribution, and status of Kodiak s sympatric apex predators while exploring the processes that drive populations of their prey within a dynamic marine environment. These studies were designed to overlap spatially and temporally to allow synchronous collection of predator and prey data and a synoptic assessment of their seasonal interactions. By limiting the geographic breadth of its integrated studies to waters near Kodiak, GAP has been able to collect data with both temporal and taxonomic depth. Steller sea lion numbers in the Kodiak region declined precipitously through the 1980 s and more slowly through the 1990 s; counts continued to decline from despite abatement of the decline elsewhere. We used repeated aerial surveys of haulouts in the Kodiak Archipelago to monitor the seasonal abundance and distribution of Steller sea lion and to explore inter- and intra-annual patterns reflective of changing prey availability and reproductive needs of sea lions. Use of terrestrial habitat peaked in late summer and a negative trend in Steller sea lion numbers was seen in the area over four survey years. Seasonal patterns of use varied on each site, including shifts in overall attendance numbers and use of within-haulout microhabitat. We assessed the diet of Steller sea lions as a fundamental first step to understanding their potential for competitive interactions with humans and other upper level marine consumers. Preliminary findings indicate that Kodiak s Steller sea lions are currently preying on a diverse diet, including a remarkable nine dominant prey species. Relative use varied both seasonally and regionally but Pacific sandlance (42.0 FOC), arrowtooth flounder (37.0 FOC), walleye pollock (30.1 FOC), Pacific cod (29.2 FOC), and salmon spp. (28.5 FOC) were found to be the five dominant prey of Steller sea lion in the samples examined to date. We conducted a variety of vessel surveys to monitor spatial and temporal patterns in the distribution and abundance of prey species within Kodiak waters. Prey distributions were found to vary spatially and seasonally between 2001 and Pelagic fish distribution was correlated to the presence of oceanographic features on the northeast side of Kodiak Island and surveys were expanded to accommodate these features. Specifically, horizontal features of the water column off Portlock Bank, Marmot Gully and Chiniak Gully appear to affect the distributions of capelin and walleye pollock. As such, a large amount of variability was found in the energy density of prey available to upper trophic levels. Demersal fish distributions were highly variable among seasons and between years. However, distributions were associated with specific strata, such as distance to shore and depth. Steller sea lions share Kodiak waters and prey resources with a variety of apex predators, including marine fish, birds, and mammals, whose numbers increased during the Steller sea lion s decline. We documented temporal and spatial patterns in the diets, abundance, distribution, and habitat use of several piscivorous consumers (apex predators) in the Kodiak region as a basis for evaluating interactions among potential competitors and differential response to environmental variables. Kodiak harbor seals prey on the species eaten by sea lions but their numbers have increased steadily in the Kodiak area while Steller sea lion numbers have continued to decline. We examined dive behavior of harbor seals as a first step in assessing potential overlap in marine habitat use between these sympatric and piscivorous pinnipeds. Large whales are apex predators found in Kodiak waters designated as Steller sea lion Critical Habitat. We documented the year-round presence and distribution of large whales in the Kodiak Archipelago and assessed their abundance, distribution, and habitat use in northeast Kodiak waters. The relative number, diversity, and persistence of whales in the near-coastal community demonstrate their significance as upper level consumers in an area where Steller sea lion numbers continue to decline. We initiated studies to assess the foraging ecology of humpback whales in Kodiak waters, a consumer whose i
5 numbers are rebounding and whose diet includes fish consumed by Steller sea lions and zooplankton that feed those fish species. We monitored dietary, reproductive, physiological and behavioral parameters of black-legged kittiwakes, glaucous-winged gulls and tufted puffins across their breeding season in Seabirds exhibited remarkable similarity in the trends of predator-insensitive reproductive parameters thus allowing us to draw some general conclusions about marine foraging conditions in Chiniak Bay from In 2001 evidence suggests that foraging conditions were consistently good across the entire breeding season for most colonies and species. Energy rich age 1+ sandlance dominated the diets and foraging took place primarily within the confines of the bay. In 2002, although foraging conditions appeared to be excellent early in the season, egg predators severely impacted the reproductive output of approximately 50% of kittiwake breeding colonies within the bay. Impaired nestling growth rates indicated that foraging conditions had declined markedly by the nestling period and were the poorest of any year of the study. Adult kittiwakes responded by devoting more time to foraging and by undertaking longer foraging trips that extended beyond the periphery of Chiniak Bay. Glaucous-winged gulls breed earlier in the season and thus exhibited excellent reproductive performance yet displayed decrease body condition and increase plasma corticosterone levels by late chick rearing suggestive of decreased forage availability in mid-summer. In 2003, egg laying was delayed by cool marine conditions in the spring and egg predation severely impacted most kittiwake colonies within the bay. Rapid nestling growth suggested excellent foraging conditions in 2003 while kittiwake parents provisioned nestlings on a diet of energy-rich capelin and, to a lesser degree, on lipid-poor YOY sandlance. Key Words: Steller sea lions, trophic interactions, seabirds, marine mammals, forage fish, predatory fish, ecosystem monitoring, Kodiak, Gulf of Alaska ii
6 II. RECOMMENDATIONS The continued decline of apex predator populations has illustrated the fundamental need to understand ecosystem mechanisms and processes at the organismal and population levels. After years of unprecedented and intensive research on Steller sea lions, there is still no clear evidence that nutritional stress, environmental change, or predation are linked to their continued declines. A primary stumbling block has been in determining what mechanisms are expected to control the population s decline/lack of recovery at the ecosystem, population, individual, and cellular levels. In the first three years of GAP, we began describing the structure of a small marine system east of Kodiak in response to specific Steller sea lion questions. We monitored seasonal abundance and distribution of fish species in relation to oceanographic variability. We identified consumers in the system, including piscivorous fish, birds, marine mammals, and humans that utilize this prey base and monitored their distribution and productivity over time. Then we linked prey availability and dietary overlap among upper level consumers to determine potential competitive interactions between Steller sea lions and other apex predators. Future effort should focus on exploring the structure of this system and monitor spatial and temporal changes in its biotic and abiotic components. Insights developed in GAP s first three years can be used to explore the connections between these components from oceanographic, physiological, and ecological perspectives. While continuing to monitor the structure and variability of the system, future research should explore the physical processes, energetic pathways, and physiological mechanisms that link its components. A multidisciplinary and comprehensive effort should be made to explore the interfaces where physical oceanography drives primary productivity, where predators consume their prey, and where captive fish react to controlled environmental change. Longterm monitoring and hypothesis-driven research on such trophic level interactions will become more critical as managers take an ecosystem-based approach to marine resource management relies on understanding both the structural components of the system and the functional mechanisms of their interactions. Future studies should continue monitoring the seasonal distribution and abundance of predators and prey track oceanographic variability in relationship to zooplankton and fish populations to explore effects of environmental change on primary and secondary production develop time-series needed to forecast and predict effect of perturbations consider predators and prey in terms of energetic content and their interactions as energetic exchange use spatially- and temporally- specific data to develop holistic models of marine ecosystem dynamics iii
7 TABLE OF CONTENTS I. EXECUTIVE SUMMARY... i II. RECOMMENDATIONS... iii III. INTRODUCTION... 1 IV. ACKNOWLEDGEMENTS... 3 V. LIST OF STUDENTS... 4 VI. PREY AND FISHERIES OCEANOGRAPHY... 5 Steller sea lion prey availability in the Long Island Critical Habitat ( ) Robert J. Foy... 6 Preliminary investigations into prey and baleen whale distribution relative to the oceanography on the north and east side of Kodiak Island (ESOK) Robert J. Foy, Briana Witteveen, Lisa Baraff, and Kate Wynne Monthly variability in fish and zooplankton distributions in Marmot and Chiniak Bays (MaCH) (2002) Robert J. Foy Portlock Bank fisheries oceanography (2003) Robert J. Foy Interannual and seasonal zooplankton community composition near Kodiak Island, Alaska Xian Wang and Robert J. Foy Proximate composition (energetic value) of important Steller sea lion prey ( )... Robert J. Foy Fatty Acid Analysis of Fish collected within Steller sea Critical Habitat, Kodiak, AK Robert J. Foy VII. PISCIVOROUS CONSUMERS A. PISCIVOROUS FISH Investigating the role of arrowtooth flounder (Atheresthes stomias) as a top level consumer in the Gulf of Alaska ecosystem from Brian Knoth and Robert J. Foy Trophic Status of Spiny Dogfish (Squalus acanthias) in the Gulf of Alaska...56 Judith Nash and Robert J. Foy A summary of sleeper shark stomach contents collected in the Kodiak Area, Spring Kate M. Wynne B. PISCIVOROUS MAMMALS Preliminary assessment of the diet of Steller sea lions in the Kodiak area, Kate M. Wynne Aerial monitoring of terrestrial habitat use by Steller sea lions in the Kodiak Archipelago, Kate M. Wynne iv
8 Dive behavior of harbor seals (Phoca vitulina richardsi) within Steller sea lion Critical Habitat on the east side of Kodiak Island, Alaska Shawn Harper and Kate Wynne Opportunistic Aerial Sightings of Large Whales Within Steller Sea Lion Critical Habitat in the Kodiak Archipelago Kate Wynne and Briana Witteveen Summer distribution and habitat characteristics of fin whales and humpback whales in Steller sea lion critical habitat off northeast Kodiak Island, Lisa S. Baraff, Robert J. Foy and Kate M. Wynne An Apparent Feeding Aggregation of Humpback Whales (Megaptera novaeangliae) Near Kodiak Island, Alaska: Historical and Current Abundance Estimation Briana H. Witteveen, Kate M. Wynne, and Terry J. Quinn II Potential current and historic prey removal due to consumption by humpback whales (Megaptera novaeangliae) near Kodiak Island, Alaska Briana H. Witteveen, Robert J. Foy, and Kate M. Wynne C. PISCIVOROUS BIRDS Black-legged kittiwakes as bio-indicators of marine conditions in the western Gulf Of Alaska S. Dean Kildaw, Katie M. Murra, C. Loren Buck Reproductive performance of glacous-winged gulls In Chiniak Bay, Kodiak Island, Alaska206 J. Brook Gamble, S. Dean Kildaw, C. Loren Buck Body condition of glaucous-winged gulls throughout the reproductive period J. Brook Gamble and C. Loren Buck Foraging distribution, diet, and breeding biology of tufted puffins In Chiniak Bay, Alaska Cory T. Williams, S. Dean Kildaw, and C. Loren Buck v
9 III. INTRODUCTION The precipitous and continued decline of the western stock of Steller sea lions (Eumetopias jubatus) has been well documented (Calkins and Goodwin 1988, Loughlin et al. 1992, Sease and Loughlin 1999, Hill and DeMaster 1999, NRC 2003). Factors contributing to their decline and preventing recovery remain unclear, although reduced juvenile survival is considered a likely proximate cause (Merrick 1995, Sease and Merrick 1997). One hypothesis is that the western stock of Steller sea lions is nutritionally stressed and their recovery may be limited by the availability, quality, and/or diversity of their prey (ASG 1993, NMFS 1995, Merrick et al. 1997, Sease and Merrick 1997, Calkins, et al. 1998, Trites and Donnelly 2003). Although evidence from the 1970 s and 1980 s support this hypothesis, studies in the 1990 s do not (PSMFC 1997, Millette et al.1999, NRC 2003), suggesting other factors may now be involved. We currently lack adequate understanding of the dynamic ecological processes affecting Steller sea lions to determine or reduce impediments to their recovery. Since 1999, University of Alaska Fairbanks faculty in Kodiak have been addressing trophic-level questions of immediate biological and economic concern in the western Gulf of Alaska. In 2001, the Gulf Apex Predator-prey program (GAP) received a Congressionally-appropriated NOAA grant to support the program s efforts to document trophic relationships between Steller sea lions, their prey, competitors, and predators in the Kodiak region. Fundamental to the GAP program was the integration of distinct but related hypothesis-driven research projects. Although focused on Steller sea lion concerns, GAP s interrelated studies also broadly assessed the degree of dietary overlap among Kodiak s sympatric apex predators while exploring processes that drive populations of their prey within a dynamic marine environment. These studies overlapped spatially and temporally, allowing synchronous collection of predator and prey data and synoptic assessment of their seasonal interactions. GAP program was planned as a multiyear sampling effort to allow monitoring inter-annual variability against which effects of human intervention may be compared. GAP investigators sought to make synergistic linkages to related studies and efficiently broaden research beyond the scope of individual projects. The Principal Investigators fostered collaboration with fisheries and marine mammal researchers within the National Marine Fisheries Service (NMFS), U.S. Fish and Wildlife Service (USFWS), and the Alaska Department of Fish and Game (ADFG). Steller sea lions and humans share a position as apex predators in the Gulf of Alaska with a variety of piscivorous fish, birds, and marine mammals. Historically, these apex predators have undergone drastic and potentially interrelated changes (Pitcher 1990, Springer 1992, Merrick 1995, Anderson et al.1997). Yet they have been studied, inventoried, and managed separately without consideration for their multi-species interactions and potentially competitive consumption of common prey resources. Data needed to describe the complex ecological interrelationships among apex predators and to discern effects of natural and anthropogenic change on their prey base are therefore lacking (Boyd 1995). As a result, the potential impact of cumulative commercial fish removals on the endangered Steller sea lion stock remains equivocal (NMFS 2000, pg 182, 227). Lacking empirical data, the Endangered Species Act mandates a risk-averse approach to the management of human removals of Steller sea lion prey. Although no direct correlations have been made between commercial pollock harvests and continued Steller sea lion declines, restrictions on commercial fishing have been implemented throughout much of the Gulf of Alaska and Bering Sea in an effort to assure adequate prey availability for Steller sea lions within their designated critical habitat. Based on limited data and presumed competition, these actions may be reasonable and prudent from an administrative perspective but were not designed to improve our understanding of actual ecological interactions and potential for competition between Steller sea lions, human harvesters, and other apex predators in the system. Because continued Steller sea lion declines and resulting fishery restrictions bear significant biological, social and economic ramifications, Alaska s congressional delegates rallied federal support for increased research on all possible factors relating to declines of Steller sea lions. Funds were appropriated to GAP in support of research that directly addresses research areas Congress identified as necessary for understanding the Steller sea lion s decline and potential recovery. GAP focused on 1
10 addressing the hypothesis that current Steller sea lion declines are related to prey limitation and potential for competition with fisheries or other upper level consumers. Secondarily we addressed the hypotheses that environmental change and predation could be limiting Steller sea lion recovery in the Gulf of Alaska. Literature Cited ASG (Alaska Sea Grant) Is it food?: Addressing marine mammal and sea bird declines. Workshop summary, Alaska Sea Grant Rept , Univ. of Alaska, Fairbanks. Anderson, P.J., J.E. Blackburn, and B.A. Johnson Declines of forage species in the Gulf of Alaska, , as an indicator of regime shift. Pp in Forage fishes in marine ecosystems: proceedings of the international symposium on the role of forage fishes in marine ecosystems. Alaska Sea Grant Rept 97-01, Fairbanks Boyd, I.L Steller sea lion research- a report prepared for the U.S. National Marine Fisheries Service, National Marine Mammal Laboratory, Seattle 90 pp. Calkins, D.G. and E. Goodwin Investigations of the declining sea lion population in the Gulf of Alaska. Unpubl. rept, AK Dept Fish Game, 333 Raspberry Rd., Anchorage, AK 76pp. Calkins, D.G, E.F. Becker, and K.W. Pitcher Reduced body size of female Steller sea lions from a declining population in the Gulf of Alaska. Mar. Mammal Sci.14: Loughlin, T.R., A.S. Perlov, and V.V. Vladimirov Range-wide survey and estimation of total number of Steller sea lions in Mar. Mammal Sci. 82: Merrick, R.L The relationship of foraging ecology of Steller sea lions (Eumetopias jubatus) to their population decline in Alaska. PhD Thesis, University of Washington, 171 pp. Merrick, R.L., T.R. Loughlin, and D.G. Calkins Diet diversity of Steller sea lions and their population decline in Alaska: a potential relationship. Can. J. Fish. Aquat. Sci. 54: Millete, L.L., A.W. Trites, and D. Calkins Behavior of lactating Steller sea lions in Alaska: are they nutritionally stressed? Abstr 13 th Biennial Conf on Biol of Marine Mammals, Dec 1999, Maui, HI NMFS, Status review of the United States Steller sea lion (Eumetopias jubatus) population. Unpubl. Rept., National Marine Mammal Lab, NMFS, Seattle, WA 92 pp.psmfc Steller sea lion Research Peer Review: Behavior/Rookery Studies Workshop, Seattle WA 5-7 Dec Pacific States Marine Fish Commission unpub rept. NRC (National Research Council) Decline of the Steller sea lion in Alaskan waters: untangling food webs and fishing nets. National Research Council, National Academy Press, D.C. Pitcher, K.W Major decline in number of harbor seals, Phoca vitulina richardsi, on Tugidak Island, Gulf of Alaska. Mar. Mammal Sci. 6(2) PSMFC Steller sea lion Research Peer Review: Feeding Ecology Workshop, Seattle WA Feb Pacific States Marine Fish Commission unpub rept. Sease, J.L. and R.L. Merrick Status and population trends of Steller sea lions. pp in Pinniped populations, Eastern North Pacific: status, trends, and issues. Symposium of 127th Ann. Mtg. Am. Fisheries Society, Monterey, CA. Sease, J.L.and T.R. Loughlin Aerial and land-based surveys of Steller sea lions (Eumetopias jubatus) in Alaska, June and July 1997 and NOAA Tech Memo NMFS-AFSC pp. Springer, A.M A review: walleye pollock in the North Pacific how much difference do they make? Fish.Oceanogr. 1(1): Trites, A.W. and C.P. Donnelly The decline of Steller sea lions Eumetopias jubatas in Alaska: a review of the nutritional stress hypothesis. Mammal Rev. 33(1):
11 IV. ACKNOWLEDGEMENTS We thank the staffs at the University of Alaska Fairbanks (FITC, MAP, SFOS, GCS), National Oceanographic and Atmospheric Administration Grants Office, and the National Marine Fisheries Service Alaska Regional Office (NMFS) who have assisted in the administration and management of this NOAA grant. In addition to annual support from this NOAA grant, GAP program has benefited from additional funding and support provided by the Steller Sea Lion Research Initiative, Cooperative State Research Education and Extension Service, Pollock Conservation Cooperative Research Consortium, the Cooperative Institute for Arctic Research, USFWS (Migratory Birds), University of Alaska Foundation, Angus Gavin Memorial Migratory Bird Research Grant, UAF s Center for Global Change and Arctic Systems Research, North Pacific Marine Research Board, Rasmuson Fisheries Research Center, UAF Office of the Graduate School, and the Alaska SeaLife Center. GAP represents a truly collaborative effort with additional financial, permitting, and/or logistic support provided by personnel from the Alaska Department of Fish and Game (ADFG), NMFS (Alaska Fisheries Science Center (AFSC) and National Marine Mammal Laboratory (NMML)), U.S. Geological Survey National Biological Survey (USGS), and U.S. Fish and Wildllife Service (USFWS). In particular, we appreciate the collaborative efforts and support of Dr. Kathleen O Reilly (University of Portland), Dr. David Irons (USFWS Migratory Birds), Dr. Tom Loughlin (NMML), and Dr. Gail Blundell (ADFG). We thank the following technicians, interns, and volunteers who provided valuable field and/or lab assistance: Erin Kate Aleksak, Chuck Adams, Peggy Amox, Allison Banks, Katie Brenner, Sharon Buck, Casey Clark, Steve Coen, Travis Cooper, Lucretia Fairchild, Joel Fiddes, Ian Gravenstede, Andrea Haas, Catherine Hegwer, Susan Inglis, Dwaine Macintosh, Samuel Mansfield, Christy Newell, Rachel Orben, Bob Pfutzenreuter, Petra Reimann, Cassandra Roberts, Jordy Thomson, Carey Vorholt, and Tom Wilson. We thank the captains and crew of the F/V Alaska Beauty, F/V Alaskan, F/V Laura, and F/V Mythos. Our aerial surveys were safely and expertly piloted by Tom Walters (Maritime Helicopters, Kodiak), Willie Hall (Kodiak Air, Kodiak), and Willie Fulsom, Garrett Houiser, and Dean Andrew (Andrew Air, Kodiak) Finally we extend a special thanks to Al Burch, Jay Stinson, and other members of the community of Kodiak who have supported GAP since its inception, demonstrating their belief that sound resource management must be based on a comprehensive and scientific understanding of interrelated ecosystem components. GAP research was conducted under the following state permits and authorization: National Marine Fisheries Service Fish: LOA# , LOA# , LOA# , LOA# Marine Mammals: NMFS Scientific Permit # Steller sea lion NMFS Scientific Permit # Harbor seals NMFS Scientific Permit # , # , # whales U.S. Fish and Wildlife Service Birds: MB , MB , MB Alaska Dept of Fish and Game Fish: CF01-001, CF01-027, CF02-033, CF03-024, CF A-0109, 01A-0110, 04A-0018, 04A-0017, 04A-0050 Birds: , , , Institutional Animal Care and Use Assurance of Care (IACUC) Fish: # 01-10, # 01-11, # 04-21, # Marine mammals: # 01-46, #02-38, #02-48 Birds: # 02-12, # , #
12 V. LIST OF STUDENTS The following students benefited from financial or logistic support provided by this grant to GAP as they conducted research for their graduate degrees at the University of Alaska Fairbanks: Baraff, L., MS Marine Biology: Summer distribution and habitat characteristics of balaenopterid whales off northeast Kodiak Island, Alaska Brewer, J.H.,MS Marine Biology: Adrenal responsiveness of Black-legged Kittiwake chicks: proximate affects of brood size, status and adult provisioning rate. Gamble, J.B., MS Biology: Ecological and Physiological Factors Contributing to Reproductive Success of Glaucous-winged Gulls (Larus glaucescens) in Chiniak Bay, Kodiak Island, Alaska Hanna, S. K., MS Marine Biology: The effect of temperature on swimming speed and metabolic rate of Pacific cod, Gadus macrocephalus Harper, S., MS Marine Biology: Dive physiology and behavior of two polar phocid species. Knoth, B. MS Fisheries: Investigating the role of arrowtooth flounders (Atheresthes stomias) as a top level consumer in the Gulf of Alaska ecosystem from Murra, K. A., MS Marine Biology: Thesis: Black-legged kittiwake foraging ecology and reproductive performance in Kodiak, AK Nash, J., MS Oceanography: Trophic status of spiny dogfish (Squalus acanthias) in the Gulf of Alaska Wang, X., MS Marine Biology: Interannual and seasonal zooplankton community composition near Kodiak Island, Alaska Williams, C.T., PhD Marine Biology: Physiological ecology of the Tufted Puffin Witteveen, B.H., MS Fisheries: Abundance and feeding ecology of humpback whales (Megaptera novaeangiae) in Kodiak, Alaska. 4
13 VI. PREY AND FISHERIES OCEANOGRAPHY The prey component of the GAP program includes numerous studies focused on the distribution, ecology and physiology of fish and zooplankton that make up the prey of Steller sea lions and their competitors. Interactions among these multiple trophic levels have been assessed to ultimately better understand their influence on apex predators. We have also included a significant focus on oceanography to describe the environment in which these interactions occur. The objectives from were to: 1. assess the seasonal species composition, distribution, abundance, and quality of prey available to sea lions within 10, 20, and 25 nm of Long Island haulout; 2. monitor oceanographic conditions associated with fish species distribution; 3. determine the feasibility of describing and quantifying prey fields upon which Steller sea lions, whales, and seabirds are observed actively foraging. The GAP study area was sampled for the first time in the spring of 2000 with funds from the North Pacific Research Board (Wynne et al. 2003). The GAP program was designed to compliment the 2000 research and continue a time series in the same study area. As such, data from 2000 was analyzed as part of the GAP program and included in some of the results in this report. From 2000 to 2003, we assessed prey resources available to Steller sea lions and other apex predators through systematic seasonal surveys on multiple spatial and temporal scales: monthly nearshore (2002), monthly in Marmot Bay-Chiniak Bay (2002), and quarterly Long Island Critical Habitat ( ). From 2000 to 2002, we used waters within 46.3 km (25 nm) of the Long Island Steller sea lion haulout as a core study area in which to document seasonal changes in prey species composition, abundance, and distribution. In 2002, we extended our surveys to include waters surrounding Marmot Island, a site used both as a rookery (seasonally for mating and pupping) and a haulout (year-round for resting). Fish distributions and abundance were related to physical oceanographic features in the region to predict the correlations of environmental parameters to the availability of prey for upper trophic levels. Our final objective was to make preliminary comparisons between data collected on prey resources with data collected on diets and habitats used by Steller sea lions, humpback and fin whales and seabirds. Literature Cited Wynne, K. M., R. J. Foy, B. L. Norcross, S. Hills, C. L. Buck Availability and use of prey by Steller sea lions in the Kodiak area. North Pacific Marine Research Program. Final Report. University of Alaska Fairbanks, Alaska. 5
14 Steller sea lion prey availability in the Long Island Critical Habitat ( ) Robert J. Foy School of Fisheries and Ocean Sciences, University of Alaska Fairbanks, Kodiak, AK Introduction To assess the seasonal distribution of fish species and to describe the physical environment in Steller sea lion habitat, a series of transect lines were occupied between 2000 and Other studies have been designed to quantify seasonal availability of pelagic and demersal prey near Steller sea lion haulouts in mid-summer (Byrd et al. 1997, Mueter and Norcross 2000). Our goal was to develop seasonal surveys of a given area to assess intra- and inter-annual changes in sea lion prey availability as has been called for by Pacific States Marine Fisheries Commission (PSMFC 1999). The survey consisted of a 20 nm area around Long Island near Kodiak Island, Alaska. This area is designated as critical Steller sea lion habitat (CFR (a)) and as such provided the initial study area for our program. Waters within a 20 nm radius of Long Island haulout were designated as critical habitat in 1993 but were not closed to fishing at the time. In 1998, waters within a 10 nm radius of this haulout were designated a winter-only Pollock Trawl Exclusion Zone and closed to pollock trawling during pollock A1 and A2 seasons (NMFS 1998) In 2000, 2001 and 2002 we assessed and compared fish species present within two distance strata (10 nm and nm) of the Long Island haulout as a means of comparing prey availability inside and outside of this Pollock Trawl Exclusion Zone. In 2000, the F/V Alaska Beauty was set up with commercial mid water and bottom trawling gear as well as an acoustic echo integration system to conduct surveys in March, May and November A tow body with a transducer was towed. An acoustic and biological survey was developed based on standard protocol given vessel time available. We conducted two surveys in 2001: May and 3 11 November A March 2001 survey was not possible due to weather and vessel availability constraints. In 2002 the F/V Laura was equipped with a hull mounted 38 khz transducer. The commercial bottom and midwater trawling gear was the same as that used in 2001.We conducted four surveys in 2002: 1-5 April, May, July and November In the acoustic sampling was on multiple parallel east-west lines equally spaced 5.6 km apart, extending 37 km out from Long Island (Fig.1). The vessel speed during all transecting was 7 knots (1000 rpms). A total of approximately 235 nm was surveyed on each cruise. Information was recorded during the entire transect with respect to noise level, signal acquisition, and weather conditions. Boat noise was found to be minimized around 1500 rpm, which corresponded to approximately 7 knots. The bottom trawl was deployed at 20 randomly selected locations along the acoustic transect line based on sampling multiple strata including depth and distance from SSL haulouts (Figure 1). The bottom trawl was deployed for 10 min tows beginning when the trawl is fishing on the bottom. Upon retrieval, all fishes were separated by species and counted. We randomly subsampled 100 fish of representative sizes of each species and set aside for weight (g) and length (mm) measurements. All subsamples of rare species were weighed whereas only of common species were weighed from each subsample. Single species with sample sizes totaling more than 500 fish were approximated by counting a single subset. Fish lengths and weights were entered into electronic fish measuring boards (FMB). All large fish were dissected for stomach content analysis. The midwater trawl was deployed opportunistically as we encountered pelagic fish assemblages to ground-truth the hydroacoustic signals. Tow duration was dependent on the magnitude of acoustic signal, ranging from 10 to 25 minutes. Midwater tows were treating similarly to bottom tows upon retrieval. 6
15 A Seabird Conductivity and Temperature at Depth (CTD) instrument was deployed to collect oceanographic data (salinity, temperature, light, productivity) at each station In 2003 the objectives of the fish surveys were changed to reflect progress in testing previous hypotheses and to address new hypotheses regarding the trophic and oceanographic linkages in our ecosystem on the east side of Kodiak Island. We continued seasonal monitoring of prey availability within the Long Island Critical Habitat area but reduced the intensity of nearshore sampling in order to expand assessment of prey to shelf waters outside of LICH (see Portlock section). These surveys continued to assess prey availability on a scale being utilized by dependent and recently weaned sea lion pups (NMFS unpublished data). The previous ( ) survey areas within 46.3 km of Long and Marmot Islands was monitored in 2003 such that deviations in trends in fish distribution or relationships to oceanographic conditions established during could be detected. As such, every other transect line (every km) previously occupied throughout the year was surveyed in Approximately four days of hydroacoustic and trawl surveying were conducted in each season to assess relative seasonal abundance estimates and distribution of fish within 46.3 km of the Long Island sea lion haulouts. Hydroacoustic sampling included a total of km parallel east-west transects spaced km apart and to the edge of designated Steller sea lion Critical Habitat around Long Island. Twelve predetermined locations within the survey area were sampled for demersal fish distribution. We conducted three surveys in 2003: 5-9 March, 22 May - 4 June and 1-17 August A Seabird Conductivity and Temperature at Depth (CTD) instrument was deployed to collect oceanographic data (salinity, temperature, light, productivity) at each station. Nearshore surveys Nearshore waters immediately adjacent to haulouts and rookeries appear to be of particular significance to pre-weaned Steller sea lion pups and may represent biologically critical habitat. Several prey species found in these nearshore waters, including sandlance and other nearshore species, have been found to occur frequently in the scats of Steller sea lions using Chiniak and Long Island haulouts but are rarely caught in our larger scale surveys. Because our other surveys use gear that precludes surveying shallow waters immediately adjacent to haulouts, we explored a number of nearshore survey techniques in 2002 to determine the species composition and relative abundance of fishes present within 1000 m Long Island and Cape Chiniak haulouts (Fig. 2). Techniques for identifying fish prey species present included 1) deployment of beach and purse seines, 2) and examination of seabird diets or stomach contents from sport-caught halibut. Results, Evaluation and Conclusions Trawl surveys revealed a significant interannual and seasonal variability in fish biomass (kg/km) on the northeast side of Kodiak from (Fig. 3). Note that the biomass of fish in the nearshore stations was reduced in 2001 possibly due to warmer temperatures on the shelf. Fluctuations were consistent with what we know about habitat (depth, substrate, distance to shore) preferences of groundfish around Kodiak Island. Sixty-seven species of fish were collected among the seasons and years. These were dominated by arrowtooth flounder, flathead sole, walleye pollock, Pacific cod, rock sole and eulachon making up on average the top 89% of fish caught in the bottom trawls. An average of 130,000 fish was counted each year. It was noted that although arrowtooth flounder dominated most stations, pollock, rock and rex sole biomass increased in 2002 compared to the previous years. Comparing strata among seasons we found a significant pattern for some species between 0-10 and nm form the Long Island sea lion haulout (Fig. 4). Walleye pollock biomass was higher in the nearshore region while arrowtooth flounder, flathead sole, rock sole and Pacific halibut all had significantly higher biomasses in the nm strata. 7
16 Twelve species of fish were caught in the midwater over the 3 seasons from (Fig. 5). These included, in order of averaged abundance: walleye pollock, capelin, eulachon, arrowtooth flounder, Pacific sandfish, king salmon, sturgeon poacher, unidentified roundfish, steelhead trout, dusky rockfish, prowfish, and spiny dogfish. An average of 19,000 fish was counted each year. Both seasonal and interannual variability was noted in the distribution of pelagic fish species. Spatial differences suggest that both pollock and capelin exhibit strong seasonal variability based on life history stage (Fig. 6). Pelagic biomass was highest in 2001 almost doubling the total biomass of capelin available in the study area. Comparisons of depth strata of both pelagic and demersal fish revealed a significant species specific pattern (Fig. 6). Walleye pollock, rock sole, and Pacific cod dominated the shallower stations while arrowtooth flounder, flathead sole and Pacific cod dominated the deeper stations. There were noted differences in size class variability among station depths as well. Temperature and salinity profile data reveal numerous vertical density structures in the water column. Horizontal temperature and salinity structure in Chiniak and marmot Bay also reveal a seasonal variability important for understanding fish distributions (Fig. 7). In March 2002 the surface waters are mostly uniform with slightly warmer water offshore. This coincides with a minimal surface salinity gradient although winter current structure in the area is revealed by a slightly higher saline wedge of water over the deeper gullies at the mouths of Chiniak and Marmot Bays. In May 2002, a stronger temperature gradient is apparent with warmer water over the North Albatross Bank. Surface salinity in May also reveals a stronger gradient of fresher water nearshore and more saline water over the Bank. Literature Cited Byrd, G.V., R.L. Merrick, J.F. Piatt and B.L. Norcross Seabird, Marine Mammal, and Oceanography Coordinated Investigations (SMMOCI) near Unimak Pass, Alaska. Proc. Int. Symp. Role of Forage Fishes in Marine Ecosystems. Alaska Sea Grant, AK-SG-97-01: Mueter, FJ and BL Norcross Changes in species composition of demersal fish community in nearshore waters of Kodiak Island, Alaska. Can. J.Fish and Aquat. Sci 57: PSMFC Steller sea lion Research Peer Review: Feeding Ecology Workshop, Seattle WA Feb Pacific States Marine Fish Commission unpub rept. NMFS, Endangered Species Act Section 7 Consultation: authorization of the Bering Sea and Aleutian Islands groundfish fishery for walleye pollock, Bering Sea and Aleutian Islands Atka mackerel fishery, and Gulf of Alaska groundfish fishery for walleye pollock between 1999 and Office of Protected Resources, NMFS, 3 Dec
17 Afognak Island # # # # # # # # r # # # # # # Kodiak Island # # # # # # Figure 1. Acoustic transect lines spaced 3 nm apart and occupied in on the northeast side of Kodiak Island. Dots represent bottom trawl and oceanographic stations occupied during each cruise. Darkest bathymetric line=100 m isobath. Concentric rings represent 10 nm and 20 nm radii around the Steller sea lion haulout (star) at Long Island '0"W '0"W '0"W '0"W 57 40'1"N 57 40'1"N 57 50'1"N Kodiak Island 57 50'1"N Long Island Chiniak Bay Cape Chiniak 57 30'1"N Kilometers '1"N '0"W '0"W '0"W '0"W Figure 2. Nearshore areas sampled in the summer of 2002 in Chiniak Bay near Kodiak Island. 9
18 March May July November Alaska plaice Big skate Flathead sole Pacific halibut Alaska skate Butter sole Longnose skate Rex sole Arrowtooth flounder Dover sole Pacific cod Rock sole Walleye pollock Yellowfin sole rockfish Sablefish Spiny dogfish Figure 3. Catch per unit effort (kg/km) of groundfish on the northeast side of Kodiak Island
19 March May November PO 0 10 nm R COD FS B ATF HBUT nm Figure 4. Average biomass of groundfish in two distance-to-shore strata in March, May and November Walleye pollock Eulachon Capelin Arrowtooth flounder Pacific sandfish Figure 5. Average species composition of midwater trawls in the Long Island Critical Habitat area. 11


20 Figure 6. Pelagic fish distribution in March and May 2002 on the Northeast side of Kodiak Island. 12
21 a. Depth<100m Lepidopsetta 2 (southern rock sole) Pacific cod Rock sole Arrowtooth flounder Butter sole Walleye pollock Pacific halibut Yellow Irish Lord Starry flounder b. Depth>100m Flathead sole Arrowtooth flounder Flathead sole Walleye pollock Eulachon Pacific cod Rex sole Rock sole Yellow Irish Lord Pacific halibut Dusky rockfish Figure 7. Biomass of fish caught within 25 nm of Long Island by depth strata between 2000 and a. Fish found shallower than 100 m. b. Fish found deeper than or equal to 100 m. 13


22 Figure 8. Surface temperature and salinity distribution across Chiniak and marmot Bays in March and May
23 Preliminary investigations into prey and baleen whale distribution relative to the oceanography on the north and east side of Kodiak Island (ESOK) Robert J. Foy 1, Briana Witteveen 1, Lisa Baraff 2, and Kate Wynne 1 1 School of Fisheries and Ocean Sciences, University of Alaska Fairbanks, Kodiak, AK 2 School of Fisheries and Ocean Sciences, University of Alaska Fairbanks, Fairbanks, AK Introduction In 2001 we conducted a midsummer pelagic prey survey along the north and east side of the Kodiak Archipelago (ESOK) (Fig. 1). The survey was conducted July 2001 and served to document pelagic prey availability more broadly than our previous surveys in the Kodiak area at a time when reproductive and energetic demands may be particularly high for local piscivorous predators. The primary goal of the extended ESOK survey was to determine if fish habitat associations found within Long Island Critical Habitat are representative of those found over a broader geographic (north-south and depth) range. Secondarily, these surveys provided a platform for documenting mid-summer associations of marine mammals with prey fields and oceanographic features along the north and east side of Kodiak. This is a preliminary report of our findings; results will be included in a more comprehensive documentation of the distribution of large whales relative to prey within the Kodiak Archipelago being prepared by the authors. Methods The ESOK survey utilized both acoustic and midwater trawl methodology to assess prey distribution, abundance, and species composition along the east and north side of the Kodiak Archipelago. Acoustic sampling was conducted along 37 km zigzag transects from Shuyak Island to the Trinity islands, with two lines extending 100 km to the shelf edge off Chiniak Gully (Fig. 1). The midwater trawl was deployed opportunistically as the vessel encountered pelagic fish assemblages to groundtruth hydroacoustic signals. Throughout the survey period, oceanographic conditions were recorded at multiple locations by deploying a conductivity and temperature at depth (CTD) (Fig.1). Data collected with each CTD cast included salinity, temperature, density, and flourometry at one meter intervals from the surface to the sea floor. Differences between values were calculated for bins of 5, 10, and 15 meters for each of these parameters respectively. The depth at which the maximum change in value for each parameter was then determined. During the survey, a dedicated marine mammal observer was stationed on top of the wheelhouse to record the species, number, and location of marine mammal observed during transects. Marine mammal observations were made during daylight hours while on transect. Sighting effort was concentrated 90 degrees to the port and starboard from the bow of the boat. For each marine mammal sighting, the vessel location, angle to the sighting, reticle count, and height of the observer off of the water were used to calculate the actual position (latitude and longitude) of animals. Sightings were separated by species for humpback, fin, killer, and gray whales. Sightings of other species or those that could not reliably be identified were binned in a category labeled other. Preliminary Results The distribution of pelagic fish on the east side of Kodiak was found to be highly variable and associated with bathymetry. The highest biomass of fish was found over gullies greater than 100 m. The pelagic composition was dominated by capelin followed by eulachon and pollock (Table 1). A total of 24 species were encountered during this survey. We concluded that the relationship between fish distribution 15
24 and oceanographic variables was similar on the east side of Kodiak to those encountered in the Long Island Critical Habitat (LICH) survey area. We did, however, find that larger scale physical forcing due to shelf break fronts and off-shore eddies may impact the fish distributions in our study to a large extent. These results led us to establish the Portlock Bank off shore surveys in Marine mammal observation effort occurred for a total of nearly 77 hours over 428 nm and resulted in 92 sightings of 223 whales (Table 2, Fig. 2). Humpback whales were the most frequently sighted species, followed by gray whales. Sightings of other species were dominated by whales identified as Balaenoptera spp. and were most likely fin whales. Sightings of fin and humpback whales will undergo further in-depth analysis to characterize their distribution and relative abundance in relation to prey variables and oceanographic conditions (Fig. 3). This will be accomplished by relating whale sightings to oceanographic features determined by CTD casts, including sea-surface temperature (SST), sea-surface chlorophyll concentration, and depth of thermocline, and prey type and distributions as determined by acoustic backscatter at 38 and 200 khz. We hypothesize that fin and humpback whale sightings will be positively correlated to prey densities and oceanographic features, most strongly to chlorophyll concentration and less so to SST and depth of the thermocline. Previous GAP surveys have found these oceanographic features to influence prey distribution near Kodiak. Secondarily we hypothesize that there is a prey density threshold below which foraging by baleen whales is unprofitable and aggregating behavior does not occur. Further, we hypothesize there will be species-specific differences between the correlations of prey and oceanographic features to humpback and fin whale distribution in this area. 16
25 Table 1. Species composition and percent abundance of pelagic fish species recorded during the ESOK cruise, July Scientific name Common name Abundance (%) Mallotus villosus Capelin 60.1 Thaleichthys pacificus Eulachon 25.2 Theragra chalcogramma Walleye pollock 13.7 Myctophidae Lanternfishes 0.3 Mysidacea Mysidacea 0.2 Cnidaria Jellyfish 0.1 Pandalus borealis Pink shrimp 0.1 Teuthoidea Squids 0.1 Oncorhynchus keta Chum Salmon <0.1 Oncorhynchus tshawytscha King salmon <0.1 Liparididae Snailfishes <0.1 Ammodytes hexapterus Pacific sand lance <0.1 Salpidae Salp <0.1 Atherestes stomias Arrowtooth flounder <0.1 Unidentified larval fish Unidentified larval fish <0.1 Chauliodus macouni Pacific viperfish <0.1 Clupea harengus pallasi Pacific herring <0.1 Oncorhynchus kisutch Silver salmon <0.1 Gadus macrocephalus Pacific cod <0.1 Hemitripterus bolini Bigmouth sculpin <0.1 Oncorhynchus gorbuscha Pink salmon <0.1 Trichodon trichodon Pacific sandfish <0.1 Zaprora sinenus Prowfish <0.1 Psychrolutes paradoxus Tadpole sculpin <0.1 Table 2. Total sightings and number of whales observed during the ESOK survey, Scientific Name Common Name No. of Sightings No.of Whales Balaenoptera physalus Fin 6 16 Megaptera novaeangliae Humpback Eschrichtus robustus Gray Orcinus orca Killer Other Total
26 156 0'0"W 154 0'0"W 152 0'0"W 150 0'0"W '0"N 156 0'0"W 58 0'0"N Alaska Mainland 154 0'0"W [[ [ [ [ [ [ [ [ Shuyak Is. [ [ Afognak Is. [ [ [ [ [[ [ Marmot Bay [ [ Chiniak [ Bay [ [ [ [[ [ [ [ [ [ [ CTD Cast Locations [ Kodiak Island Kilometers 152 0'0"W 150 0'0"W Marine Mammal Survey Effort Vessel Survey Lines 58 0'0"N 148 0'0"W 148 0'0"W
27 156 0'0"W 154 0'0"W 152 0'0"W 150 0'0"W '0"N 156 0'0"W 58 0'0"N Alaska Mainland 154 0'0"W [[ [ [ [ [ [ [ [ Shuyak Is. [ [ Afognak Is. [ [ [ [ [[ [ Marmot Bay [ [ Chiniak [ Bay [ [ [ [[ [ [ [ [ [ [ CTD Cast Locations [ Kodiak Island Kilometers 152 0'0"W 150 0'0"W Marine Mammal Survey Effort Vessel Survey Lines 58 0'0"N 148 0'0"W 148 0'0"W Figure 1. Map of the Kodiak Archipelago showing vessel transect lines for hydroacoustic prey surveys, marine mammal observation effort, and locations of all CTD casts.
28 $ #S $ #S ÊÚ #S ÊÚ #S #S#S#S#S#S Kilometers 59 # # ## #S ÊÚ $ #S #S #S #S#S#S#S #S #S % #S $ ÊÚ #S#S#S#S#S#S #S#S#S $ #S #S#S#S N 20 % $ Kodiak Island #S#S#S #S ÊÚ $$ % %%% ÊÚ % #S $ #S #S #S #S#S#S#S #S#S # ÊÚ 57 # $ Other Species Sightings ÊÚ Killer Whale Sightings # Fin Whale Sightings % Gray Whale Sightings #S Humpback Whale Sightings Figure 2. Map of the Kodiak Archipelago showing location of all cetacean sightings recorded during ESOK surveys.
29 156 0'0"W 154 0'0"W 152 0'0"W 150 0'0"W Alaska Mainland Shuyak Is '0"N 156 0'0"W 58 0'0"N 154 0'0"W " " Kodiak Island " Afognak Is Kilometers " 152 0'0"W Marmot Bay Chiniak Bay Fin Whale Sightings " 1-2 " 3-4 " 5 Humpback Whale Sightings '0"W '0"N 148 0'0"W 148 0'0"W Figure 3. Map of the Kodiak Archipelago showing the location and number of humpback and fin whales sighted.
30 Monthly variability in fish and zooplankton distributions in Marmot and Chiniak Bays (MaCH) (2002) Robert J. Foy School of Fisheries and Ocean Sciences, University of Alaska Fairbanks, Kodiak, AK Introduction In addition to the previous surveys in 2002, we also initiated a monthly pelagic prey survey within Marmot and Chiniak Bays (MaCh) to document pelagic prey available on a finer temporal and spatial scale within our study area (Fig. 1). The MaCh survey was run monthly from May through September To cover this area in three days, the survey was limited to hydro-acoustic and trawl surveys of midwater prey (no bottom trawls) on transects. Data collected during this cruise were analyzed as described for the previous surveys (above) with the addition of statistical analyses to account for the multi-colinearity associated with a zigzag survey design. Results, Evaluation and Conclusions Seasonal trends were noted in the nearshore Marmot Bay surveys in In May and September pollock dominated the biomass of fish in this area making up 99 and 96 % of the pelagic fish present, respectively. Eulachon was significantly more abundant in June at 17% than in any other month surveyed. Capelin was most abundant in August, accounting for more than 29% of the total biomass observed along the transect. Formal results regarding the distribution of fish, zooplankton (see Zooplankton chapter) and oceanographic variables are currently being analyzed for publication. 22
31 Table 1. Species composition by month in the nearshore areas on the northeast side of Kodiak Island in Month Scientific name Common name May June July August September Theragra chalcogramma Walleye pollock Mallotus villosus Capelin < Thaleichthys pacificus Eulachon Pandalopsis dispar Sidestripe shrimp Pandalus borealis Pink shrimp Liparididae Snailfishes 0.4 Cnidaria Jellyfish Trichodon trichodon Pacific sandfish <0.1 < Hippoglossoides elassodon Flathead sole Clupea pallasi Pacific herring Berryteuthis magister Majestic squid Unidentified larval fish Unidentified larval fish < Psychrolutes sigalutes Soft sculpin Gadus macrocephalus Pacific cod < < Atherestes stomias Arrowtooth flounder Mysidacea Mysidacea < Lycodes brevipes Shortfin eelpout <0.1 Sebastes aleutianus Rougheye rockfish <0.1 Liparis gibbus Variagated snailfish <0.1 Podothecus acipenserinus Sturgeon poacher <0.1 Lamna ditropis Salmon shark <0.1 <0.1 Sebastes alutus Pacific ocean perch <0.1 Aptocyclus ventricosus Smooth lumpsucker <0.1 <0.1 Euphausiacea Euphausiacea <0.1 <0.1 <0.1 23
32 152 50'0"W '0"W '0"W '0"W '0"W '0"W Marmot Bay 57 40'1"N 57 40'1"N 57 30'1"N 57 30'1"N 57 50'1"N 57 50'1"N 58 0'1"N 58 0'1"N Chiniak Bay Kodiak Island Kilometers '0"W '0"W '0"W '0"W '0"W '0"W Figure 1. Marmot- Chiniak Bay (MaCh) survey lines occupied monthly in 2002 on the northeast side of Kodiak Island. 24
33 Portlock Bank fisheries oceanography (2003) Robert J. Foy School of Fisheries and Ocean Sciences, University of Alaska Fairbanks, Kodiak, AK Introduction The productive shelf waters east of Kodiak support intensive foraging by a variety of marine birds, cetaceans, and pinnipeds (Parsons 1987, Waite et al. 1999). Recent telemetry data show that Steller sea lions tagged on haulouts within the GAP study use these waters as weanlings. To assess productivity and prey availability in this area, we modified prey surveys in 2003 to document larger scale fish distribution and related oceanographic features in shelf waters east side of Kodiak Island. In so doing, we produced a unique seasonal view of the physical oceanographic structure affecting the nearshore areas of Kodiak and the resources they support. In May and August 2003, Portlock Banks (northeast of Kodiak) were surveyed to assess seasonal fish distribution and physical oceanographic conditions (Fig. 1). May represents spring conditions where productivity is at its highest and the freshwater driven Alaska coastal current is beginning to gain momentum. Conditions on Portlock Banks drive a source of production and may predict oceanographic influences on the northeast side of Kodiak. In addition, the continental shelf break (max depth = 500 m) was surveyed to assess pelagic fish distribution and physical oceanographic conditions in May and July. In both months, we were interested in relating the movement of off-shelf waters into near-coastal fish habitat. We related the oceanographic conditions on the outer shelf to those found closer to shore to determine predictive linkages between the two environments. The acoustic sampling was conducted on multiple parallel east-west lines equally spaced 18.5 km apart, covering a 12,201 km 2 area over Portlock Bank. The vessel speed during all transecting was 7 knots (1000 rpms) and approximately 741 km were surveyed on each cruise. Midwater fishes were surveyed using a Simrad EK60 echo sounder attached to a 38 khz, 12-degree split beam transducer. Echo-integration of the acoustic signal was accomplished using Echoview software that, combined with catch length and weight data, yielded estimates of fish biomass. To determine the size and species of target fishes, a small representative sample of prey was collected with a DanTrawl Bering Billionaire midwater net with a modified research cod end. The midwater trawl was deployed opportunistically when we encountered pelagic fish assemblages to ground truth the hydroacoustic signals. Tow duration was dependent on the magnitude of acoustic signal, ranging from 10 to 25 minutes. Fish species caught in the midwater tows included, in order of averaged abundance were walleye pollock, Pacific Ocean perch, capelin, myctophids, eulachon, and king salmon. From each tow, a random sample of up to 100 fish of each species (per size category) was measured; up to 30 of these were also weighed. A sample of up to 500 fish was collected and frozen for subsequent studies of species-specific quality (proximate analyses). All large fish were dissected to determine reproductive status and stomachs will be preserved for subsequent diet analyses. Specimens that could not be positively identified to species in the field were frozen and returned to the Fisheries Industrial Technology Center in Kodiak for identification. Results, Evaluation and Conclusions Results from 2003 acoustic surveys suggested a correlation between areas of high fish biomass (acoustic backscatter) and oceanographic fronts. Data from 2003 and 2004 Portlock surveys are currently being analyzed together to test seasonal and interannual relationships between oceanographic variables and fish distributions. 25
34 Literature Cited Parsons, T.R Ecological relations. Pp in Hood, D.W. and S.T. Zimmerman (eds), The Gulf of Alaska: physical environment and biological resources. NTIS, Washington, D.C. 655pp. Waite, J.M., M.E. Dahlheim, R.C. Hobbs, S.A. Mizroch, O. vonziegesar-matkin, J.M. Straley, L.M. Herman, and J. Jacobsen Evidence of a feeding aggregation of humpback whales, Megaptera novaeangliae, around Kodiak Island, Alaska. Mar. Mammal Sci.15(1):


35 153 0'0"W '0"W 152 0'0"W '0"W 151 0'0"W '0"W 150 0'0"W '0"W 149 0'0"W 59 0'0"N µ 59 0'0"N 58 30'0"N 58 30'0"N 58 0'0"N 57 30'0"N [ 7 6 [ 8 13 [ [ [ [ [ [ 3 [ [ 11 [ [ '0"W 58 0'0"N 57 30'0"N 57 0'0"N 57 0'0"N 56 30'0"N Kilometers 56 30'0"N 153 0'0"W '0"W 152 0'0"W '0"W 151 0'0"W '0"W 150 0'0"W '0"W Figure 1. Portlock Bank survey areas occupied in the summer of 2003 on the northeast side of Kodiak Island. 27
36 Interannual and seasonal zooplankton community composition near Kodiak Island, Alaska Xian Wang and Robert J. Foy School of Fisheries and Ocean Sciences, University of Alaska Fairbanks, Kodiak, AK This study is part of a M.S. thesis that is currently scheduled to be completed by May Samples for this project were collected in as part of the GAP program. Zooplankton samples were collected during most oceanographic station stops from While not directly linked to Steller sea lion production, data about zooplankton abundance and species composition do contribute to the understanding of the ecosystem production. Steller sea lion prey depend on the zooplankton component of the community which can dictate seasonal biomass and energy density of the prey. Arrowtooth flounder, for instance are prey of Steller sea lions and are strongly dependent on the larger zooplankton community for prey (see Piscivory chapter below). Steller sea lion competitors directly feed on zooplankton suggesting that their role in the ecosystem can not be overlooked in a discussion on Steller sea lion prey availability. Introduction Zooplankton are an important component of the marine environment in terms of abundance, biomass and their energy transformation role in the marine food web. They are the most abundant creatures in the ocean and although most zooplankton are small in size, some of them are microscopic. They occupy one of the largest 3-dimensional environments on the planet. Because of zooplankton s special position in the pelagic food web and their world wide distribution and abundance they are considered to be the most significant secondary producers in the ocean (Lenz 2000). Within the zooplankton community, copepods and euphausiids are the most dominant species, especially in boreal and polar regions (Lenz 2000, Irigoien et al. 2002). Key zooplankton taxa include Crustacea, Cnidaria, Chaetognatha, Polychaeta and Tunicata. Calanoid copepods and euphausiids from high latitudes have large amount of lipids, which are significant energy material that transfer from zooplankton to higher trophic levels (Sargent et al. 1981, Ohman 1997). The ecological role of an organism is largely determined by its position and significance in the food web (Lenz 2000). Zooplankton occupy a key position in the pelagic food web as they transfer the organic energy produced by unicellular algae through photosynthesis to higher trophic levels such as pelagic fish stocks exploitable by humans (Lenz 2000). Because of the short trophic linkage and their intermediate position in the pelagic food web, zooplankton are direct indices of food web structure and carrying capacity for higher trophic level predator species (Mackas 1995). They are also of vital importance in the marine food web because most finfish and shellfish spend critical early parts of their life histories as members of the plankton community (Dunn 1979). Zooplankton are necessary for the maintenance of fish, shellfish and other living resources (Damkaer 1977). There is positive association between recruitment of certain fish species and copepod abundance (Arnott & Ruxton 2002, Runge et al. 1999). There was a positive association between Sandeel recruitment and Calanus copepod (Stages V and VI) abundance. The seasonal timing and availability of zooplankton prey are important to upper trophic level species, especially larval fish. In Prince William Sound juvenile herring feeding in fall and winter of decreased following the decline of zooplankton densities in the fall of 1997 (Foy and Norcross 2001). In Resurrection Bay, in the Northern Gulf of Alaska, fish larvae such as pollock, herring, sand lance and flathead sole depended very much on nauplii as their first-feeding food (Paul et al. 1991). To a certain extent, zooplankton species serve as an indicator of important fish habitat (Lee 1980). Eucalanus bungii and Metridia pacifica were valuable indicator species of the fishing grounds for pollock and yellowfin sole in the south eastern Bering Sea (Lee 1980). 28
37 Zooplankton communities change with the fluctuation of the environmental conditions. On large spatial and temporal scale, zooplankton distribution can be governed by water depth and temperature regime (Lenz 2000). Interannual and seasonal variations in climate can influence currents and sea temperature, which in turn impact zooplankton stocks (Coyle 1990). Physical conditions, such as ocean temperature, salinity, wind speed, stratification, thermocline depth, halocline depth, pycnocline depth, light, current, circulation, food availability and predation can all bring changes to zooplankton distribution and abundance (Coyle & Pinchuk 2003). Crustacean growth rates are known to depend strongly on water temperature (Lee et al. 2003, Tittensor et al. 2003). Thus, copepods may be a sensitive early warning of temperature increases or decreases in the ocean in response to climate changes. Because many zooplankton species are relatively short-lived and are capable of high growth rates, they respond quickly to environmental perturbations. On a local scale, water temperature is one of the major controlling factors of copepod distribution (Lee et al. 1999). Zooplankton abundance and species composition were influenced primarily by mean sea water salinity, and secondarily by the mean water temperature above the thermocline in northern Gulf of Alaska shelf (Coyle & Pinchukn 2003). Zooplankton concentration in the water column and vertical zooplankton appeared to be affected by currents (Roman et al. 2001). Many hydrographic factors such as local wind forcing which may link with upwelling, shelf break pattern, continental shelf and topology of the coast have high correlation with zooplankton biomass, abundance and composition (Cunha 1993, Danielsen et al. 1998). In disturbed or well mixed water, zooplankton biomass tends to be relatively high (Paffenhofer 1980). Whereas, some zooplankton are consistently concentrated along the edge of continental shelf (Sabates et al. 1989). Therefore, hydrographic features may at least partially explain the zooplankton population dynamics. Zooplankton composition, abundance, distribution and biomass have been studied and described nearly all over the world s oceans, especially in North Pacific, Atlantic Ocean and Indian Ocean (Clark et al. 2001, Bollens et al. 2002, Lindley 2002, Woodd-Walker et al. 2002, Conway et al. 2003). In the North Pacific, studies of zooplankton are mainly concerned with areas that have special physical conditions, such as the California area, Kuroshio Current area, Gulf of Alaska and Bering Sea. Zooplankton studies in these areas investigated seasonal, interannual and interdecadal zooplankton distributions, relationships between zooplankton communities and their oceanographical conditions, zooplankton growth rates and feeding ecology and zooplankton s interaction with higher trophic levels. Gulf of Alaska environment Climates are always changing, either on a micro- or on a mega-scale and these changes may affect the biodiversity and production in the ocean. The climate of the North Pacific is known to change sharply over periods of time, compared with climatic processes in other parts of the world. The Gulf of Alaska (GOA) climate is sub-arctic and is sensitive to climate variations on time scales ranging from the interannual to the interdecadal ( The GOA is a highly productive (>300 gc*m -2 yr -1 ) ecosystem as evidenced by SeaWiFS global primary productivity estimates ( The cold, nutrient-rich waters support a diverse ecosystem. Large-scale atmospheric and oceanographic conditions will affect the productivity of the GOA. Both long term and short term climate changes, in the GOA, have large influences on resident zooplankton community patterns. Regime shift is a long term shift in ocean climate. During the late 1970 s, a regime shift triggered a reorganization of community structure in the GOA ecosystem. The regime shift was characterized by an ocean temperature increase by 1-3 degrees o C. This regime shift led to a change in zooplankton composition in the northern North Pacific (Conners et al. 2002). In the Alaskan Gyre, the biomass of zooplankton and nekton doubled after the regime shift during the 1970s (Sugimoto & Tadokoro 1998). These regime shifts have long time effects on the ecosystems which can last 20 years or even more. A possible1990 regime shift was studied by using pacific halibut. The 1977 regime shift may have had a warming effect on the North Pacific Ocean, while a 1990 regime shift had a cooling effect on bottom seawater (Gao & Beamish 2003). The most recent regime shift happened around 1999 when ocean temperature changed from relative warmer to relative cooler (Bond et al. 2003). The effects of this most recent shift are still being investigated. Short term climate and oceanographic fluctuations can also result in zooplankton community structure changes. Ocean 29
38 conditions and plankton structure vary seasonally. In , there was a temperature decline of the sea water, which caused the zooplankton communities from Alaska to California to yield a trend as follows: boreal calanoid copepod species showed lower abundances in the warm period while subtropical species showed higher abundance and a more northerly distribution (Batten & Welch 2004). Currents affect nutrient availability, salinity change, and temperature conditions. Currents can also affect zooplankton communities by changing nutrient, salinity, and temperature conditions. Circulation and mixing of different currents provide zooplankton different habitats, which in turn cause zooplankton community structure variability. GOA shelf waters are characterized by two major currents: the Alaska Stream, which flows westward toward the shelf break and contains relatively cold and high saline water and the Alaska Coastal Current (ACC), which is a buoyancy driven current flowing westward within km of the shore line (Coyle & Pinchuk 2003). The ACC is the dominant current over the inner shelf. It is forced by both wind and freshwater runoff along the coast (Vaughan 2001) so that it contains relatively warm and dilute water. The GOA zooplankton community is dominated by a few species which account for most of the biomass and abundance. The GOA is a diverse and rich ecosystem and contains a number of important resources (Coyle & Pinchuk 2003). Over the shelf of northern GOA showed that: the large oceanic copepods such as Calanus, Eucalanus and Neocalanus are seasonal members of shelf and coastal zooplankton communities. They account for more than 25% of the net zooplankton biomass during the spring and summer months (Cooney 1986). Copepods are the most common taxonomic group. Zooplankton standing stocks vary with season at all oceanic, shelf and coastal locations. The movements of copepods over the GOA shelf have been related to seasonal shifts in vertical distributions and to a persistent pattern of onshore Ekman transport (Cooney 1988). Studies at Station P (at 50 N, 145 W) in the GOA confirmed that zooplankton biomass was highly seasonal; peaking in May and June and decreasing almost an order of magnitude from late fall to early spring (October to March). The annual cycle of zooplankton abundance and biomass on the GOA shelf during showed a strong seasonal pattern. Kodiak zooplankton Zooplankton have not been extensively studied around Kodiak Island, Alaska. The continental shelf waters near Kodiak Island have a diverse plankton assemblage, with complex distribution patterns where the abundance of zooplankton in the fall is higher than in early spring (Dunn 1979). In the summer, cold oceanic zooplankton species were valuable indicators of the fishing grounds for pollock and yellowfin sole (Lee 1980). Zooplankton composition, abundance and disposition were analyzed to compare to higher trophic marine animals in order to assess the significance of the selected holozooplankton to the pelagic food web (Vogel & McMurray 1982). It was found that predation by the higher trophic level species, such as capelin and Atka mackerel, showed a strong relationship with the decrease in zooplankton densities. Previous studies in the Kodiak Archipelago had addressed small scale relationships between zooplankton composition and environmental variables. No studies have been done to specifically address the seasonal and interannual variability associated with zooplankton community in relation to the dynamic environmental conditions of the region. This relationship must be better understood before variability in production and biomass of upper trophic levels can be understood. Mesoscale zooplankton studies are needed to provide a more solid foundation for high trophic level studies, i.e., fishery studies. These studies will help set up a better understanding and help build up a more sophisticated relationship of the marine food web around Kodiak Island. A broad picture of how zooplankton act under the influence their oceanographic conditions can be achieved by correlating zooplankton distribution and oceanographic conditions. The more we figure out about the relationships between zooplankton distribution and their oceanographic conditions, the better we can predict changes in zooplankton distribution and composition when we only have the oceanographic data available. It is impossible and time consuming to collect zooplankton data everywhere in the study area, while oceanographic data is easier to obtain. Significance of this study 30
39 It is important to study the zooplankton population dynamics around Kodiak Island due to the unique oceanographic conditions of this area. This area is influenced by two major current systems; the Alaska Stream and Alaska Coastal Current. These two currents have distinctive characteristics, specifically differences in temperature, salinity and nutrient availability, which result in different habitats. Under this circumstance, zooplankton have a potential for significant production and biodiversity, which may be responsible for the successful recruitment of numerous commercial fisheries downstream. By getting valuable regional scale zooplankton data and related oceanographic data through survey sampling, we can contribute these mesoscale data to the global scale zooplankton research. We are focusing on a mesoscale zooplankton study that has not been done before: examining the seasonal and annual variations of zooplankton abundance, distribution, and composition in relationship to the oceanographic features. There are gullys, banks and bays within this large coastal area. Different topographies provides different environment for zooplankton, which in turn cause different zooplankton distribution among these topographies. Zooplankton composition and distribution data can also be used to indicate climate change, identify certain water characteristics, and predict fishery community change. Goals The overall goal of this project will be to assess the relationship between zooplankton distribution and environmental variables on the northeast side of Kodiak Island. In order to accomplish the goals above, the objectives are: 1. to describe interannual zooplankton composition, distribution and abundance in Marmot Bay and Chiniak Bay near Kodiak Island from 2001 to H 0 : We hypothesize that zooplankton composition, distribution and abundance vary interannually in Marmot Bay and Chiniak Bay near Kodiak Island. 2. to describe seasonal zooplankton composition, distribution and abundance variations in Marmot Bay and Chiniak Bay near Kodiak Island from 2001 to H 0 : We hypothesize zooplankton composition, distribution and abundance vary seasonally in Marmot Bay and Chiniak Bay near Kodiak Island. Temperature and salinity changes may at least partly explain the difference. Zooplankton biomass will increase during spring month and decrease during winter month. 3. to assess the across shelf (from shore to the shelf break) distribution of zooplankton in H 0 : We hypothesize there are differences in zooplankton composition, distribution and abundance between inshore and offshore areas. Nearshore zooplankton community will be dominated by relatively smaller copepods; offshore zooplankton community will be dominated by relatively larger copepods. 4. to correlate zooplankton distribution with environmental variability using temperature and salinity data. H 0 : We hypothesize that temperature and salinity changes may at least partly explain the differences in zooplankton composition, distribution and abundance. Methods Study time and area Zooplankton samples from Marmot Bay and Chiniak Bay around Kodiak Island were collected in March, May, August, and November from 2001 to In March, the ocean temperatures are the coldest and copepods move up towards the surface to release eggs. In May, the ocean is highly productive after the peak of phytoplankton bloom, and certain zooplankton species increase with the adequate food. In August, the water temperatures are the warmest of the year and it has fewer nutrients than in May. Also, the water column is highly stratified due to the lack of mixing by winds. In November, copepods move down in the water column to over winter. Some of the copepods will stay at resting stages in order to stay alive (Baier & Napp 2003, Kobari et al. 2003, Napp et al. 2002). Zooplankton samples collection A 1 m diameter, 130 um mesh size ring net was deployed at multiple stations to collect zooplankton specimens. The sampling stations were systematically distributed in the sampling area. The ring net was lowered to a depth of 25 m. This depth was chosen based on the maximum depth of the acoustic scattering layer. In most cases, the thickest layer of zooplankton is from 25 m to the surface. The 31
40 ring net was lowered 0.5 m*s -1 through the water column. A General Oceanics flowmeter will be used with the ring net to calculate the amount of water filtered through the net. The flowmeter is centered in the center of the ring diameter where the flow properties are good. The amount of filtered water (m 3 ) = flowmeter revolutions* calibration factor*net opening area (m 2 ) (Sameoto et al. 2000, Coyle & Pinchuk 2003). Zooplankton samples will be preserved on board immediately in 10% buffered formaldehyde. In 2004, we also used rose bengal to dye the zooplankton samples for microscope identification in the laboratory. Sampling stations In 2001 and 2002 samples were collected in 24 stations in inshore areas of the Marmot and Chiniak Bays. In 2003 and 2004 samples were collected both in inshore area and offshore stations on the Portlock bank area. All the stations are evenly distributed within the sampling area. Zooplankton samples analysis In the microscope laboratory, all the zooplankton samples will be identified to species level. Each sample is poured into a sorting tray and large animals will be counted and removed before splitting the samples. Sub-samples split with a Folsom splitter will be enumerated and identified to the lowest possible taxonomic group and life stage. The number of splits will be determined after approximately 100 individuals of the dominant species remained. After analyzing the smallest fraction of sub-sample, we will go through all other sub-samples from small fraction to large fraction until we get a good description of the whole sample (Coyle & Pinchuk 2003). Zooplankton catches will be standardized to number per 1 m 3 of water after sub-sample analysis. CTD and TSG Sea surface temperature and sea surface salinity were collected using a continual data collecting SeaBird 45 thermosalinograph (TSG) attached to the hull of the survey vessel. Temperature and salinity from the entire water column was collected using a SeaBird19 CTD (conductivity and temperature at depth). The CTD was sent down from the surface to bottom at a speed of 0.5 m*s -1. The data series was processed using SBEDataProcessing-Win32 software (Domack et al. 1992). T-S plot will be done using the data collected by CTD in order to determine the thermocline depth. Gray and Kingsford (2003) define the thermocline as a >0.5 0 C change in temperature in 1 m depth interval. Coyle and Pinchuk (2002) define the depth of the thermocline where dt/dz was maximum. We will use the latter definition to determine the thermocline because by using the formal method, we might pick up a wrong thermocline if there are more than one temperature changes >0.5 0 C. T-D and S-D graphs will also be done. Statistical analysis To get an overall impression of zooplankton community structure in relation to the environmental variable, multi-dimensional scaling (MDS) will be used. Cluster analysis might be used to analyze the nearshore-offshore zooplankton comparisons (Magadza 1994). The main spirit of this method is to use species as an indicator to group my stations: try to find out similarity and dissimilarity among stations. Statistical software Statistica will be used. Results, Evaluation and Conclusions Analyses for this project are continuing with expected publications in the Fall of The species composition encountered during the study is: Most dominant small copepods: Oithona similis, Pseudocalanus spp., Acartia longiremis, copepod nauplii Most dominant large copepods: Calanus marshallae, Eucalanus bungii, Neocalanus spp. Other zooplankton: Oikopleura, Fritillaria, Sagitta, crab zoea, euphausiids. Literature Cited Anderson PJ, Blackburn JE, Johnson BA (1997) Declines of forage species in the Gulf of Alaska, , as an indicator of regime shift, Vol. 14. pp American Fisheries Society 32
41 Anderson PJ, Piatt JF (1999) Community reorganization in the Gulf of Alaska following ocean climate regime shift. Marine Ecology-Progress Series 189: Arnott SA, Ruxton GD (2002) Sandeel recruitment in the North Sea: Demographic, climatic and trophic effects. Marine ecology progress series 238: Baier CT, Napp JM (2003) Climate-induced variability in Calanus marshallae populations. Journal of Plankton Research 25: Bakun A (1990) Global climate change and intensification of coastal ocean upwelling. Science (Washington) 247: Batten SD, Welch DW (2004) Changes in oceanic zooplankton populations in the north-east Pacific associated with the possible climatic regime shift of Deep Sea Research II 51: Bollens SM, Cordell JR, Avent S, Hooff R (2002) Zooplankton invasions: a brief review, plus two case studies from the Northeast Pacific Ocean. Hydrobiologia 480: Bond NA, Overland JE, Spillane M, Stabeno P. (2003) Recent shifts in the state of the North Pacific. Geophysical Research Letters 30: 23 Brodeur RD, Frost BW, Hare SR, Francis RC, Ingraham WJ, Jr. (1996) Interannual variations in zooplankton biomass in the Gulf of Alaska, and covariation with California Current zooplankton biomass. Reports of California Cooperative Oceanic Fisheries Investigations 37:80-99 Brodeur RD, Ware DM (1992) Long-term variability in zooplankton biomass in the subarctic Pacific Ocean. Fisheries Oceanography 1:32-39 Clark DR, Aazem KV, Hays GC (2001) Zooplankton Abundance and Community Structure Over a 4000 km Transect in the North-east Atlantic. Journal of Plankton Research 23: Conners ME, Hollowed AB, Brown E (2002) Retrospective analysis of Bering Sea bottom trawl surveys: regime shift and ecosystem reorganization. Progress in Oceanography 55: Conversi A, Hameed S (1997) Evidence for quasi-biennial oscillations in zooplankton biomass in the subarctic Pacific. Journal of Geophysical Research. C. Oceans 102:15, ,665 Conway DVP, White RG, Hugues-Dit-Ciles J, Gallienne CP, Robins DB (2003) Guide to the coastal and surface zooplankton of the southwestern Indian Ocean, Vol. Vol. 15, 354 pp. Marine Biological Association of the UK, Plymouth (UK) Cooney RT (1986) The seasonal occurrence of Neocalanus cristatus, Neocalanus plumchrus, and Eucalanus bungii over the shelf of the northern Gulf of Alaska. Continental shelf research. Oxford, New York NY 5: Cooney RT (1988) Distribution and ecology of zooplankton in the Gulf of Alaska: A synopsis. THE BIOLOGY OF THE SUBARCTIC PACIFIC (PART 1)., Bulletin of the Ocean Research Institute, University of Tokyo. 26:27-41Coyle KO, Paul AJ (1990) Abundance and biomass of meroplankton during the spring bloom in an Alaskan Bay. Ophelia 32: Coyle KO, Paul AJ, Ziemann DA (1990) Copepod populations during the spring bloom in an Alaskan subarctic embayment. Journal of Plankton Research 12: Coyle KO, Pinchuk AI (2002) Climate-related differences in zooplankton density and growth on the inner shelf of the southeastern Bering Sea. Progress in Oceanography 55: Coyle KO, Pinchuk AI (2003) Annual cycle of zooplankton abundance, biomass and production on the northern Gulf of Alaska shelf, October 1997 through October Fisheries Oceanography 12: Cunha ME (1993) Spatial variation of the zooplankton biomass in relation to the hydrographic conditions off the Portuguese coast, Vol. ICES, 23 pp COPENHAGEN (DENMARK) Damkaer DM (1977) Initial zooplankton investigations in Prince William Sound, Gulf of Alaska and lower Cook Inlet, U.S. National Oceanic and Atmospheric Administration, Boulder, CO. Environmental Research Laboratories Danielsen P, St. John MA, Heilmann J (1998) Investigations of hydrographic processes influencing the distribution and production of phyto-and zooplankton in the Bornholm Basin, Baltic Sea, Vol. ICES, Copenhagen (Denmark) Domack EW, Schere E, McClennen C, Anderson J (1992) Intrusion of circumpolar deep water along the Bellingshausen Sea continental shelf. Antarctic Journal of the United States 27:71 Dunn JR, Kendall AW, Jr., Wolotira RJ, Bowerman JH, Jr., Dey DB, Matarese AC, Munk JE (1981) Seasonal composition and food web relationships of marine organisms in the nearshore zone -- 33
42 including components of the ichthyoplankton, meroplankton, and holoplankton. Report No. NOAA-OMPA-FR-81-13, NOAA Off. of Marine Pollution Assesment, Boulder, CO (USA) Dunn JR, Kendall AW, Jr., Wolotira RW, Quetin L, Bowerman JH, Jr. (1979) Seasonal composition and food web relationships of marine organisms in the nearshore zone, NOAA-ERL-AR p Foy RJ, Norcross BL (2001) Temperature effects on zooplankton assemeblages and juvenile herring feeding in Prince William Sound, Alaska. Alaska Sea Grant College Program. AK-SG pp Gao Y, Beamish RJ (2003) Stable isotope variations in otoliths of Pacific halibut (Hippoglossus stenolepis) and indications of the possible 1990 regime shift. Fisheries Research (Amsterdam) 60: Gray CA, Kingsford MJ (2003) Variability in thermocline depth and strength, and relationships with vertical distributions of fish larvae and mesozooplankton in dynamic coastal waters. Marine ecology progress series 247: Incze LS, Ainaire T (1994) Distribution and Abundance of Copepod Nauplii and Other Small ( Mu- M) Zooplankton During Spring in Shelikof Strait, Alaska. Fishery Bulletin 92:67-78 Irigoien X, Harris RP, Verheye HM, Joly P, Runge J, Starr M, Pond D, Campbell R, Shreeve R, Ward P, Smith AN, Dam HG, Peterson W, Davidson R, et al. (2002) Copepod hatching success in marine ecosystems with high diatom concentrations. Nature 419: Kobari T, Ikeda T, Kanno Y, Shiga N, Takagi S, Azumaya T. (2003) Interannual variations in abundance and body size in Neocalanus copepods in the central North Pacific. Journal of Plankton Research 25: Lee CR, Lee PG, Park C (1999) Seasonal and vertical distribution of planktonic copepods in the Korea Strait. Journal of the Korean Fisheries Society. Pusan 32: Lee HW, Ban S, Ikeda T, Matsuishi T (2003) Effect of temperature on development, growth and reproduction in the marine copepod Pseudocalanus newmani at satiating food condition. Journal of Plankton Research 25: Lee SS (1980) Distribution and abundance of copepods in the gulf of Alaska and the Bering Sea in summer J. Oceanol. Soc. Korea 15:17-33 Lenz J (2000) Introduction. In: ICES zooplankton Methodology manual. Academic Press, London(UK), p1-30. Lindley JA, Reid PC (2002) Variations in the abundance of Centropages typicus and Calanus helgolandicus in the North Sea: Deviations from close relationships with temperature. Marine biology 141: Mackas DL (1995) Interannual variability of the zooplankton community off southern Vancouver Island. 121: Magadza CHD (1994) Evaluation of eutrophication control in Lake Chivero, Zimbabwe, by multivariate analysis of zooplankton, Vol 272: Masundire HM (1994) Seasonal trends in zooplankton densities in Sanyati basin, Lake Kariba: Multivariate analysis, Vol 272: McKinnell SM, Mackas DL (2003) Intercalibrating SCOR, NORPAC and bongo nets and the consequences for interpreting decadal-scale variation in zooplankton biomass in the Gulf of Alaska. Fisheries Oceanography 12: Morgan CA, Peterson WT, Emmett RL (2003) Onshore-offshore variations in copepod community structure off the Oregon coast during the summer upwelling season. Marine ecology progress series 249: Napp JM, Baier CT, Brodeur RD, Coyle KO, Shiga N, Mier K. (2002) Interannual and decadal variability in zooplankton communities of the southeast Bering Sea shelf. Deep-Sea Research (Part II, Topical Studies in Oceanography) 49: Ohman MD (1997) On the determination of zooplankton lipid content and the occurrence of gelatinous copepods. Journal of Plankton Research 19: Paffenhofer GA (1980) Zooplankton distribution as related to summer hydrographic conditions in Onslow Bay, North Carolina. Bull. Mar. Sci. 30: Paul AJ, Coyle KO (1993) Taxa composition and biomass of the surface-dwelling crustaceans during spring pycnocline formation in Auke Bay, southeastern Alaska. Journal of crustacean biology. Washington DC 13:
43 Paul AJ, Coyle KO, Haldorson L (1991a) Interannual variations in copepod nauplii prey of larval fish in an Alaskan bay. ICES journal of marine science 48: Paul AJ, Paul JM, Coyle K, Smith R (1991b) Phytoplankton, zooplankton, and ichthyoplankton in Resurrection Bay, northern Gulf of Alaska in Report No. AK-SG Rogers DE, Rabin DJ, Rogers BJ, Garrison K, Wangerin M (1979) Seasonal composition and food web relationships of marine organisms in the nearshore zone of Kodiak Island - including ichthyoplankton, meroplankton (shellfish), zooplankton, and fish, NOAA-ERL-AR Roman MR, Holliday DV, Sanford LP (2001) Temporal and spatial patterns of zooplankton in the Chesapeake Bay turbidity maximum. Marine Ecology Progress Series 213: Runge JA, Castonguay M, De Lafontaine Y, Ringuette M, Beaulieu JL (1999) Covariation in climate, zooplankton biomass and mackerel recruitment in the southern Gulf of St Lawrence. Fisheries Oceanography 8: Sabates A, Gili JM, Pages F (1989) Relationship between zooplankton distribution, geographic characteristics and hydrographic patterns off the Catalan coast (western Mediterranean). Marine biology, Heidelberg 103: Sameoto D, Wiebe P, Runge J, Postel L, Dunn J, Miller C, Coombs S (2000) Collecting zooplankton. In: ICES zooplankton Methodology manual. Academic Press, London(UK), p Sargent JR, Gatten RR, Henderson RJ (1981) Lipid Biochemistry of Zooplankton From High Latitudes, Vol 7:6 Scheffer M, Straile D, Van Nes EH, Hosper H (2001) Climatic warming causes regime shifts in lake food webs. Limnology and Oceanography 46: Sugimoto T, Tadokoro K (1997) Interannual-interdecadal variations in zooplankton biomass, chlorophyll concentration and physical environment in the subarctic Pacific and Bering Sea. Fisheries Oceanography 6:74-93 Sugimoto T, Tadokoro K (1998) Interdecadal variations of plankton biomass and physical environment in the North Pacific. Fisheries Oceanography 7: Taggart CT, Drinkwater KF, Frank KT, McRuer J, LaRouche P (1989) Larval fish, zooplankton community structure, and physical dynamics at tidal front, Vol 191: Tittensor DP, Deyoung B, Tang CL (2003) Modelling the distribution, sustainability and diapause emergence timing of the copepod Calanus finmarchicus in the Labrador Sea. Fisheries Oceanography 12: Vaughan SL, Mooers CN, Gay SM (2001) Physical variability in Prince William Sound during the SEA Study ( ). Fisheries Oceanography 10:58-80 Vogel AH, McMurray G (1982) Seasonal population density distribution of copepods, euphausiids, amphipods and other holoplankton on the Kodiak Shelf, National Ocean Serv., Anchorage, AK (USA). Ocean Assessments Div. Woodd-Walker RS, Ward P, Clarke A (2002) Large-scale patterns in diversity and community structure of surface water copepods from the Atlantic Ocean. Marine ecology progress series 236:
44 Proximate composition (energetic value) of important Steller sea lion prey ( ) Robert J. Foy School of Fisheries and Ocean Sciences, University of Alaska Fairbanks, Kodiak, AK Introduction The importance of seasonal, spatial and ontogenetic variability in the energetic content of sea lion prey species has been noted but not well studied. In particular, marked species-specific seasonal and size variation in energy density has been observed in fish preyed on by seabirds and marine mammals (Hislop et al. 1991, Martensson et al. 1996). Knowledge of seasonal energetic differences is important to understanding the food requirements of Steller sea lions. It is expected that the energy density of fishes is highest in the fall and lowest prior to increases in spring plankton assemblages. Therefore, fish samples were collected in the fall near the potential maximum energy density and in early March when the accumulated effects of low food availability during the winter could be monitored. It is also expected that increased biomass of zooplankton and variability in production affects fish energy density from May - September. This study targeted demersal and pelagic fishes within the foraging range of Steller sea lion haulouts. Several demersal fish species are both prey of sea lions and targets of important commercial groundfish fisheries in Alaskan waters (walleye pollock, Pacific cod, flatfishes etc.). Knowledge of the quality of prey around Steller sea lion haulouts will allow us to understand the relative importance of particular prey that are also key commercial fisheries so that the importance of protected Steller sea lion habitat can be evaluated. The goal of this project was to determine the quality of fish species with the following objectives: 1. Quantify the quality of pelagic and ground fishes around Steller sea lion haulouts. 2. Estimate energetic availability of key Steller sea lion prey species around haulout areas based on biomass and energetic composition of fish species. 3. Compare seasonal quality of multiple commercially important fish species. 4. Make ontogenetic comparisons of the quality of multiple commercially important fish species. 5. Spatial and temporal comparisons of overall energetic densities of the fish community around the eastern side of Kodiak Island. Pelagic and demersal fish were collected on the east side of Kodiak Island, Alaska. Multiple fish species were collected around the Long Island Steller sea lion haulout on the southeast side of Kodiak Island in March, May, and November 2001 and March, May, June, July, August, September Fish were collected from the 10 nm closure area and the nm zone around the Long Island haulout on the northeast side of Kodiak Island. Samples were measured (SL), weighed and frozen whole upon collection and kept until proximate analyses could be done. Temperature data was also collected so that fish quality can be compared to physical attributes of the local environment. Approximately 1000 samples have been analyzed from an even distribution of species and size classes stratified by depth and distance to shore. Multiple fish were used at once for the smallest fish collected. Each fish was ground in a Butcher Boy commercial grinder with a 1.25 cm grinding plate followed by a Hobart grinder with a 0.4 cm grinding plate. Carbohydrates were not included because of their negligible amounts in fishes. Lipid was extracted using the Supercritical Fluid Extraction method in a LECO FA-100 Fat Analyzer. One to 3 g aliquots of homogenate were analyzed in triplicate. Total lipid content of the sample will then be used to extrapolate, by direct proportion, the total lipid content of the fish. Water content was 36
45 determined by isolating two 15 to 30 mg duplicate aliquots of homogenate in separate ceramic crucibles. The crucibles were placed in a 102 o C oven, dried until the contents attained constant weight (approximately 24 h), and reweighed. Dry weight was subtracted from wet weight to determine the water content, which was then reported as a percentage of wet weight. Protein content was determined with a Leco FP-2000 Nitrogen Analyzer. Protein was then estimated by multiplying percent nitrogen by a factor of 6.25 (Dowgiallo 1975). Ash content was determined by combusting duplicate 3 g aliquots of each homogenate in a muffle furnace at 510 o C until constant weight is attained. Samples were reweighed and ash content reported as a percentage of wet weight. Results, Evaluation and Conclusions The proximate composition of fish around the Long Island Steller sea lion haulout differed seasonally and annually. Lipid values ranged from 0.95 to 4.7 percent in May and from 1.9 to 11.6 percent in November over 30 fish species. Moisture ranged from 76.5 to 80.7 percent in May and 69.6 to 79.5 percent in November. Protein ranged from 13.9 to 21.0 percent in May to 14.9 to 17.7 percent in November. Ash ranged from 1.5 to 3.6 percent in both May and November. Data for this report include commercial fish species important to the diet of Steller sea lions (walleye pollock, Pacific cod, arrowtooth flounder, rock sole, and flathead sole). Between 25 and 59 samples of each species were run each season. The mean lengths and weights of fish used for analyses varied among seasons each year (Table 1). Proximate composition values are reported for March, May and November to show seasonal variability in energy density among the most important commercial fish species in the Steller sea lion diets (Table 2). Pacific cod, walleye pollock and rock sole have highest lipid contents in the fall and vary by 2 percent over the season. Arrowtooth flounder and flathead sole have highest lipid content in the spring. These differences may be due to life history variability or due to size class bias in the sampling. The seasonal variability in lipid content of walleye pollock varied significantly among seasons and between years (Fig. 1). Data from show that pollock gain as much as eight percent lipid content between May and November. Average values of lipid content appear to also be greater in 2002 than in similar months in 2000 and The seasonal amount of lipid available averaged across all pelagic and demersal species important to the diet of Steller sea lions varies spatially in Marmot and Chiniak Bays. During March 2002, the highest density of lipid was isolated to the area nearest Kodiak City. In both May and in November the area where the highest amount of lipid is available extends to the entire nearshore region. It is interesting to note that in July, the distribution shifted to an area in northern Marmot Bay and a very high amount of lipid was available farther offshore. This was attributed to large biomass of capelin that came closer to shore with increased water temperature in July July also represents the month with the highest lipid available in most years (Fig. 4). This seasonal phenomenon caused us to increase our sampling efforts in the area of Portlock Banks in 2003 and The interannual variability in lipid available in any given month is also large. The amount of lipid available in May of 2001 was larger than in 2000 or 2002 (Fig. 3). Also, the distribution of higher lipid fish species was more spread out over the entire nearshore area in May 2001 and 2002 than in While the seasonal and annual variability in lipid content of Steller sea lions is high, the relative lipid content among species remains similar (Fig. 5). Spiny dogfish, eulachon, arrowtooth flounder, starry flounder and capelin continually dominate the highest lipid content diets. It should be noted that sandlance was not adequately sampled in this study and make a large portion of the Sea lion diet and has relatively higher lipid content. Also species such as salmon have a high lipid content and are important in the diet but occur seasonally. 37
46 Literature Cited Alaska Sea Grant Is it food?: Addressing marine mammal and sea bird declines. Workshop summary, Alaska Sea Grant Rept , Univ. of Alaska, Fairbanks. Calkins, D.G., E.F. Becker, and K.W. Pitcher Reduced body size of female Steller sea lions from a declining population in the Gulf of Alaska. Mar. Mammal Sci. 14(2): Croll D. A. and B. R. Tershy Penguins, fur seals, and fishing: prey requirements and potential competition in the South Shetland Islands, Antarctica. Polar Biology. 19: Dowgiallo, A Chemical composition of an animal s body and of its food. Pages in W. Grodzinski, R. Z. Klekowski, and A. Duncan editors. Methods for Ecological Bioenergetics. IBP Handbook, No. 24 Blackwell Scientific. Hislop, J. R. G., M. P. Harris, and J. G. M. Smith Variation in the calorific value and total energy content of the lesser sandeel (Ammodytes marinus) and other fish preyed on by seabirds. J. Zool. Lond. 224: Lawson, J. W., A. M. Magalhaes, and E. H. Miller Important prey species of marine vertebrate predators in the northwest Atlantic: proximate composition and energy density. Marine Ecology Progress Series. 164: Loughlin, T.R., A.S. Perlov, and V.V. Vladimirov Range-wide survey and estimation of total number of Steller sea lions in Mar. Mammal Sci. 82: Martensson, P. E., A. R. Lager Gotaas, E. S. Nordoy, and A. S. Blix Seasonal changes in energy density of prey of northeast Atlantic seals and whales. Marine Mammal Science. 12(4): Merrick, R.L. and T.R. Loughlin Foraging behavior of adult female and young-of-the-year Steller sea lions in Alaskan waters. Can. J. Zool. 75: Merrick, R.L., R.B. Brown, D.G. Calkins, and T.R. Loughlin A comparison of Steller sea lion, Eumetopias jubatus pup masses between rookeries with increasing and decreasing populations. Fish. Bull. 93: Merrick, R.L., T.R. Loughlin, and D.G. Calkins Diet diversity of Steller sea lions and their population decline in Alaska: a potential relationship. Can. J. Fish. Aquat. Sci. 54: Merrick, R.L., T.R. Loughlin, G.A. Antonelis and R. Hill Use of satellite-linked telemetry to study Steller sea lion and northern fur seal foraging. Pol. Res. 13: Sease, J.L. and R.L. Merrick Status and population trends of Steller sea lions. pp in Pinniped populations, Eastern North Pacific: status, trends, and issues. Symposium of 127th Ann. Mtg. Am. Fisheries Society, Monterey, CA. 38
47 Table 1. Count, average length and weight of commercial species used for current analyses. March mean length (cm) mean weight (g) count Pacific cod Arrowtooth flounder Flathead sole Rock sole May Pacific cod Walleye pollock Arrowtooth flounder Flathead sole Rock sole November Pacific cod Walleye pollock Arrowtooth flounder Flathead sole Rock sole
48 Table 2. Seasonal proximate composition of commercial fish species. Lipid Protein Water Ash mean SD mean SD mean SD mean SD Pacific cod Arrowtooth flounder Flathead sole Rock sole May Pacific cod Walleye pollock Arrowtooth flounder Flathead sole Rock sole November Pacific cod Walleye pollock Arrowtooth flounder Flathead sole Rock sole
49 9.00 Mean (SD) Percent Lipid for Commercial Grade Walleye Pollock May-00 Jun-00 Jul-00 Aug-00 Sep-00 Oct-00 Nov-00 Dec-00 Jan-01 Feb-01 Mar-01 Apr-01 Percent Lipid May-01 Jun-01 Jul-01 Aug-01 Sep-01 Oct-01 Nov-01 Dec-01 Jan-02 Feb-02 Mar-02 Apr-02 May-02 Jun-02 Jul-02 Aug-02 Sep-02 Figure 1. Seasonal and interannual trends in commercial grade walleye pollock lipid content 41


50 March May Lipid (kg/km) Lipid (kg/km) Value Value High : High : Low : 5.95 Low : 6.82 July November Lipid (kg/km) Lipid (kg/km) Value Value High : High : Low : Low : Figure 2. Seasonal distribution of lipid biomass in Chiniak and Marmot Bay in
 Value High : 78.98 Low : 6.82 Figure 3.")
51 Lipid (kg/km) Value High : Lipid (kg/km) Value High : Low : 1.00 Low : Lipid (kg/km) Value High : Low : 6.82 Figure 3. Interannual distribution of lipid biomass in Chiniak and Marmot Bay in May
52 lipid (kg/km) March May July November Figure 4. Average lipid content in the demersal fish community on the northeast side of Kodiak Island. 70 Lipid (%) of Key Steller Sea Lion Prey % lipid Spiny dogfish Eulachon Arrowtooth flounder Starry flounder Capelin Yellowfin sole Butter sole Dover sole Rex sole Flathead sole Rock sole Sand sole Rougheye rockfish Harlequin Rockfish King salmon Northern rockfish Dusky rockfish Big skate Alaska skate Sculpins Walleye pollock Pacific cod Kelp greenling May-02 Mar-02 Nov-01 Jul-01 May-01 Nov-00 May-00 Figure 5. Average lipid content of Steller sea lion prey
53 Fatty Acid Analysis of Fish collected within Steller sea Critical Habitat, Kodiak, AK Robert J. Foy School of Fisheries and Ocean Sciences, University of Alaska Fairbanks, Kodiak, AK Introduction Much of our knowledge regarding diets of marine birds and mammals comes from fecal (scat) and stomach content analyses. Scat and stomach content analyses are useful for qualitatively assessing most of the diet items but have limitations that may bias the quantification of actual diets of the marine mammal. Limitations include variable digestion of particular prey species hard parts and undetermined species-specific passage rates. Scats also represent prey consumed during an unknown number of foraging bouts to unknown areas. Therefore, alternative methods have been sought to better quantify the diets of marine mammals. The analysis of fatty acid signatures has been used to identify and quantify the diets of pinnipeds and cetaceans (Aguilar and Borrell 1990, Borabia, et al 1994, Iverson et al 1997). Fatty acids represent a large portion of the lipid component of fish consumed by birds and mammals and are often conserved in fat or blubber following metabolism. Therefore, fatty acid signature analysis represents a tool for determining the origin of ingested food and a quantitative way of assessing prey items important to the diet of marine birds and mammals. In order to analyze fatty acids present in these consumers however, it is first necessary to identify the fatty acid signatures within the prey species they consume. In 2003, we initiated a project to determine the fatty acid signatures of pelagic and ground fish species collected within the Long, Chiniak, and Marmot Island Steller sea lion critical habitats. From a representative sample of these fish we quantified fatty acid methyl esters using protocols for lipid extraction and fatty acid assessment proven effective in other labs assessing pinniped prey. We will document seasonal and species-specific variability in fatty acids found in fish near Kodiak Island. These data will be critical to subsequent studies involving GAP collections of seabird fat and harbor seal blubber. The goal of this project was to determine the fatty acid signatures of fish species collected within the Long, Chiniak, and Marmot Island Steller sea lion critical habitats (Table 1) with the following objectives for 2004: 1. Collect pelagic and ground fishes within the Long, Chiniak, and Marmot Island Steller sea lion critical habitats. 2. Determine protocol for lipid extraction and fatty acid assessment 3. Quantify fatty acid methyl esters from a representative sample of fish. The following methodologies were used for fatty acid extractions: Methods Fat Extraction Lipids were extracted from samples using an accelerated solvent extractor ASE 200 (Dionex). The solvent system used to extract lipids was 2:1 chloroform/methanol (Folch solvent system). Lipids were continuously extracted under nitrogen at 70 o C over 15 minutes. After extraction solvents were removed under nitrogen stream on a TurboVap LV ASE Compatible (Zymark). Fatty acids profile Fatty acids methyl esters were prepared according to Maxwell and Marmer (1983), and analyzed on a gas chromatographer equipped with a flame ionization detector (FID) GC6850 (Agilent Technologies). Samples were analyzed in duplicate. 45
54 Lipid classes Lipid classes were determined by planar chromatography on an Iatroscan TLC/FID MK-6s (Iatron Laboratories). Calibration curves of the following lipid classes were determined using appropriate standards: wax esters, free fatty acids, triglycerides, sterols, partial glycerides and phospholipids. Lipid classes were quantified after a two-step development system using first a mixture of hexane:diethyl ether:formic acid (99:1:0.1 and ) with partial scanning of the rods, and then a mixture of hexane:diethylether (85:15) for elution of the polar lipid classes (Parrish and Ackman, 1983; Parrish, 1987). Results, Evaluation and Conclusions Calibration curves for approximately 25 fatty acids were determined and fatty acids quantified (Table 1). Fatty acid signatures from 35 species of pelagic and groundfish have been analyzed (Table 2). Data from 2004 will be added to assess seasonal and interannual variability in the signatures present for each species. Literature Cited Aguilar, A. and A. Borrell Patterns of lipid content and stratification in the blubber of fin whales (Balaenoptera physalus). Journal of Mammalogy 71(4): Borabia, M., P.J. Gearing, Y. Simard, J.N. Gearing, and P. Beland Blubber fatty acids of finback and humpback whales from the Gulf of St. Lawrence. Marine Biology 122: Iverson, SJ, Frost, KJ and Lowry, LL Fatty acid signatures reveal fine structure of foraging distribution of harbor seals and their prey in Prince William Sound, Alaska. Marine Ecology Progress Series 151: Maxwell, R.J., and Marmer, W.N Fatty acid analysis: phospholipid rich samples. Lipids, 18, Parrish, C.C Separation of aquatic lipid classes by chromarod thin-layer chromatography with measurement by Iatroscan flame ionization detection. Canadian Journal of Fisheries and Aquatic Sciences 44, Parrish, C.C. and Ackman, R.G Chromarod separations for the analysis of marine lipid classes by Iatroscan thin-layer chromatography-flame ionization detection. Journal of Chromatography,202,
55 Table 1. The fatty acids selected for and quantified in 2003 samples C10:0 C12:0 C13:0 iso-c14:0 C14:0 C14:1n5 iso-c15:0 anteiso-c15:0 C15:0 iso-c16:0 C16:0 C16:1n9 C16:1n7 iso-c17:0 anteiso-c17:0 C16:2n4 C17:0 C16:3n4 C17:1n9 C16:4n3 C16:4n1 C18:0 C18:1n9 c,t C18:1n7 C18:1n5 C18:2n6 c C18:2n6 t C18:3n6 C18:3n4 C18:3n3 C18:4n3 c19:0 C20:0 C20:1n11 C20:1n9 C20:1n7 C20:1n5 C20:2n6 C20:3n6 C20:4n6 C20:3n3 C20:4n3 C20:5n3 C22:0 C22:1n11 C22:1n9 C22:1n7 C22:2n6 C21:5n3 C22:4n6 C22:5n6 C22:3n3 C22:4n3 C24:0 C22:5n3 C22:6n3 C24:1n 47
56 Table 2. Species common names and total count used for fatty acid analysis in Species Total AK Plaice 10 Arrowtooth Flounder 25 BigmouthSculpin 5 Buttersole 5 DasycottusSculpin 5 DoverSole 5 EnglishSole 5 Eulachon 25 Flathead Sole 25 Halibut 25 Herring 25 KingSalmon 5 Longnose Skate 5 P. cod 25 PInkShrimp 25 PlainSculpin 5 Pollock 25 RexSole 5 RockSole 25 Rougheye 5 Sablefish 5 Sandsole 5 Shortfin eelpout 5 Shortfineelpout 5 Smooth Lumpsucker 5 Snailfish(liparis) 5 SpinyheadSculpin 5 StarryFlounder 5 SturgeonPoacher 5 Tanner Crab 5 TomCod 5 WhiteSpottedGreenling 5 WryMouth 5 Yelowfin sole 5 Yellow Irish Lords 5 48
57 VII. PISCIVOROUS CONSUMERS Piscivorous fish, seabirds, harbor seals, and whales are among the non-human apex predators that inhabit Kodiak waters, prey on local fish assemblages, and could potentially compete with Steller sea lions for common prey. As a first step in addressing such competitive interactions, we studied the seasonal diets and foraging patterns of these sympatric consumers. In addition, we monitored the health, productivity, and foraging patterns of sympatric predator populations as indicators of relative prey availability to consumers using common prey resources. To assess the roles of these predators and provide input for trophic-level modeling of energy budgets, we collected samples and data to identify seasonal and inter-annual patterns and changes in prey and habitat use by piscivorous birds, seals, whales, and fish in the Kodiak area. A. PISCIVOROUS FISH Fish are the dominant consumers of fish in the Bering Sea and other ecosystems. The decline of Steller sea lions in the 1970 s and 1980 s coincided with both declining forage fish abundance and increasing piscivorous groundfish populations. Currently, fish biomass of the Bering Sea and Gulf of Alaska is dominated by piscivorous groundfish, including arrowtooth flounder (Atheresthes stomias), walleye pollock (Theragra chalcogramma), Pacific cod (Gadus macrocephalus), and Pacific halibut (Hippoglossos stenolepis). While each have been found in the diet of Steller sea lions in our study area (Wynne, et al in prep), these species are also significant or dominant consumers of pollock and capelin in the Bering Sea and Gulf of Alaska and may therefore also compete with Steller sea lions for forage fish prey. We initiated several studies intended to assess the seasonal diets and potential for piscivorous fish to compete with Steller sea lions for common prey resource. Overall objectives were to examine seasonal diets of arrowtooth flounder, halibut, and spiny dogfish, Pacific cod, and walleye pollock by examining stomachs collected from survey cruises, commercial and sport harvests examine stomach contents of sleeper sharks taken as by-catch in commercial fisheries determine trophic status of individual spiny dogfish with stable isotope analyses. 49
58 Investigating the role of arrowtooth flounder (Atheresthes stomias) as a top level consumer in the Gulf of Alaska ecosystem from Brian Knoth and Robert J. Foy School of Fisheries and Ocean Sciences, University of Alaska Fairbanks, Kodiak, AK This study is part of a M.S. thesis that is currently scheduled to be completed by December Arrowtooth flounder represent both a prey item of Steller sea lions in Kodiak as well as an important competitor. As the arrowtooth flounder biomass has increased exponentially in the past decade, the obvious correlation to Steller sea lion declines needs to be addressed. Prior to a direct analysis, the importance of arrowtooth flounder as a consumer in the ecosystem needs to be quantified. Introduction The nearshore waters of the Gulf of Alaska (GOA) have undergone a drastic change in the fish species composition since the early 1980 s. The community has shifted from one dominated by small forage fish and shrimp to a community dominated by large piscivorous gadid and flatfish species (Anderson et al. 1997; Mueter and Norcross 2000). The species which has shown the most dramatic increase in abundance is arrowtooth flounder (Atheresthes stomias). Arrowtooth flounder is a large, piscivorous flatfish found in waters off central California to the Bering Sea (Hart 1973). In the early 1980 s arrowtooth flounder abundance was estimated to be around 980,000 metric tons (mt) and the most recent biomass estimates for arrowtooth flounder in the GOA are 2,822,830 mt (Turnock, Wilderbuer, and Brown 2003). In the GOA, arrowtooth flounder are most abundant in waters 76m to 225m deep (Zimmermann and Goddard 1996). Arrowtooth flounder are presently the most plentiful groundfish in the GOA, however, there is little commercial fishing targeting them. In 2003, there were only 23,316 mt harvested in the GOA (Turnock, Wilderbuer, and Brown 2003). Due to their increasingly high abundance and high trophic level in the GOA food web (Trites 2001) it is important to study their feeding behavior and trophic role in structuring the GOA ecosystem. Predation can play an important role in structuring and regulating prey populations in an ecosystem. Top level consumers may determine the fate of all populations in an ecosystem (Carpenter, Kitchell, and Hodgson 1985). Control of a system, by top level predators, has been illustrated for relatively simple freshwater systems (Carpenter, Kitchell, and Hodgson 1985; McQueen et al. 1989). Such control has been difficult to clearly illustrate in larger, more complex marine ecosystems, however, there are examples where this is occurring. The Georges Bank fish community, off the New England coast, is described as a predator controlled ecosystem (Sissenwine et al. 1984; Tsou and Collie 2001). This system has undergone dramatic changes in community structure due to the over exploitation of valuable, top level fish predators (Fogarty and Murawski 1998). The system is now dominated by elasmobranchs and other lower valued piscivores (Collie and Delong 1999). Predation by these piscivorous species is the most dominant source of mortality on prerecruit fishes in the Georges Bank fish community (Collie and Delong 1999, Overholtz, Link, and Suslowicz 1999, Tsuo and Collie 2001). Predation on the early life stages of marine fish may contribute to the extensive fluctuations seen in some stocks (Bailey and Houde 1989, Bax 1991). In the Grorges Bank ecosystem, the dominance of the piscivorous fish species in the system may be altering the rate of recovery of the valuable groundfish species (Fogarty and Murawski 1998). Understanding how species interact, through competition and predation, is valuable for managers in predicting long term trends in multispecies fisheries (Tsou and Collie 2001). In the GOA, diet studies have shown that arrowtooth flounder generally feed in the water column and typically feed on commercially important prey. Yang (1993, 1995) found that the majority of prey by weight of arrowtooth flounder >40 cm was walleye pollock (Theragra chalcogramma) and fish 20 cm to 39 cm fed mainly on capelin (Mallotus villosus) and Pacific herring (Clupea harengus) in the GOA. Larger 50
59 size arrowtooth flounder (> 40 cm) consume mainly age- 0, 1, and 2 walleye pollock (<300 mm) (Yang and Nelson 2000). Like all aquatic species, the main factor limiting prey choice is their body/ gape size (Lundvall et al. 1999). In the GOA, arrowtooth flounder compete with several fish and marine mammals, for food resources, particularly for their main prey walleye pollock. Yang (1993) found that in the GOA that Pacific halibut (Hippoglossus stenolepis), sablefish (Anoplopoma fimbria), and Pacific cod (Gadus macrocephalus) also consume walleye pollock. Diet overlap between these species is highly variable. Yang and Nelson (2000) found that diet overlap varied among years; pacific cod and arrowtooth flounder had a high overlap (>50%) in 1990, arrowtooth flounder and walleye pollock had high overlap 1993, and in 1996 there was low diet overlap between these predators in the GOA. Yang (1995) found that walleye pollock were the most important prey for both arrowtooth flounder and pacific halibut, specifically between arrowtooth flounder >40 cm and pacific halibut >80 cm. Arrowtooth flounder also compete with Steller sea lions (Eumetopias jubatus) for similar food resources. Sinclair and Zeppelin (2002) found that walleye pollock was one of the most common prey items identified in Steller sea lion scat samples in the GOA. Since the decline in the western stock of Steller sea lion may be associated with diet restrictions (National Marine Fisheries Service 2001) understanding the food habits of arrowtooth flounder, a possible competitor, is crucial. Although the food habits of arrowtooth flounder have been documented in the GOA there is a need to take a more detailed look into the temporal (seasonal, inter-annual) variations. Typically, a common assumption is that diet information collected during a few months, i.e. summer months, is representative of predation behavior throughout the year (Hollowed, Ianelli, and Livingston 2000). This does not take into account seasonal changes in a predator s diet. Dwyer, Bailey, and Livingston (1987) found distinct seasonal differences in the prey composition in walleye pollock. This study will attempt to remove this assumption by studying the seasonal and inter-annual variations in the diet of adult arrowtooth flounder in the study area. A better understanding of these variations could lead to more accurate estimates of predation losses. Presently the GOA is dominated by large piscivorous and gadid species (Mueter and Norcross 2000). Evidence supports the hypothesis that the decline in forage fishes occurred after the increase in large predatory fish, thus supporting the belief that predation was a possible factor contributing to the changes in community structure (Mueter and Norcross 2000). Arrowtooth flounder are the most numerous of all groundfish species in the GOA and being a large flatfish they are considered an apex predator on the same trophic level as marine mammals (Trites 2001). In the GOA, groundfish predation can be a significant source of mortality for important commercial fish species such as walleye pollock (Livingston 1994). Information gained by studying the feeding behavior of arrowtooth flounder and quantifying the consumption of commercially important prey will be useful in the management of the fish stocks in the GOA. The overall goal of this project is to examine the trophic role of adult arrowtooth flounder, as a top level consumer, in the GOA ecosystem. One objective will be further our understanding of the seasonal and interannual variations in the diet of arrowtooth flounder in the study area. We hypothesize that there will be significant differences in the diet compostition of arrowtooth flounder on a seasonal and interannual scale. The second objective will be to provide an estimate of the consumption of commercially important prey, by adult arrowtooth flounder, in the study area. We hypothesize that consumption estimates will show that adult arrowtooth flounder are consuming significant amounts of commercially important species, i.e. walleye pollock, on a yearly basis. The last objective will be to provide initial estimates on the flow of fish biomass and energy to arrowtooth flounder in the GOA food web. This will help test the hypothesis that a significant portion of the overall fish biomass and energy, in the GOA, is being utilized by adult arrowtooth flounder. Methods Study Area Sampling was conducted in the Gulf of Alaska in the vicinity of Kodiak Island. Specifically, the study area encompasses the water around Marmot and Long Islands. The sampling was in conjunction with ongoing survey cruises that have been operating in the area since May These cruises are used to survey and monitor fish, seabird, and whale populations around the Long Island and Marmot 51
60 Island Steller sea lion haulouts. The survey cruises were conducted four times annually in March, May, August, and November for 2001, 2002, and 2003 and will continue to be conducted in The cruises follow established, multiple east to west running parallel transect lines that encompass the waters around Marmot and Long Islands. Bottom trawls were conducted at designated stations throughout the study area. Bottom depths of these stations range from 60 m to 215 m deep. The survey cruises were conducted on the commercial stern trawler F/V Laura. The boat is configured with a main deck reel located directly over the stern ramp which is used to deploy the bottom trawl. The net used is a DanTrawl Fiska Trawl II 380/55 model with a 2.22 cm codend liner with 4.0 meter Nets Fishbuster doors. Each tow is conducted for approximately 10 minutes and the speed of the vessel is maintained at 3 knots (5.5 km/hr) for the duration of the tow. This calculates out to a distance of 0.92 km covered for each tow. The mean width of the net multiplied by the distance traveled results in an area swept by the net for each tow. The effort of each tow is used in conjunction with the data collected from the tows (arrowtooth flounder numbers and sizes) to calculate the catch per unit effort (CPUE) of each tow. CPUE will be calculated for arrowtooth flounder for each tow. Upon retrieval, the catches are were sorted by species and counted. Length measurements (total length (cm)) were taken for subsets of each species in the trawl. Large catches required a subset to be taken and analyzed, with the total catch determined from the composition of the subset. At each station, specimens of arrowtooth flounder were set aside for stomach collection. Depending on the catch size, 5 to 10 specimens were collected at each station. Arrowtooth flounder show size related feeding tendencies, becoming more piscivorous with size. Specifically, arrowtooth flounder > 40 cm tend to be mainly piscivorous (Yang 1995; Yang and Nelson 2000). This size threshold was used to select specimens. Fish that showed evidence of regurgitation or net feeding activities were not included. The following information was collected for each specimen: species, total length (cm), weight (g), sex, and maturity status. Stomachs were removed and placed in individual cloth bags with a corresponding identification tag listing the station code, species, and specimen number. Samples were preserved in a 10% formaldehyde solution in 5 gallon buckets. Stomachs were stored in the buckets until the laboratory analysis can be conducted. Laboratory Analysis In the laboratory, stomachs were removed from cloth bags and excess liquid was blotted off with a paper towel. Each stomach was weighed (0.01g). Stomachs were opened with a knife or scissors and contents were placed on a sieve with 300 um mesh. The stomach lining was rinsed off over the sieve, blotted dry, and reweighed on the balance. Stomach content weight was calculated by subtracting the stomach lining weight from the initial stomach weight. A determination of stomach fullness and digestion stage was recorded for each specimen. The following stomach fullness indices were used: 1 - empty, 2-25% full, 3-50% full, 4-75% full, and 5-100% full. Indices for digestion stage will be: 0 - pristine, no digestion, 1 - mostly pristine, 2 - mostly digested, 3 - fully digested. The stomach contents were gently rinsed with distilled water over the sieve to rinse off formalin residue. Prey organisms were separated, counted, and identified to the most practical taxonomic level. Emphasis was placed on the identification and measurement of fish, crab, and shrimp prey. Whole fish specimens were measured (1.0 cm) and weighed (0.01g). Crab carapace width was measured for intact crab carapaces. An attempt to identify digested fish prey was made by using otolith and other bony structures. Data from all specimens were recorded and entered into a database. Data Analysis The stomach sample information will be divided into four groups according to the season of capture (March, May, August, and November) for each of the study years. The samples will be divided this way to allow for ease of comparison among seasons and years. The prey composition will be described using the following methods: Percent of frequency of occurrence (%FO), percentage of total stomach content weight (%W), and percentage of total prey number (%N). These will be calculated for the major categories of prey items. Consumption of major prey items by arrowtooth flounder, for a certain time, will be calculated by the following equation (Livingston 1993): C = DR D B P 52
61 Where C = consumption in tons of a prey species, DR = daily ration (expressed as a fraction of body weight consumed daily), D = time period of analysis, B = estimates of predator population biomass, and P = the proportion by weight of given prey species. Daily ration estimates will be obtained from the literature. Predator biomass estimates will be obtained from the bottom trawl data. The consumption estimates of commercially important prey will be analyzed on a seasonal and yearly basis. Comparison to the commercial landings of the particular prey for a given year will be conducted to illustrate the magnitude of the consumption. Additionally, the length of prey items consumed will be calculated and compared with sizes of prey items typically harvested commercially. This will help to determine if the two groups are competing with each other for the same size class of species. Finally, consumption estimates, in terms of biomass, will be converted into energy values by using known energy densities of prey items consumed. Estimates of total energy consumed by adult arrowtooth flounder will expressed seasonally and on a yearly scale. Estimates will be made for the total fish biomass and energy consumed by adult arrowtooth flounder, on a yearly basis, in the GOA. Results, Evaluation and Conclusions Stomach samples of adult arrowtooth flounder were collected during surveys in 2001, 2002, and There are plans to continue the sampling for During the 2001, 2002, and 2003 surveys, an average of 5 10 stomach samples of arrowtooth flounder were collected for each of the tows. In 2004, there are plans to increase the number of stomach samples collected per tow during each of the survey cruises. To date only a small portion (33) of the stomach samples have been initialized analyzed for stomach fullness. Of the 33 samples, 11 of the stomachs were empty. The remaining 22 stomachs averaged g and placed averaged ~ 3 on the index of stomach fullness (~ 50% full). No other analysis of the stomach samples has been completed. Literature Cited Anderson, P.J., Blackburn, J.E., and Johnson, B.A Declines of forage species in the Gulf of Alaska, , as an indicator of regime shift. Pages in Forage fishes in marine ecosystems. Proceedings of the International Symposium on the Role of Forage Fishes in Marine Ecosystems. University of Alaska Fairbanks, Alaska Sea Grant College Program Report Number Fairbanks, Alaska. Arrhenius, F. and S. Hansson Food consumption of larval, young and adult herring and sprat in the Baltic Sea. Marine Ecology Progress Series 96: Arrhenius, F. and S. Hansson In situ food consumption by young-of-the-year Baltic Sea herring Clupea harengus: a test of predictions from a bioenergetics model. Marine Ecology Progress Series 110: Bailey, K.M. and E.D. Houde Predation of eggs and larvae of marine fishes and the recruitment problem. Advances in Marine Biology 25:1 83. Bax, N.J The significance and prediction of predation in marine fisheries. ICES Journal of Marine Science 55: Brodeur, R. D. and K.M. Bailey Predation on the early life stages of marine fishes: a case study on walleye pollock in the Gulf of Alaska. Pages in Y. Watanabe, Y. Yamashita, and Y. Oozeki, editors. Survival strategies in early life stages of marine resources. A.A. Balkema Press, Rotterdam, Netherlands. Buckley, T.W. and P.A. Livingston A bioenergetics model of walleye pollock (Theragra chalcogramma) in the eastern Bering Sea: structure and documentation. U.S. Department of Commerce, NOAA Technical Memorandum. NMFS-AFSC-37. Carpenter, S.R., J.F. Kitchell, and J.R. Hodgson Cascading tropics interactions and lake productivity. Bioscience 35(10): Collie, J.S. and A.K. DeLong Multispecies interactions in the Georges Bank fish community. Pages in Ecosystem approaches for fisheries management. University of Alaska Fairbanks, Alaska Sea Grant College Program Report number Fairbanks, Alaska. Dwyer, D. A., K. M. Bailey, and P. A. Livingston Feeding habits and daily ration of walleye pollock (Theragra chalcogramma) in the eastern Bering Sea, with special reference to cannibalism. Canadian Journal of Fisheries and Aquatic Sciences 44:
62 Fogarty, M.J. and S.A. Murawski Large scale disturbance and the structure of marine systems: fisheries impacts on Georges Bank. Ecological Applications 8: S6 S22. Hansson, S., L.G. Rudstam, J.F. Kitchell, M. Hilden, B.L. Johnson, and P.E. Peppard Predation rates by North Sea cod (Gadus morhua) predictions from models on gastric evacuation and bioenergetics. ICES Journal of Marine Science 53: Hart, J.L Pacific Fishes of Canada. Fisheries Research Board of Canada Bulletin 180. Hartman, K.J. and F.J. Margraf Effects of prey and predator abundances on prey consumption and growth of walleyes in western Lake Erie. Transactions of the American Fisheries Society 121: Hewett, S.W. and B.L. Johnson Fish bioenergetics model 2, an upgrade of A generalized bioenergetics model of fish growth for microcomputers. University of Wisconsin Sea Grant Technical Report Number WIS-SG , 79pp. Hollowed, A. B., J. N. Ianelli, and P. A. Livingston Including predation mortality in stock assessments: a case study for Gulf of Alaska Walleye pollock. ICES Journal of Marine Science 57(2): Livingston, P.A., D.A. Dwyer, D.L. Wenker, M.S. Yang, and G.M. Lang Trophic interactions of key fish species in the eastern Bering Sea. International North Pacific Fisheries Commission Bulletin 47: Livingston, P. A Importance of predation by groundfish, marine mammals, and birds on walleye pollock Theragra chalcogramma and Pacific herring Clupea pallasi in the eastern Bering Sea. Marine Ecology Progress Series 102: Livingston, P. A Overview of multispecies interactions involving walleye pollock in the eastern Bering Sea and Gulf of Alaska. ICES Council Meeting Papers. ICES, Copenhagen (Denmark). Lundvall, D., Svanbäck R., Persson L., and P. Bystrom Size dependent predation in piscivores: interactions between predator foraging and prey avoidance abilities. Canadian Journal of Fisheries and Aquatic Sciences 56: Mittlebach, G.G., Turner, A.M., Hall, D.J., Rettig, J.E., and C.W. Osenberg Perturbation and resilience: a long term, whole lake study of predator extinction and reintroduction. Ecology 76: Mueter, F. J. and B. L. Norcross Changes in species composition of the demersal fish community in nearshore waters of Kodiak Island, Alaska. Canadian Journal of Aquatic Sciences 57: National Marine Fisheries Service Steller sea lion protection measures final supplemental environmental impact statement. U.S. Department of Commerce, National Oceanic and Atmospheric Administration Alaska Region, Juneau, Alaska. Overholtz, W.J., J.S. Link, and L.E. Suslowicz Consumption and harvest of pelagic fishes and squids in the Gulf of Maine Georges Bank ecosystem. Pages in Ecosystem Approaches for Fisheries Management. University of Alaska Fairbanks, Alaska Sea Grant College Program Report Number Fairbanks, Alaska. Rand, P.S. and D.J. Stewart Dynamics of salmonine diets and foraging in Lake Ontario, : a test of a bioenergetic model prediction. Canadian Journal of Fisheries and Aquatic Sciences 55: Rickey, M.H Maturity, spawning, and seasonal movement of arrowtooth flounder, Atheresthes stomias, off Washington. Fishery Bulletin 93: Sinclair, E.H. and T.K. Zeppelin Seasonal and spatial differences in diet in the western stock of Steller Sea Lion (Eumetopias jubatus). Journal of Mammalogy 83(4): Sissenwine, M.P Perturbation of a predator controlled continental shelf ecosystem. Pages in K. Sherman and L.M. Alexander, editors. Variability and Management of Large Marine Ecosystems. American Association for the Advancement of Science, Selected Symposium Series, no. 99. Washington, D.C. Stewart, D.J. and M. Ibarra Predation and production by Salmonine fishes in Lake Michigan, Canadian Journal of Fisheries and Aquatic Sciences 48: Trites, A.W Marine mammal trophic levels and interactions. Pages in J. Steele, S. Thorpe and K. Turekian, editors. Encyclopedia of Ocean Sciences. Academic Press, London, UK. 54
63 Tsou, T.S. and J.S. Collie. 2001a. Predation mediated recruitment in the Georges Bank fish community. ICES Journal of Marine Science 58: Tsou, T.S. and J.S. Collie. 2001b. Estimating predation mortality in the Georges Bank fish community. Canadian Journal of Fisheries and Aquatic Sciences 58: Turnock, B.J., T.K. Wilderbuer and E.S. Brown Arrowtooth flounder- Stock assessment and fishery evaluation report for the 2002 Gulf of Alaska Groundfish Fishery. National Marine Fisheries Service. Stock Assessment and Fishery Evaluation Report. Anchorage, Alaska. Winberg, G.G Rate of metabolism and food requirements of fishes. Belorussian University, Minsk. Translated from Russian: the Fisheries Research Board of Canada. Translation Series 164, 1960, Ottawa. Yang, M-S Food habits of the commercially important groundfishes in the Gulf of Alaska in U.S. Department of Commerce, NOAA Technical Memorandum. NMFS-AFSC-22. Yang, M-S Food habits and diet overlap of arrowtooth flounder (Atheresthes stomias) and Pacific halibut (Hippoglossus stenolepis) in the Gulf of Alaska. Pages in Proceedings of the International Symposium on North Pacific Flatfish. University of Alaska Fairbanks, Alaska Sea Grant College Program Report No Fairbanks, Alaska. Yang, M-S. and M. W. Nelson Food habits of the commercially important groundfishes in the Gulf of Alaska in 1990, 1993, and U.S. Department of Commerce, NOAA Technical Memorandum. NMFS-AFSC-112. Zimmermann, M. and P. Goddard Biology and distribution of arrowtooth, Atheresthes stomias, and Kamchatka, A. evermanni, flounders in Alaskan waters. Fishery Bulletin 94:
64 Trophic Status of Spiny Dogfish (Squalus acanthias) in the Gulf of Alaska Judith Nash and Robert J. Foy School of Fisheries and Ocean Sciences, University of Alaska Fairbanks, Kodiak, AK This study is part of a M.S. thesis that is currently scheduled to be completed by May Samples for this project were collected in 2003 as part of the GAP program. Spiny dogfish are both an important prey item as well as competitor with Steller sea lions. As spiny dogfish and other elasmobranch biomass has increased in the Gulf of Alaska in the past decade, the correlation to Steller sea lion declines needs to be addressed. Prior to a direct analysis, the importance of spiny dogfish in the Gulf of Alaska ecosystem needs to be determined. Introduction The emphasis of marine research has been increasingly at the ecosystem level. Previously, studies focused on species in isolation. This approach is being supplanted by broader scale investigations of species in relation to both the biotic and abiotic factors that influence their life history strategies. One framework for the study of ecosystems is built around the concept of trophic interactions among species. The significance of these relationships serves as a determinant for the relative success of the populations that comprise a given ecosystem (Pimm 1982). Trophic interactions, though recognized as being influential on community dynamics, have been a source of controversy among ecologists in terms of the processes that define the structure of a given ecosystem. The bottom-up hypothesis supports the idea that each trophic level is resource-limited. This is countered by the hypothesis of the top-down mediated ecosystem, wherein the upper trophic levels are food-limited while those at the lower end of the spectrum may be defined by either resource availability or predation (Hairston et al. 1960). There is some evidence however, for the presence of a middle ground amidst the controversy: both forcing systems are apt to operate at varying degrees and in different temporal and spatial scales (Roff et al. 1988). In aquatic systems, the top-down controlled system is the preferred paradigm for want of evidence indicating otherwise (Steele 1998). Evolving from the top-down theory, and largely supported by limnological evidence (Strong 1992; Carpenter and Kitchell 1993), is a trophic cascade model. This model is predicated upon the idea that higher trophic levels, by virtue of their presence or absence in a system, will determine the relative amassment of plant biomass at the system's base (Verity and Smetacek 1996), the effects 'cascading' through the various trophic levels. Consequently, alterations to the population structure of a key organism in a system, such as that of a toplevel predator, may be extensive and result in considerable changes to the populations of other species within the system, and thus in the nature of the system itself. Fish at the top of marine food webs tend to be the target and primary harvest of the fishing industry (Pauly et al. 1998). Many shark species are commonly at or near the top of their supporting food webs. Furthermore, it has been suggested that sharks may be fundamental to the maintenance and stability of marine communities, fulfilling the role of keystone predators (Hinman 1998). In addition to their characteristic position within their food webs, sharks exhibit a number of other distinct life history traits that require consideration. Sharks exhibit K-selected life history strategies, defined by slow growth, delayed onset of sexual maturity, low fecundity and natural mortality, and greater longevity than that experienced by their teleost counterparts (Walker 1998). Lately, shark populations the world over have been receiving a great deal of attention in light of their relative trophic position and the effects of fishing on their populations (Kitchell et al. 2002). In 1994, the member countries of the Convention of International Trade in Endangered Species of Wild Flora and Fauna (CITES) mandated a review of the status and trade in sharks (Stevens et al. 2000). This lead to the eventual adoption of the United Nations Food and Agriculture Organization International Plan of Action for Shark Conservation and Management in 1999, which aimed to have national shark fishery management plans in place by The achievement of this goal remains beyond reach, but continues to be a priority for the organization and 56
65 many of its member countries (Cavanaugh and Fowler 2004) as the threat faced by many shark species continues to grow in step with the lucrative market for shark products. The growing concern about the impact of fishing on shark population dynamics, and the intention to implement management strategies are justified by the limited information available regarding sharks and what has been observed to happen to shark populations when they are the targets of unmanaged fisheries. The spiny dogfish (Squalus acanthias) has a history of utilization in North America that has been traced back to as early as 5000 B.P. (Ketchen 1986). This species is one of the most plentiful sharks in the world's oceans, distributed in temperate and sub-arctic waters at depths ranging from the surface to 900 meters (NOAA 1999). Spiny dogfish generally seem to prefer a temperature range between 6 and 13 degrees Celsius (Jensen 1966; Shepherd et al. 2002) and have been observed to participate in migratory behavior (McFarlane and King 2002; McRuer and Hurlbut 1996). As with other members of the family Squalidae, the spiny dogfish is ovoviparous, bearing live young after one of the longest gestation periods of any vertebrate: from months (Ketchen 1972). In addition to the prolonged reproductive cycle, the species exhibits a remarkably slow growth rate and late onset of maturity. Although age and length at maturity has shown regional variation, in the Northeast Pacific, females have been observed to attain sexual maturity anywhere from 16 to 35 years of age (Ketchen 1975; Saunders and McFarlane 1993). Fecundity tends to increase with length and, while a single reproductive cycle may produce 2-15 pups, the average litter size is 6 pups (Soldat 1979). Offspring measure 20 to 30 centimeters at birth (Jones and Green 1977) and the sexually dimorphic growth exhibited by the species becomes apparent as the individuals mature. Females attain a greater size than males and, in the North Pacific, have been observed to achieve maximum lengths of more than 130 cm. Males, on the other hand, reach maturity at an average age of 14 years and have been observed to attain a maximum length of 107 cm and an age in excess of 40 years (Ketchen 1975). The spiny dogfish is a gregarious species that tends to school by size and, when mature, by sex (Nammack et al. 1985; Koen Alonso et al. 2002). Juvenile spiny dogfish seem to favor a mid water habitat where their diet has been found to comprise a variety of small invertebrates (Jones and Green 1977). With the onset of maturity however, the species undergoes a shift to demersal habitat utilization where fish become the primary prey (Koen Alonso et al. 2002). The opportunistic feeding habits of spiny dogfish are well documented (Garrison 2000). Numerous and varied food items, predominantly fish, arthropods, and ctenophores, were observed during an extensive study analyzing more than spiny dogfish stomachs during the Northeast Fisheries Science Center (NEFSC) bottom trawl surveys from (NMFS 1999). Despite recognition of the opportunistic feeding behavior of the species, any attempt to further generalize regarding the diet of spiny dogfish is confounded by considerations of locality, depth, and seasonality of sampling (Ketchen 1986). Furthermore, the seemingly voracious appetite of packs of spiny dogfish has made the species a target of many a fisherman's animosity. Those acquainted with the spiny dogfish are familiar with its reputation as a nuisance fish. Its recorded history as a commercially harvested resource, however, dates back to the nineteenth century, when the body and liver oils of the spiny dogfish first became a marketable commodity used in industrial lubrication and lighting (Ketchen 1986). Expansion of the United States (US) east coast fishery on spiny dogfish throughout the 1990s was a result of attempts to ease the pressure on the more valuable collapsed Atlantic groundfish stocks through the creation and promotion of markets for spiny dogfish meat (ASMFC 2002). Consequently, after a decade of fairly stable spiny dogfish landings totaling approximately 6300 metric tons annually, the following decade saw a marked increase in catches. Landings peaked in 1996 at 28, 200 metric tons, followed by a subsequent decline to 22, 000 metric tons in The US commercial fishery was responsible for more than 95% of these spiny dogfish landings (NEFSC 1999). The spiny dogfish fishery is one that has traditionally targeted females owing to their larger size and greater value; recent stock assessment of spiny dogfish utilizing NMFS data revealed a continued decline in the biomass and numbers of mature females as well as in the overall stock (NMFS 2000). Additionally, pup surveys by NMFS in the northwest Atlantic yielded the lowest numbers on record at the end of the 1990s (ASMFC 2000), indicating a possible failure in recruitment as a result of exploitation. In 1998, the National Marine Fisheries Service declared the species over-fished (ASMFC 2002). Management initiatives were immediately undertaken and a fishery management plan (FMP) was jointly developed by the Mid-Atlantic and New England Fishery Management Councils and implemented 57
66 in 2000 (NMFS 2000). The spiny dogfish also has a long history of utilization on the west coast of North America, having been both an abundant and significant component of the Pacific groundfish fishery at various periods throughout history (Ketchen 1986). Though the Atlantic spiny dogfish fishery saw explosive growth followed by a sudden and devastating crash, fishery efforts directed at spiny dogfish in the Pacific have been somewhat more uniform in recent years (NMFS 2001). The average annual landing size in the Washington-Oregon dogfish fishery was approximately 500 mt between 1986 and 2001, which represents a fraction of the catch reported on the eastern seaboard (NMFS 2001). In 2003, however, Rockfish Conservation Areas were established for the protection of rockfish and other valuable groundfish along the west coast (NMFS 2003). Consequently, fishing for spiny dogfish with the traditionally utilized bottom trawls (NMFS 2001) has since been prohibited in these areas. Although spiny dogfish is not a targeted species in Alaskan waters, increasing abundance of this and other shark species have become apparent to fishermen in the last decade (Wright and Hulbert 2000). Common bycatch in both the pelagic walleye pollock trawl fishery as well as in the longline fisheries for a variety of groundfish species (halibut (), sablefish (), Pacific cod ()), spiny dogfish have experienced a dramatic population increase in the eastern Gulf of Alaska and Prince William Sound. In the six years spanning 1997 to 2002, bycatch of the species ranged from 117 mt to 864 metric tons and was primarily taken between Southeast and Kodiak, Alaska (NPFMC 2003). Catch trends reported by fishermen are supported by the longline survey data obtained by both the National Marine Fisheries Service and the International Pacific Halibut Commission. These data depict an increasing trend in relative abundance of spiny dogfish in the waters along the eastern and central gulf coast of Alaska and the Kodiak Island region during the 1990s (Wright and Hulbert 2000). The concept of regimes developed with the increasing importance of fisheries management. Regimes were first introduced in the 1970s (Isaacs 1975) to describe both stable conditions in climatic and oceanic data series as well as persistent periods of patterns in fish recruitment (Beamish et al. 1999). McKinnell et al. (2001) describe the low frequency, high amplitude and frequently sudden changes in the biological communities that can transpire simultaneously with physical changes in the climate system as a regime shift. The Gulf of Alaska ecosystem has experienced numerous occurrences of these regime shifts. The first such regime shift to be recognized was that of 1977 when a dramatic alteration in species composition (Anderson et al. 1997) followed a cyclical shift from a predominantly cold regime in the three decades prior to 1977, to a warm regime in the years since (Benson and Trites 2002). The changes observed in the oceanic and climatic conditions during 1977 were not the first such major shift in the oceanic climate. Indications of similar events have been noted to occur prior to the 1977 shift, in 1925 and 1947 (Mantua et al. 1997; Minobe 1997). Additionally, in the years following the 1977 event, there was a shift in 1989 (Beamish et al. 1999) and a potential shift in 1998 (McFarlane et al. 2000). However, it is important to note that a shift does not imply a return to a previous state nor does it imply that a particular regime will be evident in all of the indices that describe the climatic and oceanographic conditions of the Pacific Ocean (Benson and Trites 2002). Where previously the biological community was dominated by small forage fish and crustaceans supporting a vibrant collection of seabirds and marine mammals, by the 1990s the biomass of higher trophic level groundfish had increased by as much as 250% (Anderson and Piatt 1999). This increase in gadoid and flatfish species such as walleye pollock and arrowtooth flounder saw a potentially related decline in the forage fish base and the marine mammals and seabirds that these species support. The cause of the restructuring of the large marine ecosystem of the Gulf of Alaska is unclear. One widely supported hypothesis is that the reorganization of the ecosystem is a result of the ocean climate shift (Orensanz et al. 1998) to an environment favorable to species whose biological characteristics include greater longevity, delayed maturity, and intermittent strong recruitment (Anderson and Piatt 1999). A related hypothesis is that the increasing populations of these species, many of whom prey on forage species, are thought to have further exacerbated the declines in the forage base (Anderson and Piatt 1999; Mueter and Norcross 2000). Evidence supporting this hypothesis demonstrates that predation plays a considerable role in the Gulf of Alaska ecosystem. The degree to which spiny dogfish affect mortality rates of commercially important species in the Gulf of Alaska is unknown. A better understanding of the trophic role of spiny dogfish in this ecosystem 58
67 would assist in providing a sound basis from which to make management decisions regarding the potential for a fishery targeting spiny dogfish. The assessment of diet and trophic position are important aspects in understanding the role of a species in a marine ecosystem. One long-standing practice to accomplish these aims in aquatic food webs has been the use of stomach content analysis (Cortes 1997). This and other indirect methods of dietary evaluation may be misleading unless a wide-ranging sampling schedule is undertaken. Stomach content analysis provides only a snapshot of a species diet and may be biased by discrepancies in rates of digestion (Hansson et al. 1997). In recent years, stable isotope analysis has been recognized as a useful way to determine trophic position. Predator tissues bear signature δ 13 C/δ- 12 C and δ 15 N/δ 14 N ratios that are directly related to those of their prey and have been shown to transfer in a predictable manner (Peterson and Fry 1987). δ- 13 C/δ- 12 C ratios are often used as a sign of a consumer s primary prey items as enrichment of δ- 13 C between trophic levels is limited to 0-1% (Peterson and Fry 1987; Hobson and Welch 1992). In contrast, nitrogen stable isotope ratios (δ- 15 N/δ- 14 N) are useful as a predictor of actual trophic level as δ- 15 N shows an increase of 3-4% with increasing trophic level (Peterson and Fry 1987; Post 2002). This disparity in nitrogen isotope fractionation occurs because the consumer s metabolic processes preferentially utilize the lighter isotope (Rau et al. 1983). While the use of stable isotopes does have certain limitations, including a lack of known trophic fractionations as well as the assumptions involved in analysis (Estrada et al. 2003), it also has distinct advantages over traditional diet measures. Stable isotope analysis provides information that represents assimilated and not merely ingested prey, the isotopic ratios present in consumer tissue are indicative of long-term diet (Peterson and Fry 1987) and δ- 13 C/δ- 12 C ratios allow conclusions to be drawn regarding inshore versus offshore feeding habits (France 1995). Consequently, stable isotope analysis serves as a complementary method to stomach content surveys. The goal of this study is to investigate the trophic status of spiny dogfish (Squalus acanthias) and to evaluate its role as a top-level predator in the Gulf of Alaska ecosystem. Objectives The following objectives pertain to the achievement of the goal stated above: Quantify number, biomass, fullness and frequency of occurrence of prey species in the stomach contents of individual spiny dogfish. Assess stomach condition of spiny dogfish according to determination of fullness. Determine trophic status of individual spiny dogfish with stable isotope analyses. Hypotheses Spiny dogfish occupy a trophic level between 3 and 4 in the Gulf of Alaska. There is an ontogenetic shift in the diet of spiny dogfish from pelagic to demersal species. There is a seasonal shift in the diet of spiny dogfish due to changes in distribution. Spiny dogfish in different areas of the Gulf of Alaska will occupy different trophic levels. Methods Sampling will be carried out in the Kodiak Island region of the Gulf of Alaska using bottom trawls at designated stations where depths range from 60 to 215 meters. Sampling for spiny dogfish will be concomitant to studies being carried out by three organizations. During the summer months, when juvenile spiny dogfish and mature females are anticipated to be in nearshore waters, the National Marine Fisheries Service and the International Pacific Halibut Commission conduct surveys in environs of interest. The University of Alaska, on the other hand, conducts surveys at various times throughout the year. Survey and monitoring activities for seabird, whale and fish populations around the stellar sea lion haulouts at Marmot and Long Islands are performed during March, May, August and November and provide opportunities to carry out sampling for spiny dogfish as well. 59
68 At each designated station, between 5 and 10 spiny dogfish specimens will be set aside depending on the size of the catch. Any fish that show evidence of regurgitation or net-feeding activities will be excluded from the pool. The 5 to 10 randomly selected spiny dogfish will then be reserved for stomach and tissue collection and the following information for each individual will be recorded: species, total length (cm), weight (g), sex and stage of maturity. Stomachs will be removed from the specimens and placed in individual cloth bags tagged with a record of the station code, species and specimen number. Samples will then be preserved in 5 gallon buckets containing a 10% formaldehyde solution where they will remain until such time that laboratory analyses can be conducted. A small section of dorsal muscle tissue (2-3 cm) will be excised from each specimen. This tissue sample will be stored frozen with a record of the identifying information corresponding to the specimen until stable isotope analysis can be undertaken. In the laboratory, stomachs will be extracted from the cloth bags and paper towels will be used to blot excess liquid from each specimen. Individual stomachs will be weighed to the nearest hundredth of a gram using a balance scale. Once the stomach has been incised using a knife or scissors its contents will be placed on a sieve with 300 µm mesh. The lining of the stomach will be rinsed off over the sieve to capture any remaining items, blotted dry and reweighed on the balance. The weight of the stomach contents may then be expressed as the difference between the initial stomach weight and that of the stomach lining. This value, as well as determination of stomach fullness and digestion stage, will be recorded for each specimen. Indices for digestion stages will be: 0 - pristine, no digestion, 1- mostly pristine, 2 mostly digested and 3 fully digested. Indices for stomach fullness will be: 1 empty, 2 25% full, 3 50% full, 4 75% full, and 5 100% full. Prior to the sorting, enumeration and identification of prey organisms, the stomach contents will be rinsed of formalin residue over the sieve using distilled water. Identification of prey will be to the most practical taxonomic level with an emphasis on fish, crab and shrimp prey. Whole fish will have length measured to the nearest centimeter and weight determined to the nearest hundredth of a gram. The width of intact crab carapaces will also be measured to the nearest centimeter. Efforts to identify digested fish prey will be made using otoliths and other bony structures. Lipid has been found to have lighter δ- 13 C values in comparison to protein and carbohydrate (Parker 1964) and may confound interpretation of diet source data in muscle tissue. Consequently, lipid will be removed from the tissue prior to analysis. The frozen muscle samples will be dried to constant mass at 60 C and lipid extraction will then be carried out using the method introduced by Bligh and Dyer (1959). The dry, lipid-free tissue will be pulverized. An approximately 1 to 2 mg aliquot of ground, lipidfree spiny dogfish tissue will be used to determine the δ- 13 C and δ- 15 N values. Analysis will be carried out using a Europa 20/20 Continuous Flow Isotope Ratio Mass Spectrometry System (CF-IRMS). Stable isotope abundances will be measured by comparing the ratios of δ- 13 C/δ- 12 C and δ- 15 N/δ- 14 N in the sample to the international standards (Pee Dee Belemnite for carbon and atmospheric nitrogen, respectively). Results will be expressed in parts per thousand (%) deviation from the standard using the equation: δx = (Rsample/Rstandard - 1) 1000% where X is 13C or 15N and R is the isotopic ratio δ- 13 C/δ- 12 C or δ- 15 N/δ- 14 N (Peterson and Fry 1987). The mass spectrometry facility at the University of Alaska Fairbanks will perform the analysis of δ- 13 C and δ- 15 N. The major categories of prey items present in stomach contents will be described using the following indices: percentage by number (%N), percentage by weight (%W) and percentage frequency of occurrence (%O). Relative trophic position will be estimated using the equation: Trophic Position (TP)= λ + (δ-15n spiny dogfish δ-15n base)/ n where λ is the TP of the organism used to estimate δ- 15 N base, n is the enrichment in N-15 per trophic level, and δ- 15 N spiny dogfish is the direct measurement of δ-15n for spiny dogfish (Post 2002). The species to be used as an estimate for δ- 15 N base should utilize a habitat similar to that of the spiny dogfish. Additionally, effects of short-term variation should be minimized through the utilization of a base 60
69 species that will span a large enough time span so as to integrate the isotopic signature of its food web (Post 2002). A one-factor ANOVA will be used to investigate the possibility of significant dietary differences among maturity stages. This analysis will be applied to stomach content weights with the weight of each food category as a dependent variable and maturity stage (size) as treatment. A one-factor ANOVA will be used to investigate the possibility of significant diet composition differences among seasons. This analysis will be applied to stomach content weights with the weight of each food category as a dependent variable and season as treatment. A one-factor ANOVA will be used to investigate the possibility of significant trophic differences among spiny dogfish in different areas of the Gulf of Alaska. This analysis will be applied spiny dogfish specimens where mean trophic position is a dependent variable and area of the Gulf as treatment. Literature Cited Anderson, P.J., J.E. Blackburn, and B.A. Johnson Declines of forage species in the Gulf of Alaska, , as indicator of regime shift. In of Forage Fishes in Marine Ecosystems. Proceedings of the International Symposium on the Role of Forage Fishes in Marine Ecosystems. Alaska Sea Grant college Program Report No University of Alaska Fairbanks, Fairbanks, AK, pp Anderson, P.J. and J.F. Piatt Community reorganization in the Gulf of Alaska following ocean climate regime shift. Marine Ecology Progress Series 189: Atlantic States Marine Fisheries Commission (ASMFC) Interstate Fishery Management Plan for Spiny Dogfish. Fishery Management Report No. 40 of the Atlantic States Marine Fishery Commission. NOAA. Silver Spring, MD. Beamish, R.J., D.J. Noakes, G.A. McFarlane, L. Klyashtorin, V.V. Ivanov and V. Kirashov The regime concept and natural trends in the production of Pacific Salmon. Canadian Journal of Fisheries and Aquatic Sciences 56: Benson, A.J. and A.W. Trites Ecological effects of regime shifts in the Bering Sea and eastern North Pacific Ocean. Fish and Fisheries 3: Bligh, E.G. and W.J. Dyer A rapid method of total lipid extraction and purification. Canadian Journal of Biochemistry and Physiology 37: Carpenter, S. R. and J.F. Kitchell (eds) The Trophic Cascade in Lakes. Cambridge University Press. Cambridge, England, U.K. 385 p. Cavanagh, R. and S. Fowler IUCN Shark specialist Group Quadrennial Report. The World Conservation Union: Cortes, E A critical review of methods of studying fish feeding based on analysis of stomach contents: application to elasmobranch fishes. Canadian Journal of Fisheries and Aquatic Sciences 54: Standardized diet compositions and trophic levels of sharks. ICES Journal of Marine Science 56: Estrada, J. A., A.N. Rice, M.E Lutcavage, and G.B. Skomal Predicting trophic position of the northwest Atlantic Ocean using stable isotope analysis. Journal of the Marine Biological Association of the United Kingdom: France, R Stable nitrogen isotopes in fish: literature synthesis on the influence of ecotonal coupling. Estuarine Coastal and Shelf Science 41: Garrison, L Spatial and dietary overlap in the Georges Bank Groundfish Community. Canadian Journal of fisheries and Aquatic Sciences 57: Hairston, N.G., Sr., F.E. Smith, and L.B. Slobodkin Community structure, population control, and competition. American Naturalist 94: Hansson, S., J.E. Hobbie, R.Elmgren, U. Larsson, B. Fry, and S. Johansson The stable nitrogen isotope ratio as a marker of food web interactions and fish migration. Ecology 78: Hinman, K Ocean roulette: conserving swordfish, sharks and other threatened pelagic fish in longline-infested waters. Leesburg (VA): National Coalition for Marine Conservation 52 p. Hobson, K.A. and H.E. Welch Determination of trophic relationships within a high arctic marine food web using delta 13 C and delta 15 N analysis. Marine Ecology Progress Series 84:
70 Isaacs, J.D Some ideas and frustrations about fishery science. California Cooperative Fisheries Investigations Reports 28: Jensen, A.C Life History of the Spiny Dogfish. U.S. Fish and Wildlife Service. Fisheries Bulletin 65: Jones, B.C. and G.H. Green Reproduction and embryonic growth of spiny dogfish (Squalus acanthias) in the Strait of Georgia, British Columbia. Journal of the Fisheries Research Board of Canada 34: Food and feeding of spiny dogfish (Squalus acanthias) in British Columbia Waters. Journal of the Fisheries Research Board of Canada 34: Ketchen, K.S Size at maturity, fecundity and embryonic growth of the spiny dogfish (Squalus acanthias) in British Columbia Waters. Journal of Fisheries Research Board of Canada 29: Age and growth of dogfish, Squalus acanthias, in British Columbia Waters. Journal of Fisheries Research Board of Canada 32: The Spiny Dogfish (Squalus acanthias) in the Northeast Pacific and a History of its Utilization. Canadian Special Publication of Fishery and Aquatic Sciences 88: 78 p Kitchell, J.F., T.E. Essington, C.H. Boggs, D.E. Schindler, and C.J. Walters The Role of Sharks and Longline Fisheries in a Pelagic Ecosystem of the Central Pacific. Ecosystems 5: Koen Alonso, M., E.A. Crespo, N.A. Garcia, S.N. Pedraza, P.A. Mariotti, and N.J. Mora Fishery and ontogenetic driven changes in the diet of the spiny dogfish, Squalus acanthias, in Patagonian waters, Argentina. Environmental Biology of Fishes 63: Mantua, N.J., S.R. Hare, Y. Zhang, J.M. Wallace and R.C. Francis A Pacific interdecadal climate oscillation with impacts on salmon production. Bulletin of the American Meteorological Society 78: McFarlane, G.A., King, J.R. and Beamish, R.J. (2000) Have there been recent changes in climate? Ask the fish. Progress in Oceanography 47:147. McFarlane, G. A. and J.R. King Migration patterns of spiny dogfish (Squalus acanthias) in the North Pacific Ocean. Fishery Bulletin 101: McKinnell, S.M., R.D. Brodeur, K. Hanawa, A.B. Hollowed, J.J. Polovina,, and C. -I. Zhang An introduction to the beyond El Nino conference: climate variability and marine ecosystem impacts from the tropics to the Arctic. Progress in Oceanography 49: 1-6. McRuer, J.T. and T. Hurlbut The status of Spiny dogfish (Squalus acanthias, Linnaeus) in the Bay of Fundy, Scotian Shelf and Southern Gulf of St. Lawrence (NAFO Divisions 4TVWX) in Department of Fisheries and Oceans Atlantic Fisheries Research Document 96: 75. Minobe, S A year climatic oscillation over the North Pacific and North America. Geophysical Letters 24: Mueter, F.J. and B. L. Norcross Changes in species composition of the demersal fish community in nearshore waters of Kodiak Island, Alaska. Canadian Journal of Aquatic Sciences 57: Nammack, M.F. J.A. Musick, and J.A. Colvocoresses Life history of spiny dogfish off the Northeastern United States. Transactions of the American Fisheries Society 114: National Marine Fisheries Service (NMFS) Dogfish fishery management plan executive summary. Mid-Atlantic Fishery Management Council. NOAA. Silver Spring, MD. NMFS United States National Plan of Action for the Conservation and Management of Sharks. NOAA. Silver Spring, MD. NMFS Fisheries of the United States 2001 Report. NOAA. Silver Spring, MD. NMFS Pacific Coast Groundfish Fishery: Changes to Commercial Trip Limits and Area Closures New Pacific Coast Groundfish Conservation Areas. Public Notice NMFS-SEA Northeast Fisheries Science Center (NEFSC) Essential Fish Habitat Source Document: Spiny Dogfish, Squalus acanthias, Life History and Habitat Characteristics. NOAA Technical Memorandum NMFS-NE-150, Woods Hole, MA. North Pacific Fisheries Management Council (NPFMC) Ecosystem Considerations in Stock Assessment and Fishery Evaluation Report for the Groundfish Resources of the Gulf of Alaska. North Pacific Fisheries Management Council, Anchorage, AK
71 Orensanz, J.M., J. Armstrong, D. Armstrong, and R. Hilborn Crustacean resources are vulnerable to serial depletion the multifaceted decline of crab and shrimp fisheries in the greater Gulf of Alaska. Review of Fish Biology 8: Parker, P.L The biogeochemistry of the stable isotope of carbon in a marine bay. Geochimica et Cosmochimica Acta 28: Pauly, D., V. Christensen, J. Dalsgaard, R. Froese, and F. Torres, Jr Fishing Down Marine Food Webs. Science 279: Peterson, B. and B. Fry Stable isotopes in ecosystem studies. Annual Review of Ecology and Systematics 18: Pimm, S.L Food Webs. Chapman and Hall, London, UK. Post, D.M Using stable isotopes to estimate trophic position: models, methods, and assumptions. Ecology 83: Rau, G.H. A.J. Mearns, D.R. Young, R.J. Olson, H.A. Schafer, and I.R. Kaplan Animal 13 C/ 12 C correlates with trophic level in pelagic food webs. Ecology 64: Shepherd T., F. Page, and B. Macdonald Length and sex-specific associations (Squalus acanthias) between spiny dogfish in the Bay of Fundy and Scotian Shelf. Fisheries Oceanography 11(2): Soldat, V.T Biology, distribution, and abundance of the spiny dogfish in the northwest Atlantic. International Commission for the Northwest Atlantic Fisheries (ICNAF) Research Document 79, VI 102: 9 p. Steele, J.H Regime shifts in marine ecosystems. Ecological Applications (Supplement) 8: Stevens, J.D., R. Bonfil, N.K. Dulvy, and P.A. Walker The effects of fishing on sharks, rays, and chimaeras (chondrichthyans), and the implications for marine ecosystems. ICES Journal of Marine Science 57: Strong, D.R., Jr Are trophic cascades all wet: differentiation and donor control in speciose ecosystems. Ecology 73: Saunders, M.W. and G.A. McFarlane Age and length at maturity of the female spiny dogfish (Squalus acanthias) in the Strait of Georgia, British Columbia, Canada. Environmental Biology of Fishes 38: Verity, P.G. and V. Smetacek Organism life cycles, predation, and the structure of marine pelagic ecosystem. Marine Ecology Progress Series 130: Walker, T.I Can shark resources be harvested sustainably? A question revisited with a review of shark fisheries. Marine and Freshwater Resources 49: Wright, B.A. and L. Hulbert Shark abundance increases in the Gulf of Alaska. PICES May 2000 Newsletter 8: 2. 63
72 A summary of sleeper shark stomach contents collected in the Kodiak Area, Spring 2001 Kate M. Wynne School of Fisheries and Ocean Sciences, University of Alaska Marine Advisory Program, Kodiak, AK Introduction The potential causes for drastic declines in Steller sea lion numbers and their slow recovery are unknown but could involve predation by apex predators (NRC 2003). Pacific sleeper sharks (Somniosus pacificus) are among the apex predators living in Kodiak waters whose numbers have increased since the 1980 s. Their role as apex consumers in this system is of particular interest as apparent expansions in their populations appear to have coincided with declines in Steller sea lion (Eumetopias jubatus) and other marine mammal populations in the Gulf of Alaska. There is currently no estimate of the abundance of Pacific sleeper sharks in Alaskan waters. The rate at which they are caught incidentally in longline surveys for sablefish and halibut, however, suggest their relative population numbers (RPNs) increased in the 1990 s in Alaskan waters with increases in the Gulf of Alaska were focused in Shelikof Trough (Courtney and Sigler, unpubl. data, NMFS Auke Bay Lab). The diet and tropho-dynamic role of Pacific sleeper sharks in the Gulf of Alaska remain poorly understood. Early interest in the potential role of these sharks as apex predators was generated by the discovery of harbor seal and/or cetacean (harbor porpoise and unknown whale) remains in five of thirty sleeper shark stomachs examined in Prince William Sound (L. Hulbert, NMFS, pers. comm.) and one of three sleeper sharks taken as bycatch from Portlock Banks in 2000 (K. Wynne, unpubl data). Marine mammal remains were recovered from 25 sleeper shark stomachs collected in the Gulf of Alaska in August 2001 and May 2002; 21 contained cetacean remains and the other four were unidentified (Hulbert, Sigler and Lansford, unpubl. data, NMFS Auke Bay Lab). The majority (64%) of these remains was determined to have been scavenged and others were too decomposed for analysis; there was no clear evidence that the sharks actively preyed upon the mammals. No confirmed Steller sea lion remains were recovered (Hulbert, Sigler and Lansford, unpubl. data, NMFS Auke Bay Lab). Even if not posing a direct predatory threat to Steller sea lion populations, increasing shark populations can potentially compete with Steller sea lions if their diets overlap and prey is limited. Salmon sharks and sleeper sharks are also known to consume prey that are prominent in the diet of Steller sea lions including salmon, walleye pollock, cephalopods, arrowtooth flounder, and other finfish (Bright 1959,Yang and Page1998). Examining the diets of these sharks can provide insight into the degree of dietary overlap and potential for competitive interactions with Steller sea lions in the Gulf of Alaska. Sharks are species of interest to the University of Alaska s Gulf Apex Predator-prey study (GAP) because they have the potential to be both a Steller sea lion consumer and competitor in the Gulf of Alaska. In 2001, a pilot study was conducted as part of GAP to 1) determine the feasibility of developing an opportunistic shark sampling program, 2) identify dominant prey species in the stomachs of sharks collected in the Kodiak area, and 3) document evidence of consumption of Steller sea lions. This report summarizes efforts in 2001 to assess the diet of sleeper and salmon sharks in Kodiak waters, with collections authorized under Fish Resource Collection Permit number CF from the Alaska Department of Fish and Game. 64
73 Methods A variety of sharks are caught incidental to Alaskan commercial fisheries but are rarely retained because of their limited marketability. In pilot this study, a small group of fishermen in Kodiak were contacted during one week in Spring 2001 and asked to voluntarily retain for scientific purposes a sample of sharks taken incidentally while trawling for walleye pollock. They were specifically asked to release any live sharks from gear but to retain no more than five sleeper sharks and five salmon sharks from each fishing trip that were recovered dead from fishing gear and return them to Kodiak intact for examination. Some skippers elected to extract the stomachs from sharks while at sea. Upon their return to port, these fishermen notified K. Wynne who met the boats and sampled retained sharks at the dock. Intact sharks were identified, sexed, and measured (standard fork length). The approximate location of each shark capture was recorded as the latitude/longitude of specific trawls or generic area fished during the trip, as reported by skippers. Stomachs were extracted from intact sharks and their contents removed for examination either on deck or subsequently in the Kodiak Fisheries Research Center lab. Stomachs extracted by fishermen at sea were bagged and frozen separately. Prey remains were extracted from stomachs, identified to the lowest possible taxon, and the length of undigested remains was measured of to the nearest centimeter. Fish otoliths and cephalopod beaks were retained to allow subsequent species identification of partially digested prey. In addition, samples of cartilage, muscle, and liver were collected from sharks to allow assessment of ratios of stable carbon and nitrogen isotopes (δ 13 C, δ 15 N) as an indicator of the trophic level at which the sharks were foraging (Hirons 2001, Hobson and Welch 1992). Results Sharks sampled in this project were taken incidentally in commercial pollock trawls within 30 miles of Kodiak Island and delivered to processors in Kodiak. Four vessels retained a total of 22 sleeper sharks and three salmon sharks for examination between March and early April 2001 (Table 1). All were collected from Shelikof Strait, off the south or southwest end of Kodiak Island in water approximately fathoms deep. Further sampling in other fishing seasons was limited by weather and/or time constraints. Three salmon sharks were examined, all males that ranged in length from cm (mean 217cm, SD 7.57). Each contained only traces of prey including fish (capelin, eulachon) and/or cephalopods. Of the 22 sleeper shark stomachs examined, 10 (40%) were from males, five (20%) were from females, and the origin of seven (40%) was not determined. The fork length of these sleeper sharks ranged from cm (mean 248.7cm, SD 48.72). Prey remains were found in all but one stomach examined and included walleye pollock, eulachon, arrowtooth flounder, octopus, and squid. Mammalian prey remains were found in only one shark stomach examined, a 348cm female sleeper shark. This stomach contained approximately 10 kg of partially digested whale tissue in chunks that weighed approximately 1-2 kg each and were the diameter of the shark s jaws. Because of the number of chunks and their uniform state of digestion, they most likely represent scavenged chunks from a single whale carcass, possibly a gray whale (Eschrichtius robustus). Literature Cited Bright, D.B The occurrence and food of the sleeper shark, Somniosus pacificus, in a central Alaska bay. Copea 1959 (1):76-77 Hirons, A.C Trophic dynamics of pinniped populations in Alaska using stable carbon and nitrogen isotope ratios. PhD Thesis, University of Alaska, Fairbanks, 143pp. Hobson, KA. and H.E. Welch Determination of trophic relationships within a high arctic marine food web using δ 13 C and δ 15 N analysis. Mar. Ecol. Progr. Ser. 84:9-18. National Research Council (NRC) Decline of the Steller sea lion in Alaskan waters: untangling food webs and fishing nets. The National Academies Press, Washington D.C. 65
74 Yang, M-S. and B.N. Page Diet of Pacific sleeper shark, Somniosus pacificus, in the Gulf of Alaska. Fish. Bull. 97:
75 Table 1. Summary of sharks taken as bycatch, landed in Kodiak, and sampled in 2001 under provisions of ADFG Fish Resource Permit No. CF issued to K. Wynne, UAF. Date Species Collected Sleeper Sharks Specimen Number Sex Length (cm) Approximate Capture Location 03/27/ SLSH01 F 348 mid-lower Shelikof 03/27/ SLSH02 M 292 mid-lower Shelikof 03/27/ SLSH03 M 226 mid-lower Shelikof 03/27/ SLSH04 M 147 mid-lower Shelikof 03/27/ SLSH05 M 225 mid-lower Shelikof 03/27/ SLSH06 M 208 mid-lower Shelikof 03/27/ SLSH07 M 280 mid-lower Shelikof 03/27/ SLSH08 F 233 mid-lower Shelikof 03/27/ SLSH09 U 279 mid-lower Shelikof 03/28/ SLSH01 M 159 Shelikof Strait 03/28/ SLSH02 M 257 Shelikof Strait 03/29/ SLSH01 U 320 Shelikof Strait 03/29/ SLSH02 U 236 Shelikof Strait 03/29/ SLSH03 U ' ' Shelikof Strait 03/30/ SLSH01 F /30/ SLSH02 M 284 Shelikof Strait 03/31/ SLSH01 U /31/ SLSH02 U /31/ SLSH03 U /02/ SLSH01 F 225 Shelikof Strait 04/02/ SLSH02 F 282 Shelikof Strait 04/02/ SLSH03 M 277 Shelikof Strait Salmon Sharks 03/28/ SaSH01 M 207 east Shelikof 04/02/ SaSH01 M 193 east Shelikof 04/02/ SaSH02 M 205 east Shelikof 67
76 Table 2. Prey recovered from 22 sleeper shark stomachs taken as bycatch in Shelikof Strait in March and April Walleye Arrowtooth Squid or Pollock Eulachon Flounder Octopus %FOC in 22 stomachs 90.9% 59.1% 50.0% 36.4% Number recovered total beaks + min cm octo max cm squid mean whole StdDev Length (cm) min max mean StdDev
77 B. PISCIVOROUS MAMMALS Pinnipeds Harbor seals and Steller sea lions are sympatric pinnipeds that are known to prey on similar fish species and rest on haulouts within 1-5km of each other near Kodiak. Seal numbers have been declining in this area since 1993 while Steller sea lion numbers have continued to decline. In GAP we collected samples needed to document the seasonal prey use and foraging patterns of both pinniped species within Steller sea lion Critical Habitat in Kodiak waters. With these data we can address the potential for competition between harbor seals, Steller sea lions, or other upper level consumers that coexist and share prey resources within Kodiak s coastal waters. Overall objectives were to determine prey species consumed by Steller sea lions in the Kodiak region (relative size, diversity, frequency of occurrence, seasonal patterns, inter-annual variability) compare diets of Kodiak Steller sea lions to diets of sympatric piscivores and Steller sea lions in southeast Alaska monitor the seasonal distribution of Steller sea lions on designated critical haulouts in the Kodiak area determine habitat use and prey species consumed by harbor seals compare diets and habitat use by Kodiak harbor seals to those of Steller sea lions and other sympatric piscivores in the Kodiak area Piscivorous whales Humpback (Megaptera novaeangliae) and fin (Baleanoptera physalus) whales are known to be significant consumers in many marine ecosystems that may consume large zooplankton and schooling fish. As such, they have the potential to either compete with Steller sea lions directly when consuming forage fish species or indirectly by consuming zooplankton upon which Steller sea lion prey species feed. We assessed the seasonal abundance, foraging ecology, and habitat use of humpback and fin whales in Kodiak waters as a means of assessing their role as apex predators, degree of prey overlap, and potential for competition with Steller sea lions. Overall objectives were to assess the seasonal abundance and diet of humpback whales in Kodiak waters as a means of assessing their role as apex predators, degree of prey overlap and potential for competition with Steller sea lions calculate current consumption rates based on seasonal abundance, energy requirements, and feeding rates characterize habitats used by piscivorous whales in Kodiak waters 69
78 Preliminary assessment of the diet of Steller sea lions in the Kodiak area, Kate M. Wynne University of Alaska Fairbanks School of Fisheries and Ocean Sciences, Marine Advisory Program, Kodiak, AK Introduction Documenting the diet of Steller sea lions is fundamental to testing the prey limitation hypothesis, assessing the potential for competition between Steller sea lions and commercial fisheries, and determining the seasonal and regional overlap with other consumers of common prey resources. Despite acknowledged limitations and biases (Olesiuk, et al. 1990, Gales and Cheal 1992, Orr and Harvey 2001, Tollitt et al 2003), fecal samples (scats) represent a reasonable index of prey field sampled by foraging sea lions (Merrick, et al. 1997). Identifiable hard parts (bones, eye lenses, teeth, cartilaginous parts, otoliths, cephalopod beaks, and scales) in the scats of piscivorous mammals can be collected and identified by comparison to reference collections (Cottrell, et al. 1996). Prior to the 1990 s, Steller sea lion diets were assessed by examining stomach contents; only 389 stomachs collected throughout western Alaska were examined over a 40+ year period, (Mathiesen et al 1962, Thorsteinson and Lensink 1962, Pitcher 1981, Lowry et al. 1982). Since 1990, researchers have collected and examined fecal samples to assess the relative importance of prey to Alaskan Steller sea lions. From , a sample of 338 scats was collected opportunistically in summer months on multiple sites in the Aleutian Islands and the central Gulf of Alaska (Merrick et al 1997). Sinclair and Zeppelin (2002) summarized the contents of over 3700 scats collected opportunistically from 1990 to 1998 throughout western Alaska. Individual site-specific collections were small; samples were grouped into two seasons and four regions to assess seasonal and regional patterns of prey use. A more concerted effort to collect and analyze scat contents since 1999 has improved our understanding of temporal and regional patterns of prey use by Steller sea lions (Wynne et al 2003, Womble and Sigler 2004, Waite and Burkanov 2004). It has been hypothesized that the catastrophic decline of the western stock of Steller sea lions through the 1980 s and 1990 s was due, at least in part, to prey limitations (NRC 2003). As a result, focused have been managed to reduce the potential for humans to compete with Steller sea lions for fish that have been identified as important components of their diet. In addition, the degree of Steller sea lion diet diversity has been inversely correlated to rates of population decline (Merrick et al 1997). If so, we would expect decreased diet diversity in Kodiak (where declines continue from (Sease and Gudmundson 2002, Fritz pers. comm.) than in areas where Steller sea lion numbers are stable or increasing. We would also expect decadal differences as population trends changed. Sinclair and Zeppelin (2002) noted differences in prey use between summer and winter collections which they attributed to changes in availability of prey in these dichotomous season categories. For these reasons, it is important to understand what prey species are important to Steller sea lions, consider regional and seasonal differences in prey use, and to monitor observed changes over time. Scats were used in this study to monitor the diet diversity and the seasonal and regional importance of prey species to Steller sea lions in the Kodiak region. Specifically, fecal samples were collected on a seasonal basis to a) assess the species, relative diversity, and frequency of occurrence of prey in the diets of Kodiak Steller sea lions, b) compare seasonal prey use to prey availability determined in GAP prey surveys, c) compare seasonal diets of Kodiak Steller sea lions to those diets of sympatric piscivores and Steller sea lions found southeast Alaska and elsewhere, and d) monitor long-term trends in sea lion diets. This report summarizes preliminary analyses of scats processed through 2004 using a subset of samples collected during GAP s seasons and prior collections ( ) in the same area (Wynne et al 2003). 70
79 Methods Fecal samples (scats) were collected approximately monthly from Steller sea lion haulouts to monitor the seasonal and regional importance of prey species to Steller sea lions throughout the Kodiak region. Collections were more sporadic in 2003 and 2004 due to funding and permit issues. Scats were bagged separately and subsequently rinsed to recover identifiable hard parts (eye lenses, otoliths, vertebrae, cephalopod beaks, and scales) that pass through the digestive tract. These dried remains were sent to Pacific Identifications, Inc (Victoria, BC) for identification to lowest possible taxon and characterization of prey size class. The species, number, and relative size of prey (when possible) contained in each scat were reported. Sample processing and scat content analysis are ongoing. A more comprehensive analysis of the prey identified within scats collected from Kodiak haulouts will be presented following completion of scat content analyses by Pacific Identifications, Inc. The relative importance of each prey item was assessed by comparing the frequency at which it occurred in fecal samples. This simple frequency of occurrence (FOC) of identified prey species was calculated for each haulout per collection by determining the percent of scats in which a given prey item was detected (Olesiuk et al. 1990). Some researchers have considered that any prey species found in greater than 5% of scats sampled is of dietary importance to Steller sea lions (Merrick et al 1997, Sinclair and Zeppelin 2002). A higher standard was used in this study: prey items that occurred in >10 % of scats containing identifiable prey were considered important in Steller sea lion diets. Assessing spatial patterns of prey use requires that regions be defined by reasonable boundaries (natural or contrived). Telemetry studies conducted by NMFS (NMML unpubl data) have shown that tagged individual Steller sea lions may make extended coastal transits to use haulouts throughout the Kodiak Archipelago (NMML unpubl data). Following their move to another haulout, however, these central place foragers tend to forage within 0-20m of the site (NMML, unpubl data). It is therefore reasonable to assume that scats deposited on eastern Kodiak haulouts would not likely represent prey consumed by Steller sea lion foraging greater than 20nm from a haulout. In these analyses, sites considered to represent North Kodiak haulouts (Latax Rks, Sea Otter I, and Marmot I) are located greater than 20nm from the nearest of the East Kodiak haulouts (Long Is, C. Chiniak, Ugak I) or West Kodiak haulout (C. Ugat) (Fig. 1). Seasonal patterns of prey use were assessed by grouping results from samples collected during four seasons: winter= December through March, spring= April and May, summer= June through September, and fall= October and November. Months within these seasons share similar oceanographic and environmental patterns with potential biological significance to prey of Steller sea lions. In addition, these seasons may loosely correspond to assumed changes in the energetic demands on Steller sea lions associated with reproduction, lactation, and weaning. An index of dietary richness was developed by tallying the number of scats within each sample from each site that contained n identifiable prey species. The size of most prey species consumed was estimated at the time scat contents were identified; these data will be analyzed following completion of scat analyses. Results A total of 2,232 scats were collected from ten Steller sea lion haulouts during GAP s sampling in the Kodiak Archipelago (Fig. 1). An additional 944 scats collected from the area from were included in the following analyses to bolster sample sizes and allow longer temporal assessments (Table 1). Of those collected, only 1168 had been analyzed at the time of this report and 37 of those were empty. Therefore, this report summarizes preliminary analyses of dietary patterns observed in the processed subset of 1,131 scats collected in the Kodiak area from that contained identifiable prey remains (Table 2). Scats collected on Latax Rks, Sea Otter I, and Marmot I are considered to represent North Kodiak haulouts; those collected on Long Is, C. Chiniak, Ugak I are grouped as East Kodiak haulouts. Scats could be collected on only one West Kodiak haulout, Cape Ugat. 71
80 Nine prey species (or families) were found in greater than 10% of the scats containing identifiable remains (% frequency of occurrence, FOC) in preliminary analyses (Fig. 2). The five most frequently occurring prey species each occurred in greater than 25% of scats containing identifiable remains: Pacific sandlance 1 (sandl: 42.0 FOC), arrowtooth flounder 2 (arrfl: 37.0 FOC), walleye pollock 3 (polck: 30.1 FOC), Pacific cod 4 (p.cod 29.2 FOC), and salmon spp. (salmn, 28.5 FOC) (Fig.2). Pacific herring 5 (herng), capelin 6 (capln), and Irish Lord spp 7 (IrLrd) were found in close to 15% of scats and sole spp 8. in 10% of scats with identifiable remains (Fig. 2). Hexagrammids (hexgr), represented primarily by greenling spp., were found in >5% of scats examined and would therefore have qualified as a tenth significant prey item using standards used in other studies. Only 37 of 1168 (3.7%) scats analyzed to date contained no identifiable remains and were classified as Empty. More Empty scats were collected on North Kodiak sites than others (Fig. 3). Cephalopods (primarily octopus spp) and rockfish spp were found in >5% of some seasonal samples (Fig. 4) but were not found to be significant prey overall. The spatial, temporal, and overall patterns of diversity in prey use in this area will be analyzed in more detail once identification of prey items in remaining samples is complete. 1 Pacific sandlance (Ammodytes hexapterus) 2 Arrowtooth flounder (Atheresthes stomias) 3 Walleye pollock (Theragra chalcogramma) 4 Pacific cod (Gadus macrocephalus) 5 Pacific herring (Clupea pallasii) 6 Capelin (Mallotus villosus) 7 Irish Lord spp (Hemilepidotus spp) 8 Soles (Pleuronectes spp.) Scats analyzed to date suggest Steller sea lions on Kodiak haulouts have a rich diet, i.e. each scat commonly included remains from multiple prey species (Fig. 3). Scats containing a single identifiable prey species were found in only 20.9, 26.5, and 30.4% of scats analyzed from West, North, and West haulouts, respectively. More than half (53.7%) of scats contained three or more identifiable prey species and more than one-third (35.6%) contained more than four different prey species (Fig. 3). Several seasonal patterns in use of dominant prey species were found in preliminary analyses of scats sampled throughout the Kodiak Archipelago (Fig. 4). Sandlance, arrowtooth flounder, pollock, and Pacific cod were among dominant prey species in scats collected from October to May. In winter, the relative importance of Irish lords and sole spp peaked while that of capelin and salmon was lowest (Fig. 4). In the relatively small spring sample, the FOC of herring was exceeded only by that of sandlance and arrowtooth flounder. Summer scat samples were dominated by capelin and to a lesser degree by arrowtooth flounder and salmon. Use of salmon peaked in October and November, although a broad suite of prey was recovered from fall scat collections (Fig. 4). Within this sample, seasonal patterns in diet composition were further examined to identify associated spatial patterns of prey use within the Kodiak Archipelago (Fig. 5). In Oct-Nov, Steller sea lions on northern and eastern haulouts used a diversity of prey and dominance was shared by five species. Pollock occurred more frequently in scats from eastern sites and salmon, sandlance, and arrowtooth flounder from northern sites (Fig. 5). During winter months (Dec-Mar), scat samples from C. Ugat suggest herring, pollock, and sandlance are seasonally important to Steller sea lions on the Shelikof Strait. Shifts in the relative dietary importance of individual prey between sites seen in preliminary analyses could reflect spatial and temporal changes in prey distribution or foraging patterns of Steller sea lions. Sandlance was found to be a key prey item throughout the Kodiak Archipelago but its relative importance decreased in summer samples (Fig 5). Herring and capelin were among the seasonally dominant prey in scats from North and West sites but were rarely found in East Kodiak scat samples (Fig. 5). Arrowtooth flounder were among the dominant prey recovered from April through November scats collected on East and North sites but were of lesser importance to animals using the West Kodiak haulout. Pollock was consistently important in all seasons on East Kodiak sites and of varying seasonal importance in other areas. Salmon spp were among dominant prey items in all seasons except winter (Fig. 5). A minor use of hexagrammids (primarily greenling spp) was evidenced primarily in fall and winter scats. Cephalopods and rockfish were rarely found in scats sampled to date (Fig. 5) 72
81 Discussion This report summarizes preliminary analysis of approximately one half of the scats collected between1999 and 2004 in the Kodiak Archipelago. Further analyses and final interpretation of results will follow complete processing of remaining scat samples. Sampling throughout the year on multiple sites in the Kodiak Archipelago has allowed monitoring of seasonal and regional patterns of prey use. Preliminary analyses indicate that Kodiak s Steller sea lions are currently preying on a diverse diet that varies both seasonally and regionally. Nine prey species were found to be important (in >10% of scats) including species of forage fish (sandlance, herring, capelin), flatfish (arrowtooth flounder, soles), groundfish (pollock, Pacific cod), and demersals (Irish lords). Of these, sandlance, arrowtooth flounder, walleye pollock, Pacific cod were dominant and found in greater than 28% of scats examined, with species-specific regional and seasonal shifts in relative importance. Many of these prey species have been found in Steller sea lion scats examined elsewhere, including walleye pollock, sandlance, arrowtooth flounder, Irish lords, herring, and salmon. The number and diversity of dominant prey species in the GAP sample analyzed to date, however, far exceed those previously reported and with far fewer empty scats (i.e. no identifiable remains) than those collected in the central Gulf of Alaska from (Sinclair and Zeppelin 2002). Whether differences are due to differences in sampling intensity or decadal patterns of prey use will be difficult to assess. The number and diversity of dominant prey species in the GAP sample analyzed to date, however, far exceed those previously reported and with far fewer empty scats (i.e. no identifiable remains) than those collected in the central Gulf of Alaska from (Sinclair and Zeppelin 2002). Several important (>5% FOC) prey species consumed by Steller sea lions in southeast Alaska in the 1990 s were also found to be important in our preliminary analyses reported here. Trites et al (2003) found pollock, herring, sandlance, salmon, arrowtooth flounder, rockfish, skates, squid, and octopus to be important components of Steller sea lion diets in southeast Alaska. Although more thorough comparisons are forthcoming, preliminary results suggest that sea lion scats in southeast Alaska contained a less diverse suite of prey that included more rockfish, skates, and cephalopods than sea lions sampled in this study. The overall, spatial, and temporal patterns of diversity in prey use in this area will be analyzed in more detail once identification of prey items in remaining samples is complete. Conclusions Long-term seasonal sampling of Steller sea lion scats in the Kodiak Archipelago has provided a means of identifying important prey and tracking it use spatially and temporally in an area of continuing Steller sea lion decline. Determining the prey species of seasonal importance to Steller sea lions is fundamental to assessing potential prey limitations or competition between Steller sea lions and commercial fisheries. Following completion of all scat analyses, these data will be compared to the seasonal distribution, abundance, and energetic content of key prey species found in GAP prey surveys within the same geographic range and time frame. Spatial and decadal differences between this and other Steller sea lion diet studies will be examined in greater depth upon completion analysis of all scat samples collected. In addition, these data will be combined with other GAP datasets to examine correlations between the seasonal distribution and diet of Steller sea lions to that of their key prey species and potential competitors within the Kodiak Region. Literature Cited Cottrell, P.E., A.W. Trites, and E.H. Miller Assessing the use of hard parts in faeces to identify harbour seal prey: results of captive-feeding trials. Can. J. Zool. 74: Gales, N.J. and A.J. Cheal Estimating diet composition of the Australian sea lion (neophoca cinerea) from scat analysis: an unreliable technique. Wildl. Res: 19:
82 Lowry L.F., K.J. Frost, D.G. Calkins, G.L. Swartzman, and S. Hills Feeding habits, food requirements, and status of Bering Sea marine mammals. North Pacific Fisheries Man. Council Doc 19, 19A. 574pp Mathiesen, O.A, R.T. Baade, and R.J. Lopp Breeding habits, growth, and stomach contents of the Steller sea lion in Alaska. J. Mammal. 43(4): Merrick, R.L., T.R. Loughlin, and D.G. Calkins Diet diversity of Steller sea lions and their population decline in Alaska: a potential relationship. Can. J. Fish. Aquat. Sci. 54: Olesiuk, P.F., M.A. Bigg, G.M. Ellis, S.J. Crockford, and R.J. Wigen An assessment of the feeding habits of harbour seals (Phoca vitulina) in the Strait of Georgia, British Columbia, based on scat analysis. Can. Tech. Rep. Fish. Aquat. Sci. No Orr, A.J. and J.T. Harvey Quantifying errors associtated with using fecal samples to determine the diet of the California sea lion (Zalophus californianus). Can. J. Zool 79: Pitcher, K.W Prey of the Steller sea lion, Eumetopias jubatus, in the Gulf of Alaska. Fish. Bull. 79: Sease, J.L.and C.J.Gudmundson.2002.Aerial and land-based surveys of Steller sea lions (Eumetopias jubatus) from the western stock in Alaska, June and July 2001 and NOAA Tech Memo NMFS- AFSC-131. Sinclair, E.H. and T.K. Zeppelin Seasonal and spatial differences in diet in the western stock of Steller sea lions (Eumetopias jubatus). J. Mammal 83(4): Thorsteinson, F.V. and C.J. Lensink Biological observations of Steller sea lions taken during an experimental harvest. J. Wilil. Manage. 26: Tollitt, D.J., M. Wong, A.J. Winship, D.A.S. Rosen, and A.W. Trites Quantifying errors associtated with using prey skeletal structures from fecal samples to determine the diet of Steller sea lions. Mar. Mammal. Sci 19(4): Trites, A.W., D.G. Calkins, and A.J. Winship Diets of Steller sea lions in southeast Alaska. Abstract in symposium proceedings: Marine Science of the Northeast Pacific: Science for Resource-dependent communities. Anchorage AK January Waite, J.N. and V. N. Burkanov Steller sea lion (Eumetopias jubatas) feeding habits in the Russian Far East. Abstract: Proceedings: Sea lions of the world: conservation and research in the 21 st century. 22 nd Wakefield Symposium, 30 Sept 3 October, 2004, Anchorage AK Womble, J.N. and M.F.Sigler Importance of seasonally available prey for Steller sea lion at Benjamin island, southeastern Alaska. Abstract: Proceedings: Sea lions of the world: conservation and research in the 21 st century. 22 nd Wakefield Symposium, 30 Sept 3 October, 2004, Anchorage AK Wynne, K.M., R.J. Foy, B. L. Norcross, C. L. Buck, and S. Hills Availability and use of prey by Steller sea lions in the eastern Kodiak area, Final Rept. to the North Pacific Marine Research Program, School of Fisheries and Ocean Sciences, Univ. of Alaska Fairbanks, 23 pp 74
83 Table 1. Summary of Steller sea lion scat samples collected on haulout sites in the Kodiak Archipelago during GAP ( ) and NPMR ( ) studies. Collection Site Total LI: Long I CH: C. Chiniak UG: Ugak I CB: C.Barnabas TH: Two-headed I CU: C. Ugat LA: Latax Rks SO: Sea Otter I SL: Sea Lion Rk MA: Marmot I Table 2. Subset of scat samples containing identifiable prey remains used in this preliminary analysis of Steller sea lion prey use in the Kodiak region, mo / yr West North East Collected CU SO LA MA LI CH UG Sep Nov Dec Jan Feb Mar Apr May Jun Jul Aug Sep Oct Dec Mar Jun 2001 Jul Oct Nov Jan Nov Aug Sep
84 156 30'0"W 156 0'0"W '0"W 155 0'0"W '0"W 154 0'0"W '0"W 153 0'0"W '0"W 152 0'0"W '0"W 151 0'0"W '0"W 150 0'0"W 58 30'0"N Alaska Mainland! LA! SO!( 58 30'0"N! MA 58 0'0"N 57 30'0"N 57 0'0"N ") CU ") ") Kodiak Island #* # #* #* [ # LI # # UG CH Alaska 58 0'0"N 57 30'0"N 56 30'0"N 57 0'0"N 56 30'0"N Kilometers '0"W 156 0'0"W '0"W 155 0'0"W '0"W 154 0'0"W '0"W 153 0'0"W '0"W 152 0'0"W '0"W 151 0'0"W '0"W 150 0'0"W Figure 1. Steller sea lion haulouts of north ( ), east ( ), and west ( ) regions of the Kodiak Archipelago. Filled shapes denote scat collection sites included in this preliminary assessment of regional diet patterns FOC by species, all samples combined Freq of Occurrence sandl arrfl polck p.cod salmn herng capln IrLrd soles hexgr halbt ceph rockf Figure 2. Frequency of occurrence of 13 prey items in a sample of 1131 scats collected on Kodiak Archipelago haulouts, See text for prey name abbreviations. 76
85 160 Number of scats containing n identifiable prey species North (n=653) West (n= 110) East (n=313) Number of scats n (number of identifiable prey species) Figure 3. Number of scats containing 0-16 identifiable prey species from a subset of samples collected on Kodiak Steller sea lion haulouts, North= LA, SO, MA; East= LI, CH, UG; West= CU FOC of Prey by Season Oct-Nov (n=304) June-Sep (n=264) Apr-May (n=70) Dec-Mar (n=493) cumulative FOC sandl arrfl polck p.cod salmn herng capln IrLrd soles hexgr halbt ceph rockf Figure 4. Cumulative and seasonal frequency of occurrence (FOC) of prey species in a sample of 1131 Steller sea lion scats collected in the Kodiak area, See text for prey abbreviations. 77
86 Cumulative % FOC Dec-Mar West (n=73) East (n=246) North (n=174) 0 sandl arrfl polck p.cod salmn herng capln IrLrd soles hexgr ceph halbt rockf cumulative FOC Apr-May West (n=2) East (n=26) North (n=42) 0 sandl arrfl polck p.cod salmn herng capln IrLrd soles hexgr ceph halbt rockf Cumulative FOC Jun-Sep West (n=32) East (n=20) North (n=216) 20 0 sandl arrfl polck p.cod salmn herng capln IrLrd soles hexgr ceph halbt rockf Oct - Nov East (n=93) North (n= 211) sandl arrfl polck p.cod salmn herng capln IrLrd soles hexgr ceph halbt rockf Figure 5. Comparative seasonal importance of prey species identified in 1131 scats collected on Kodiak Steller sea lion haulouts, North= LA, SO, MA; East= LI, CH, UG; West= CU. 78
87 Aerial monitoring of terrestrial habitat use by Steller sea lions in the Kodiak Archipelago, Kate M. Wynne School of Fisheries and Ocean Sciences, University of Alaska Marine Advisory Program, Kodiak, AK Introduction Steller sea lions are amphibious, foraging at sea but congregating onshore on terrestrial sites between feeding bouts at sea to give birth, breed, rest, and nurse their pups. Haulouts are sites used by groups of sea lions for resting; sites used specifically for pup rearing and breeding activities by this polygynous species are called rookeries. Sites used as rookeries during the breeding season may be used as haulouts at other times of the year. The number of individuals that haul out on terrestrial sites and the amount of time they spend ashore varies daily and seasonally in response to temporal variables (time of day and season) weather, energetic demands on individuals, and disturbance among other factors ( Gentry 1970, Calkins and Pitcher 1982, Withrow 1982, Milette 1999, Gisiner 1985, Loughlin et al 2003). Rookeries and most haulouts appear to be traditional sites, with historic use by groups of Steller sea lions being documented for decades (Fiscus et al. 1976). Individual Steller sea lions may use many different haulout sites (NMML unpubl telemetry data) but have been found to exhibit a large degree of site fidelity in their use of rookeries. The majority (67%) of twelve females branded in western Alaska rookeries returned as adults to their natal rookery to breed (Raum-Suryan et al. (2002). Some haulouts are used year-round while others are used only seasonally in response to predictable patterns of prey availability (Womble, et al 2003, Sinclair and Zeppelin 2002). Most traditional haulouts are located on exposed headlands with easy access to waters where bathymetric and oceanographic features support altered. New or transitory haulouts may develop as Steller sea lions find suitable resting sites while opportunistically exploiting a new or sporadic prey source. When precipitous declines led to the listing of Steller sea lions as threatened under the Endangered Species Act, their Critical Habitat was defined to include major rookeries and their surrounding waters (within a 20nm). In their 1998 Biological Opinion, the National Marine Fisheries Service (NMFS 1998) further defined major seasonal and year-round haulouts within Critical Habitat based on point estimates from counts of Steller sea lions observed on sites from 1976 to Since then, these designated major haulouts and rookeries have formed the basis for fishing area-closures intended to limit the potential for commercial fishermen to locally deplete Steller sea lion prey resources. NMFS researchers have counted Steller sea lions on Kodiak area haulouts during sporadic and systematic aerial surveys since 1976 (Loughlin et al 1984). These were developed into systematic biennial aerial surveys of sites from Kenai to Kiska (including Kodiak sites) to monitor the population trend of Steller sea lions in western Alaska (Loughlin et al 1992). Scheduled during June, these surveys have generated point estimates of non-pup Steller sea lion numbers during the breeding season (Sease and Merrick?). Since 2002, use of medium format photography has enabled researchers to more accurately detect and count pups during June surveys (Sease and Gudmundson 2002, Fritz et al. unpubl data). Biennial June surveys conducted in 2000, 2002, and 2004 showed an abatement of the Steller sea lion decline throughout much of the western stock s range (NMML, unpub data). The exception is the central Gulf of Alaska where counts continued to decline 12.5% from and 7.4% (Fritz, unpubl data ). Steller sea lion sites within the Kodiak Archipelago are located in the center of this area of continued declining counts. Therefore, long-term year-round monitoring of Steller sea lion counts on terrestrial sites in this area may help identify specific areas of continued decline on which to focus future research efforts. The Kodiak area is also exposed to a variety of human activities that have the potential to directly or indirectly impact Steller sea lions including oil drilling and transport, rocket launches, commercial fishing, tourism, and shipping. For this reason, monitoring Steller sea lion use of 79
88 terrestrial sites on a fine temporal scale can help managers as they assess and attempt to mitigate the spatial and temporal vulnerability of Steller sea lions to anthropogenic threats. Finally, Steller sea lions are among Kodiak s numerous piscivorous consumers. Monitoring temporal and spatial trends in their abundance and distribution in this area is critical to GAP s ongoing assessment and future modeling of tropho-dynamic interactions in the Kodiak region. This paper summarizes results of monthly aerial surveys of Steller sea lion haulouts in the Kodiak Archipelago. The objectives were to 1) monitor the number of sea lions using Kodiak area haulouts over time and 2) identify seasonal and annual trends in Steller sea lion use of terrestrial habitat in the Kodiak Archipelago. Methods Counts made from fixed-wing aircraft were used to monitor the seasonal use by Steller sea lions of twelve designated critical haulouts in the Kodiak Archipelago (Fig. 1). All sites surveyed were designated by NMFS to be significant sites (NMFS 1998): 10 year-round, one summer-only (Ugak I), and one winter-only site (Long I) (Table 1). When possible, surveys were conducted in the first week of each month but weather delays and charter conflicts prevented rigorous flight scheduling and completion. Surveys were not initiated unless weather conditions favored their likely completion. Surveys were flown in a Cessna C206 or comparable over-wing aircraft following standard NMML survey methodology regarding timing, equipment, speed, and altitude (Loughlin et al 1992). All sea lions present were photographed (35mm, oblique angle) for subsequent counting off images and a visual estimate was recorded at each site. Pups were included in total counts. Sea lions swimming within 2-3 body lengths of a site were counted as using the site. The specific area on the haulout being occupied (microhabitat) by sea lions was noted. No effort was made to estimate the percent of sea lions at sea (not hauled out) during surveys or to calculate abundance estimates from counts made. These repetitive counts were used to monitor trends in the distribution and relative use of Kodiak sites by Steller sea lions; results are compared by month and year. In addition, these surveys were used to identify feasible sites for subsequent scat collection (Wynne, this volume). Resulting land-based observations made on those haulouts were used to verify the age/sex composition of Steller sea lion using the site and to record presence of branded individuals. Results A total of 47 monthly surveys were made between 25 September 1999 and 9 October 2003 to visually and photographically count Steller sea lions in the Kodiak Archipelago (Table 2). Local weather conditions prevented the aircraft s safe approach (wind sheer) or observation of sea lions (fog or snow) at one or more sites on eight of the surveys attempted. Total counts on haulouts during the 39 surveys completed between 25 September 1999 to 10 October 2003 ranged from 727 to 2544, with a mean of 1688 (+/- 460) sea lions counted. A general negative annual trend in overall numbers throughout the study area was seen over the four survey years (Fig. 2). Negative trends in site-specific monthly counts were most notable on the three northernmost haulouts and the summer-only haulout on Ugak I (Figs. 3, 4). Slight declines were noted on the two haulouts within GAP s LiCh prey survey area (Fig. 4, Long I and C. Chiniak). Counts on other sites showed stable or modest increasing trends (Figs. 3, 4, 5). Two new sites (not previously identified as major haulouts) were added to the survey route as their consistent use was detected during surveys (Fig. 6). Although counts on these sites were not included in the study area trend assessment totals, it is apparent their inclusion would soften the declining trend during the period in which they were surveyed (Fig. 7). Peak Steller sea lion counts in the study area occurred in late summer while lowest overall counts occurred in midwinter surveys. Seasonal patterns of use varied on each site (Table 2, Figs. 3-5). Cape Barnabas and Long Island were both vacated during summer months while Ugak Island was occupied only during summer months (Fig. 4). All other sites were used year-round by varying numbers of Steller 80
89 sea lions (Fig.3-5). On most haulouts, sea lions were found to utilize different portions of the haulout (microhabitat) during different seasons. Counts on Marmot Island, the study area s only major rookery, increased after late May as breeding animals arrived to establish territories and peaked in mid- to late summer when pups were included in total counts. Similarly, counts on Latax Rks (Fig. 8) to the north of the rookery increased in July and peaked in September following the breeding season but land-based observations confirm the increase involved an influx of adult males on the site (Wynne, unpubl data). On sites south of Marmot I (Fig. 9), peak numbers were seen at the onset and immediately following the breeding season on Gull Pt and Ugak I respectively. Land-based observations confirm that animals using Ugak I haulout were large and apparently spent bulls, including one that was seen defending a territory on the Marmot rookery in July by NMML observers (K. Chumbley, pers. comm.). Counts on Long I however show the site vacated during the breeding season and used extensively in the winter. Land-based observations confirm that this site was used extensively by adult females with pups through the winter; females apparently vacate the site in May at the onset of pupping and breeding activities on Marmot I or other rookeries. Seasonal use of other haulouts appears more associated with temporal fluctuations in prey availability. For instance, the Cape Ugat (CU) haulout on the west side of Kodiak was used fairly consistently with the exception of a drop of attendance in mid-summer and peak in March (Fig.5). The mid-summer drop in counts on the site corresponds to the seasonal arrival of Steller sea lions in Chief Cove (shaded areas Fig. 5) approximately 15 km to the south where sea lions prey on fish caught on salmon gillnets (Wynne unpubl data). March peak counts on this site correspond to spawning of herring and pollock in nearby waters. Variability in counts made on Long Island and Cape Chiniak haulouts coincidental to GAP s in March, May, July, and November prey surveys (Fig. 10) may reflect seasonal and interannual fluctuations in prey biomass within 20nm of Long Island haulout Wynne et al (2003) and Foy (this volume). Detailed analyses of these potential correlations are in progress. Small-scale shifts in the location where sea lions congregated on given haulouts suggest they exploit seasonally important microhabitat. During relatively warm months, sea lions on many sites (LI, CH, CU, IK, LA, SO) were found to congregate on lower-lying, exposed, north or west-facing areas of the main haulout or adjacent rocks. In winter, sea lions on the same sites hauled out on high, south-facing rock slopes backed by rock faces. A seasonal shift in microhabitat use was also seen on Marmot I, which functions as a rookery from June-September but as a haulout October-May. When Marmot I. functions as a rookery, animals used multiple flat cobble beach sites on the east and south shore of the island, moving progressively southward through the summer and occasionally haul out on a rock beach on the SW tip of the island. In late fall, following the breeding season, use of the southern beaches diminished and remaining animals were concentrated on beaches on the east side of the island. From January to May of each year surveyed, the few sea lions remaining on Marmot I were hauled out on one site, a south-facing cave-like ledge site located approximately midway up the east side of the island. The overhead cave-like structure of this site affords sea lions protection from rocks that fall from cliffs above during freeze-thaw cycles. Discussion Combined counts of Steller sea lions on twelve major haulouts in the Kodiak area showed a slight declining annual trend between fall 1999 and Similarly, NMFS documented continued declines in biennial Steller sea lion counts in the central Gulf of Alaska (CGOA) including the Kodiak Archipelago of 4.3% from 1998 to 2002 and (Sease and Gudmundson 2002) 7.4% from NMML, unpubl data). During the course of this study, two sites were added to the survey as their repeated or consistent use by large numbers of animals was noted. Animals on both sites apparently exploit prey made seasonally available by human activities. Including these counts in total counts in the years surveyed softens the declining trend within the area. Further assessment is needed to determine if increased use of such new and opportunistic prey sources by Steller sea lions may affect aerial counts made during NMFS summer trend surveys. Although NMFS has an established set of sites with which to monitor stock trends, those survey routes should be updated periodically with data on newly established haulout sites. 81
90 Seasonal patterns of terrestrial habitat use varied by site suggesting the distribution of Steller sea lions within the GAP study area is responsive to the energetic demands on these large consumers. Sitespecific seasonal shifts in sea lion numbers correspond to a) specific demands associated with breeding and pup rearing and b) the availability of predictable or readily accessible prey, as seen elsewhere. Reproductive needs The demands of breeding, pupping, and pup rearing appear to have an important influence on the use of terrestrial habitat by Steller sea lion. Counts on Marmot Island clearly reflect the seasonal use of multiple beaches on this island for breeding and early pup rearing. Counts on haulouts to the north and south of Marmot Island may reflect distributional changes associated with breeding activities on the rookery. Some sites appear to function as staging and recovery areas for reproductive males while others appear to be particularly important for females rearing pups through their first winter. The haulout at Long Island forms the center for GAP s seasonal prey availability surveys on the east side of Kodiak. Although considered a winter-only haulout by NMFS (1998), it is more accurately a non-summer site. It is virtually vacated during the breeding season, with only a few subadult animals hauling out on it during summer. In fall, sea lions of all age and sex groups return but usually congregate first on a rocky beach on nearby Long Island. Within a month sea lions start to use the offshore (main) haulout site, which is then used extensively by large numbers of juveniles and females with pups into June. Animals branded as pups on both Sugarloaf and Marmot Island rookeries have been observed on this site as pups and juveniles and are among the animals seen using the site in summer (Wynne, unpubl data). The physiography and location of the Long Island and nearby Chiniak haulouts make them conducive to rearing young-of-the-year sea lions. Pups captured on one of these sites and branded or tagged with satellite-linked dive recorders were found to haul out on the other site as well (NMML, unpubl data). The structure, slope, and aspect of the haulouts provide pups with thermoregulatory benefits. Both are adjacent to sheltered shallow (<10m) area in which pups can play and gain experience foraging on the areas with greenling, ronquils, sandlance, rockfish and other demersal prey resources (Hegwer 2004). Weanlings and females that nurse then leave their young on these sites do not have to travel far to encounter substantial foraging opportunities. These haulouts are located near a bathymetric trough (northern reach of the Chiniak Gully (see map in Prey section, this volume) that supports substantial volumes of arrowtooth flounder, pollock, and Pacific cod from November to May (Foy this volume). Steller sea lion pups satellite-tagged on these sites spent much of their first winter using very nearshore waters then traveling increasing distances offshore along the Chiniak gulley edges in spring as they assumedly foraged (Loughlin et al. 2003) Noted shifts in use of specific aspects of these and other haulouts suggest Steller sea lions exploit seasonally important microhabitat. In winter, animals resting on high south-facing sites can exploit and conserve solar energy in these proverbial toaster ovens while being sheltered from northwest winds and increased winter wave action. Such seasonal shifts in microhabitat use have thermoregulatory benefits but also provide young pups access to sheltered waters. Prey Seasonal shifts in sea lion numbers on many Kodiak haulout sites appear to be related to Steller sea lions exploitation of predictable or readily accessible prey, as seen elsewhere. For example, the March peak in counts Cape Ugat are likely related to the abundance of spawning pollock in Shelikof Strait and herring in west Kodiak bays upon which animals using this site feed (Wynne, this volume). Since 2002, midsummer low counts on Cape Ugat have been found to correspond to the seasonal peaks in Steller sea lions presence in Chief Cove. Commercial salmon fishermen in the Chief Cove area have reported for years that Steller sea lions scavenge salmon from their salmon set gillnets, causing extensive damage to their gear and catch (Wynne, unpub data). Salmon taken from these nets provide a predictable seasonal prey source for Steller sea lions on the west side of Kodiak. 82
91 Human-enhanced seasonal prey availability may also explain the use of a non-traditional haulout site within Dog Bay boat harbor in Kodiak. The site is a floating platform formerly used as a temporary breakwater and now used as a haulout by an increasing number of Steller sea lions. Initially occupied by older bulls, this site is typically abandoned in midsummer during the breeding season. Since 1998 more females and immature animals have used the site, including some known aged branded or radio-tagged individuals Although a variety of prey are naturally available in the nearby waters of Women s Bay, Steller sea lions are also known to opportunistically scavenge fish and offal from commercial fishing vessels delivering their catch to nearby Kodiak processors. Conclusions Many variables affect the number of sea lions hauled out during surveys including weather, temporal considerations, and disturbance factors. No effort has been made to consider these covariates in deriving actual abundance estimates. Actual counts of animals using key sites are used here as an index of abundance and means by which to explore inter- and intra-annual changes in Steller sea lion distribution in Kodiak waters. These shifts in use are likely associated with changes in prey availability and seasonal reproductive needs (breeding and post-breeding adults, young-of-the-year). Monitoring seasonal patterns of haulout use adds a temporal evaluation of Critical Habitat that may help identify potential exposure of Steller sea lions to disturbance by humans through activities such as commercial fishing, tourism, oil spills, vessel traffic. Identifying terrestrial sites of particular concern during specific seasons may allow compromise in multi-use areas that have minimal potential for affecting Steller sea lion. These data will be combined with other GAP datasets to examine the potential influences of prey field variability of Steller sea lion distribution. Identify areas where greatest physical overlap with other piscivores in the system ID likelihood of competition with other marine mammals, birds, and fish. Ultimately, having multi-year counts may help ID specific sites or areas that are contributing to continued decline within central Gulf of Alaska. Acknowledgements This study represents a truly collaborative effort between NMFS and the University of Alaska. NOAA funds supported personnel but funding for all aircraft charters was graciously provided by the NMFS National Marine Mammal Lab, Seattle, WA. I thank Dr. Tom Loughlin for seeing the value in forging and maintaining such valuable research collaborations. Included in this report are data collected in 1999 and 2000 (Wynne et al. 2003) and supported in part by funds from the North Pacific Marine Research Board. This research was conducted under authority of NMFS Scientific Permit # (K. Wynne Co-Investigator) in collaboration with the NMFS National Marine Mammal Laboratory (NMML, Seattle, WA). Literature Cited Calkins, D.G. and K.W. Pitcher Population assessment, ecology, and trophic relationships of Steller sea lions in the Gulf of Alaska. US Dep Commerce NOAA, OCSEAP Final Rep. 19(1983): Fiscus, CH, H.W. Braham, R.W. Mercer, R.D. Everitt, B.D. Krogman, P.D. McGuire, C.E. Peterson,R.M. Sonntag, and D.E. Withrow Seasonal distribution and relative abundance of marine mammals in the Gulf of Alaska. US.S. Dep Comm, NOAA, OCSEAP Environ. Assess. Alaskan Continental Shelf, Q. Rep., Oct-Dec, 1: Gentry, R.L Social behavior of the Steller sea lion. PhD Thesis, Univ. California, Santa Cruz, 113pp. Gisiner. R.C Male territorial and reproductive behavior in the Steller sea lion, Eumetopias jubatus. PhD Thesis, Univ California, Santa Cruz. 146pp 83
92 Hegwer, C.L Seasonal abundance and diversity of nearshore fishes around Steller sea lion haulouts of Kodiak Island. M.S. Thesis, Univ. Alaska, Fairbanks. Loughlin, T.R., D.J. Rugh, and C.H. Fiscus Northern sea lion distribution and abundance: J. Wildl. Manage. 48: Loughlin, T.R., A.S. Perlov, and V.A. Vladimirov Range-wide survey and estimation of total numbers of Steller sea lions in Alaska. Marine Mammal Sci. 8: Loughlin, T.R. J. T. Sterling, R.L. Merrick, J.L. Sease, and A.E. York Diving behavior of immature Steller sea lions (Eumetopias jubatus). Fish Bull. 101: Milette, L.L Behavior of lavctating Steller sea lions (Eumetopias jubatas) during the breeding season: a comparison between a declining and stable population in Alaska. M.S. Thesis, Univ. British Columbia, Vancouver, BC. NMFS, Endangered Species Act Section 7 Consultation: authorization of the Bering Sea and Aleutian Islands groundfish fishery for walleye pollock, Bering Sea and Aleutian Islands Atka mackerel fishery, and Gulf of Alaska groundfish fishery for walleye pollock between 1999 and Office of Protected Resources, NMFS, 3 Dec Raum-Suryan, K.L., K.W. Pitcher, D.G. Calkins, J.L. Sease, and T.R. Loughlin Dispersal, rookery fidelity, and metapopulation structure of Steller sea lions (Eumetopias jubatas) in an increasing and a decreasing population in Alaska. Marine Mamm. Sci 18(3) Sease, J.L.and C.J.Gudmundson Aerial and land-based surveys of Steller sea lions (Eumetopias jubatus) from the western stock in Alaska, June and July 2001 and NOAA Tech Memo NMFS- AFSC-131. Sinclair, E.H. and T.K. Zeppelin Seasonal and spatial differences in diet in the western stock of Steller sea lions (Eumetopias jubatus). J. Mammal 83(4): Withrow, D.E Using aerial surveys, ground truth methodology, and haulout behavior to census Steller sea lions, Eumetopias jubatus. M.S.Thesis, Univ. Washington, Seattle, 102pp Womble, J.N., M.F. Willson, M.F. Sigler, B.P. Kelly, and G.R. VanBlaricom Spring-spawning fish aggregations: a seasonal feast for Steller sea lions. Abstract in Proceedings from Symposium on Marine Science in the northeast Pacific: science for resource-dependent communities. Anchorage, AK January Wynne, K.M., R.J. Foy, B. L. Norcross, C. L. Buck, and S. Hills Availability and use of prey by Steller sea lions in the eastern Kodiak area, Final Rept. to the North Pacific Marine Research Program, School of Fisheries and Ocean Sciences, Univ. of Alaska Fairbanks, 23 pp 84
93 Table 1. Summary of Steller sea lion aerial survey dates and counts on 12 haulouts in the Kodiak Archipelago, Sept 1999 to Oct Haulout Date LI CH UG GP CB TH IK CU LA SO SL MA Total 25-Sep Oct Nov Jan Feb Mar Apr May May Jul Aug Sep Oct Oct Nov Jan Feb Mar Apr May Jun Jul Aug Aug Sep Oct Dec Jan Feb Feb Apr May May Jul Aug Oct Nov Dec Jan Feb Mar Apr May Jun Jul Sep Oct LI= Long I, CH= C. Chiniak, UG= Ugak I, GP= Gull Pt, CB= C. Barnabas, TH= Two-headed, IK= C. Ikolik, CU= C. Ugat, LA= Latax Rk, SO= Sea Otter I, sea lion= Sea lion Rk, MA= Marmot I 85
94 Table 2. Steller sea lion haulouts monitored during aerial surveys conducted in the Kodiak Archipelago, September October Use and season are based on NMFS (1998) designations where H= haulout and R= rookery. Site numbers are found on study area map (Fig.1). Major Steller sea lion haulouts within the study area Map # Site Abbrev Use season 1 Latax Rks LA H year-round 2 Sea Otter Rks SO H year-round 3 Sea Lion Rks SL H year-round 4 Marmot MA H, R year-round 5 Long Is LI H Winter-only 6 C. Chiniak CH H year-round 7 Ugak Is UG H Summer-only 8 Gull Pt GP H year-round 9 C. Barnabas CB H year-round 10 Two-headed TH H, R year-round 11 C. Ikolik IK H year-round 12 C. Ugat CU H year-round ") 1 ") 2 ") 3!( 4 ") 12 [ ") 5 ") 6 ") 11 ") 8 ") 9 ") 7!( 10 Figure 1. Twelve major Steller sea lion haulouts ( ) surveyed in the Kodiak Archipelago, including sites ( ) also used as a rookery during the breeding season. 86
95 Monthly counts of SSL on 12 haulouts in Kodiak area, y = x R 2 = # ssl counted on haulouts /25/99 11/25/99 1/25/00 3/25/00 5/25/00 7/25/00 9/25/00 11/25/00 1/25/01 3/25/01 5/25/01 7/25/01 9/25/01 11/25/01 1/25/02 3/25/02 5/25/02 7/25/02 9/25/02 11/25/02 1/25/03 3/25/03 5/25/03 7/25/03 9/25/03 Date. Figure 2. Counts and trend in number of Steller sea lions using 12 haulout sites in the Kodiak Archipelago during GAP surveys, Sep Sep
96 Latax Rks y = x R 2 = Sea Lion Rks y = x R 2 = Marmot I y = x R 2 = Sea Otter Is y = x R 2 = /25/99 11/25/99 1/25/00 3/25/00 5/25/00 7/25/00 9/25/00 11/25/00 1/25/01 3/25/01 5/25/01 7/25/01 9/25/01 11/25/01 1/25/02 3/25/02 5/25/02 7/25/02 9/25/02 11/25/02 1/25/03 3/25/03 5/25/03 7/25/03 9/25/03 Figure 3. Counts and trends in number of Steller sea lions on north Kodiak haulouts, Sep 1999-Oct
97 Long Is Gull Pt y = x R 2 = y = x R 2 = Cape Chiniak Cape Barnabas y = x R 2 = y = x R 2 = Ugak Island Two-headed Is y = x R 2 = y = x R 2 = /25/99 12/25/99 3/25/00 6/25/00 9/25/00 12/25/00 3/25/01 6/25/01 9/25/01 12/25/01 3/25/02 6/25/02 9/25/02 12/25/02 3/25/03 6/25/03 9/25/03 9/25/99 12/25/99 3/25/00 6/25/00 9/25/00 12/25/00 3/25/01 6/25/01 9/25/01 12/25/01 3/25/02 6/25/02 9/25/02 12/25/02 3/25/03 6/25/03 9/25/03 Figure 4. Counts and trends in numbers of Steller sea lion on eastern Kodiak haulouts,
98 Cape Ugat y = x R 2 = Cape Ikolik y = x R 2 = Figure 5. Counts and trends in numbers of Steller sea lion on western Kodiak haulouts, /25/ /25/1999 1/25/2000 3/25/2000 5/25/2000 7/25/2000 9/25/ /25/2000 1/25/2001 3/25/2001 5/25/2001 7/25/2001 9/25/ /25/2001 1/25/2002 3/25/2002 5/25/2002 7/25/2002 9/25/ /25/2002 1/25/2003 3/25/2003 5/25/2003 7/25/2003 9/25/ Sea lion counts on Chief Cove (CC) and Dog Bay (DB sites CC DB 140 # SSLs counted /1/00 12/1/00 2/1/01 4/1/01 6/1/01 8/1/01 10/1/01 12/1/01 2/1/02 4/1/02 Fig ure 6. Counts and seasonal trends in numbers of Steller sea lions using two new haulout sites, Dog Bay (DB) and Chief Cove (CC). These sites were added to the survey route beginning in October 2000 and May 2002 respectively 6/1/02 8/1/02 10/1/02 12/1/02 2/1/03 4/1/03 6/1/03 8/1/03 10/1/03 90
99 y = x R 2 = Major sites only w/cc and DB W/CC and DB Major sites only 500 y = x R 2 = /6/ /6/2000 2/6/2001 4/6/2001 6/6/2001 8/6/ /6/ /6/2001 2/6/2002 4/6/2002 6/6/2002 8/6/ /6/ /6/2002 2/6/2003 4/6/2003 6/6/2003 8/6/ /6/2003 Figure 7. Comparison of totals and trends in number of sea lions using only major sites ( ) and with inclusion of counts made on Chief Cove (CC) and Dog Bay (DB) haulouts (- - -), October Counts of sea lions on north Kodiak sites compared to Marmot Island Marmot (MA) Latax Rks (LA) Sea Otter Rks (SO) Sea Lion Rks (SL) 1000 # sea lions counted /25/ /25/1999 1/25/2000 3/25/2000 5/25/2000 7/25/2000 9/25/ /25/2000 1/25/2001 3/25/2001 5/25/2001 7/25/2001 9/25/ /25/2001 1/25/2002 3/25/2002 5/25/2002 7/25/2002 9/25/ /25/2002 1/25/2003 3/25/2003 5/25/2003 7/25/2003 Figure 8. Counts of Steller sea lions on three north Kodiak haulouts compared to counts on Marmot Island (rookery) Sept Oct
100 East Kodiak sites compared to Marmot Marmot Is Gull Pt Ugak I Long Is C. Chiniak 1000 number of SSL counted /25/ /25/1999 1/25/2000 3/25/2000 5/25/2000 7/25/2000 9/25/ /25/2000 1/25/2001 3/25/2001 5/25/2001 7/25/2001 9/25/ /25/2001 1/25/2002 3/25/2002 5/25/2002 7/25/2002 9/25/ /25/2002 1/25/2003 3/25/2003 5/25/2003 7/25/2003 9/25/2003 Figure 9. Counts of Steller sea lions on four east Kodiak haulouts compared to counts on Marmot Is (rookery) Sept Oct SSL counts overlapping LiCh prey survey months C.Chiniak Long I March-00 May-00 November-00 March-01 May-01 November-01 March-02 May-02 July-02 November-02 Figure 10. Counts of sea lions on Long Island and Cape Chiniak haulouts in months that overlapped LiCh prey surveys (Foy, this volume). 92
101 Dive behavior of harbor seals (Phoca vitulina richardsi) within Steller sea lion Critical Habitat on the east side of Kodiak Island, Alaska Shawn Harper 1 and Kate Wynne 2 1 University of Alaska Fairbanks, School of Fisheries and Ocean Science, Fairbanks, Alaska 2 University of Alaska Fairbanks Marine Advisory Program, Kodiak, Alaska Introduction Harbor seal (Phoca vitulina richardsi) numbers declined more than 80% in western Alaska in the 1970 s and 1980 s, coinciding with similarly drastic declines in Steller sea lion numbers (Merrick et al. 1987, Pitcher 1990). In an effort to monitor the trend in harbor seal population growth, the Alaska Department of Fish and Game (ADFG) initiated a monitoring program at three key trend routes in Alaska including one in Kodiak (Small et al. 2001). This route, encompassing 30 haulouts on the east and south coast of the Kodiak Archipelago, was surveyed annually from 1993 to 2003 and showed a 5.6% annual increase in the number of harbor seals counted (Small et al. 2003). This steady increase in harbor seal numbers in the Kodiak area is in marked contrast to the continued decline of Steller sea lions in this area. Steller sea lion counts on rookeries and haulouts in the central Gulf of Alaska decreased by approximately 6.2% annually between 1991 and 2002 (Sease et al. 2001, Sease and Gudmundson 2002, NMFS unpubl. data 2004). Surveys conducted in 2002 and 2004 suggest Steller sea lion numbers in the central GOA (including Kodiak Archipelago) continue to decline despite noted increases in other regions (NMFS unpubl. data 2004). Potential causes for the decline of these populations in the 1970 s and 1980 s remain unclear but are suspected to include limited prey availability or quality and its effects on juvenile survival (Pitcher 1990, Merrick et al. 1995, Merrick et al. 1997, NRC 2003, Trites and Donnelly 2003). The diets of both species are diverse and often reflect regional and seasonal availability of prey and they often forage on many of the same species. Jemison (2001) found the diet of Kodiak seals in the 1990 s to be dominated by Irish lords and sandlance, with Pacific cod, walleye pollock, salmon spp, arrowtooth flounder, sole spp., greenling, and cephalopods also important (occurring at >10% of 321 scats). Sinclair and Zeppelin (2003) found similar key species in Steller sea lion scats in the Kodiak area in the 1990 s, including pollock, salmon, arrowtooth flounder, Pacific cod, Irish lords, snailfish, herring, sandlance, Irish lords and cephalopods (occurring seasonally at >5% of 334 scats). Wynne et al.(2003) found pollock, arrowtooth flounder, sandlance, Pacific cod, salmon spp., Irish lords, sole spp., sandfish, capelin, and snailfish to be seasonally important (occurring seasonally in >10% of 356 scats) in the diet of Steller sea lions in the Kodiak area in With this degree of overlap in diet composition and diversity, it would be reasonable to assume that growth in sympatric harbor seal and Steller sea lion populations would have similar direction and trajectories as prey availability changed. The fact that harbor seal numbers have increased since 1993 while Steller sea lion numbers have continued to decline in the Kodiak region suggests 1) the availability of prey is limited for Steller sea lions but not harbor seals or 2) factors other than prey availability are regulating these pinniped populations in the Kodiak area. Different spatial and/or temporal patterns of habitat use by sympatric consumers could suggest differential availability of certain prey. For instance, physiological constraints on dive ability could limit a mammal s access to some benthic or epibenthic prey resources. The availability of pelagic prey with diurnal migrations could also vary temporally for a mammal with limited dive depths. The prey species found in both harbor seal and Steller sea lion diets utilize habitats ranging from nearshore to shelf break and pelagic to epibenthic. Some have limited diurnal vertical migrations (e.g. Irish lords, sandlance, soles, flounders, and gadids); some have predictable seasonal movements (e.g. salmon concentrate at mouths of natal streams). Examining the dive patterns of sympatric harbor seals and Steller sea lions is one 93
102 means of assessing their spatial and temporal use of habitat, potential access to shared prey resources, and differential foraging efficiency. The depth and duration of dives made by Alaskan harbor seals have been found to vary in relation to time of day, season, and location. Frost et al. (2001) found that seals in Prince William Sound (PWS) spent most time in the water and diving at night (hours of ) and that most dives were in the 20 to 75 m depth range. Gotthardt (2001) suggests that seals in PWS found more prey in shallow water at night where they spent 52% of their time diving to depths <20m, 23% 20-50m, and 25% >50m. Gotthardt also found that adult females dive depths were variable but generally shallower than subadults (adult female average max. depth (AMD)=39.3m ± 26.4 and subadult AMD=98.2 ± 23.9). Of seals tagged in Kodiak, Swain and Small (1997) found that subadult seals made the deepest mean and maximum dives (33.6m and147m, respectively) while adult females made the shallowest mean and maximum dives (19.1m and 35m). Steller sea lions in Alaska appear to forage in relatively shallow water depths with a noted increase with age to adulthood (Merrick and Loughlin 1997). Loughlin et al. (2003) found that Steller sea lion pups (7-10mos) in Alaska were capable of diving to 252m but that their mean maximum dive depth was 25.7m and their mean dive duration was only 0.8 minutes. Yearlings had a maximum dive depth of 288m but on average they dove for just 1.1min to maximum depths of 63.4m (Loughlin et al. 2003). Adult females tracked in summer were found to dive to median and maximum depths of 21m and m, respectively); those tracked in winter dove deeper and longer (Merrick and Loughlin 1997). In this report we summarize the depth, time, and duration of dives made by a sample of harbor seals within designated Steller sea lion Critical Habitat in the Kodiak area in 2002 and 2003.Our data will be used in subsequent comparisons to dive data collected from 11 Steller sea lions tagged on Long Island or Cape Chiniak in 2002 and 2003 (NMFS unpub data to elucidate differential use of northeastern Kodiak waters by these sympatric piscivores. Methods Project personnel collaborated with Alaska Department of Fish and Game (ADFG) biologists to capture seals within the study area in October 2002 and March Captures were attempted at five haulouts in the Chiniak Bay area with a variety of techniques; we were only successful using a beach seine at Middle Island in Kalsin Bay (Figure 1). The net was deployed at moderate speed to catch seals as they vacated the haulout, taken ashore at both ends, and hauled in (Frost and Lowry 1994). Seals caught within the seine were removed and held in hoop-nets for subsequent sampling and instrumentation. Two types of electronic tags were attached to seals to facilitate the assessment of harbor seal dive behavior. A VHF radio (ATS Inc., model MM320; 3.5 cm x 5.6 cm x 2.1 cm, weighing 70g) was attached to the pelt of each seal s head with Devcon 5-minute Epoxy. These radios transmitted a signal at 50bpm that was tuned to a unique VHF frequency between MHz, allowing identification of individual seals when located. Because VHF signals cannot be detected when the antenna is submerged, the primary use of head-mounted VHFs was to monitor seals at-sea when surfacing between dives, allowing tracking by boat and fine-scale monitoring of movements and location during foraging bouts Combination VHF/TDR tags were attached with epoxy to the dorso-lumbar pelt on seals to monitor dive behavior. Each tag contained one VHF transmitter (ATS Inc., model MM 190) with distinctive frequency for locating seals (or tags) and one archival time-depth recorder (TDR) (Wildlife Computers Inc., model MK9) for archiving time-linked pressure and temperature data during dives. These instruments were epoxied together with syntactic foam to form a tag 6.6 cm x 14.5 cm x 2.56cm and weighing approx.190g. These VHF/TDR tags were designed to float after being shed during the seals annual molt, allowing location and retrieval of the archival TDR without recapturing the animal. TDRs deployed in October were programmed to record pressure, temperature, light levels, and saltwater resistance every ten seconds, continuously. TDRs deployed in March were programmed to record 94
103 pressure, temperature, and saltwater resistance every five seconds and light and battery voltage every ten seconds continuously. Mobile and fixed antenna systems were used to detect VHF transmissions, locate seals, or recover VHF/TDR backpacks after being shed. Automated data-recording systems using mast-mounted Yagi antennas were used to record the presence and absence of tagged seals within Chiniak Bay area. Mobile receivers were used in planes, on boats, and on land to locate and retrieve shed VHF/TDR backpacks. Once backpacks were recovered, Wildlife Computer s BETA Instrument Helper software (Version 401) was used to access and process data archived in the TDRs. This software generated a graphical representation of two dimensional dive data; recorded dive data were assessed in one hour time blocks. A combination of pressure, salt water resistance, temperature, and light level sensor readings were used to determine when a seal was at the surface. This was also used to derive a correction factor needed to zero the pressure readings to surface pressure equivalence. The Zero Offset Correction (ZOC) command was used to manually correct for erroneous drift that occurred in the pressure recordings; data collected when drift exceeded the programs ability to distinguish individual dive (when reviewing light, seawater resistance, and depth measurements) were excluded from the dive analysis. In the dive analysis, the Minimum Dive Depth was defined as 3 meters, the Allowable Surface Error as 1 meter, and Percent of Maximum Depth for Bottom as 90%. Dive summaries, including start time, duration, max depth, bottom time, number of wiggles, average wiggle distance, average descent rate, and average ascent rate, were saved in an Excel file. Post-hoc processing in Excel included converting Universal time recorded on the TDRs to local Alaska Standard Time and assignment of dates to TDR deployment week numbers. Data were aggregated in four time blocks (1 = , 2 = , 3 = , and 4 = ) and six depth bins (1 = 4-20m, 2 = 21-50m, 3 = m, 4 = m, 5 = m, and 6 = >200), duplicating those used in ADFG s Kodiak harbor seal studies (Hastings et al 2001). Weekly summaries of dive data for each seal were compiled in an Access database to derive query-generated summary statistics. Results A total of 19 seals were captured, nine in October 2002 and ten in March 2003 (Table 1). Of these, 15 (8 in October, 7 in March) were measured, tagged, sampled and equipped with a VHF/TDR backpack. Because the tags attached to the pelt were shed during the summer molt, those deployed in October could potentially remain attached for eight to ten months and those deployed in March for four months. Eight out of the fifteen TDRs were retrieved during summer Of these, five of the eight TDRs recovered had recorded and collected data and three had suffered catastrophic failure. Of the five functional TDRs, four (one sub-adult and three adult males) collected salvageable data from October 13, 2002 to the middle of February, 2003 before substantial drift and eventual failure of pressure sensors compromised their data. We truncated our data set for these four animals on 15 February at appoint where the data were uncompromised. The other functional TDR, deployed in March on an adult female that was visibly assessed to be pregnant, recorded data through July 2003 (Table 1). Data from these five functioning TDRs provide insights into activity budget (% time submerged below 3m) and dive patterns of individual seals (Table 2). Adult female (03KOD03) The adult female, determined visually to be pregnant when captured, made 26,476 dives for a total of 75,573 minutes submerged (or approx 46% of her time deeper than 3m) during the deployment period of 30 March through 26 July 2003 (Table 2). Overall, her dives averaged 2.85 minutes in duration and her maximum dive time was 17.2 minutes. Her overall maximum dive depth was 218m but her average maximum depth within a dive series was only 24m (Table 2). The maximum dive time occurred while she dove within the shallowest depth bin (3-20m) (Table 3). No clear patterns were noted in her 95
104 diving relative to time of day although she spent more time diving at night and early morning than other time periods (Table 4). Changes in her dive behavior were evident during the weeks of June 1 st through June 15 th (relating to week numbers 10 through 12, Figure 2). This time period coincides with the peak period for seal pupping on nearby Tugidak Island (Jemison et al. 1998). Total dive counts did not change appreciably during this time but the number of counts within depth bin1 (3-20m) increased while all others fell to zero. The weekly percentage of time spent submerged (below 3m) dropped considerably as most of her time was spent at the surface, either in the water or hauled out. Adult and subadult males Four male seals (3 adult:1 subadult) were equipped with functioning TDR packages from 13 October to 15 February 2002 that recorded 113,247 individual dives (Table 1). Mean dive duration was similar for all males, averaging between 2.85 and 3.77 minutes per dive. The percentage of total time spent submerged below 3m varied considerably between individuals, ranging between 44.5 and 66% (Table 2). The maximum individual dive durations ranged from minutes. A clear dichotomy was noted in the maximum depth of dives recorded by males; two males dove deeper than 200m while two other never dove deeper than 65m (Table 2). The subadult male made consistently deeper dives than the adult males (Table 2), as evidenced by weekly average depth distribution of male dives (Figure 4). No clear temporal patterns were evident in male dive patterns although the three adults spent the least amount of time diving during the mid-day time period (Table 4). Discussion Gender-specific trends Our sample size was too small to assess gender-specific trends. However, a clear shift was noted in the dive behavior of adult female 03KOD03 in early June, coinciding with the period of pupping on nearby Tugidak Island (first pups born mid May, peak numbers in mid-june (Jemison et al. 1998). Female harbor seals nurse their pups for 3-6 weeks (Bishop 1967, Hoover 1983). Our female s time spent diving and average depth of dives dropped precipitously in weeks 10 and 11, presumably associated with post-partum fasting and began to increase by week 12, presumably during late lactation as her pup approached weaning. This female did not dive to depths >10m until 18 June but the next week (25 June) she abruptly began diving to depths >80m and by Week 14 (late June) she had resumed her dive routine. These findings are consistent with those of Bowen et al. (2001) who found the onset of diving during lactation varied considerably among female harbor seals, with dive bouts resuming 1-16 days postpartum (range). Others have found that lactating harbor seals may start foraging before the weaning process is completed (Boness et al. 1994, Bowen et al. 2001, and Baechler et al. 2002). Temporal trends The five seals in this study spent the greatest amount of their time diving during the 21:00-03:00 time period. Further analyses will seek correlations between time of day and depth of dives made. Gotthardt (2001) observed time of day as having a significant effect on dive frequency and depths to which Prince William Sound harbor seals dove; most dives occurred at night (21:00-03:00) while the deepest dives occurred from 03:00-09:00 and shallowest from 09:00-15:00. Frost et al. (2001) also found that Prince William Sound seals spent the greatest percentage of time in water between 21:00-03:00 and the least amount in the water from 03:00-09:00. Depth trends Mean dive depths of seals in this study were shallow: both sexes spent most their time and dives in water <50m deep. This finding is consistent with dive depths previously recorded in Kodiak, where 94.7% of dives recorded were <50m (Hastings et al. 2001). Frost et al. (2001) reported diving by harbor seals in Prince William Sound was focused in the 20 to 100m depth range and more than half of harbor seal dives reported by Gjertz et al. (2001) were shallower than 40 m in depth. The three adult males in 96
105 this study tended to dive deeper during the low light hours of the day but, because the majority of their dives where <20m, this pattern is lost in the depth-binning of our results. The maximum dive depth recorded by TDRs placed on our seals was 218m for the female and 274m by one of the males. These maximum depths are shallower than those recorded by female (368m) and male (320m) seals tracked with satellite-linked depth recorders (SLDRs) in Kodiak in (Hastings et al 2001). This difference may reflect either bathymetric differences in study areas or shallower foraging by seals relative to the sea bed. Variations seen in dive depths may be a function both of geographic location and prey location (Tollit et al. 1998, Frost et al. 2001, Gotthardt 2001, Small and Ver Hoef 2001). We cannot address this issue because we lack locational linkages and thus the bathymetric data associated with our dive depths. Mean dive durations increased with dive depth but the longest dives for both sexes occurred in dives to <50m. Gjertz et al. (2001) and Lowry et al. (2001) associated deeper and longer dive durations to seals foraging at or past the shelf break. Problems associated with combining locational and dive data have limited our ability to determine where seals forage relative to the sea bed (Gjertz et al. 2001, Tollit 1998). These preliminary data provide a means of comparing one dimension of harbor seal habitat use to that of other consumers being monitored within the same bays. In particular, we plan to compare seal dive data to data collected from Steller sea lions captured in and near Chiniak Bay by ADFG and NMFS researchers from (NMML unpub data) as those data become available. In their absence, we compared our seals data to dive patterns of 18 immature Steller sea lions tagged throughout Alaska (Loughlin et al. 2003). Young-of-the year Steller sea lions were found to have a mean dive duration of 0.8 min, mean maximum dive depth of 25.7m, and maximum dive depth of 252m. Yearlings had a mean dive duration of 1.1min, mean maximum dive depth of 63.4m, and maximum dive depth of 288m (Loughlin et al. 2003). On average, the seals we studied made longer but shallower dives than immature Steller sea lions studied in Alaska (Loughlin et al. 2003). Mean seal dives were 2-4 times longer than dives made by these immature Steller sea lions. On average, the immature Steller sea lions dove deeper than the seals in our study (mean max. dive depth) although the maximum depths reached by diving seals and sea lions were similar. Future analysis of dive data from Steller sea lions tagged within our study area in 2002 and 2003 are needed to discern differential use of the marine habitat by these sympatric pinnipeds. Future geo-positional linking of dive data is needed to determine if there is an inshore-offshore segregation of foraging by these sympatric species. Future GAP analyses will seek associations between mean seal dive depths and the species-specific depth of prey fields found during GAP s LICH prey surveys in November 2002, March and May Conclusions In this study we consider spatial and temporal patterns of diving behavior to be indicators of habitat use by harbor seals. Although we lack geographic linkage to dive profiles, we found preliminary evidence suggesting there may be age or gender-specific patterns in habitat use by seals sampled in this study. A larger sample size and longer deployment period are needed to clearly distinguish these patterns from individual variation. There is significant dietary overlap between seals and sea lions in the Kodiak area. A comparison of species-specific dive patterns of tagged animals simultaneously using the same area may illuminate temporal patterns in dive behavior suggestive of differential foraging patterns. Such studies and analyses will further our ability to judge whether prey availability may be differentially affecting these species and contributing to their disparate population trajectories in the Kodiak region. Acknowledgments This research was conducted under NMFS Scientific Permit No (held by The Alaska Department of Fish and Game in collaboration with Dr. Gail Blundell) and IACUC Permit #20-48 (University of Alaska Fairbanks). This project and the captures involved the cooperative efforts of the 97
106 Alaska Department of Fish and Game, the Alaska Sealife Center, and the University of Alaska Fairbanks Fisheries Industrial Technology Center. Special thanks to Jeff Allen on the F/V Chiniak for returning a TDR he found in Eagle harbor/ugak Bay. Literature Cited Baechler, J., C.A. Beck, and W.D. Bowen Dive shapes reveal temporal changes in the foraging behaviour of different age and sex classes of harbour seals (Phoca vitulina). Canadian Journal of Zoology 80: Bishop, R.H Reproduction, age determination, and behavior of the harbor seal, Phoca vitulina, in the Gulf of Alaska. M.S. Thesis, Univ. Alaska, College. 121pp Boness, D.J., W.D. Bowen, and O.T. Oftedal Evidence of a maternal foraging cycle resembling that of otariid seals in a small phocid, the harbor seal. Behavioral Ecology & Sociobiology 34: Bowen, W.D., S.J. Iverson, D.J. Boness, and O.T. Oftedal Foraging effort, food intake and lactation performance depend on maternal mass in a small phocid seal. Functional Ecology 15: Frost, K.J., M.A. Simpkins, and L.F. Lowry Diving behavior of subadult and adult harbor seals in Prince William Sound, Alaska. Marine Mammal Science 17(4): Frost, K.J., L.F. Lowry, E. Sinclair, J.M. Ver Hoef, and D.C. McAllister Impacts on distribution, abundance, and productivity of harbor seals. Pp in T.R. Loughlin, ed. Marine Mammals and the rexxon Valdez. Academic Press, San Diego, CA. Gjertz, I., C. Lydersen, and O. Wiig Distribution and diving of harbour seals (Phoca vitulina) in Svalbard. Polar Biology 24: Gotthardt, T.A The foraging ecology of harbor seals (Phoca vitulina richardsi) in Southcentral Prince William Sound, Alaska. MS thesis, University of Alaska Anchorage,. Hastings, K.K., R.A. Small, M.A. Simpkins, and U.G. Swain Dive behavior of adult and subadult harbor seals from Kodiak Island and Southeast Alaska. pp in Alaska Department of Fish & Game, Division of Wildlife Conservation, Harbor Seal Investigations in Alaska, Annual Report Hoover, A.A Behavior and ecology of harbor seals Phoca vitulina richardsi inhabiting glacial ice in Aialik Bay, Alaska. M.S. Thesis, Univ. Alaska, Fairbanks. 133pp Jemison, L.J., R. Daniel, S. Crowley, G. Pendleton, and B. Kelly Pupping and molting phenology of harbor seals on Tugidak Island, Alaska. pp in Harbor seal investigations in Alaska. Annual report, NOAA Grant NA57FX0367, ADFG, Anchorage, AK. 190 pp Jemison, L.J Summary of harbor seal diet data collected in Alaska from pp in Harbor seal investigations in Alaska. Ann. Rept, NOAA Grant NA87FX0300, ADFG, Anchorage, AK. 356pp. Lesage, V., M.O. Hammill, and K.M. Kovacs Functional classification of harbor seal (Phoca vitulina) dives using depth profiles, swimming velocity, and an index of foraging success. Canadian Journal of Zoology 77: Lesage, V., M.O. Hammill, and K.M. Kovacs Long-distance movements of harbour seals (Phoca vitulina) from a seasonally ice-covered area, the St. Lawrence River estuary, Canada. Canadian Journal of Zoology 82: Loughlin, T.R. J. T. Sterling, R.L. Merrick, J.L. Sease, and A.E. York Diving behavior of immature Steller sea lions (Eumetopias jubatus). Fish Bull. 101: Lowry, L.F., K.J. Frost, J.M. Ver Hoef, and R.A. DeLong Movements of satellite-tagged subadult and adult harbor seals in Prince William Sound, Alaska. Marine Mammal Science 17(4): Merrick, R.L, T.R. Loughlin, and D.G. Calkins Decline in abundance of the northern sea lion, Eumetopias jubatus, in Alaska Fish. Bull., 85 (2) Merrick, R.L The relationship of foraging ecology of Steller sea lions (Eumetopias jubatus) to their population decline in Alaska. PhD Thesis, University of Washington, 171 pp. Merrick, R.L., R.B. Brown, D.G. Calkins, and T.R. Loughlin A comparison of Steller sea lion, Eumetopias jubatas, pup masses between rookeries with increasing and decreasing populations. Fish. Bull. 93: Merrick, R.L Current and historical roles of apex predators in the Bering Sea ecosystem. J. Northw. Atl. Fish. Sci. 22:
107 Merrick, R.L. and T.R. Loughlin Foraging behavior of adult female and young-of-the-year Steller sea lions in western Alaskan waters. Can. J. Zool. 75: Merrick, R.L., Chumbley, K. and Byrd, G.V Diet diversity of Steller sea lions (Eumetopias jubatas) and their population decline in Alaska: a potential relationship. Can. J. Fish. Aquat. Sci. 54: NRC (National Research Council) Decline of the Steller sea lion in Alaskan waters: untangleing food webs and fishing nets. National Research Council, National Academy Press, D.C. Pitcher, K.W Prey of the Steller sea lion, Eumetopias jubatus, in the Gulf of Alaska. Fish. Bull. 79: Pitcher, K.W Major decline in number of harbor seals, Phoca vitulina richardsi, on Tugidak Island, Gulf of Alaska. Mar. Mammal Sci. 6(2) Rehberg, M.J. and R.J. Small Dive behavior, haulout patterns, and movements of harbor seal pups in the Kodiak Archipelago, pp in Alaska Department of Fish & Game, Division of Wildlife Conservation, Harbor Seal Investigations in Alaska, Annual Report Sease, J.L.and C.J.Gudmundson.2002.Aerial and land-based surveys of Steller sea lions (Eumetopias jubatus) from the western stock in Alaska, June and July 2001 and NOAA Tech Memo NMFS-AFSC-131. Sease, J.L, W.P. Taylor, T.R. Loughlin, and K.W. Pitcher Aerial and land-based surveys of Steller sea lions (Eumetopias jubatas) in Alaska, June and July 1999 and NOAA Tech Memo NMFS-AFSC-122. Sinclair, E.H. and T.K. Zeppelin Seasonal and spatial differences in diet in the western stock of Steller sea lions (Eumetopias jubatus). J. Mammal 83(4): Small, R.J., and J.M. Ver Hoef Movement patterns of non-pup harbor seals in the Kodiak Archipelago and Southeast Alaska. Alaska Department of Fish & Game, Division of Wildlife Conservation, Harbor Seal Investigations in Alaska, Annual Report Small, R.J., G.W. Pendleton, and K.W. Pitcher Trends in abundance of Alaska harbor seals Marine Mammal Sci. 19(2): Small, R.J., G.W. Pendleton, and K.M. Wynne Harbor seal population trends in the Ketchikan, Sitka, and Kodiak areas of Alaska, pp 8-30 in Harbor seal investigations in Alaska. Annual report, NOAA Grant NA87FX0300, ADFG, Anchorage, AK. 356pp. Swain, U.G. and R.J. Small Movements and diving behavior of harbor seals in southeast Alaska and the Kodiak Archipelago. pp in Harbor seal investigations in Alaska. Annual report, NOAA Grant NA57FX0367, ADFG, Anchorage, AK. 356pp Thompson, P.M., M.A. Fedak, B.J. McConnell, and K.S. Nicholas Seasonal and sex-related variation in the activity patterns of common seals. Journal of Applied Ecology 26: Tollit, D.J., A.D. Black, P.M. Thompson, A. Mackay, H.M. Corpe, B. Wilson, S.M. Van Parijs, K. Grellier, and S. Parlane Variations in harbour seal Phoca vitulina diet and dive-depths in relation to foraging habitat. Journal of Zoology (London) 244: Trites, A.W. and C.P. Donnelly The decline of Steller sea lions Eumetopias jubatas in Alaska: a review of the nutritional stress hypothesis. Mammal Rev. 33(1):3-28. Wynne, K.M., R.J. Foy, B. L. Norcross, C. L. Buck, and S. Hills Availability and use of prey by Steller sea lions in the eastern Kodiak area, Final Rept. to the North Pacific Marine Research Program, School of Fisheries and Ocean Sciences, Univ. of Alaska Fairbanks, 23 pp 99
108 Table 1. Summary of time-depth recorder (TDR) deployment history and data recovery for five seals sampled in 2002 and Animal TDR Date Data recorded Seal # Age Sex Mass (kg) deployed recovered last usable data # days # dives # minutes 03KOD03 AD F /30/03 7/30/03 7/26/ , ,280 02KOD01 SA M /13/02 8/7/03 2/15/ , ,440 02KOD04 AD M /13/02 7/14/03 2/15/ , ,440 02KOD07 AD M /13/02 7/9/03 2/15/ , ,440 02KOD08 AD M /13/02 7/11/03 2/15/ , ,440 Table 2. Summary of dive depth, duration, and % time spent diving below 4m for five harbor seals equipped with TDRs in Kodiak, Seal # Harbor seal Max Dive depth (m) Age class Sex Max Mean Dive duration (minutes) Std dev max mean Std dev Diving (>4m) # mins % total time 03KOD03 AD F , KOD01 SA M , KOD04 AD M , KOD07 AD M , KOD08 AD M ,
109 Table 3. Number, duration, and % of time spent diving in each of six depth bins as recorded by TDRs deployed on one female and four male harbor seals in Chiniak Bay, Alaska. Depth Bins Adult female All Males Combined (161,280 minutes total; 75,573 minutes diving) (725,760 minutes total; 390,808 minutes diving) Mean Max Sum % of Mean Max Sum % of Dive Dive Dive Dive Total Dive Dive Dive Dive Total Count Duration Duration Time Time Count Durat'n Durat'n Time Time (n) (min) (min) (min) (n) (min) (min) (min) 4-20 m m m m m > 200m Table 4. Number, depth, duration, and % of time spent diving in each of four time blocks as recorded by TDRs deployed on one female and four male harbor seals in Chiniak Bay, Alaska. Time Block Adult female All Males Combined (161,280 minutes total; 75,573 minutes diving) (725,760 minutes total; 390,808 minutes diving) Dive Count Avg Max Depth Max Depth Max Sum Dive Time % of Total Time Dive Count Avg Max Depth Max Depth Max Sum Dive Time (n) (m) (m) (min) (n) (m) (m) (min) % of Total Time 03:00-08: :00-14: :00-20: :00-02:
110 152 35'0"W '0"W '0"W '0"W '0"W '0"W 152 5'0"W 57 55'0"N Kodiak Is '0"N 57 50'0"N 57 50'0"N % # % 57 45'0"N Long Is '0"N # # Chiniak Bay 57 40'0"N 57 35'0"N Kalsin Bay [ Middle Is Kilometers % Cape Chiniak # 57 40'0"N 57 35'0"N '0"W '0"W '0"W '0"W '0"W '0"W 152 5'0"W Figure 1. Map of study area in northeastern Kodiak Island, including Steller sea lion haulouts ( ), harbor seal haulouts ( ), and harbor seal capture location ( ) in Chiniak Bay. 102
111 Weekly Percent of Time Submerged Adult female (03KOD03) 100% 90% 80% Percent Time Submerged 70% 60% 50% 40% 30% 20% 10% 0% Week Figure 2. Weekly percentage of time spent diving by an adult female harbor seal (03KOD03) in the northeastern waters off Kodiak Island, Alaska. Weeks 1 through 16 represent the dates March 30, 2003 through July 26, Weekly Mean Maximum Depth per Depth Bin Adult female (03KOD03) 250 Average Maximum Depth (Meters) DB1 DB2 DB3 DB4 DB5 DB Week Figure 3. Weekly mean maximum depth values per depth bin (DB1 = 4-20m, DB2 = 21-50m, DB3 = m, DB4 = m, DB5 = m, and DB6 = >200m) with standard deviation bars for an adult female harbor seal (03KOD03) in the northeastern waters off Kodiak Island, Alaska. Weeks 1 through 18 represent the dates March 30, 2003 through July 26,
112 Weekly Average Maximum Depth Distributions for Subadult (02KOD01) and adult (02KOD04, 02KOD07, 02KOD08) males 250 Depth (Meters) KOD01 02KOD04 02KOD07 02KOD Week Figure 4. Weekly mean maximum depth values (+/- std dev) for one subadult ( 02KOD01) and three adult (02KOD04, 02KOD07, 02KOD08) harbor seals monitored in the waters off northeastern Kodiak Island, Alaska. Weeks 1 through 18 represent the dates October 13, 2002 through February 15,
113 Opportunistic Aerial Sightings of Large Whales Within Steller Sea Lion Critical Habitat in the Kodiak Archipelago Kate Wynne and Briana Witteveen School of Fisheries and Ocean Science, University of Alaska Fairbanks, Kodiak, Alaska Introduction Kodiak Island waters support both resident and migratory populations of large cetaceans including fin whales (Balaenoptera physalus), humpback (Megaptera novaeangliae), gray (Eschrichtius robustus), and killer whales (Orcinus orca). Several large cetacean species were commercially harvested from Kodiak waters for shore-based and offshore processing as recently as 1937 (Reeves et al 1985) and pelagically in North Pacific waters as recently as 1965 (Mizroch et al 1999). Now protected following centuries of harvest, some of the Pacific whale stocks that feed in Alaskan waters appear to be rebounding (Calambokidis et al 1997, Zerbini in press). The Kodiak and western Gulf of Alaska waters are known to support substantial seasonal feeding aggregation of humpbacks (Waite et al. 1999, Witteveen 2003), fin (Mizroch et al 1999), and gray whales (Moore et al, in prep). Resident and transient killer whales have been documented feeding on fish and mammals in Kodiak waters (Matkin et al 1996). Fin and humpback whales can be found in Kodiak waters during winter months feeding on nearshore aggregations of herring, capelin, and other schooling fish (Zwiefelhofer, pers.comm.). Whales that feed in Kodiak waters consume species that are key prey for other consumers in the system, including Steller sea lions (Pitcher 1981,Sinclair and Zeppelin 2002). In the northern hemisphere, humpback diets consist primarily of small schooling fish species including capelin, smelts, herring, juvenile pollock, and other prey commonly found in Steller sea lion diets (Merrick et al 1997, Kenney et al 1997). Fin whales may target euphausiids and large zooplankton as prey (Moore et al. 2000) but are also known to feed extensively on capelin and other schooling fish (Kenney et al. 1997). Gray whales feed primarily on epibenthic zooplankton (Nerini 1984) but have been found feeding pelagically on capelin (N. Black, pers comm.). Killer whales seen in the Archipelago include both mammal-eating transients and fish-eating resident pods (Matkin et 1999, Hiese et al. 2003). Matkin (pers. comm.)has found that many resident pods are targeting salmon as primary prey in summer months. Many of these prey species are also consumed by Steller sea lion, sea birds, and piscivorous fish in Kodiak waters (this volume). Thus, seasonal and year-round feeding by large whales in Kodiak waters has the potential to directly reduce fish prey available for consumption by Steller sea lions or secondarily reduce the volume of the prey upon which those fish species feed. Whales are significant marine predators whose consumption of finfish has been estimated to exceed commercial fishery harvests in many ecosystems and which may compete with sea lions, seals, fish, and seabirds for prey (Kenney et al. 1997, Trites et al.1997). Estimating the abundance, distribution, and foraging ecology of these upper level consumers therefore is key to understanding their role as consumers and potential competitors of Steller sea lions in Kodiak waters. To understand the trophic interactions of these apex predators and their common prey source in Kodiak waters, researchers at UAF initiated the Gulf Apex Predator-prey (GAP) program of studies. As part of the GAP program, we monitored the seasonal presence and distribution of large whales in the Kodiak Archipelago through a series of repeated opportunistic aerial surveys. 105
114 Methods Standardized cetacean surveys are typically conducted using fixed wing aircraft or research vessels as platforms following line transect methodology (Carretta and Forney 1993, Barlow 1999, Buckland et al 2001, Waite et al 2002, Zerbini et al in press). Conducting repeated and rigorous shipboard or aerial surveys of the area in this manner would have been cost-prohibitive within scope of GAP. However, GAP conducted as series of pinniped surveys in the area that provided an opportunistic platform from which to monitor seasonal presence/absence of cetaceans. In this report, we summarize the seasonal and annual distribution of large whale species observed during these surveys. Because of their opportunistic nature, no effort was made to use these sightings to derive population estimates. Whale observations were recorded during two series of pinniped surveys conducted in the Kodiak Archipelago from June 2001 to June GAP personnel conducted monthly counts of Steller sea lion on 14 sites in the Archipelago from June 2001 to June 2004 (Wynne,this volume). In addition, Wynne collaborated with the Alaska Department of Fish and Game (ADFG) to conduct repetitive counts of harbor seals on 33 haulouts on the east and south side of Kodiak Island during August 2001 and 2002 (Small et al 2001). The area covered by these surveys falls primarily within designated Steller sea lion critical habitat (See Wynne, this volume). In all surveys, a Cessna 206 on floats was flown at an altitude of ft and speed of kn while transiting between harbor seal or Steller sea lion haulouts. All survey routes began in the City of Kodiak and proceeded south along the east coast of the island, transiting between haulouts on a systematic but not fixed course (FIG. 1). Harbor seal surveys extended to the head of most bays and ended at the south end of Kodiak Island. Steller sea lion surveys circumnavigated the Archipelago and covered waters further offshore. All cetacean sightings (defined here as groups of 1+ animals separated by more than 2-3 km) were noted along with their time and location. When time allowed, the plane diverted off the transect to confirm species identification and estimate the number of individual whales present. Whales were often but not always photographed. Survey timing and observer effort varied among surveys. Harbor seal surveys were scheduled to occur within 2.5 hrs of low tide, often started as early as 08:30 and were completed by 15:00. Steller sea lion surveys were scheduled to occur between 10:00 and 16:00, independent of tide stage. During harbor seal surveys, one observer and the pilot scanned opportunistically for blows and surfacing animals ahead of and on either side of the aircraft. During Steller sea lion surveys, the pilot and up to three observers scanned for whales. An approximate location (latitude/longitude) was recorded for each sighting based on GPS reading near the center of the group. Cetaceans were identified to species when possible or otherwise recorded as other ; a gross estimate of the number of individuals per group sighted was also recorded. The number of sightings and individuals recorded were summed by species, season, and year and approximate locations were plotted using ArcInfo. Seasons were defined as Winter (December- March), Spring (April-May), Summer (June-September), and Fall (October-November). This asymmetrical seasonal delineation is used throughout GAP studies and reflects local oceanographic patterns but may or may not affect whale distribution in the region. Due to variable observer effort and area coverage during each survey, the number of whales observed was not used to calculate density or abundance estimates. A relative measure of survey effort in each survey, survey hours (shr), was determined as the number of hours flown (over water) per survey regardless of the number of observers or whale sighting conditions. This was used to derive a relative index of sighting frequency (# sightings or groups encountered per shr) and whale density (# animals per shr) for four identified species (fin, humpback, gray, killer whales) and Other species (unidentified large cetacean) by season and year. The relative density of groups (# animals per sighting) was also calculated for the same species. 106
115 Results Aerial surveys were conducted on 45 days between 1 June 2001 and 1 June 2004 to count pinnipeds in the Kodiak archipelago (Wynne, this volume). On those surveys, approximately 175 hrs were flown over water, 41 hrs while on the harbor seal route and 134 hrs while on the Steller sea lion route (FIG. 1). The replicate harbor seal surveys conducted in August of 2001 and 2002 are responsible for the dominance (39.5%) of total effort in Summer01 and Summer02 (FIG. 2). Survey effort (hr) varied seasonally and annually (FIG. 2) and was used to determine the relative density of sightings per season and year (FIG. 3). A total of 322 whale sightings involving an estimated 2126 whales were recorded opportunistically during pinniped surveys from 1 June 2001 to 1 June 2004 (Table 1). Whales were distributed throughout the study area (Fig. 4) and a mean of 1.8 groups were seen per hour of survey effort. Although seen in every month and year surveyed, sightings were most frequent during spring and summer surveys (Fig. 5). Group size (# whales per sighting) varied by species (Fig. 6). More than half of the individual whales observed during surveys were gray whales (Table 1A) but fin and humpback whales, combined, accounted for 68.6% of total sightings (Table 1B). Gray whales Gray whales were seen most frequently and in greatest density (# animals per shr) between June and September but were observed in the study area at least once in every month of the year. Mean group size was greatest in summer and ranged annually from approximately 3.4 to 26.6 individuals (Fig. 6). In 2001 and 2002 a large feeding aggregation of gray whales was centered in the mouth of Ugak Bay (Fig. 7). Gray whales apparently moved out of this area in 2003 (fewer sightings and animals per shr). They had returned to the area in early spring 2004 at the end of this reporting period (Fig. 3A) and were seen feeding but in smaller aggregations (Figs. 3B, 6). Fin whales Fin whales were observed in every month of the year but were most frequently encountered during spring and summer months (Table 1). Mean group size ranged annually from approximately 2.3 to 4.2 individuals and was greatest during fall surveys (Fig. 6). The greatest number of sightings and individuals were observed along the west coast of Kodiak Island, including Uyak Bay (Fig. 8). Groups in this area often consisted of tightly associated individuals. Fin whales were also frequently observed in Kupreanof Straits and throughout Marmot Bay (Fig.8). Fin whales were rarely observed on the tracklines north of Afognak Island or along the eastern shore of Kodiak Island. Humpback whales Humpback whale groups were more broadly distributed along the survey routes (Fig. 9). Mean group size ranged annually from approximately 2.7 to 3.8 individuals and was greatest during fall surveys (Fig. 6). Winter feeding aggregations were noted at the head of several area bays where herring and capelin are known to spawn. No humpbacks were observed during February or March surveys. Annual shifts in distribution were noted and may have been associated with shifts in prey upon which whales were feeding. In 2001, large aggregations of humpbacks were seen north of Shuyak Island and southeast of Sitkalidak Island. In 2002, humpback sightings were of smaller groups that were more widely dispersed throughout the survey area (Fig. 9). In 2003, sightings were scarce near Shuyak Island and centered instead off eastern Kodiak. The 2004 results reported here reflect only January through May sightings but again include numerous sightings near Shuyak I (Fig. 9). Killer whales Killer whales were rarely encountered during opportunistic aerial surveys; three pods were observed during June pinniped surveys (Fig.10). One sighting was recorded in each year and group sizes were estimated to consist of 7, 20, and 25 individuals. One sighting (April 2004) was of a tightly associated group in resting formation (Matkin pers.comm.); others were more dispersed and apparently traveling. Other species 107
116 The Other whale category was assigned to sightings of large whales when the species could not be determined. Increased effort in later years to stay near whales long enough for identification likely accounts for the reduction of sightings in this category after 2001 (Fig. 3) Conclusions Large whales are among the apex predators found in Kodiak waters designated as Steller sea lion Critical Habitat. We documented the year-round presence of large whales in Kodiak waters, many in large feeding aggregations. The relative number, diversity, and persistence of whales in the near-coastal community demonstrate their significance as upper level consumers in an area where Steller sea lion numbers continue to decline. Prey species consumed by these whales elsewhere include fish upon which Steller sea lions feed and zooplankton that feed those fish species. To assess the potential for sympatric dietary overlap, GAP will continue these opportunistic surveys of whale distribution with dedicated and directed studies of prey and habitat use. We thank pilots Willie Hall (Kodiak Air) and Willie Folsom, Garrett Hosier, and Dean Andrew (Andrew Air) for their safe and skillful flights around the Kodiak Archipelago. We also thank Kathy Hough, Cathy Hegwer, and assorted others for spotting whales during long and arduous survey hours. Literature Cited Barlow, J Trackline detection probability for long-diving whales. Pg In GW Garner, SC Amstrup, JL Laake, BFJ Manly, LL McDonald, and DG Robertson eds. Marine mammal survey and assessment methods. AA Balkema, Rotterdam, The Netherlands. Buckland, S.T.,.DR. Anderson, K.P. Burnham, J.L. Laake, D.L. Borchers, and L. Thomas Introduction to distance sampling; Estimating abundance of biological populations. Oxford Univ Press, Oxford, UK Calamobokidis, J., G.H. Steiger, J.M. Straley, T. Quinn, L.M. Herman, S. Cerchio, D.R. Salden, M. Yamaguchi, F. Sato, J.R. Urbán, J. Jacobson, O. von Ziegesar, K.C. Balcomb, C.M. Gabriele, M.E. Dalheim, N. Higashi, S. Uchida, J.K.B. Ford, Y Miyamura, P.Ladron de Guevara, S. A. Mizroch, L. Schlender, and K. Rasmussen Abundance and population structure of humpback whales in the North Pacific basin. Final Contract Report 50ABNF to Southwest Fisheries Science Center, National Marine Fisheries Service, P.O. Box 271 La Jolla, CA pp. Carretta, J.V. and K.A. Forney Report of the two aerial surveys for marine mammals in California waters utilizing a DeHavilland Twin Otter aircraft. NOAA Tech Memo NMFS, NOAA TM-NMFS- SWFSC pp Dolphin, W.F Prey densities and foraging of humpback whales, Megaptera novaeangliae. Experentia 43(1987): Birkhauser Verlag Basel. Heise,K. L.G. Barrett-Lennard, E. Saulitis, C.Matkin, and David Bain Examining the evidence for killer whale predation on Steller sea lions in British Columbia and Alaska. Aq. Mamm. 29,3: Kenney, R.D., G.P. Scott, T.J. Thompson, and H.E. Winn Estimates of prey consumption and trophic impacts of cetaceans in the USA Northeast Continental Shelf system. J. Northw. Atl. Fish. Sci 22: Livingston, P.A Importance of predation by groundfish, marine mammals, and birds on walleye pollock Theragra chalcogramma and Pacific herring Clupea pallasi in the eastern Bering Sea. Mar. Ecol. Prog. Ser.102: Mizroch, SA, DW Rice, D. Zwiefelhofer, J. Waite, and W.L. Perryman Distribution and movements of fin whales in the North Pacific Ocean. In Prep. Moore, S.E., J.M. Waite, L.L. Mazzuca, and R.C. Hobbs Mysticete whale abundance and observations of prey associations on the central Bering Sea shelf. J. Cetacean Res. Manage. 2(3): Moore S., J. Grebmeier, J. Clement, K.Wynne, P. Gearin, and W. Perryman. In Prep. Gray whales southeast of Kodiak Island, Kodiak: a new feeding area? 108
117 Matkin, C.O., G. Ellis, E. Saulitis, L. Barrett-Lennard, and D. Matkin Killer whales of southern Alaska. North Gulf Oceanic Society, Homer, AK. 96pp. Merrick, R.L., T.R. Loughlin, and D.G. Calkins Diet diversity of Steller sea lions and their population decline in Alaska: a potential relationship. Can. J. Fish. Aquat. Sci. 54: Nerini, M A review of gray whale feeding ecology. pp In Jones, M.L., S.L. Swartz, S.L.. Leatherwood (eds). The gray whale Eschrichtius robustus. Academic Press, New York, NY Overholtz,W.J., S.A Murawski, and K.L. Foster Impact of predatory fish, marine mammals, and seabirds on the pelagic fish ecosystem of the northeastern USA. ICES Mar. Sci. Sym.193: Pitcher, K.W Prey of the Steller sea lion, Eumetopias jubatus, in the Gulf of Alaska. Fish. Bull. 79: Reeves, R.R., S. Leatherwood, S.A. Karl, and E.R. Yohe Whaling results at Akutan ( ) and Port Hobron ( ), Alaska. Rept. Int. Whal. Commn. 35: Saulitis, E., C. Matkin, L. Barrett-Lennard, K. Heise, and G. Ellis Foraging strategies of sympatric killer whale (Orcinus orca) populations in Prince William Sounds, Alaska. Mar. Mammal Sci 16(1): Sinclair, E.H. and T.K. Zeppelin Seasonal and spatial differences in diet in the western stock of Steller sea lions (Eumetopias jubatus). J. Mammal 83(4): Small, R.J., G.W. Pendleton, and K.M. Wynne Harbor seal population trends in the Ketchikan, Sitka, and Kodiak areas of Alaska, pp 8-30 in Harbor seal investigations in Alaska. Annual report, NOAA Grant NA87FX0300, ADFG, Anchorage, AK. 356pp. Waite, J.M., M.E. Dahlheim, R.C. Hobbs, S.A. Mizroch, O. vonziegesar-matkin, J.M. Straley, L.M. Herman, and J. Jacobsen Evidence of a feeding aggregation of humpback whales, Megaptera novaeangliae, around Kodiak Island, Alaska. Mar. Mammal Sci.15(1): Witteveen, B.H Abundance and feeding ecology of humpback whales Megaptera novaeangliae in Kodiak, Alaska. M.S. Thesis, University of Alaska Fairbanks Zerbini, A.N., P.R. Wade, and J. M. Waite. (in press) Abundance and Distribution of Fin, Humpback and Minke Whales from the Kenai Fjords to the Central Aleutian Islands, Alaska: Summer
118 Table 1. Number of animals (A) and number of sightings (B) recorded during opportunistic aerial pinniped surveys. Winter: Dec-Mar, Spring: Apr-May, Summer: June-Sept, and Fall: Oct-Nov. A. Number of animals Year Season Species Fin Humpback Gray Orca Other Winter Spring Summer Fall Total B. Number of sightings (groups) Species Fin Humpback Gray Orca Other Year Winter Season Spring Summer Fall Total
 40 35 30 25 20 15 10 5 0 Sum01 Opportunistic Whale Survey Effort June 2001-04 Fal01 Win02 Spr02 Sum02 Fal02 Win03 Spr03 Survey season Sum03 Fal03 HS route SLroute Win04")
119 Figure 1. Approximate routes flown during harbor seal and Steller sea lion aerial surveys in the Kodiak area from June Approx survey effort (SHr) Sum01 Opportunistic Whale Survey Effort June Fal01 Win02 Spr02 Sum02 Fal02 Win03 Spr03 Survey season Sum03 Fal03 HS route SLroute Win04 Spr04 Figure 2. Seasonal distribution of opportunistic whale sighting effort (shr) during harbor seal (HS) and Steller sea lion (SL) aerial surveys. (Win= Dec-Mar, Spr= Apr-May, Sum= June-Sept, and Fal= Oct-Nov) 111
120 A. Sighting (or group) density Number of Sightings per Survey Hour (shr) by Year Sightings per shr Fin Humpback Gray Orca Other Species B. Whale density Number of Animals per Survey Hour (shr) by Year Animals per shr Fin Humpback Gray Orca Other Species Figure 3. Annual relative density of whale sightings (A) and whale numbers (B) in the study area as determined by number recorded per opportunistic survey hour (shr). 112


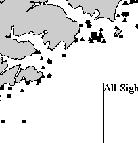
121 Figure 4. Distribution of all whale sightings recorded opportunistically during pinniped aerial surveys, by year June
122 A. Whale sightings 1.2 Number of Sightings per Survey Hour (shr) by Season Sightings per shr Winter Spring Summer Fall Fin Humpback Gray Orca Other Species B. Whale numbers Number of Animals per Survey Hour (shr) 14.0 Animals per shr Winter Spring Summer Fall Fin Humpback Gray Orca Other Species Figure 5. Seasonal relative density of whale sightings (A) and whale numbers (B) in the study area as determined by number recorded per opportunistic survey hour (shr). Winter: Dec-Mar, Spring: Apr-May, Summer: June-Sept, and Fall: Oct-Nov. 114
123 A. Seasonal Number of Animals per Sighting by Seasons 35.0 Animals per. Sighting Winter Spring Summer Fall Fin Humpback Gray Orca Other Species B. Annual Number of Animals per Sighting by Years Animals per Sighting Fin Humpback Gray Orca Other Species Figure 6. Seasonal and annual patterns in group size (# animals per sighting) by species. Winter: Dec- Mar, Spring: Apr-May, Summer: June-Sept, and Fall: Oct-Nov. 115


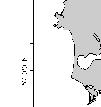


124 Ugak Bay Ugak Bay 116 A. B Figure 7. Distribution of gray whale sightings by season (A) and year (B), observed during opportunistic aerial surveys June


125 Marmot Bay Marmot Bay Uyak Bay Uyak Bay 117 A. B. Figure 8. Distribution of fin whale sightings by season (A) and year (B), observed during opportunistic aerial surveys June


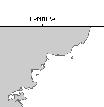


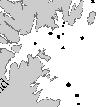


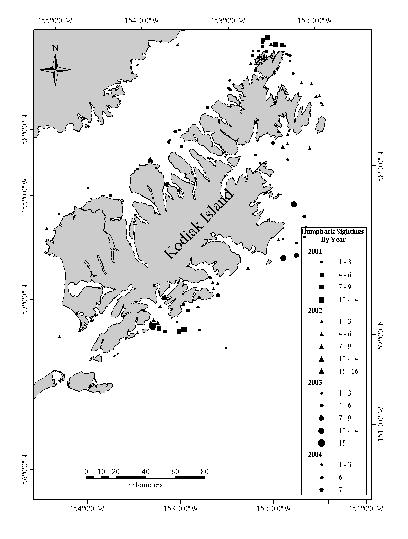


126 Shuyak I. Shuyak I. Sitkalidak I. 118 Sitkalidak I. A. B Figure 9. Distribution of humpback whale sightings by season (A) and year (B), observed during opportunistic aerial surveys June


127 119 A. B. Figure 10. Distribution of killer whale (orca) sightings by season (A) and year (B), observed during opportunistic aerial surveys June
128 Summer distribution and habitat characteristics of fin whales and humpback whales in Steller sea lion critical habitat off northeast Kodiak Island, Lisa S. Baraff 1, Robert J. Foy 2 and Kate M. Wynne 3 1 School of Fisheries and Ocean Sciences, University of Alaska Fairbanks, Fairbanks, Alaska 2 University of Alaska Fairbanks, Fishery Industrial Technology Center, Kodiak, Alaska 3 University of Alaska Fairbanks Marine Advisory Program, Kodiak, Alaska Introduction Large baleen whales are considered significant components of marine ecosystems (Bowen 1997; Katona and Whitehead 1988). Substantial removals of whales through commercial whaling presumably impacted community structure and prey biomass in the Southern Ocean, Bering Sea and northern North Pacific Ocean (Laws 1985; Merrick 1997; Springer et al. 2003). Fin whales (Balaenoptera physalus) in northeastern U.S. continental shelf waters were more recently estimated to consume 58,000 mt of herring, sand lance and mackerel annually (Overholtz et al. 1991), with a possible total prey consumption of 646,000 mt (Hain et al. 1992). Estimated annual removal of fishery resources by all cetaceans in this ecosystem was 1/3 to 3 times that of commercial fisheries (Kenney et al. 1997). A paucity of distribution, habitat, and prey data for most cetaceans, however, precludes clearly defining their ecological roles. Most available distribution, prey, and habitat data are antiquated, having been derived through commercial whaling operations that ended in the North Pacific in 1976 and Kodiak nearshore waters in 1937 (Kawamura 1982; Nasu 1966; Nasu 1972; Nemoto 1959; Nemoto and Kawamura 1977; Uda 1954). Fin whale and humpback whale (Megaptera novaeangliae) stocks were heavily exploited and dramatically reduced by whaling in the northern North Pacific, warranting designation as endangered under the U.S. Endangered Species Act of 1973 (Perry et al. 1999). They were the dominant species taken along the Alaska coast (Nemoto 1959) and were primary targets of shore-based whaling out of Port Hobron (off eastern Kodiak Island) between 1926 and 1937 (Reeves et al. 1985). Few directed surveys for large whales occurred in this region since commercial whaling ended (Brueggeman et al. 1987; Brueggeman et al. 1988; Rice and Wolman 1982; Stewart et al. 1987). Systematic surveys for baleen whales were only recently conducted in the Bering Sea (Moore et al. 2000) and abundance and distribution of baleen whales between the Kenai Peninsula and eastern Aleutian Islands were documented coincident to killer whale (Orcinus orca) surveys in 2001 and 2002 (Zerbini et al. 2003). Prior to the study reported here, opportunistic data indicated that Kodiak waters presently support significant numbers of fin and humpback whales (Waite et al. 1999; K. Wynne this volume; D. Zwiefelhofer unpublished data). The need for whales to forage frequently and efficiently leads to nonrandom distribution and aggregations in areas of high prey concentrations; shifts in whale distribution could indicate ecosystem changes and fluctuations in prey biomass and availability (Hain et al. 1992; Katona and Whitehead 1988; Krieger and Wing 1986; Moore and DeMaster 1998; Moore et al. 2000; Selzer and Payne 1988). Climatic regime shifts occurred in the North Pacific in 1977 and, possibly, 1989 and 1998 (Anderson and Piatt 1999; Hare and Mantua 2000; Hollowed et al. 2001; McFarlane et al. 2000). Forage availability and species composition fluctuated in Kodiak waters during these periods. Shrimp, capelin, and herring abundance declined while gadid and flatfish biomass increased in the 1980s (Anderson and Piatt 1999; Mueter and Norcross 2000). Surveys in Marmot and Chiniak Bays, Kodiak Island, in 2001 and 2002 showed a resurgence of pandalid shrimp and osmerids (eulachon and capelin), with catches reaching levels not seen since the early 1980s (Anderson 2003). Fin and humpback whales killed during North Pacific whaling operations consumed primarily herring, walleye pollock, capelin, smelt, 120
129 and euphausiids (Nemoto 1959; Nemoto 1963; Nemoto and Kasuya 1965; Nemoto and Kawamura 1977; Thompson 1940); all could be important prey items today. Northeast Kodiak Island baleen whale distribution and habitat use may reflect local fluctuations in prey abundance, type, and availability. Cetacean distribution is indirectly influenced by physical conditions that concentrate prey (Croll et al. 1998; Davis et al. 2002; Kellogg 1928; Selzer and Payne 1988). Prime whaling grounds (and presumably, feeding areas) in the North Pacific corresponded with oceanic fronts, eddies, and topographic upwelling (Nasu 1966; Nasu 1972; Nemoto 1959; Uda 1954). Recent studies compared distribution to depth and bottom topography (Baumgartner 1997; Davis et al. 1998; Forcada et al. 1996; Hui 1979; Moore and DeMaster 1998; Raum-Suryan and Harvey 1998; Selzer and Payne 1988; Waring et al. 2001; Woodley and Gaskin 1996), sea surface temperature and thermal structure (Baumgartner et al. 2000; Brown and Winn 1989; Davis et al. 2002; Moses and Finn 1997; Woodley and Gaskin 1996) and zooplankton and prey availability (Baumgartner et al. 2000; Fiedler et al. 1998; Foerster and Thompson 1985; Griffen 1997; Murison and Gaskin 1989; Woodley and Gaskin 1996). These studies involved a range of species from the Gulf of Mexico, Gulf of Maine, Mediterranean Sea, Northeast Atlantic, coastal California and Washington State, and the Chukchi and Beaufort Seas. Similar analyses are lacking for the Gulf of Alaska. Environmental parameters that influence cetacean distribution, whether directly or indirectly, are key to defining important feeding habitats for cetaceans. Proposed recovery actions for humpback and fin whale populations consider the identification and characterization of important habitats primary objectives toward the goal of population recovery (Anonymous 1991; Anonymous 1999). Based on whaling catch locations, Marmot and Chiniak Bays off northeast Kodiak Island were historically important foraging areas (Reeves et al. 1985) and appear to be such today. Most of this area also falls within Steller sea lion (Eumetopias jubatus) critical habitat (50 CFR ), including 20 nm buffer zones and seasonal 3 nm - 20 nm federal fishery closure zones around Marmot Island, Long Island, and Cape Chiniak (50 CFR ) (Fig. 1). The region is, therefore, central to the University of Alaska Fairbanks ecosystem-based Gulf Apex Predator-prey study (GAP), of which this project is a part. The goals of this study were to describe 2002 and 2003 summer (May-September) distribution of fin whales and humpback whales in Marmot and Chiniak Bays, to measure (or derive) several habitat characteristics that may influence distribution, to assess which (if any) of these characteristics, or suite of characteristics, are significant descriptors or correlates of whale distribution, and to evaluate habitat partitioning among the whale species. Environmental variables included bottom depth and slope, thermocline depth, pycnocline depth, stratification, and zooplankton composition and depth-averaged density. The ecological role of baleen whales in this area can be best evaluated once distribution, physical and biological habitat characteristics and use are defined. Methods Data Collection The study area encompassed roughly 2000 km 2 in Marmot and Chiniak Bays (Fig. 1). Research platforms in 2002 included weekly whale-focused surveys and monthly 3-day hydroacoustic prey surveys. For the weekly surveys, the study area was divided into four comparably sized zones that could be surveyed in one day each.track lines were not predetermined, but traversed a zone in a manner that afforded full coverage. A zone was considered fully surveyed if the entire area had been within visual range of the 2-3 observers by day s end. Weather frequently prevented full zone coverage; partial coverage was common. Whales were detected visually while cruising at a speed of approximately 18 km/hr. All sighting data were recorded directly at whale locations. Sighting, environmental and navigational data were recorded using a GPS and Nobeltec Navigation Software. Line transect (passing mode) protocol (Buckland et al. 2001) was used for whale sightings during 2002 hydroacoustic prey surveys. Observations were made by a single observer located on the flying bridge, 4.88 m above the water, and at an average vessel speed of 11 km/hr. Angle to sighting was determined using a fix-mounted angle board. Fujinon 7x50 binoculars, equipped with ocular reticles, were 121
130 used to determine distance (in nm) to sightings. These data were later used to derive sighting locations. Observations were conducted during all daylight hours, while on transect, except during poor visibility (thick fog, heavy rain), sea states greater than Beaufort 5, or while at prey sampling stations. The vessel did not break effort to approach whales. In 2003, bi-weekly surveys followed east-west oriented transect lines spaced at 5 km intervals across the study area. Line-transect methods similar to that in 2002 were employed. Observations were made by 2-3 observers in the vessel s wheelhouse, at an eye-height of 3.73 m above the water, and at an average speed of 16 km/hr. A field computer, with GPS interface and WinCruz data entry program (developed by Robert Holland, SWFSC), was used to record sighting and environmental data, and continuous location updates. Sighting effort was broken (i.e., closing mode) to approach whales for species confirmation and to sample at whale locations (see below). Watch was maintained, and sighting data recorded while transiting to, from, or between transect lines. Temperature and salinity profiles were obtained using a Sea-Bird Electronics Sea Cat-19 Plus CTD (conductivity-temperature-depth) profiler. The CTD was deployed to approximately 1 m off the bottom at a rate of 1 m/sec. In 2002, sampling occurred only at whale locations. In areas of whale aggregations, sampling occurred central to the aggregation. In 2003, sampling occurred at whale locations, plus at predetermined sampling stations during each survey. Station locations were selected using systematic sampling techniques where the start point (station 1) was randomly chosen for each survey and subsequent stations were then spaced at 10 nm increments. This spread sampling effort throughout the study area and will allow for comparison of samples taken directly at whales to those collected at random locations. Beginning in late July 2002, vertical zooplankton tows were made adjacent to whales presumed to be feeding. Tows were made at individual sightings or in the center of aggregations. Sampling equipment included a 0.75 m diameter ring net of mm mesh, with a 5:1 length to mouth ratio and an 11.4 cm collecting bucket, weighted with approximately kg. The mesh size was selected to maximize the possibility of capturing euphausiids and copepodite stage V copepods, which were known prey of fin and humpback whales (Horwood 1987; Kawamura 1982; Nemoto 1959; Nemoto 1963; Nemoto 1973; Nemoto and Kasuya 1965; Nemoto and Kawamura 1977; Thompson 1940). Angle of the line during deployment and retrieval was recorded using a protractor and the amount of line deployed adjusted to compensate for angles off vertical. Rate of retrieval was 1 m/sec (Allen 1972). Depth of deployment was to the bottom to maximize the possibility of capturing zooplankton from throughout the water column, especially diel migrating euphausiids (Allen 1972; Brinton 1967; Kendall et al. 1980). Samples were preserved in 1 liter bottles, with 10% formalin buffered with seawater. In 2003, zooplankton were collected at whale locations and at the pre-determined stations described above. Sampling protocol was otherwise the same as in Zooplankton were collected throughout the study period (May-September). Data Processing Only on effort sighting data were included. Off effort data, omitted from analyses, were collected when visibility was compromised by fog, rain, darkness, or sea states greater than Beaufort 5, while at sampling stations, or whenever conditions precluded maintaining watch. A sighting refers to a recorded group of whales, not the number of individuals within the group, unless group size = 1. When not recorded directly at whale locations, sighting positions were derived using angle, distance to sighting (based on height of eye and reticle), vessel location, and geofunc.xla Excel functions (Jeff Laake, NMML/NMFS/NOAA). Sighting data were entered into a GIS (ArcView 3.2, ESRI, Redlands, CA) for mapping and analysis. Nearest Neighbor Analysis in the Animal Movement Analysis Extension (Hooge and Eichenlaub 1997) was used to test for spatial randomness of whale distribution. An R value < 1 indicates a clustered pattern tendency, R = 1 indicates random distribution, R > 1 indicates uniformity. 122
131 CTD downcast data were processed using SeaBird Data Processing software. These data are being used to derive mean water column temperature, salinity and density, thermocline and pycnocline depths (depth of maximum temperature and density gradients, respectively), and the stratification parameter. The stratification parameter is defined by υ = ( ρ ρ ) gzdz; ρ = h ρdz, where h is h h depth of the CTD cast, ρ is density, g is gravity (-9.8 m/s 2 ), z is depth, and dz symbolizes change in depth (Ross and Larson 2003; Simpson et al. 1977). This estimates the energy (Joules/ m 3 ) needed to redistribute a water mass of depth h by complete vertical mixing (Fiedler et al. 1998; Simpson et al. 1977). Zooplankton samples were being processed to determine taxonomic composition and depth averaged density (organisms/m 3 ). Samples in 2002 were sub-sampled using 20 ml aliquots until total copepod count equaled 100 individuals. A Folsom splitter was used to divide 2003 samples until roughly 100 copepods remain. Large organisms were removed and enumerated prior to sub-sampling. Identification and enumeration of sub-samples were extrapolated to the entire sample. Copepods and euphausiids were being identified to at least the genus level. Copepod total length is measured to size class (< 1.0 mm, mm, mm, mm, > 6.0 mm). Euphausiid furcilia were counted, but not identified to species. Mysids, decapod shrimp and crab zoea are identified to at least family level. Other taxa are identified at either family or genus level (e.g., cladocerans, amphipods, gastropods), while some are only grossly identified (e.g., cnidarians, chaetegnaths, barnacle nauplii). For analytical purposes, euphausiids were later categorized as eggs, non-adults, which included furcilia, juveniles, calyptopes and nauplii, and adults, and calanoid copepods were grouped by genus. Zooplankton data were linked to sampling station information, and total counts, counts by taxonomic groups, and by size class per volume of water sampled were calculated. The volume of water sampled was calculated using a trigonometric function based on angle of net deployment, area of net mouth opening and length of line deployed. Bathymetric data were obtained from the National Geodetic Data Center (GEODAS) and from the Alaska Earthquake Information Center, University of Alaska Fairbanks. The latter data were compiled by Scientific Fisheries, Inc. using NGDC/NOS combined data, and by TIME/NOAA for use in tsunami predictions. These bathymetric XYZ point files were clipped, compiled and merged using ArcView 3.2 and 3-D and Spatial Analyst extensions. Triangulated Irregular Networks (TINS) were generated then converted to grids (250 m cell size), from which depths and degrees of slope were derived and applied to sighting locations. The slope command in Spatial Analyst estimates the maximum rate of change from each cell to a 3x3 cell neighborhood. Depth classes (50 m increments, m) and slope classes (2 degree increments, 0-18 degrees) were created to describe percent of the respective classes available in the study area compared to usage as determined by whale locations. Survey effort per depth and slope class was calculated and sightings (by species) per km effort per class were derived. Survey area boundaries and depth and slope class availability were based on actual area covered and derived separately for 2002 and Area was determined by delineating buffers around survey tracklines at a distance within which whales would be sighted and recorded during the respective surveys. Buffers of 2 nm were used for 2002 and 2003 systematic surveys and a 1 nm buffer was used for 2002 whale-focused surveys. Buffers were combined by year; areas of repeated coverage and overlap were only counted once, so that area calculations were inclusive, not cumulative. Depth and slope data relative to sightings were analyzed for inter-year and inter-species differences using ANOVA (alpha = 0.05). Sightings data from the weekly and monthly 2002 surveys were combined for these analyses. Data for the remaining variables are still being processed, so have not been statistically analyzed. Results 123
132 Table 1 summarizes monthly and total kilometers surveyed on effort in 2002 and Total coverage was comparable in both years, despite different survey methods, with km surveyed in 2002 and km surveyed in 2003 (Figs. 2 and 3). Line-transect effort was relatively consistent throughout the seven surveys in 2003, ranging from km to km, out of a total transect length of km. Survey areas are listed in Table 2 and depicted in Figures 4 and 5. Coverage was more consistent in 2003 than in 2002 where the difference between the largest and smallest area surveyed was km 2, compared to km 2 in Area surveyed in 2003 was also consistently larger than in 2002, with overall study areas of km 2 and km 2, respectively. Because of variability in area surveyed in 2002, particularly the omission of the northeast segment of the area in May and September, only June-August data were considered in inter-year whale-habitat comparisons. Intra-year analyses include May and September data. Although fin whales and humpback whales were the focus of this study, all cetaceans encountered were recorded, including Dall s porpoise (Phocoenoides dalli), harbor porpoise (Phocoena phocoena), killer whales (Orcinus orca), gray whales (Eschrichtius robustus), and unidentified balaenopterids. The latter were likely either fin whales or humpback whales that could not be identified to species due to distance or weather constraints. Monthly sightings by species and year are summarized in Tables 3 and 4. Total sightings included 170 fin whales and 128 humpbacks in 2002 and 130 fin whales and 79 humpbacks in In both years, humpback sightings were lowest in May and September and highest July and August, while fin whale sightings were highest in July and remained high in September when humpback sightings diminished. These numbers do not include known re-sightings within a given survey area, but may include individuals re-sighted in different locations of the study area or during different survey periods. Table 5 shows fin whale and humpback sightings corrected for effort. Sighting rates were lower in Nearest neighbor analyses, conducted separately by year and species, indicated highly clustered (non-random) distribution in all cases. In 2002, R-values for humpbacks and fin whales were E -6 and E -6, respectively. Values in 2003 were E -5 and E -6 for humpbacks and fin whales, respectively. Humpbacks appeared more dispersed in 2003 than in 2002, which may account for the slightly higher R-value that year. Figures 6 and 7 depict 2002 and 2003 sighting locations. Mean depth distribution of 2002 humpbacks (97.9 m) and fin whales (128.2 m) differed significantly (p < ). Mean depths of 2003 humpbacks (109.6 m) and fin whales (124.4 m) were also significantly different (p = 0.03), although by a smaller margin. June August humpback mean depths in 2002 (96.3 m) and 2003 (115.5 m) were significantly different (p = 0.025), but did not differ (p = 0.146) when May and September data were included. There was no significant difference between 2002 (129.5 m) and 2003 (125.0 m) fin whale mean depth distribution (p = 0.454) (Fig. 8). There was a significant difference in mean slope distribution for fin whales in 2002 (2.08) and 2003 (3.07) (p = ), for 2002 (1.61) and 2003 (2.45) humpbacks (p = 0.009), and for 2002 humpbacks (1.57) and fin whales (2.02) (p = 0.027). Slope distribution did not differ significantly (p = 0.22) between 2003 humpbacks (2.41) and fin whales (2.86) (Fig. 9). Percent of sightings in each of the depth classes (e.g., usage) was compared to availability of each class in the respective study areas for June-August (Fig. 10). Percent availability was comparable in 2002 and 2003, but the patterns of usage varied. Whale distribution was not proportional to available depth classes. Fin whales were sighted in the 0-50 m depth class disproportionate to availability (2% of fin whales versus 40% of the study area). Fin whales followed the same general pattern both years, but with a much sharper peak in the m depth class in 2003, offset by lower usage in the m and m classes. In 2002, humpback sightings by depth class approximated that available in the 124
133 study area. This was not the case in 2003 when far fewer humpbacks were sighted in the 0-50 m depth class and a greater proportion were in the m and m depth classes. Figure 11 shows sightings by species and year corrected for km of effort within each depth class. Fin whales generally frequented deeper depth classes, with comparable sighting rates in the m depth class in 2002 and Humpback sightings in this depth class were also consistent across years, as was the difference between fin whale and humpback sighting rates. In 2002, sighting frequency of fin whales in the m depth class was 3.6 times greater than in 2003 and twice that of humpbacks in In 2003, fin whales and humpbacks were seen in this depth class in equal proportions. When corrected for effort, fin whales in 2002 were sighted with the greatest frequency in depths of m and m. Such corrections did not similarly affect frequency by depth class for Humpback sighting frequency in the 0 50 m class was 14 times and 5.5 times that of fin whales in 2002 and 2003, respectively. The sighting frequency of humpbacks in this depth class in 2002 was three times that in Humpback sighting frequency in the m depth class was 4.7 times lower in 2003 than in There were no sightings of either species in depths greater than 250 m. Approximately 65% of the 2002 and 2003 study areas fall within the 0-2 degree slope class. Usage in both years closely mirrored that available, although there was a shift in usage from shallower to steeper slopes in 2003 (Fig. 12). Whale distribution by slope class, corrected for effort, showed a different pattern (Fig. 13). The most striking difference is between years; both fin whales and humpbacks were sighted in higher slope classes in 2003 than in Sighting frequency for both species decreased twofold in the 0-2 degree and 2-4 degree classes while increasing two-fold in the 4-6 degree slope class. In 2002, humpbacks were not sighted in slopes greater than 6-8 degrees, and fin whales in slopes greater than 8-10 degrees. However, in 2003, fin whales and humpbacks were sighted in slopes of and degrees, respectively. The former was based on only one sighting in a class in which there was little effort. In 2002, 86 CTD casts were made in the vicinity of whales, 40 with fin whales, 40 with humpbacks and 6 with both species. Sixteen zooplankton tows were made, 8 with fin whales, 7 with humpbacks and 1 with both (Table 6). In 2003, sampling occurred both with and without whales (Tables 7). There were 85 CTDs and 89 zooplankton tows at stations absent of whales and 51 CTDs and 53 zooplankton tows in the vicinity of whales. A breakdown of tows by species is shown in Table 8. There were 29 CTD and 29 zooplankton tows with fin whales, 16 CTDs and 18 zooplankton tows with humpbacks and 4 CTDs and 5 zooplankton tows with both species. These data are currently being analyzed. Discussion The overall distribution pattern of fin whales and humpbacks off northeast Kodiak Island in 2002 and 2003 was similar to that seen historically, as well as in more recent surveys of the region (Brueggeman et al. 1989; Reeves et al. 1985; Zerbini et al. 2003). Current locations suggest that this area has either continued as an important summertime foraging area since at least the days of coastal whaling, or has been re-established in more recent years. Catch positions documented by Reeves et al. (1985) for the Port Hobron whale fishery show the majority of fin whales were taken in Marmot and Chiniak Bays between June and August and highest humpback takes there were in July and August. It was not surprising that fin and humpback whales were non-randomly distributed in Marmot and Chiniak Bays since cetaceans are frequently aggregated, presumably in areas of concentrated prey (Katona and Whitehead 1988; Kenney and Winn 1986; Krieger and Wing 1986; Moore et al. 2002; Payne et al. 1990; Piatt et al. 1989; Simard and Lavoie 1999). Localized distribution within the bays fluctuated from 2002 to 2003 (e.g., absence of inshore humpbacks, more dispersed humpbacks, more humpbacks than fin whales in outer Marmot Bay in 2003). This may account for differences in depth and slope distribution between years. Although some differences could be artifacts of inconsistent levels of effort, it is quite plausible that areas of concentration did change from one year to the next. Zerbini et al. (2003) attributed local differences in humpback and fin 125
134 whale distribution around Kodiak in 2001 and 2002 to possible shifts in prey concentrations. Changes in spatial distribution relative to prey have been well documented in other areas (Krieger and Wing 1986; Payne et al. 1990). Bottom topography appears a significant correlate to cetacean distribution (Baumgartner 1997; Baumgartner et al. 2000; Cañadas et al. 2002; Davis et al. 1998; Davis et al. 2002; Woodley and Gaskin 1996). Although analyses are preliminary, data from this study suggest that fin whales and humpback whales may have distinctive depth preferences. Moore et al. (2002) noted a clear association between fin whales and the 200 m depth contour in the central-eastern Bering Sea. Fin whales were sighted on both the Middle Shelf (0-50 m) and Outer Shelf (>100 m) domains of the central-eastern and southeastern Bering Sea, yet sighting rates were more than two-fold higher in the latter. Humpbacks were more closely associated with the 50 m depth contour. Depth distributions of fin whales off the northeastern U.S. and eastern Canada were comparable to that in Marmot and Chiniak Bays. Woodley and Gaskin (1996) found fin whales in the Grand Manan Basin, Bay of Fundy at mean depths of ± 48.2 m, nearly identical to our findings. Those on the northeastern continental shelf were common along the 200 m depth contour, but the mean depth was shallower at ± 235 m (Hain et al. 1992). Fin whales are widely distributed throughout the world s oceans and do not strictly inhabit shallow waters. In the Mediterranean Sea, fin whales are frequently off the continental slope in depths from 400 to 2800 m (Forcada et al. 1996). Although there were some differences in distribution relative to slope, the significance in our study is less clear at this time and warrants further investigation and analysis. Variability in bottom topography has been assessed using several different methods, including contour index (Hui 1979), meters of change per kilometer (Baumgartner 1997), as well as slope (Moses and Finn 1997; Raum-Suryan and Harvey 1998). It may be useful to evaluate the data using these different methods. Fin whales and humpbacks are frequently sympatric, yet often maintain discrete feeding aggregations. Our data suggest some species-specific spatial segregation between areas of concentration (Figures 4 and 5). This was also noted by Brueggeman et al. (1989) and Zerbini et al. (2003) for western Gulf of Alaska and eastern Aleutian Islands humpback whales and fin whales. Thompson (1940) noticed that fin whales and humpback whales killed off eastern Kodiak had different prey preferences despite being taken in relative proximity to one another. Differing feeding strategies could also affect distribution, even when species are feeding on the same prey (Whitehead and Carlson 1988). The data described here are preliminary and incomplete, so few conclusions regarding correlations between environmental variables and fin whale and humpback whale distribution can be drawn at this time. Completion of zooplankton and oceanographic data processing will allow for more thorough analyses of potentially significant correlates of cetacean distribution in Marmot and Chiniak Bays, including inter-specific differences. Multivariate and logistic regression analyses that simultaneously address the suite of habitat variables bathymetric, oceanographic and biological collected and derived during this study should provide a more complete picture of influential habitat characteristics for the largest apex predators in the Marmot and Chiniak Bays study area. Acknowledgments Thanks to D. Kubiak of the Mythos and J. Stinson and crew of the F/V Alaskan for making the field work possible, to A. Banks, K. Brenner, A. Haas, M. B. Loewen, and B. Witteveen for logistical and field assistance, to D. Smart, F. Huettmann, and D. Verbyla for GIS help, and to E. Suleimani of the Alaska Earthquake Information Center for bathymetric data. Thanks also to R. Holland (SWFSC) for providing and modifying the WinCruz data entry program and to A. Zerbini for graciously helping with data extraction methods. Research was conducted under NMFS Scientific Research Permit numbers and and IACUC permit number Literature Cited 126
135 Allen, GM Notes on sampling amphipods and euphausiids in the North Pacific Ocean. Trans. Am. Fish. Soc. 101(4): Anderson, PJ and Piatt, JF Community reorganization in the Gulf of Alaska following ocean climate regime shift. Mar. Ecol. Prog. Ser. 189: Anderson, PJ Marine community dynamics in the Gulf of Alaska under historical and future climate regimes. Marine Science in the North Pacific: Science for Resource Dependent Communities; Joint Scientific Symposium: Exxon Valdez Oil Spill Trustee Council, GLOBEC- Northeast Pacific Program, Steller Sea Lion Investigations, North Pacific Research Board, North Pacific Marine Research Institute, Pollock Conservation Cooperative Studies. Abstracts January 2003, Anchorage, Alaska. Anonymous Final recovery plan for the humpback whale, Megaptera novaeangliae. Silver Spring, MD: U.S. Dep. Commer., NOAA, NMFS. 105 p. Anonymous Draft recovery plan for the fin whale, Balaenoptera physalus, and sei whale, Balaenoptera borealis. Silver Spring, MD: F/OPR, NMFS, NOAA. 68 p. Baumgartner, MF The distribution of Risso's dolphin (Grampus griseus) with respect to the physiography of the northern Gulf of Mexico. Marine Mammal Science 13(4): Baumgartner, MF, Mullin, KD, May, LN, and Leming, TD Cetacean habitats in the northern Gulf of Mexico. Fish. Bull. 99(2): Bowen, WD The role of marine mammals in aquatic ecosystems. Mar. Ecol. Prog. Ser. 158: Brinton, E Vertical migration and avoidance capability of euphausiids in the California Current. Limnology and Oceanography 12: Brown, CW and Winn, HE Relationship between the distribution pattern of right whales, Eubalaena glacialis, and satellite-derived sea surface thermal structure in the Great South Channel. Continental Shelf Research 9(3): Brueggemn, JJ, Green, GA, Grotefendt, RA, and Chapman, D, G Aerial surveys of endangered cetaceans and other marine mammals in the northwestern Gulf of Alaska and southeastern Bering Sea. U.S. Dep. Commer., NOAA, OCSEAP Final Report 61(1989): Brueggeman, JJ, Green, GA, Grotefendt, RA, Tressler, RW, and Chapman, D, G Marine mammal habitat use in the North Aleutian Basin, St. George Basin, and Gulf of Alaska. In: Thorsteinson, LK, editor. Proceedings of the Gulf of Alaska, Cook Inlet, and North Aleutian Basin information update meeting. Anchorage, Alaska: Ocean Assessments Division, Alaska Office/NOS/NOAA/U.S. Dep. Commer. p Brueggeman, JJ, Green, GA, Tressler, RW, and Chapman, D, G Shipboard surveys of endangered cetaceans in the northwestern Gulf of Alaska. U.S. Dep. Commer., NOAA, OCSEAP Final Report 61(1989): Cañadas, A, Sagarminaga, R, and García-Tiscar, S Cetacean distribution related with depth and slope in the Mediterranean waters off southern Spain. Deep-Sea Research I 49((2002)): Croll, DA, Tershy, BR, Hewitt, RP, Demer, D, Fiedler, PC, Smith, S, Armstrong, W, Popp, JM, Kiekhefer, T, Lopez, VR and others An integrated approach to the foraging ecology of marine birds and mammals. Deep-Sea Research II 45(1998): Davis, RW, Fargion, GS, May, N, Leming, TD, Baumgartner, MF, Evans, WE, Hansen, LJ, and Mullin, KD Physical habitat of cetaceans along the continental slope in the north-central and western Gulf of Mexico. Marine Mammal Science 14(3): Davis, RW, Ortega-Ortiz, JG, Ribic, CA, Evans, WE, Biggs, DC, Ressler, PH, Cady, RB, Leben, RR, Mullin, KD, and Wursig, B Cetacean habitat in the northern oceanic Gulf of Mexico. Deep- Sea Research I 49(2002): Fiedler, PC, Reilly, SB, Hewitt, RP, Demer, D, Philbrick, VA, Smith, S, Armstrong, W, Croll, DA, Tershy, BR, and Mate, BR Blue whale habitat and prey in the California Channel Islands. Deep- Sea Research II 45(1998):
136 Foerster, JW and Thompson, PM Plankton and whaling ground dynamics in the Denmark Strait. Bulletin of Marine Science 37(2): Forcada, J, Aguilar, A, Hammond, PS, Pastor, X, and Aguilar, R Distribution and abundance of fin whales (Balaenoptera physalus) in the western Mediterranean Sea during the summer. Journal of the Zoological Society of London 238: Griffen, RB Relationships between odontocete distributions and zooplankton community structure along the southern edge of Georges Bank. J. Northw. Atl. Fish. Sci. 22: Hain, JHW, J., RM, Kenney, RD, and Winn, HE The fin whale, Balaenoptera physalus, in waters of the Northeastern United States continental shelf. Rep. int. Whal. Commn 42: Hare, SR and Mantua, NJ Empirical evidence for North Pacific regime shifts in 1977 and Progress in Oceanography 47(2000): Hollowed, AB, Hare, SR, and Wooster, WS Pacific Basin climate variability and patterns of Northeast Pacific marine fish production. Progress in Oceanography 49(2001): Hooge, PN and Eichenlaub, B Animal movement extension to ArcView. Version 1.1. Anchorage, AK, U.S.A.: Alaska Biological Sciences Center, U.S. Geological Survey. Horwood, JW The sei whale: population biology, ecology and management. New York: Croom Helm. 375 p. Hui, CA Undersea topography and distribution of dolphins of the genus Delphinus in the Southern California Bight. Journal of Mammalogy 60(3): Katona, S and Whitehead, H Are Cetacea ecologically important? In: Barnes, M, editor. Oceanography and Marine Biology Annual Review. Aberdeen: Aberdeen University Press. p Kawamura, A Food habits and prey distributions of three rorqual species in the North Pacific Ocean. Sci. Rep. Whales Res. Inst. 84: Kellogg, R What is known of the migrations of some of the whalebone whales. Annual Report Smithsonian Institution: Kendall, AWJ, Dunn, JR, Wolotira, RJJ, Bowerman, JHJ, Dey, DB, Matarese, AC, and Munk, JE Zooplankton, including ichthyoplankton and decapod larvae, of the Kodiak Shelf. NWAFC/NMFS/U.S. Dep. Commer. Report nr NWAFC Processed Report pp. Kenney, RD and Winn, HE Cetacean high-use habitats of the northeast United States continental shelf. Fishery Bulletin 84(2): Krieger, KJ and Wing, BL Hydroacoustic monitoring of prey to determine humpback whale movements. Auke Bay, Alaska: NWAFC, NMFS, NOAA, U.S. Department of Commerce. Report nr NOAA Technical Memorandum NMFS F/NWC-98. Laws, RM The ecology of the southern ocean. Am. Sci. 73: McFarlane, GA, King, JR, and Beamish, RJ Have there been recent changes in climate? Ask the fish. Progress in Oceanography 47(2000): Merrick, RL Current and historical roles of apex predators in the Bering Sea ecosystem. J. Northw. Atl. Fish. Sci. 22: Moore, SE and DeMaster, DP Cetacean habitats in the Alaskan Arctic. J. Northw. Atl. Fish. Sci. 22: Moore, SE, Waite, JM, Friday, NA, and Honkalehto, T Cetacean distribution and relative abundance on the central-eastern and the southeastern Bering Sea shelf with reference to oceanographic domains. Progress in Oceanography 55: Moore, SE, Waite, JM, Mazzuca, LL, and Hobbs, RC Mysticete whale abundance and observations of prey associations on the central Bering Sea shelf. J. Cetacean Res. Manage. 2(3): Moses, E and Finn, JT Using Geographic Information Systems to predict North Atlantic right whale (Eubalaena glacialis) habitat. J. Northw. Atl. Fish. Sci. 22: Mueter, FJ and Norcross, BL Changes in species composition of the demersal fish community in nearshore waters of Kodiak Islland, Alaska. Can. J. Fish. Aquat. Sci. 57: Murison, LD and Gaskin, DE The distribution of right whales and zooplankton in the Bay of Fundy, Canada. Can. J. Zool. 67:
137 Nasu, K Fishery oceanographic study on the baleen whaling grounds. Sci. Rep. Whales Res. Inst. 20: Nasu, K Movement of baleen whales in relation to hydrographic conditions in the northern part of the North Pacific Ocean and Bering Sea. In: Kelley, EJ, editor. Oceanography of the Bering Sea with emphasis on renewable resources. Fairbanks, Alaska: Institute of Marine Science, University of Alaska Fairbanks. p Nemoto, T Food of baleen whales with reference to whale movements. Sci. Rep. Whales Res. Inst. 14: Nemoto, T Some aspects of the distribution of Calanus cristatus and C. plumchris in the Bering and its neighbouring waters, with reference to the feeding of baleen whales. Sci. Rep. Whales Res. Inst. 17: Nemoto, T Feeding pattern of baleen whales in the ocean. In: Steele, JH, editor. Marine Food Chains. Edinburgh: Oliver and Boyd. p Nemoto, T and Kasuya, T Foods of baleen whales in the Gulf of Alaska of the North Pacific. Sci. Rep. Whales Res. Inst. 19: Nemoto, T and Kawamura, A Characteristics of food habits and distribution of baleen whales with special reference to the abundance of North Pacific sei and Bryde's whales. Rep. int. Whal. Commn Special Issue 1: Overholtz, WJ, Murawski, SA, and Foster, KL Impact of predatory fish, marine mammals, and seabirds on the pelagic ecosystem of the northeastern U.S.A. ICES Mar. Sci. Symp. 193: Payne, PM, Wiley, DN, Young, SB, Pittman, S, Clapham, PJ, and Jossi, JW Recent fluctuations in the abundance of baleen whales in the southern Gulf of Maine in relation to changes in selected prey. Fish. Bull., U.S. 88: Perry, SL, DeMaster, DP, and Silber, GK The great whales: history and status of six species listed as endangered under the U.S. Endangered Species Act of Marine Fisheries Review 61(1):1-74. Piatt, JF, Methven, DA, Burger, AE, McLagan, RL, Mercer, V, and Creelman, E Baleen whales and their prey in a coastal environment. Can. J. Zool. 67: Raum-Suryan, KL and Harvey, JT Distribution and abundance of and habitat use by harbor porpoise, Phoceona phocoena, off the northern San Juan Islands, Washington. Fish. Bull. 96(4): Reeves, RR, Leatherwood, S, Karl, SA, and Yohe, ER Whaling results at Akutan ( ) and Port Hobron ( ), Alaska. Rep. int. Whal. Commn 35: Rice, DW and Wolman, AA Whale census in the Gulf of Alaska June to August Rep. int. Whal. Commn 32: Ross, JRM and Larson, RJ Influence of water column stratification on the depth distribution of pelagic juvenile rockfishes off central California. CalCOFI Rep. 44: Selzer, LA and Payne, PM The distribution of white-sided (Lagenorhynchus acutus) and common dolphins (Delphinus delphis) vs. environmental features of the continental shelf of the northeastern United States. Marine Mammal Science 4(2): Simard, Y and Lavoie, D The rich krill aggregation of the Saguenay - St. Lawrence Marine Park; hydroacoustic and geostatistical biomass estimates, structure, variability, and significance for whales. Can. J. Fish. Aquat. Sci. 56: Simpson, JH, Hughes, DG, and Morris, NCG The relation of seasonal stratification to the tidal mixing on the continental shelf. Deep-Sea Research I 24(suppl.): Springer, AM, Estes, JA, van Vliet, GB, Williams, TM, Doak, DF, Danner, EM, Forney, KA, and Pfister, B Sequential megafaunal collapse in the North Pacific Ocean: An ongoing legacy of industrial whaling? Proceedings of the National Academy of Sciences 100(21): Stewart, BS, Karl, SA, Yochem, PK, Leatherwood, S, and Laake, JL Aerial surveys for cetaceans in the former Akutan, Alaska, whaling grounds. Arctic 40(1): Thompson, RJ Analysis of stomach contents of whales taken during the years 1937 and 1938 from the North Pacific [Master of Science]. Seattle: University of Washington. 82 p. 129
138 Uda, M Studies of the relation between the whaling grounds and the hydrological conditions. Sci. Rep. Whales Res. Inst. 9: Waite, JM, Dalheim, ME, Hobbs, RC, and Mizroch, SA Evidence of a feeding aggregation of humpback whales (Megaptera novaeangliae) around Kodiak Island, Alaska. Marine Mammal Science 15(1): Waring, GT, Hamazaki, T, Sheehan, D, Wood, G, and Baker, S Characterization of beaked whale (Ziphiidae) and sperm whale (Physeter macrocephalus) summer habitat in shelf-edge and deeper waters off the northeast U.S. Marine Mammal Science 17(4): Whitehead, H and Carlson, C Social behavior of feeding finback whales off Newfoundland: comparisons with the sympatric humpback whale. Can. J. Zool. 66: Woodley, TH and Gaskin, DE Environmental characteristics of North Atlantic right and fin whale habitat in the lower Bay of Fundy, Canada. Can. J. Zool. 74: Zerbini, AN, Wade, PR, and Waite, JM Abundance and distribution of fin, humpback and Minke whales from the Kenai Fjords to the Central Aleutian Islands, Alaska: summer Paper SC/55/O9 presented to the International Whaling Commission Scientific Committee:14 pp. 130
139 Table 1. Kilometers surveyed on-effort by month and year May June July August September Total km Table 2. Survey coverage area (km 2 ) by sampling period and year May June July August September June-August May-September Table on-effort sightings by species and month Fin Whales Humpback Whales Unidentified Balaenopterids Dall's Porpoise Harbor Porpoise Killer Whales Minke Whales May June July August September Totals Unidentified balaenopterids were either fin whales or humpbacks, but could not be approached for ID confirmation 131
140 Table on effort sightings by species and month Fin Whales Humpback Whales Unidentified Balaenopterids Dall's Porpoise Harbor Porpoise Gray Whales May June July August September Totals Unidentified balaenopterids were either fin whales or humpbacks, but could not be approached for ID confirmation Table 5. Sightings per kilometer of effort by species, month and year. Fin whales/km effort Humpbacks/ km effort May June July August September Totals Table 6. Summary of 2002 sampling stations by month and species CTD Stations With Whales Zooplankton Stations With Whales Month with Bp with Mn with Bp & Mn Total with Bp with Mn with Bp & Mn Total June July August September Totals * Bp = fin whale (Balaenoptera physalus); Mn = humpback whale (Megaptera novaeangliae) * All sampling occurred in the presence of whales 132
141 Table 7. Summary of 2003 sampling stations with and without whales present CTD Stations Zooplankton Stations Month with whales without whales Total with whales without whales Total May June July August September Totals * 5 CTD casts failed due to low batteries; 1 was redone Table 8. Summary of 2003 sampling stations with whales, by month and species CTD Stations With Whales Zooplankton Stations With Whales Month with Bp with Mn with Bp & Mn with Bp with Mn with Bp & Mn May June July August September Totals * 2 CTD stations and 1 zooplankton station listed with whales were with Dall's porpoise only * Bp = fin whale (Balaenoptera physalus); Mn = humpback whale (Megaptera novaeangliae) 133
142 AFOGNAK ISLAND MARMOT ISLAND MARMOT BAY STUDY AREA BOUNDARY 20 nm BUFFER ZONES AREA ENLARGED KODIAK ISLAND LONG ISLAND CHINIAK BAY CAPE CHINIAK Figure 1. Study area, with 20 nautical mile Steller sea lion buffer zones around the Long Island haulout and Figure 1. Marmot Study area, Island with rookery. 20 nautical The mile study Steller area sea boundary lion buffer depicted zones encompasses around the Long the Island cumulative haulout areas and included Marmot Island in 2002 rookery. and 2003 The surveys. study area boundary depicted encompasses the cumulative areas included in 2002 and 2003 surveys. 134
143 Figure on-effort survey tracks. Thick, gray lines are hydroacoustic prey survey transects. Thin, black lines are whalefocused Figure survey tracklines survey coverage area. Figure on effort track lines. Included are parallel transect lines and diversions off transect for sightings and transiting to, from, and between Figure 5. transect 2003 survey lines. coverage area. 135
 and humpback (B) sightings, May-September.")
144 Figure on-effort fin whale (A) and humpback (B) sightings, May-September. Figure on-effort fin whale (A) and humpback (B) sightings, May-September. 136
145 Mean Depth (m) Fin whales Humpbacks Figure 8. Mean depth distribution ( ± Standard Error) by species and year (June-August) Mean Slope (degrees) Fin whales Humpbacks Figure 9. Mean slope distribution ( ± Standard Error) by species and year (June-August). 137
146 Fin Whale Sightings Humpback Sightings Study Area 50 Percent Slope Class (degrees) Fin Whales Humpback Sightings Study Area 50 Percent Figure 10. Relative use and availability Slope of Class depth (degrees) classes by year (June-August). Shown are percent of fin whale and humpback sightings by depth class and percent composition of the study areas by depth class. 138
147 Sightings/km effort Fin Whales 2003 Fin Whales 2002 Humpbacks 2003 Humpbacks Slope Class (degrees) Figure 11. Sightings per kilometer of effort per slope class, by species and year (June-August). 139
148 Fin Whale Sightings Humpback Sightings Study Area 50 Percent Slope Class (degrees) Fin Whales Humpback Sightings Study Area 50 Percent Slope Class (degrees) Figure 12. Relative usage and availability of slope classes by year (June-August). Shown are percent of fin whale and humpback sightings by slope class and percent composition of the study areas by slope class. 140
149 An Apparent Feeding Aggregation of Humpback Whales (Megaptera novaeangliae) Near Kodiak Island, Alaska: Historical and Current Abundance Estimation Briana H. Witteveen 1, Kate M. Wynne 1, and Terry J. Quinn II 2 1 University of Alaska Fairbanks, School of Fisheries and Ocean Sciences, Kodiak, AK 2 University of Alaska Fairbanks, School of Fisheries and Ocean Sciences, Juneau, AK Introduction Photo-identification has been used for many years as a mark-recapture tool for estimating humpback whale populations and tracking their movements (Baker et al. 1986, 1992; Perry et al. 1990; von Ziegesar 1992; Calambokidis et al. 1993). Photo-identification studies have resulted in moderate understanding of humpback whale stocks in the North Pacific and have proven that, though they may converge on winter breeding grounds, humpback whales are isolated into regional aggregations during feeding seasons with very little exchange between them. Known feeding aggregations in the North Pacific are found along the California/ Oregon/Washington coast and southeastern Alaska (Calambokidis et al. 1993; Straley 1994). A group of feeding humpback whales (Megaptera novaeangliae) is found year-round in the Kodiak Archipelago in the western Gulf of Alaska, with a peak in sightings occurring between June and October (Fig. 1) (Waite et al. 1999; Zwiefelhofer unpub. data). These whales are currently assigned to the Central North Pacific (CNP) stock of humpback whales by the National Marine Fisheries Service (NMFS), though no directed research has been conducted on this population (Angliss et al. 2001). Previous research on humpback whales around Kodiak Island has occurred opportunistically during killer whale (Orcinus orca) line transect surveys in the early 1990 s (Waite et al. 1999). This research indicated that Kodiak Island humpback whales may be a homogeneous feeding aggregation separate from other known feeding aggregations in Alaskan waters, including southeast Alaska and Prince William Sound. However, until directed research solidifies opportunistic results the understanding of the stock structure of North Pacific humpback whales remains incomplete, making need for directed research efforts in this region critical to management. Stock separation is a concern for managers due to an increase in fisheries interactions, gear entanglement, and a growing whale watching industry in Alaskan waters. Management concerns in the Kodiak Island area also stem from the need to monitor recovery rates of the population. Large-scale commercial whaling occurred on Kodiak Island between 1926 and 1937, significantly reducing the number of humpback whales in the area (Williams S. Lagen Collection unpub. data, University of Washington). All stocks of humpback whales diminished by commercial whaling are believed to be increasing, but data are inadequate to assess the rate of increase (Angliss et al. 2001). The purpose of this paper is to give results from a study to assess humpback whale numbers in Kodiak that began in This study estimated abundance for a portion of eastern Kodiak Island humpback whales based on mark-recapture, photo-identification studies conducted in 2001 and Estimates of pre-whaling and immediate post-whaling populations within the study area are also constructed using a delay-difference population model (Quinn and Deriso 1999). 141
150 Methods Study area For logistic reasons, the study area was limited to the waters of eastern Kodiak Island, including Chiniak and Marmot Bays (Fig.1). Kodiak Island is part of the Kodiak Archipelago and is located approximately 30 miles from the Alaskan mainland in the Gulf of Alaska. Vessel surveys and field data Individual whales were identified from photographs of the black and white pigment patterns and other natural markings on the ventral surface of their tail flukes (Katona et al.1979). Photographs were taken during vessel surveys with a 35 mm camera with 300 mm lens and black and white 3200 ASA speed film exposed at 800 ASA. Photographs of calves were not used in the analysis, due to the tendency of the pattern on the flukes of some calves to change prior to maturity. In addition to photographs, data collected included the date, time, latitude and longitude, nearest headland, and general behavior of the whale. Information about the number of whales in the group and the role (mother, calf, adult) of each whale was documented for each encounter. Study and sample periods Vessel surveys were conducted during study periods in June through September of 2001 and 2002 from the R/V Soundwave, an 8.2 m bowpicker. For each year, the study periods were divided into seven-day sample periods with the exception of the final sample periods in both years, which were shorter (Table 1). The 2001 study period consisted of 10 total sample periods beginning June 13 th and ending September 14 th (Table 1). Surveys took place for 18 days and a total of about 74 hours. Effort in 2002 consisted of 15 sample periods beginning June 4 th and ending September 17 th. Surveys took place on 38 days for a total of about 224 hours (Table 1). Survey effort was increased in 2002 primarily due to vessel availability. Inclement weather conditions such as fog and high winds limited survey effort in both years. Current abundance estimation An estimate of current humpback whale abundance within the study area was made using the Schnabel maximum likelihood estimator (MLE) (Seber 1982). Two critical assumptions of the Schnabel MLE are that the population is closed and that all whales have equal capture probabilities at each sample period. The Schnabel MLE was only applied to 14 sample periods in 2002 because no whales were seen in the shortened 15th sample period. Table 2 summarizes model input. Small sample sizes in 2001 prevented estimation of abundance. A parametric bootstrap was performed to 1000 replicates to obtain 95% confidence intervals for estimated abundance ˆN Alternatives to the closed population Schnabel MLE were also explored. A Jolly-Seber estimate was calculated for the 2002 data. This method of estimation assumes an open population and allows for recruitment and mortality to occur within the study period. In addition, robust estimators from program MARK, including the Pollock robust model that combined results from 2001 and 2002, were also explored (White and Burnham 1999). Historical abundance estimation Estimates of eastern Kodiak Island humpback whales within the study area were calculated for pre-whaling (pristine) and immediate post-whaling populations following an Allen-Clark delay-difference model (Quinn and Deriso 1999). The following equation, adapted from Breiwick et al. (1981), was used to calculate historical abundances, which were dependent upon the current abundance estimate and historical catch: N t+ 1 = ( N t Ct )(1 M ) + Rt (1) where N t = population size at the beginning of year t 142
151 where Ct = catch in year t M = natural mortality rate R t = rt N t τ is the gross recruitment between the beginning of year t and t +1 τ = lag time assumed for population response. The recruitment rate was assumed to be a density-dependent function, according to the equation: N t τ rt = M + ( 1 )( r M ) (2) N o r = recruitment rate in year t t N 0 = initial population size (pristine population size prior to commercial exploitation) (r-m) = net recruitment rate. Currently, there are no estimates of net recruitment for humpback whale populations in the North Pacific. Therefore, the value of net recruitment was set equal to 0.04, which is equal to the general cetacean maximum productivity rate defined by Wade and Angliss (1997). The value of M was taken as one minus survival rate. A survival rate of 0.96 came from the estimated survival rate for humpback whales in the North Pacific (Mizroch et al. in press). The values of r followed from the fact that the net recruitment rate is equal to r minus M. The value of r was thus set equal to 0.08 in order to achieve a net recruitment rate of 0.04 given an M of The value of τ was set equal to five years, as per the age of average sexual maturity in humpback whales (Chittleborough 1958, 1959; Clapham and Mayo 1990). The values for C t were taken from the William S. Lagen collection at the University of Washington. The collection contains catch history, including date, year, and number of kills for humpback whales harvested out of the Port Hobron whaling station in Kodiak, Alaska (Fig. 2). Locations of most kills are given in the collection, but are very general and typically only account for approximate bearing and distance offshore in which the whale was harvested. The whaling grounds encompassed most of eastern Kodiak Island; an area approximately four times that of the study area (Fig. 2). As a result, values of Ct were divided by four to account for the size difference between whaling grounds and the study area, assuming random harvest throughout the grounds. Initial population size, ˆN 0, was estimated by first entering a trial value for ˆN 0 into equation 2 and projecting the population forward to The estimate for ˆN 0 was the value that resulted in ˆN 2002 corresponding to the MLE, given values of C t, R t, and M. The initial population size applies to the years 1920 through 1925 and is assumed to represent the carrying capacity prior to commercial exploitation. Once a value of ˆN 0 was found, population size at any subsequent time period could be estimated. Thus, immediate post-exploitation abundance, ˆN 1938, was easily found by use of this method. The values of ˆN 0 and ˆN 1938 were dependent on ˆN 2002, therefore confidence intervals for each followed from a parametric bootstrap in which ˆN 0 and ˆN 1938 were estimated based on the ˆN 2002 values from the previous 1,000 bootstrap replicates Sensitivity study of historical estimation to model parameters A sensitivity study of the r and M parameters in the delay-difference model was performed in order to determine which parameter was the most influential in the final estimation of historical population sizes. Changing the value of each of the parameters and re-running the model tested the sensitivity of the model to each parameter. New values of M and r were used to reflect both higher and lower values than 143
152 the baseline model. The two parameters were tested independently from one another. Values of M used came from the 95% confidence intervals of survival from Mizroch et al. (in press), which equaled 0.94 and Therefore values of M were 0.02 and No confidence intervals were available for r, so values were set at 0.06 and 0.10 to reflect both lower and higher rates of recruitment. An additional scenario was examined in which r and M were both set equal to 0.04 to represent a situation in which net recruitment was zero. A final scenario set net recruitment equal to 0.10 between 1980 and 1990 inclusively to reflect a period of increased productivity (Baker and Herman 1987; Calambokidis et al. 1997). Sensitivity study of historical estimation to catch numbers A sensitivity study of the historical catch (C t ) in the delay-difference model was performed in order to determine how influential catch was in the final estimation of historical abundance. To test the sensitivity of the model to catch, catch numbers were left as given values as well as divided by two to represent scenarios in which catch within the study area comprised either all or one half of the total number of humpback whale kills. Results were compared to the base model in which catch numbers were divided by four. Results Vessel surveys Vessel surveys in 2001 resulted in 68 sightings of humpback whales. The 68 sightings produced fluke photographs of 31 unique adult whales that were used in the estimation of abundance (Table 3). Excluded from analysis were sightings of calves or animals for which no fluke photograph was obtained. Adult whales were sighted in all months surveyed in Vessel surveys in 2002 resulted in 148 sightings of humpback whales (Table 3). As in 2001, some sighted whales were calves or animals with no associated fluke photograph. Thus, 2002 vessel survey data resulted in fluke photographs of 71 individual whales that were used in analysis. Adult whales were sighted in all months surveyed in Current abundance estimation The Schnabel MLE of abundance, N 2002, was 157 animals (CV 18%) with a 95% confidence interval of (114, 241) (Fig. 3). Estimated parameters in the Jolly-Seber method, such as capture probability and survival, were not biologically realistic (i.e. survival over 100%). Thus estimates of abundance from the Jolly-Seber method are not reported. Robust models produced highly unreasonable results, including negative estimates of abundance and capture probability, due to low sample sizes. Therefore, estimates from robust models are also not reported. Program CAPTURE was used to evaluate the degree of heterogeneity in the 2002 sighting data (Rexstad and Burnham 1992). CAPTURE extends the Schnabel experimental design by applying sighting histories to increasingly complicated models in which the probability of capture varies with time, behavior, and heterogeneity. The program then recommends models that best represent the input data. Two of the top four models suggested by CAPTURE included heterogeneity as a factor in estimation, though the top recommended model did not. Thus, program output suggested that heterogeneity may be present to some extent. Historical abundance estimation The delay difference model estimated the pre-whaling humpback whale abundance at 343 (CV 3%) animals within the study area given the value of ˆN 2002 equal to 157 (Fig.3). The 95% confidence interval was (331, 376). The model estimated post-whaling abundance, ˆN 1938, as 27 (CV 42%) animals, with a confidence interval of (14, 61). Sensitivity study of historical estimation to model parameters 144
153 Pristine abundance was estimated at 341 and 373 when M was equal to 0.02 and 0.06 respectively. ˆN 1938 equaled 5 and 72 under the same parameterization (Figure 4). Pristine abundance was estimated at 392 and 371 when r was set equal to 0.06 and 0.10, respectively. ˆN 1938 was equal to 67 and 8 under the same parameterization. During the 1980 scenario pristine abundance was estimated at 332 and ˆN 1938 was equal to 16 (Figure 4). Similar patterns of population growth and decay were seen for all values of both M and r. Sensitivity study of historical estimation to catch numbers When historical catch numbers were divided in half, representing a scenario in which one half of humpback whale kills occurred within the study area, pristine abundance was estimated at 645 and abundance in 1938 was estimated at 11. When catch numbers were not altered and 100% of the historical catch was assumed to occur within the study area, N 0 was estimated at 1258, while N 1938 was estimated at -11 (Fig. 4). Discussion Current abundance estimation Estimated abundance for the Kodiak Island humpback whale population, within the study area, 157 animals, had a precise CV of about 18%. However, the model may have not met at least two of its assumptions; closure and equal probability of capture. A violation to the closure assumption stemmed from the limitation of the study area. The study area was defined based on historical accounts of humpback whale occurrence and vessel accessibility from the city of Kodiak and did not incorporate all areas around Kodiak Island in which humpback whales may feed. Thus, this study estimated only a proportion of the whales that may be part of a much larger feeding aggregation. The whales in the study area may belong to a feeding aggregation that utilizes waters not only around Kodiak Island, but waters throughout the western Gulf of Alaska as well. Whales may have migrated into and out of the study area throughout the study period, as humpback whales have been previously observed throughout the Kodiak Archipelago. The amount of movement that may have occurred into and out of the study area cannot be estimated without photo-identification effort in other high use areas around the island. One survey of the entire east coast of Kodiak Island in September 2002 sighted 67 individual whales outside of the study area, of which only two whales had been previously sighted in the study area within the study period (B. Witteveen, unpubl. data). This would suggest some very limited movement between the whales within the study area and other feeding whales around Kodiak Island, but data were too few to draw conclusions about the degree of violation to the closure assumption within the study area. Despite other areas of high use by humpback whales and slight evidence for movement out of the study area, the assumption of closure was probably justified due to the fact that only a single year of sighting histories was examined. However, if the closure assumption was violated to a high degree, abundance could be overestimated (Seber 1982). The assumption of equal probability of capture within each sampling period may not be satisfied. The Schnabel MLE allows for time-varying capture probabilities, meaning capture probability was equal for all animals at each time period, but not, necessarily, over all time periods. An equal capture probability for all whales at each sample period is highly unlikely. Problems with model assumptions such as these may be rectified in the future as effort continues and sample size is increased. Additional research will further clarify habitat usage by humpback whales within the Kodiak Island study area and the degree of exchange between these whales and feeding humpback whales in other regions of western Alaska. This would allow for more advanced models that 145
154 examine closure assumptions and heterogeneity in p to be utilized (Pollock et al. 1990; White and Burnham 1999). Historical abundance estimation The estimation of the historical populations of humpback whales was dependent on the estimate of current abundance. A negative bias associated with the current estimate would lead to underestimation of the historical estimates. However, the estimated carrying capacity was affected more by the whaling removals and choice of parameters r and M. Sensitivity study results show the delay-difference model was highly dependent on the values of M and r. Changing each value by a few percent causes changes in estimates of abundance throughout the time scale by means of changes in net recruitment to the population. In cases when r > M, the population will continue to increase until carrying capacity is reached. When r < M, the population will decrease. The mortality parameter seems to exert more influence on the model, causing larger variations in estimates from the baseline (Fig. 4). In most scenarios examined here, parameters were kept constant throughout the time period. In reality, recruitment and mortality rates have significant annual variation and are not likely to remain constant throughout the time period. The delay-difference model is deterministic and does not allow for variations in these parameters over time when, in reality, variations over a long time period, such as the one represented here, are likely to occur. Notably, the scenario that does allow for some variation in the parameters over time, the 1980 scenario, estimates abundances that are the most similar to the base model. The values for M and net recruitment used in this model were taken from large-scale humpback whale research projects and are not specific to the Kodiak region. Using new values of M and r based on the Kodiak Island population would result in an improved assessment of historical population size and growth, but no data currently exist for such values to be estimated. Therefore the values of M, r, net recruitment, and subsequently estimates of the historical population, are provisional. Historical abundance here was estimated only within the study area though humpback whale kills occurred throughout the east side of Kodiak. It is likely that historical abundance within the study area would be overestimated if catch had not been altered to account for the size of the study area in relation to the whaling grounds because results show that the delay difference model is highly sensitive to changes in catch numbers (Figure 4). Applying all of the humpback whale kills to the study area results in a negative abundance in 1938 indicating a complete depletion of the population and showing the impracticality of not adjusting catch numbers. Specific information about kill location would allow for a more accurate proportion of catch to be applied and would result in a more realistic account of historical abundance within the study area. Reeves et al. (1985) gives a rough distribution of Port Hobron humpback whale kills based on the general locations given in the William S. Lagen collection. Examination of this distribution supports a one-quarter proportioned catch within the study area. The most conservative estimate of local abundance within the study area assumed that the study area comprises one quarter of the whaling grounds. Applying that same proportion to the historical catch numbers resulted in 343 (CV 3%) whales as the best estimate of historical abundance within the study area given the current level of data. The total population utilizing the entire Kodiak area is clearly greater than that of the study area. Depending on the annual utilization of the study area, the population could be just slightly larger than that in the study area to several times the estimated population. The whales in the study area may belong to a feeding aggregation that utilizes waters not only around Kodiak Island, but waters throughout the western Gulf of Alaska as well. Further research is needed to accurately define the boundaries of feeding humpback whales in the Kodiak Island study area and in western Alaska in general. Acknowledgements 146
155 The authors are indebted to a number of individuals whose assistance was essential to this project. Janice M. Straley, Dr. Robert J. Foy, and Dr. Brendan P. Kelly offered insight and guidance. Chris Gabriele of Glacier Bay National Park and John Calambokidis of Cascadia Research shared their experience and suggestions and Lisa Baraff assisted in data collection. Financial support for this project was provided by the Rasmuson Fisheries Research Center and NOAA Grant #NA16FX1270 to University of Alaska Gulf Apex Predator-Prey Project. All research was conducted until provisions of NMFS Scientific Research Permit Literature Cited Angliss, R.P., D.P. DeMaster, and A. Lopez Alaska Marine Mammal Stock Assessments, U.S. Department of Commerce, NOAA Technical Memorandum NMFS-AFSC pp. Baker, C.S. and L.M. Herman Alternative population estimates of humpback whales (Megaptera novaeangliae) in Hawaiian waters. Canadian Journal of Zoology 65: Baker, C.S., L.M. Herman, A. Perry, W.S. Lawton, J.M. Straley, A.A. Wolman, G. D. Kaufman, H.E. Winn, J.D. Hall, J.M. Reinke, and J. Ostman Migratory movement and population structure of humpback whales (Megaptera novaeangliae) in the central and eastern North Pacific. Marine Ecology Progress Series 31: Baker, C.S., J.M. Straley, and A. Perry Population characteristics of individually identified humpback whales in southeastern Alaska summer and fall Fish Bulletin 90: Breiwick, J.M., E.D. Mitchell, and D.G. Chapman Estimated initial population size of the Bering Sea stock of bowhead whales, Balaena mysticetus: An iterative method. United States Fishery Bulletin 78: Calambokidis, J., G.H. Steiger, and J.R. Evenson Photographic identification and abundance estimates of humpback whales off California in Final report N0ABNF to the Southwest Fisheries Science Center, National Marine Fisheries Service, P.O. Box 271 La Jolla, CA. 67 pp. Calamobokidis, J., G.H. Steiger, J.M. Straley, T. Quinn, L.M. Herman, S. Cerchio, D.R. Salden, M. Yamaguchi, F. Sato, J.R. Urbán, J. Jacobson, O. von Ziegesar, K.C. Balcomb, C.M. Gabriele, M.E. Dalheim, N. Higashi, S. Uchida, J.K.B. Ford, Y Miyamura, P.Ladron de Guevara, S. A. Mizroch, L. Schlender, and K. Rasmussen Abundance and population structure of humpback whales in the North Pacific basin. Final Contract Report 50ABNF to Southwest Fisheries Science Center, National Marine Fisheries Service, P.O. Box 271 La Jolla, CA pp. Chittleborough, R.G The breeding cycle of the female humpback whale, Megaptera nodosa. Austalian Journal of Marine and Freshwater Research 9: Chittleborough, R.G Determination of age in the humpback whale, Megaptera nodosa (Bonnaterre). Australian Journal Of Marine and Freshwater Research 10: Clapham, P.J., and C.A. Mayo Reproduction of humpback whales (Megaptera novaeangliae) observed in the Gulf of Maine. International Whaling Commission Special Issue 12: Katona, S., P. Baxter, O. Brazier, S. Kraus, J. Perkins, and H. Whitehead Identification of humpback whales by fluke photographs. Pages in: H.E. Winn and B.L. Olla, eds. Behavior or Marine Animals, Vol. 3. Plenum Press, New York, NY. Mizroch, S.A., L.M. Herman, J.M. Straley, D. Glockner-Ferrari, C. Jurasz, J.D. Darling, S. Cerchio, C.M. Gabriele, D.R. Salden and O. von Ziegesar. In press. Estimating the adult survival rate of Central North Pacific humpback whales. Perry, A., C.S. Baker, and L.M. Herman Population characteristics of individually identified humpback whales in the central and eastern North Pacific: a summary and critique. Paper SC/A88/ID25 International Whaling Commission Special Issue 12:
156 Pollock, K.H., J.D. Nichols, C. Brownie, and J.E. Hines Statistical inferences for capture-recapture experiments. Wildlife Monograph pp. Quinn, T.J., II, and R.B. Deriso Quantitative Fish Dynamics. Oxford University Press, New York. Reeves, R.R., S. Leatherwood, S.A. Karl, and E.R. Yohe Whaling results at Akutan ( ) and Port Hobron ( ), Alaska. Paper SC/36/O Report of the International Whaling Commission 35: Rexstad, E. and K.Burnham User s Guide for Interactive Program CAPTURE. 30pp. Seber, G.A.F The Estimation of Animal Abundance and Related Parameters, 2 nd Edition. Griffin, London. Straley, J Seasonal characteristics of humpback whales (Megaptera novaeangliae) in southeastern Alaska. Thesis, University of Alaska, Fairbanks. 121pp. von Ziegesar, O A catalogue of Prince William Sound humpback whales identified by fluke photographs between the years 1977 and Unpublished report to the North Gulf Ocean Society, PO Box 15244, Homer AK Wade, P.R., and R. Angliss Guidelines for assessing marine mammal stocks: repot of the GAMMS workshop April 3-5, 1996, Seattle Washington. U.S. Department of Commerce, NOAA Technical Memorandum NMFS-OPR pp. Waite, J. M., M.E. Dahlheim, R.C. Hobbs, and S.A. Mizroch Evidence of a feeding aggregation of humpback whales (Megaptera novaeangliae) around Kodiak Island, Alaska. Marine Mammal Science 15: White, G.C. and K.P. Burnham Program MARK: Survival estimation from populations of marked animals. Bird Study 46:
157 Table 1. Start and end dates and effort for the 2001 and 2002 sample periods for humpback whale photoidentification vessel surveys. Sample Period Period Start Date Period End Date Year # of days sampled # of hours sampled Period Start Date Period End Date # of days sampled # of hours sampled 1 11-Jun 17-Jun Jun 9-Jun Jun 24-Jun Jun 16-Jun Jun 1-Jul Jun 23-Jun Jul 8-Jul Jul 7-Jul Jul 15-Jul Jul 14-Jul Jul 22-Jul Jul 21-Jul Jul 29-Jul Jul 28-Jul Jul 5-Aug Jul 4-Aug Sep 9-Sep Aug 11-Aug Sep 14-Sep Aug 18-Aug Aug 25-Aug Aug 1-Sep Sep 8-Sep Sep 15-Sep Sep 17-Sep Total
158 Table 2. Schnabel unconditional MLE model input and results of abundance estimate. Schnabel MLE was applied to 2002 Kodiak Island humpback whale sightings only. i n m M Sum: s: 14 r: 71 n = the size of the ith sample m = the number of marked animals in the ith sample M = the number of marked animals just prior to the ith sample s = the total number of samples r = the total number of marked animals at the end of the experiement. 150
159 Table 3. Number of sightings and the number of flukes photographed by study period. Photographs were collected during humpback whale vessel surveys conducted in 2001 and Year Sample Period # of sightings (adults only) # of flukes photographed # of sightings (adults only) # of flukes photographed Total Number of sightings columns include all adult whales sighted. 151
160 156 00' ' ' ' ' ' ' Shuyak Is N 58 00' 58 00' Kodiak Island 57 00' ALASKA 57 00' ' ' ' ' ' ' ' Figure 1. Map of the Kodiak archipelago showing Kodiak and Shuyak Islands. The study area is shown in shade. 152
161 156 00' ' ' ' ' ' N 58 00' 58 00' Kodiak Island ÊÚ# 57 00' Port Hobron 57 00' ' ' ' ' ' ' Figure 2. Location of the Port Hobron whaling station. The approximate coverage area of commercial whaling operations is shown in stripes and the study area is shown in shade. 153
162 Number of Whales N (331, 376) N (14, 61) N (114, 241) Ct/4 Nt Year Figure 3. Comparison of adjusted commercial catch (C t /4) and estimated abundance (N t ) between 1920 and Abundance estimates (± 95% CI) from delay-difference model for N 0, N 1938, and N 2002 are shown.
163 a. Base (M = 0.04) 1980 M = 0.02 M = Number of Whales b. Base (r = 0.08) 1980 r = M =0.04 r = 0.06 r = c. Base (C t /4) C t C t / Figure 4. Comparison of estimated abundance showing sensitivity of the delay-difference model to a) the M parameter, b) the r parameter, and c) historic catch values (C t ). In the 1980 scenario, (r-m) was fixed at 0.10 between 1980 and Year 155
164 Potential current and historic prey removal due to consumption by humpback whales (Megaptera novaeangliae) near Kodiak Island, Alaska Briana H. Witteveen, Robert J. Foy, and Kate M. Wynne University of Alaska Fairbanks, School of Fisheries and Ocean Sciences, Kodiak, Alaska Introduction Numerous studies have revealed that an increased awareness of trophic-level interactions is essential in assessing the status of complex marine ecosystems (Overholtz et al. 1991; Pascual et al.1993; Hairston and Hairston 1993; Estes 1994; Kenney et al. 1997; Trites et al. 1997). Such studies have shown that predator-prey linkages in marine systems can have direct and indirect effects on all ecosystem members, but predictions of their effects cannot be made without multi-species models. Cetaceans are top predators in marine ecosystems and consume significant amounts of prey. Knowledge of the distribution, abundance, and foraging habits of cetaceans is, therefore, an essential element of any pelagic ecosystem study (van Franeker 1992). Many species preyed upon by cetacean populations are targeted by other marine predators and commercial fisheries or are linked to fisheries through complex food webs. Previous studies have reported that prey removal due to cetacean consumption approach or exceed removals due to commercial fishing (Laws 1977; Laevastu and Larkins 1981; Bax1991, Markussen et al. 1992; Nordøy et al. 1995; Kenney et al. 1997). Such high levels of consumption can have significant effects on the distribution and abundance of prey species and the structure of marine communities (Perez and McAlister 1993; Kenney et al. 1997; Croll et al. 1998). Therefore, examining consumption by cetaceans contributes information about complex ecosystem linkages and the long-term sustainability of marine resources (Perez and McAlister 1993; Kenney et al. 1997; Tamura and Ohsumi 2000). Humpback whales (Megaptera novaeangliae) feed in the waters off Kodiak Island and, because they are considered apex predators, may influence the structure of the Kodiak Island marine ecosystem (Figure 1) (Trites et. al. 1997; Croll et. al. 1998). Modeling the amount of prey consumed by feeding humpback whales is, therefore, a useful tool for evaluating their role as marine predators. Cetaceans, in general, are described as opportunistic in their food selection, though species tend to select broad categories of prey such as cephalopods, fish, or zooplankton (Tomilin 1954; Nemoto 1959; Klumov 1966; Sigurjónsson and Víkingsson 1998). Humpback whales are classified as generalists and target a wide variety of prey species (Nemoto 1970; Perry et al. 1999). They have been shown to be seasonal feeders on euphausiids (Thysanoessa spp.) and schooling fish species up to 30 cm in length, including capelin (Mallotus villosus), Pacific herring (Clupea pallasi), walleye pollock (Theragra chalcogramma), Atka mackerel (Pleurogrammus monopterygius), cod (Gadus spp.), sardines (Sardinops spp.), and sandlance (Ammodytes spp.) (Nemoto 1957, 1959; Mitchell 1973; Payne et al. 1990). The variety, as well as the amount, of prey removed from Kodiak waters may therefore be significant. Resource removal from Kodiak waters is of particular importance when considering the high value of Kodiak Island commercial fisheries, which totaled 63.3 million dollars in ex-vessel value in 2002 (NMFS 2002a). Modeling consumption by humpback whales as they recover from severe population declines could shed light on patterns of change seen in prey and sympatric consumer populations, such as marine birds and pinnipeds (Merrick 1997; Anderson and Piatt 1999). Commercial whaling in the 1900 s significantly reduced the number of humpback whales, both within coastal Kodiak waters, and throughout the North Pacific (Rice 1978). Following their protection in 1965, however, humpback whale numbers in Manuscript currently in review for publication in Fishery Bulletin 156
165 the central North Pacific increased, possibly by as much as 10%, between the early 1980 s and early 1990 s for some North Pacific stocks (Baker and Herman 1987; Calambokidis et al. 1997). Removal and subsequent recovery of a marine predator of this magnitude may cause large variations in the biomass removal of prey in the ecosystem, as has been hypothesized in other studies (Laws 1985; Springer et al. 2003). However, no empirical evidence exists to demonstrate such trophic interactions in the Gulf of Alaska. In this paper, we model the historic and current consumption by humpback whales within waters of northeastern Kodiak Island in order to assess the impact these whales have as predators on local prey populations. Materials and methods Study area The study area encompassed waters of northeastern Kodiak Island, including Chiniak and Marmot Bays (Figure 1). The study area was divided into four subareas of approximately equal size in order to equalize sampling effort and maximize coverage of the study area. Subareas were also used to separate sightings of humpback whales for the purpose of weighting diet composition in relation to prey availability. An additional subarea, including the waters near Woody and Long Islands, was not considered a survey subarea but was designated in the post-study period for calculating diet composition ( nearshore, Figure 1). Sightings and abundance of humpback whales Data on humpback whale sightings was collected during vessel surveys conducted between June and September 2001 and Individual whales were identified from photographs of the black and white pigment patterns and other natural markings on the ventral surface of their tail flukes (Katona et al. 1979). A humpback whale sighting was defined as a sighting of an individual whale on a single day. Therefore, no whale was counted twice on one day, but may have been counted multiple times during the study period. Humpback whale sightings were summed by month and then by subarea for calculation of whale diet (see Methods: Composition of simulated diets). An associated study used these sightings and fluke photographs to estimate current humpback whale abundance within the study area (Witteveen et al. this volume). This estimate was used in conjunction with historic catch data from the Port Hobron whaling station to estimate historic humpback whale abundance. The whaling grounds of Port Hobron encompassed most of eastern Kodiak waters; an area approximately four times that of the study area. To account for the size difference between whaling grounds and the study area, catch values were divided by four assuming random harvest throughout the grounds. The pre-whaling and current estimates of N in the study area are 343 (95% C.I. 331, 376) and 157 (95% C.I. 114, 241), respectively (Witteveen et al. this volume). Composition of simulated diets Two diets were simulated to reflect both a historic and current suite of possible humpback whale prey species. The diets were simulated because direct observation of humpback whale feeding behavior is rare and, even when observed, cannot produce a concrete determination of the prey species being eaten. Diet A simulated historic target species and was based on the stomach contents of 39 humpback whales harvested at the Port Hobron whaling station on southeast Kodiak waters between May 30 and August 9, 1937 as analyzed by Thompson (1940). Diet B simulated current target species and assumes no prey selectivity. It was based on the assumption that humpback whales will eat suitably sized prey (<30cm) in proportion to its relative occurrence in areas used by humpback whales. Euphausiid proportions in the diet were based on historic stomach contents and assumed to be constant over time, since no current euphausiid abundance estimate is available. 157
166 Information on seasonal prey availability was collected from mid-water trawl surveys that were conducted within eastern Kodiak waters in July 2001 and June through September Multiple passes with a commercial mid-water trawl net with a 22-mm mesh cod-end liner were made through acoustic scattering layers, ensuring an accurate representation of mid-water fish composition and occurrence. Species composition, species counts, and fish size were determined for each tow and grouped within the study subareas. Only data from tows conducted during the study period in 2001 and 2002 in areas utilized by humpback whales were included in this analysis. Therefore, prey surveys overlapped humpback whale sightings both temporally and spatially. A separate series of acoustic and purse seine (center panel with a 3.2-mm mesh net) surveys was used to determine prey availability within the nearshore subarea in June through September 2002 (Foy unpubl. data). Prey composition determined by these surveys was assumed to be homogeneous throughout the near-shore habitat within the study area. To calculate diet B, the occurrence of fish smaller than 30 cm was determined from the mid-water trawl surveys within each subarea and month for both 2001 and Tow data was first separated by subarea and month. Percent composition of prey species in each tow was calculated by dividing the total number of fish of each species caught by the total number of all fish caught in each tow, excluding species larger than 30 cm (Nemoto, 1959) and species that were not previously documented as prey, such as flatfish and other non-schooling fishes (Nemoto ; Klumov 1963; Kreiger and Wing ; Perry et al. 1999). To calculate diet B for the entire study area, prey proportions were weighted by the number of whales in each subarea. The weighted proportions were then summed across all months and subareas and multiplied by one minus the percentage of assumed euphausiid occurrence within the diet. Thus, diet B simulates a weighted availability of prey species based on temporal and spatial overlap between prey surveys and humpback whale sightings within the study period (Figure 2). Consumption and biomass removal Seasonal consumption was estimated for both the current humpback whale population and the pre-whaling humpback whale population. Pre-whaling consumption was estimated using diet A only. Diet B was used to estimate consumption by the current humpback whale population and to project consumption by a humpback whale population at the pre-whaling abundance estimate. The active metabolic rate (kcal/day) of feeding humpback whales was estimated in this study as E = 192M, where Kleiber s (1961) model for basal metabolic rate (BMR; E = 70M ) was modified using average oxygen consumption estimates for feeding baleen whales and M is average body weight (kg) (Wahrenbrock et al. 1974: Sumich 1983; Perez and McAlister 1993). Daily prey consumption was then estimated as: E 1 I = K 1,000 where I = total prey consumption (kg/day), E = estimated daily energy requirements (kcal/day) and, K = the estimated energy density (kcal/gram wet weight) of presumed prey. The average body mass for humpback whales (M) was set equal to 30,408 kg (Trites and Pauly 1998). The total energy density (K) of each diet was calculated by multiplying the average seasonal energy density of each prey species sampled in the study area by the percentage of that species within each diet and summing across all species. Values of K for individual prey species came from proximate compositions that were determined from prey collected during 2002 trawl surveys for all months within the study period (Foy unpubl. data). For each month, energy density was calculated by multiplying percent lipid by 9.4 kcal/g and percent protein by 4.3 kcal/g, which are conversion factors based on heat produced during metabolism of foodstuffs (Schmidt-Nielson 1997). Carbohydrates were considered to be bound and not available for nutrition (Gaskin 1982). The average seasonal energy density of each prey species was calculated by summing all values of energy density and dividing by the number of months in the study period. Previously published proximate composition values for surf smelt (Hypomesus pretious) and energy density data for euphausiids (Thysanoessa spp.) were used (Davis et al. 1997; Payne et al. 1999). 158
167 Seasonal prey consumption for the population was estimated by multiplying I by estimates of abundance (N) and the total number of days in the humpback whale feeding season. Consumption estimates were calculated for both the upper and lower 95% confidence limits on the abundance estimates to show a possible range of consumption. The length of the feeding season was presumed to be 152 days (Perez and McAllister 1993). Results Analysis of sightings showed that humpback whales were not uniformly distributed within the study area (Table 1). Occurrence of humpback whales within subareas was variable, indicating withinseason shifts of habitat use. Peak humpback whale sightings occurred in subarea 2 in July of 2001 and No humpback whales were sighted in the near-shore area after the month of July in either year. Only two prey items were identified in the 27 stomachs that contained appreciable quantities of prey of 39 stomachs analyzed by Thompson (1940). Surf smelt occurred in 21 of 27 (78%) stomachs and euphausiids occurred in 6 of 27 (22%) stomachs (Table 2). These percentages comprise diet A.). Energy densities of these two species combined to give a total energy density of 1.31 kcal/gram (Table 3). The fish species found in areas used by humpback whales in 2001 and 2002 were pollock (36.96%), capelin (28.89%), eulachon (7.60%), Pacific sandlance (4.44%), Pacific sandfish (0.08%), and Pacific herring (0.03%) (Table 2). Diet B is comprised of these percentages. Calculated energy densities of prey species ranged from a high (eulachon) of 2.52 kcal/gram to a low of 1.12 kcal/gram (juvenile pollock). The total energy density for diet B was 1.19 kcal/gram (Table 3). Based on energetic content of the above diets, the model suggests each humpback whale in the study area would consume 338 kg/day on diet A and 370 kg/day on diet B. Using a pre-whaling estimate of 343 (95% C.I ) animals in the study area, humpback whales feeding on diet A prior to 1927 would have removed an estimated 1.76 x 10 7 kg of prey annually (95% C.I.1.70 x x 10 7 ), including nearly 3.87 x 10 6 (3.74 x x 10 6 ) kg of euphausiids and approximately 1.37 x 10 7 (1.32 x x 10 7 ) kg of surf smelt (Table 4). Assuming diet B accurately reflects prey use by the estimated 157 (95% C.I ) humpback whales currently feeding in the study area, these whales would be removing nearly 8.83 x 10 6 (6.41 x x 10 7 ) kg annually, including 3.26 x 10 6 (2.37 x x 10 6 ) kg of pollock, nearly 2.55 x 10 6 (1.85 x x 10 6 ) kg of capelin, and 6.71 x 10 5 (4.88 x x 10 6 ) kg of eulachon. If the same diet was consumed by a population of humpback whales allowed to return to pre-whaling abundance the projected population would remove 1.9 x 10 7 (1.86 x x 10 7 ) kg of prey annually, including approximately 7.13 x 10 6 (6.88 x x 10 6 ) kg of pollock, 5.57 x 10 6 (5.38 x x 10 6 ) kg of capelin, and 4.25 x 10 6 (4.10 x x 10 6 ) kg of euphausiids (Table 4). Discussion Consumption Estimating the energy requirements of large cetaceans is inherently difficult and values presented here may be subject to substantial uncertainty. Previous studies in which consumption rates for 0.75 cetaceans are estimated have used a range of values to adjust BMR ( E = 70M ) for active metabolism. These values generally range from approximately 1.5 to 3 times BMR (Hinga 1979; Lockyer 1981; Sigurjónsson and Víkingsson 1998). Our value of 192 is 2.7 times larger than 70 and is, therefore, a reasonable estimate, as it fits within this range and is based on observed oxygen consumption of baleen whales. However, the consumption estimates are highly sensitive to perturbations of model input; a 5% error in this value would cause deviation of that same percent in final consumption values. Further, all input values in our consumption model are assumed to be constant when body mass, physiological status and assimilation efficiency are likely subject to large seasonal fluctuations (Innes et al. 1987; Perez and McAlister 1993; Kenney et al. 1997; Trites et al. 1997; Sigurjónsson and Víkingsson 1998). Our model, however, did account for seasonal changes in the energy density of local prey sources, a 159
168 limitation of previous models (Perez and McAlister 1993). Further research is necessary to obtain reliable field estimates of metabolic rates if model uncertainty is to be reduced. The historic prevalence of surf smelt in diet A could imply a dramatic change in surf smelt availability, misidentification or an overestimation of smelt found in stomachs. Thompson s (1940) analysis resulted from samples of stomach contents obtained from catcher vessels; therefore, these samples may have completely missed less prevalent species. Further, stomach samples may have only reflected the most recent meal of the whale and therefore be biased toward a single species. This potential bias, however, may have been minimized by sampling stomachs throughout the season (May 30 August 09) (Thompson 1940). Diet B is dominated by walleye pollock, a species not present in historic diet A. The increased importance of juvenile pollock in contemporary humpback whale diet B could reflect changes in prey species availability and use, foraging selectivity, or our diet reconstruction methodology. Modeled diet B is considered provisional for two reasons. First, it assumes humpback whales eat prey species in proportion to their availability within foraging areas. Humpback whales may have preferred prey species and consumption may be disproportional to availability. That is, they may be selectively foraging from all available prey sources. Previous foraging studies have described humpback whale distribution as being correlated with areas of capelin (Whitehead and Carscadden 1985; Piatt et al. 1989) and sandlance abundance (Payne et al. 1986; Kenney et al. 1996) indicating a possible preference for small forage fish species. Given that in the decades since whaling, the Gulf of Alaska shifted from a system dominated by forage fish to one dominated by pollock and other groundfish (Merrick 1997; Anderson and Piatt 1999; Benson and Trites 2002), a shift in prevalence from surf smelt in the historic diet to pollock in the current diet is not unexpected. Pollock has been shown to be a dominant prey source of humpback whales harvested in Russia (Klumov, 1963). Additionally, humpback whales in southeastern Alaska have been observed near schools of juvenile pollock and are believed to eat pollock to an unknown, but potentially large, extent in some years (C. Gabriele pers. comm.). The second source of uncertainty in diet B stems from the assumption that our mid-water trawl surveys are unbiased samples of all available prey. Because these surveys were not designed to sample zooplankton, they may have produced a biased estimate of euphausiid availability. This bias may not be significant, however, as the 22% value we used in diet B was based on historic usage and falls within the range of euphausiid consumption (5-30% of the total diet) estimated in other humpback whale studies (Perez and McAlister 1993; Kenney et al. 1997). Further, diet B was constructed based on results of mid-water trawl surveys that may underestimate the availability of some forage fishes, particularly Pacific sandlance. Pacific sandlance are often small enough to swim through the meshes in the net or are found in benthic habitats and cannot be captured by mid-water trawl methods. To minimize this potential sampling bias, we supplemented our trawl surveys with purse seine sampling in the nearshore subarea. Despite this effort we may have underestimated the prevalence of Pacific sandlance in the area, as it was found to dominate the diets of other coastal piscivores; the contents of 34 coho salmon (Oncorhynchus kisutch) and Pacific halibut (Hippoglossus stenolepis) stomachs in 2002 (Witteveen unpubl. data); and regurgitants from blacklegged kittiwakes in 2001 (n = 96) and 2002 (n = 147) were dominated by Pacific sandlance (Murra et al. 2003). Potential Ecological Effects of Humpback Whale Consumption Though estimates of consumption are highly dependent on estimates of population abundance and metabolic rates, these values indicate that humpback whales were, and still are, significant predators within the Kodiak Island ecosystem. Historic commercial whaling reduced the population in our study area to an estimated low of 27 animals by 1938 (Witteveen et al. this volume). The removal of so many large consumers likely had significant impacts on the surrounding ecosystem. As modeled, reducing historic consumption to that of 160
169 current levels would release nearly 10,000 tons of prey within the study area in a single feeding season. Such a release could have invoked a trophic cascade effect. Cetacean removals in the Southern Ocean have demonstrated how trophic cascades can affect marine ecosystems through removal of large marine predators, including whales (Laws 1985). It has been hypothesized that a similar reorganization of the marine community may have occurred in the Bering Sea and Gulf of Alaska, although the mechanisms of such a cascade are not well understood (Merrick 1997; Trites 1997; Springer et al. 2003). Removal of whales during commercial harvest reduced predation on certain fish, cephalopod, and zooplankton species, which were then available to other consumers. This large release of prey, when coupled with environmental factors such as the 1977 regime shift, may have contributed to the growth of sympatric marine predator populations from the late 1940 s to late 1970 s. It is hypothesized that whale stock resurgence, coupled with the 1977 regime shift that favored the proliferation of groundfish species, may have reduced prey availability to other piscivores in the system and led to declines seen in harbor seal (Phoca vitulina), Steller sea lion, Northern fur seal (Callorhinus ursinus), common murre (Uria aalge), thick-billed murre (U. lomvia), and red-legged kittiwake (Rissa brevirostris) populations (Merrick 1995, 1997; NRC 1996; Trites 1997). The Gulf of Alaska and Bering Sea ecosystems may still be seeing changes caused by baleen whale removals and recovery (NRC 1996). Assuming the Kodiak Island study area was similarly affected by this trophic reorganization, estimating current consumption by humpback whales would help elucidate the role their recovery is playing in ecosystem dynamics. If our diet composition and subsequent consumption estimates are accurate, our results suggest the diet of humpback whales in Kodiak waters directly overlap those of sympatric piscivores and the biomass removed may be substantial. The top species modeled in the humpback whale diet represent an important source of energy for multiple higher-trophic-level species and are known to be significant dietary components for Steller sea lions (Wynne), harbor seals (Jemison 2001), tufted puffins (Fratercula cirrhata) (Piatt et al. 1997), blacklegged kittiwakes (Murra et al. 2003), adult pollock, Pacific halibut, and arrowtooth flounder (Livingston et al. 1993; Yang 1995; Merrick 1997; Best and St. Pierre 1986). Our model suggests humpback whales within the study area may currently be consuming a significant amount of fish, including over 3.26 x 10 6 kg of juvenile pollock and nearly 3.62 x 10 6 kg of small forage fish, such as capelin, eulachon and Pacific sandlance, during a 152-day feeding season. In comparison, tufted puffins consume only 6.40 x 10 4 kg of juvenile pollock between mid-july and mid- September, but this accounts for as much as one-tenth of the age zero pollock stock in the GOA during early July (Hatch and Sanger 1992). In addition, gadid removal by Steller sea lions in 1998 was estimated to be 1.79 x 10 8 kg, or 12% of total gadid biomass removed commercial fisheries for that year (Winship and Trites 2003). Though nearly 55 times the pollock removal due to consumption by humpback whales, this figure includes all gadid (not only pollock) species removals in all Alaskan waters. More importantly, these fish are likely larger ( 60 cm vs. 30 cm) than fish targeted by humpback whales. Although humpback whales generally feed on smaller age classes than are targeted by commercial fisheries or Steller sea lions (Perez and McAlister 1993; Kenney et al. 1997), consumption of younger age classes may affect future recruitment into the fishery. Barrett et al. (1990) stated that consumption of young cod (Gadus morhua) and saite (Pollachius virens) by shags (Phalacrocorax aristotelis) and cormorants (P. carbo) in the Northeast Atlantic could be a limiting factor in recruitment in years of low stock size, even if consumption of these species was overestimated by an order of magnitude. Thus, it is noteworthy that the humpback whales removal of an estimated 3.26 x 10 6 kg of pollock (age 0-2) equal 30% of the 2002 commercial pollock harvest of 1.09 x 10 7 kg (ages 3 to 8) for the 161
170 entire Kodiak Island management area and 2.1% of the 2002 spawning biomass of pollock for the entire Gulf of Alaska, which was estimated at 1.58 x 10 8 kg (NMFS 2002b; NPFMC 2002, 2003). These comparisons are based on mean estimates of prey removal and do not take into account model uncertainty. When uncertainty is considered, however, comparison to even the lower end of estimates of prey removal are still of note. For example, assuming removal of juvenile pollock is equal to the lower estimate, or 2.37 x 10 6 kg, the humpback whale s removal of pollock still equals 21.7% of the 2002 commercial pollock catch and 1.5% of 2002 spawning biomass. Thus, it follows that if true consumption is actually closer to the upper estimates, that impact of prey removal by humpback whales would likely increase. The humpback whale represents only one of a myriad of marine consumers within the Kodiak Island ecosystem whose ecological role cannot be determined without sophisticated multi-species models and analysis of ecosystem interactions. This study was designed to provide essential baseline data and a model for estimating prey removal by foraging humpback whales. Our results show that the potential for biomass removal due to consumption by humpback whales is significant and that the foraging strategies of these whales warrant further investigation. Continued research efforts can improve estimates of biomass removal by identifying target prey, determining the degree of prey selectivity, and assessing variable foraging efficiency. Acknowledgements The authors are grateful for the insight and guidance provided by Janice M. Straley, Dr. Terry J. Quinn II, Dr. Brendan P. Kelly, and Chris Gabriele. Field and lab assistance was provided by Lisa Baraff and Katie Brenner. Financial support for this project was provided by the Rasmuson Fisheries Research Center and NOAA Grant #NA16FX1270 to University of Alaska Gulf Apex Predator-Prey Project. All research was conducted until provisions of NMFS Scientific Research Permit Literature Cited Anderson, P.J., and J. F. Piatt Community reorganization in the Gulf of Alaska following ocean climate regime shift. Mar. Ecol. Prog. Ser. 189: Baker, C.S., and L.M. Herman Alternative population estimates of humpback whales (Megaptera novaeangliae) in Hawaiian waters. Can. J. Zool. 65: Barrett. R.T., N. Rov, J. Loen, and W.A. Montevecchi Diets of shags Phalacrocorax aristotelis and cormorants P. carbo in Norway and possible implications in gadoid stock recruitment. Mar. Ecol. Prog. Ser. 66: Bax, N.J A comparison of the fish biomass flow to fish, fisheries, and mammals in six marine ecosystems. ICES Mar. Sci. Symp. 193: Benson, A.J., and A. W. Trites Ecological effects of regime shifts in the Bering Sea and eastern North Pacific Ocean. Fish Fish. 3: Best, E.A., and G. St. Pierre Pacific halibut as predator and prey. International Pacific Halibut Commission Technical Report 21, 27 p. [Available from Calambokidis, J., G.H. Steiger, J.M. Straley, T. Quinn, L.M. Herman, S. Cerchio, D.R. Salden, M. Yamaguchi, F. Sato, J.R. Urbán, J. Jacobson, O. von Ziegesar, K.C. Balcomb, C.M. Gabriele, M.E. Dalheim, N. Higashi, S. Uchida, J.K.B. Ford, Y Miyamura, P.Ladron de Guevara, S. A. Mizroch, L. Schlender, and K. Rasmussen Abundance and population structure of humpback whales in the North Pacific basin. Cascadia Research Cooperative Final Contract Report 50ABNF to Southwest Fisheries Science Center La Jolla, CA 92038, 72p. [Available at Croll, D.A., B.R. Tershy, R.P. Hewitt, D.A. Demer, P.C. Fiedler, S.E. Smith, W. Armstrong, J.M. Popp, T. Keikhefer, V.R. Lopez, J. Urban, and D. Gendron An integrated approach to the foraging ecology of marine birds and mammals. Deep-Sea Res. 45:
171 Davis, N.D., K.W. Meyers, and Y.Ishida Caloric value of high-seas salmon prey organisms and simulated salmon ocean growth and prey consumption. NPAFC 1: Estes, J.A Top-level carnivores and ecosystem effects: questions and approaches. In Linking species and ecosystems (C.G. Jones and J.H. Lawton, eds.) p Chapman Hall, New York. Gaskin, D.E The Ecology of Whales and Dolphins. Heinemann, London, 459 p. Hairston, N.G. and N.G. Hairston Cause-effect relationships in energy flow, trophic structure, and interspecific interactions. Am. Nat. 142: Hatch, S.A. and G.A. Sanger Puffins as samplers of juvenile pollock and other forage fish in the Gulf of Alaska. Mar. Ecol. Prog. Ser. 80: Hinga, K.R The food requirements of whales in the Southern Hemisphere. Deep-Sea Res. 26: Innes, S., D.M. Lavigne, W.M. Eagle, and K.M. Kovacs Feeding rates of seals and whales. J. Anim. Ecol. 56: Jemison, L.A Summary of harbor seal diet data collected in Alaska from In Harbor seal investigations in Alaska (R.J. Small, ed.), p Ann. Rep. NOAA Grant NA 87Fx0300. Anchorage, AK. Katona, S., P. Baxter, O. Brazier, S. Kraus, J. Perkins, and H. Whitehead Identification of humpback whales by fluke photographs. Pages in: H.E. Winn and B.L. Olla, eds. Behavior or Marine Animals, Vol. 3. Plenum Press, New York, NY Kenney, R.D., P.M. Payne, D.W. Heinmann, and H.E. Winn Shifts in northeast shelf cetacean distributions relative to trends in the Gulf of Maine/Georges Bank finfish abundance. In The Northeast Shelf Ecosystem: Assessment, Sustainability, and Management (K. Sherman, N.A. Jaworski, and T.J. Smayda, eds.). p Blackwell Science, Carlton, Victoria. Kenney, R.D., G.P. Scott, T.J. Thompson, and H.E. Winn Estimates of prey consumption and trophic impacts of cetaceans in the USA Northeast continental shelf ecosystem. J. Northwest Atl. Fish. Sci. 22: Kleiber, M The fire of life: An introduction to animal energetics. John Wiley and Sons, New York, NY, 454 p. Klumov, S.K Food and helminth fauna of whalebone whales in the main whaling regions of the world ocean. Trudy Instituta Okeanologii 71: Klumov, S.K Plankton and the feeding of the whalebone whales (Mystacoceti). Trans. Inst. Oceanol. 51: Krieger, K.J., and B.L. Wing Hydroacoustic surveys and identification of humpback whale forage in Glacier Bay, Stephens Passage, and Frederick Sound, Southeastern Alaska, Summer NOAA Tech. Mem. NMFS F/NWC-66, 60 p. Krieger, K.J., and B.L. Wing Hydroacoustic monitoring of prey to determine humpback whale movements. NOAA Tech. Mem. NMFS F/NWC-98, 62 p. Laevastu, T., and H.A. Larkins Marine Fisheries Ecosystems, Its Quantitative Evaluation in Management. Fishing News Books, Farnham, Surrey, 167 p. Laws, R.M Seals and whales in the Southern Ocean. Phil. Trans. R. Soc. of London Series B Bio. Sci. 279: Laws, R.M The ecology of the Southern Ocean. Am. Sci. 73: Livingston, P.A., A. Ward, G.M. Lang, and M-S. Yang Groundfish food habits and predation on commercially important prey species in the eastern Bering Sea from 1987 to NOAA Tech. Memo. NMFS F/NWC-54, 192 p. 163
172 Lockyer, C Estimation of the energy costs of growth, maintenance and reproduction in the female minke whale (Balaenoptera acutorostrata), from the Southern Hemisphere. Rep. Int. Whal. Comm.31: Markussen, N.H., M. Ryg, and C. Lydersen Food consumption of the NE Atlantic minke whale (Balaenoptera acutorostrata) population estimated with a simulation model. ICES J. Mar. Sci. 49: Merrick, R.L The relationship of the foraging ecology of Steller sea lions (Eumetopias jubatus) to their population decline in Alaska. PhD Thesis. University of Washington, Seattle, WA, 172 p. Merrick, R.L Current and historical roles of apex predators in the Bering Sea ecosystem. J. Northwest Atl. Fish. Sci. 22: Mitchell, E Draft report on humpback whales taken under special scientific permit by eastern Canadian land stations, Rep. Int. Whal. Comm. 23: Murra, K.A., C.L. Buck, S.D. Kildaw, J.B. Gamble, C.T. Williams Forage location, diet, and productivity of black-legged kittiwakes in 2001 and 2002 in Chiniak Bay, Kodiak Alaska (Abstract). In Marine Science in the Northeast Pacific: Science for Resource Dependent Communities Joint Science Symposium; January 13 17, 2003; Anchorage, Alaska. National Marine Fisheries Service (NMFS) 2002a. Personal Commun. Fishery Statistics and Economics Division, Silver Spring MD b Gulf Of Alaska groundfish quotas and preliminary catch in round metric tons. NMFS/AKR Fish Management. Juneau, AK North Pacific Fisheries Management Council (NPFMC).2002 SAFE report for the groundfish resources of the Gulf of Alaska, Assessment of Walleye Pollock Stock in the Gulf of Alaska, 90 p. [Available at Stock assessment and fishery evaluation (SAFE) report for the groundfish resources of the Gulf of Alaska, 846 p.[available at National Research Council (NRC) The Bering Sea Ecosystem. National Academy Press, Washington DC, 307 p. Nemoto, T Foods of baleen whales in the northern Pacific. Sci. Rep. Whales Res. Inst. Tokyo 12: Nemoto, T Foods of baleen whales with reference to whale movements. Sci. Rep. Whales Res. Inst. Tokyo 14: Nemoto, T Feeding patterns of baleen whales in the ocean. In Marine Food Chains (J.H. Steele, ed.) p Oliver and Boyd, Edinburgh. Nordøy, E.S., L.P. Falkov, P.-E. Måtensson, and A.S. Blix Food requirements of northeast Atlantic minke whales. In Whales, seals, fish, and man (A.S. Blix, L. Walløe, and Ø. Ulltang, eds.), p Elsevier Science, Amsterdam. Overholtz, W.J., S.A. Murawski and K.L. Foster Impacts of predatory fish, marine mammals, and seabirds on pelagic fish ecosystems of the northeastern USA. In Multispecies models relevant to management of living resources (N. Daan and M.P. Sissenwine, eds.) p ICES Mar. Sci. Symp International Council for the Exploration of the Sea (ICES), Coppenhagen V, Denmark. Pascual, M., R. Hilborn, L. Fritz, H. Xi, J. Moss Modeling the trophic relationships between fish and marine mammal populations in Alaskan waters. In Is it food? Addressing marine mammal and seabird declines, p Alaska Sea Grant Rep. Alaska Sea Grant Program Univ. Alaska University of Alaska, Fairbanks, AK. Payne, P.M., J.R. Nicolas, L. O Brien, and K.D. Powers The distibution of the humpback whales Megaptera novaeangliae on Georges Bank and in the Gulf of Maine in relation to densities of the sand eel Ammodytes americanus. Fish. Bull. 84:
173 Payne, P.M., D.N. Wiley, S.B. Young, S. Pittman, P.J. Clapham, and J.W. Jossi Recent fluctuations in the abundance of baleen whales in the southern Gulf of Maine in relation to changes in selected prey. Fish. Bull. 88: Payne, S.A., B.A. Johnson, and R.S. Otto Proximate composition of some northeastern Pacific forage fish species. Fish. Oceanogr. 8: Piatt, J.F., D.A. Methven, A.E. Burger, R.L. McLagan, V. Mercer, and E. Creelman Baleen whales and their prey in a coastal environment. Can. J. Zool. 67: Piatt, J.F., D.D. Roby, L. Henkel, and K. Neuman Habitat use, diet, and breeding biology of tufted puffins in Prince William Sound, Alaska. Northwest. Nat. 78: Perez, M.A., and W.B. McAlister Estimates of food consumption by marine mammals in the eastern Bering Sea. NOAA Tech. Memo. NMFS-AFSC p. Perry, S.L., D.P. DeMaster, and G.K. Silber The great whales: History and status of six species listed as endangered under the Endangered Species Act of Mar. Fish. Rev. 61(1): Rice, D. W The humpback whale in the North Pacific: distribution, exploitation and numbers. Appendix 4. Pp , In K. S. Norris and R. R. Reeves (eds.), Report on a workshop on problems related to humpback whales (Megaptera novaeangliae) in Hawaii. U.S. Dep. Commer., Nat. Tech. Info. Serv. PB Springfield, VA. Schmidt-Nielson, K Animal Physiology: Adaptation and environment. 5 th ed. Cambridge Press. Cambridge, United Kingdom. 607 p. Sigurjónsson, J. and G.A. Víkingsson Seasonal abundance of and estimated food consumption by cetaceans in Icelandic and adjacent waters. J. Northwest Atl. Fish. Sci.. 22: Springer, A.M., J.A. Estes, G.B. van Vilet, T.M. Williams, D.F. Doak, E.M. Danner, K.A. Forney, and B. Pfister Sequential megafaunal collapse in the North Pacific Ocean: An ongoing legacy of industrial whaling? Proc. Acad. Nat. Sci. 100: Sumich, J.L Swimming velocities, breathing patterns, and estimated costs of locomotion in migrating gray whales, Eschrichtius robustus. Can. J. Zool. 61: Tamura, T. and S. Ohsumi Regional assessments of prey consumption by marine cetaceans in the world. International Whaling Commission document SC/52/E6, 45 p. [Available at Thompson, R.J Analysis of stomach contents taken during the years 1937 and 1938 from the North Pacific. M.Sc. thesis, University of Washington, Seattle. 82 p. Tomilin, A.G Adaptive types in the order Cetacea (the problem of ecological classification of Cetacea). Zool. Zh. 33: Trites, A.W The role of pinnipeds in the ecosystem. In Pinniped populations, eastern north Pacific: status, trends, and issues. A symposium of the 127 th Annual Meeting of the American Fisheries Society. (G. Stong, J. Goebel, and S. Webster, eds.) p New England Aquarium, Conservation Department, Boston, MA. Trites, A.W, and D. Pauly Estimating mean body masses of marine mammals from maximum body lengths. Can. J. Zool. 78: Trites, A.W., V. Christensen, and D. Pauly Competition between fisheries and marine mammals for prey and primary production in the Pacific Ocean. J. Northwest Atl. Fish. Sci. 22: van Franeker, J.A Top predators as indicators for ecosystem events in the confluence zone and marginal ice zone of the Weddell and Scotia seas, Antarctica, November 1988 to January 1989 (EPOS Leg 2). Polar Biol. 12: Wahrenbrock, E.A., G.F. Maruschak, R. Elsner, and D.W. Kenney Respiration and metabolism in two baleen whale calves. Mar. Fish. Rev. 36: 1-9. Whitehead, H. and J.E. Carscadden Predicting inshore whale abundance whales and capelin off the Newfoundland coast. Can. J. Fish. Aquat. Sci. 42:
174 Winship, A.J. and A.W. Trites Prey consumption of Steller sea lions (Eumetopias jubatus) off Alaska: how much prey do they require? Fish. Bull. 101: Yang, M.S Food habits and diet overlap of arrowtooth flounder (Atheresthes stomias) and Pacific halibut (Hippoglossus stenolepis) in the Gulf of Alaska., In Proceedings of the International Symposium on North Pacific Flatfish, p Alaska Sea Grant Program Report 95-04, Fairbanks, AK. 166
175 Table 1 Combined 2001 and 2002 sightings of humpback whales by subarea and month in the Kodiak Island study area and 2002 Area June July August September Total Near Shore Total Table 2 Composition and relative occurrence of prey species represented in simulated humpback whale diets A and B. Diet Prey Species Common Name Percent of Diet Hypomesus pretious Surf smelt 78.00% A Thysanoessa spp. Euphausiids spp % Total 100% Theragra chalcogramma Walleye pollock 36.96% Mallotus villosus Capelin 28.88% Thysanoessa spp. Euphausiids spp % B Thaleichthys pacificus Eulachon 7.60% Ammodytes hexapterus Pacific sandlance 4.44% Trichodon trichodon Pacific sandfish 0.08% Clupea harengus pallasi Pacific herring 0.03% Total 100% 167
176 Table 3 Monthly and average energy densities (kcal/gram) of prey species represented in simulated humpback whale diets A and B based on lipid and protein composition. Energy densities were used to estimate consumption by humpback whales. Average values in parentheses have been adjusted to reflect standard deviations of lipid and protein composition. Energy Densities (kcal/gram) Species June July August September Average capelin (1.1665, ) Pacific sandlance (1.3211, ) Pacific sandfish (1.0449, ) eulachon (2.3761, ) herring (1.9432, ) juv. pollock (0.9730, ) euphausiids N/A N/A N/A N/A surf smelt N/A N/A N/A N/A
177 Table 4 Daily and annual (over a 152-day feeding season) consumption of prey from two different diets off northeastern Kodiak Island by humpback whales at two levels of population abundance: the current population of 157 and the historic population of 343 (also presumed to be the carrying capacity to which the current population will recover). Diet A is the historic diet; Diet B is based on currently available prey. Prey Species Daily removal (kg) Annual Removal (kg) 169 Historic Population Current Population Diet A Diet B Mean Lower Limit Upper Limit Surf smelt 90, ,725, ,245, ,046, Euphausiids 25, ,871, ,735, ,243, , ,597, ,981, ,290, Euphausiids 27, ,246, ,097, ,654, Walleye pollock 46, ,132, ,882, ,818, Capelin 36, ,573, ,378, ,110, Eulachon ,467, ,415, ,608, Pacific sandlance , , , Pacific sandfish , , , Pacific herring , ,300, ,624, ,156, Euphausiids 12, ,943, ,411, ,983, Walleye pollock 21, ,264, ,370, ,011, Capelin 16, ,551, ,852, ,916, Eulachon , , ,030, Pacific sandlance , , , Pacific sandfish , Pacific herring , ,834, ,414, ,560,661.04
178 # Marmot # # # Kilometers N 170 Alaska Kodiak Island ÊÚ Bay Chiniak Bay 2 Woody Island Long Island Figure 1 Map of Kodiak Island study area. Study area is shown in shade with subareas outlined and numbered. In detail is the near-shore subarea between Woody Island and Long Island.
179 Kilometers Afognak Island # # # # # # # # # # # # # # # Marmot Bay N # # Ñ Ñ Ñ Ñ 171 Ñ Ñ Kodiak Island # # Ñ # Ñ Ñ # # # # Ñ ### # Ñ # # # # # # # # # # ## # # # # # # ## # # # ## Ñ ### # # # # # ## # # # Ñ # ## Ñ Chiniak Bay Ñ Ñ # # # # # # # Ñ Ñ ## # # # # # # # Ñ Figure 2 A close-up of the study area showing locations of humpback whale sightings (N) and prey tows (+) for 2001 and Only prey tows utilized in diet simulation are shown.
180 C. PISCIVOROUS BIRDS Seabirds may serve as sensitive indicators of marine conditions that impact Steller sea lions because their diet overlaps that of sea lions and other apex predators in the Gulf of Alaska and because seabird reproductive parameters are both easily monitored and responsive to food availability (Cairns 1987). In particular, seabirds are useful indicators of relative abundance and demographics of intermediate trophic levels because they eat small, young-of-year fishes which are ecologically important links in the food web but difficult to quantify in trawl and hydro-acoustic surveys. Therefore, we used seabirds as bio-indicators to monitor the relative abundance and distribution of forage fishes and other trophic intermediates of the Gulf of Alaska food web. Overall objectives were to determine seasonal diets and foraging areas of black-legged kittiwakes, glaucous-winged gulls and tufted puffins during breeding season monitor the numbers and breeding performance of offshore divers (tufted puffins, common murres), surface feeders (black-legged kittiwakes, glaucous-winged gulls), and nearshore divers (pigeon guillemots, cormorants). determine nestling diets and growth rates of tufted puffins, black-legged kittiwakes, glaucouswinged gulls, and pigeon guillemots. 172
181 Black-legged kittiwakes as bio-indicators of marine conditions in the western Gulf Of Alaska S. Dean Kildaw 1, Katie M. Murra 2, C. Loren Buck 2 1 University of Alaska Fairbanks, School of Fisheries and Ocean Sciences, Fairbanks, Alaska 2 University of Alaska Fairbanks, School of Fisheries and Ocean Sciences Kodiak, Alaska Introduction Changes in the structure and function of marine ecosystems in the North Pacific Ocean are hypothesized to have been driven by a gradual decline in primary production over the past century (Schell 2000), decadal-scale climatic oscillations in the northern hemisphere (Hare and Mantua 2000), or commercial exploitation of keystone species (Springer et al. 2003). A "regime shift " from lower than average sea surface temperatures to higher than average temperatures in the late 1970's (Hare and Mantua 2000) was concomitant with the replacement of energy-rich forage fishes (capelin Mallotus villosus, and herring Clupea pallasi) in the western Gulf of Alaska by energy-poor Gadid fishes (Anderson and Piatt 1999), and was associated with population declines of Steller sea lions (Eumetopias jubatus), seabirds and other apex predators in the Gulf of Alaska and Bering Sea (Springer 1998; Agler et al. 1999). Our lack of understanding about how and why marine ecosystems respond to climatic and anthropogenic perturbations limits our ability to develop effective management strategies to halt the precipitous decline of the endangered Steller sea lions in western Alaska. In an effort to better understand linkages between ecosystem change and apex predator populations in the Gulf of Alaska, researchers from the University of Alaska established the Gulf Apex Predator-Prey (GAP) project as an interdisciplinary program of integrated ecosystem research. The seabird component of the GAP program is an important facet because seabirds forage at intermediate trophic levels and their reproductive performance is highly responsive to changes in forage availability. Therefore, seabirds can contribute to our understanding of ecosystem structure and function by serving as bio-indicators of marine conditions (Aebischer et al. 1990; Kitaysky and Golubova 2000; Durant et al. 2003). Black-legged kittiwakes are small, pelagic gulls with a holarctic distribution (Baird 1994). During summer they nest on shear cliff faces and may travel <75 km from their nesting sites (Daunt et al. 2002) to feed on invertebrates and surface schooling fishes (Baird 1994). Kittiwakes in the Gulf of Alaska feed on forage fishes such as sandlance (Ammodytes hexapterus), capelin, herring and juvenile gadids (Baird 1994; Suryan and Irons 2001) and exhibit dietary overlap with Steller sea lions and other apex predators. Kittiwakes are particularly useful as bio-indicators of marine foraging conditions because they are a conspicuous, widely distributed and readily monitored. And, like other seabirds, aspects of their breeding biology, foraging ecology and physiology are highly sensitive to food availability (Hamer et al. 1993; Rindorf et al. 2000; Barrett 2002; Gill et al. 2002; Suryan et al. 2002). Predation may be additive or compensatory to effects of food supply on many breeding parameters that are traditionally monitored by seabird biologists. Adult kittiwakes and their nest contents are at risk to bald eagles (Haliaeetus leucocephalus), peregrine falcons (Falco peregrinus) and ravens (Corvus corax) throughout the breeding season but the potential impact of these predators on kittiwake populations or productivity is limited by numeric swamping. Disturbance of kittiwakes by aerial predators potentially has a far greater indirect impact on kittiwake reproductive performance by facilitating egg predation by abundant magpies (Pica pica) and northwestern crows (Corvus caurinus). Breeding parameters of kittiwakes can be divided into two groups; those affected only by forage availability and those that are potentially confounded by the effects of predation. Laying success, egg volume and clutch size, chick growth rate, regurgitation rates of chicks, foraging behavior, diets, timing of breeding and body condition are primarily, if not exclusively, dependent upon foraging conditions either 173
182 prior to or during the reproductive season. Hatching success, fledging success, brood size at fledge and plasma corticosterone levels, however, can be driven by either foraging conditions or predation or some combination of the two. In addition, we anticipated that "floor" and "ceiling" effects would limit the sensitivity and utility of each monitored parameter to a small portion of the potential range of prey abundance and to a specific stage of the breeding season (Cairns 1987). Therefore, we monitored multiple parameters in an effort to collectively canvas a broad range of prey abundance across the entire breeding season. Although the intent of this report is to summarize data collected between on the abundance, reproductive performance, diet, foraging behavior, and physiology of kittiwakes breeding in Chiniak Bay, on Kodiak Island, in the western Gulf of Alaska, we also assess historical patterns of abundance and productivity of kittiwakes over the past 3 decades for the sake of comparison. We feel that this context is important for interpretation of our results given the dramatic regime shifts witnessed over that time period. Methods Study Area We studied kittiwakes breeding at colonies located on numerous sea stacks and islets within Chiniak Bay (57 43' N, ' W) in the northeastern corner of Kodiak Island, Alaska (Figure 1). Kodiak Island is located in the Western Gulf of Alaska in a marine region that experienced "regime shifts" - dramatic changes in oceanographic conditions and food web structure - in 1977, 1989, and possibly 1998 (Anderson and Piatt 1999; Hare and Mantua 2000) that potentially effected seabirds and other apex predators in the region. Fieldwork was conducted May August in 2001, 2002, and 2003 on colonies that ranged in size from < 10 to approximately 2000 nests. Personnel were housed in the City of Kodiak and colonies were accessed via daily excursions in open skiffs. We monitored black-legged kittiwakes at 3 levels of precision. We conducted "colony surveys of all kittiwake colonies within Chiniak Bay to obtain information on population size and gross chick production. We also established multiple visual monitoring plots at several colonies and visited these on a 5-day cycle to obtain more detailed information on breeding chronology and reproductive performance. Lastly, we used ladders and climbing ropes to reach kittiwake nests on a small number of access plots on a 5-day cycle and, in addition to detailed chronology and productivity data, we obtained weights and measurements of eggs and chicks. Detailed methods for each of these 3 types data collection are presented below. Colony Surveys We conducted annual surveys (n=3 years) of nests and chicks at 21 kittiwake colonies within Chiniak Bay to determine indices of population size and chick production and to estimate brood size at fledging. Chicks were counted in the second week of August, just before the oldest were due to fledge. Nests were counted during the second week of August in 2001 and 2002 and during mid-incubation (end of June) in We counted kittiwake nests and chicks from an open skiff at a distance of approximately m using 8x or 10x binoculars and tally counters. Each colony was divided into readily identifiable subsections and duplicate counts were made of nests and chicks within each section. Nests were defined as any site where a hand-sized "patty" of nesting material was present regardless of the presence of an adult. Nest counts were repeated if they differed by more than 10 percent and the two closest counts were then averaged. We made separate tallies of 1-, 2-, or 3-chick broods and of broods with large vs. small chicks. Chicks were considered large if black-tipped tail feathers were visible (approx day old) or lacked down on their backs. We also recorded newly fledged chicks observed roosting on the cliff face or on water near the colony and that otherwise could not be associated with a particular nest. Chick counts are minimum estimates only and can differ markedly between observers depending on experience, visibility, 174
183 and sea conditions, therefore, we used the highest chick count of the two observers and did not repeat counts if the observer with the highest count was comfortable with their census total. Visual Monitoring Plots We quantified a suite of reproductive parameters that are potentially useful as indicators of marine conditions by following the breeding status of individual kittiwake nests on 48 visual-monitoring plots over the course of the breeding season. Plots each contained approximately 30 nests and were established at 12 accessible kittiwake colonies within Chiniak Bay (Fig 1). The location of every nest was marked directly onto a laminated photo of each plot and then each nest was uniquely numbered. Plots were observed from cliff-top vantage points and the contents of each nest was determined every 5 days, weather permitting, from late May (pre-laying) to late August (post fledging). Reproductive events (laying, hatching, disappearance of eggs or chicks) were assumed to have occurred on the mid-point of a time "window" between visits for which nest contents were confirmed; however, we refined these initial estimates in two ways: (a) if a clutch was completed over two nest visits or if more than one egg appeared in the nest between two visits, we assumed that eggs were laid 2.5 days apart (Gill et al. 2002) and adjusted the lay window, and lay date for each egg accordingly. (b) we refined the hatch window, and hatch date, by extrapolating from visit dates before and after laying using minimum (25.5 days) and maximum (29.5 days) estimates for incubation duration (Gill et al. 2002). We assumed chicks had fledged if their computed age was a minimum of 36 days at the time of their disappearance, or a minimum of 25 days if they were still present in the nest on the last visit of the season (chick mortality is quite low in the later half of the nestling period). We observed an abnormal spike in chick loss as their age approached the fledging cutoff of 36 days and attributed this to uncertainty in our estimation of chick age at the time of disappearance rather than to a sudden increase in the death rate of chicks. We corrected for this bias in two ways: (a) we added 6 days to the minimum observed age of chicks that had a combined uncertainty in the timing of hatch and disappearance of 14+ days, and added 12 days to the minimum age of chicks with combined uncertainty of 24+ days. (b) we assumed that a chick fledged, rather than failed, if the difference between its estimated age at disappearance and the fledging cutoff of 36 days was less than 1/4 of the combined uncertainty in the timing of hatch and disappearance for that chick.. Access plots We reached kittiwake nests on six access plots from the beach or by using a ladder or climbing rope. Access plots were established and monitored using the same procedures outlined for visual monitoring plots but facilitated the collection of three additional types of data: (a) Egg measurements: we numbered all newly discovered eggs (n=1768 in all years) on each end with a permanent marker and measured the maximum length and diameter of each egg to the nearest 0.1 mm using dial calipers. We inspected each egg during the visit prior to hatch and recorded evidence of impending hatch (star pips, hole pip) and used this info to refine our estimates of hatch date. Egg volume was computed using the formula: volume = x length x width 2 (Coulson 1963). (b) Chick measurements: we measure the mass of all chicks (n=913 in all years) on every visit using a Pesola spring scale with an accuracy of ± 1-5g (depending on the scale s capacity), and measured the wing chord (± 2mm) of all chicks that had erupted primary feathers. To minimize premature fledging, we stopped handing chicks when their wing cord exceeded 220mm at approximately days of age. We estimated the growth rate of each chick by fitting a linear regression through mass measurements collected between 3 and 22 days of age, a period for which the mass trajectory of even the most rapidly growing chicks was approximately linear. (c) Regurgitation rate of chicks: we recorded whether each chick spontaneously regurgitated during handling as an index of chick provisioning rates (n=4255 total chick handlings in all years). No effort was made to stimulate regurgitation by nestlings. We determined the regurgitation rate for each colony visit (n=171 total visits) by dividing the number of nests from which at least one chick 175
184 regurgitated by the total number of nests with chicks that were handled on each visit (n=2837 total nests with handled chicks). We use colony visits as our sampling unit because chicks within nests and nests within colony visits are not statistically independent. Diet Samples We obtained diet samples from kittiwakes by collecting regurgitations volunteered by adults and nestlings that were captured and handed for other purposes. Diet samples (n=801) were collected from 6 colonies primarily during the nestling period between mid-july and mid August in each year of the study (n=3 years). Samples were grouped by colony and date of visit and five samples with a minimum mass of 5g were randomly selected from each group for processing and identification of prey. Samples varied considerably in their state of digestion so fish and invertebrate prey items were identified from hard parts recovered by picking though samples with the aid of a dissecting scope. Maximum lengths of fish otoliths were measured to the nearest 0.01mm using a calibrated ocular micrometer built into the eyepiece of the dissecting scope. We estimated the fresh-mass of individual fish from otolith measurements using massotolith regression equations derived from voucher samples of fish collected within the study area, and estimated the fresh mass of invertebrate prey items from voucher specimens collected in the Gulf of Alaska and Bering Sea. For each diet sample, we determined the total estimated mass of all prey items and the proportion of the mass of each sample comprised by each prey species. Lastly, the total length of each capelin and sandlance was determined from otolith measurements (via otolith-fish length regressions determined for voucher specimens) and was used to classify individuals as either young of year (YOY) or age 1+ (Hatch and Sanger 1992). For each sample we then determined the proportion of each species that were YOY individuals. Blood Samples and Stress Hormones Over the three years of the study, we collected blood samples from 136 adult kittiwakes captured at their nests with noose poles or foot snares and determined the concentration of corticosterone in blood plasma as a physiological indicator of stress. Samples were obtained within three minutes of capture, before circulating levels of corticosterone became elevated in response to handling-induced stress (Kitaysky et al. 1999). A 0.05ml sample of blood was collected into heparinized capillary or Nettleson tubes from the alar vein (located on the underside of the wing) following puncture with a 25 gauge needle. Blood samples were immediately transferred to 1.5 ml snap-cap vials and stored on ice for several hours until centrifuged and separated. Plasma fractions were drawn off using long-stemmed Pasteur pipettes and were held at -70 C until assayed for corticosterone concentration via a direct radioimmunoassay as detailed in Wingfield and Farner, (1975). Briefly, aliquots of plasma (10-25 µl) were measured into centrifuge tubes and allowed to equilibrate overnight with 2000 cpm tritiated corticosterone. Corticosterone was extracted in 4 ml re-distilled dichloromethane added to each sample. Extracts were aspirated with pasteur pipettes and evaporated under nitrogen in a warm water bath. After evaporation of dichloromethane, samples were resuspended in 550 µl phosphate-buffered saline with gelatin and allowed to equilibrate overnight at 4 C. Aliquots of samples were transferred to duplicate test tubes (200 µl each) for radioimmunoassay. In addition, a 100 µl aliquot was placed in a vial for determination of percentage recovery of the initial 2000 cpm. This recovery value is used to adjust final assayed concentrations of corticosterone. Standard curves were set up over the range of pg. Samples were refrigerated overnight after addition of equal (100 µl) amounts of labeled corticosterone and antiserum. Dextran-coated charcoal (0.5 ml) was added 12 min prior to centrifugation to separate bound and free fractions. Supernatants were decanted into scintillation vials and counted after addition of 4.5 ml Ultima Gold scintillation fluid. Patterns of Colony Attendance We determined the proportion of time that adult kittiwakes spent at the colony and the duration of their foraging trips by outfitting individuals with radio transmitters (n = 29 birds in 2001; n = 39 birds in 2002) and monitoring colony attendance using automated receiving stations that consisted of an ATS (Advanced Telemetry Systems, Isanti MN) model R4000 VHF radio receiver, data collection computer (ATS model D5241), 12v battery (30 amp hour), solar panel (45 watt), and charge regulator (5 amp). We captured adult kittiwakes at their nest sites via noose pole or foot snare and glued 9g radio transmitters (ATS model 3PN) directly to the shafts of three central tail feathers using "superglue" adhesive (Locktite 422) and accelerant (Locktite 712) to reduce setup time. All radio-tagged kittiwakes returned to their nests 176
185 after capture and resumed parental duties. Furthermore, reproductive performance (chicks fledged per nest attempt) of kittiwakes with radio-transmitters was similar to that of kittiwakes without transmitters in both years (2001: 0.68 vs. 0.67, 2002: 0.46 vs. 0.43) suggesting that transmitters had, at most, a limited impact on breeding individuals (Wanless 1992). Receiving stations had a reception range of only a few hundred meters and cycled through all frequencies every 5-10 minutes; therefore, we assumed that birds not detected by the receiving station were absent the colony and were potentially foraging. We validated the proper functioning of automated receiving stations by placing a reference transmitter at each colony to assess false negatives and by including "dummy" frequencies in the list of scanned frequencies to assess false positives. We only used data from time periods during which the receiving station at a given colony functioned correctly. We divided the breeding season into 3 stages that were based on the timing of hatch of the firstchick (a-chick): Incubation (pre-hatch), Early Chick (chicks 0-20 days old), and Late Chick (chicks days old). Kittiwakes with nests containing eggs or chicks were defined as active breeders, and those with empty nests as failed breeders. Thus, an individual kittiwake could contribute data to the analysis as both a breeder and a failed breeder within the same stage of the breeding season. Kittiwakes generally have at least one member of the pair at the nest at all times (Hatch and Hatch 1988), and the attendance behavior of breeding kittiwakes is directly affected by the behavior of their mates. Therefore, we captured only one adult per breeding pair for all nests, except for one nest in 2001 in which we inadvertently captured both adults. We excluded the second bird from this nest from data analysis to not violate the assumption of independence of samples. We continuously collected data of presence at the colony from radio-tagged kittiwakes from July 3 rd to August 30 th (total 59 days) in 2001 and from June 22 nd to August 27 th (total 67 days) in Absences from the colony were calculated as the inverse of presence at the colony. We required a minimum of four bouts of absence and four bouts of presence to include a nest in data analysis. To exclude short absences from the colony for the purpose of roosting, bathing or group "panic flights" (Coulson and Johnson 1993; Hamer et al. 1993), we considered only absences from the colony of longer than 40 minutes to be potential foraging bouts. Black-legged kittiwakes feed mainly during daylight hours and spend much of the night roosting offshore (Coulson and Whooller 1984; Coulson and Johnson 1993). To eliminate the time spent roosting at night from analysis of attendance patterns, we determined Day (5:23am to 11:02pm, total time 17 h 39 min.) and Night (>11:02pm to <5:23am, total time 6 h 21 min.) periods based on mean times of dawn and dusk in the Kodiak region during the month of June. We determined for each individual, within each year and stage of the breeding season, the proportion of the daylight period present at the colony and the average duration of colony absences (foraging bouts) that occurred entirely during the daylight period as indicators of foraging effort. At-Sea Distribution We erected triangulation stations on Pillar Mountain (305m ASL) and Heitman Mountain (260m ASL) to determine the at-sea distribution of kittiwakes. Each station consisted of two 6-element Yagi antennas (Maxrad, Hanover Park, Illinois) "stacked" parallel to one another and attached to a swiveling mast pole. Simultaneous bearings, adjusted to true north, were determined for each transmitter frequency using a null-peak switch box and an R4000 radio receiver (ATS). Triangulation activities at both stations were coordinated via two-way radio. Although we could only detect birds resting on the water over a distance of a few kilometers, we determined that the reception range of a transmitter mounted 3 m above the surface of the water on the rigging of a boat, and that emulated a flying kittiwake, was at least 45km. We determined locations (latitude and longitude) of birds and reference transmitters via triangulation and plotted locations from black-legged kittiwakes in 2001 and In 2003 we switched from land-based triangulation to aerial telemetry to determine the foraging distribution of blacklegged kittiwakes. We determined the location of radio-tagged kittiwakes by flying aerial transects along a fixed grid (10km or 15km) on six occasions between 22 July and 18 August. Aerial transects were flown at meters using a Cessna 206 equipped with paired four-element Yagi antennas mounted on the wing struts. The initial survey covered an area that extended 40 km in all directions (excluding land) from Chiniak and Cliff Islands. The area flown on subsequent flights was expanded in the direction of signals that were detected outside of the original survey coverage area. 177
186 Aerial coverage for all flights combined is shown in Figure 2. We scanned each frequency for 2 seconds using an R4000 VHF receiver (ATS) and a left/right switchbox to determine a subjective measure of signal strength (on a scale of 1-5) and the direction (right or left) of the loudest signal. We estimated bird locations by plotting the location of all signals detected for each individual in ArcView 3.2 (ESRI Inc.) and calculating its weighted mid-point location. We estimate the precision of locations by comparing estimated and actual locations of reference transmitters placed on anchored buoys at known locations. At this time we have not yet completed analysis of aerial telemetry data. Data Analyses General considerations Statistical analyses were performed using Statistical Analysis Software (SAS, Version 8.2), or Sigma Plot (version 3.2). The objective of most statistical analyses was to test for differences among years in reproductive, foraging, and physiological measures of kittiwakes. We included additional pertinent variables (e.g. colony, chick category) as "blocking" factors in ANOVA analyses to statistically control for masking effects these factors could potentially have on difference among years (Neter et al. 1996). We could not and did not test for three-way interactions in these analyses and dropped all two-way interactions where P>0.10 from final models. Where significant two-way interactions were encountered, we examined interaction plots and sub-divided each analysis. We used Tukey's multiple comparisons to compare factor-level means of all significant main effects with α set at Because many ANOVA models were unbalanced, we present least-square means and pooled standard error bars in all figures. Least-square means weight all levels of all factors equally, independent of sample size. Historical Patterns of Abundance and Productivity We used counts of nests and chicks from colony surveys in Chiniak Bay as indices of kittiwake abundance and reproductive performance and used data from surveys initiated in 1975 and conducted annually since the mid 1980's to evaluate historic patterns in these parameters. We performed separate population trend analyses on kittiwake colonies located within "inner" and "outer" regions of Chiniak Bay (Fig. 1) because population trends appeared to differ between regions (Fig. 3a) and because, prior to 1998, complete surveys of outer bay colonies were rare. We determined population trends by fitting regression lines through annual nest-count totals of inner and outer bay colonies and compared trends between regions by testing for differences between slopes of the two regression equations. Kittiwake productivity was determined for each colony in each survey year (n=294 total data points) by dividing total chicks by total nests. We compared productivity between three "regimes" ( , , and ) that represent periods of relative ecosystem stasis in the North Pacific Ocean bounded by abrupt transitions in climate and ecosystem structure (Anderson and Piatt 1999; Hare and Mantua 2000). We controlled for effects of colony location (inner vs. outer) and colony "age" (old vs. new) on kittiwake productivity by incorporating these variables as blocking factors in a three-way ANOVA model. "Old" colonies were present during the initial surveys in 1975 while "new" colonies formed in subsequent years but mainly between 1984 and If age and location are not included in the ANOVA model, variability associated with greater productivity of new (n=13) vs. old (n=9) and of inner bay (n=11) vs. outer bay (n=10) colonies masks effects of regime on productivity. Reproductive Parameters We computed the following reproductive parameters for each visual and nest-access plot in every year of the study: Laying Success = nests with eggs / total nests constructed Hatching Success = total chicks / total eggs (first and re-layed clutches combined) Fledging Success = fledged chicks / total chicks Productivity = fledged chicks / total nests constructed Clutch Size = total eggs (first clutches only) / nests with eggs Lay Date= mean date of lay of "A" eggs in first clutches 178
187 We compared reproductive parameters among years using ANOVAs that incorporated colony and year x colony interaction as blocking factors. For these analyses we used data from 24 plots in 7 colonies and were observed in all three years of the study. Egg volume We compared egg volume among years using an ANOVA that included as blocking factors colony, egg category, and interactions between year, colony and egg category. Interaction terms with p > 0.10 were excluded from the final model. Egg category has three levels that are a combination of clutch size and lay order: (a) lone egg from a single egg clutch, (b) first egg of 2-egg clutch, and (c) second egg of 2-egg clutch. We restricted the analysis of egg volume to data from 5 colonies that provided data on first clutches of 1 and 2 eggs (n= 1389 eggs) in all three years of the study. Nestling growth We compared the growth rate of nestlings among years using a blocked ANOVA that incorporated as blocking factors, colony, chick category and interactions between year and these variables. Chick category has three levels that represent a combination of brood size and hatch order: (a) singleton chick, (b) α chick from a brood of two, (c) β chick from a brood of two. We reclassified α chicks as singletons if the β chick in their nests disappeared before age 12. We restricted the analysis of chick growth to data from 541 chicks from 4 colonies that provided data in all three years of the study. We excluded from this analysis, chicks with fewer than three mass measurements between 3 and 22 days of age. Regurgitation Rate of Nestlings We determined regurgitation rates for each colony visit and separated visits into 3 time periods: (a) July 10-20, (b) July 21-30, and (c) July 31 - August 15. Time periods correspond roughly to early (1-10 days old), mid (11-20 days old), and late (20+ days old) stages of chick rearing and included a minimum of two plot visits per period for each colony (n=4 colonies) that was observed in all three years of the study (n= 89 colony visits in total). We compared regurgitation rates between years with an ANOVA that included as blocking factors, colony, time period and interactions between year and these two variables. Diet Composition Sandlance and Capelin comprised the bulk (90%+) of the diet of kittiwakes; therefore, we pooled sample-proportions from all other species into an "other" prey category. To account for potential effects of season on diet, samples were pooled into 4 time periods within each year of the study: (a) July 10-20, (b) July 21-30, (c) July 31 - August 9, and 4) August 10+. These time periods correspond roughly to early (1-10 days old), mid (11-20 days old), late (21-30 days old) and fledging (31+ day) stages of the chickrearing period. Mean proportions of each prey type were computed for diet samples pooled by colony and time period within each year. These period means were used in statistical analyses because diet samples collected on a given day from a given colony are not independent. We compared kittiwake diet among years with a separate ANOVA for each prey type that included as blocking factors, colony, time period and interactions between year and these two variables. We computed means for the proportion of YOY capelin and sandlance in the kittiwake diet by pooling samples by colony and time period within each year. The resulting period means were used in statistical analyses because diet samples collected on a given day from a given colony are not independent. We compared the proportion of YOY capelin and sandlance among years using an ANOVA model that incorporated as blocking factors colony, time period and interactions between year and these two factors. Blood Samples and Stress Hormones We compared the baseline corticosterone concentration in blood plasma of adult kittiwakes between years using one-way ANOVAs for incubation and brood rearing periods separately. Patterns of Colony Attendance 179
188 For each stage of the breeding season (Incubation, Early Chick, and Late Chick), we compared the proportion of time present at the colony (colony attendance) and the average duration of forging bouts between years (2001, 2002) using a two-factor ANOVA that included breeding status (active or failed) as a blocking factor. Results Historical Patterns of Abundance and Productivity Overall, the kittiwake population in Chiniak Bay increased by 43% in the 19 years since it was first surveyed in 1975 and has increased 84% from a population low in 1997 (Fig. 3a). Trends in nest counts have been largely driven by a significant increase in abundance of nests built within the inner region of Chiniak Bay (slope= 172 nests/year, r 2 =0.74, t 22 = 0.89, P<0.0001). In contrast, outer bay colonies exhibited a declining trend over the past 19 years that borders on significance (slope= -122 nests/year, r 2 =0.35, t 9 = -2.22, P=0.053). Differing trends of inner and outer populations (t 31 =6.07, P<0.0001) can be explained largely by changes in nest counts that occurred between 1984 and 1990 colony surveys: population trends are remarkably concordant between the two regions both before and after this time interval (Fig. 3a). Abrupt declines of nest counts in 1983 and 1997 coincided with extremely intense El Nino events that occurred in and (Fig. 3a). The striking decline in nest-count in 1983 was likely due to reduced nesting propensity rather than real change in kittiwake abundance because it was associated with utter reproductive failure in1983 (Fig. 3b) and was reversed in 1984 (Fig. 4a). For this reason, we excluded data from 1983 from regression analyses of population trends. In contrast to El Nino events, the kittiwake population of Chiniak Bay apparently was not strongly or immediately affected by changing marine conditions associated with regime shifts in 1977, 1989, or 1998 (Fig. 3a). Despite marked inter-annual variability (Fig. 3b), kittiwake productivity in Chiniak Bay differed among regimes (F 2,289 = 14.9, P<0.0001), and was significantly greater for young vs. old colonies (F 1,289 = 21.9, P<0.0001) and for inner vs. outer colonies (F 1,289 = 6.94, P=0.0089). Interactions between regime and age and location blocking factors were not significant (P>0.10) and were dropped from the final model. Post-hoc comparisons revealed that productivity in the current regime of the 2000's was significantly greater (P<0.05) than during the 1980's or 1990's (Fig. 4). Intense El Nino events of and were associated with 2 years of reproductive failure that occurred, in each instance, during the second year of the warm-water event. In contrast, there were only six years of reproductive failure (productivity <0.05) for the 22-year time series on the whole. General Reproductive Parameters Reproductive parameters common to all visual and nest access plots within all colonies monitored in every year of the study are summarized in Tables 1 and 2. ANOVA results described below were based on a subset of 24 reproductive plots within 7 colonies that were observed in all three years of the study. The initial ANOVA performed on kittiwake laying success indicated a significant year x colony interaction (F 12,51 = 1.96, P=0.048). We examined the interaction plot (Fig. 5) and concluded that this interaction was driven by reduced laying success of the KU colony in 2002 and of KU and MA colonies in We neutralized the interaction by separating MA and KU from 5 other colonies and ran separate ANOVA analyses on the two groups. The 5-colony analysis found that laying success did not vary across years (F 2,27 = 0.08, P=0.92, Fig. 6). In contrast, the second analysis of only KU and MA colonies revealed a significant decline in laying success across years (F 2,24 = 4.54, P=0.02, Fig. 6). Post-hoc comparisons indicated that laying success was greater in 2001 vs for these colonies. The initial ANOVA performed on hatching success found a significant year x colony interaction (F 12,51 = 3.98, P=0.0002) that was driven by reduced hatching success of KU and MA colonies in 2002 and of KU, MA, and PU in 2003 (Fig.7). We subdivided this interaction by separating KU, MA and PU from the remaining 4 colonies and performing separate analysis on both groups. In the 4-colony analysis, hatching success did not differ among years (F 2,24 = 0.93, P=0.41, Fig. 8), however, the analysis of KU, MA and PU 180
189 revealed a year effect (F 2,27 = 17.7, P<0.0001) and post-hoc comparisons indicated progressively reduced hatching success from 2001 through 2003 (Fig. 8). Analysis of fledging success revealed a significant year x colony interaction (F 12,46 = 2.37, P=0.02) that was driven by reduced fledging success of the KU colony in 2003 (Fig. 9). We removed the interaction by separated KU from the remaining colonies and found no difference in fledging success among years (F 2,36 = 1.18, P=0.32, Fig. 10). We then performed a one-way ANOVA on KU alone and found a significant decline in fledging success declined across years (F 2,15 = 4.91, P=0.03) and a significant difference between 2001 and 2003 (Fig.10). The initial ANOVA on kittiwake productivity indicated a significant year x colony interaction (F 12,51 = 4.31, P=0.0001) that was driven by reduced productivity of KU, MA and PU in 2002 and 2003 (Fig. 11). We neutralized this interaction by separating KU, MA and PU from the remaining 4 colonies and performing two analyses. Results of the 4-colony ANOVA indicated a trend among years towards higher productivity in 2003 that bordered on significance (F 2,24 = 2.84, P=0.08, Fig. 12). A separate analysis of KU, MA and PU colonies found a significant year effect (F 2,27 = 25.1, P<0.0001) while post-hoc comparisons indicated that productivity declined in a stepwise fashion between 2001 and 2003 (Fig. 12) for those colonies. Analysis of clutch size found a significant year x colony interaction (F 12,51 = 2.40, P=0.02) that was largely driven by low clutch sizes for KU and MA colonies in 2003 (Fig. 13). Excluding KU and MA from the analysis produced no year effect (F 2,27 = 1.36, P=0.27) while a separate ANOVA performed on KU and MA found that clutch size differed among years (F 2,24 = 16.8, P<0.0001, Fig. 14). Post-hoc comparisons for this second analysis revealed that clutch size was significantly smaller in 2003 than in either 2001 or 2002 (Figure 14). Lay date of first clutches differed significantly among years (F 2,63 = 1.46, P=0.25, Figure 15) with no year x colony interaction. Post-hoc comparisons revealed that laying was delayed by 3 days in 2003 relative to 2001 and 2002 (Fig. 15). Additional Reproductive Parameters Reproductive parameters only available from nest access plots (egg volume, chick growth, regurgitation propensity, and diet composition) are presented in Tables 2 and 3. ANOVA results for egg volume and chick growth are based on data for 5 reproductive plots from 5 colonies that were sampled in all 3 years of the study. Analyses of regurgitation propensity and diet composition were based on data from 4 colonies with samples from all time periods. Egg volume significantly differed among years (F 2,1380 = 3.10, P=0.05, Fig. 16) and displayed no interaction between year and either colony or egg category. Post-hoc comparisons revealed that eggs were larger in 2002 than 2003 (Fig.16). Analysis of chick growth rates revealed a significant year x colony interaction (F 6,535 = 2.58, P<0.02) that was driven by decreased growth rates for the KA colony in 2002 (Fig. 17). When we excluded KA and repeated the analysis, we found a significant effect of year (F 2,443 = 5.83, P<0.003) and post-hoc comparisons indicated a higher growth rate in 2003 than in either 2001 or 2002 (Fig. 18). Analysis of KA alone also found a significant affect of year on growth rate (F 2,90 = 9.15, P<0.0002) while post-hoc comparisons indicated lower growth rates in 2002 vs. either 2001 or 2003 (Fig.18). Propensity of nestling kittiwakes to regurgitate did not differ among years (F 2,81 = 0.67, P<0.51; Fig. 19). All two-way interactions were not significant and were dropped from the final ANOVA model. Diet Composition We preformed separate analyses of diets of kittiwake chicks on each of three prey categories: capelin, sandlance, and a catch-all "other" category. Note, however, results of the analyses of capelin and sandlance in the diets are not independent because roughly 90% of the kittiwake diet was comprised of these two prey types and their relative abundance in a diet sample is highly buy inversely related. 181
190 The proportion of capelin and sandlance in kittiwake diets varied among years (capelin, F 2,32 = 6.73, P=0.004; sandlance, F 2,32 = 13.14, P<0.0001; Fig. 20). Significant year x time period interactions for capelin (F 6,32 = 2.72, P=0.03) and sandlance (F 6,32 = 2.39, P=0.05) were driven by a high proportion of capelin and low proportion of sandlance within the 3rd time period of 2001 (Fig. 21). Excluding the 3rd time-period from these analyses to neutralize this interaction did not affect the results substantively. Posthoc comparisons indicated an increased contribution of capelin (and reduced sandlance) to the diet of kittiwakes across years, with 2003 significantly greater than either 2001 or The proportion of YOY sandlance in the diet of kittiwakes increased across years (F 2,38 = 9.96, P=0.0003; Fig. 22). All interactions were not significant and were dropped from the final model. Post-hoc comparisons indicated that the abundance of YOY sandlance was greater in 2003 than either 2001 or Corticosterone Baseline levels of plasma corticosterone significantly differed among years during the brood rearing period (F 2,78 = 5.74, P=0.005; Fig. 23) but not during incubation (F 2,80 = 1.67, P=0.20; Fig. 23). Post-hoc comparisons indicated significantly elevated levels of corticosterone in 2003 vs during the brood rearing period. Patterns of Colony Attendance The proportion of daylight hours that actively breeding kittiwakes were away from the colony foraging was significantly greater in 2002 vs during the early chick and late chick stages of the breeding season, but did not differ between years during the incubation period. The duration of foraging trips undertaken by actively breeding kittiwakes during the daylight hours was significantly longer during the incubation period in 2001 vs. 2002, was significantly shorter during the late nestling period in 2001 vs and did not differ between years during the early chick period. At-Sea Distribution We determined 70 locations for black-legged kittiwakes during 6 triangulation sessions in 2001 and 137 locations during 11 triangulation sessions in In 2001, black-legged kittiwakes were concentrated inside Chiniak Bay, with many found along the Cape Chiniak coastline (Fig. 26a). In 2002, a number of locations were documented well beyond the confines of Chiniak Bay to the north and east (Fig. 26b). Discussion Historical Trends in Abundance and Productivity Opposite trends in kittiwake populations between outer vs. and inner regions of Chiniak Bay were driven by a substantial decline in the outer bay population between 1984 and 1990 (Fig. 2a) that resulted from a 50% decline (3100 nests) from the large colony at Cape Chiniak. Between 1984 and 1990, kittiwakes in Chiniak Bay experienced generally poor productivity (Fig. 2b). Despite this, 10 new breeding colonies (4 outer bay, 6 inner bay) formed and grew rapidly. These observations suggest that regional population trends within Chiniak Bay may have been driven by the mass emigration of adult birds from the Cape Chiniak colony; however, declines in the outer bay far exceeded gains in the inner bay (Fig 2a) and the kittiwake's high fidelity to nest sites and mates (Baird 1994) suggest that other factors are responsible. Depressed nest counts of kittiwakes in 1983 and were associated with extreme El-Nino events and low breeding success of kittiwakes in Chiniak Bay (Fig. 2a) and the western Gulf of Alaska (Hatch 1987). The recovery of nest counts one year after the El Nino and within two years of the event, suggest that low nest counts were likely caused by reduced nesting propensity rather than actual population declines. El Nino events can have "bottom up" effects on breeding seabirds by altering ocean temperature, nutrient availability, and phytoplankton production in the Gulf of Alaska kittiwakes 182
191 typically exhibit (Goes et al. 2001; Whitney and Welch 2002), but warmer water temperature can also affect seabirds more directly by affecting the abundance (Harding et al. 2003) and distribution (Stergiou 1991) of forage fishes such as capelin and sandlance. In contrast to El-Nino events, regime shifts in ocean climate did not appear to affect kittiwake nest counts. Differences in kittiwake productivity across regimes were likely due to differences in ecosystem structure that characterized each time period (Anderson and Piatt 1999). Poor kittiwake productivity recorded during the mid-late 1980's was associated with a "warm" regime and the absence of energy rich capelin from trawl surveys (Anderson and Piatt 1999) and seabird diets (Francis et al. 1998) in the region. Increased productivity of kittiwakes in the 1990's followed a "minor" regime shift that was characterized by ecosystem reorganization rather that climatic change (Hare and Mantua 2000), and that was associated with reduced zooplankton and increased groundfish (cod, pollock, flatfish) in the Gulf of Alaska (Anderson and Piatt 1999). Higher kittiwake productivity in the recent years has been associated with cooler ocean temperatures that have prevailed since a candidate regime shift back to a "cold" state in late 1998 (Hare and Mantua 2000). Kittiwakes as Bio-Indicators of Forage Fish Abundance We monitored a suit of dietary, reproductive, physiological and behavioral parameters of kittiwakes as indicators of the abundance and distribution of forage fishes within Chiniak Bay. Each monitored parameter is specific to a particular stage of the breeding season and may be more or less sensitive to food abundance. We will first consider the implications of each parameter separately then will then attempt to integrate these diverse indicators to arrive at a generalized view what kittiwakes tell us about how foraging conditions in Chiniak Bay have changed over the three years of our study. Diet - Kittiwakes are generalist foragers who's diet reflects the abundance of surface schooling forage fishes within foraging range ( km, ref.) of their breeding colonies (Suryan et al. 2002). An increased abundance of capelin in the kittiwake diet between 2001 and 2003 and a reduced abundance and average size of sandlance, suggests that kittiwakes responded to reduced availability larger size classes of sandlance in the near shore environment by foraging farther offshore where they encountered more abundant capelin. Reproductive Performance - Kittiwakes are long-lived seabirds and that face a life history tradeoff between survival and reproduction (Golet et al. 2004). Breeding kittiwakes will curtail or abandon reproductive investment when faced with food limitation that exceeds their behavioral buffering capability (Hamer et al. 1993). As a result, overall productivity and several of its component measures of reproductive success (clutch size, laying success, hatching success, and fledging success) are sensitive to food availability (Hamer et al. 1993; Gill et al. 2002). Interpreting trends in measures of reproductive performance of kittiwakes across years is complicated by interactions between effects of year and colony for a number of parameters. Our results indicated two discrete patterns of reproductive performance: some colonies displayed no trend in productivity among years while others exhibited a stepwise decline in productivity across years that was inline with a the more general bay wide pattern (Fig. 4b). Productivity declines were mainly a consequence of reduced hatching success and to a lesser degree, reduced clutch size and laying success. In contrast, fledging success did not differ among years and did not contribute to differing trends in productivity among colonies. Access to food resources is not responsible for differing productivity trends among colonies because they are located near to one another and, in principal have overlapping foraging ranges and share common food resources. Measures of reproductive performance are unique relative to all other monitored parameters because they may be influenced by predation in addition to food abundance. Predation affect hatching and fledging success directly through loss of eggs and nestling but can also indirectly lead to underestimation of clutch size and laying success because eggs can be laid and lost to predators before they are documented. We propose that predation may be responsible for differing trends in reproductive performance of kittiwakes observed among colonies. Northwestern crows and black-billed magpies are abundant within Chiniak Bay and are facultative predators of kittiwake eggs that are dependant on the disturbance of nesting kittiwakes by less abundant peregrine falcons, bald eagles, common ravens and, on occasion, humans. Peregrine falcons are the least common of the larger aerial predators but target 183
192 adult kittiwakes as well as large nestlings. Even though eagles and ravens rarely target adult kittiwakes, kittiwakes react to their presence and ravens can be extremely effective egg predators. Predation can affect reproductive performance directly but may also act in concert with food supply when food abundance is limited, predation may be facilitated by inconsistent nest attendance and reduced nest defense by breeding kittiwakes (Hamer et al. 1993; Gill et al. 2002). Predator activity is inherently patchy and it may have been mere chance that particular colonies in 2002 and 2003 were spared from predators at a time when predation severely reduced reproductive performance in other colonies. Timing of Breeding The timing of kittiwake egg lying is in part dependant on the availability of food (Gill et al. 2002). Our results indicated delayed egg laying in 2003 that was correlated with colder ocean temperature, delayed spring bloom (R. Foy, unpublished data) which likely delayed the development of the marine food web and the availability of forage fishes in Egg Volume - Egg volume is affected at least in part by food availability during egg development (Gill et al. 2002). Larger eggs in 2002 suggest that early season foraging conditions in this year were better than the other two years of the study. Chick Growth Rate and Regurgitation Propensity Food limitation is known to affect chick growth rates by reducing the ability of adult kittiwakes to provision their chicks (Suryan et al. 2002). Our results suggest that kittiwakes were better able for provision young in 2003 vs or 2002, either by increasing the frequency of meal delivery or by providing larger meals to nestlings. Plasma Corticosterone Baseline levels of corticosterone in blood plasma are thought to reflect an individual's level of energetic stress and physiological condition. Kitaysky et al. (1999) demonstrated that levels of plasma corticosterone of adult black-legged kittiwakes during the breeding season are correlated with body condition, food abundance, and reproductive performance and can serve as a measure of regional productivity of the marine ecosystem. Increased baseline corticosterone in breeding kittiwakes across years during the nestling period but not the incubation period suggests that foraging conditions declined as the breeding season progressed in 2003 and, to a lesser degree, in Patterns of Nest Attendance-- The duration of foraging trips and the proportion of time that adult seabirds spend away from the colony foraging are both negatively correlated with food availability in the marine environment (Hamer et al. 1993) and are positively associated with distance traveled away from the colony (Suryan et al. 2000). Shorter foraging trips displayed by breeding kittiwakes during the incubation period in 2002 indicate better foraging conditions relative to In contrast, in 2002, increased foraging time during the early chick period and increases in both foraging time and trip during in the late chick period all suggest that foraging conditions progressively deteriorated over the 2002 season relative to At-Sea Distribution We observed that kittiwakes foraged at a greater distance from the colony during the nestling period in 2002 vs These results suggest that foraging conditions within the bay were poor and that individuals needed to travel further to obtain food in Kittiwakes as Bio Indicators: an integrated view of the big picture While all monitored parameters reflect food availability and are potential indicators of marine conditions and forage fish abundance, they differ with regards to their capacity to be influenced by predation. Basic reproductive parameters (i.e., productivity and all of its component measures of breeding performance; clutch size, laying success, hatching success, and fledging success) are sensitive to the level of predation, while all other parameters are not. The predator-insensitive parameters that we monitored all share striking similarities in trend across years. Delayed timing of egg laying in 2003 was associated with cool marine conditions and delayed arrival of the spring phytoplankton bloom (R. Foy, unpublished data), the annual phenomenon that jump starts the marine production cycle in temperate latitudes. An increased abundance of capelin in the diet of nestling kittiwakes between 2001 and 2003 was matched by a corresponding decline the prevalence, size and energy content (Van Pelt et al. 1997) of sandlance. The growth rate of nestling 184
193 kittiwakes was greatest in 2003 but exhibited a downward trend between 2001 and 2002 that was consistent with trends toward longer, more distant foraging trips, increased time spent foraging, and increased corticosterone during the nestling period. These trends suggest that forage fishes were less abundant during the nestling period in 2002 and that kittiwakes had to work harder to provision their chicks. In contrast to these late-season indicators, larger egg size and shorter foraging trips during the incubation period in 2002 suggest that early-season foraging conditions were better in 2002 than in either 2001 or The only incongruence within the entire suite of predation-insensitive monitoring parameters was that elevated nestling growth rates indicated better foraging conditions in 2003 whereas elevated levels of corticosterone during the brood rearing period suggests the opposite trend. Possibly, adult kittiwakes suffered elevated levels of corticosterone in 2003 because they foraged at greater distances from their colonies while nestlings exhibited rapid growth because they were provisioned with energy rich capelin. Future analysis of nest attendance data for the nestling period in 2003 will help address this unresolved issue. In contrast to the great consistency observed among predation-insensitive monitoring parameters, predator-sensitive reproductive parameters exhibited two distinct patterns among years: reproductive performance of some colonies declined across years while that of others exhibited no significant trend. We argue that differing levels of predation are responsible for divergent productivity trends of these colonies because the period of greatest discrepancy in productivity among colonies (egg laying and incubation) is the stage of breeding for which kittiwakes are susceptible to the most abundant predators within Chiniak Bay (ravens, crows, and magpies). In addition, while the few colonies that appeared to escape egg predation displayed no trend across years for clutch size, or for laying, hatching, or fledging success, they did exhibit a borderline significant pattern of productivity that precisely mirrors that observed for nestling growth rate and other predation-insensitive parameters during the nestling period: productivity was greatest in 2003 and displayed a modest decline from 2001 to We have argued that foraging conditions cannot be directly responsible for declining reproductive performance observed in many kittiwake colonies across years because colonies have overlapping foraging ranges and share common food resources. Instead, we suspect that declining reproductive performance was due to elevated levels of egg predation in 2002 and 2003 but cannot exclude the possibility that food limitation may have facilitated egg predation by diminishing the breeding tenacity of adult kittiwakes. While larger eggs and shorter foraging trips suggest better early season foraging conditions for kittiwakes in 2002 and argue against the "predator facilitation" hypothesis, foraging conditions for kittiwakes fluctuate on a short time scale (Suryan et al. 2002), and neither egg volume data from the pre-laying period nor nest attendance or corticosterone data from late incubation period are truly contemporaneous with the period of peak egg predation during the first two weeks of incubation (D. Kildaw unpublished data). We require corticosterone and colony attendance data from the early incubation period to better address the predator facilitation hypothesis. To summarize, kittiwake monitoring parameters suggest the follow trends in marine conditions and forage fish abundance within Chiniak Bay: Foraging conditions were consistently good across the entire breeding season for most colonies and parents provisioned nestlings primarily with energy rich age 1+ sandlance that they captured within the confines of the bay Although foraging conditions appeared to be excellent early in the season, egg predators severely impacted the reproductive output of approximately 50% of kittiwake breeding colonies within the bay. Impaired nestling growth rates indicated that foraging conditions had declined markedly by the nestling period and were the poorest of any year of the study. Adult kittiwakes responded by devoting more time to foraging and by undertaking longer foraging trips that extended beyond the periphery of Chiniak Bay Egg laying was delayed by cool marine conditions in the spring and egg predation severely impacted most kittiwake colonies within the bay. Rapid nestling growth suggested excellent foraging conditions in 2003 while kittiwake parents provisioned nestlings on a diet of energy-rich capelin and, to a lesser degree, on lipid-poor YOY sandlance. 185
194 Literature Cited Aebischer, N. J., J. C. Coulson and J. M. Colebrook (1990). Parallel long-tern trends across four marine trophic levels and weather. Nature 347: Agler, B. A., S. J. Kendall, D. B. Irons and S. P. Klosiewski (1999). Declines in marine bird Populations in Prince William Sound, Alaska coincident with climatic regime shift. Waterbirds 22(1): Anderson, P. J. and J. F. Piatt (1999). Community reorganization in the Gulf of Alaska following ocean climate regime shift. Marine Ecology Progress Series 189: Baird, P. H. (1994). Black-legged kittiwake. Birds of North America. A. Poole and F. Gill. Philadelphia, The Academy of Natural Sciences and The American Ornithologists Union. 92: 28. Barrett, R. E. (2002). Atlantic puffin Fratercula arctica and common guillemot Uria aalge chick diet and growth as indicators of fish stocks in the Barents Sea. Marine Ecology Progress Series 230: Cairns, D. K. (1987). Seabirds as indicators of marine food supplies. Biological Oceanography 5: Coulson, J. C. (1963). Egg size and shape in the kittiwake Rissa tridactyla and their use in estimating age composition of populations. Proceedings of the Zoological Society of London 140: Coulson, J. C. and M. P. Johnson (1993). The attendance and absence of adult Kittiwakes Rissa tridactyla from the nest site during the chick stage. Ibis 135: Coulson, J. C. and R. D. Whooller (1984). Incubation under natural conditions in the kittiwake gull, Rissa tridactyla. Animal Behaviour 32: Daunt, F., S. Benvenuti, M. P. Harris, L. Dall'Antonia, D. A. Elston and S. Wanless (2002). Foraging strategies of the black-legged kittiwake Rissa tridactyla at a North Sea colony: evidence for a maximum foraging range. Marine Ecology Progress Series 245: Durant, J. M., T. Anker-Nilssen and N. C. Stenseth (2003). Trophic interactions under climate fluctuations: the Atlantic puffin as an example. Proceedings of the Royal Society of London B 270: Francis, R. C., S. R. Hare, A. B. Hollowed and W. S. Wooster (1998). Effects of interdecadal climate variability on the oceanic ecosystems of the NE Pacific. Fisheries Oceanography 7(1): Gill, V. A., S. A. Hatch and R. B. Lanctot (2002). Sensitivity of breeding parameters to food supply in black-legged kittiwakes Rissa tridactyla. Ibis 144: Goes, J. I., H. d. R. Gomes, A. Limsakul, W. M. Balch and T. Saino (2001). El Nino related interannual variations in biological production in the North Pacific as evidenced by satellite and ship data. Progress in Oceanography 49: Golet, G. H., J. A. Schmutz, D. B. Irons and J. A. Estes (2004). Determinants of reproductive costs in the long-lived black-legged kittiwake: a multiyear experiment. Ecological Monographs 74(2): Hamer, K. C., P. Monaghan, J. D. Uttley, P. Walton and M. D. Burns (1993). The influence of food supply on the breeding ecology of Kittiwakes Rissa tridactyla in Shetland. Ibis 135: Harding, A. M. A., J. F. Piatt and K. C. Hamer (2003). Breeding ecology of horned puffins (Fratercula corniculata) in Alaska: annual variation and effects of El Nino. Canadian Journal of Zoology 81: Hare, S. R. and N. J. Mantua (2000). Empirical evidence for North Pacific regime shifts in 1977 and Progress in Oceanography 47: Hatch, S. A. (1987). Did the El Nino-southern oscillation affect sseabirds in Alaska? Wilson Bulletin 99(3): Hatch, S. A. and M. A. Hatch (1988). Colony attendance and population monitoring of Black-legged Kittiwakes on the Semidi Islands. Condor 90: Hatch, S. A. and G. A. Sanger (1992). Puffins as samplers of juvenile pollock and other forage fish in the Gulf of Alaska. Marine Ecology Progress Series 80: Kitaysky, A. S. and E. G. Golubova (2000). Climate change causes contrasting trends in reproductive performance of planktivorous and piscivorous alcids. Journal of Animal Ecology 69:
195 Kitaysky, A. S., J. C. Wingfield and J. F. Piatt (1999). Dynamics of food availability, body condition and physiological stress response in breeding Black-legged kittiwakes. Functional Ecology 13: Neter, J., H. Kutner, C. J. Nachtsheim and W. Wasserman (1996). Applied linear statistical models. Boston, McGraw-Hill. Rindorf, A., S. Wanless and M. P. Harris (2000). Effects of changes in sandeel availability on the reproductive output of seabirds. Marine Ecology Progress Series 202: Schell, D. M. (2000). Declining carrying capacity in the Bering Sea: Isotopic evidence from whale baleen. Limnological Oceanography 45: Springer, A. M. (1998). Is it all climate change? Why marine bird and mammal populations fluctuate in the North Pacific. Biotic Impacts of Extratropical Climate Variability in the Pacific, University of Hawaii, University of Hawaii. Springer, A. M., J. A. Estes, G. B. van Vliet, T. M. Williams, D. F. Doak, E. M. Danner, K. A. Forney and B. Pfister (2003). Sequential megafaunal collapse in the North Pacitic Ocean: an ongoing legacy of industrial whaling? Proceedings of the National Academy of Sciences 100(21): Stergiou, K. (1991). Possible implications of climaric variability on the presence of capelin (Mallotus villosus) of th Norwegian coast. Climatic Change 19: Suryan, R. M. and D. B. Irons (2001). Colony and population dynamics of black-legged kittiwakes in a heterogeneous environment. Auk 118(3): Suryan, R. M., D. B. Irons and J. Benson (2000). Prey switching and variable foraging strategies of black-legged kittiwakes and the effect on reproductive success. Condor 102: Suryan, R. M., D. B. Irons, M. Kaufman, J. Benson, P. G. R. Jodice, D. D. Roby and E. D. Brown (2002). Short-term fluctuations in forage fish availability and the effect on prey selection and broodrearing in the black-legged kittiwake Rissa Tridactyla. Marine Ecology Progress Series 236: Van Pelt, T. I., J. F. Piatt, B. K. Lance and D. D. Roby (1997). Proximate composition and energy density of some North Pacific forage fishes. Comparative Biochemical Physiology 118(4): Wanless, S. (1992). Effects of tail-mounted devices on the attendance behavior of kittiwakes during chick rearing. Journal of Field Ornithology 63(2): Whitney, F. A. and D. W. Welch (2002). Impact of the El Nino and 1999 La Nina on nutrient supply in the Gulf of Alaska. Progress in Oceanography 54: Wingfield, J. C. and D. S. Farner (1975). The determination of five steriods in avian plasma by radioimmunoassay and competitive protein binding. Steriods 26:
196 Table 1. Summary of laying success, fledging success, hatching success, and productivity data for all colonies in all years of the study. Year Colony Laying Success proportion of nests ± SD (n) 1 Hatching Success proportion of eggs ± SD (n) 1 Fledging Success proportion of chicks ± SD (n) 1 Productivity chicks fledged/ nest ± SD (n) all na 0.60 ± na (1) ± na (1) ± na (1) all 0.89 ± 0.02 (9) ± 0.12 (9) ± 0.11 (9) ± 0.23 (9) all 0.83 ± 0.10 (10) ± 0.18 (9) ± 0.20 (9) ± 0.31 (10) all 0.75 ± 0.27 (10) ± 0.31 (7) ± 0.28 (7) ± 0.47 (10) KU na 0.60 ± na (1) 0.65 ± na (1) 0.7 ± na (1) 2001 GC 0.90 ± 0.06 (5) 0.33 ± 0.18 (5) 0.48 ± 0.27 (5) 0.29 ± 0.32 (5) 2001 GU 0.86 ± 0.05 (5) 0.70 ± 0.12 (5) 0.85 ± 0.06 (5) 0.96 ± 0.17 (5) 2001 KA 0.86 ± 0.17 (5) 0.58 ± 0.27 (5) 0.64 ± 0.37 (5) 0.88 ± 0.51 (5) 2001 KU 0.90 ± 0.04 (10) 0.55 ± 0.18 (10) 0.68 ± 0.26 (10) 0.68 ± 0.30 (10) 2001 MA 0.87 ± 0.06 (11) 0.72 ± 0.08 (11) 0.79 ± 0.07 (11) 0.99 ± 0.14 (11) 2001 PU 0.89 ± 0.10 (4) 0.73 ± 0.09 (4) 0.85 ± 0.01 (4) 1.04 ± 0.14 (4) 2001 BL 0.91 ± 0.04 (4) 0.67 ± 0.11 (4) 0.71 ± 0.11 (4) 0.86 ± 0.24 (4) 2001 SE 0.94 ± na (1) 0.58 ± na (1) 0.72 ± na (1) 0.74 ± na (1) 2001 SV 0.86 ± 0.11 (4) 0.51 ± 0.15 (4) 0.65 ± 0.10 (4) 0.56 ± 0.16 (4) 2002 GC 0.87 ± 0.05 (5) 0.39 ± 0.20 (5) 0.46 ± 0.21 (5) 0.29 ± 0.20 (5) 2002 GU 0.90 ± 0.07 (5) 0.72 ± 0.06 (5) 0.88 ± 0.05 (5) 1.07 ± 0.13 (5) 2002 KA 0.84 ± 0.08 (4) 0.65 ± 0.09 (4) 0.71 ± 0.19 (4) 0.76 ± 0.28 (4) 2002 KU 0.62 ± 0.27 (9) 0.21 ± 0.24 (9) 0.34 ± 0.36 (9) 0.26 ± 0.34 (9) 2002 MA 0.86 ± 0.09 (11) 0.36 ± 0.20 (11) 0.66 ± 0.25 (11) 0.42 ± 0.27 (11) 2002 PU 0.85 ± 0.11 (4) 0.50 ± 0.17 (4) 0.71 ± 0.16 (4) 0.62 ± 0.30 (4) 2002 BL 0.93 ± 0.04 (4) 0.38 ± 0.35 (4) 0.43 ± 0.50 (4) 0.48 ± 0.55 (4) 2002 SE 0.90 ± na (1) 0.22 ± na (1) 0.52 ± na (1) 0.19 ± na (1) 2002 SV 0.85 ± 0.10 (4) 0.58 ± 0.17 (4) 0.26 ± 0.24 (4) 0.31 ± 0.39 (4) 2002 UT 0.68 ± na (1) na na 0.00 ± na (1) 2003 GC 0.79 ± 0.06 (3) 0.16 ± 0.10 (3) 0.64 ± 0.39 (3) 0.11 ± 0.10 (3) 2003 GU 0.89 ± 0.01 (3) 0.78 ± 0.04 (3) 0.82 ± 0.04 (3) 1.09 ± 0.06 (3) 2003 KA 0.92 ± 0.01 (2) 0.80 ± 0.12 (2) 0.91 ± 0.05 (2) 1.32 ± 0.26 (2) 2003 KU 0.72 ± 0.12 (6) 0.05 ± 0.08 (6) 0.04 ± 0.08 (6) 0.00 ± 0.00 (6) 2003 MA 0.72 ± 0.14 (4) 0.39 ± 0.07 (4) 0.78 ± 0.01 (4) 0.46 ± 0.25 (4) 2003 PU 0.82 ± 0.04 (2) 0.21 ± 0.14 (2) 0.49 ± 0.17 (2) 0.18 ± 0.17 (2) 2003 SV 0.94 ± 0.03 (4) 0.69 ± 0.06 (4) 0.59 ± 0.22 (4) 0.70 ± 0.28 (4) 2003 UT 0.00 ± na (1) na na 0.00 ± na (1) 2003 VE 0.73 ± 0.18 (4) na na 0.00 ± 0.00 (4) 2003 MR 0.94 ± na (1) na na 0.54 ± na (1) 1 = number of reproductive plots, 2 = unpub. data from D. Nysewander, 3 = number of colonies 188
197 Table 2. Summary of data for hatch date, egg volume, clutch size, brood size at hatch and brood size at fledge for all colonies in all years of the study. Year Colon y Hatch Date date in July ± SD (n) 1 Egg Volume cm 3 ± SD (n) 2 Clutch Size eggs/nest ± SD (n) 1 Brood Hatch chicks/nest ± SD (n) 1 Brood Fledge chicks/nest ± SD (n) all 43.4 ± na (1) 4 na 1.65 ± na (1) ± na (1) ± na (1) all 40.0 ± 1.6 (9) ± 0.53 (6) ± 0.1 (9) ± 0.1 (9) ± 0.1 (9) all 41.9 ± 6.8 (10) ± 0.25 (6) ± 0.2 (10) ± 0.1 (9) ± 0.1 (9) all 44.7 ± 3.2 (9) ± 0.58 (5) ± 0.2 (9) ± 0.2 (8) ± 0.1 (8) KU 43.4 ± na (1) na 1.65 ± na (1) 1.48 ± na (1) 1.44 ± na (1) 2001 GC 42.6 ± 0.9 (5) 46.2 ± 3.69 (157) 1.69 ± 0.06 (5) 1.28 ± 0.14 (5) 1.29 ± 0.17 (5) 2001 GU 39.9 ± 1.4 (5) 45.5 ± 2.91 (73) 1.80 ± 0.14 (5) 1.66 ± 0.07 (5) 1.59 ± 0.06 (5) 2001 KA 36.3 ± 2.2 (5) 45.8 ± 3.47 (126) 1.99 ± 0.04 (5) 1.59 ± 0.33 (5) 1.59 ± 0.18 (4) 2001 KU 40.8 ± 2.5 (10) 46.5 ± 3.54 (126) 1.76 ± 0.13 (10) 1.47 ± 0.16 (10) 1.36 ± 0.12 (9) 1.50 ± 0.15 (11) 2001 MA 39.7 ± 0.9 (11) 45.2 ± 3.45 (176) 1.92 ± 0.06 (11) 1.65 ± 0.14 (11) 2001 PU 41.1 ± 0.6 (4) 46.4 ± 2.85 (56) 1.75 ± 0.06 (4) 1.60 ± 0.06 (4) 1.53 ± 0.04 (4) 2001 BL 39.2 ± 1.7 (4) na 1.80 ± 0.12 (4) 1.64 ± 0.16 (4) 1.48 ± 0.14 (4) 2001 SE 39.8 ± (1) na 1.81 ± na (1) 1.71 ± na (1) 1.52 ± na (1) 2001 SV 40.2 ± 2.2 (4) na 1.68 ± 0.23 (4) 1.45 ± 0.07 (4) 1.35 ± 0.03 (4) 2002 GC 40.5 ± 2.2 (5) 46.7 ± 3.75 (154) 1.69 ± 0.13 (5) 1.42 ± 0.14 (5) 1.30 ± 0.22 (5) 2002 GU 38.4 ± 1.5 (5) 46.2 ± 3.45 (70) 1.82 ± 0.13 (5) 1.60 ± 0.08 (5) 1.50 ± 0.03 (5) 2002 KA 38.6 ± 7.3 (4) 46.5 ± 3.22 (70) 1.84 ± 0.06 (4) 1.56 ± 0.09 (4) 1.44 ± 0.13 (4) 2002 KU 45.1 ± 5.2 (9) 45.9 ± 3.09 (102) 1.57 ± 0.17 (9) 1.50 ± 0.11 (5) 1.49 ± 0.29 (5) 1.32 ± 0.28 (10) 2002 MA 40.4 ± 5.7 (11) 46.2 ± 3.46 (92) 1.72 ± 0.18 (11) 1.33 ± 0.20 (11) 2002 PU 40.1 ± 2.8 (4) 46.4 ± 3.32 (67) 1.71 ± 0.18 (4) 1.58 ± 0.12 (4) 1.40 ± 0.10 (4) 2002 BL 37.8 ± 1.4 (4) na 1.82 ± 0.14 (4) 1.40 ± 0.20 (4) 1.58 ± 0.00 (2) 2002 SE 41.0 ± na (1) na 1.70 ± na (1) 1.46 ± na (1) 1.25 ± na (1) 2002 SV 36.8 ± 1.0 (4) na 1.86 ± 0.14 (4) 1.61 ± 0.07 (4) 1.27 ± 0.33 (4) 2002 UT na na na na na 2003 GC 44.1 ± 1.8 (3) 46.0 ± 3.93 (128) 1.54 ± 0.10 (3) 1.55 ± 0.39 (3) 1.45 ± 0.50 (3) 2003 GU 41.5 ± 1.1 (3) 46.1 ± 2.91 (108) 1.86 ± 0.04 (3) 1.65 ± 0.00 (3) 1.49 ± 0.01 (3) 2003 KA 41.6 ± 0.1 (2) 45.7 ± 5.35 (74) 1.89 ± 0.06 (2) 1.74 ± 0.14 (2) 1.68 ± 0.08 (2) 2003 KU 42.8 ± 1.0 (6) 45.7 ± 3.53 (102) 1.48 ± 0.21 (6) 1.63 ± 0.37 (3) 1.00 ± 0.00 (2) 2003 MA 50.6 ± 2.2 (4) 44.5 ± 3.06 (62) 1.42 ± 0.17 (4) 1.27 ± 0.16 (4) 1.15 ± 0.07 (4) 2003 PU 46.0 ± 1.4 (2) na 1.61 ± 0.03 (2) 1.27 ± 0.18 (2) 1.09 ± 0.12 (2) 2003 SV 41.8 ± 1.2 (4) na 1.77 ± 0.15 (4) 1.67 ± 0.07 (4) 1.56 ± 0.13 (4) 2003 UT na na na na na 2003 VE na 45.8 ± 3.72 (25) na na na 2003 MR na na na 1.37 ± na (1) 1.46 ± na (1) 1 = number of reproductive plots, 2 = number of eggs, 3 = unpub. data from D. Nysewander, 4 = number of colonies 189
198 Table 3. Summary of data for chick growth regurgitation propensity and diet composition for all colonies in all years of the study. Year Colony Chick Growth (singleton and A chicks only) g/day ± SD (n) 1 Regurgitation Diet Composition (proportion by mass) ± SD (n) 3 Propensity proportion of nests ± SD (n) 2 Capelin Sandlance Other all 16.3 ± na (1) 5 na na na na 2001 all 16.3 ± 0.5 (6) ± 0.06 (6) ± 0.15 (6) ± 0.19 (6) 5 (6) ± all 16.0 ± 0.8 (6) ± 0.03 (4) ± 0.05 (5) ± 0.07 (5) 5 (5) ± all 16.9 ± 0.6 (4) ± 0.04 (4) ± 0.12 (5) ± 0.13 (5) 5 (5) ± KU 16.3 ± 2.1 (34) na na na na 2001 GC 16.1 ± 2.0 (39) 0.31 ± 0.07 (221) 0.29 ± 0.21 (35) 0.63 ± 0.17 (35) 2001 GU 16.4 ± 1.4 (29) 0.23 ± 0.08 (172) 0.43 ± 0.25 (30) 0.44 ± 0.18 (30) 2001 KA 16.1 ± 1.3 (26) 0.13 ± 0.02 (158) 0.06 ± 0.12 (24) 0.93 ± 0.12 (24) 2001 KU 16.2 ± 1.9 (35) 0.18 ± 0.11 (220) 0.37 ± 0.37 (31) 0.47 ± 0.34 (31) 2001 MA 15.8 ± 1.8 (74) 0.20 ± 0.09 (418) 0.22 ± 0.20 (49) 0.74 ± 0.16 (49) 2001 PU 17.3 ± 1.3 (26) 0.27 ± 0.18 (144) 0.40 ± 0.41 (24) 0.43 ± 0.26 (24) 0.06 ± 0.06 (35) 0.12 ± 0.11 (30) 0.00 ± 0.01 (24) 0.15 ± 0.18 (31) 0.03 ± 0.07 (49) 0.15 ± 0.20 (24) 2002 GC 15.8 ± 1.7 (30) 0.15 ± 0.06 (200) 0.31 ± 0.33 (28) 0.57 ± 0.31 (28) 0.10 ± 0.09 (28) 2002 GU 16.5 ± 2.3 (27) 0.23 ± 0.06 (169) 0.39 ± 0.11 (40) 0.49 ± 0.12 (40) 0.10 ± 0.08 (40) 2002 KA 14.8 ± 2.1 (14) 0.16 ± 0.12 (146) 0.21 ± 0.23 (21) 0.75 ± 0.24 (21) 0.03 ± 0.06 (21) 2002 KU 17.2 ± 2.0 (3) na na na na 2002 MA 16.0 ± 2.1 (30) 0.17 ± 0.09 (196) 0.38 ± 0.16 (35) 0.56 ± 0.11 (35) 0.04 ± 0.06 (35) 2002 PU 15.6 ± 2.5 (9) na 0.52 ± 0.43 (14) 0.41 ± 0.36 (14) 0.05 ± 0.09 (14) 2003 GC 17.4 ± 2.6 (22) 0.21 ± 0.07 (116) 0.59 ± 0.22 (28) 0.34 ± 0.26 (28) 0.06 ± 0.07 (28) 2003 GU 17.3 ± 2.1 (44) 0.22 ± 0.06 (290) 0.57 ± 0.07 (47) 0.22 ± 0.12 (47) 0.20 ± 0.11 (47) 2003 KA 16.8 ± 2.7 (22) 0.12 ± 0.05 (151) 0.25 ± 0.09 (28) 0.58 ± 0.11 (28) 0.10 ± 0.18 (28) 2003 KU na na 0.69 ± 0.42 (6) 0.30 ± 0.42 (6) 0.00 ± 0.00 (6) 2003 MA 15.9 ± 2.0 (22) 0.20 ± 0.12 (167) 0.46 ± 0.04 (36) 0.43 ± 0.03 (36) 0.09 ± 0.01 (36) 1 = number of chicks. 2 = number of nests, colony means (±SD) computed from means for three time periods that are each based on regurgitation proportions from a minimum of two plot-visit per time period. 3 = number of diet samples, colony means (±SD) computed from means of samples within 4 time periods. 4 = D. Nysewander unpub. data. 5 = number of colonies contribution to annual mean. 190
199 1 Kodiak Island Inner Bay 9 8 Outer Bay Alaska Chiniak Bay 10 km Figure 1. Locations of 22 black-legged kittiwake breeding colonies (see key below) within the Chiniak Bay study area on Kodiak Island, in the western Gulf of Alaska. The dashed line demarcates inner bay and outer bay regions. Colonies are identified by their two-letter abbreviation throughout this report. 1=Mary I. (MA), 2=Blodgett I. (BL), 3=Puffin I. (PU), 4=Gibson Cove (GC), 5=Sealand (SE), 6=Gull I. (GU), 7=Crooked I. (CR), 8=Kulichkof I. (KU), 9=Holiday I. (HO), 10=Marathon Rock (MR), 11=Veisoki I. (VE), 12=Queer I. (QU), 13=Kalsin I. (KA), 14=Utesistoi I. (UT), 15=Svitlak I. (SV), 16=Middle I., 17=Pinnacle Rock (PR), 18=Kekur I. (KE), 19= Cape Chiniak Is. (CH), 20=Long I. Inner (LI), 21=Long I. Outer (LO), 22=Cliff I. (CI) 191
200 Figure 2. Coverage area of aerial transects flown in 2003 to determine the at-sea distribution of kitiwakes. 192
201 a) Nest Count (1000's) Whole Bay Outer Bay Inner Bay b) Productivity Outer Bay Inner Bay Year Figure 3. a) Trends in count of kittiwake nests within inner and outer regions of Chiniak Bay between 1975 and Dashed lines indicate "regime shift" events that occurred in 1977, 1989, and Bars beneath the x-axis indicate extreme El Nino events. b) Trends in productivity (chicks fledged/nest) of kittiwakes within inner and outer sections of Chiniak Bay. Dashed lines indicate regime shift events that occurred in 1977, 1989, and Bars beneath the x-axis indicate extreme El Nino events. 193
202 0.4 Productivity a a b 1980's 1990's 2000's Regime Figure 4. Kittiwake productivity differed among climatic "regimes" in the Gulf of Alaska. Letters at the base of each bar indicate results of Tukey's post-hoc comparisons: bars sharing a letter do not differ significantly. 1 Laying Success GC GU KA SV PU MA Colony KU Figure 5. Interaction plot of mean (±SE) laying success (nests with eggs/total nests) of black-legged kittiwakes in 7 colonies within Chiniak Bay, Alaska for An extreme lack of parallelism between lines illustrates the interaction between year and colony. Colonies were separated into two groups indicated by the vertical hatched line to neutralize the interaction. 194
203 1 GC, GU, KA, SV, PU MA, KU Laying Success Year Figure 6. Mean (±SE) laying success (nests with eggs/total nests) for 7 colonies that were divided into two groups to neutralize an interaction between year and colony. Letters at the base of each bar present results of Tukey's post-hoc comparisons within each group: bars that share a letter are not significantly different. a a,b b 1 Hatching Success GC GU KA SV PU MA Colony KU Figure 7. Interaction plot of mean (±SE) hatching success (chicks hatched/total eggs) of black-legged kittiwakes in 7 colonies within Chiniak Bay, Alaska for An extreme lack of parallelism between lines illustrates the interaction between year and colony. Colonies were separated into two groups indicated by the vertical hatched line to neutralize the interaction. 195
204 1 GC, GU, KA, SV PU, MA, KU Hatching Success a b c Year Figure 8. Mean (±SE) hatching success (chicks hatched/total eggs) for 7 colonies that were divided into two groups to neutralize an interaction between year and colony. Letters at the base of each bar present results of Tukey's post-hoc comparisons within each group: bars that share a letter are not significantly different. 196
205 Fledging Success GC GU KA SV PU MA Colony KU Figure 9. Interaction plot of mean (±SE) Fledging success (chicks fledged/chicks hatched) of blacklegged kittiwakes in 7 colonies within Chiniak Bay, Alaska for An extreme lack of parallelism between lines illustrates the interaction between year and colony. Colonies were separated into two groups indicated by the vertical hatched line to neutralize the interaction. Fledging Success GC, GU, KA, SV, PU, KU 0 a a,b b Year Figure 10. Mean (±SE) Fledging success (chicks fledged/chicks hatched) for 7 colonies that were divided into two groups to neutralize an interaction between year and colony. Letters at the base of each bar present results of Tukey's post-hoc comparisons within each group: bars that share a letter are not significantly different. 197
206 Productivity GC GU KA SV PU MA Colony KU Figure 11. Interaction plot of mean (±SE) overall productivity (chicks fledged/total nests) of black-legged kittiwakes in 7 colonies within Chiniak Bay, Alaska for An extreme lack of parallelism between lines illustrates the interaction between year and colony. Colonies were separated into two groups indicated by the vertical hatched line to neutralize the interaction. Productivity GC, GU, KA, SV Year PU, MA, KU a b c Figure 12. Mean (±SE) overall productivity (chicks fledged/total nests) for 7 colonies that were divided into two groups to neutralize an interaction between year and colony. Letters at the base of each bar present results of Tukey's post-hoc comparisons within each group: bars that share a letter are not significantly different. 198
207 Clutch Size GC GU KA SV PU MA Colony KU Figure 13. Interaction plot of mean (±SE) clutch size of black-legged kittiwakes in 7 colonies within Chiniak Bay, Alaska for An extreme lack of parallelism between lines illustrates the interaction between year and colony. Colonies were separated into two groups indicated by the vertical hatched line to neutralize the interaction. Clutch Size GC, GU, KA, SV, PU MA, KU Year a a b Figure 14. Mean (±SE) clutch size for 7 colonies that were divided into two groups to neutralize an interaction between year and colony. Letters at the base of each bar present results of Tukey's post-hoc comparisons within each group: bars that share a letter are not significantly different. 199
208 18 Lay Date of first egg (date in June) a a b Year Figure 15. Mean lay date (± SE) of the first egg of black-legged kittiwake clutches for 7 colonies within Chiniak Bay, AK from Letters at the base of each bar indicate results of Tukey's posthoc comparisons: bars sharing a letter do not differ significantly. 47 Egg Volume (CC) a,b a b Year Figure 16. Mean egg volume (±SE) of black-legged kittiwakes for 5 colonies in Chiniak Bay, Alaska Letters at the base of each bar indicate results of Tukey's post-hoc comparisons: bars sharing a letter do not differ significantly. 200
209 Chick Growth Rate (g/day) GC 15 GU 25 MA 35 KA 45 Colony Figure 17. Interaction plot of mean linear growth rate (±SE) of body mass of black-legged kittiwake chicks for 4 colonies within Chiniak Bay, Alaska for An extreme lack of parallelism between lines illustrates the interaction between year and colony. Colonies were separated into two groups indicated by the vertical hatched line to neutralize the interaction. Growth rate is defined as slope of a linear regression model fitted to mass-at-age data from individual chicks for which a minimum of 3 mass measurements were collected between 3 and 22 days of age, a period within which growth is approximately linear. 18 GC, GU, MA KA Chick Growth Rate (g/day) a a b Figure 18. Mean linear growth rate (±SE) of body mass of black-legged kittiwake chicks for 4 colonies that were divided into two groups to neutralize an interaction between year and colony. Letters at the base of each bar present results of Tukey's post-hoc comparisons within each group: bars that share a letter are not significantly different. Growth rate is defined as slope of a linear regression model fitted to mass-at-age data from individual chicks for which a minimum of 3 mass measurements were collected between 3 and 22 days of age, a period within which growth is approximately linear. 201 Year a b a
210 Proportion Regurgitating Year Figure 19. The mean proportion of nestling kittiwakes that regurgitated in response to researcher disturbance did not differ among years (F 2,71 =0.86, P=0.43) in Chiniak Bay, AK Bars represent means (±SE) of proportions computed for each plot visit by dividing the number of nests with chicks that provided regurgitations by the total number of nests with chicks. If fewer than 10 nests were sampled on a given plot visit, data were pooled with those of the next nearest visit. Proportion of Total Sample Mass a a a a b capelin sandlance other prey Year b Figure 20. Diets of black-legged kittiwakes in Chiniak Bay, AK Proportion of capelin in the diet of black-legged kittiwakes increased across years (p=0.004) at the expense of sandlance (p=0.001). Mean proportions (±SE) are indicated and were computed from mean values for diet samples pooled for each colony within 4 seasonal time periods. 202
211 a) Capelin (prop. of sample mass) b) Sandlance (prop. of sample mass) July July 35Aug July July Aug Time Period Figure 21. Interaction plots of diet composition (mean ± SE) of black-legged kittiwakes in 4 time periods for An extreme lack of parallelism between lines illustrates the interaction between year and time period that was driven by increased capelin, and reduced sandlance, during the 3rd time period in Proportion of YOY Fish by Species capelin sandlance 0 a a b Figure 22. The proportion of YOY individuals in the diets of black-legged kittiwakes by year in Chiniak Year Bay, AK Proportion of YOY individuals in the diet increased across years for sandlance but, for capelin, was negligible in all years. 203
212 Baseline Corticosterone (ng/ml) Incubation Nestling a a,b Year b Figure 23. Baseline levels (mean ±SE) of plasma corticosterone for free-living adult black-legged kittiwakes during incubation and nestling periods in Chiniak Bay, AK Results of pair wise comparisons within each period are denoted with letters: bars that share a letters do not differ. 0.7 Proportion of Day Spent Foraging Incubation Early Chick Late Chick 0.4 a a a a b Year b Figure 24. Mean proportion (±SE) of daylight period devoted to foraging by kittiwakes for three periods of the breeding season (Incubation, Early Chick, Late Chick) in 2001 and Letters denote significant differences between years within each period: bars that share a letter do not differ. 204
 of foraging bouts of breeding kittiwakes during three periods of the breeding season (Incubation, Early Chick, Late Chick) in 2001 and 2002.")
 locations (n = 70) for 27 black-legged kittiwakes in 2001.")
213 Foraging Trip Duration (hrs) a a Figure 25. Mean duration (hrs ±SE) of foraging bouts of breeding kittiwakes during three periods of the breeding season (Incubation, Early Chick, Late Chick) in 2001 and Letters denote significant differences between years within each period letter do not differ. b Year b Incubation Early Chick Late Chick (A) (B) Figure 26. Triangulated locations of kittiwakes equipped with radio-transmitters in Chiniak Bay, Alaska. (A) locations (n = 70) for 27 black-legged kittiwakes in (B) locations (n = 137) for 36 blacklegged kittiwakes in Concentric rings located at 10- and 20-nautical mile from the north eastern tip of Long Island. Green stars show the location of two triangulation stations. 205
Effect of Ocean Conditions on the Cross-shelf Distribution of Walleye Pollock (Theragra chalcogramma) and Capelin (Mallotus villosus)
 and Capelin (Mallotus villosus)") Effect of Ocean Conditions on the Cross-shelf Distribution of Walleye Pollock (Theragra chalcogramma) and Capelin (Mallotus villosus) Anne Hollowed, Chris Wilson, Phyllis Stabeno, and Libby Logerwell National
Effect of Ocean Conditions on the Cross-shelf Distribution of Walleye Pollock (Theragra chalcogramma) and Capelin (Mallotus villosus) Anne Hollowed, Chris Wilson, Phyllis Stabeno, and Libby Logerwell National
Fine-Scale Survey of Right and Humpback Whale Prey Abundance and Distribution
 DISTRIBUTION STATEMENT A. Approved for public release; distribution is unlimited. Fine-Scale Survey of Right and Humpback Whale Prey Abundance and Distribution Joseph D. Warren School of Marine and Atmospheric
Ecological interactions between forage fish, rorquals, and fisheries in Haida Gwaii
 Ecological interactions between forage fish, rorquals, and fisheries in Haida Gwaii Szymon Surma MSc candidate UBC Fisheries Centre The problem rorquals: lunge-feeding baleen whales eat large quantities
7 GULF OF ALASKA POLLOCK
 7 GULF OF ALASKA POLLOCK 7.1 Introduction For the Gulf of Alaska (GOA) pollock fishery, the Principle 1 and 2 PIs were mapped against the following indicators within the stated reports: FAM PI: Assessment
Co-Principal Investigators Stephen C. Jewett, Ph.D. Paul C. Rusanowski, Ph.D.
 PROGRESS REPORT FACTORS AFFECTING NEARSHORE SURVIVAL AND PRODUCTION OF JUVENILE SOCKEYE SALMON FROM KVICHAK BAY Phase I: Important habitat, migration routes and food resources CoPrincipal Investigators
Interactions in a multispecies age-structured assessment model for the Gulf of Alaska
 Interactions in a multispecies age-structured assessment model for the Gulf of Alaska Kray F. Van Kirk SFOS UAF Juneau, Alaska Terrance J. Quinn II SFOS UAF Juneau, Alaska Jeremy S. Collie GSO URI Narragansett,
Alaska Salmon Shark Assessment Project
 Alaska Salmon Shark Assessment Project Project Number: 02396 Restoration Category: Proposer: Lead Trustee Agency: Cooperating Agencies: Alaska Sea Life Center: Duration: Cost FY 02: Research NOAA Dr. Stan
STOCK ASSESSMENT AND FISHERY EVALUATION REPORT FOR THE GROUNDFISH FISHERIES OF THE GULF OF ALASKA AND BERING SEA/ALEUTIAN ISLAND AREA:
 STOCK ASSESSMENT AND FISHERY EVALUATION REPORT FOR THE GROUNDFISH FISHERIES OF THE GULF OF ALASKA AND BERING SEA/ALEUTIAN ISLAND AREA: ECONOMIC STATUS OF THE GROUNDFISH FISHERIES OFF ALASKA, 1998 by Terry
Cook Inlet Habitat Conservation Strategy
 Cook Inlet Habitat Conservation Strategy What is the Cook Inlet Habitat Conservation Strategy? It s a new effort to tie together all of NOAA Fisheries habitat-related science and management activities
Zooplankton community structure in the northern Gulf of Mexico: Implications for ecosystem management
 Zooplankton community structure in the northern Gulf of Mexico: Implications for ecosystem management By Andrew F. Millett Dauphin Island Sea Lab University of South Alabama W. Monty Graham, Glenn A. Zapfe,
Fine-scale Focal DTAG Behavioral Study in the Gulf of Maine
 DISTRIBUTION STATEMENT A: Approved for public release; distribution is unlimited. Fine-scale Focal DTAG Behavioral Study in the Gulf of Maine Alessandro Bocconcelli Woods Hole Oceanographic Institution
2016 West Coast Entanglement Summary
 March 2017 2016 West Coast Entanglement Summary Overview of Entanglement Data west coast region MMHSRP Permit #18786 In 2016, 71 separate cases of entangled whales were reported off the coasts of Washington,
Arctic Fisheries: Present and future perspectives
 Challenges of the Changing Arctic: Continental Shelf, Navigation and Fisheries Arctic Fisheries: Present and future perspectives Harald Loeng Outline of the talk Some basic background what do we know Climate
Life Beyond the Spawning Grounds: Distribution & Food Web Relations of Herring & Forage Fishes in Puget Sound
 Life Beyond the Spawning Grounds: Distribution & Food Web Relations of Herring & Forage Fishes in Puget Sound Dave Beauchamp, USGS & UW-SAFS Liz Duffy, UW-SAFS (NRDC) Iris Kemp, UW-SAFS Collaborators:
JIMAR PFRP ANNUAL REPORT FOR FY 2006
 JIMAR PFRP ANNUAL REPORT FOR FY 2006 P.I./Sponsor Name: Michael P. Seki and Jeffrey J. Polovina Project Proposal Title: Oceanographic Characterization of the American Samoa Longline Fishing Grounds for
Salmon bycatch patterns in the Bering Sea pollock fishery
 Salmon bycatch patterns in the Bering Sea pollock fishery James Ianelli Seattle, WA Data from the North Pacific Observer Program (Fisheries Monitoring and Assessment) were analyzed for seasonal, temporal,
Exploration of ecosystem factors responsible for coherent recruitment patterns of Pacific cod and walleye pollock in the eastern Bering Sea
 Exploration of ecosystem factors responsible for coherent recruitment patterns of Pacific cod and walleye pollock in the eastern Bering Sea Patricia A. Livingston, James Ianelli, Grant Thompson, and Ed
Juvenile Steelhead Distribution, Migration, Growth and Feeding in the Columbia River Estuary, Plume and Ocean Waters
 Juvenile Steelhead Distribution, Migration, Growth and Feeding in the Columbia River Estuary, Plume and Ocean Waters Elizabeth Daly (OSU) Richard Brodeur (NWFSC) Julie Scheurer (ARO) Laurie Weitkamp (NWFSC)
Michael Tehan, Assistant Regional Administrator, Interior Columbia Basin Office
 UNITED STATES DEPARTMENT OF COMMERCE National Oceanic and Atmospheric Administration NATIONAL MARINE FISHERIES SERVICE Northwest Fisheries Science Center Fish Ecology Division 2725 Montlake Boulevard East
Marine Mammals. James M. Price. Division of Environmental Sciences. from NOAA photograph library
 Marine Mammals from NOAA photograph library James M. Price James.Price@boem.gov Division of Environmental Sciences Environmental Studies Program R/V Pisces (from NOAA Web site) Develops and oversees applied
and found that there exist a significant overlap between the billfish resources and the exploitation activities targeting tunas and mahi mahi.
 Executive Summary Report 2016 Billfish Research in the Eastern Pacific Ocean Rosenstiel School of Marine and Atmospheric Science University of Miami January 2017 During 2016, the Eastern Pacific Ocean
2016 ANNUAL FISH TRAWL SURVEY REPORT
 216 ANNUAL FISH TRAWL SURVEY REPORT The University of Rhode Island Graduate School of Oceanography The Graduate School of Oceanography (GSO) Fish trawl survey began weekly sampling two stations in Narragansett
Fine-scale Focal Dtag Behavioral Study of Diel Trends in Activity Budgets and Sound Production of Endangered Baleen Whales in the Gulf of Maine
 Fine-scale Focal Dtag Behavioral Study of Diel Trends in Activity Budgets and Sound Production of Endangered Baleen Whales in the Gulf of Maine Susan E. Parks The Pennsylvania State University, Applied
Hydroacoustic survey of Otsego Lake, 2004
 Hydroacoustic survey of Otsego Lake, 2004 Thomas E. Brooking 1 Mark D. Cornwell 2 INTRODUCTION Fishery managers must often rely on uncertain information regarding abundance and distribution of offshore
National Report on Large Whale Entanglements
 National Report on Large Whale Entanglements Confirmed in the United States in 2017 In 2017, 76 confirmed cases of large whale entanglements were documented along the coasts of the United States. Seventy
AERIAL SURVEYS OF HARBOR SEALS IN SOUTHERN BRISTOL BAY, ALASKA,
 AERIAL SURVEYS OF HARBOR SEALS IN SOUTHERN BRISTOL BAY, ALASKA, 1998-1999 Robert J. Small Alaska Department of Fish and Game 1255 West 8 th Street Juneau, Alaska 99802 bob_small@fishgame.state.ak.us INTRODUCTION
North Pacific Fishery Management Council. Community considerations in Federally-managed fisheries. April 2005
 North Pacific Fishery Management Council Community considerations in Federally-managed fisheries April 2005 Why are Fisheries Off Alaska so important to communities? Would rank in the top 10 producing
Final Report Alaska Department of Fish and Game State Wildlife Grant T July 1, 2003 June 30, 2006:
 Final Report Alaska Department of Fish and Game State Wildlife Grant T-1-6-4 July 1, 2003 June 30, 2006: Acoustic Monitoring for Killer Whales in the Bering Sea John Hildebrand and Erin Oleson Marine Physical
MANAGEMENT OF KRILL AS AN ESSENTIAL COMPONENT OF THE CALIFORNIA CURRENT ECOSYSTEM
 MANAGEMENT OF KRILL AS AN ESSENTIAL COMPONENT OF THE CALIFORNIA CURRENT ECOSYSTEM AMENDMENT 12 TO THE COASTAL PELAGIC SPECIES FISHERY MANAGEMENT PLAN ENVIRONMENTAL ASSESSMENT, REGULATORY IMPACT REVIEW
Adaptation to climate variation in a diversified fishery:
 Adaptation to climate variation in a diversified fishery: The West Coast groundfish trawl fishery Lisa Pfeiffer Northwest Fisheries Science Center, NOAA Fisheries Seattle, Washington USA The West Coast
Challenges in communicating uncertainty of production and timing forecasts to salmon fishery managers and the public
 Challenges in communicating uncertainty of production and timing forecasts to salmon fishery managers and the public Alaska Fisheries Science Center Joseph A. Orsi and Phillip R. Mundy Auke Bay Laboratories
What s UP in the. Pacific Ocean? Learning Objectives
 What s UP in the Learning Objectives Pacific Ocean? In this module, you will follow a bluefin tuna on a spectacular migratory journey up and down the West Coast of North America and back and forth across
EAST, WEST, NORTH & SOUTH: Spatio-Temporal Variation in the Diet & Prey Characteristics of Rhinoceros Auklets in the N.
 EAST, WEST, NORTH & SOUTH: Spatio-Temporal Variation in the Diet & Prey Characteristics of Rhinoceros Auklets in the N. Pacific Ocean Julie A. Thayer & William J. Sydeman (PRBO Conservation Science), Douglas
Establishing a Transit Corridor through the Round Island Walrus Habitat Protection Area Scope, Purpose and Need of the Action
 Establishing a Transit Corridor through the Round Island Walrus Habitat Protection Area Scope, Purpose and Need of the Action Prepared by Steve A. MacLean North Pacific Fishery Management Council November,
Essential Fish Habitat
 Pacific Fishery Management Council Fact sheet: Essential Fish Habitat Habitat is the environment where an animal lives, feeds, and reproduces. Identifying fish habitat is complex because fish move through
Wild flatfish (Alaska Sole and Flounder), living in the clear remote waters of Alaska, are managed to provide a sustainable food source while
, living in the clear remote waters of Alaska, are managed to provide a sustainable food source while") Wild flatfish (Alaska Sole and Flounder), living in the clear remote waters of Alaska, are managed to provide a sustainable food source while protecting against habitat damage. Flatfish fishermen are dedicated
Wild flatfish (Alaska Sole and Flounder), living in the clear remote waters of Alaska, are managed to provide a sustainable food source while protecting against habitat damage. Flatfish fishermen are dedicated
Modern status of Sea otter population on the Commander Islands
 Modern status of Sea otter population on the Commander Islands Alexander Burdin, Kamchatka branch of Pacific Institute of Geography, RAS, University of Alaska, Fairbanks, ASLC, Sergey Zagrebelny, Commander
Objectives, Design Evolution, Standardization, Research platform piggybacks Proposed modifications
 Objectives, Design Evolution, Standardization, Research platform piggybacks Proposed modifications Primary Objectives Standardized, fishery independent data for stock assessment CPUE, sex specific length-at-age,
Right Whale Diving and Foraging Behavior in the Southwestern Gulf of Maine
 DISTRIBUTION STATEMENT A. Approved for public release; distribution is unlimited. Right Whale Diving and Foraging Behavior in the Southwestern Gulf of Maine Mark Baumgartner Woods Hole Oceanographic Institution
Hydroacoustic surveys of Otsego Lake s pelagic fish community,
 Hydroacoustic surveys of Otsego Lake s pelagic fish community, 2010 1 Holly A. Waterfield 2 and Mark Cornwell 3 INTRODUCTION Hydroacoustic surveys were conducted in May and November 2010 to estimate pelagic
Blue crab ecology and exploitation in a changing climate.
 STAC Workshop 28 March 2017 Blue crab ecology and exploitation in a changing climate. Thomas Miller Chesapeake Biological Laboratory University of Maryland Center for Environmental Science Solomons, MD
Map Showing NAFO Management Units
 Map Showing NAFO Management Units Biology Are 6 species of seals in Atlantic Canadian waters, all of which occur in Newfoundland Two Arctic Species (Ringed, Bearded) Two temperate (Grey, Harbour) Two migratory
Ocean Conditions, Salmon, and Climate Change
 Ocean Conditions, Salmon, and Climate Change John Ferguson 1 NOAA Fisheries Northwest Fisheries Science Center Seattle, Washington 1 Talk represents work by dozens of scientists at NWFSC and OSU Today
Abundance and trophic interactions in North Sea fishes
 Abundance and trophic interactions in North Sea fishes Georgi M. Daskalov and Steven Mackinson CEFAS, Lowestoft Laboratory, Lowestoft, Suffolk, NR33 OHT, UK Tel/fax: +44 () 152 524584, email: georgi.daskalov@cefas.co.uk
Elizabeth Logerwell and Kimberly Rand Alaska Fisheries Science Center
 Beaufort Sea: Perspectives on Climate Change and Fisheries Elizabeth Logerwell and Kimberly Rand Alaska Fisheries Science Center John Horne and Sandra Parker-Stetter University of Washington Tom Weingartner
STUDY PERFORMANCE REPORT
 STUDY PERFORMANCE REPORT State: Michigan Project No.: F-53-R-14 Study No.: 486 Title: Assessment of lake trout populations in Michigan s waters of Lake Michigan. Period Covered: April 1, 1997 to March
Agenda Item G.4.a Supplemental SWFSC PowerPoint November 2016
 Agenda Item G.4.a Supplemental SWFSC PowerPoint November 2016 Southwest Fisheries Science Centers Southwest Fisheries Science Center Summary of Current Information Available on Coastal Pelagic Species
Advances in king crab juvenile biology: Growth, life history, habitat, and predation
 Advances in king crab juvenile biology: Growth, life history, habitat, and predation Ginny L. Eckert University of Alaska Fairbanks, Juneau Center School of Fisheries and Ocean Sciences 1 Graduate Students
Reducing Risk of Whale Entanglements in Oregon Dungeness Crab Gear
 Session 3 Reducing Risk of Whale Entanglements in Oregon Dungeness Crab Gear CaseID: 20150703Mn NMFS MMHSRP Permit #: 18786 Overview West Coast Information Framing the problem Summary of West Coast large
U.S. National Observer Program, Southeast Regional Fishery Observer Programs & Regional Electronic Technology Implementation Plans Jane DiCosimo
 Tab A, No. 7 Office of Science and Technology Silver Spring, MD U.S. National Observer Program, Southeast Regional Fishery Observer Programs & Regional Electronic Technology Implementation Plans Jane DiCosimo
Spatial/Seasonal overlap between the midwater trawl herring fishery and predator focused user groups
 Spatial/Seasonal overlap between the midwater trawl herring fishery and predator focused user groups A working paper submitted to the Herring PDT Micah Dean July 26, 2017 Introduction A goal of Amendment
The Oscillating Control Hypothesis Reassessment in view of New Information from the Eastern Bering Sea
 The Oscillating Control Hypothesis Reassessment in view of New Information from the Eastern Bering Sea George L. Hunt, Jr. School of Aquatic and Fishery Sciences University of Washington With help from:
Wakefield Fisheries Symposium, May University of Alaska, Fairbanks School of Fisheries and Ocean Sciences, Fisheries Division Juneau, AK
 Wakefield Fisheries Symposium, May 2014 Daniel B. Michrowski Terrance J. Quinn, II University of Alaska, Fairbanks School of Fisheries and Ocean Sciences, Fisheries Division Juneau, AK Background: 5 W
IB BIOLOGY SUMMER WORK OPTION G: Ecology & Conservation
 IB BIOLOGY SUMMER WORK OPTION G: Ecology & Conservation This portfolio is designed to be used as a study guide for one of the options that will be covered for your paper three exam. It will make an excellent
Ecosystem-based Science for Management of Alaskan Fisheries. Patricia A. Livingston NOAA-Fisheries Alaska Fisheries Science Center Seattle, WA, USA
 Ecosystem-based Science for Management of Alaskan Fisheries Patricia A. Livingston NOAA-Fisheries Alaska Fisheries Science Center Seattle, WA, USA Overview Background on ecosystem research and ecosystem
Patterns of Southern Resident Killer Whale (Orcinus orca) Movement in Relation to the Tides and Currents
 Movement in Relation to the Tides and Currents") Patterns of Southern Resident Killer Whale (Orcinus orca) Movement in Relation to the Tides and Currents Erin M. Soucy Beam Reach Marine Science and Sustainability School 620 University Road Friday Harbor,
Patterns of Southern Resident Killer Whale (Orcinus orca) Movement in Relation to the Tides and Currents Erin M. Soucy Beam Reach Marine Science and Sustainability School 620 University Road Friday Harbor,
Groundfish Science Report Michelle McClure and John Stein. IEA Update. Cisco Werner and John Stein. September 15, 2011
 Agenda Item G.1.b Supplemental NW & SW Fisheries Science Centers PowerPoint September 2011 Groundfish Science Report Michelle McClure and John Stein IEA Update Cisco Werner and John Stein September 15,
BERING SEA SALMON FOOD HABITS: DIET OVERLAP IN FALL AND POTENTIAL FOR INTERACTIONS AMONG SALMON
 BERING SEA SALMON FOOD HABITS: DIET OVERLAP IN FALL AND POTENTIAL FOR INTERACTIONS AMONG SALMON by Nancy D. Davis, Janet L. Armstrong, and Katherine W. Myers High Seas Salmon Research Program Fisheries
Annual Pink Shrimp Review
 Annual Pink Shrimp Review Oregon Department of Fish and Wildlife ODFW Marine Region, Marine Science Dr., Bldg. #3, Newport, OR 97365 (503) 867-4741 TO: FROM: OREGON SHRIMP INDUSTRY BOB HANNAH, PINK SHRIMP
Evaluating Potential Fishery Effects of Changes to Other Species Management
 Evaluating Potential Fishery Effects of Changes to Other Species Management Analysis Conducted by Scott Miller Economist NOAA Fisheries, Alaska Region, Analytical Team With Contributions by Andy Smoker,
This Thesis for the Master of Environmental Studies Degree by Kathryn Chumbley. has been approved for The Evergreen State College by
 PREY BIOMASS ABUNDANCE, DISTRIBUTION, AND AVAILABILITY TO THE ENDANGERED STELLER SEA LION (EUMETOPIAS JUBATUS) POPULATION AT UGAMAK ISLAND, ALASKA, 1995-99. by Kathryn Chumbley A Thesis Submitted in partial
UPPER COOK INLET COMMERCIAL HEFGUNG AND SMELT FISHERIES, 1998
 UPPER COOK INLET COMMERCIAL HEFGUNG AND SMELT FISHERIES, 1998 Report for the Alaska Board of Fisheries BY Jeff Fox REGIONAL INFORMATION REPORT NO. 2A98-29 Alaska Department of Fish and Game Division of
Gulf of the Farallones National Marine Sanctuary Safe Harbor for Sea Turtles
 Gulf of the Farallones National Marine Sanctuary Safe Harbor for Sea Turtles Photos by Doug Perrine They re here now! Leatherbacks swim 6,000 miles from Indonesia to California to Feed on Jellyfish ~ August
Chinook Salmon Bycatch in Gulf of Alaska Groundfish Fisheries
 Chinook Salmon Bycatch in Gulf of Alaska Groundfish Fisheries March 2009 Staff Discussion Paper Table of Contents 1 INTRODUCTION...1 2 CHANGES TO THE DISCUSSION PAPER SINCE THE PREVIOUS DRAFT...1 3 DATA
Oceanographic characteristics of the habitat of benthic fish and invertebrates in the Beaufort Sea
 AFSC Oceanographic characteristics of the habitat of benthic fish and invertebrates in the Beaufort Sea Elizabeth Logerwell, Kimberly Rand Alaska Fisheries Science Center, National Marine Fisheries Service
FINAL REPORT FIXED GEAR - MARINE MAMMAL INTERACTIONS STUDY
 FINAL REPORT FIXED GEAR - MARINE MAMMAL INTERACTIONS STUDY For NOAA Fisheries Operations, Management, and Information Division Grants Program Office Juneau, Alaska From Texas A&M University Research Foundation
The Blob, El Niño, La Niñas, and North Pacific marine ecosystems
 The Blob, El Niño, La Niñas, and North Pacific marine ecosystems Laurie Weitkamp Northwest Fisheries Science Center Newport Field Station NOAA Fisheries Laurie.weitkamp@noaa.gov Bill Peterson s Big Picture:
Your web browser (Safari 7) is out of date. For more security, comfort and. the best experience on this site: Update your browser Ignore
 is out of date. For more security, comfort and. the best experience on this site: Update your browser Ignore") Your web browser (Safari 7) is out of date. For more security, comfort and Activitydevelop the best experience on this site: Update your browser Ignore Fisheries and Seafood Consumption How do the locations
Your web browser (Safari 7) is out of date. For more security, comfort and Activitydevelop the best experience on this site: Update your browser Ignore Fisheries and Seafood Consumption How do the locations
First Ever Estimate of Cod Fishery in 1850s Reveals 96% Decline on Scotian Shelf
 Tuesday, March 1, 2005 www.coml.org Contacts: Terry Collins, +1-416-538-8712 Darlene Trew Crist, +1-401-295-1356, Sara Hickox, +1-401-874-6277 First Ever Estimate of Cod Fishery in 1850s Reveals 96% Decline
Rockfish Bycatch: Spatial Analysis Using Observer Data in the Aleutian Islands and Bering Sea
 Rockfish Bycatch: Spatial Analysis Using Observer Data in the Aleutian Islands and Bering Sea Prepared for Alaska Marine Conservation Council Prepared by Ecotrust Charles Steinback Sarah Klain DRAFT REPORT
Fin Whale. Appendix A: Marine Wildlife. Balaenoptera physalus. New Hampshire Wildlife Action Plan Appendix A Marine-38. Federal Listing.
 Fin Whale Balaenoptera physalus Federal Listing State Listing Global Rank Rank Regional Status E not tracked G3G4TNR State Very High Photo by Christin Khan, NOAA/NEFSC Justification (Reason for Concern
SAC-08-10a Staff activities and research plans. 8 a Reunión del Comité Científico Asesor 8 th Meeting of the Scientific Advisory Committee
 SAC-08-10a Staff activities and research plans 8 a Reunión del Comité Científico Asesor 8 th Meeting of the Scientific Advisory Committee IATTC RESEARCH PROGRAM Four programs: A. Stock Assessment; B. Biology
Preliminary Results of the 2014 Underwater Camera Survey of the Eastern Bering Sea Outer Shelf and Slope
 Preliminary Results of the 2014 Underwater Camera Survey of the Eastern Bering Sea Outer Shelf and Slope Chris Rooper, Mike Sigler, Pam Goddard and Pat Malecha Alaska Fisheries Science Center RACE Seminar
Marine Survival of Puget Sound Chinook salmon- New studies on size-selective mortality and critical growth periods
 Western Washington University Western CEDAR Salish Sea Ecosystem Conference 2014 Salish Sea Ecosystem Conference (Seattle) May 1st, 1:30 PM - 3:00 PM Marine Survival of Puget Sound Chinook salmon- New
HADDOCK ON THE SOUTHERN SCOTIAN SHELF AND IN THE BAY OF FUNDY (DIV. 4X/5Y)
") Canadian Science Advisory Secretariat Science Advisory Report 26/47 HADDOCK ON THE SOUTHERN SCOTIAN SHELF AND IN THE BAY OF FUNDY (DIV. 4X/5Y) Context Haddock (Melanogrammus aeglefinus) are found on both
Canadian Science Advisory Secretariat Science Advisory Report 26/47 HADDOCK ON THE SOUTHERN SCOTIAN SHELF AND IN THE BAY OF FUNDY (DIV. 4X/5Y) Context Haddock (Melanogrammus aeglefinus) are found on both
STATUS AND MANAGEMENT OF THE SOUTH AFRICAN SMALL PELAGIC FISHERY - AUGUST 2013
 STATUS AND MANAGEMENT OF THE SOUTH AFRICAN SMALL PELAGIC FISHERY - AUGUST 2013 Acknowledgements: Janet Coetzee (Department of Agriculture, Forestry and Fisheries, South Africa) and Dr Awie Badenhorst (Consultant
Acoustic and Visual Survey of Cetaceans at Palmyra Atoll
 Acoustic and Visual Survey of Cetaceans at Palmyra Atoll Trip report 08/2010 Palmyra, August 18 September 9, 2010 Jason P Larese Mark Deakos Contact: sbaumann@ucsd.edu, jhildebrand@ucsd.edu Scripps Institution
Southern Resident Killer Whale Information Webex
 Southern Resident Killer Whale Information Webex February 23 rd, 2018 Sheila J Thornton, Ph.D Research Scientist, Fisheries and Oceans Canada Photo: S.J. Thornton Resident Killer Whale Biology Resident
Kodiak and Alaska Peninsula Commercial Dungeness Crab Fisheries, Report to the Alaska Board of Fisheries. Michael P. Ruccio.
 Kodiak and Alaska Peninsula Commercial Dungeness Crab Fisheries, 1999 Report to the Alaska Board of Fisheries By Michael P. Ruccio and David R. Jackson Regional Information Report 1 No. 4K00-3 Alaska Department
Matching bird diets with fish data: New insight into avian predation in the Columbia River estuary
 Matching bird diets with fish data: New insight into avian predation in the Columbia River estuary Laurie Weitkamp and Tom Good NOAA Fisheries, Northwest Fisheries Science Center Don Lyons and Dan Roby
Bycatch accounting and management in the Ross Sea toothfish fishery
 Bycatch accounting and management in the Ross Sea toothfish fishery Steve Parker Sophie Mormede Stuart Hanchet New Zealand Ross Sea Region 4.5 million km 2 of ocean High seas fishery Managed by CCAMLR
Coastal Pelagic Species
 Pacific Fishery Management Council Fact sheet: Coastal Pelagic Species The Fish The term pelagic refers to species that live in the water column as opposed to living near the sea floor. They can generally
National Marine Fisheries Service Alaska Region, Sustainable Fisheries Division. The North Pacific Fishery Management Council
 Agency: National Marine Fisheries Service Alaska Region, Sustainable Fisheries Division and, The North Pacific Fishery Management Council Subject: Informal consultation on proposed amendments to the Steller
Zooplankton Availability to. Larval Walleye (Sander vitreus) in Black Lake, MI, USA
 in Black Lake, MI, USA") Zooplankton Availability to Larval Walleye (Sander vitreus) in Black Lake, MI, USA Dana Jo DePlonty School of Biological Science Dr. Kristi Arend 1 Abstract Black Lake has very few small walleye even though
Zooplankton Availability to Larval Walleye (Sander vitreus) in Black Lake, MI, USA Dana Jo DePlonty School of Biological Science Dr. Kristi Arend 1 Abstract Black Lake has very few small walleye even though
The preliminary data presented in the following PDF is not to be used without the author s consent.
 The preliminary data presented in the following PDF is not to be used without the author s consent. James Sulikowski, Ph.D. Marine Science Center University of New England 11 Hills Beach Rd. Biddeford,
Fine Scale Baleen Whale Behavior Observed Via Tagging Over Daily Time Scales
 DISTRIBUTION STATEMENT A. Approved for public release; distribution is unlimited. Fine Scale Baleen Whale Behavior Observed Via Tagging Over Daily Time Scales Mark Baumgartner Woods Hole Oceanographic
2015 Winnebago System Walleye Report
 215 Winnebago System Walleye Report Adam Nickel, Winnebago Gamefish Biologist, March 216 As winter passes in the rear view mirror, it won t be long until the spring rush of the 216 walleye run is here.
Zooplankton community changes on the Canadian northwest Atlantic continental shelves during recent warm years
 Zooplankton community changes on the Canadian northwest Atlantic continental shelves during recent warm years Catherine L. Johnson 1, Stéphane Plourde 2, Pierre Pepin 3, Emmanuel Devred 1, David Brickman
U.S. Pacific Coast Krill (Euphausiids)
") Agendum E.3.b Supplemental NMFS PowerPoint Presentation September 2004 U.S. Pacific Coast Krill (Euphausiids) Prepared by: Susan E. Smith Roger Hewitt NMFS Southwest Fisheries Science Center, NOAA 8604
Agendum E.3.b Supplemental NMFS PowerPoint Presentation September 2004 U.S. Pacific Coast Krill (Euphausiids) Prepared by: Susan E. Smith Roger Hewitt NMFS Southwest Fisheries Science Center, NOAA 8604
Effects of climate change on fish spawning grounds and larvae drift. Frode Vikebø Risør
 Effects of climate change on fish spawning grounds and larvae drift Frode Vikebø frovik@imr.no Risør 15.08.2012 Objectives What are the prerequisites for modelling drift, growth and survival of early stages
Summary of current information available on Coastal Pelagic Species with emphasis on Northern Anchovy
 Agenda Item H.3.a Supplemental SWFSC PowerPoint (Electronic Only) November 2015 Summary of current information available on Coastal Pelagic Species with emphasis on Northern Anchovy Gerard DiNardo, Dale
University of Miami Rosenstiel School of Marine and Atmospheric Science. Billfish Research Program
 University of Miami Rosenstiel School of Marine and Atmospheric Science Billfish Research Program 2011-2013 UNIVERSITY OF MIAMI Billfish Science Laboratory: RESEARCH FOCUS Uses advanced remote sensing
Arctic Frontiers, Tromsø, January 24 th Thorbjørn Thorvik, Senior adviser. The Norwegian Directorate of Fisheries.
 Sustainable harvesting at lower trophic levels: The Norwegian management plan for Calanus finmarchicus and the framework for utilizing mesopelagic species Thorbjørn Thorvik, Senior adviser. The Norwegian
Long-term killer whale monitoring in Prince William Sound/ Kenai Fjords
 ATTACHMENT C EVOSTC Annual Project Report Form 1. Program Number: See, Reporting Policy at III (C) (1). 12120114-M 2. Project Title: See, Reporting Policy at III (C) (2). Long-term killer whale monitoring
Killer whales and their prey in Iceland
 Killer whales and their prey in Iceland Filipa I. P. Samarra Marine and Freshwater Research Institute, Skúlagata 4, 101 Reykjavík, Iceland June-August 2018 PAGE 1 Letter to Volunteers Dear Earthwatch volunteers,
GROUNDFISH MANAGEMENT TEAM REPORT ON CONSIDERATION OF INSEASON ADJUSTMENTS, INCLUDING CARRYOVER. Annual Vessel Limit (15.4%)
") Agenda Item I.3.a Supplemental GMT Report 2 March 2017 GROUNDFISH MANAGEMENT TEAM REPORT ON CONSIDERATION OF INSEASON ADJUSTMENTS, INCLUDING CARRYOVER The Groundfish Management Team (GMT) reviewed the
Agenda Item I.3.a Supplemental GMT Report 2 March 2017 GROUNDFISH MANAGEMENT TEAM REPORT ON CONSIDERATION OF INSEASON ADJUSTMENTS, INCLUDING CARRYOVER The Groundfish Management Team (GMT) reviewed the
NOAA Marine Fisheries and Research
 NOAA Marine Fisheries and Research Alaska Fisheries Science Center Auke Bay Laboratories Jim Murphy, Alaska Fisheries Science Center Fall 2018 Yukon River Panel Anchorage, AK Dec 12, 2018 Salmon Bycatch
Right Whale Diving and Foraging Behavior in the Southwestern Gulf of Maine
 DISTRIBUTION STATEMENT A. Approved for public release; distribution is unlimited. Right Whale Diving and Foraging Behavior in the Southwestern Gulf of Maine Mark Baumgartner Woods Hole Oceanographic Institution
SEA GRANT PROGRESS REPORT
 SEA GRANT PROGRESS REPORT Project Title: The relationship between seasonal migrations of berried female lobster Homarus americanus, egg development and larval survival. Principal Investigator: Winsor H.
ASSESSMENT OF THE WEST COAST OF NEWFOUNDLAND (DIVISION 4R) HERRING STOCKS IN 2011
 HERRING STOCKS IN 2011") Canadian Science Advisory Secretariat Science Advisory Report 212/24 ASSESSMENT OF THE WEST COAST OF NEWFOUNDLAND (DIVISION 4R) HERRING STOCKS IN 211 Context Figure 1. Map of unit areas of NAFO Division
Canadian Science Advisory Secretariat Science Advisory Report 212/24 ASSESSMENT OF THE WEST COAST OF NEWFOUNDLAND (DIVISION 4R) HERRING STOCKS IN 211 Context Figure 1. Map of unit areas of NAFO Division