2014 OKLAHOMA ANGLER SURVEY
|
|
|
- Dinah Powers
- 5 years ago
- Views:
Transcription


1 Oklahoma Department of Wildlife Conservation 2014 OKLAHOMA ANGLER SURVEY PREPARED BY: COREY A. JAGER RESPONSIVE MANAGEMENT SPECIALIST NOVEMBER 2015
2 KEY RESULTS: Overall, 83% of respondents fished in Oklahoma during Annual license holders were most active, with 87% having fished during the past year, followed by 76% of lifetime license holders, and 53% of senior license holders. Of those that did not fish, nearly half cited not having time to participate. The majority of active anglers had been fishing in Oklahoma for a decade or more. Oklahoma anglers fished 31 days out of the year on average, and drove 39 miles one-way to their fishing destination. Oklahoma anglers fished in a variety of water bodies during 2014, but most often in lakes and reservoirs. Crappie were the species most anglers preferred to catch during 2014, closely followed by largemouth bass. Rod and reel angling continued to be the fishing method used most often. Bank and boat fishing were most popular across all angers during The majority of Oklahoma anglers practice catch-and-release fishing to some degree, with only ten percent of anglers preferring to keep their entire catch. Oklahoma anglers felt that relaxation, enjoying nature and the outdoors, and being with friends and family were the most important reasons for fishing. Overall, anglers fished most often with their family (66%), followed by their friends (24%) and a small group fished alone most often (10%). The number and economic impact of sportfishing trips varies with the size and location of lakes. However, even a small lake may attract 10,000 visits per year and generate hundreds of thousands of dollars in spending by anglers (Melstrom, Jayasekera, Jager & Boyer 2015). The average sportfishing trip has an economic value of about $67 (Melstrom et al. 2015). Water quality impacts anglers. The number of sportfishing trips to lakes decrease as turbidity (a loss of clarity) and an increase in hypereutrophic conditions (an excess of nutrients such as phosphorus and nitrogen, associated with algal blooms and little available oxygen in the water) (Melstrom et al. 2015).
3 INTRODUCTION One of the most popular forms of outdoor recreation in Oklahoma is sportfishing. According to a national report on outdoor recreation, Oklahomans spend more total days fishing than wildlife watching and hunting combined (U.S. Fish and Wildlife Service 2014). Successful Oklahoma fisheries management depends on an understanding of both the biological and social aspects of a fishery. Because the fishing public bear the majority of the cost of maintaining and enhancing fishing through their license and equipment purchases, it is especially critical to understand the fishing public s experiences and preferences, as well as their attitudes toward Oklahoma fisheries management. Recently, many states have observed stagnation, and in many cases a decline in fishing participation. Although the amount of leisure time has increased for many Americans, the amount of demand on this leisure time has apparently increased as well. The number of Oklahomans who purchase fishing license and their attitudes have changed over the decades. State license holders increased from 245,429 in 1969 to over 720,000 in However since 1999, there has been a steady decline in the number of fishing license sold. Angler attitudes toward the ODWC's direction of management activity have also changed (Summers 1990). Additionally, unpublished reports by the ODWC suggest that annual renewal rates of anglers buying license is less than 60%. Marketing strategies that deal not only with recruitment of new anglers but retention of these participants is needed. Assessing motivation as well as opinions and needs becomes the first logical step in developing such a marketing plan. It is imperative that resource management agencies, primarily funded by user groups such as anglers, investigate fishing participation, reasons for fishing, opinions about fisheries management, and reasons why fishing participation is waning. Since the late 1960 s, angler opinion surveys have been useful tool for fishery resource managers to learn about their angling constituents. This survey was once again employed during 2014 to learn about and monitor trends related to the fishing public in Oklahoma. 3
4 METHODS Previous Oklahoma surveys consisted of both mail questionnaires (Moser 1975, Mense 1977 and Summers 1986) and telephone interviews (Summers 1990, 1996 and 2002; Summers and Crews 2002). Although the advantages of conducting mail surveys include range and economy, it has been suggested that telephone interviews obtain more complete and accurate information (Duttweiler 1974). However, transitions to mobile phones and public displeasure with the amount of telemarketing seen in recent years, suggests that web-based surveys may provide a necessary supplement to access public opinion. After consultation with survey literature, Division personnel, ODWC administration and human dimensions colleagues, a mixed-mode angler questionnaire was developed. Following the 2007 Angler Survey protocol, it was predetermined that the entire sample would consist of 75% annual license holders, 20% lifetime license holders and 5% senior license holders, even though the distribution of license types in the sample did not represent the distribution of the population. Senior license holders account for 43% of the population, lifetime license holders account for 32% and the remainder of the population (26%) are annual, fiscal, 5-year and combination license holders. Senior license holders tend to be less active 54% participation rate in 2000 (Summers and Crews 2002) and 44% participation rate in 2006 (Summers 2009). Therefore, to avoid a large return of inactive anglers, we maintained a distorted representation of the population frame (Appendix A, Table A1). Past angler surveys have achieved a 50% response rate. With a goal of completing 1,200 completed interviews, a sample of 2,400 was needed. However, to account for declining response rates we further increased the sample to 3,000. This sample was randomly pulled from the year annual license files, the existing lifetime license file and the existing senior license file using the relative percentages above. All anglers selected for the survey were mailed a pre-survey postcard notification (Appendix B1) on October 1, 2014, which allowed anglers to access the survey online using a web link and unique identification number. However, identification numbers were not printed in the correct spot making it difficult for anglers to respond in this manner. All anglers were then mailed a copy of the survey instrument (Appendix B2) on October 6, 2014, with instructions for completing the survey by either by mail, telephone or online. 4
5 License holders who did not respond by mail or online were contacted by telephone beginning October 28, Interviews and data entry of mail surveys were conducted by an outside contractor. Interview staff were hired and trained by the contractor. Two supplementary training sessions were conducted by the ODWC project leader. A computer assisted telephone interview (CATI) system was used. If participants completed the survey by both telephone and mail, telephone interview data were used. Interviewers attempted to contact interviewees from 3:00 p.m. to 9:00 p.m. Monday through Thursday, from 2:00 p.m. to 8:00 p.m. on Fridays, 10:00 a.m. to 2 p.m. on Saturdays and from 2:00 p.m. to 8:00 p.m. on Sundays. Date, time, interviewer, and outcome of each attempt were recorded. Telephones were allowed to ring 6 times before the interviewer recorded a no-answer response. Interviewers attempted to redial numbers 1-2 hours after a no-answer response and minutes after a busy signal response. Before a phone number was retired as over quota, it was attempted at least 6 different days, one of which was a Saturday, and at different times of the day, including at least one call during business hours. Anglers were asked their first second and third choice of species most preferred. Overall species preference was calculated by giving first choice species 5 points, second choice species 3 points and third choice species one point for each angler and then summing total points by species This calculation was the same used in all previous surveys back to Non-response bias (resulting when the proportion of the sample from whom survey data was received does not represent the proportion from whom no data was received) is sometimes formally addressed by a follow-up study of non-respondents, comparative analysis, and subsequent weighting of the original data if differences are found. Alternatively, responses of early and late respondents can be compared for a few key variables. The presumption is that people who do not complete the survey (non-respondents) are likely more similar to those that responded slowly than those who responded quickly. This second approach (comparison of early vs. late respondents) was used to assess non-response bias. Differences between categorical variables were detected using chi-square (Pearson, Fisher s Exact Test, or Linear-by- Linear Association as appropriate. Multiple means were compared using a one-way ANOVA. All tests were considered significant at P < Differences between categorical variables were detected using the chi-square test. Multiple means were compared using a one-way ANOVA. All tests were considered significant at P < Analysis was performed on the entire dataset along with 5
6 stratification by license type when differences were significant. Trend comparisons were made to previous Oklahoma Angler Surveys when appropriate. Surveys from previous years often asked the same questions, but in some years the response items differed. Trend data from previous years were pulled from reports, not raw data, due to accessibility and usability. Economic questions were analyzed by an Oklahoma State University researcher and results are reported separately (refer to Melstrom et al. 2015). RESULTS AND DISCUSSION Sample Disposition and Response Rate A total of 770 usable survey responses were received. Discarded from the analysis were one drop-out, and two responses that did not include an ID number. Sixty-six people completed survey via multiple methods (e.g. phone and mail), we opted to keep phone responses over mail or internet responses in these situations. Of the valid responses, 315 responded by mail (41%), 393 were interviewed by phone (51%), and 62 responded to the survey online (8%). The remaining license holders were not interviewed for a variety of reasons which are detailed in Table 1. The final adjusted response rate was calculated by dividing the number of completed interviews by the number of all telephone numbers of eligible and unknown eligibility status. Unknown Eligibility and Eligible numbers were working numbers that could potentially have resulted in completed interviews (n = 1,722). After eliminating phone numbers that could not possibly have resulted in completed interviews (fax numbers, and wrong or disconnected numbers; n = 1,278), the final, adjusted survey response rate was 45%. The respondent group was comprised of 5.2% senior license holders, 20% lifetime license holders, and 74.8% annual license holders, which nearly matched our sampling distribution (Appendix B). Data were subsequently not weighted by license type. On average, three calling attempts were necessary to complete a telephone interview. The number of calling attempts ranged from one to twelve. The length of the telephone interview ranged from over a minute (e.g., non-angling participants) to 25 minutes. The average telephone interview was completed in less than twelve minutes. 6
7 Table 1: Final disposition of Angler Survey sampling pool as identified by OU POLL. Frequency Percent Ineligible: Non-residential number % No eligible respondent % Non-working number % Fax/Modem % Moved/Never Licensed % Sub-total Ineligible: % Unknown Eligibility: No answer % Caller ID/ privacy manager 2 0.9% Answering machine % Phone line busy % Quick Hang-up % Rude/Uncooperative % Language/physical problems % Sub-total Unknown Eligibility: % Eligible: Completed Telephone Interview % Dropout Telephone Interview % Completed Mail Survey % Completed Web Survey % Unknown Web/Mail 4 0.3% Individual Refusal % Household Refusal % Outstanding Appointments % Respondent never available % Sub-total Eligible: % Total: % 7
8 Non-Response Bias To assess non-response bias, answers from survey participants for whom the telephone interview was completed with one or two attempts ( early respondents, 50%) were compared to the responses for those that were interviewed after three or more attempts ( late respondents, 50%) for seven selected variables. Participants who responded by mail were not used in the comparison. No significant differences were found for any of the selected variables: No difference in fishing participation, education, license type, age, average miles driven and average number of days fished (P > 0.05 for all tests). Response Mode Bias A mixed-mode methodology was used for the Angler Survey to improve coverage and response rates. Question formatting and wording was identical across modes, however, different response modes may introduce different biases. For example, a respondent might feel more comfortable disclosing sensitive information on a mail survey rather than over the phone while talking to an actual human (Dillman, Smyth & Christian 2014). To examine the impact of mixed methodology, survey responses were compared between mail and telephone respondents for eight variables. Web responses were excluded because they represented such a small proportion of overall responses. Significant differences were found when response mode was compared for anglers age group (P < 0.001) and satisfaction with the ease of purchasing a fishing license (P = 0.029). Research has shown that responses to scalar questions tend to differ between telephone responses and mail or web responses, with telephone respondents tending to select the extremes on the scale more often (Dillman et al. 2014). This appeared to be the case here. Further evaluation of scale question differences revealed two of four scale question responses differed by mode of completion. Each question offered a 5- category response scale. When reduced to three categories, all but one question no longer displayed significant differences. Responses to satisfaction with bank fishing remained different by response mode (P < 0.001). Because only one of the scalar questions showed differences, no weighting was done to account for response mode. Comparisons were not significant for fishing participation, household income, education level, license category, average miles driven and average number of days fished (P > 0.05 for all tests). 8
. Survey respondents followed a similar distribution to the population. Figure 1. Geographic distribution of 2014 Oklahoma Angler Survey respondents, includes active and inactive 2014 anglers.")
9 Geographic Distribution Oklahoma anglers are well-dispersed throughout the states, with the major metropolitan areas-- Oklahoma City and Tulsa being home to the greatest number of anglers (Figure 1). Survey respondents followed a similar distribution to the population. Figure 1. Geographic distribution of 2014 Oklahoma Angler Survey respondents, includes active and inactive 2014 anglers. 9
10 Use of Fishing Privileges Overall, 83% of respondents fished in Oklahoma during Fishing activity differed by license category (P < 0.001). Annual license holders were most active, with 87% having fished during the past year, followed by 76% of lifetime license holders, and 53% of senior license holders (Figure 2). Fishing participation overall among survey respondents has been general stable over the past decades (Figure 3). Of those that did not fish, nearly half cited not having time to participate (Figure 4). Did you fish in Oklahoma in the past 12 months? [Yes] Senior 53% Lifetime 76% Annual/Combo/5-Year 87% Overall 83% 0% 20% 40% 60% 80% 100% Figure 2. Fishing participation by Oklahoma anglers, (n = 770). 10
11 Did you go fishing during the last year? [Yes...] 100% 80% 60% 40% 20% 0% Figure 3. Fishing participation by surveyed Oklahoma anglers, What was the main reason that you did not fish in Oklahoma last year? No time 49% Other 34% Change in plans No one to go with No place to go Poor quality of fishing 6% 6% 4% 2% 0% 20% 40% 60% Figure 4. Main reasons for not fishing during the last year (n = 127; 2 missing). Respondents were invited to provide open ended reasons for why they did not go fishing during 2014 to specify other responses. The majority did not fish due to heath reasons and due to water levels or drought conditions. A few respondents expressed a general disinterest in fishing. 11
12 No further survey questions were asked of license holders who did not fish in The remainder of this report presents results from respondents who were active anglers (n = 641). The total number of active Oklahoma anglers was estimated by multiplying the percentage of active anglers to the population group: 83% of respondents were active anglers X 722,298 license-holders = 599,507 active anglers in Oklahoma. Demographics Active anglers provided a variety of demographic information (Table 2). The average active angler was 48 years old, with the youngest respondent being 15 years old and the oldest 83. Overall, respondent age was skewed toward older adults. On the 2000 Angler Opinion Survey, respondent average age was 44 (Summers and Crews 2002). The majority of responding anglers held an associate s or bachelor s degree and were employed full-time. Household incomes of anglers spread pretty evenly across the income categories. Respondents ethnicity and race revealed to be less diverse than the overall state diversity. For example, 84% of angler survey respondents were white, whereas only 75% of Oklahomans are white. On the other hand, 11% of respondents were American Indian/Alaskan Native, whereas only 9% of Oklahomans fit into this demographic (U.S. Census Bureau 2015). The average household of respondents was above 3, with many respondent households comprised of families with young children, or older adults with no children. 12
13 Table Oklahoma Angler Survey respondent demographics. Range Median S.E. Age Education Employment Income Did not complete high school 5.3% High School Diploma or GED 44% Associate s or Technical Degree 22.5% Bachelor s Degree 19.9% Advanced Degree 8.3% Unemployed 2.8% Employed PT 6.5% Employed FT 65.3% Homemaker 3.4% Student 2.1% Military 0.6% Retired 15.3% Other 4.1% <$25, % $25,000-$49,000 20% $50,000-$74, % $75,000-$99,000 18% $100,000-$149,000 16% $150, % Hispanic/Latino 2.9% Race/Ethnicity Household Size American Indian/Alaskan Native 11.1% Asian/Asian American 1.1% Black/African American 0.8% White 84.2% Bi-racial/Multi-racial 2% Other 0.8% Mean 3.23 Range 1-15 Mode 2 Household Composition Family w/ children under 12 31% Family w/ teens, no children 9% Adults of mixed ages, no children 26% Adults >50, no children 34% 13
14 In addition to being skewed toward older ages, most active anglers responding to the survey had fished in Oklahoma for a decade or more (Figure 5). There was a significant difference in anglers years of experience fishing by license category (P = 0.001). Nearly all lifetime license holders had been fishing in Oklahoma for over 10 years, while annual/5-year and senior license holders had more varied years of experience. 1% How many years have you fished in Oklahoma? 6% 4% First year 2-5 years 6-9 years 10+ years 90% Most anglers rated fishing as equally important or as important when compared to their other outdoor activities. The level of importance varied by years of experience (P =0.038; Figure 6). Figure 5. Years of experience fishing in Oklahoma, by active anglers (n = 619; 22 missing). Angling Avidity: Experience and Importance Not Important Equally important Important Overall First year 2-5 years 6-9 years 10+ years 0% 20% 40% 60% 80% 100% Figure 6. Years of experience fishing in Oklahoma and importance of fishing compared to other outdoor activities (n = 614). 14
15 Fishing Experiences and Preferences Oklahoma anglers fished 31 days out of the year on average, and drove 39 miles oneway to their fishing destination. When observed over time, it appears anglers are travelling farther and fishing less than the previous few years (Figure 7). Trends in Days Fished and One-way Distance Traveled by OK Anglers One-way distance traveled (mi) Average days fished D a y s M i l e s Figure 7. Trends in the average number of days anglers fished in Oklahoma and the average one-way travel distance (map miles) by Oklahoma Anglers. 15
16 Oklahoma anglers fished in a variety of water bodies, but most often in lakes and reservoirs (Figure 8). There was a significant difference between license types and where anglers fished most often (P = 0.024; Figure 9). Where did you fish in Oklahoma? Where fished MOST often Where fished Below reservoir dams 4% 24% Rivers, streams, creeks 13% 45% Ponds 22% 50% Lakes/Reservoirs 61% 86% 0% 20% 40% 60% 80% 100% Figure 8. Water bodies that Oklahoma anglers fished during 2014, and water bodies anglers fished most often (n = 619; 22 missing). Annual/ 5-year Lifetime Senior Below reservoir dams 4% 5% 0% Rivers, streams, or creeks 13% 15% 0% Ponds 20% 30% 33% Lakes and reservoirs 63% 51% 67% 0% 50% 100% 0% 50% 100% 0% 50% 100% Figure 9. Comparison of water bodies fished most often by license category (Annual/5-year n = 486; Lifetime n = 112; Senior n =21). 16
17 Anglers were asked their first second and third choice of species they most preferred to catch (Table 3). Overall species preference was calculated by giving first choice species 5 points, second choice species 3 points and third choice species one point for each angler and then summing total points by species This calculation was the same used in all previous surveys back to Crappie were the species most anglers preferred to catch during 2014, closely followed by largemouth bass. Although crappie earned the most total points, largemouth bass achieved the greatest number of first choice points meaning more anglers chose largemouth as their number one preferred species. The order of the top seven preferred species to catch by Oklahoma anglers did not change from the 2000 Angler Survey. Preference for Saugeye displayed the greatest change since 2000, with a 3-point drop in rank. Other species moved up or down only 1 or 2 points. Species Table 3. Species anglers prefer to catch when fishing, st Choice Points 2nd Choice Points 3rd Choice Points 2014 Previous Rank Total Points Rank Rank change Crappie Largemouth bass Channel catfish Blue catfish White bass Flathead catfish Smallmouth bass Striped bass Rainbow trout * 11 8 Sunfish Walleye * 10 7 Hybrid bass Brown trout n/a n/a Paddlefish * 17 Spotted bass Gar Saugeye n/a Carp * 15 *Indicates a tie 17
18 Species Top species preferences were cross-referenced with water bodies fished most often (Table 4). Crappie and blue catfish anglers almost predominantly fish in lakes and reservoirs. Largemouth bass anglers are nearly split between their time in lakes and reservoirs and ponds. Channel and flathead catfish anglers are more versatile with their fishing locations, with flathead anglers not surprisingly spending a greater amount of time below dams, where the fish are often noodled. Table 4. Species anglers prefer to catch when fishing, Lakes and Reservoirs Water Body Fished Most Often Ponds Rivers, streams, creeks Below reservoir dams Crappie (n=147) 74.8% 12.9% 10.9% 1.4% Largemouth bass (n=165) 50.3% 46.1% 3.6% 0.0% Channel catfish (n=74) 54.1% 19.3% 15.7% 2.4% Flathead catfish (n=28) 46.4% 7.1% 32.1% 14.3% Blue catfish (n=60) 75.0% 3.3% 18.3% 3.3% *Percentage of anglers selecting that species as their first choice. Second and third choices are excluded. Species with sample sizes under 25 are also excluded 18
19 Rod and reel angling continued to be the fishing method used most often (Figure 10). There was no significant difference between license categories and fishing method preference used most often (P = 0.389). Which fishing methods did you use? Other Noodling Flyfishing Juglining Rod and Reel 1% 5% 1% 6% 2% 9% 3% 22% Method used most often Methods used last year (multiple responses allowed) 93% 98% 0% 50% 100% Figure 10. Comparison of fishing methods used during 2014, and methods used most often (n = 626; 15 missing). Oklahoma anglers were asked what type of bait they used most often during the last year of fishing. The majority used artificial bait or lures (54%) and live bait (44%), while a small proportion preferred to use no bait at all (i.e. noodling; 2%; Figure 11). Bank and boat fishing were most popular across all angers during 2014 (Figure 12). There was a significant difference between license holders and the platform from which they fished most often (P = 0.01; Figure 13). While all groups prefer bank fishing, 74% of lifetime anglers utilized a boat for fishing, 59% of annual/5-year license holders used a boat, and only 43% of seniors used a boat. No Bait, 2% Fishing Bait Preference Artificial, 54% Live, 44% Figure 11. Fishing bait used most often by Oklahoma anglers (n = 624; 17 missing). 19
20 From where did you do your fishing? Non-motorized boat 3% 9% Platforms used most often In the water Dock 5% 14% 8% 28% Fishing platforms used last year (multiple responses allowed) Motorized boat 41% 61% Bank 44% 65% 0% 20% 40% 60% 80% 100% Figure 12. Angling platforms used during 2014, and platforms used most often (n = 624; 17 missing). Annual/ 5-year Lifetime Senior In the water 5% 4% 0% Non-motorized boat 3% 3% 14% Motorized boat 39% 52% 29% Dock 8% 6% 24% Bank 46% 35% 33% 0% 50% 100% 0% 50% 100% 0% 50% 100% Figure 13. Angling platforms used most often during 2014, by license category (Annual/5-year n = 492; Lifetime n = 117; Senior n = 21). 20
21 Fishing Platform Preferences 100% 80% 3% 4% 4% 5% 6% 6% 7% 5% 4% 8% 5% 3% 3% 5% 60% 40% 20% 41% 43% 46% 40% 44% 49% 44% 50% 48% 47% 49% 46% 43% 44% Dock Wading/ Float Tube Boat Bank 0% Figure 14. Angling platforms used most often during In 1977, 1985 used bridge/overpass: lumped into dock (less than 1% of responses). A shifting trend toward fishing platform preferences has started to occur, with more anglers using boats than fishing from the bank. This trend evened out slightly, with the same proportion of 2014 anglers fishing from boats as the bank, and an increase in the proportion of anglers fishing from docks (Figure 14). A shift is perhaps not surprising, as technology improves and becomes more accessible for anglers. Anglers indicating that they fished from the bank we asked to rate their satisfaction with bank fishing. Forty-seven percent of respondents rated were satisfied or very satisfied with their bank fishing (Figure 15). Angler s dissatisfaction with bank fishing (Figure 16) was mostly explained by angler s perception of poor quality of fishing associated with bank fishing areas. 21
22 Satisfaction with bank fishing in Oklahoma [bank anglers only] 1-- Very Dissatisfied Very Satisfied 4% 16% 33% 24% 23% 0% 20% 40% 60% 80% 100% Figure 15. Satisfaction with bank fishing in Oklahoma by anglers that used banks for their fishing during 2014, rated on a scale from 1-5, where 1 = Very dissatisfied and 5 = Very satisfied (n = 379; 36 missing). 60% 50% 40% Reasons dissatisfied with bank fishing 51% 30% 20% 10% 25% 19% 0% Poor quality of fishing Not enough bank fishing areas 6% Something else Poor facilities at bank fishing areas Figure 16. Reasons bank anglers were dissatisfied with Oklahoma bank angling. Responses are only from anglers rating bank angling as 1 or 2 out of 5 (n = 77; 1 missing). 22
23 The 2014 Angler Survey asked anglers to rate the importance of a variety of reasons one might go fishing. Consistent with the 2007 Angler Survey, Oklahoma anglers felt that relaxation, enjoying nature and the outdoors, and being with friends and family were the most important reasons for fishing (Figure 17). The various aspects of an angler s catch catching fish to eat, catching a lot of fish, or catching large fish weighed less heavily as reasons for Oklahoma anglers to go fishing, but were still moderately important. When you go fishing, how important are each of the following to you: 1=Not at all Important =Very Important Relaxation Enjoying nature and the outdoors Being with friends and family Catching fish to eat Catching a lot of fish Catching large fish 0% 20% 40% 60% 80% 100% Figure 17. Importance of a variety of reasons anglers go fishing in Oklahoma, rated on a scale from 1-5, where 1 = Not at all important, and 5 = Very important (n = ; missing). 23
24 One aspect of the fishing experience that was explored more closely was catch-andrelease fishing. Anglers were asked what proportion of fish they catch are typically released. The majority of Oklahoma anglers practice catch-and-release fishing to some degree (Figure 18). Only ten percent of anglers keep their entire catch. There was no significant difference by license types (P = 0.789). What percent of the fish you catch in Oklahoma do you release? None Less than half more than half All 10% 24% 31% 36% 0% 20% 40% 60% 80% 100% Figure 18. Proportion of fish released that were caught by Oklahoma anglers (n = 623; 18 missing). 24
25 To understand if fishing traditions are shared with others, such as friends or family, we asked Oklahoma angler who they fished with most often. Overall, anglers fished most often with their family (66%), followed by their friends (24%) and a small group fished alone most often (10%; Figure 19). There was a significant difference between license categories and who they fished with most often. Seniors tended to fish alone more often than annual/5-year and lifetime license holders (P = 0.022). Who do you fish with most often? Family Friends Fish Alone Overall 10% 24% 66% Annual/ 5-year Lifetime 4% Senior 11% 20% 32% 23% 66% 65% 20% 60% Figure 19. Responses to who Oklahoma anglers fish with most often, overall and by license category (Overall n = 622; Annual/5-year n = 488; Lifetime n = 114; Senior n = 20). 25
26 Anglers were also asked specifically if they take kids fishing. Responses were not significantly different by license type, but were significantly different by age group (P 0.003; Figure 20). Middle-aged anglers tended to bring kids fishing more often than early adult and senior age groups; this is likely because middle-aged individuals have their own children to take along. Do you take kids fishing? (Percent checking each age category) Does not take kids fishing Takes kids under 16 Takes kids under 18 0% 20% 40% 60% 80% 100% 24 and younger 39% 50% 11% % 66% 10% % 66% 15% % 62% 24% % 56% 14% 65 and older 25% 61% 14% Figure 20. Percentage of anglers that do not take kids fishing, take kids under 16 fishing, and take kids under 18 fishing, by age group (n = 671). 26
27 Anglers were asked if they were a member of any fishing clubs or organizations. This information can be used to segment anglers by avidity; however a very small group of anglers indicated they were members of fishing clubs or organizations (5.5%; Figure 21). A similar question was posed to anglers on the 1985 Oklahoma Angler survey and only 6.5% indicated they were members of a fishing organization. Anglers that indicated they belong to fishing clubs or organizations had the opportunity to identify those groups. These responses are listed in Appendix C3. Previous angler surveys asked about angler participation in bass tournaments. Just over 90% of anglers on each survey indicated they never fished bass tournaments during the previous year (Figure 22). Are you a member of any fishing clubs or organizations? No, 95% Yes, 6% Figure 21. Percentage of Oklahoma anglers belonging to a fishing club or organization (n = 623; 18 missing). How often did you fish bass tournaments in Oklahoma last year? Never Occasionally Regularly Exclusively Don't Know/No Response % 93% 92% 0% 20% 40% 60% 80% 100% Figure 22. Frequency of participation in Oklahoma bass tournaments by Oklahoma anglers during the year prior to being surveyed, by year: 1997, 2001, and
28 Attitudes toward ODWC The final series of questions focused on anglers perceptions of the Wildlife Department and their management of Oklahoma Fisheries. First, anglers were asked to rate their satisfaction with items related to fishing regulations and licensing. Of the three items, anglers were most satisfied with the ease of purchasing a fishing license (85% rating a 4- Satisfied or 5- Very Satisfied ; Figure 23). The majority of anglers were also satisfied with the ease of understanding Oklahoma fishing regulations (75% rating a 4 or 5) and the number of Oklahoma fishing regulations (59% rating a 4 or 5). There was no significant difference in responses for any of the items by license category (P > 0.05 for all items). Please rate your satisfaction with the following: 1=Very Dissatisfied =Very Satisfied Ease of purchasing a fishing license Ease of understanding OK fishing regulations Number of OK fishing regulations 0% 20% 40% 60% 80% 100% Figure 23. Angler satisfaction with three items related to Oklahoma fishing regulations and licensing (n = ; missing). The Oklahoma Wildlife Conservation Department receives its funds differently than other government agencies through the sale of hunting and fishing licenses, and a federal excise tax on hunting and fishing equipment. We asked Oklahoma anglers how they think the Wildlife Department is funded, providing them with four options, two of which were correct. The majority were aware that hunting and fishing license sales help fund the Wildlife Department (Figure 24). However, less than a third correctly identified the federal excise tax as a source of funding. More than one third also incorrectly identified Wildlife Department funding as coming from state tax dollars or state park fees. 28
29 100% 80% How is the Wildlife Department funded? multiple responses allowed 86% 60% 40% 28% 32% 36% 20% 0% Federal Excise Tax State tax dollars State park fees Hunting/fishing license sales Figure 24. Angler responses to how the Oklahoma Wildlife Department is funded. Each column represents the percentage of respondents checking a given column. Green indicates correct funding sources (n = 641). Taking a look at individual response patterns, we learn that only 7% correctly identified both funding sources, without checking a box for an incorrect funding source (Figure 25). The majority of anglers checked at least one correct box along with one incorrect box. There were no significant differences in responses by license type or by years of experience (P > 0.05). How is the Wildlife Department funded?: Respondent "correctness" 7% 11% Completely incorrect 38% 43% Partially correct with some incorrect boxes checked Partially correct, with no incorrect boxes checked Completely correct Figure 25. Individual responses patterns to how the Oklahoma Wildlife Department is funded. Percentages show levels of angler correctness (n = 641). 29
30 In consideration of a revised rule for Walleye, we asked anglers to specify which experience they prefer for their walleye fishing. Sixty-three percent of anglers never fish for walleye. Excluding those that do not fish for walleye, 64% would prefer to catch and keep a few walleye, versus the other options given (Figure 26). Which of the following experiences would you prefer when fishing for walleye? 70% 60% 64% 50% 40% 30% 20% 17% 20% 10% 0% Catching a lot of small walley (less than 14") and releasing them all Catching and keeping a few 14" - 20" walleye Catching and keeping one walleye over 20" Figure 26. Individual responses patterns to how the Oklahoma Wildlife Department is funded. Percentages show levels of angler correctness (n = 572; 69 missing). 30
31 CONCLUSION The quinquennial survey of Oklahoma anglers has provided valuable updates and trend information for resource managers since the mid 1970 s. These surveys have provided an understanding of angler participation, experiences, preferences and attitudes toward a number of aspects of Oklahoma s fisheries. Interestingly, very little change can be seen for the majority of angling preferences and experiences since the inception of the survey. Fishing in Oklahoma remains a predominantly family-oriented activity. The majority of anglers use fishing as a means to get outside, relax and be with family and friends. However, trend data suggest anglers are spending fewer days on the water, and driving longer distances to get to their fishing destinations. A slight, but notable increase can be seen in the amount of anglers utilizing boats for their fishing. Lastly, anglers fished most often in lakes or reservoirs, and continued to prefer crappie, largemouth bass, and channel catfish over other species. RECOMMENDATIONS Only resident fishing license holders with telephone numbers in the database were eligible to be surveyed, yet nearly half of the fishing license holders were ineligible for sampling because they lacked telephone data. This discrepancy is largely attributed to annual licenses and corresponds with the implementation of point-of-sale licensing at most vendors, where clerks using the electronic interface may have discovered the phone number field is not required. This could be problematic if those anglers who have willingly provided telephone information on their license differ in their angling participation from those that did not provide telephone information. In fact, Oklahoma hunter surveys have shown differences in participation rates between hunters with and without phone numbers on license data (Jager 2014). It is recommended that this potential bias in the angling population be further explored, and considerations be made to address the incomplete sampling frame on future surveys. Oklahoma angler surveys have traditionally inquired into resident angler populations only. During 2014, over 68 thousand non-resident fishing licenses were sold by the Wildlife Department (Oklahoma Department of Wildlife Conservation 2014). The Wildlife Department could benefit greatly from learning more about these anglers, their participation, preferences and experiences fishing in Oklahoma. Future angler surveys should incorporate the non-resident angling population. 31
32 REFERENCES Dillman, D. A., Smyth, J. D., & Christian, L. M. (2014). Internet, phone, mail, and mixedmode surveys: the tailored design method. John Wiley & Sons. Jager, C.A. (2014). Upland Game Harvest Surveys. Oklahoma Department of Wildlife Conservation Federal Aid Project No. W-82-R-45, Job 4, Final Report. Oklahoma City, OK. Melstrom, R. T., Jayasekera, D., Jager, C., & Boyer, T. A. The Economic Value of Sportfishing Trips to Oklahoma Lakes. Oklahoma Cooperative Extension Service Fact Sheet: AGEC Web [November 1, 2015]. Available at: web.pdf. Oklahoma Department of Wildlife Conservation Annual Report. Oklahoma City, OK. Summers. G.L. and A. Crews Angler motivation and opinion surveys. Oklahoma Department of Wildlife Conservation Federal Aid Project No. F-37-R, Job 6, Final Report. 92 pp. Oklahoma City, OK. Summers. G.L Angler opinion surveys. Oklahoma Department of Wildlife Conservation Federal Aid Project No. F-50-R, Job 6, Final Report. 29 pp. Oklahoma City, OK. U.S. Census Bureau. State and County QuickFacts. Retrieved from: Last Revised: Wednesday, 14-Oct-2015 U.S. Fish and Wildlife Service Oklahoma National Survey of Fishing, Hunting, and Wildlife-Associated Recreation. U.S. Department of the Interior, U.S. Fish and Wildlife Service and U.S. Department of Commerce, U.S. Census Bureau. Revised
33 APPENDIX A Table A1. Distribution of license types for population (Oklahoma resident fishing license holders), sample, and completed surveys, Percentages may not add to 100% due to rounding. Population Sample Completed n % n % n % Lifetime Fishing 36, % 140 5% 44 6% Combination 104, % % % Total 141,534 20% % % Senior Fishing 58, % 49 2% 10 1% Combination 100, % 91 3% 30 4% Lifetime over 60 combo 1, % 4 0% 0 0% Lifetime over 60 Fishing 6, % 6 0% 3 0% Total 167,263 23% 150 5% 43 6% Annual Fishing 302, % 1,393 46% % Fishing 2-day 8, % 20 1% 3 0% Combination 24, % 191 6% 53 7% Combination FY 2, % 21 1% 6 1% Youth Fishing 17, % 41 1% 9 1% Youth Combination 3, % 20 1% 4 1% Youth Combination FY 324 0% 5 0% 1 0% Lake Texoma 21,820 3% 82 3% 28 4% Total 380,075 53% 1,773 59% % Five-Year Fishing 22, % % % Combination 10, % 163 5% % Total 33,426 5% % % Grand Total 722, % 3, % % 33

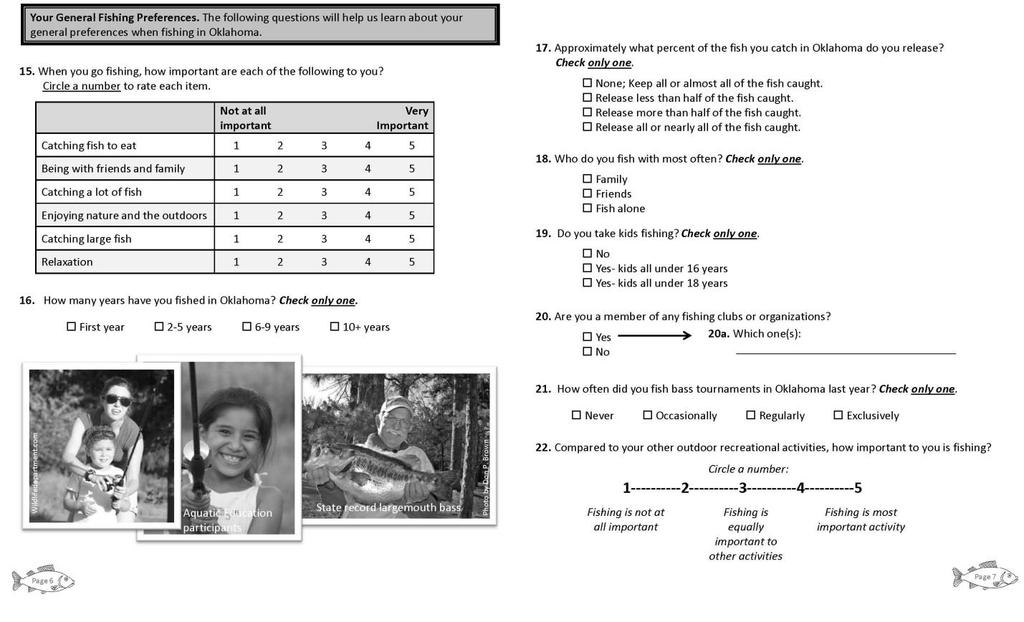
34 APPENDIX B: SURVEY INSTRUMENT B1: PRE-SURVEY NOTIFICATION POSTCARD 34

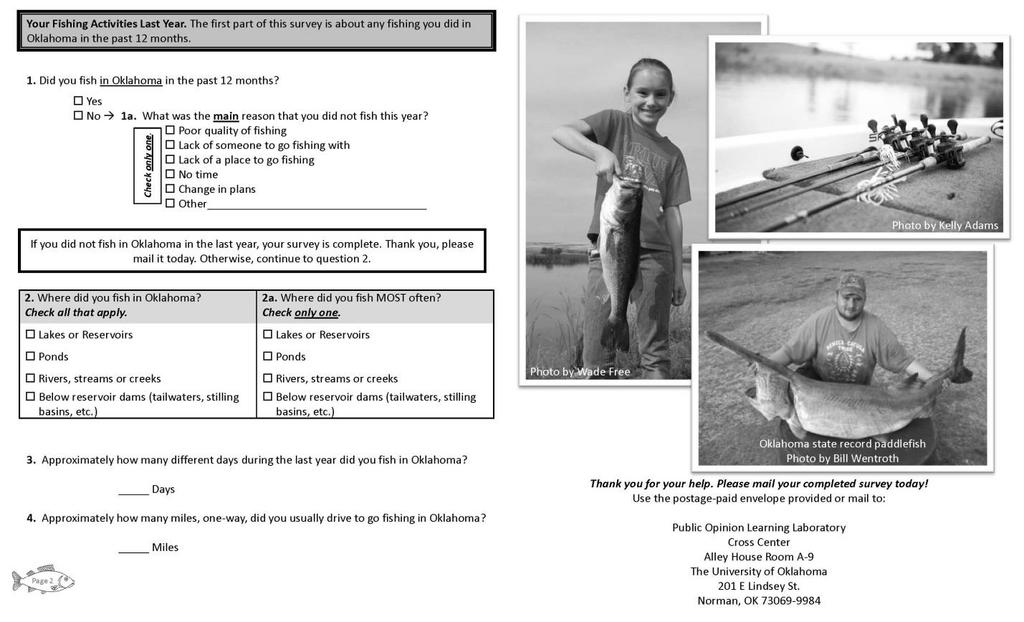
35 B2: MAIL SURVEY INSTRUMENT 35

36 36

37 37
Angling in Manitoba (2000)
") Angling in Manitoba (2000) TABLE OF CONTENTS Page Introduction 1 Angler Profile 2 Angling Effort 7 Catch and Harvest 10 Angling Expenditures 13 Bait Use 16 Nonresident Trip Characteristics 18 Angling in
Angling in Manitoba (2000) TABLE OF CONTENTS Page Introduction 1 Angler Profile 2 Angling Effort 7 Catch and Harvest 10 Angling Expenditures 13 Bait Use 16 Nonresident Trip Characteristics 18 Angling in
Angling in Manitoba Survey of Recreational Angling
 Angling in Manitoba 2005 Survey of Recreational Angling TABLE OF CONTENTS Page Introduction 1 Angler Profile 2 Angling Effort 6 Catch and Harvest 9 Angling Expenditures 11 Bait Use 14 Canadian and Nonresident
Wildlife Ad Awareness & Attitudes Survey 2015
 Wildlife Ad Awareness & Attitudes Survey 2015 Contents Executive Summary 3 Key Findings: 2015 Survey 8 Comparison between 2014 and 2015 Findings 27 Methodology Appendix 41 2 Executive Summary and Key Observations
The 2001 Economic Benefits of Hunting, Fishing and Wildlife Watching in MISSOURI. Prepared by:
 The 2001 Economic Benefits of Hunting, Fishing and Wildlife Watching in MISSOURI Prepared by: Southwick Associates, Inc. PO Box 6435 Fernandina Beach, FL 32035 Ph (904) 277-9765 Fax (904) 261-1145 Email:
1999 On-Board Sacramento Regional Transit District Survey
 SACOG-00-009 1999 On-Board Sacramento Regional Transit District Survey June 2000 Sacramento Area Council of Governments 1999 On-Board Sacramento Regional Transit District Survey June 2000 Table of Contents
The 2006 Economic Benefits of Hunting, Fishing and Wildlife Watching in TEXAS. Prepared by:
 The 2006 Economic Benefits of Hunting, Fishing and Wildlife Watching in TEXAS Prepared by: Southwick Associates, Inc. P.O. Box 6435 Fernandina Beach, FL 32035 Ph (904) 277-9765 Fax (904) 261-1145 Email:
Internet Use Among Illinois Hunters: A Ten Year Comparison
 HumanDimensions R e s e a r c h P r o g r a m Internet Use Among Illinois Hunters: A Ten Year Comparison Illinois Natural History Survey Prairie Research Institute University of Illinois at Urbana-Champaign
Hunter and Angler Expenditures, Characteristics, and Economic Effects, North Dakota,
 Agribusiness and Applied Economics Report No. 507-S January 2003 Hunter and Angler Expenditures, Characteristics, and Economic Effects, North Dakota, 2001-2002 Dean A. Bangsund and F. Larry Leistritz*
APPENDIX 1 INTRODUCTORY LETTER, SURVEY COVER LETTERS, REMINDER POSTCARD, AND QUESTION & ANSWER SHEET
 APPENDIX 1 INTRODUCTORY LETTER, SURVEY COVER LETTERS, REMINDER POSTCARD, AND QUESTION & ANSWER SHEET 67 Cooperative Human Dimensions Initiative Human Dimensions Section Colorado Division of Wildlife 6060
Brook Trout Angling in Maine2009 Survey Results
 Maine State Library Maine State Documents Resource Management Documents Inland Fisheries and Wildlife 5-3-2010 Brook Trout Angling in Maine2009 Survey Results Marc Edwards University of Maine Cooperative
Central Hills Prairie Deer Goal Setting Block G9 Landowner and Hunter Survey Results
 Central Hills Prairie Deer Goal Setting Block G9 Landowner and Hunter Survey Results Table of Contents Public Surveys for Deer Goal Setting... 1 Methods... 1 Hunter Survey... 2 Demographics... 2 Population
Oklahoma Department of Wildlife Conservation 2015 POST-SEASON SURVEY OF PADDLEFISH PERMIT HOLDERS
 Oklahoma Department of Wildlife Conservation 2015 POST-SEASON SURVEY OF PADDLEFISH PERMIT HOLDERS PREPARED BY: Corey A. Jager, Responsive Management Specialist Jason D. Schooley, Paddlefish Biologist October
Golfers in Colorado: The Role of Golf in Recreational and Tourism Lifestyles and Expenditures
 Golfers in Colorado: The Role of Golf in Recreational and Tourism Lifestyles and Expenditures by Josh Wilson, Phil Watson, Dawn Thilmany and Steve Davies Graduate Research Assistants, Associate Professor
Northwest Parkland-Prairie Deer Goal Setting Block G7 Landowner and Hunter Survey Results
 Northwest Parkland-Prairie Deer Goal Setting Block G7 Landowner and Hunter Survey Results Table of Contents Public Surveys for Deer Goal Setting... 1 Methods... 1 Hunter Survey... 2 Demographics... 2 Population
The 2006 Economic Benefits of Hunting, Fishing and Wildlife Watching in NORTH CAROLINA. Prepared by:
 The 2006 Economic Benefits of Hunting, Fishing and Wildlife Watching in NORTH CAROLINA Prepared by: Southwick Associates, Inc. P.O. Box 6435 Fernandina Beach, FL 32035 Ph (904) 277-9765 Fax (904) 261-1145
Department of Agricultural and Resource Economics, Fort Collins, CO
 July 2011 EMPR 11-01 Department of Agricultural and Resource Economics, Fort Collins, CO 80523-1172 http://dare.colostate.edu/pubs WHAT IS THE VALUE OF A FISHING TRIP? A COMPARISON OF PUBLIC AND PRIVATE
LAKE TANEYCOMO ANGLER CREEL SURVEY SUMMARY. Shane Bush Fisheries Management Biologist Missouri Department of Conservation Southwest Region
 LAKE TANEYCOMO 2008-2009 ANGLER CREEL SURVEY SUMMARY Shane Bush Fisheries Management Biologist Missouri Department of Conservation Southwest Region February 1, 2013 Introduction Lake Taneycomo was formed
A SURVEY OF 1997 COLORADO ANGLERS AND THEIR WILLINGNESS TO PAY INCREASED LICENSE FEES
 Executive Summary of research titled A SURVEY OF 1997 COLORADO ANGLERS AND THEIR WILLINGNESS TO PAY INCREASED LICENSE FEES Conducted by USDA Forest Service Rocky Mountain Research Station Fort Collins,
JadEco, LLC PO BOX 445 Shannon, IL 61078
 Introduction: With the assistance of Lake Holiday staff and volunteers, we were able to conduct an AC electrofishing survey on May 8, 27. Water temperatures were 2.3 C (8.5 F) and water clarity was decent
TRENDS IN PARTICIPATION RATES FOR WILDLIFE-ASSOCIATED RECREATION BY RACE/ETHNICITY AND GENDER:
 TRENDS IN PARTICIPATION RATES FOR WILDLIFE-ASSOCIATED RECREATION BY RACE/ETHNICITY AND GENDER: 1980-2001 Allan Marsinko Professor Department of Forestry and Natural Resources Clemson University Clemson,
Recreational Fishing and Socioeconomic Characteristics of Eastern Oklahoma Stream Anglers
 Recreational Fishing and Socioeconomic Characteristics of Eastern Oklahoma Stream Anglers William L. Fisher Oklahoma Cooperative Fish and Wildlife Research Unit, U.S. Geological Survey, Biological Resources
AN ASSESSMENT OF NEW JERSEY RESIDENT HUNTER OPINION ON CROSSBOW USE
 AN ASSESSMENT OF NEW JERSEY RESIDENT HUNTER OPINION ON CROSSBOW USE Survey mailed: December 2007 Data analyzed: January 2008 Division of Fish and Wildlife David Chanda, Director Larry Herrighty, Assistant
U.S. Bicycling Participation Study
 U.S. Bicycling Participation Study Report of findings from the 2016 survey Conducted by Corona Insights Commissioned by PeopleForBikes Released July 2017 Table of Contents Background and Objectives 3 Research
The Impact of TennCare: A Survey of Recipients 2009
 The Impact of TennCare: A Survey of Recipients 2009 Christopher Carty Research Associate, Center for Business and Economic Research William F. Fox Director, Center for Business and Economic Research and
NEVADA DEPARTMENT OF WILDLIFE STATEWIDE FISHERIES MANAGEMENT
 NEVADA DEPARTMENT OF WILDLIFE STATEWIDE FISHERIES MANAGEMENT FEDERAL AID JOB PROGRESS REPORTS F-20-48 2012 RYE PATCH RESERVOIR WESTERN REGION NEVADA DEPARTMENT OF WILDLIFE, FISHERIES DIVISION JOB PROGRESS
AN ASSESSMENT OF NEW JERSEY DEER HUNTER OPINION ON EXPANDING ANTLER POINT RESTRICTION (APR) REGULATIONS IN DEER MANAGEMENT ZONES 28, 30, 31, 34 AND 47
 REGULATIONS IN DEER MANAGEMENT ZONES 28, 30, 31, 34 AND 47") AN ASSESSMENT OF NEW JERSEY DEER HUNTER OPINION ON EXPANDING ANTLER POINT RESTRICTION (APR) REGULATIONS IN DEER MANAGEMENT ZONES 28, 30, 31, 34 AND 47 Survey mailed: April 2010 Data analyzed: June 2010
AN ASSESSMENT OF NEW JERSEY DEER HUNTER OPINION ON EXPANDING ANTLER POINT RESTRICTION (APR) REGULATIONS IN DEER MANAGEMENT ZONES 28, 30, 31, 34 AND 47 Survey mailed: April 2010 Data analyzed: June 2010
Rider Satisfaction Survey Total Market 2006
 Rider Satisfaction Survey Total Market 2006 Prepared For: Valley Metro Fall 2006 2702 North 44 th Street Suite 100-A. Phoenix, Arizona 85008 602-707-0050 www.westgroupresearch.com Valley Metro 2006 Rider
NEVADA DEPARTMENT OF WILDLIFE STATEWIDE FISHERIES MANAGEMENT
 NEVADA DEPARTMENT OF WILDLIFE STATEWIDE FISHERIES MANAGEMENT FEDERAL AID JOB PROGRESS REPORTS F-20-49 2013 SQUAW CREEK RESERVOIR WESTERN REGION Contents NEVADA DEPARTMENT OF WILDLIFE, FISHERIES DIVISION
Public Input to St. Lawrence River Fisheries Community Objectives
 Public Input to St. Lawrence River Fisheries Community Objectives Tommy L. Brown, Human Dimensions Research Unit, Cornell University Steven R. LaPan, New York State Department of Environmental Conservation,
Travel and Rider Characteristics for Metrobus
 Travel and Rider Characteristics for Metrobus 040829040.15 Travel and Rider Characteristics for Metrobus: 2012-2015 Overview The Miami Dade County Metropolitan Planning Organization (MPO) conducted a series
Staff Summary. Oregon s 2006 Angler Preference Survey of Annually Licensed Resident Anglers
 Staff Summary Oregon s 2006 Angler Preference Survey of Annually Licensed Resident Anglers July 2007 Oregon s 2006 Angler Preference Survey for Annually Licensed Resident Anglers I. Introduction and Background
Female Cyclist Survey 3
 Female Cyclist Survey 3 Executive Summary In order to fully characterize the current and potential female membership of USA Cycling, this study was commissioned to design and analyze a 2013 survey of that
Tennessee Black Bear Public Opinion Survey
 Tennessee Black Bear Public Opinion Survey Executive Summary 2012 Survey TWRA Technical Report 12 02 This electronic publication was developed by the Tennessee Wildlife Resources Agency s Division of Wildlife
Report to the Benjamin Hair-Just Swim For Life Foundation on JACS4 The Jefferson Area Community Survey
 Report to the Benjamin Hair-Just Swim For Life Foundation on JACS4 The Jefferson Area Community Survey Prepared by: Kara Fitzgibbon, M.A. Research Analyst Matthew Braswell, M.A. Research Analyst Yuliya
Summer Flounder. Wednesday, April 26, Powered by
 Summer Flounder Wednesday, April 26, 2017 On February 2, 2017, the Summer Flounder, Scup and Black Sea Bass Management Board, part of the Atlantic States Marine Fisheries Commission (ASMFC), approved changes
Evaluating the Influence of R3 Treatments on Fishing License Sales in Pennsylvania
 Evaluating the Influence of R3 Treatments on Fishing License Sales in Pennsylvania Prepared for the: Pennsylvania Fish and Boat Commission Produced by: PO Box 6435 Fernandina Beach, FL 32035 Tel (904)
Insights into First-Time Fishing License Buyers:
 Insights into First-Time Fishing License Buyers: A Survey Analysis For: Recreational Boating & Fishing Foundation (RBFF) By: Southwick Associates May 2014 PO Box 6435 Fernandina Beach, FL32035 Tel (904)
Rainy Lake Open-water Creel Survey:
 Rainy Lake Open-water Creel Survey: 21 11 Darryl McLeod District Update 212-1 Introduction An open-water creel survey was conducted on the Ontario portion of Rainy Lake from May 15 th (the opening of the
Nebraska Births Report: A look at births, fertility rates, and natural change
 University of Nebraska Omaha DigitalCommons@UNO Publications since 2000 Center for Public Affairs Research 7-2008 Nebraska Births Report: A look at births, fertility rates, and natural change David J.
WATERFOWL HUNTING IN MINNESOTA. A study of people who hunted for waterfowl in Minnesota from 2000 through Final Report
 WATERFOWL HUNTING IN MINNESOTA A study of people who hunted for waterfowl in Minnesota from 2000 through 2004 Final Report A cooperative study conducted by: Minnesota Cooperative Fish and Wildlife Research
tfishing A study of gender and life stage along New York s eastern Lake Ontario coast
 New York Sea Grant SUNY CESF 205 Marshall Hall 1 Forestry Drive Syracuse, NY 13210 Tel: (315) 470-6561 Fax: (315) 470-6956 Sportf tfishing ishing: A study of gender and life stage along New York s eastern
CHAPTER 10 TOTAL RECREATIONAL FISHING DAMAGES AND CONCLUSIONS
 CHAPTER 10 TOTAL RECREATIONAL FISHING DAMAGES AND CONCLUSIONS 10.1 INTRODUCTION This chapter provides the computation of the total value of recreational fishing service flow losses (damages) through time
2016 Capital Bikeshare Member Survey Report
 2016 Capital Bikeshare Member Survey Report Prepared by: LDA Consulting Washington, DC 20015 (202) 548-0205 February 24, 2017 EXECUTIVE SUMMARY Overview This report presents the results of the November
Regulations. Grabbling season May 1 July 15; only wooden structures allowed.
 Enid Reservoir 218 REEL FACTS Keith Meals, Arthur Dunn, Stanley Turner Fisheries Biologists keithm@mdwfp.state.ms.us, ArthurD@mdwfp.state.ms.us, StanleyT@mdwfp.state.ms.us General Information: Enid Reservoir
Final Report, October 19, Socioeconomic characteristics of reef users
 Socioeconomic Study of Reefs in Southeast Florida - Executive Summary By Hazen and Sawyer in association with Florida State University and National Oceanic and Atmospheric Administration, October 19, 2001
CRACIUN RESEARCH. June 20, 2011 A M A R K E T R E S E A R C H S T CHA
 CRACIUN RESEARCH A M A R K E T R E S E A R C H S T U D Y CHA June 20, 2011 Craciun Research Anchorage. Seattle. Washington, DC 907.279.3982 www.craciunresearch.com 2011 Craciun Research. All rights reserved.
INTERIM PERFORMANCE REPORT
 INTERIM PERFORMANCE REPORT Federal Aid Grant No. F17AF00601 (W-190-R-1) Upland Game Investigations Oklahoma Department of Wildlife Conservation July 1, 2017 through June 30, 2018 Interim Performance Report
Regulations. Grabbling season May 1 July 15; only wooden structures allowed.
 Grenada Reservoir 218 REEL FACTS Keith Meals, Arthur Dunn, Stanley Turner Fisheries Biologists keithm@mdwfp.state.ms.us, ArthurD@mdwfp.state.ms.us, StanleyT@mdwfp.state.ms.us General Information: Grenada
NEVADA DEPARTMENT OF WILDLIFE STATEWIDE FISHERIES MANAGEMENT
 NEVADA DEPARTMENT OF WILDLIFE STATEWIDE FISHERIES MANAGEMENT FEDERAL AID JOB PROGRESS REPORTS F-20-52 2016 LAKE TAHOE WESTERN REGION NEVADA DEPARTMENT OF WILDLIFE, FISHERIES DIVISION ANNUAL PROGRESS REPORT
Highlights of Angler Recruitment, Retention and Reactivation (R3) Literature
 Literature") Highlights of Angler Recruitment, Retention and Reactivation (R3) Literature Prepared for the Aquatic Resources Education Association By Bob Byrne Consulting Amissville, VA Funding provided by a grant
Highlights of Angler Recruitment, Retention and Reactivation (R3) Literature Prepared for the Aquatic Resources Education Association By Bob Byrne Consulting Amissville, VA Funding provided by a grant
FISHERIES MANAGEMENT. Georgia Freshwater Fisheries. Department of Natural Resources Wildlife Resources Division
 FISHERIES MANAGEMENT Georgia Freshwater Fisheries Fishing in Georgia 1.4 million resident anglers fish in Georgia. Fishing in Georgia generates $1.3 billion in retail sales and a $2.1 billion ripple effect
Appendix 21 Sea angling from the shore
 Appendix 21 Sea angling from the shore LUC SMRTS2015 Final Report 342 March 2016 Appendix 21 Sea angling from the shore Table A21.1: Summary of sample confidence levels Responses Spatial data Questionnaire
Introduction: JadEco, LLC PO BOX 445 Shannon, IL 61078
 Introduction: was contacted to collected data on the fishery for Lake Holiday. AC Electroshocking was conducted at 2 locations on September 28, 2015. Fish population data was collected for a total of 100
2009 New Brunswick Gambling Prevalence Study
 2009 New Brunswick Gambling Prevalence Study Prepared for: Government of New Brunswick Centennial Building P.O. Box 6000 Fredericton, NB E3B 5H1 Prepared by: TABLE OF CONTENTS EXECUTIVE SUMMARY... 1 STUDY
2016 Capital Bikeshare Member Survey Report
 2016 Capital Bikeshare Member Survey Report Prepared by: LDA Consulting Washington, DC 20015 (202) 548-0205 February 24, 2017 EXECUTIVE SUMMARY Overview This report presents the results of the November
FISH COMMUNITIES AND FISHERIES OF THE THOUSAND ISLANDS AND MIDDLE CORRIDOR
 St. Lawrence River Discussion Paper FISH COMMUNITIES AND FISHERIES OF THE THOUSAND ISLANDS AND MIDDLE CORRIDOR Issues Below is a synopsis of fish community issues and proposed management approaches. More
Modal Shift in the Boulder Valley 1990 to 2009
 Modal Shift in the Boulder Valley 1990 to 2009 May 2010 Prepared for the City of Boulder by National Research Center, Inc. 3005 30th Street Boulder, CO 80301 (303) 444-7863 www.n-r-c.com Table of Contents
These programs, known here as treatments, have been analyzed to measure their effects on participating individuals, otherwise known as the treatment
 These programs, known here as treatments, have been analyzed to measure their effects on participating individuals, otherwise known as the treatment groups. Contest Entries completed forms from shows and
LEAD SURVEY REPORT. Ontario Federation of Anglers and Hunters Guthrie Drive Peterborough, ON K9J 8L5. T: W:
 LEAD SURVEY REPORT Ontario Federation of Anglers and Hunters 4601 Guthrie Drive Peterborough, ON K9J 8L5 T: 705.748.6324 W: www.ofah.org INTRODUCTION On April 5, 2018, Environment and Climate Change Canada
OVERVIEW OF METHODOLOGY
 I N T R O D U C T I O N The Orange County Transportation Authority () is the county transportation commission responsible for planning, funding and delivering transportation improvements in Orange County
SACRAMENTO AREA TRAVEL SURVEY: BEFORE BIKE SHARE
 SACRAMENTO AREA TRAVEL SURVEY: BEFORE BIKE SHARE August 2017 A Research Report from the National Center for Sustainable Transportation Susan Handy, University of California, Davis Drew Heckathorn, University
Charter Boat Fishing in Lake Michigan: 2015 Illinois Reported Harvest
 Illinois Department of Natural Resources Division of Fisheries Charter Boat Fishing in Lake Michigan: 2015 Illinois Reported Harvest Steven R. Robillard Illinois Department of Natural Resources Lake Michigan
HUNTERS OPINIONS ON SHOOTING DEER OVER SUPPLEMENTAL FEED OR CORN
 HUNTERS OPINIONS ON SHOOTING DEER OVER SUPPLEMENTAL FEED OR CORN Conducted for the Mississippi Department of Wildlife, Fisheries, and Parks by Responsive Management 5 HUNTERS OPINIONS ON SHOOTING DEER
TRAPPING HARVEST STATISTICS. Division of Fish and Wildlife 500 Lafayette Road, Box 20 Saint Paul, MN (651)
") TRAPPING HARVEST STATISTICS Division of Fish and Wildlife 500 Lafayette Road, Box 20 Saint Paul, MN 55155-4020 (651) 259-5207 285 286 INTRODUCTION 2015 TRAPPER HARVEST SURVEY Margaret Dexter, Wildlife
TRAPPING HARVEST STATISTICS Division of Fish and Wildlife 500 Lafayette Road, Box 20 Saint Paul, MN 55155-4020 (651) 259-5207 285 286 INTRODUCTION 2015 TRAPPER HARVEST SURVEY Margaret Dexter, Wildlife
Hunter Perceptions of Chronic Wasting Disease in Illinois
 HumanDimensions R e s e a r c h P r o g r a m Hunter Perceptions of Chronic Wasting Disease in Illinois Joel Brunsvold, Director Illinois Department of Natural Resources Paul Vehlow Federal Aid Coordinator
Angler Spending on Fishing-related Durable Goods: Results from the 2014 Marine Recreational Fishing Expenditure Survey
 Angler Spending on Fishing-related Durable Goods: Results from the 2014 Marine Recreational Fishing Expenditure Survey Sabrina Lovell1, James Hilger2, and Scott Steinback3 NAAFE 2015 Ketchikan, AK 1US
Charter Boat Fishing in Lake Michigan: 2017 Illinois Reported Harvest
 Illinois Department of Natural Resources Division of Fisheries Charter Boat Fishing in Lake Michigan: 2017 Illinois Reported Harvest Steven R. Robillard Illinois Department of Natural Resources Lake Michigan
Rider Satisfaction Survey Phoenix Riders 2004
 Rider Satisfaction Survey Riders Prepared For: Valley Metro Spring 2720 E. Thomas Rd. Bldg. A, Arizona 85016-8296 602-707-0050 answers@westgroupresearch.com Valley Metro Rider Satisfaction Survey - Page
Dial A Lift Customer Survey 2011 Executive Summary
 Dial A Lift Customer Survey 2011 Executive Summary Survey conducted and report prepared by Corey, Canapary & Galanis Research 447 Sutter Street San Francisco, CA 94108 Introduction Dial A Lift is a door
The 2005 Waterfowl Hunting Season in Minnesota: A Study of Hunters Opinions and Activities. White-winged scoter. Final Report
 This document is made available electronically by the Minnesota Legislative Reference Library as part of an ongoing digital archiving project. http://www.leg.state.mn.us/lrl/lrl.asp The 2005 Waterfowl
The Impact of TennCare: A Survey of Recipients 2006
 The Impact of TennCare: A Survey of Recipients 2006 Brad Kiser Research Associate, Center for Business and Economic Research William F. Fox Director, Center for Business and Economic Research and Professor
DKS & WASHINGTON COUNTY Washington County Transportation Survey
 PREPARED FOR: DKS & WASHINGTON COUNTY Washington County Transportation Survey April 2013 PREPARED BY: DHM RESEARCH (503) 220-0575 239 NW 13 th Ave., #205, Portland, OR 97209 www.dhmresearch.com 1 INTRODUCTION
Pickwick Lake 2018 REEL FACTS Trevor Knight Fisheries Biologist (662)
") Pickwick Lake 218 REEL FACTS Trevor Knight Fisheries Biologist trevork@mdwfp.state.ms.us (662) 84-5176 General Information: Covering 43,1 acres, Pickwick Lake, which borders Alabama, Tennessee, and Mississippi,
Pickwick Lake 218 REEL FACTS Trevor Knight Fisheries Biologist trevork@mdwfp.state.ms.us (662) 84-5176 General Information: Covering 43,1 acres, Pickwick Lake, which borders Alabama, Tennessee, and Mississippi,
TRAPPING HARVEST STATISTICS. Division of Fish and Wildlife 500 Lafayette Road, Box 20 Saint Paul, MN (651)
") TRAPPING HARVEST STATISTICS Division of Fish and Wildlife 500 Lafayette Road, Box 20 Saint Paul, MN 55155-4020 (651) 259-5207 265 266 2014 TRAPPER HARVEST SURVEY INTRODUCTION Margaret Dexter, Wildlife
TRAPPING HARVEST STATISTICS Division of Fish and Wildlife 500 Lafayette Road, Box 20 Saint Paul, MN 55155-4020 (651) 259-5207 265 266 2014 TRAPPER HARVEST SURVEY INTRODUCTION Margaret Dexter, Wildlife
Independent Economic Analysis Board. Review of the Estimated Economic Impacts of Salmon Fishing in Idaho. Task Number 99
 IEAB Independent Economic Analysis Board Roger Mann, Chair Noelwah R. Netusil, Vice-Chair Kenneth L. Casavant Daniel D. Huppert Joel R. Hamilton Lon L. Peters Susan S. Hanna Hans Radtke Review of the Estimated
SOUTH CAROLINA ELECTRIC & GAS COMPANY COLUMBIA, SOUTH CAROLINA
 SOUTH CAROLINA ELECTRIC & GAS COMPANY COLUMBIA, SOUTH CAROLINA SALUDA HYDROELECTRIC PROJECT (FERC NO. 516) BOATING DENSITY STUDY PLAN FINAL SEPTEMBER 2006 Prepared by: SOUTH CAROLINA ELECTRIC & GAS COMPANY
Susquehanna River Walleye Fishery
 Susquehanna River Walleye Fishery 2008 The Susquehanna River is the largest tributary to the Atlantic Ocean lying completely within the United States. It originates from the outlet of Otsego Lake in Cooperstown,
Executive Summary. TUCSON TRANSIT ON BOARD ORIGIN AND DESTINATION SURVEY Conducted October City of Tucson Department of Transportation
 Executive Summary TUCSON TRANSIT ON BOARD ORIGIN AND DESTINATION SURVEY Conducted October 2004 Prepared for: City of Tucson Department of Transportation May 2005 TUCSON TRANSIT ON BOARD ORIGIN AND DESTINATION
WILMAPCO Public Opinion Survey Summary of Results
 Wilmington Area Planning Council WILMAPCO Public Opinion Survey Summary of Results Prepared by: 2955 Valmont Road, Suite 300 Boulder, Colorado 80301 t: 303-444-7863 f: 303-444-1145 www.n-r-c.com Table
LAKE ONTARIO FISHING AND FISH CONSUMPTION
 LAKE ONTARIO FISHING AND FISH CONSUMPTION by Nancy A. Connelly, Research Specialist, Cornell University Department of Natural Resources and Diane Kuehn, Extension Specialist, New York Sea Grant INTRODUCTION
Population & Demographics
 Population & Demographics Conditions and Trends When looking at trends in the total number of people living in Windham (population) and at the characteristics of the people who live here by factors such
Dauphin Lake Fishery. Status of Walleye Stocks and Conservation Measures
 Dauphin Lake Fishery Status of Walleye Stocks and Conservation Measures Date: December, 21 Dauphin Lake Fishery Status of Walleye Stocks and Conservation Measures Background: Walleye stocks in Dauphin
MINISTRY OF ENVIRONMENT ENVIRONMENTAL STEWARDSHIP DIVISION FISH AND WILDLIFE BRANCH. Horsefly River Angling Management Plan
 MINISTRY OF ENVIRONMENT ENVIRONMENTAL STEWARDSHIP DIVISION FISH AND WILDLIFE BRANCH Horsefly River Angling Management Plan January 30 th, 2006 Area/Fishery Description The Horsefly River watershed provides
2014 Bike to Work Day: Survey Report Denver Regional Council of Governments
 2014 Bike to Work Day: Survey Report Denver Regional Council of Governments Prepared By: Corona Insights CoronaInsights.com CONTENTS Introduction... 3 Summary of Findings... 4 Bike to Work Day Participation...
NEVADA DEPARTMENT OF WILDLIFE STATEWIDE FISHERIES MANAGEMENT
 NEVADA DEPARTMENT OF WILDLIFE STATEWIDE FISHERIES MANAGEMENT FEDERAL AID JOB PROGRESS REPORTS F-2-49 213 RYE PATCH RESERVOIR WESTERN REGION NEVADA DEPARTMENT OF WILDLIFE, FISHERIES DIVISION ANNUAL PROGRESS
Regulations. Grabbling season May 1 July 15; only wooden structures allowed.
 Sardis Reservoir 218 REEL FACTS Keith Meals, Arthur Dunn, Stanley Turner Fisheries Biologists keithm@mdwfp.state.ms.us, ArthurD@mdwfp.state.ms.us, StanleyT@mdwfp.state.ms.us General Information: Sardis
The University of Georgia
 The University of Georgia Center for Agribusiness and Economic Development College of Agricultural and Environmental Sciences Economic Impacts of Alabama Quail Hunting Prepared by: Archie Flanders and
December 18, Dear Sir/Madam,
 December 18, 2000 Dear Sir/Madam, We are writing to bring you up-to-date on our efforts to develop fish community objectives for the St. Lawrence River. First of all, we want to thank you for participating
TRAPPING HARVEST STATISTICS. Division of Fish and Wildlife 500 Lafayette Road, Box 20 Saint Paul, MN (651)
") TRAPPING HARVEST STATISTICS Division of Fish and Wildlife 500 Lafayette Road, Box 20 Saint Paul, MN 55155-4020 (651) 259-5207 265 266 2007 TRAPPER HARVEST SURVEY Margaret Dexter, Wildlife Research Unit
TRAPPING HARVEST STATISTICS Division of Fish and Wildlife 500 Lafayette Road, Box 20 Saint Paul, MN 55155-4020 (651) 259-5207 265 266 2007 TRAPPER HARVEST SURVEY Margaret Dexter, Wildlife Research Unit
Teton County Related Hunting and Fishing Spending, For the Wyoming Wildlife Federation. David T. Taylor & Thomas Foulke
 Teton County Related Hunting and Fishing Spending, 2015 For the Wyoming Wildlife Federation University of Wyoming, Department of Agricultural & Applied Economics David T. Taylor & Thomas Foulke 1 February
Capital Bikeshare 2011 Member Survey Executive Summary
 Capital Bikeshare 2011 Member Survey Executive Summary Prepared by: LDA Consulting Washington, DC 20015 (202) 548-0205 June 14, 2012 EXECUTIVE SUMMARY Overview This report presents the results of the 2012
WHERE ARE ARIZONA DEMOGRAPHICS TAKING US? HOW GROWING SLOWER, OLDER AND MORE DIVERSE AFFECTS REAL ESTATE
 WHERE ARE ARIZONA DEMOGRAPHICS TAKING US? HOW GROWING SLOWER, OLDER AND MORE DIVERSE AFFECTS REAL ESTATE March 2017 Tom Rex Office of the University Economist and Center for Competitiveness and Prosperity
ROLLER DERBY DEMOGRAPHICS:
 ROLLER DERBY DEMOGRAPHICS: Results from the Third Annual Comprehensive Data Collection on Skaters and Fans Women s Flat Track Derby Association Published March 2012 Methodology Data for this survey were
Fremont County Related Hunting and Fishing Spending, 2015
 Fremont County Related Hunting and Fishing Spending, 2015 For the Wyoming Wildlife Federation University of Wyoming, Department of Agricultural & Applied Economics David T. Taylor & Thomas Foulke September,
TRAPPING HARVEST STATISTICS. Division of Fish and Wildlife 500 Lafayette Road, Box 20 Saint Paul, MN (651)
") TRAPPING HARVEST STATISTICS Division of Fish and Wildlife 500 Lafayette Road, Box 20 Saint Paul, MN 55155-4020 (651) 259-5207 289 290 2010 TRAPPER HARVEST SURVEY Margaret Dexter, Wildlife Research Unit
TRAPPING HARVEST STATISTICS Division of Fish and Wildlife 500 Lafayette Road, Box 20 Saint Paul, MN 55155-4020 (651) 259-5207 289 290 2010 TRAPPER HARVEST SURVEY Margaret Dexter, Wildlife Research Unit
Appendix A (Survey Results) Scroll Down
 Scroll Down") Appendix A (Survey Results) Scroll Down RECREATIONAL USER TENDENCIES What is your gender? 1 8 6 4 46.1% Female 53.9% Male Slightly over half of the on-site interviews at Coopers Rock were conducted with
Appendix A (Survey Results) Scroll Down RECREATIONAL USER TENDENCIES What is your gender? 1 8 6 4 46.1% Female 53.9% Male Slightly over half of the on-site interviews at Coopers Rock were conducted with
Chapter 20. Sampling the Recreational Creel
 Chapter 20 Sampling the Recreational Creel 20.1 Introduction - Creel Surveys Management requires information Environment in which fish lives Management requires information (cont.) *Other organisms with
APPENDIX 3: EAGLECREST MASTER PLAN PUBLIC OPINION SURVEYS
 APPENDIX 3: EAGLECREST MASTER PLAN PUBLIC OPINION SURVEYS Eaglecrest Master Plan Public Opinion Surveys Prepared for Eaglecrest Ski Area Board of Directors Prepared by McDowell Group Inc. Eaglecrest Master
NEVADA DEPARTMENT OF WILDLIFE STATEWIDE FISHERIES MANAGEMENT
 NEVADA DEPARTMENT OF WILDLIFE STATEWIDE FISHERIES MANAGEMENT FEDERAL AID JOB PROGRESS REPORTS F-20-50 2014 BILK CREEK RESERVOIR WESTERN REGION 1 NEVADA DEPARTMENT OF WILDLIFE, FISHERIES DIVISION JOB PROGRESS
Previous Stocking Black crappie. Channel catfish. Cutbow. Rainbow trout. Saugeye Black crappie. Channel catfish. Cutbow.
 Runyon Lake FISH SURVEY AND MANAGEMENT DATA Carrie Tucker - Aquatic Biologist (Pueblo) carrie.tucker@state.co.us / 719-561-5312 General Information: Runyon Lake, which is approximately thirty-five acres