INTERIM PERFORMANCE REPORT
|
|
|
- Crystal Jenkins
- 5 years ago
- Views:
Transcription


1 INTERIM PERFORMANCE REPORT Federal Aid Grant No. F17AF00601 (W-190-R-1) Upland Game Investigations Oklahoma Department of Wildlife Conservation July 1, 2017 through June 30, 2018
2 Interim Performance Report State: Oklahoma Grant Number: F17AF00601 (W-190-R-1) Grant Program: Wildlife Restoration Program Grant Title: Game Harvest Survey Project Leader: Corey Jager Grant Period: July 1, 2017 June 30, 2019 Report Period: July 1, 2017 June 30, 2018 Project Description: This grant allows the Oklahoma Department of Wildlife Conservation to monitor upland game harvest and hunter opinion. Objective: Resource Management Need: There is a need to monitor upland game harvest and hunter opinion on wildliferelated topics in order to inform wildlife management decisions. Objective 1 Data Collection and Analysis Research, Survey of Monitoring - Utilization: Complete a harvest survey of 2,000 hunting license holders annual from July 1, 2017 through June 30, Summary of progress: Abstract: The Oklahoma Department of Wildlife Conservation (ODWC) has conducted telephone surveys since 1986 to estimate the number of hunters and game harvest statewide and regionally. A sample of hunting license holders (n = 1,384) was interviewed during February Fifty-seven percent of individuals interviewed hunted during Hunter and game harvest estimates and statistics were calculated statewide. Deer (Odocoileus virginianus and O. hemionus) season was most popular with hunters. Statewide harvest estimates for 2017 increased from 2016 estimates for dove (Zenaida macroura), jackrabbit (Lepus californicus), swamp rabbit (S. aquaticus), fall turkey (Meleagris gallopavo silvestris and M. g. intermedia), woodcock (Scolopax minor), raccoon (Procyon lotor), gray fox (Urocyon cinereoargenteus), bobcat (Lynx rufus), beaver (Castor canadensis), and river otter (Lutra canadensis). Harvest estimates decreased from 2016 estimates for quail (Colinus virginianus and Callipepla squamata), pheasant (Phasianus colchicus), crow (Corvus brachyrhynchos), cottontail (Sylvilagus floridanus), fox squirrel (Sciurus niger), gray squirrel (S. carolinensis), spring turkey, coyote (Canis latrans), and red fox (Vulpes fulva). Prairie chicken (Tympanuchus cupido and T. pallidicinctus) season remained closed during A series of human dimensions questions were asked to learn about hunter use of the new Oklahoma Land Access Program, opinions about purchasing and leasing land for public access, opinions about various aspects of WMA management, and to learn about what aspects of the deer hunting experience are most important. Procedures: The 2017-season game harvest survey was administered using a mixed-mode methodology (mail and telephone). The methodology for this project was developed as a result of methodological research conducted during the 2014-season survey (Jager 2014), and is a hybrid version of past methodologies. Results are considered comparable from 1986 to present.
3 A random sample of license holders, stratified by license category, was drawn from the database of annual, lifetime, and senior citizen license holders (Table A1). Five-year license holders were sampled with annual license holders. Within each license category, the sample was further stratified by county of residence. The specific license types included in each general category included hunting only and combination hunting and fishing. Based on the sampling scheme above, a sample of 5,837 license holders (1,576 annual/five-year, 2,444 lifetime, and 1,817 senior citizen) was selected for interviewing. A goal of more than 3,000 completed interviews was set for this project. License holders were over-sampled to compensate for declining response rates found in the past few seasons of the Game Harvest Survey. The survey (Appendix D) was mailed to sampled hunting license holders on January 25, The survey emphasized the importance of the study, described options for responding, and included a self-addressed, postage-paid envelope for those who preferred to participate in the survey through the mail. License holders who did not respond by mail and had telephone numbers listed on their license application were contacted by telephone beginning February 1, 2018, otherwise license holders without telephone numbers were mailed a second survey on February 27, The ODWC utilized a contractor to collect telephone interview data and data enter mail surveys. A computer assisted telephone interview (CATI) system was used. If participants completed the survey by both telephone and mail, telephone interview data were used. Interviews were conducted Monday through Thursdays between 5:00 p.m. and 9:00 p.m. with some afternoon (2:00 p.m.-5:00 p.m.) shifts on various days each week to catch those respondents not available during evening hours or by appointment. Friday shifts went from 4:00 p.m. until 8:00 p.m., Saturday shifts lasted from 10:00 a.m. to 2:00 p.m., and Sunday shifts went from 2:00 p.m. until 6:00 p.m. Before a phone number was retired as over quota, it was attempted at least 10 different times. Survey participants answered questions regarding their hunting activities during Individuals that hunted were asked which species they hunted, the number of days they hunted each species, the number of each species harvested, the county which they hunted each species most, and whether they hunted each species on private or public land. Individuals that hunted on public land were asked the number of days they hunted on public land for each species and the number of each species harvested on public land. The harvest portion of the questionnaire was similar to previous years. Information regarding license holder opinion about current wildlife-related issues was also collected. The survey instrument was reviewed by wildlife division regional supervisors, the wildlife division research supervisor, the wildlife division assistant chief and chief, federal aid coordinator, and the assistant director. Modifications were incorporated as needed. Statewide and regional (Figure A1) harvest estimates and public land use were calculated. Hunter and harvest estimates were determined by calculating the proportion of license holders hunting each species and their mean bag for that season. These estimates were extrapolated for all license holders. Differences between categorical variables were detected using the chi-square test. Multiple means were compared using a one-way ANOVA. All tests were considered significant at P < 0.05.
4 Results: Interviews were completed for 24% (n = 1,384) of the 5,837 individuals we attempted to contact. The remaining license holders were not interviewed for a variety of reasons: Wrong, disconnected or no telephone number (n = 2,573) Over quota after ten attempts (n =1,317) Refused to complete the interview (n = 190) Unavailable during project (e.g., military duty, incarcerated, etc.; n = 63) Health issues or deceased (n = 73) Fax machine or pager (n = 26) Language barrier or hearing impaired (n = 4) The final adjusted response rate was calculated by dividing the number of completed interviews by the number of all eligible individuals. Eligible individuals were individuals that could potentially have resulted in completed interviews. After eliminating phone numbers that could not possibly have resulted in completed interviews (deceased license holders, fax numbers, and wrong or disconnected numbers; n = 2,735), the final, adjusted survey response rate was 45%. Twenty-one percent of the completed surveys were conducted by telephone and 79% by mail. To examine the impact of mixed methodology, survey responses were compared between mail and telephone respondents for seven variables. There were no statistically significant differences found between mail and telephone respondents for overall 2017-season hunting participation, public land use, participation in quail season, spring turkey season, dove season, 2017 deer seasons, and category of license held (P > 0.05). Because the survey methodology included multiple contacts, regardless of invitation method, response-mode and invitation-mode biases were not considered a significant problem in data validity; results were not weighted. The average length of the telephone interviews was 11 minutes, with a median time of 8.7 minutes. Call attempt data were not available from the telephone interview contractor, limiting the ability to compare early and late respondents to the survey. The proportions of license types in the completed survey sample differed by 1.2% or less from the distribution of license types found in the population (Table A1), therefore weighting was deemed unnecessary. Harvest Estimates (Tables and Figures in Appendix A) Number of hunters and game harvest estimates and statistics were calculated statewide (Table A2). Statewide harvest estimates for 2017 increased from 2016 estimates for dove (+38%), jackrabbit (+39%), swamp rabbit (+399%), fall turkey (+27%), woodcock (+37%), raccoon (+11%), bobcat (+73%), beaver (+92%), gray fox (+44%), and river otter (+132%). Harvest estimates decreased from 2016 estimates for crow (-26%), pheasant (- 19%), quail (-14%), cottontail (-12%), fox squirrel (-20%), gray squirrel (-2%), spring turkey (-2%), coyote (- 21%), and red fox (-100%). Prairie chicken season remained closed during Statewide trends in estimated harvest and number of hunters by species from 1986 to 2017 are presented in Table A5 and Figures A2 A20. Most hunters hunted within their region of residence (Table A2). The percentage of hunters that hunted within their home county ranged from 50% for jackrabbit to 87% for swamp rabbit. Regional harvest estimates were calculated, but small sample sizes reduced the reliability of some estimates, as evidenced by the large confidence intervals (Table A3). Small samples sizes have traditionally been a problem for less-popular game seasons. Increasing the sample from previous years improved sub-samples for several species, yet it was still not enough to improve the reliability for certain species. Some regional estimates indicated harvest outside the geographic range of a species. These estimates could be a result of animals harvested on commercial hunting preserves, or simply erred memory.
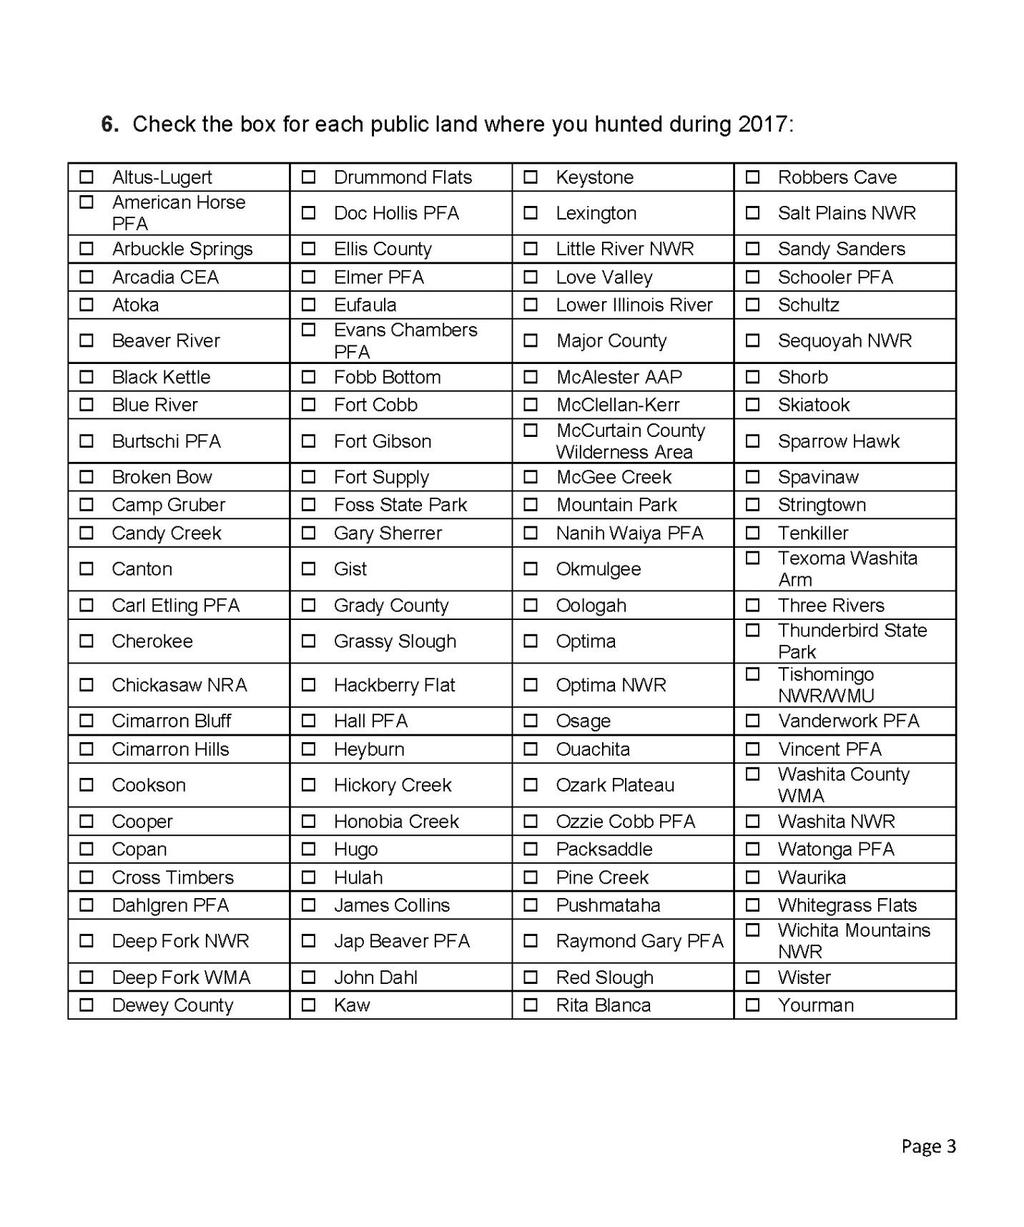
5 Game harvest estimates, statistics, and estimated number of hunters for each species were calculated for all public lands collectively (Table A4). The percentage of game harvested on public land ranged from 0% for woodcock and jackrabbit to 42% for gray squirrel. These estimates were limited by small sample sizes. A larger sample would be needed to obtain more reliable estimates of game harvest and hunter numbers on public hunting lands. Deer hunter participation was assessed. On average, deer hunters spent 17.7 days in the field during the 2017 deer season (Std. Error = 0.73, Table A6). The average number of days spent hunting deer differed by license category (P < 0.001). Deer hunters with a lifetime license averaged 20.2 deer hunting days, annual/five-year license holders averaged 14.7 days and senior citizen license averaged 10.7 days. The average number of days archery hunters spent in pursuit of deer in 2017 was 16.7 days. Muzzleloader hunters averaged 4.6 days. Youth season hunters averaged 2.6 days. Gun hunters averaged 6.1 days and special antlerless (holiday) season hunters averaged 2.1 days. There was a significant difference found in the number of days hunted by license category during the regular gun season (P = 0.003). No differences were found by license type for days spent archery, muzzleloader or special antlerless (holiday) season hunting (P > 0.05). Deer hunter success was also examined. On average, deer hunters harvested 0.51 bucks and 0.41 does during all of the 2017 deer seasons, for a total deer harvest of 0.92 per hunter (Table A7). Harvest did not differ by deer hunter license category (P > 0.05). Human Dimensions Issues (Tables and Figures in Appendix B) Human dimensions questions were designed to help ODWC become more familiar with hunting license holders and understand their hunting preferences. The rates of participation in different hunting seasons were analyzed for the various license holder categories (lifetime, annual/5-year and senior citizen license holders). Use of public land was examined. Several special management questions were also asked. Hunting Activity Overall, 57% of participants indicated that they hunted in 2017, but the rate of participation varied significantly according to license type (P < 0.001; Figure B1). Senior citizen license holders used their hunting privileges far less often than annual/five-year or lifetime license holders. To estimate the number of license holders that actually hunted, the total number of license holders in Table A1 (362,615) was multiplied by the ratio of active hunters interviewed (790/1,384). The estimated number of resident license holders who hunted in Oklahoma during 2017 was 206,984. Rates of participation in the different hunting seasons, overall and by license type, are presented in Table B1. Combining all types of hunting license holders, the most popular season was deer (enjoyed by 46% of hunting license holders), followed by dove and turkey (17.3% and 16.6%, respectively). Although the ODWC does not manage feral swine (Sus scrofa), the ODWC has begun to was collect information about feral swine hunting and trapping participation. Feral swine are now the fourth most pursued species by Oklahoma licensed hunters, with 15.7% having spent time hunting or trapping them in Land Use Participants used a variety of land types when hunting different game species. Excluding seasons with small sample sizes, the use of private land exclusively among active hunters was most common for pursuit of crow (94% of crow hunters used only private land), dove (84%) and pheasant (82%; Figure B2). Twenty percent of survey participants used public land for some portion of their hunting during As can be seen from Figure B3, this statistic also reflects 43% of participants who did not hunt at all. Focusing only on active hunting license holders (those who hunted during 2017), 36% hunted on public land in 2017 and 64% did not. Use of public land by active hunters did not vary by license category.
6 The problem with either of these approaches to measuring public land use is that they do not portray the relative importance of public land to Oklahoma s hunting license holders. A hunter who supplemented private land access with public land hunting once or twice during 2017 carried a weight equal to a hunter who relied on public land exclusively, although the relative importance of public land to those two hunters was probably much different. To more accurately capture the importance of public land, active hunters were asked to indicate how much of their hunting in 2017 occurred on public versus private land. Averaging across all active hunters, 19% of the hunting in 2017 occurred on public land (Figure B4). This measure of public land varied by license category (P = 0.026) with annual/5-year license holders spending the most amount of time on public land (24% of hunting in 2017). Looking at the issue from another angle, the majority of active license holders used private land for at least some of their hunting during Only 6% relied exclusively on public land for hunting (see overall in Figure B2). Active hunters who used public land were asked how important public land was to them for hunting. Eighty-two percent reported that public land was very important (Figure B5). Responses did not vary by license category (P = 0.384). Figure B5 shows the stability of this opinion over time ( ). In general, more public land is available for hunting in the eastern half of Oklahoma than the western half. Similarly, a greater proportion of active hunters said they used public land located in the eastern half of the state than in the western (Figure B6). Deer Hunting Deer season is the most popular hunting season in Oklahoma. Forty-six percent of all survey participants and 81% of active hunters (those who hunted at all 2017) hunted deer during Participation in deer season by active hunters in 2017 varied according to license category (P < 0.001). Ninety percent of active lifetime license holders hunted deer, while 76% of active annual/five-year license holders and 68% of active senior citizen license holders hunted deer during The regular rifle season was the most popular among 2017 deer hunters (88% participating), followed by archery (60%), primitive firearms (48%), special antlerless (holiday) season (21%), and the youth rifle season (5% participating as a youth) (Figure B7). Deer hunter participation in the individual seasons was analyzed by license type. Archery season participation was most likely for lifetime license holders (67%), followed by annual/five-year license holders (51%) and senior citizen license holders (36%) (P < 0.001). Muzzleloader season participation was more likely for lifetime license holders (58%) than senior citizen license holders (44%) or annual/five-year license holders (31%) (P < 0.001). Rifle season, youth season and special antlerless (holiday) season participation did not vary by license category (P > 0.05). Patterns in deer season participation were also examined. Most deer hunters participated in more than one season (68%), and some hunted all four (11%; Figure B8). The most common patterns were participation in gun season only (21%) and the three regular seasons archery, muzzleloader and gun (21%; Figure B9). Youth deer season participation was not included in this analysis because it only applied to a small portion of surveyed hunters. Examined separately, 91% of youth season participants also hunted deer during other seasons: 97% hunted during rifle season, 50% hunted during archery, 41% hunted during muzzleloader, and 16% hunted during the special antlerless (holiday) deer gun season (Figure B10). Just over half (53%) of all deer hunters successfully harvested a deer during the 2017 season (Figure B11). More hunters shot a buck (42%) than a doe (25%). Less than 1% of hunters filled the annual bag limit of deer for 2017 (six total during archery, youth, muzzleloader and gun seasons, plus one bonus doe allowable during the special antlerless (holiday) season; seven maximum).
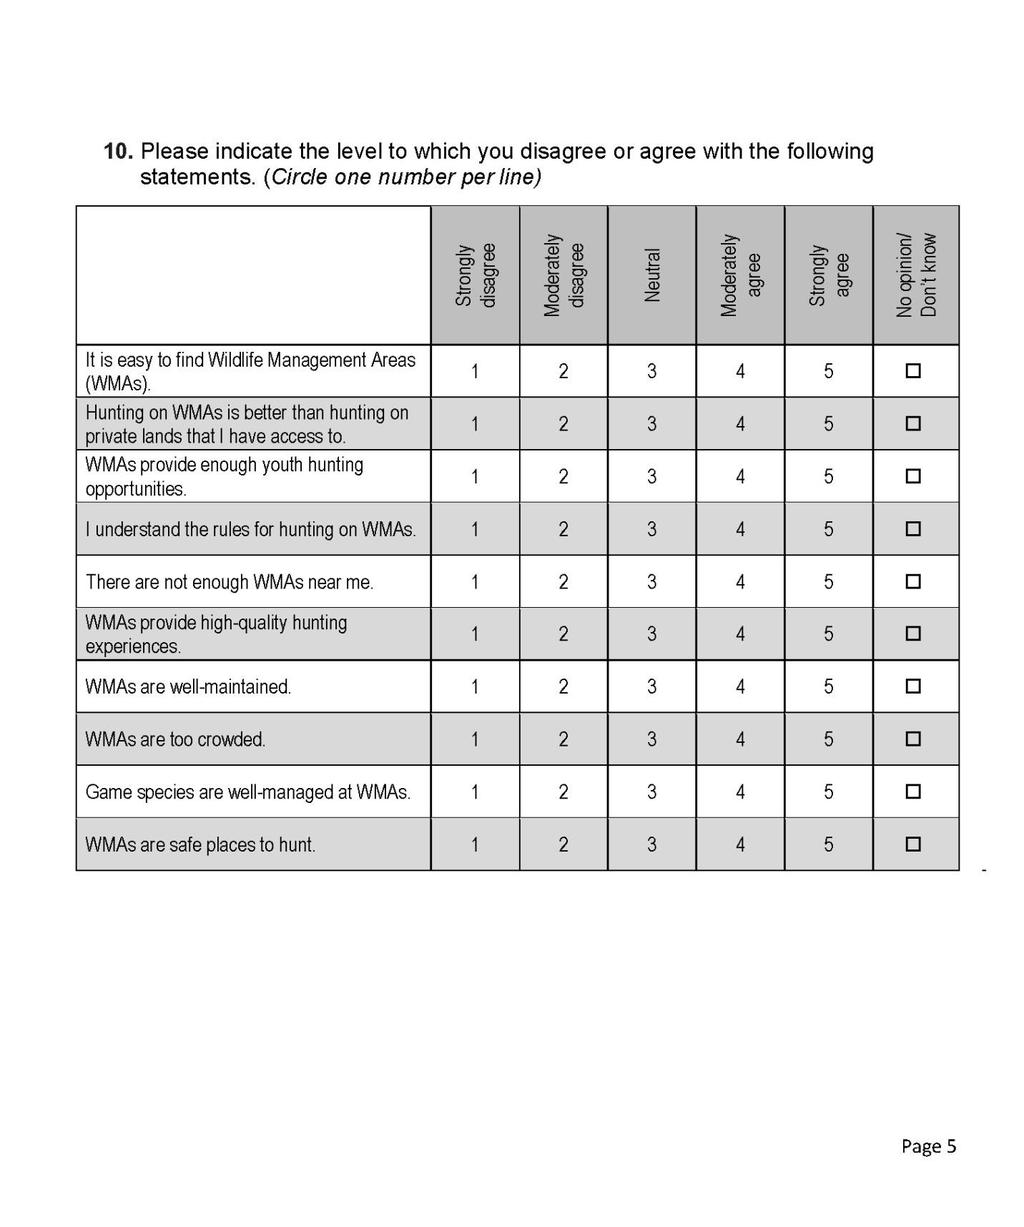
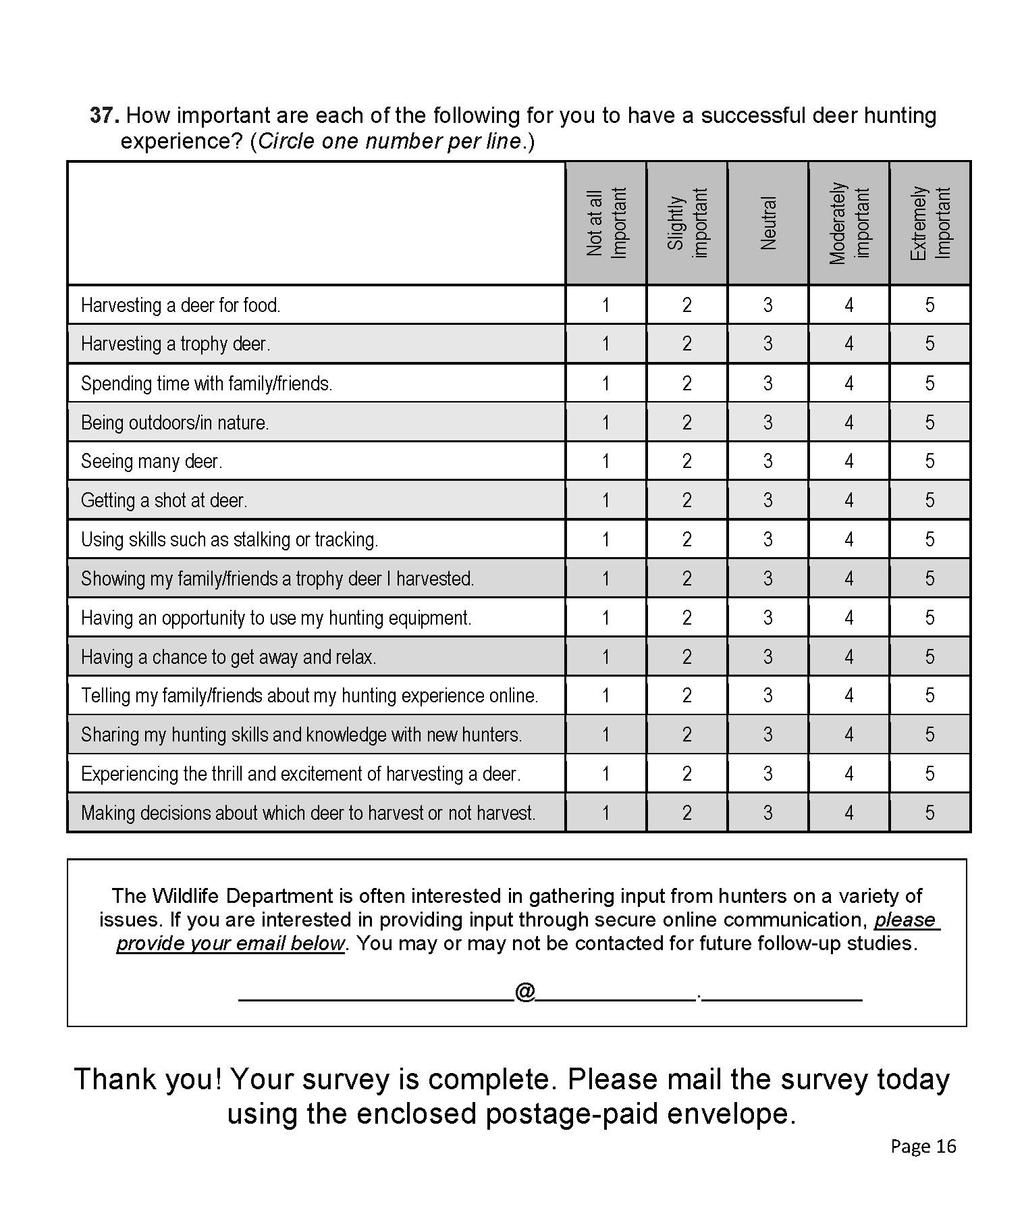
7 An increasing proportion of archery hunters are using crossbows for their hunting. In 2015, 33% of archery hunters used crossbows for all of their archery hunting. That number increased to 40% in 2016, and 42% in 2017 (Figure B12). Barriers to Participation ODWC continues to assess barriers to hunting participation. Forty-three percent (n = 595) of hunting license holders did not hunt in 2017 and were asked to identify the main reason why they did not hunt. Thirty-one percent identified health issues, and another 20% indicated other priorities. Twelve percent were simply not interested in hunting (Figure B13). The finding of health concerns was unsurprising, given that nearly twothirds of the inactive hunting license holders were senior citizen license holders. Similarly, the finding of not interested was expected, as over the years it has become apparent that many senior citizen license holders purchased the combination hunting and fishing license with no intent to hunt. Historically, the cost of a combination license was only slightly greater than the hunting-only or fishing-only license, leading many seniors to buy the combination just in case or in the interest of making a donation to ODWC. ODWC continues to face limitations in the things the agency can directly influence in order to remove barriers to hunting. Special Management Issues In 2017, the ODWC launched the Oklahoma Land Access Program (OLAP). This program leases private land for public hunting, fishing and wildlife-viewing access. ODWC sought to gather baseline information about use of these properties for hunting. Just over 4% of hunters used OLAP properties for their 2017-season hunting. Of the hunters that did not use OLAP for their hunting, about 28% said they planned to use OLAP properties in the future, and 72% said they had no plans to use OLAP properties for future hunting (Figure B14). The majority of OLAP hunters harvested game on OLAP properties (79%; Figure B15). Successful hunters harvested a variety of species deer, dove, pheasant, quail, turkey and other species. OLAP hunters were mostly satisfied with the OLAP properties they hunted (53% rated moderately or extremely satisfied ; Figure B16). All active hunters were asked their opinions about the Wildlife Department purchasing and leasing land for public use. Hunters generally favored the Wildlife Department acquiring land for public use. Seventy-seven percent of hunters either moderately or strongly supported the Wildlife Department purchasing land to expand current WMAs, while 76% supported the Department purchasing land to create new WMAs. A smaller, yet still considerable, number of hunters supported the Wildlife Department leasing private land for public access (68%; Figure B17). Public land hunters rated their support for land purchasing and leasing significantly higher than hunters that did not use public land during 2017 (P < for each item). Hunters were asked to rate their agreement or disagreement with a variety of statements about WMAs. Items that received the greatest level of agreement were that hunters understood the rules for hunting on WMAs (85% agreed), and that WMAs are easy to find (72% agreed). Hunters tended to disagree that hunting on WMAs is better than hunting on private lands that they have access to (50% disagreed; Figure B18). The majority of hunters that used public land for their 2017-season hunting were satisfied with the land they used (70% rated either moderately or extremely satisfied ; Figure B19) Deer hunters were asked to rate the importance of a variety of attributes that may contribute to a successful deer hunting experience. Non-harvest aspects of deer hunting ranked most important to deer hunters. Ninety-six percent of deer hunters ranked Being outdoors/in nature as either moderately or extremely important. Of least importance to hunters was telling family/friends about my hunting experience online, with about half of hunters rating it as not at all or slightly important (Figure B20).
8 Discussion: The Game Harvest Survey has been conducted for over 30 years and has provided valuable data for ODWC programs. However, the survey is not without its limitations. For years, ODWC managers and biologists have had reservations about the point estimates resulting from the Game Harvest Survey because the numbers of hunters and harvest estimates were inflated beyond what they felt was realistic. Over-estimation of hunter numbers and game harvest may have stemmed from several sources. Recall Bias Another significant source of estimation error was probably recall bias. Participants were asked questions about hunting seasons that may have begun 11 months prior to the interview (e.g., spring turkey). The majority of participants probably did not keep written records of the number of field days and harvest, and responded to questions based on memory. A 1998 mail survey found that participants in a one-day controlled quail hunt overestimated their quail harvest almost a year after the event (Crews 1999). If hunters had trouble recalling an isolated one-day event, the problems of recall bias were surely magnified when hunters were asked to recall hunting activities for seasons spanning several months, as occurred during the Game Harvest Survey. Recall bias during the Game Harvest Survey might only be addressed by breaking the survey into smaller segments to be conducted throughout the year, immediately following the close of each season. At this time, such a change in methodology is cost prohibitive. Social Desirability Bias Yet another source of estimation error could have been social pressure, or the participant s desire to give socially acceptable answers. Participants may have felt uncomfortable admitting that they did not harvest any game, did not hunt very many days, harvested more game than legally allowed, harvested game without a tag, etc. To minimize bias from social pressure, interviewers are trained to read the questions the same way during each interview, avoid discussion about the question items, and not reveal personal opinions. Although the desire to give socially acceptable answers may significantly impact the results of opinion questions, it is presumed that the effect on harvest data should be consistent from year to year and should not impact the trend data, except perhaps in scale. It is assumed that respondents participating in the survey over the phone may be more likely to provide socially desirable answers than those participating by mail. This was examined on the 2014-season survey by comparing the percentage of respondents reporting unsuccessful hunts by their mode of response. The percentages of respondents who reported not harvesting, deer, spring turkey and dove were nearly identical for mail and phone responses, suggesting phone surveys may not be any more likely to introduce social desirability bias. Rounding Bias (Digit Preference) The exact number of game harvested for species with long seasons and/or large bag limits may have been difficult for participants to remember. For example, when successful hunters reported the number of animals harvested, they often respond with numbers ending in 0 or 5 (Crews 1999, 1998). Rounding bias, or digit preference, may have some unknown influence on harvest estimates. This bias was assessed and confirmed to exist on previous game harvest surveys (Jager 2014). It is presumed that any bias introduced by the tendency toward rounded numbers is consistent from year to year and should not impact the trend data, except perhaps in scale.
9 Non-Response Bias Non-response bias (resulting when the proportion of the sample interviewed does not represent the proportion which could not be interviewed) can be formally addressed by a follow-up study of non-respondents, comparative analysis, and subsequent weighting of the original data if differences are found. Another way to detect non-response bias is to compare the responses of early and late respondents on a few key variables. The presumption is that the people who could not be interviewed (non-respondents) would be more similar to those that were difficult to interview (success after repeated attempts) than those that were successfully interviewed within the first few attempts. This second approach is typically used to assess non-response bias in the Game Harvest Survey; however data were unavailable for this analysis on the 2017-season survey. Past results of the assessment suggested that non-response bias was present on occasion, but not a significant problem. Sample Size Limitations The current number of completed surveys (n = 1,384) is more than adequate to analyze results of questions asked of all respondents (e.g., participation in hunting). A standard sample size of 400 is generally used for populations over 1,000, as the results from a random sample can be reported with 95% confidence at a level of precision of plus or minus 5% (Dillman 2000). Further increasing the sample size does not yield a significant return on investment in reduced sampling error. However, during the Game Harvest Survey, estimates of hunter numbers and harvest are often calculated from a much smaller sub-sample (e.g., active hunters or participants in a particular season). The overall sample size for the 2017-seasons GHS was doubled from previous years. This helped increase certain sub-sample sizes, however, participant samples of less than 400 were still used for nearly all of the seasons listed in Table A2. Regional estimates and public land estimates are rarely based on data from more than 100 respondents (Tables A3 and A4). Variability in these small samples often yields wide confidence intervals. The incidence of participation in some seasons is so low that an unrealistic number of completed surveys would be needed to yield a sub-sample size of 400 for estimating harvest. For example, based on 2017 season participation rates, over 10,000 completed surveys would be needed to identify 400 pheasant hunters (3.3% of completed 2017 surveys). For other seasons, almost an entire population census would be necessary (e.g., 1,048 woodcock hunters were estimated to exist statewide in 2017). Recommendations: The value of this project in collecting trend data on species harvest outweighs the cost, despite concerns about biases. Within the constraint of budget and time, ODWC should continue to sample at the rate necessary to complete more than 3,000 completed surveys, in order to yield the greatest amount of data possible from active hunters. Literature Cited: Crews, A. K Upland Game Harvest Surveys. Oklahoma Department of Wildlife Conservation Federal Aid Project No. W-82-R-38, Job 4, Final Report. Oklahoma City, OK. Crews, A. K Upland Game Harvest Surveys. Oklahoma Department of Wildlife Conservation Federal Aid Project No. W-82-R-37, Job 4, Final Report. Oklahoma City, OK. Dillman, D. A Mail and internet surveys: The Tailored Design Method. Second edition. New York, NY. John Wiley & Sons. Jager, C.A Upland Game Harvest Surveys. Oklahoma Department of Wildlife Conservation Federal Aid Project No. W-82-R-45, Job 4, Interim Report. Oklahoma City, OK.
10 Objective 2 - Data Collection and Analysis Database Development and Management: Construct 1 database of historic hunter information from all existing game harvest survey records and additional relevant data by June 30, Summary of progress: Progress has been made toward designing a database that allows for quick queries and visualization of hunter trends. The database design is in progress. Tables in the database will likely include both raw and calculated information, which will provide an archive for the data and quick access to trend information that is not presented in reports. Year 2 of this grant will focus on standardizing tables and importing into a database, as well as determining appropriate software for sharing queries and visualizing data. Equipment: None. Significant Deviation: None. Date Prepared: August 14, 2018 Prepared by: Corey Jager Approved by: Wildlife Division Administration Oklahoma Department of Wildlife Conservation Andrea K. Crews, Federal Aid Coordinator Oklahoma Department of Wildlife Conservation
11 APPENDIX A Harvest Estimates Tables and Graphs Table A1. Distribution of license types for Game Harvest Survey population (Oklahoma resident hunting license holders), sample, and completed surveys, Population Sampled Completed LICENSE TYPE Number Percent Number Percent Number Percent Lifetime Hunting 42, Combination 115, , Hunting Over Combination Over 60 1, Subtotal 160, , Senior Citizen Hunting 2, Combination 116, , Subtotal 118, , Annual Hunting 35, Hunting Fiscal Year (FY) 8, Combination 14, Combination FY 3, Youth Hunting 2, Youth Hunting FY 1, Youth Combination 1, Youth Combination FY Subtotal 68, , Five-Year Hunting 4, Combination 10, Subtotal 15, Total 362,615 5,837 1,384
12 Table A2. Statewide hunter and game harvest estimates and statistics by species/subspecies in Oklahoma, HUNTED HUNTED MEAN MEAN MEAN NUMBER NUMBER 95% CONFIDENCE IN OWN IN OWN BAG/ DAYS DAILY OF OF DAYS TOTAL INTERVAL FOR COUNTY REGION SPECIES/SEASON SAMPLE HUNTER HUNTED BAG HUNTERS HUNTED HARVEST TOTAL HARVEST (%) (%) Crow ,432 44, ,371 50, , Dove , ,895 1,893,421 1,241,116 2,545, Furbearers ,318 a. 278,419 b.... Coyote , , ,074 95, ,156.. Bobcat , ,155 28,559 14,809 42,308.. Raccoon , ,200 79,481 50, ,780.. Beaver ,144 38,358 16,292 7,273-26,311.. Gray Fox ,572 26,201 1, ,305.. Red Fox ,048 24, Otter ,716 1, ,949.. Pheasant ,790 39,039 39,563 18,774-60, Quail , , , , , Rabbits ,292 a. 153,563 b.... Cottontail ,030 96, ,887 83, , Jackrabbit ,310 12,052 4, , Swamp Rabbit ,358 31,834 27,960 4,020-51, Squirrels ,750 a. 573,332 b.... Fox Squirrel , , , , , Gray Squirrel , , ,797 21, , Turkeys ,261 a. 32,505 b.... Fall Turkey , ,152 5,640 3,555-7, Spring Turkey , ,655 26,865 21,248-32, Woodcock ,048 1,747 3, , Feral Swine ,855 a 1,966, ,132 b 395, ,121.. Hunting ,541 74, , , ,889.. Trapping ,096 73,968 5, ,243.. a Estimated number of hunters that hunted at least one species/subspecies within a given season. b Estimated total harvest within a given season.
13 Table A3. Hunter and game harvest estimates and statistics by region and species/subspecies in Oklahoma, HUNTED HUNTED MEAN MEAN MEAN NUMBER NUMBER 95% CONFIDENCE IN OWN IN OWN BAG/ DAYS DAILY OF OF DAYS TOTAL INTERVAL FOR COUNTY REGION REGION SPECIES/SEASON SAMPLE HUNTER HUNTED BAG HUNTERS HUNTED HARVEST TOTAL HARVEST (%) (%) NW SW NC Crow ,048 2,096 9,956 2,622-17, Dove ,694 66, , , , Pheasant ,192 13,624 12,314 6,482-18, Quail ,432 42, ,640 80, , Rabbits: Cottontail ,048 2,096 4,716 2,937-6, Jackrabbit ,048 2, , Swamp Rabbit Squirrels: Fox , Gray Turkey: Fall ,930 17,554 2,096 1,069-3, Spring ,502 17,607 4,952 2,369-7, Woodcock Crow Dove ,004 73, , ,542-1,380, Pheasant Quail ,812 49, ,790 79, , Rabbits: Cottontail ,048 7,074 5, , Jackrabbit Swamp Rabbit Squirrels: Fox ,834 1, , Gray Turkey: Fall ,358 8, , Spring ,240 31,179 4,454 2,444-6, Woodcock Crow ,572 17,292 6,288 1,194-11, Dove ,720 96, , , , Pheasant ,240 17,816 12,314 7,586-17, Quail ,860 47, ,173 52, , Rabbits: Cottontail ,930 22,532 22,008 8,884-35, Jackrabbit Swamp Rabbit Squirrels: Fox ,026 68,907 71,527 36, , Gray ,192 43,493 69,169 18, , Turkey: Fall ,882 47, Spring ,908 44,541 3,779 1,626-5, Woodcock ,
14 Table A3. Continued. HUNTED HUNTED MEAN MEAN MEAN NUMBER NUMBER 95% CONFIDENCE IN OWN IN OWN BAG/ DAYS DAILY OF OF DAYS TOTAL INTERVAL FOR COUNTY REGION REGION SPECIES/SEASON SAMPLE HUNTER HUNTED BAG HUNTERS HUNTED HARVEST TOTAL HARVEST (%) (%) SC NE SE Crow ,834 5,502 41, , Dove ,550 47, ,352 83, , Pheasant , Quail ,310 1, , Rabbits: Cottontail ,572 4,192 6, , Jackrabbit Swamp Rabbit Squirrels: Fox ,260 10,189 16,011 1,450-30, Gray ,834 4,768 4, , Turkey: Fall ,668 26,201 1, , Spring ,694 50,567 5,240 3,211-7, Woodcock Crow ,096 6,588 20,960 7,513-34, Dove ,956 41, , , , Pheasant ,310 1, , Quail ,048 9,170 15,720 4,690-26, Rabbits: Cottontail ,978 20,742 37,189 17,512-56, Jackrabbit Swamp Rabbit ,567 2, , Squirrel: Fox ,170 76,767 74,794 52,735 96, Gray ,908 71,805 76,555 48, , Turkey: Fall ,716 95, Spring ,742 66,811 3,930 1,882-5, Woodcock Crow ,096 9,694 19,912 8,397-31, Dove ,668 51,091 62,639 24, , Pheasant Quail ,048 4,978 6, , Rabbits: Cottontail ,144 34,847 36,300 9,280-63, Jackrabbit ,480 2, , Swamp Rabbit ,048 14,410 11,878 4,346-19, Squirrels: Fox , ,382 74,748 42, , Gray , , ,739 62, , Turkey: Fall ,620 20, Spring ,074 43,493 2, , Woodcock
15 Table A4. Hunter and game harvest estimates and statistics for all public hunting land in Oklahoma, MEAN MEAN MEAN NUMBER % OF 95% CONFIDENCE BAG/ DAYS DAILY NUMBER OF OF DAYS TOTAL STATEWIDE INTERVAL FOR SPECIES/SEASON SAMPLE HUNTER HUNTED BAG HUNTERS HUNTED HARVEST HARVEST TOTAL HARVEST Crow ,572 10, Dove ,956 31, , , ,549 Pheasant ,096 6,812 2, ,406 Quail ,432 60,261 68, ,037 95,404 Rabbits: Cottontail ,978 23,134 22, ,283 37,898 Jackrabbit , Swamp Rabbit ,572 12,052 7, ,619-10,053 Squirrels: Fox , ,754 75, , ,722 Gray , , , , ,269 Turkey: Fall ,502 72,686 1, ,310 Spring ,314 48,417 5, ,020-9,863 Woodcock
16 Table A5. Statewide trends in estimated harvest and estimated number of hunters in Oklahoma, Number Of Hunters Bag Per Hunter Days Hunted Daily Bag Total 95% Confidence Interval Year Harvest for Total Harvest Crow , , , , , , , , , ,957 55, , , ,601 56, , , ,678 65, , , ,893 70, , , ,150 36, , , ,054 70, , , ,501 41, , , ,683 53, , , , , , , ,196 87, , , , , , , , , , , , , , , ,702 33,840 1,035, , , , , , , , , , ,766 88, , , , , , , , , , , ,882 94, , , ,655 73, , , ,224 93, , , ,562 62, , , ,039 90, , , ,145 61, , , ,838 82, , , ,216 56, , , ,292 16, , , ,443 52, , , ,371 50, ,889
17 Table A5. Continued. Number Of Hunters Bag Per Hunter Days Hunted Daily Bag Total 95% Confidence Interval Year Harvest for Total Harvest Dove , ,071,048 1,771,207 2,370, , ,968,139 1,668,916 2,267, , ,708,665 1,475,536 1,941, , ,219,640 1,049,482 1,389, , ,752,372 1,464,888 2,039, , ,469,351 1,276,161 1,662, , ,437,806 1,249,094 1,626, , , ,859 1,087, , ,393,209 1,157,469 1,628, , ,044, ,397 1,188, , ,172,345 1,016,774 1,327, , ,139,192 1,016,289 1,262, , ,499,400 1,307,724 1,691, , ,413,132 1,254,042 1,572, , ,956,043 1,672,467 2,239, , ,407,192 1,240,641 1,573, , ,804,942 1,570,543 2,039, , ,767,431 1,432,089 2,102, , ,531,717 1,314,727 1,748, , ,244,858 1,067,456 1,422, , ,586,916 1,323,873 1,849, , ,147, ,320 1,351, , ,087, ,280 1,249, , ,350,721 1,160,476 1,540, , ,154, ,429 1,505, , ,044, ,392 1,201, , ,230, ,432 1,563, , ,479,101 1,075,013 1,883, , ,327,749 1,184,961 1,469, , ,064, ,750 1,210, , ,375, ,531 1,852, , ,893,421 1,241,116 2,545,727
18 Table A5. Continued. Number Of Hunters Bag Per Hunter Days Hunted Daily Bag Total 95% Confidence Interval Year Harvest for Total Harvest Pheasant , ,652 60, , , ,277 46,072 70, , ,769 40,807 66, , ,458 37,129 57, , ,978 33,790 60, , ,586 30,920 50, , ,912 47,535 84, , ,658 54,001 79, , ,638 36,766 60, , ,566 38,927 68, , ,922 27,664 50, , ,170 47,167 71, , ,830 39,450 68, , ,907 59,268 88, , ,203 86, , , ,233 37, , , ,358 35,876 78, , ,114 77, , , ,713 65, , , ,037 72, , , ,053 52,350 89, , ,783 63,519 98, , ,807 60,512 93, , ,725 83, , , ,440 65, , , ,613 34,745 60, , ,789 18,965 34, , ,661 25,063 44, , ,741 20,824 36, , ,950 26,496 41, , ,241 32,215 61, , ,039 18,774 60,351
19 Table A5. Continued. Number Of Hunters Bag Per Hunter Days Hunted Daily Bag Total 95% Confidence Interval Year Harvest for Total Harvest Quail , ,711,186 2,352,252 3,070, , ,242,080 2,800,473 3,683, , ,012,172 1,701,565 2,322, , ,179,840 1,805,160 2,554, , ,256,571 1,892,142 2,621, , ,240,764 2,846,242 3,635, , ,328,404 2,861,486 3,795, , ,013,098 1,778,982 2,247, , ,307,057 1,976,583 2,637, , , ,199 1,144, , ,322,260 1,141,940 1,502, , ,493,212 1,256,216 1,730, , ,048, ,731 1,203, , ,028, ,071 1,220, , ,144, ,191 1,359, , , , , , , , , , , ,353 1,085, , ,023, ,117 1,212, , , ,772 1,033, , , , , , , , , , , , , , , , , , , , , , ,186 75, , , ,067 89, , , ,719 80, , , , , , , , , , , , , , , , , ,384
20 Table A5. Continued. Number Of Hunters Bag Per Hunter Days Hunted Daily Bag Total 95% Confidence Interval Year Harvest for Total Harvest Cottontail Rabbit , , , , , ,128, ,501 1,578, , , , , , , , , , , , , , , , , , , , , , , , , , , , , , , , , , , , , , , , , , , , , , , , , , , , , , , , , , , , , , , , , , , , , , , , , , , , , , ,700 94, , , ,217 92, , , , , , , , , , , , , , , ,966 86, , , ,944 75, , , , , , , ,119 83, , , , , , , ,887 83, ,257
21 Table A5. Continued. Number Of Hunters Bag Per Hunter Days Hunted Daily Bag Total 95% Confidence Interval Year Harvest for Total Harvest Jackrabbit , ,698 5,716 87, , ,598 8,927 64, , ,256 1,850 16, , , , , ,977 1,541 12, , , , , , , , ,185 2,580 15, , , , , , , ,993 1,481 4, , , , , , , , , , , , , , , , , , ,630 3,779 11, , ,911 1,056 8, , , , , ,877 2,315 17, , ,454 1,673 11, , , , , , , , , , , , , , , , , , , , , , , , ,016
22 Table A5. Continued. Number Of Hunters Bag Per Hunter Days Hunted Daily Bag Total 95% Confidence Interval Year Harvest for Total Harvest Swamp Rabbit , ,948 36,672 97, , ,622 30,227 63, , ,049 32,353 59, , ,686 31,287 68, , ,187 23,908 84, , ,852 41, , , ,305 35, , , ,101 43,944 88, , ,069 28,701 63, , ,965 27,923 64, , ,324 23,196 55, , ,686 19,760 51, , ,533 29,328 57, , ,512 27,075 53, , ,858 12,309 27, , ,867 21,768 41, , ,022 8,368 23, , ,690 23,946 91, , , , , ,013 4,333 17, , ,064 10,216 29, , ,833 3,060 12, , ,877 7,081 20, , ,829 4,021 15, , ,323 3,250 13, , ,548 6,908 22, , ,051 4,072 12, , ,829 3,520 36, , ,048 5,338 18, , , , , , , , ,960 4,020 51,899
23 Table A5. Continued. Number Of Hunters Bag Per Hunter Days Hunted Daily Bag Total 95% Confidence Interval Year Harvest for Total Harvest Fox Squirrel , , , , , , ,904 1,139, , , , , , , , , , , , , , , , , , , , , , , , , , , , , , , , , , , , , , , , , , , , , , , , , , , , , , , , , , , , , , , , , , , , , , , , , , , ,944 1,386, , , , , , , , , , , , , , , , , , , , , , , , , , , , , , , , , , , , , , , , , , , , ,627
24 Table A5. Continued. Number Of Hunters Bag Per Hunter Days Hunted Daily Bag Total 95% Confidence Interval Year Harvest for Total Harvest Gray Squirrel , , , , , , , , , , , , , , ,418 1,191, , , , , , , , , , , , , , , , , , , , , , , , , , , , , , , , , , , , , , , , , , , , , , , ,722 1,642, , , , , , , , , , , , , , , , , , , ,264 1,731, , , ,319, , , , , , , , , , , , , , , , , , , , , , , , , , , , , , , , , , , , , , , , ,900
25 Table A5. Continued. Number Of Hunters Bag Per Hunter Days Hunted Daily Bag Total 95% Confidence Interval Year Harvest for Total Harvest Turkey: Fall a , , , , , , , , , , , , , , , , , , , ,557 1,571 3, , ,429 3,092 5, , ,434 3,214 5, , ,763 3,429 6, , ,406 3,392 6, , ,217 3,741 6, , ,617 3,196 6, , ,669 7,692 11, , ,151 5,305 8, , ,614 7,673 11, , ,483 6,730 10, , ,336 4,705 7, , ,576 2,213 4, , ,195 2,747 5, , ,188 5,523 8, , ,442 3,862 7, , ,290 3,855 6, , ,538 3,153 5, , ,385 2,084 4, , ,600 4,336 6, , ,421 1,529 3, , ,429 2,703 6, , ,640 3,555 7,724
26 Table A5. Continued. Number Of Hunters Bag Per Hunter Days Hunted Daily Bag Total 95% Confidence Interval Year Harvest for Total Harvest Turkey: Spring a , , , , , , , , , , , , , , , , , , , ,751 17,509 23, , ,582 14,337 20, , ,196 14,349 20, , ,393 16,967 23, , ,549 18,012 25, , ,390 20,678 28, , ,866 22,072 29, , ,123 27,553 36, , ,241 36,135 46, , ,879 29,532 38, , ,463 31,824 41, , ,485 36,636 46, , ,992 26,092 35, , ,142 26,628 35, , ,407 32,609 42, , ,769 21,519 30, , ,954 24,701 33, , ,251 18,760 25, , ,394 18,527 26, , ,835 17,385 22, , ,781 16,019 21, , ,460 22,091 32, , ,865 21,248 32,483
27 Table A5. Continued. Number Of Hunters Bag Per Hunter Days Hunted Daily Bag Total 95% Confidence Interval Year Harvest for Total Harvest Woodcock , ,025 2,978 11, , ,858 4,968 12, , , , ,021 1,907 14, , , , , , , , , , , , , , , , , , , , , , , , , , , , , , , , , , , , , , ,340
28 Table A5. Continued. Number Of Hunters Bag Per Hunter Days Hunted Daily Bag Total 95% Confidence Interval Year Harvest for Total Harvest Coyote , ,611 57, , , ,918 55, , , , , , ,649 57, , , ,321 75, , , ,037 45, , , ,485 90, , , ,966 87, , , ,455 85, , , , , , , ,270 89, , , ,036 39, , , ,587 83, , , , , , , ,074 95, ,156 Bobcat , ,800 6,817 22, , ,630 3,702 11, , ,669 8,636 24, , ,628 14,734 30, , ,645 9,647 19, , ,522 7,258 21, , ,963 8,225 21, , ,138 12,287 25, , ,220 7,650 16, , ,371 7,449 23, , ,028 5,751 12, , ,950 7,075 14, , ,047 3,297 8, , ,552 6,665 26, , ,559 14,809 42,308 Raccoon , ,439 45,639 87, , ,705 47,872 95, , ,480 51,955 93, , ,627 40,533 74, , ,781 46,919 94, , ,895 38,468 83, , ,607 57,094 98, , ,746 55, , , ,789 72, , , ,026 56,244 99, , ,932 52,288 99, , ,402 61,077 91, , ,751 39,867 75, , ,513 46,088 96, , ,481 50, ,780
29 Table A5. Continued. Number Of Hunters Bag Per Hunter Days Hunted Daily Bag Total 95% Confidence Interval Year Harvest for Total Harvest Beaver , ,978 4,733 15, , ,598 4,233 18, , ,055 4,464 19, , ,409 2,379 18, , ,069 1,174 20, , ,747 3,629 21, , ,682 1,562 17, , ,806 1,301 32, , ,446 5,022 9, , ,882 1,682 24, , , , , ,227 7,440 15, , ,174 3,118 13, , ,488 5,768 11, , ,292 7,273 25,311 Gray Fox , , , , ,084 1,208 2, , , , , , , , , , , , , ,482 2,298 6, , , , , , , , , , , , , , , , , , , ,305 Red Fox , , , , , , , , , , ,
30 Table A5. Continued. Number Of Hunters Bag Per Hunter Days Hunted Daily Bag Total 95% Confidence Interval Year Harvest for Total Harvest River Otter , , , , , , ,949 Bear , Elk , Antelope Prairie Chicken , ,398 3,714 21, , ,459 3,302 11, , ,016 2,388 9, , ,639 2,811 12, , ,512 2,411 10, , ,363 4,921 11, , ,352 1,097 9, , , , , , , , , ,080 a Confidence intervals for turkey harvest estimates were not available for A correction factor was applied to the turkey estimates during those years, but it was evaluated in 1996 and deemed inappropriate. The harvest estimates for turkey prior to 1995 were recalculated without the correction factor but confidence intervals could not be calculated.
31 Table A6. number of days deer hunters participated in each deer season in Oklahoma, Year Total Days a Archery Days Muzzleloader Days Youth Days Rifle Days N/A N/A N/A N/A a Number of days of deer hunting was collected as one aggregate variable in years In years 2003-present, number of days of deer hunting was collected by season and summed to calculate total mean days. b Holiday antlerless deer gun season began in Holiday Days b
32 Table A7. number of deer harvested by deer hunters in each deer season in Oklahoma, Total: All-Seasons Archery Primitive Youth Rifle Holiday Year Number Deer Number Bucks Number Does Number Bucks Number Does Number Bucks Number Does Number Bucks Number Does Number Bucks Number Does N/A N/A N/A N/A N/A N/A N/A N/A Number Does

33 North West North Central North East South East South Central South West Figure A1. Regional boundaries for Oklahoma used in the Game Harvest Survey.
34 Estimated Harvest Estimated # Hunters 600,000 Crow 18, ,000 16,000 14, ,000 12, ,000 10,000 8, ,000 6, ,000 4,000 2, Year Estimated Harvest Estimated No. of Hunters Figure A2. Statewide trends in estimated crow harvest and estimated number of crow hunters in Oklahoma,
35 Estimated Harvest Estimated No. of Hunters Mourning Dove 2,500,000 90,000 80,000 2,000,000 70,000 60,000 1,500,000 50,000 1,000,000 40,000 30, ,000 20,000 10, Year Estimated Harvest Estimated No. of Hunters Figure A3. Statewide trends in estimated mourning dove harvest and estimated number of mourning dove hunters in Oklahoma,
36 Estimated Harvest Estimated No. of Hunters 140,000 Ring-necked Pheasant 25, , ,000 20,000 80,000 15,000 60,000 10,000 40,000 20,000 5, Estimated Harvest Figure A4. Statewide trends in estimated ring-necked pheasant harvest and estimated number of ring-necked pheasant hunters in Oklahoma, Year Estimated No. of Hunters
37 Estimated Harvest Estimated No. of Hunters Quail 3,500, ,000 3,000, ,000 2,500, ,000 2,000,000 80,000 1,500,000 60,000 1,000,000 40, ,000 20, Year Estimated Harvest Estimated No. of Hunters Figure A5. Statewide trends in estimated quail harvest and estimated number of quail hunters in Oklahoma,
38 Estimated Harvest Estimated No. of Hunters Cottontail Rabbit 1,200,000 90,000 1,000,000 80,000 70, ,000 60, ,000 50,000 40, ,000 30, ,000 20,000 10, Estimated Harvest Year Estimated No. of Hunters Figure A6. Statewide trends in estimated cottontail rabbit harvest and estimated number of cottontail rabbit hunters in Oklahoma,
39 Estimated Harvest Estimated No. of Hunters Jackrabbit 70,000 9,000 60,000 8,000 50,000 7,000 6,000 40,000 5,000 30,000 4,000 20,000 10,000 3,000 2,000 1, Year Estimated Harvest Estimated No. of Hunters Figure A7. Statewide trends in estimated jackrabbit harvest and estimated number of jackrabbit hunters in Oklahoma,
40 Estimated Harvest Estimated No. of Hunters Swamp Rabbit 90,000 14,000 80,000 12,000 70,000 60,000 10,000 50,000 8,000 40,000 30,000 20,000 10,000 6,000 4,000 2, Year Estimated Harvest Estimated No. of Hunters Figure A8. Statewide trends in estimated swamp rabbit harvest and estimated number of swamp rabbit hunters in Oklahoma,
41 Estimated Harvest Estimated No. of Hunters Fox Squirrel 1,000,000 80, , , ,000 70,000 60, ,000 50, ,000 40, , , , ,000 30,000 20,000 10, Year Estimated Harvest Estimated No. of Hunters Figure A9. Statewide trends in estimated fox squirrel harvest and estimated number of fox squirrel hunters in Oklahoma,
42 Estimated Harvest Estimated No. of Hunters Gray Squirrel 1,000,000 60, , ,000 50, ,000 40, , ,000 30, , ,000 20, ,000 10, , Estimated Harvest Year Estimated No. of Hunters Figure A10. Statewide trends in estimated gray squirrel harvest and estimated number of gray squirrel hunters in Oklahoma,
43 Estimated Harvest Estimated No. of Hunters Fall Turkey 16,000 35,000 14,000 30,000 12,000 25,000 10,000 8,000 6,000 4,000 20,000 15,000 10,000 2,000 5, Year Estimated Harvest Estimated No. of Hunters Figure A11. Statewide trends in estimated fall turkey harvest and estimated number of fall turkey hunters in Oklahoma,
44 Estimated Harvest Estimated No. of Hunters Spring Turkey 45,000 80,000 40,000 70,000 35,000 60,000 30,000 50,000 25,000 40,000 20,000 15,000 30,000 10,000 20,000 5,000 10, Year Estimated Harvest Estimated No. of Hunters Figure A12. Statewide trends in estimated spring turkey harvest and estimated number of spring turkey hunters in Oklahoma,
45 Estimated Harvest Estimated No. of Hunters American Woodcock 25,000 4,000 3,500 20,000 3,000 15,000 2,500 2,000 10,000 1,500 5,000 1, Year Estimated Harvest Estimated No. of Hunters Figure A13. Statewide trends in estimated American woodcock harvest and estimated number of American woodcock hunters in Oklahoma,
46 Estimated Harvest Estimated No. of Hunters Coyote 300,000 35, ,000 30, ,000 25,000 20, ,000 15, ,000 10,000 50,000 5, Year Estimated Harvest Estimated No. of Hunters Figure A14. Statewide trends in estimated coyote harvest and estimated number of coyote hunters in Oklahoma,
47 Estimated Harvest Estimated No. of Hunters 30,000 Bobcat 14,000 25,000 12,000 20,000 10,000 8,000 15,000 6,000 10,000 4,000 5,000 2, Year Estimated Harvest Estimated No. of Hunters Figure A15. Statewide trends in estimated bobcat harvest and estimated number of bobcat hunters in Oklahoma,
48 Estimated Harvest Estimated No. of Hunters 100,000 Raccoon 12,000 90,000 80,000 10,000 70,000 8,000 60,000 50,000 6,000 40,000 30,000 4,000 20,000 2,000 10, Year Estimated Harvest Estimated No. of Hunters Figure A16. Statewide trends in estimated raccoon harvest and estimated number of raccoon hunters in Oklahoma,
49 Estimated Harvest Estimated No. of Hunters 18,000 Beaver 3,500 16,000 14,000 3,000 12,000 2,500 10,000 2,000 8,000 1,500 6,000 4,000 2,000 1, Year Estimated Harvest Estimated No. of Hunters Figure A17. Statewide trends in estimated beaver harvest and estimated number of beaver hunters in Oklahoma,
50 Estimated Harvest Estimated No. of Hunters 5,000 Gray Fox 2,500 4,500 4,000 2,000 3,500 3,000 1,500 2,500 2,000 1,000 1,500 1, Year Estimated Harvest Estimated No. of Hunters Figure A18. Statewide trends in estimated gray fox harvest and estimated number of gray fox hunters in Oklahoma,
51 Estimated Harvest Estimated No. of Hunters 1,200 Red Fox 1,800 1,000 1,600 1, , , Year Estimated Harvest Estimated No. of Hunters Figure A19. Statewide trends in estimated red fox harvest and estimated number of red fox hunters in Oklahoma,
52 Estimated Harvest Estimated No. of Hunters 1,400 River Otter 1,400 1,200 1,200 1,000 1, Year Estimated Harvest Estimated No. of Hunters Figure A20. Statewide trends in estimated river otter harvest and estimated number of river otter hunters in Oklahoma,
53 APPENDIX B Human Dimensions Issues Tables and Graphs
54 Table B1. Rate of participation in specific 2017 hunting seasons by all license holders, and by license type. (*Small sample size.) Total Sample Participation Lifetime Participation by License Type Annual/Five-Year Senior Hunting Season (n = 1,384) (n = 614) (n = 327) (n = 443) Season n Percent Season n Percent Season n Percent Season n Percent Any Hunting Deer (Overall) Gun Primitive Firearms Archery Special Antlerless Youth Season Dove Turkey (Overall) Spring Turkey Fall Turkey Feral Swine Waterfowl (Overall) Ducks Geese Squirrel (Overall) Fox Squirrel Gray Squirrel Quail Furbearers (Overall) Coyote Raccoon Bobcat Beaver* Gray Fox* Red Fox* Otter* Rabbit (Overall) Cottontail Rabbit Swamp Rabbit* Jackrabbit* Pheasant Crow Woodcock*
55 "Did you hunt in Oklahoma during 2017?" 100% 90% 80% 70% 60% 50% 40% 30% 20% 10% 0% 71% Lifetime license holders (n = 614) Annual/Five-Year license holders (n = 327) Senior license holders (n = 443) 81% Yes 20% 29% 19% No 80% Figure B1. Distribution of hunting license holder participation in hunting activities during 2017, by license category. Both hunting and combination-hunting-and-fishing licenses were included in all license categories (n = 1,384).
56 Type of Land Used for Hunting in Oklahoma during 2017, by Season Public land only Private land only Both public and private Overall (n = 757; 33 missing) Deer (n=626) Crow (n=36) Dove (n=232) Pheasant (n=45) Quail (n=115) Cottontail (n=59) Jackrabbit* (n=5) Swamp Rabbit* (n=8) Fox Squirrel (n=106) Gray Squirrel (n=93) Fall Turkey (n=81) Spring Turkey (n=199) Ducks (n=141) Geese (n=81) Woodcock* (n=3) 0% 20% 40% 60% 80% 100% Figure B2. Distribution of land use for specific hunting seasons during Sample sizes and missing data vary for each species. *Small sample size.
57 Did you use public land for any portion of your hunting in Oklahoma during 2017? All hunting license holders (n = 1,365; 19 missing) Active hunting license holders (n = 771; 19 missing) Yes 20% Did not hunt in % No 37% Yes 36% No 64% Figure B3. Distribution of hunting license holder use of public land during the 2017 hunting season. Considering all Oklahoma hunting seasons in 2017, how much of your hunting occurred on public vs. private land? Averaged across active hunters (n = 757; 33 missing) Private Land 81% Public Land 19% Figure B4. Average proportion of 2017-season hunting that occurred on public or private land, by license holders who hunted during 2017.
58 [Asked of hunters who used public land:] How important is public land to you for your hunting? 100% 80% 85% Not important Somewhat important Very important 81% 81% 83% 79% 80% 79% 80% 80% 82% 60% 40% 20% 0% 17% 17% 20% 13% 16% 18% 19% 18% 18% 15% 2% 2% 2% 2% 1% 2% 2% 2% 2% 3% Figure B5. Importance of public land to active hunters who used public land (2008 n = 447, 5 missing; 2009 n = 497, 15 missing; 2010 n = 449, 7 missing; 2011 n = 474, 5 missing; 2012 n = 452, 4 missing; 2013 n = 385, 0 missing; 2014 n = 958, 6 missing; 2015 n = 512, 2 missing; 2016 n = 334, 3 missing; 2017 n =273, 5 missing). Please check the box for each part of Oklahoma where you hunted on public land during 2017, based on the major highways: Active hunters 2017 (n = 790) 9% 16% 6% 14% Figure B6. Use of public land located in each region, by active hunting license holders in 2017.
59 Participation in Specific Deer Seasons 2017-season deer hunters (n = 637) (*Senior citizen license holders excluded for Youth Season) 100% Multiple responses allowed 88% 80% 60% 40% 20% 0% 60% 48% 21% 5% Archery Muzzleloader Rifle Youth Rifle* Holiday Figure B7. Participation in individual deer seasons, by 2017-season deer hunters. 50% Patterns of Participation: Number of Deer Seasons 2017-season deer hunters (n = 619) 40% 30% 32% 31% 27% 20% 10% 0% 11% One season only Two seasons Three seasons All four seasons Figure B8. Number of deer seasons (archery, primitive, gun and holiday season; youth season excluded) participated in by 2017-season deer hunters.
60 Patterns of Participation: Specific Deer Seasons 2017-season deer hunters (n = 619) Archery only 9% Muzzleloader only 1% Gun only 21% Holiday only Muzzleloader & holiday 0% 0% Gun & holiday 4% Muzzleloader & gun 12% Archery & holiday 1% Archery & gun 14% Archery & muzzleloader Muzzleloader, gun & holiday Archery, muzzleloader, holiday Archery, gun, holiday 1% 3% 0% 4% Archery, muzzleloader, gun 21% All four deer seasons 11% 0% 10% 20% 30% 40% 50% Figure B9. Specific deer seasons (archery, primitive, gun and holiday antlerless season; youth season excluded) participated in by 2017-season deer hunters.
61 Other Deer Hunting by Youth Season Participants 2017 youth deer season hunters (n = 33) No other season 9% Archery 41% Muzzeloader 50% Regular rifle 97% Holiday season 16% 0% 20% 40% 60% 80% 100% Figure B10. Participation in other deer seasons by 2017 youth deer season hunters. Total Number of Deer Harvested Per Hunter 2017-season deer hunters (n = 625; 12 missing) Total Number of Bucks: annual limit of 2 in archery, muzzleloader, gun & youth combined Total Number of Does: annual limit of 7 in archery, muzzleloader, gun, youth & the holiday antlerless season combined Total Number of Deer: annual limit of 7 in archery, muzzleloader, gun, youth & the holiday antlerless season combined 100% 80% 60% 40% 20% 0% Figure B11. Total number of deer harvested per hunter across all 2017 seasons: archery, muzzleloader, gun, youth, and the holiday antlerless season.
62 "How much of your archery hunting was done with a crossbow?" 80% All/Most Some None 60% 40% 33% 57% 51% 40% 42% 48% 20% 10% 9% 10% 0% Figure B12. Crossbow use by 2015 archery deer hunters (n = 780); 2016 (n = 470); 2017 (n = 376). 100% 80% Reasons for Not Hunting by Inactive Hunting License Holders Did not hunt in 2017 (n = 579; 15 missing) 60% 40% 20% 0% 0% Costs too much 8% No place to go 31% Health issues 12% Not interested 20% Other priorities 27% Other Figure B13. Barriers to hunting participation, by hunting license holders who were inactive in 2017.
63 Did you use private land enrolled in the Oklahoma Land Access Program (OLAP) for any portion of your hunting during 2017? Active hunters 2017 (n = 741) Yes 5% No, but I plan to 27% No, and I don't plan to 68% Figure B14. Use of Oklahoma Land Access Program lands for 2017 hunting, by active hunters. [Asked of hunters who used OLAP land:] Did you harvest any of the following species on OLAP property? 100% Multiple responses allowed. 80% 60% 40% 24% 24% 21% 20% 18% 12% 6% 6% 0% 0% Deer Quail Dove Other Pheasant Turkey Pronghorn Did not harvest anything Figure B15. Species harvested and success by 2017 OLAP land (n = 34).
64 100% [Asked of hunters who used OLAP land:] How would you rate your satisfaction with the OLAP properties you hunted on? 80% 60% 40% 32% 41% 20% 0% 3% Extremely dissatisfied 12% Moderately dissatisfied Neutral Moderately satisfied 12% Extrememly satisfied Figure B16. Satisfaction with OLAP property hunting, by 2017 OLAP hunters (n = 34). To what extent do you support or oppose the Wildlife Department doing each of the following... Leasing private land for public hunting and fishing access 9% 18% 20% 48% Purchasing land to expand current WMAs 5% 15% 21% 56% Purchasing land to create new WMAs 5% 17% 19% 57% 0% 20% 40% 60% 80% 100% Strongly oppose Moderately oppose Neutral Moderately supoprt Strongly support Figure B17. Hunter opinions about ODWC land purchasing and leasing (n = 708; excludes 82 respondents who selected No opinion/don t know ).
65 "Please indicate the level you disagree or agree with the following statements:" Hunting on WMAs is better than hunting on private lands that I have access to. 31% 29% 29% 7% 4% WMAs provide high-quality hunting experiences. 6% 15% 38% 28% 13% There are not enough WMAs near me 7% 11% 38% 22% 22% WMAs are safe places to hunt 7% 14% 32% 29% 18% Game species are well-managed at WMAs 5% 11% 37% 33% 14% WMAs provide enough youth hunting opportunities 6% 10% 37% 27% 21% WMAs are well-maintained 6% 9% 35% 35% 15% WMAs are too crowded 4% 8% 30% 33% 26% It is easy to find WMAs 5% 9% 22% 36% 29% I understand the rules for hunting on WMAs 3% 6% 18% 30% 43% 0% 20% 40% 60% 80% 100% Strongly disagree Moderately disagree Neutral Moderately agree Strongly agree Figure B18. Hunter opinions about WMA attributes (n = ; excludes respondents who selected No opinion/don t know ).
66 [Asked of hunters who used public land:] Overall, how would you rate your satisfaction with the public land you hunted on? 100% 80% 60% 45% 40% 20% 0% 1% Extremely dissatisfied 11% Moderately dissatisfied 18% Neutral Moderately satisfied 25% Extrememly satisfied Figure B19. Satisfaction with public land hunting, by 2017 public land hunters (n = 268; excludes 10 respondents who selected No opinion/don t know ).
67 "How important are each of the follwing for you to have a successful deer hunting experience:" Telling my family/friends about my hunting experience online 42% 8% 27% 14% 9% Showing my family/friends a trophy deer I harvested 24% 12% 27% 23% 13% Harvesting a trophy deer 20% 10% 21% 32% 17% Getting a shot at deer 7% 8% 27% 34% 24% Using skills such as stalking or tracking 8% 7% 23% 36% 26% Having an opportunity to use my hunting equipment 3% 6% 22% 38% 31% Sharing my hunting skills and knowledge with new hunters 5% 7% 19% 32% 36% Seeing many deer 2% 16% 39% 38% Harvesting a deer for food 6% 6% 11% 34% 43% Experiencing the thrill and excitement of harvesting a deer 3% 5% 13% 34% 44% Making decisions about which deer to harvest or not harvest 4% 5% 13% 25% 54% Having a chance to get away and relax 1% 4% 22% 70% Spending time with family/friends 2% 6% 19% 71% Being outdoors/in nature 1% 2% 18% 78% 0% 20% 40% 60% 80% 100% Not at all important Slightly important Neutral Moderatly important Extremely important Figure B20. Deer hunter ratings of multiple aspects of a successful deer hunting experience (n = ; 9-17 missing).
68 APPENDIX D Survey Instrument
69
70
71
72
73
74
75
76
77
78
79
80
81
82
83
84
FINAL PERFORMANCE REPORT
 FINAL PERFORMANCE REPORT Federal Aid Grant No. F12AF00945 (W-82-R-51) Upland Game Investigations Oklahoma Department of Wildlife Conservation July 1, 2012 through June 30, 2017 FINAL PERFORMANCE REPORT
Demographics of Quail Hunters in Oklahoma
 National Quail Symposium Proceedings Volume 4 Article 55 2 Demographics of Quail Hunters in Oklahoma Andrea K. Crews Oklahoma Department of Wildlife Conservation Stephen J. DeMaso Oklahoma Department of
ALABAMA HUNTING SURVEY
 ALABAMA HUNTING SURVEY 2010-2011 SEASON Randy Liles STUDY LEADER Federal Assistance Project funded by your purchase of hunting licenses and equipment. ALABAMA DIVISION OF WILDLIFE AND FRESHWATER FISHERIES
Illinois Hunter Harvest Report
 HumanDimensions R e s e a r c h P r o g r a m 2012-2013 Illinois Hunter Harvest Report Illinois Natural History Survey Prairie Research Institute University of Illinois at Urbana-Champaign Federal Aid
2009 SMALL GAME HUNTER MAIL SURVEY
 INTRODUCTION 2009 SMALL GAME HUNTER MAIL SURVEY Margaret Dexter, Wildlife Research Unit The Minnesota Department of Natural Resources, Division of Fish and Wildlife, Wildlife Research unit annually conducts
New Jersey Trapper Harvest, Recreational and Economic Survey
 Summary Mail questionnaires were sent to 509 trappers requesting harvest, recreational and socioeconomic information for the 2003-04 trapping season. Survey results indicate that resident trappers are
AN ASSESSMENT OF NEW JERSEY RESIDENT HUNTER OPINION ON CROSSBOW USE
 AN ASSESSMENT OF NEW JERSEY RESIDENT HUNTER OPINION ON CROSSBOW USE Survey mailed: December 2007 Data analyzed: January 2008 Division of Fish and Wildlife David Chanda, Director Larry Herrighty, Assistant
New Jersey Trapper Harvest, Recreational and Economic Survey
 Summary A 2009-10 New Jersey Trapper Harvest Survey was mailed to 987 licensed requesting harvest, recreational and socio-economic information for the 2009-10 trapping season. The mean age of licensed
Central Hills Prairie Deer Goal Setting Block G9 Landowner and Hunter Survey Results
 Central Hills Prairie Deer Goal Setting Block G9 Landowner and Hunter Survey Results Table of Contents Public Surveys for Deer Goal Setting... 1 Methods... 1 Hunter Survey... 2 Demographics... 2 Population
Northwest Parkland-Prairie Deer Goal Setting Block G7 Landowner and Hunter Survey Results
 Northwest Parkland-Prairie Deer Goal Setting Block G7 Landowner and Hunter Survey Results Table of Contents Public Surveys for Deer Goal Setting... 1 Methods... 1 Hunter Survey... 2 Demographics... 2 Population
Hunter and Angler Expenditures, Characteristics, and Economic Effects, North Dakota,
 Agribusiness and Applied Economics Report No. 507-S January 2003 Hunter and Angler Expenditures, Characteristics, and Economic Effects, North Dakota, 2001-2002 Dean A. Bangsund and F. Larry Leistritz*
TRAPPING HARVEST STATISTICS. Division of Fish and Wildlife 500 Lafayette Road, Box 20 Saint Paul, MN (651)
") TRAPPING HARVEST STATISTICS Division of Fish and Wildlife 500 Lafayette Road, Box 20 Saint Paul, MN 55155-4020 (651) 259-5207 289 290 2010 TRAPPER HARVEST SURVEY Margaret Dexter, Wildlife Research Unit
TRAPPING HARVEST STATISTICS Division of Fish and Wildlife 500 Lafayette Road, Box 20 Saint Paul, MN 55155-4020 (651) 259-5207 289 290 2010 TRAPPER HARVEST SURVEY Margaret Dexter, Wildlife Research Unit
TRAPPING HARVEST STATISTICS. Division of Fish and Wildlife 500 Lafayette Road, Box 20 Saint Paul, MN (651)
") TRAPPING HARVEST STATISTICS Division of Fish and Wildlife 500 Lafayette Road, Box 20 Saint Paul, MN 55155-4020 (651) 259-5207 265 266 2014 TRAPPER HARVEST SURVEY INTRODUCTION Margaret Dexter, Wildlife
TRAPPING HARVEST STATISTICS Division of Fish and Wildlife 500 Lafayette Road, Box 20 Saint Paul, MN 55155-4020 (651) 259-5207 265 266 2014 TRAPPER HARVEST SURVEY INTRODUCTION Margaret Dexter, Wildlife
TRAPPING HARVEST STATISTICS. Division of Fish and Wildlife 500 Lafayette Road, Box 20 Saint Paul, MN (651)
") TRAPPING HARVEST STATISTICS Division of Fish and Wildlife 500 Lafayette Road, Box 20 Saint Paul, MN 55155-4020 (651) 259-5207 285 286 INTRODUCTION 2015 TRAPPER HARVEST SURVEY Margaret Dexter, Wildlife
TRAPPING HARVEST STATISTICS Division of Fish and Wildlife 500 Lafayette Road, Box 20 Saint Paul, MN 55155-4020 (651) 259-5207 285 286 INTRODUCTION 2015 TRAPPER HARVEST SURVEY Margaret Dexter, Wildlife
TRAPPING HARVEST STATISTICS. Division of Fish and Wildlife 500 Lafayette Road, Box 20 Saint Paul, MN (651)
") TRAPPING HARVEST STATISTICS Division of Fish and Wildlife 500 Lafayette Road, Box 20 Saint Paul, MN 55155-4020 (651) 259-5207 265 266 2007 TRAPPER HARVEST SURVEY Margaret Dexter, Wildlife Research Unit
TRAPPING HARVEST STATISTICS Division of Fish and Wildlife 500 Lafayette Road, Box 20 Saint Paul, MN 55155-4020 (651) 259-5207 265 266 2007 TRAPPER HARVEST SURVEY Margaret Dexter, Wildlife Research Unit
The Incidence of Daytime Road Hunting During the Dog and No-Dog Deer Seasons in Mississippi: Comparing Recent Data to Historical Data
 The Incidence of Daytime Road Hunting During the Dog and No-Dog Deer Seasons in Mississippi: Comparing Recent Data to Historical Data Preston G. Sullivan, Coalition for Ethical Deer Hunting, ethicaldeerhunting@gmail.com
Wildlife Ad Awareness & Attitudes Survey 2015
 Wildlife Ad Awareness & Attitudes Survey 2015 Contents Executive Summary 3 Key Findings: 2015 Survey 8 Comparison between 2014 and 2015 Findings 27 Methodology Appendix 41 2 Executive Summary and Key Observations
FOX AND COYOTE TRAPPING SURVEY
 DNR MICHIG AN EDEPARTMENT OF NATURAL R SOURCES MICHIGAN DEPARTMENT OF NATURAL RESOURCES Wildlife Division Report No. 3430 February 2005 Printed by Authority of: P.A. 451 of 1994 Total Number of Copies
Kansas Deer Report Seasons
 Kansas Deer Report 215-16 Seasons I. Current Harvest Hunter harvest of deer during the 215-16 seasons was estimated to be 95,813, 2.% more than the 93,94 deer taken in 214-15 (see table below for breakdown
AN ASSESSMENT OF NEW JERSEY DEER HUNTER OPINION ON EXPANDING ANTLER POINT RESTRICTION (APR) REGULATIONS IN DEER MANAGEMENT ZONES 28, 30, 31, 34 AND 47
 REGULATIONS IN DEER MANAGEMENT ZONES 28, 30, 31, 34 AND 47") AN ASSESSMENT OF NEW JERSEY DEER HUNTER OPINION ON EXPANDING ANTLER POINT RESTRICTION (APR) REGULATIONS IN DEER MANAGEMENT ZONES 28, 30, 31, 34 AND 47 Survey mailed: April 2010 Data analyzed: June 2010
AN ASSESSMENT OF NEW JERSEY DEER HUNTER OPINION ON EXPANDING ANTLER POINT RESTRICTION (APR) REGULATIONS IN DEER MANAGEMENT ZONES 28, 30, 31, 34 AND 47 Survey mailed: April 2010 Data analyzed: June 2010
Hunting Seasons and Bag Limits
 2017-18 Hunting Seasons and Bag Limits These are the seasons and bag limits for most hunting and trapping seasons from July 1, 2017 through June 30, 2018. 2017-18 HUNTING SEASONS AND BAG LIMITS SQUIRRELS,
HUNTERS OPINIONS ON SHOOTING DEER OVER SUPPLEMENTAL FEED OR CORN
 HUNTERS OPINIONS ON SHOOTING DEER OVER SUPPLEMENTAL FEED OR CORN Conducted for the Mississippi Department of Wildlife, Fisheries, and Parks by Responsive Management 5 HUNTERS OPINIONS ON SHOOTING DEER
Hunter Perceptions of Chronic Wasting Disease in Illinois
 HumanDimensions R e s e a r c h P r o g r a m Hunter Perceptions of Chronic Wasting Disease in Illinois Joel Brunsvold, Director Illinois Department of Natural Resources Paul Vehlow Federal Aid Coordinator
Bowhunter Observation Survey
 Oklahoma Department of Wildlife Conservation Bowhunter Observation Survey 2016-Season The Oklahoma Department of Wildlife Conservation (ODWC) sought participation from bowhunters for the inaugural Bowhunter
Job Title: Game Management, Subsection B Game Management Predator and Furbearer Management. SPECIES: Predatory and Furbearing Mammals
 Job Title:, Subsection B SPECIES: Predatory and Furbearing Mammals PREDATORY AND FURBEARING MAMMALS APPROACHES (2012 data not summarized at the time of this report.) 1. Provide opportunity for 75,000 hunter
2014 Oregon Hunting Survey: An effort to better understand the choices Oregon hunters make regarding ammunition
 2014 Oregon Hunting Survey: An effort to better understand the choices Oregon hunters make regarding ammunition Q1. How many years have you lived in Oregon? YEARS LIVED IN OREGON Q2. How many years have
Tennessee Black Bear Public Opinion Survey
 Tennessee Black Bear Public Opinion Survey Executive Summary 2012 Survey TWRA Technical Report 12 02 This electronic publication was developed by the Tennessee Wildlife Resources Agency s Division of Wildlife
Fall Wild Turkey Population Survey, 2010
 This document is made available electronically by the Minnesota Legislative Reference Library as part of an ongoing digital archiving project. http://www.leg.state.mn.us/lrl/lrl.asp Fall Wild Turkey Population
WATERFOWL HUNTING IN MINNESOTA. A study of people who hunted for waterfowl in Minnesota from 2000 through Final Report
 WATERFOWL HUNTING IN MINNESOTA A study of people who hunted for waterfowl in Minnesota from 2000 through 2004 Final Report A cooperative study conducted by: Minnesota Cooperative Fish and Wildlife Research
Bowhunter Observation Survey
 Oklahoma Department of Wildlife Conservation Bowhunter Observation Survey 2017-Season The Oklahoma Department of Wildlife Conservation (ODWC) sought participation from bowhunters for the second annual
Full summaries of all proposed rule changes, including DMU boundary descriptions, are included in the additional background material.
 The Florida Fish and Wildlife Conservation Commission (FWC) implemented a public outreach and input process in 2013 and 2014 in management Zones A, B and C. The goal of this process was to present the
Big Game Season Structure, Background and Context
 To: Members of the Colorado Parks and Wildlife Commission From: Danielle Isenhart, Regulations Manager Date: April 16, 2018 Re: 2020-2024 Big Game Season Structure, Background and Context At the May Commission
RESULTS OF THE TRAPPING SEASON
 Trapping Licenses RESULTS OF THE 2017-2018 TRAPPING SEASON Despite the stagnant fur market, the total number of trapping licenses sold increased this year by 10%. Records indicate a total of 2,374 trapping
Status and Distribution of the Bobcat (Lynx rufus) in Illinois
 in Illinois") Transactions of the Illinois State Academy of Science received 9/14/99 (2000), Volume 93, #2, pp. 165-173 accepted 1/16/00 Status and Distribution of the Bobcat (Lynx rufus) in Illinois Alan Woolf 1, Clayton
Transactions of the Illinois State Academy of Science received 9/14/99 (2000), Volume 93, #2, pp. 165-173 accepted 1/16/00 Status and Distribution of the Bobcat (Lynx rufus) in Illinois Alan Woolf 1, Clayton
2018 Season Waterfowl Hunter Survey Summary. Presented by Josh Richardson, Sr. Biologist Oklahoma Department of Wildlife Conservation
 2018 Season Waterfowl Hunter Survey Summary Presented by Josh Richardson, Sr. Biologist Oklahoma Department of Wildlife Conservation Background Waterfowl hunting season and limits are determined by both
The 2005 Waterfowl Hunting Season in Minnesota: A Study of Hunters Opinions and Activities. White-winged scoter. Final Report
 This document is made available electronically by the Minnesota Legislative Reference Library as part of an ongoing digital archiving project. http://www.leg.state.mn.us/lrl/lrl.asp The 2005 Waterfowl
FWC DEER HARVEST SURVEY: FINAL REPORT
 FWC 2007-2008 DEER HARVEST SURVEY: FINAL REPORT Prepared for: FLORIDA FISH AND WILDLIFE CONSERVATION COMMISSION Prepared by: VAI November 3, 2009 TABLE OF CONTENTS INTRODUCTION... 1 SUMMARY OF FINDINGS...
2018 MINNESOTA PRAIRIE-CHICKEN HARVEST SURVEY
 2018 MINNESOTA PRAIRIE-CHICKEN HARVEST SURVEY Charlotte Roy Forest Wildlife Populations and Research Group Minnesota Department of Natural Resources Grand Rapids, Minnesota 14 December 2018 SUMMARY OF
Introduction to Pennsylvania s Deer Management Program. Christopher S. Rosenberry Deer and Elk Section Bureau of Wildlife Management
 Introduction to Pennsylvania s Deer Management Program Christopher S. Rosenberry Deer and Elk Section Bureau of Wildlife Management To anyone who has carefully studied the situation it is evident that
2016 ANNUAL REPORT A CONSTITUTIONAL AGENCY FUNDED BY SPORTSMEN AND WOMEN THROUGH THEIR PURCHASE OF HUNTING AND FISHING LICENSES.
 216 ANNUAL REPORT A CONSTITUTIONAL AGENCY FUNDED BY SPORTSMEN AND WOMEN THROUGH THEIR PURCHASE OF HUNTING AND FISHING LICENSES. WHO WE ARE The Oklahoma Department of Wildlife Conservation, or ODWC, is
Oklahoma Department of Wildlife Conservation 2015 POST-SEASON SURVEY OF PADDLEFISH PERMIT HOLDERS
 Oklahoma Department of Wildlife Conservation 2015 POST-SEASON SURVEY OF PADDLEFISH PERMIT HOLDERS PREPARED BY: Corey A. Jager, Responsive Management Specialist Jason D. Schooley, Paddlefish Biologist October
SPOTLIGHT DEER SURVEY YO RANCHLANDS LANDOWNERS ASSOCIATION ±10,400 ACRES KERR COUNTY
 SPOTLIGHT DEER SURVEY YO RANCHLANDS LANDOWNERS ASSOCIATION ±10,400 ACRES KERR COUNTY WRITTEN BY: SHANE KIEFER, CWB SARAH KAHLICH, AWB PLATEAU LAND & WILDLIFE MANAGEMENT AUGUST 1, 2016 EXECUTIVE SUMMARY
FWC DEER HARVEST SURVEY: FINAL REPORT
 FWC 2010-2011 DEER HARVEST SURVEY: FINAL REPORT Prepared for: FLORIDA FISH AND WILDLIFE CONSERVATION COMMISSION Prepared by: THE RESEARCH STAFF DRAFT REPORT 1.1 October 11, 2011 TABLE OF CONTENTS INTRODUCTION...
APPENDIX 3: EAGLECREST MASTER PLAN PUBLIC OPINION SURVEYS
 APPENDIX 3: EAGLECREST MASTER PLAN PUBLIC OPINION SURVEYS Eaglecrest Master Plan Public Opinion Surveys Prepared for Eaglecrest Ski Area Board of Directors Prepared by McDowell Group Inc. Eaglecrest Master
DEER HUNT RESULTS ON ALABAMA WILDLIFE MANAGEMENT AREAS ANNUAL REPORT, CHRISTOPHER W. COOK STUDY LEADER MAY, 2006
 DEER HUNT RESULTS ON ALABAMA WILDLIFE MANAGEMENT AREAS ANNUAL REPORT, 2005-2006 CHRISTOPHER W. COOK STUDY LEADER MAY, 2006 ALABAMA DIVISION OF WILDLIFE AND FRESHWATER FISHERIES Federal Aid Project funded
ALTERNATIVE DEER MANAGEMENT PLAN FOR GAME MANAGEMENT UNITS. 12A, 12B, 13A, 13B, 16A, 45A, 45B, 45C, and White-tailed Deer Units
 ALTERNATIVE DEER MANAGEMENT PLAN FOR GAME MANAGEMENT UNITS 12A, 12B, 13A, 13B, 16A, 45A, 45B, 45C, and White-tailed Deer Units Arizona Game and Fish Department April 4, 2006 Alternative Deer Management
Marrett Grund, Farmland Wildlife Populations and Research Group
 Minnesota s Wild Turkey Harvest - 2013 Marrett Grund, Farmland Wildlife Populations and Research Group Minnesota offers fall and spring turkey hunting seasons. The fall turkey season was 30 days in length
STATUS OF WILDLIFE POPULATIONS, FALL 2008
 STATUS OF WILDLIFE POPULATIONS, FALL 2008 (Including 1998-2008 Hunting and Trapping Harvest Statistics) edited by Margaret H. Dexter Minnesota Department of Natural Resources Division of Fish and Wildlife
BIG GAME SEASON STRUCTURE
 9/11/2014 2015-2019 BIG GAME SEASON STRUCTURE Approved By Parks and Wildlife Commission - September, 2014 I. DEER AND ELK SEASON STRUCTURE Deer and Elk Seasons listed below assume no change to the relative
Lead Ammunition Survey Summary
 Oregon Department of Fish and Wildlife Lead Ammunition Survey Summary Concern and scrutiny over the use of lead ammunition in regards to human health and wildlife has increased in recent years. California
DEER AND ELK POPULATION STATUS AND HARVEST STRUCTURE IN WESTERN NORTH AMERICA: A SUMMARY OF STATE AND PROVINCIAL STATUS SURVEYS.
 DEER AND ELK POPULATION STATUS AND HARVEST STRUCTURE IN WESTERN NORTH AMERICA: A SUMMARY OF STATE AND PROVINCIAL STATUS SURVEYS. JUSTIN BINFET,' Wyoming Game and Fish Department, 5400 Bishop Boulevard,
Internet Use Among Illinois Hunters: A Ten Year Comparison
 HumanDimensions R e s e a r c h P r o g r a m Internet Use Among Illinois Hunters: A Ten Year Comparison Illinois Natural History Survey Prairie Research Institute University of Illinois at Urbana-Champaign
Minnesota Deer Population Goals. East Central Uplands Goal Block
 Minnesota Deer Population Goals East Central Uplands Goal Block Minnesota DNR Section of Wildlife, 2015 Final Deer Population Goals Block 4: East Central Uplands The following pages provide a description
PEPPER RANCH PRESERVE QUALITY WILDLIFE MANAGEMENT HUNT PROGRAM Brochure FOR COLLIER COUNTY RESIDENTS ONLY
 PEPPER RANCH PRESERVE QUALITY WILDLIFE MANAGEMENT HUNT PROGRAM FOR COLLIER COUNTY RESIDENTS ONLY 2017-2018 Brochure Pepper Ranch Preserve Check Station 6315 Pepper Road Immokalee, FL 34142 Phone: 239-657-1999
NEVADA DEPARTMENT OF WILDLIFE HARVEST MANAGEMENT GUIDELINES FOR HUNTING SEASONS
 NEVADA DEPARTMENT OF WILDLIFE HARVEST MANAGEMENT GUIDELINES FOR HUNTING SEASONS Draft Page 2 of 15 TABLE OF CONTENTS Schedule for formulating harvest management guidelines..............................................
Deer Harvest Characteristics During Compound and Traditional Archery Hunts
 Deer Harvest Characteristics During Compound and Traditional Archery Hunts Stephen S. Ditchkoff, Department of Zoology, Oklahoma State Edgar R. Welch, Jr., Department of Zoology, Oklahoma State Robert
2017 RULE CHANGE PROPOSALS
 OKLAHOMA DEPARTMENT OF WILDLIFE CONSERVATION 2017 RULE CHANGE PROPOSALS 1. 800:10-1-3. Additional definitions Add definition for OLAP - walk-in fishing areas and stream access means bodies of water designated
STATE OF NEVADA BOARD OF WILDLIFE COMMISSIONERS CR 18-12
 STATE OF NEVADA BOARD OF WILDLIFE COMMISSIONERS The Board of Wildlife Commissioners under the authority of Section 501.181, 503.090, 503.140 and 503.245 of the Nevada Revised Statutes, does hereby adopt
Student Population Projections By Residence. School Year 2016/2017 Report Projections 2017/ /27. Prepared by:
 Student Population Projections By Residence School Year 2016/2017 Report Projections 2017/18 2026/27 Prepared by: Revised October 31, 2016 Los Gatos Union School District TABLE OF CONTENTS Introduction
2007 South Carolina. South Carolina department of natural resources. Submitted by Charles Ruth; Project Supervisor
 2007 South Carolina TURKEY Harvest Report South Carolina department of natural resources TURKEY research & management project Submitted by Charles Ruth; Project Supervisor INTRODUCTION Ranking only behind
Agency Determination [150B- 21.3A(c)(1)a] Implements or Conforms to Federal Regulation [150B-21.3A(e)] Necessary with substantive public interest
![Agency Determination [150B- 21.3A(c)(1)a] Implements or Conforms to Federal Regulation [150B-21.3A(e)] Necessary with substantive public interest](/thumbs/90/104454100.jpg "Agency Determination [150B- 21.3A(c)(1)a] Implements or Conforms to Federal Regulation [150B-21.3A(e)] Necessary with substantive public interest") Public Comment [150B- SECTION.0100 - GENERAL REGULATIONS 15A NCAC 10B.0101 IMPORTATION OF WILD ANIMALS AND BIRDS Amended Eff. August 1, 2010 15A NCAC 10B.0102 IMPORTATION OF GRAY FOXES Eff. February 1,
Public Comment [150B- SECTION.0100 - GENERAL REGULATIONS 15A NCAC 10B.0101 IMPORTATION OF WILD ANIMALS AND BIRDS Amended Eff. August 1, 2010 15A NCAC 10B.0102 IMPORTATION OF GRAY FOXES Eff. February 1,
2009 BIG GAME AND FURBEARER HARVEST RECORD FOR THE FOND DU LAC RESERVATION AND CEDED TERRITORIES
 2009 BIG GAME AND FURBEARER HARVEST RECORD FOR THE FOND DU LAC RESERVATION AND CEDED TERRITORIES Mike Schrage Wildlife Biologist Fond du Lac Resource Management Division 1720 Big Lake Rd. Cloquet, MN 55720
CRACIUN RESEARCH. June 20, 2011 A M A R K E T R E S E A R C H S T CHA
 CRACIUN RESEARCH A M A R K E T R E S E A R C H S T U D Y CHA June 20, 2011 Craciun Research Anchorage. Seattle. Washington, DC 907.279.3982 www.craciunresearch.com 2011 Craciun Research. All rights reserved.
Furbearer Management Newsletter
 West Virginia Division of Natural Resources Furbearer Management Newsletter Fall/Winter 2012/2013 Wildlife Resources Section By this time, we trust you are filling your fur sheds and reminiscing about
Minnesota s Wild Turkey Harvest 2016
 Minnesota s Wild Turkey Harvest 2016 This report summarizes the fall 2015 and spring 2016 Minnesota wild turkey harvest information. The fall turkey season was 30 days in length (October 3- November 1)
Minnesota s Wild Turkey Harvest 2015
 Minnesota s Wild Turkey Harvest 2015 This report summarizes the fall 2014 and spring 2015 Minnesota wild turkey harvest information. The fall turkey season was 30 days in length (October 4- November 2)
Enclosed, please find the 2018 Spotlight Deer Survey Report and Recommendations that we have prepared for your review and records.
 July 26, 2018 YO Ranchlands Landowner Association 1323 Whispering Pines Houston, TX 77055 To the Wildlife Committee: Enclosed, please find the 2018 Spotlight Deer Survey Report and Recommendations that
RESULTS OF THE TRAPPING SEASON
 Trapping Licenses RESULTS OF THE 2016-2017 TRAPPING SEASON The total number of trapping licenses sold dropped this year, which is likely in response to the overall slow fur market and low pelt prices.
Teton County Related Hunting and Fishing Spending, For the Wyoming Wildlife Federation. David T. Taylor & Thomas Foulke
 Teton County Related Hunting and Fishing Spending, 2015 For the Wyoming Wildlife Federation University of Wyoming, Department of Agricultural & Applied Economics David T. Taylor & Thomas Foulke 1 February
Summary of the 2012 Off-Reservation Treaty Waterfowl Season
 Summary of the 2012 Off-Reservation Treaty Waterfowl Season Peter David Wildlife Biologist Administrative Report 13-07 June 2013 Great Lakes Indian Fish & Wildlife Commission Biological Services Division
Fremont County Related Hunting and Fishing Spending, 2015
 Fremont County Related Hunting and Fishing Spending, 2015 For the Wyoming Wildlife Federation University of Wyoming, Department of Agricultural & Applied Economics David T. Taylor & Thomas Foulke September,
1999 On-Board Sacramento Regional Transit District Survey
 SACOG-00-009 1999 On-Board Sacramento Regional Transit District Survey June 2000 Sacramento Area Council of Governments 1999 On-Board Sacramento Regional Transit District Survey June 2000 Table of Contents
2010 BIG GAME AND FURBEARER HARVEST RECORD FOR THE FOND DU LAC RESERVATION AND CEDED TERRITORIES
 2010 BIG GAME AND FURBEARER HARVEST RECORD FOR THE FOND DU LAC RESERVATION AND CEDED TERRITORIES Mike Schrage Wildlife Biologist Fond du Lac Resource Management Division 1720 Big Lake Rd. Cloquet, MN 55720
Small Game Hunter Lead Shot Study. Appendices. A cooperative study conducted by:
 183 Small Game Hunter Lead Shot Study Appendices A cooperative study conducted by: Minnesota Cooperative Fish and Wildlife Research Unit Minnesota Department of atural Resources 184 Small Game Hunter Lead
2015 Deer Population Goal Setting
 Deer advisory team recommendations Block 4: East Central Uplands The following pages represent deer population goals recommended by the 2015 deer advisory team for Block 4: East Central Uplands (permit
Executive Summary. TUCSON TRANSIT ON BOARD ORIGIN AND DESTINATION SURVEY Conducted October City of Tucson Department of Transportation
 Executive Summary TUCSON TRANSIT ON BOARD ORIGIN AND DESTINATION SURVEY Conducted October 2004 Prepared for: City of Tucson Department of Transportation May 2005 TUCSON TRANSIT ON BOARD ORIGIN AND DESTINATION
Methodology for ISER Surveys of Alaska Halibut Fishermen
 Methodology for ISER Surveys of Alaska Halibut Fishermen by Gunnar Knapp Institute of Social and Economic Research University of Alaska Anchorage 3211 Providence Drive Anchorage, Alaska 99508 907-786-7710
Matching respondents over time and assessing non-response bias. Respondents sometimes left age or sex blank (n=52 from 2001 or 2004 and n=39 from
 Supporting Information Matching respondents over time and assessing non-response bias. Respondents sometimes left age or sex blank (n=52 from 2001 or 2004 and n=39 from 2009). When age or sex was blank
Deer Hunting Frequently Asked Questions 2017 Deer Hunting Rules September 22, 2017
 What to Know for 2017 Season Structure Licenses and tags Bonus antlerless tags Crossbow regulations Public and private lands tags Tagging deer Harvest Registration Transportation of deer Chronic wasting
2014 OKLAHOMA ANGLER SURVEY
 Oklahoma Department of Wildlife Conservation 2014 OKLAHOMA ANGLER SURVEY PREPARED BY: COREY A. JAGER RESPONSIVE MANAGEMENT SPECIALIST NOVEMBER 2015 KEY RESULTS: Overall, 83% of respondents fished in Oklahoma
Saskatchewan Resident Big Game Draw Overview
 Contents What is the big game draw?... 1 Who can apply for the big game draw?... 2 How do I apply for the big game draw?... 3 Big game draw application rules... 4 How can I check my pool status?... 5 Selecting
Minnesota Deer Population Goals
 This document is made available electronically by the Minnesota Legislative Reference Library as part of an ongoing digital archiving project. http://www.leg.state.mn.us/lrl/lrl.asp Minnesota Deer Population
IC Chapter 12. License Fees and Sales
 IC 14-22-12 Chapter 12. License Fees and Sales IC 14-22-12-1 Types of hunting, fishing, and trapping licenses; fees; donations Sec. 1. (a) The department may issue the following licenses individually or
The Impact of TennCare: A Survey of Recipients 2009
 The Impact of TennCare: A Survey of Recipients 2009 Christopher Carty Research Associate, Center for Business and Economic Research William F. Fox Director, Center for Business and Economic Research and
STATE OF MINNESOTA IN COURT OF APPEALS. Court File No. A Petitioners, Respondents.
 STATE OF MINNESOTA IN COURT OF APPEALS Court File No. A12-1680 Center for Biological Diversity, Howling for Wolves, Petitioners, vs. AFFIDAVIT OF JOHN D. ERB Minnesota Department of Natural Resources,
Minnesota Deer Population Goals
 Minnesota Deer Population Goals Superior Uplands Arrowhead Goal Block Minnesota DNR Section of Wildlife, 2015 Final Deer Population Goals Block 1: Superior Uplands Arrowhead The following pages provide
2007 BIG GAME AND FURBEARER HARVEST RECORD FOR THE FOND DU LAC RESERVATION AND CEDED TERRITORIES
 2007 BIG GAME AND FURBEARER HARVEST RECORD FOR THE FOND DU LAC RESERVATION AND CEDED TERRITORIES Mike Schrage Wildlife Biologist Fond du Lac Resource Management Division 1720 Big Lake Rd. Cloquet, MN 55720
Hunt ID: OK-WMDeerTurkeyQuailDuck-All-ETTARN-OW-EITHK Deer hunt for the Long Ranger, I didn t say Lone ranger, it is Long Ranger, as in shooting big w
 Hunt ID: OK-WMDeerTurkeyQuailDuck-All-ETTARN-OW-EITHK Deer hunt for the Long Ranger, I didn t say Lone ranger, it is Long Ranger, as in shooting big whitetail at yardages over 300 yards, This is open country
Susitna-Watana Hydroelectric Project Document ARLIS Uniform Cover Page
 Alaska Resources Library & Information Services Document ARLIS Uniform Cover Page Title: Wildlife harvest analysis study, Study plan Section 10.20 : Final study plan SuWa 200 Author(s) Personal: Author(s)
This page intentionally blank
 This page intentionally blank Status of Wildlife Populations, Fall 2015 (Including 2005-2015 Hunting and Trapping Harvest Statistics) edited by Margaret H. Dexter Minnesota Department of Natural Resources
Wisconsin Deer Hunting Pocket Guide
 Wisconsin Deer Hunting Pocket Guide Linda Freshwaters Arndt The very basics of deer hunting in Wisconsin For more detail, refer to the 2017 Deer Hunting Regulations or visit dnr.wi.gov, search keyword
Splitting seasons into multiple, shorter ones is preferable to long, crowded seasons.
 COMMENTS FROM TOWN HALL MEETINGS ON HARVEST MANAGEMENT GUIDELINES FOR NEVADA HUNTING SEASONS PUBLIC Reno 31 in attendance comments Avoid overlapping seasons with differing weapon types. For example, rifle
Women in Shooting Sports Survey Results
 Conducted by SLG2, Inc. Women in Shooting Sports Survey Results January 5, 2018 SLG2, Inc. DBA: Shoot Like A Girl P.O. Box 1211 Athens, AL 35612 p. 256.520.3759 Karen.Butler@shootlikeagirl.com www.shootlikeagirl.com
2012 Pickering Commission on Hunting Laws, Rules, and Publications - Recommendations Final Draft November 8, 2011 Prepared by George Smith
 2012 Pickering Commission on Hunting Laws, Rules, and Publications - Recommendations Final Draft November 8, 2011 Prepared by George Smith The Commission approached this task mindful of the original concept
Hunter use of public-access lands in the Rainwater Basin and beyond
 Hunter use of public-access lands in the Rainwater Basin and beyond Lindsey N. Messinger and Joseph J. Fontaine Nebraska Cooperative Fish and Wildlife Research Unit School of Natural Resources University
Endangered Species in the Big Woods of Arkansas Public Opinion Survey March 2008
 Endangered Species in the Big Woods of Arkansas Public Opinion Survey March 2008 by Survey Research Center Institute of Government University of Arkansas at Little Rock 2801 South University Avenue Little
The 2001 Economic Benefits of Hunting, Fishing and Wildlife Watching in MISSOURI. Prepared by:
 The 2001 Economic Benefits of Hunting, Fishing and Wildlife Watching in MISSOURI Prepared by: Southwick Associates, Inc. PO Box 6435 Fernandina Beach, FL 32035 Ph (904) 277-9765 Fax (904) 261-1145 Email:
Minnesota Deer Population Goals. Sand Plain Big Woods Goal Block
 Minnesota Deer Population Goals Sand Plain Big Woods Goal Block Minnesota DNR Section of Wildlife, 2015 Final Deer Population Goals Block 5: Sand Plain Big Woods The following pages provide a description
The Impact of TennCare: A Survey of Recipients 2006
 The Impact of TennCare: A Survey of Recipients 2006 Brad Kiser Research Associate, Center for Business and Economic Research William F. Fox Director, Center for Business and Economic Research and Professor
Monitoring Population Trends of White-tailed Deer in Minnesota Marrett Grund, Farmland Wildlife Populations and Research Group
 Monitoring Population Trends of White-tailed Deer in Minnesota - 2014 Marrett Grund, Farmland Wildlife Populations and Research Group INTRODUCTION White-tailed deer (Odocoileus virginianus) represent one