Nebraska Births Report: A look at births, fertility rates, and natural change
|
|
|
- Naomi Alexander
- 5 years ago
- Views:
Transcription

1 University of Nebraska Omaha Publications since 2000 Center for Public Affairs Research Nebraska Births Report: A look at births, fertility rates, and natural change David J. Drozd University of Nebraska at Omaha, ddrozd@unomaha.edu Jerry Deichert University of Nebraska at Omaha, jdeicher@unomaha.edu Follow this and additional works at: Part of the Public Affairs Commons Recommended Citation Drozd, David J. and Deichert, Jerry, "Nebraska Births Report: A look at births, fertility rates, and natural change" (2008). Publications since Paper This Report is brought to you for free and open access by the Center for Public Affairs Research at DigitalCommons@UNO. It has been accepted for inclusion in Publications since 2000 by an authorized administrator of DigitalCommons@UNO. For more information, please contact unodigitalcommons@unomaha.edu.
2 Nebraska Births Report A look at births, fertility rates, and natural change Historical State Components of Population Change State Births, Number of Women, and Fertility Rates: Totals, For Age Groups, and For Major Race and Ethnic Groups State Births and Fertility Rates for Married and Unmarried Women State Births and Induced Abortions with Associated Ratios and Rates County Births, Deaths, and Natural Change Prepared By: David Drozd, Jerry Deichert The Center for Public Affairs Research University of Nebraska at Omaha 6001 Dodge Street Omaha, NE July 2008 Questions or comments on this report should be directed to David Drozd at or ddrozd@unomaha.edu Note: Additional reports on population change and components of change such as migration, or containing historical data, can be viewed at
3 TABLE OF CONTENTS HIGHLIGHTS...4 PART I: STATE DATA Table 1: Nebraska Population and Components of Change: Figure 1: Nebraska Births, Deaths, and Natural Change: Figure 2: Nebraska Components of Population Change: 1930 to Table 2a: Births by Age of Mother for Nebraska Residents: 1960 and 1970 to Table 2b: Number of Women by Age in Nebraska: 1960 and 1970 to Table 2c: Birth Rates by Age and Total Fertility Rate: Nebraska 1960 and 1970 to Figure 3: 2007 Nebraska Population by Sex and Five-Year Age Group...14 Figure 4: Comparison of the Number of Births to the Number of Women Age 15-44: Nebraska Figure 5: Nebraska Fertility Rate: (Births per 1,000 Women Age 15-44)...15 Figure 6a: Nebraska Birth Rates by Age Group of Mother High Rate Age Groups: (Births per 1,000 Women in Age Category)...15 Figure 6b: Nebraska Birth Rates by Age Group of Mother Low Rate Age Groups: (Births per 1,000 Women in Age Category)...16 Figure 6c: Comparison of Nebraska Birth and Fertility Rates by Age Group of Mother: (Births per 1,000 Women in Age Category)...16 Figure 6d: Total Fertility Rate: Nebraska 1970 to 2006 (Total Births per 1,000 Women Over their Lifetime)...17 Figure 7: 2007 Nebraska Population by Sex and Five-Year Age Group: White Alone, not Hispanic/Latino (Majority Population)...18 Figure 8: 2007 Nebraska Population by Sex and Five-Year Age Group: Non-White or Hispanic/Latino (Minority Population)...18 Figure 9: 2007 Nebraska Population by Five-Year Age Group: Non-White or Hispanic/Latino (Minority Population) as a Percent of State Total...19 Table 3: Total Births and Known White non-hispanic, Black non-hispanic and Hispanic Births and Estimated Fertility Rates in Nebraska: 1989 to Table 4: Nebraska Births to Unmarried Women: 1960 to Figure 10: Percentage of Births to Unmarried Mothers: Nebraska 1960 to Table 5: Births and Fertility Rates for Unmarried and Married Nebraska Women: 1960 to Table 6: Birth and Induced Abortion Statistics: Nebraska 1974 to
4 Figure 11: Number of Induced Abortions and Ratio of Abortions to Live Births: Nebraska 1974 to Figure 12: Year to Year Percent Change in the Number of Nebraska Induced Abortions: 1975 to Figure 13: Percent of Nebraska Induced Abortions by Woman s Age Category: 1974 to Figure 14: Ratio of Induced Abortions to Live Births by Woman s Age Category: Nebraska 1974 to Figure 15: Abortion Rate: Nebraska Induced Abortions per 1,000 Nebraska Women Ages 15-44: 1974 to Figure 16: Abortion Rate by Age: Nebraska Induced Abortions per 1,000 Nebraska Women in Age Group: 1974 to PART 2: COUNTY DATA Description...27 Map 1: Nebraska Counties Classified by Modified Urban Influence Code...28 Table 7: Listing of Nebraska Counties Classified by Modified Urban Influence Code...29 Table 8: Number of Births for Nebraska and Its Counties: Table 9: Number of Deaths in Nebraska and Its Counties: Table 10: Natural Change in Nebraska and Its Counties: Map 2: Natural Change (Births vs. Deaths) in Nebraska Counties: 1980s compared to Table 11: County Rankings for Fertility, Teen Births, and Unmarried Births: 2002 to Map 3: County Fertility Rates (Births per 1,000 Women Age 15-44): 2002 to 2006 (Based on Average Yearly Births and Average Female Population Age from 2002 to 2006)...51 Map 4: County Teen Birth Rates (Teen Births per 1,000 Women Age 15-19): 2002 to 2006 (Based on Average Yearly Teen Births and Average Female Population Age from 2002 to 2006)...52 Map 5: Percentage of Births to Unmarried Mothers by Place of Residence: 2002 to
5 HIGHLIGHTS This report shows annual birth and death figures for Nebraska and its counties. Demographic patterns and trends, including components of population change, are illustrated. Births to Nebraska residents have outnumbered deaths for decades, a leading factor in Nebraska s population growth. In Nebraska, this natural change tends to dwarf the other primary component of population change, net migration, so details and factors relating to births and fertility rates are important areas to study. As such, this report focuses on showing changes in the number of births and other birth trends since they have such a profound effect on Nebraska s population and impact important policy decisions such as building or consolidating schools. Looking at historic and current statistics, the future population structure and associated needs can be viewed with more clarity. Noteworthy aspects of the tables and figures in this report follow below: Note the following population change equations for reference: Population change = natural change + net migration Natural change = births deaths (if positive, called natural increase; if negative, natural decrease) Net migration = inmigrants outmigrants (if positive, called net inmigration; if negative, net outmigration) 1) Nebraska continues to gain population through natural increase the annual number of births being larger than the annual number of deaths. Nebraska has experienced a natural increase every year since 1930, the first year for which we have records. Net migration varies, with some years having net inmigration, while net outmigration has occurred in most years. The level of net migration typically is lower than that of natural change (Figure 2); in fact, only twice since people returned home after World War II (1946) has net migration exceeded natural change (1995, 1996). 2) Births to Nebraska residents peaked in 1961 as part of the baby boom ( ), with 34,544 births being recorded that year (Table 1). [Incidentally, other CPAR reports show that 1961 was the last time the annual population growth rate for Nebraska exceeded that of the entire United States.] The number of births then declined to a low of 22,771 in 1973 before rising in the late 1970s to mid-1980s as the baby boom echo occurred as most baby boomers were in their 20s and having their own children. Births proceeded to form another trough in the mid-1990s before increasing in the 2000s (Figure 1). This increase is in part a function of continued age shifts, as now the children of the baby boom echo are in their 20s and having their own kids. This new group is referred to as either the third wave or baby boom echo s echo. 3) Annual deaths to Nebraska residents have been remarkably steady at about 15,000 per year since the mid-1960s (Figure 1). 4) In 2006, the number of births and amount of natural increase are at their highest levels in the last 25 years (since 1982). This led to Nebraska s largest estimated annual population 4
6 increase during 2006 to 2007 in the last ten years, in both the total number of persons and in percentage change 1. 5) While the number of Nebraska women age peaked in 1997 and has fallen since, the number of births to Nebraska women bottomed at about the same time and has been rising since (Figure 4). Thus, the state fertility rate (births per 1,000 women age 15-44) hit a low of 63.4 in 1996 and 1997 and has risen to 75.4 in 2006, the highest rate since 1981 (Table 2c, Figure 5). The fertility rate accounts for changes in the number of women of reproductive age, so the number of births and associated rates are truly increasing, meaning the increase in the number of births is not simply due to an increase in the number of women of reproductive age. As previously mentioned, the number of women age has declined in recent years, as more baby-boomers have moved beyond age 44, and there have not been as many young women to replace them. 6) The 2006 Nebraska total fertility rate (TFR) stands at 2,251.6 births per 1,000 women age 15-44, the highest since being 2,311.2 in 1971, mimicking what also occurred nationally 2. The TFR summarizes the potential effect of current fertility patterns on completed family size by estimating the average number of births that a hypothetical group of 1,000 women would have during their lifetimes based on the age-specific birth rates observed in a given year. 3 A TFR of 2,100 or 2.1 births per woman is considered the replacement level, where a population has enough births to replace itself. Nebraska has been above 2,100 since 2001, after being below that level since 1972 (Table 2c, Figure 6d). The 2006 TFR for the U.S. stood just above replacement at 2,101.0, the first time since 1971 that it was above the replacement level 4. 7) By mother s age, birth rates have declined sharply among teens since 1970 and declined somewhat among year olds (Figures 6b and 6a). Conversely, rates have increased somewhat among year olds and increased greatly for those and Rates for those are now higher than among year olds, as well as rates for year olds now being higher than rates for those Table 2c and Figure 6c show that the current rate among year olds (114.0) is nearly as high as during the baby boom in 1960 (119.3); total births to year olds in 2006 (6,058) are more than the 5,164 that occurred in 1960 (Table 2a). 8) The 2006 number of births among and year olds is roughly half of what occurred in 1960 (Table 2a). Birth rates among these age groups have declined during each 10-year time frame since 1960 as well as during 2000 to 2006 (Figure 6c). 9) By mother s race and ethnicity, fertility rates are rising for all three major race and ethnic groups: White non-hispanic, Black non-hispanic, and Hispanic. Fertility rates for White non-hispanic and Black non-hispanic bottomed in 1997 and 1998 respectively and have been steadily rising since, while rates for Hispanics generally have been rising since 1989, the first year comparable data were available (Table 3). 1 Source: Population Estimates Program, U.S. Census Bureau, released These annual population figures will be documented in CPAR s 2007 Nebraska Population Report at 2 Source: Births: Preliminary Data for 2006, National Vital Statistics Reports, CDC, dated (Page 2) 3 Ibid 4 Ibid 5
7 10) The 2006 fertility rate for Hispanics (145.2 births per 1,000 women age 15-44) is twice as high as that of White non-hispanics (67.3). This does not mean that Hispanic women or families have twice as many children as non-hispanic Whites, but shows how many births there are given the number of women of child-bearing age. The rate for Black non- Hispanics is 101.9, about 1.5 times higher than among White non-hispanics (Table 3). However, White non-hispanics continue to have most of the state s births, with about three in every four births in 2006 having a White non-hispanic mother (74.2 percent). Births to Hispanic mothers accounted for 15.0 percent of all births, and the figure was 6.4 percent for Black non-hispanics. 11) Sex and age pyramids show the White non-hispanic (majority) population to be relatively older than the non-white or Hispanic (minority) population. The minority population has a higher percentage in the age category, or of reproductive age, especially in the peak reproductive age categories of and years. Given this and the higher fertility rates among minority groups, the percentage of all births to minorities is expected to continue rising. Figures show that in 2000, 22.0 percent of all children under age 5 were minorities 5, whereas that figure stands at 25.8 percent in 2007 (Figure 9). 12) A look at the total Nebraska sex and age structure (Figure 3) shows that the leading edge of the baby boom echo has now entered its prime reproductive years (age 25-29), explaining in part the rising number of births in recent years. Figure 3 also shows the largest portion of the baby boom echo is now age 20 to 24. Assuming these women in their early 20s remain in Nebraska, in the next several years they will age into the age category, which has a higher birth rate. Meanwhile, the youngest baby boomers will age beyond 44 years, so the total female population age likely will decline slightly while births likely will increase. Thus, all else being equal, we expect Nebraska births and fertility rates to continue increasing for the next several years. 13) Nebraska births to unmarried women have risen dramatically, from about 3 percent of all births in 1960 to about 32 percent in 2006 (Table 4). The percentage has risen in nearly all years since 1960 (Figure 10). 14) While fertility rates among married women have declined in every ten-year period from 1960 before rising from 2000 to 2006, the rate among unmarried women has risen steadily. In 1960, the fertility rate for married women was more than 13 times higher than the rate among unmarried women. Today the rates are much closer together, with fertility rates for married women being roughly twice that of unmarried women (Table 5). 15) Statistics indicate that one factor in increasing Nebraska resident births is a reduction in the number of induced abortions by Nebraska residents. The number of induced abortions performed in Nebraska, about 90 percent of which are for Nebraska residents 6, peaked at 6,346 in 1990 and has steadily declined since, with 13 of the past 16 years having an annual decline. The 2006 figure of 2,927 induced abortions was the lowest number that occurred in the state since recordkeeping began in 1974 (Table 6). 5 Source: 2004 Nebraska Population Report, UNO Center for Public Affairs Research (Page 25) 6 Source: Nebraska 2006 Statistical Report of Abortions, Nebraska Health and Human Services System, dated January
8 16) The 2006 number of induced abortions, abortion ratio per 1,000 live births, and abortion rate per 1,000 Nebraska women age are each at approximately half the peak level that occurred around 1990 (Table 6). 17) By age, abortion rates and ratios to live births among women age have declined dramatically. While teens accounted for more than 40 percent of all abortions in the 1970s, they comprise only about 15 percent currently (Figure 13). A larger percentage of Nebraska abortions now occur among women age 30 and older. 18) While Nebraska is currently experiencing a larger natural increase than in the recent past, fewer of its counties are. Table 10 shows that in the 1980s, 76 of Nebraska s 93 counties experienced natural increase (82 percent). From 2000 to 2006, only about half had natural increase (48 of 93, 52 percent). Most of the counties experiencing this shift from natural gain to natural loss are located in the north central or southern parts of the state (Map 2). Given that most Nebraska counties have been experiencing net outmigration (more people moving out than moving in) 7, those counties also having natural loss are destined to have declining total population numbers, at least in the short term or until a change in trend occurs. 19) County fertility and teen birth rates as well as unmarried births tend to be higher in counties that have a relatively large minority population (e.g. Thurston, Colfax, Hall, Dawson, Dakota, and Madison Counties Table 11, Maps 3, 4, and 5). 7 Source: 2006 Nebraska Population Report, Center for Public Affairs Research, UNO (Pages 37-41) 7
9 Table 1: Nebraska Population and Components of Change: Sources: Regional Economic Information System, Bureau of Economic Analysis Nebraska Vital Statistics Reports, Nebraska Health and Human Services Annual Estimates of the Population, U.S. Census Bureau, Released Estimated July 1 Jan - Dec Jan - Dec Natural Actual Net Year Population Births Deaths Increase Change Migration* Number of Persons ,380,000 27,006 13,280 13,726 5,000-8, ,384,000 26,610 12,905 13,705 4,000-9, ,386,000 25,160 12,923 12,237 2,000-10, ,385,000 24,187 12,925 11,262-1,000-12, ,382,000 25,087 13,372 11,715-3,000-14, ,375,000 23,326 13,179 10,147-7,000-17, ,358,000 23,799 13,756 10,043-17,000-27, ,339,000 22,256 13,200 9,056-19,000-28, ,326,000 22,402 11,960 10,442-13,000-22, ,318,000 22,326 12,188 10,138-8,000-18, ,316,000 22,153 12,593 9,560-2,000-11, ,272,000 22,186 12,203 9,983-44,000-53, ,245,000 23,950 12,293 11,657-27,000-37, ,235,000 25,091 12,956 12,135-10,000-21, ,214,000 24,694 12,560 12,134-21,000-33, ,210,000 24,292 12,446 11,846-4,000-15, ,256,000 27,753 12,365 15,388 46,000 32, ,266,000 32,018 12,823 19,195 10,000-7, ,265,000 31,066 12,569 18,497-1,000-19, ,302,000 31,482 12,607 18,875 37,000 18, ,327,000 31,713 12,548 19,165 25,000 5, ,316,000 33,595 12,880 20,715-11,000-30, ,311,000 33,809 13,056 20,753-5,000-25, ,318,000 32,633 13,298 19,335 7,000-13, ,340,000 33,617 12,741 20,876 22,000 1, ,374,000 34,087 13,001 21,086 34,000 13, ,397,000 33,855 13,161 20,694 23,000 2, ,394,000 33,161 13,797 19,364-3,000-23, ,383,000 32,935 13,680 19,255-11,000-30, ,397,000 34,162 13,887 20,275 14,000-5, ,417,000 34,257 14,071 20,186 20, ,446,000 34,544 13,812 20,732 29,000 8, ,464,000 33,886 14,305 19,581 18,000-2, ,476,000 32,624 14,657 17,967 12,000-6, ,482,000 30,727 14,758 15,969 6,000-10, ,471,000 27,829 14,799 13,030-11,000-25, ,456,000 25,618 14,799 10,819-15,000-26, ,457,000 24,259 14,465 9,794 1,000-9, ,467,000 24,236 15,017 9,219 10, ,474,000 24,801 14,898 9,903 7,000-2,561 8
10 Estimated July 1 Jan - Dec Jan - Dec Natural Actual Net Year Population Births Deaths Increase Change Migration* Number of Persons ,487,963 25,877 15,016 10,861 13,963 3, ,504,208 25,507 15,182 10,325 16,245 5, ,518,293 23,473 15,540 7,933 14,085 4, ,528,517 22,771 14,977 7,794 10,224 2, ,537,809 23,695 15,016 8,679 9,292 1, ,541,440 23,658 14,569 9,089 3,631-5, ,548,901 23,767 14,536 9,231 7,461-1, ,554,466 25,158 14,316 10,842 5,565-4, ,560,826 25,103 14,408 10,695 6,360-4, ,564,356 26,199 14,228 11,971 3,530-7, ,572,296 27,335 14,465 12,870 7,940-4, ,578,517 27,164 14,580 12,584 6,221-6, ,581,776 26,954 14,567 12,387 3,259-9, ,584,293 26,254 14,695 11,559 2,517-9, ,588,638 26,099 14,633 11,466 4,345-7, ,584,661 25,540 14,895 10,645-3,977-15, ,574,328 24,425 14,662 9,763-10,333-20, ,566,544 23,813 14,820 8,993-7,784-17, ,571,477 23,904 14,858 9,046 4,933-4, ,574,858 24,205 14,776 9,429 3,381-5, ,581,660 24,362 14,751 9,611 6,802-2, ,595,919 23,947 14,647 9,300 14,259 4, ,611,687 23,336 14,577 8,759 15,768 6, ,625,590 23,196 14,967 8,229 13,903 5, ,639,041 23,131 14,974 8,157 13,451 5, ,656,992 23,221 15,216 8,005 17,951 9, ,673,740 23,271 15,435 7,836 16,748 8, ,686,418 23,313 15,271 8,042 12,678 4, ,695,816 23,533 15,181 8,352 9,398 1, ,704,764 23,900 15,580 8,320 8, ,713,322 24,643 14,979 9,664 8, ,718,280 24,818 15,171 9,647 4,958-4, ,725,545 25,381 15,721 9,660 7,265-2, ,734,746 25,900 15,439 10,461 9, ,743,954 26,324 14,647 11,677 9,208-1, ,754,042 26,142 14,950 11,192 10,088-1, ,763,765 26,722 14,894 11,828 9,723-1,787 * The net migration figures are adjusted to account for calendar year births and deaths versus a July 1 population figure. The net migration value is equal to the actual population change minus the average natural change in the current and prior year. Note: REIS provides population data from 1930 to 1999 and the Census Bureau's Population Estimates Program is the source for 2000 to All birth and death data come from Nebraska Vital Statistics Reports. 9
11 Number Figure 1: Nebraska Births, Deaths, and Natural Change: ,000 35,000 30,000 25,000 20,000 15,000 10,000 5, Source: Vital Statistics, Nebraska Health and Human Services System Births Deaths Natural Change Number Figure 2: Nebraska Components of Population Change: 1930 to ,000 30,000 20,000 10, , ,000-30,000-40,000-50,000-60, Source: Vital Statistics, Nebraska Health and Human Services System; Annual Estimates, U.S. Census Bureau - released Net Migration Natural Change 10
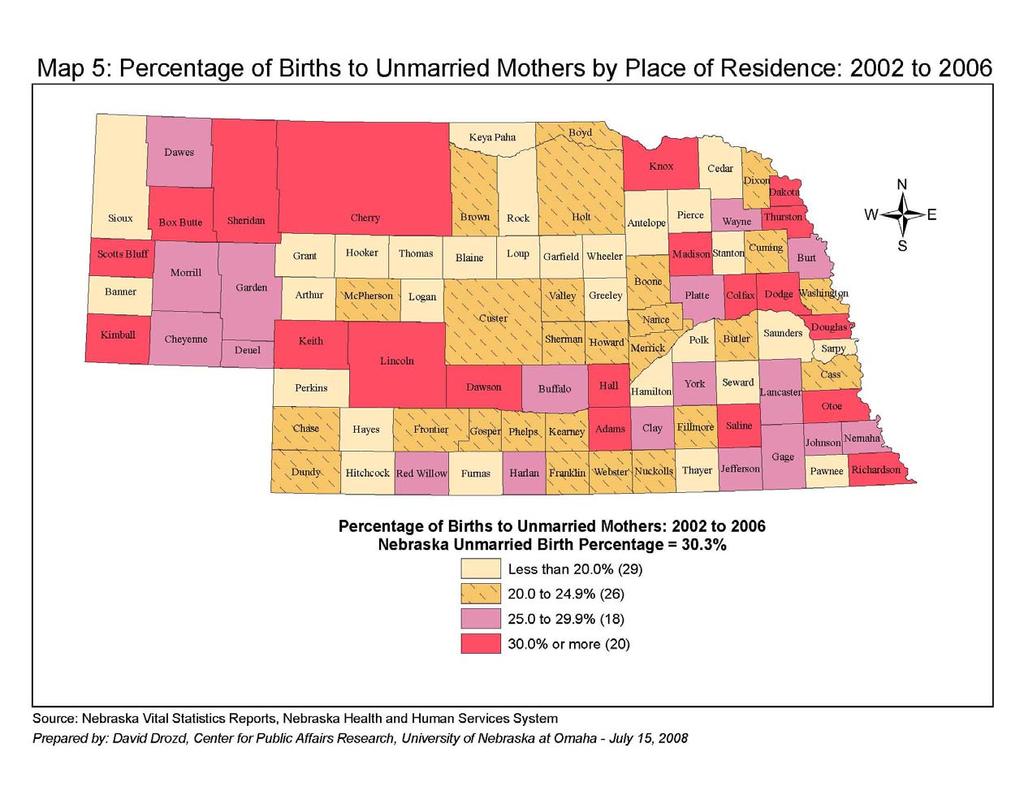
12 Table 2a: Births by Age of Mother for Nebraska Residents: 1960 and 1970 to 2006 Sources: Nebraska Health and Human Services, Special Tabulation 1960 birth data comes from table 2-14 from Age of Mother Under 45 or Not Total Age Year Older known Births ,090 12,296 9,172 5,164 2, ,262 34, ,837 10,307 7,118 2,984 1, ,876 25, ,789 10,310 7,014 2,820 1, ,507 25, ,754 9,138 6,675 2, ,473 23, ,597 8,592 6,816 2, ,758 22, ,539 9,071 7,368 2, ,695 23, ,388 8,875 7,696 2, ,658 23, ,225 8,813 8,060 2, ,767 23, ,246 9,031 8,659 3, ,158 25, ,083 8,818 8,746 3, ,103 25, ,011 9,144 9,231 3, ,199 26, ,280 9,501 9,395 4, ,335 27, ,028 9,369 9,372 4, ,163 27, ,781 9,089 9,363 4,442 1, ,920 26, ,606 8,748 8,933 4,632 1, ,253 26, ,504 8,251 9,084 4,823 1, ,099 26, ,296 7,802 9,157 4,777 1, ,536 25, ,135 7,172 8,817 4,799 1, ,429 24, ,086 6,683 8,545 4,891 1, ,813 23, ,175 6,331 8,629 5,043 1, ,904 23, ,229 6,260 8,639 5,262 1, ,206 24, ,337 6,173 8,370 5,453 1, ,362 24, ,319 6,000 8,161 5,375 1, ,947 23, ,272 6,001 7,447 5,360 1, ,336 23, ,291 5,798 7,111 5,689 1, ,196 23, ,500 5,740 6,906 5,563 2, ,131 23, ,286 5,817 6,997 5,577 2, ,221 23, ,432 5,533 7,166 5,428 2, ,271 23, ,397 5,579 7,333 5,220 2, ,313 23, ,452 5,679 7,225 5,326 2, ,533 23, ,470 5,896 7,264 5,413 2, ,900 23, ,477 6,089 7,448 5,692 2, ,643 24, ,394 6,361 7,430 5,666 2, ,818 24, ,394 6,626 7,601 5,786 2, ,381 25, ,305 6,713 7,971 5,976 2, ,900 25, ,266 6,712 8,173 6,095 2, ,324 26, ,144 6,714 8,220 5,972 2, ,142 26, ,111 6,820 8,566 6,058 2, ,722 26,659 11
13 Table 2b: Number of Women by Age in Nebraska: 1960 and 1970 to 2006 Sources: 1960 to 2000 Decennial Censuses, U.S. Census Bureau 1970s Population Estimates s Population Estimates - Revised 1990s Population Estimates s - Annual Population Estimates, U.S. Census Bureau (released ) Age of Women Year Total ,153 42,461 41,513 43,290 43,751 41, , ,798 59,520 44,751 39,348 39,550 40, , ,179 64,320 46,768 40,441 38,908 40, , ,297 64,924 51,354 41,789 38,680 39, , ,086 66,678 53,494 44,164 38,692 39, , ,554 68,785 56,348 45,823 39,012 38, , ,422 70,800 58,961 47,079 39,165 37, , ,978 71,758 62,677 47,934 39,650 37, , ,530 72,771 62,657 51,843 40,458 37, , ,817 73,576 64,249 53,422 42,391 37, , ,756 73,831 65,948 55,444 43,494 37, , ,812 74,037 67,428 57,009 44,195 37, , ,620 74,703 68,752 61,274 45,091 38, , ,140 74,056 69,392 61,462 48,536 39, , ,978 72,964 69,791 62,532 50,281 41, , ,633 71,570 69,999 63,642 52,776 42, , ,181 68,441 69,696 64,411 55,095 43, , ,747 64,142 68,961 64,506 58,116 43, , ,025 60,310 67,593 64,820 58,233 46, , ,587 57,481 66,386 65,443 59,683 48, , ,845 55,087 64,426 65,541 60,906 50, , ,330 54,172 62,516 65,873 62,140 52, , ,957 54,939 59,575 66,293 63,662 56, , ,545 55,599 57,358 66,437 65,050 58, , ,862 55,898 55,099 66,045 66,007 59, , ,500 55,888 53,475 65,128 66,702 61, , ,414 56,123 53,494 63,555 67,805 63, , ,502 55,835 54,422 61,493 68,414 64, , ,152 56,232 54,751 58,945 68,121 65, , ,416 56,959 54,870 56,451 67,343 65, , ,688 57,956 54,666 54,701 66,174 66, , ,674 59,030 54,676 54,551 64,688 66, , ,445 60,750 53,360 54,635 61,503 67, , ,683 62,632 52,841 54,894 58,929 67, , ,200 64,587 53,043 54,819 56,488 66, , ,381 65,201 53,804 54,178 55,108 65, , ,382 66,463 54,322 53,752 54,425 63, , ,069 66,466 56,028 53,138 54,741 60, ,333 12
14 Table 2c: Birth Rates by Age and Total Fertility Rate: Nebraska 1960 and 1970 to 2006 Sources: Same as Tables 2a and 2b Rates are per 1,000 women in age category; Total Fertility shows lifetime birth expectations. Births per 1,000 women in age group Age Total Year Overall Fertility* , , , , , , , , , , , , , , , , , , , , , , , , , , , , , , , , , , , , , ,251.6 * Total fertility is a measure of how many children a hypothetical group of 1,000 women would have over their lifetime given current birth rates. The formula takes the sum of each 5-year age group's birth rate multipled by 5 and divides it by the total number of women age
15 Age Group 85+ Figure 3: 2007 Nebraska Population by Sex and Five-Year Age Group 80 to to to to to to to to to to to to to to to 14 5 to 9 Under 5 Male Female Source: Annual Estimates Program, U.S. Census Bureau, released Percent of Total Population Green lines depict the depression cohort; red checker shows the "baby boom"; pink represents the "baby boom echo". Number of Births 30,000 Figure 4: Comparison of the Number of Births to the Number of Women Age 15-44: Nebraska Number of Women 370,000 Number of Women 28, ,000 26, ,000 24,000 Number of Births 310,000 22, Sources: Nebraska Health and Human Services, Decennial Censuses and Annual Estimates Program (released ), U.S. Census Bureau Year Number of Births Number of Women Age ,000 14
16 Figure 5: Nebraska Fertility Rate: (Births per 1,000 Women Age 15-44) Fertility Rate Sources: Nebraska Health and Human Services, Decennial Censuses and Annual Estimates Program (released ), U.S. Census Bureau Year Figure 6a: Nebraska Birth Rates by Age Group of Mother - High Rate Age Groups: (Births per 1,000 Women in Age Category) Birth Rate Sources: NE Health and Human Services Special Tabulation; Decennial Censuses and Estimates Program (Rel ), U.S. Census Bureau Year
17 Figure 6b: Nebraska Birth Rates by Age Group of Mother - Low Rate Age Groups: (Births per 1,000 Women in Age Category) Birth Rate Sources: NE Health and Human Services Special Tabulation; Decennial Censuses and Estimates Program (Rel ), U.S. Census Bureau Year Figure 6c: Comparison of Nebraska Birth and Fertility Rates by Age Group of Mother: (Births per 1,000 Women in Age Category) Rate Total Age Group (years) Sources: 1960 CDC Natality Report; NE Health and Human Services Special Tabulation; Decennial Censuses and Estimates Program (Rel ), U.S. Census Bureau
18 Figure 6d: Total Fertility Rate: Nebraska 1970 to 2006 (Total Births per 1,000 Women Over their Lifetime) 2, ,300.0 Replacement is considered 2,100 Total Fertility Rate 2, , , , Sources: NE Health and Human Services Special Tabulation; Decennial Censuses and Estimates Program (Rel ), U.S. Census Bureau Year 17
19 Age Group Figure 7: 2007 Nebraska Population by Sex and Five-Year Age Group: White Alone, not Hispanic/Latino (Majority Population) to to to to to to to to to to to to to to to 14 5 to 9 Under 5 Male Female Percent of Total Population Source: Population Estimates Program, U.S. Census Bureau, released Age Group Figure 8: 2007 Nebraska Population by Sex and Five-Year Age Group: Non-White or Hispanic/Latino (Minority Population) to to to to to to to to to to to to to to to 14 5 to 9 Under 5 Male Female Percent of Total Population Source: Population Estimates Program, U.S. Census Bureau, released
20 Age Group Figure 9: 2007 Nebraska Population by Five-Year Age Group: Non-White or Hispanic/Latino (Minority Population) as a Percent of State Total to to to to to to to to to to to to to to to 14 5 to 9 Under 5 Total Percent of Total Population Source: Population Estimates Program, U.S. Census Bureau, released
21 Table 3: Total Births and Known White non-hispanic, Black non-hispanic and Hispanic Births and Estimated Fertility Rates in Nebraska: 1989 to 2006 Year Total White, NH Births Black, NH Change in Births From Prior Year Total White, NH Black, NH Annual Percent Change Female Population Ages Total White, NH Births ,206 20,626 1, , ,745 13,900 8, ,362 20,711 1, , ,183 14,112 8, ,947 20,170 1, , ,216 14,385 9, ,336 19,423 1,304 1, , ,767 14,423 9, ,196 19,034 1,251 1, , ,915 14,489 10, ,131 18,728 1,266 1, , ,329 14,812 12, ,221 18,705 1,206 1, , ,373 15,201 13, ,271 18,491 1,189 1, , ,516 15,686 14, ,313 18,223 1,229 1, , ,728 16,226 16, ,533 18,182 1,224 2, , ,952 16,513 17, ,900 18,285 1,249 2, , ,276 16,624 19, ,643 18,697 1,346 2, , ,558 16,216 21, ,818 18,556 1,355 2, , ,266 16,441 22, ,381 18,606 1,407 3, , ,892 16,489 24, ,900 18,892 1,440 3, , ,879 16,625 25, ,324 19,144 1,533 3, , ,490 16,727 25, Birth Report Form Changes 2005* 26,142 19,692 1,515 3, , ,799 16,681 26, * 26,722 19,840 1,712 3, , ,912 16,807 27, Sources: Nebraska Health and Human Services System, Special Tabulation of Births by Race and Origin; Historical Estimates by Age, Sex, Race, and Hispanic Origin: Intercensal State and County Characteristics Population Estimates Files, and 2000 Censuses of Population and Housing (1990 CP-1-29 General Population Characteristics - Tables 19 and 28; 2000 via American FactFinder) Post 2000 Estimates by Age, Sex, Race and Hispanic Origin: - Released ; Note: The number of total births will not match the sum of births of the three racial groups listed due to births from other unlisted race groups as well as unknown data or nonresponse on the forms used to collect the data by the Health and Human Services System. Black, NH Total White, NH Black, NH Total Fertility Rate per 1,000 Females Age White, NH Black, NH Hispanic Hispanic Hispanic Hispanic Hispanic * The reporting form and subsequent recoding procedures used by the Nebraska Health and Human Services System changed in 2005 so the time series may not be directly comparable before and after this change. Prior to the change more births were classified as 'other' or unknown for race, so the new system has more accuracy. 20
22 Table 4: Nebraska Births to Unmarried Women: 1960 to 2006 Source: Annual Nebraska Vital Statistics Reports, Nebraska Health and Human Services System Year Total Births Unmarried Percent Unmarried , , ,886 1, ,624 1, ,727 1, ,829 1, ,618 1, ,259 1, ,236 1, ,801 1, ,877 2, ,507 2, ,473 2, ,771 1, ,695 1, ,658 2, ,767 2, ,158 2, ,103 2, ,199 2, ,335 3, ,164 3, ,954 3, ,254 3, ,099 3, ,540 3, ,425 3, ,813 3, ,904 4, ,205 4, ,362 5, ,947 5, ,336 5, ,196 5, ,131 5, ,221 5, ,271 5, ,313 6, ,533 6, ,900 6, ,643 6, ,818 6, ,381 7, ,900 7, ,324 7, ,142 8, ,722 8,
23 Figure 10: Percentage of Births to Unmarried Mothers: Nebraska 1960 to Percent Source: Annual Nebraska Vital Statistics Reports, Nebraska Health and Human Services System Year Table 5: Births and Fertility Rates for Unmarried and Married Nebraska Women: 1960 to 2006 Births to Age Rate Percentage Births to Age Rate Percentage Unmarried Unmarried per Change per Married Married per Change per Year Mothers Women 1,000 year Mothers Women 1,000 year , n/a 33, , n/a , , , , , , , , , , , , , , , , , , , , Sources: Annual Vital Statistics Reports, Nebraska Health and Human Services; Decennial Censuses and American Community Survey (ACS), U.S. Census Bureau: 1960: Table 105, Census of Population: 1960 Nebraska Volume 1 Part : Table 152, Characteristics of the Population, Nebraska Volume 1 Part : Table 205, Detailed Population Characteristics, Nebraska Book PC80-1-D : Table 37, General Population Characteristics, Nebraska Book 1990 CP : American FactFinder table PCT7, SF 3, Census : American FactFinder table C12002, 2006 ACS 22
24 Table 6: Birth and Induced Abortion Statistics: Nebraska 1974 to 2006 Sources: and Prior Statistical Report of Abortions and Annual Vital Statistics Reports, Nebraska Health and Human Services Decennial Censuses, Annual Population Estimates (released ), U.S. Census Bureau * Induced abortions per 1,000 live births. Annual Total Annual Percent of Abortions Abortion Ratio* Abortion Rate / 1,000 women Total Annual Percent Induced Annual Percent Age 19 Age 20 Age 30 All Age 15 Age 20 Age 30 Age 15 Age 15 Age 20 Age 30 Year Births Change Change Abortions Change Change & Under to 29 & Over Ages to 19 to 29 & Over to 44 to 19 to 29 to ,695 n/a n/a 3,094 n/a n/a , , , , ,158 1, , , , ,199 1, , ,335 1, ,060 1, , , , , , , , , , , ,425-1, , , , , , , , , , , , , , , , , , , , , , , , , , , , , , , , , , , , , , , , , ,
25 Number 6,500 Figure 11: Number of Induced Abortions and Ratio of Abortions to Live Births: Nebraska 1974 to 2006 Ratio* 275 5, , , , , Source: Nebraska Statistical Report of Abortions, Nebraska Health and Human Services System Year Number of Abortions Ratio* 100 * Ratio equals abortions per 1,000 live births Figure 12: Year to Year Percent Change in the Number of Nebraska Induced Abortions: 1975 to Percent Change Source: Nebraska Statistical Report of Abortions, Nebraska Health and Human Services System Year 24
26 Percent Figure 13: Percent of Nebraska Induced Abortions by Woman's Age Category: 1974 to Source: Nebraska Statistical Report of Abortions, Nebraska Health and Human Services System Year Age 19 & Under Age 30 & Over Teen Ratio* Figure 14: Ratio of Induced Abortions to Live Births by Woman's Age Category: Nebraska 1974 to 2006 Age 20+ Ratios* Age Age Age 30 and over Source: Nebraska Statistical Report of Abortions, Nebraska Health and Human Services System Year Age Age Age 30 & Over 0.0 * Ratio equals abortions per 1,000 live births 25
27 Rate Figure 15: Abortion Rate: Nebraska Induced Abortions per 1,000 Nebraska Women Ages 15-44: 1974 to Sources: Nebraska Statistical Report of Abortions, Nebraska Health and Human Services System; U.S. Census Bureau, Population Estimates Program (Released ) Year Rate Figure 16: Abortion Rate by Age: Nebraska Induced Abortions per 1,000 Nebraska Women in Age Group: 1974 to Sources: Nebraska Statistical Report of Abortions, Nebraska Health and Human Services System; U.S. Census Bureau, Population Estimates Program (Released ) Year Age 19 & Under Age 20 to 29 Age 30 & Over 26
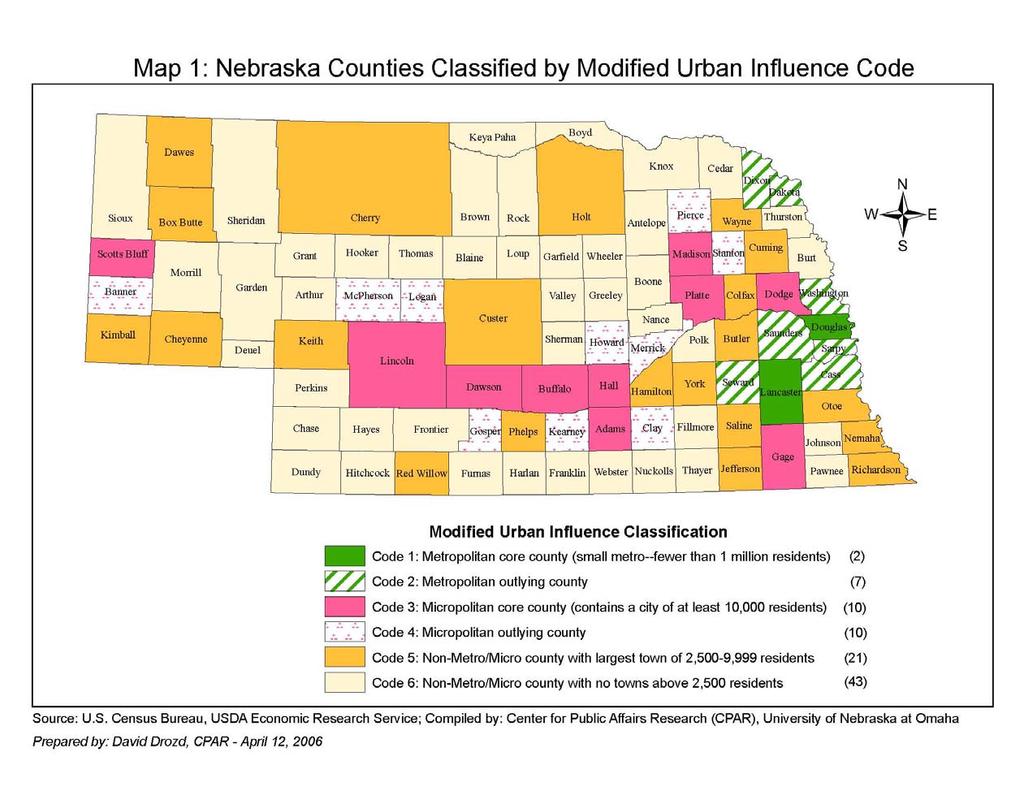
28 PART 2: COUNTY DATA The U.S. Census Bureau releases annual estimates of each county s population as of the year s midpoint, July 1. These figures typically are released in April of the following year. Estimates of major components of population change such as birth, deaths, and net migration also are released in April. The most current estimates always supersede prior estimates in this program and thus, the annual Nebraska population report summarizes and tracks these yearly figures (see The Census Bureau also releases county population estimates as of July 1 by sex, age, race, and ethnicity in August of the following year. Since intercensal population estimates and demographic characteristics are only approximations, this report provides only summary information for five-year age groups, which are the basis for calculating some of the rates found in this report. In order to show demographic trends by county type, we modified a classification system for defining counties by their size and proximity to metropolitan areas. The system merged measurement concepts used by the Census Bureau, in particular its newly employed micropolitan counties, and the Urban Influence Codes used by the USDA Economic Research Service. The classification scheme is based on county characteristics. The Modified Urban Influence Codes used in this report include six classification categories, with code 1 representing the most urban counties and code 6 corresponding to the more rural counties: Code 1: Metropolitan core county (contains a city with more than 50,000 residents); Code 2: Metropolitan outlying county; Code 3: Micropolitan core county (contains a city with more than 10,000 residents); Code 4: Micropolitan outlying county; Code 5: County with the largest town having between 2,500 and 9,999 residents; and Code 6: County with the largest town having fewer than 2,500 residents. See Map 1 for the geographical distribution of the six codes and the associated Table 7 for an alphabetized list of counties in each category. The classification scheme first determined whether the county had metropolitan or micropolitan status and then analyzed the size of the largest town in non-metropolitan and non-micropolitan counties. The tables that follow in this report summarize information by some of the county codes shown above. Of Nebraska s 93 counties, 84 meet the definition of a non-metropolitan county; of these, 20 exist within a micropolitan area, either core or outlying; 21 non-metropolitan counties are classified by their largest town having 2,500 to 9,999 people; and 43 counties are in the category of not having a town with at least 2,500 residents. The births, deaths, and natural change figures presented are from 1980 to the most current year: For a more look at historic data from 1946 and 1949 to 2005, see the Historical Nebraska Population Report at 27
29 28
30 Table 7: Listing of Nebraska Counties Classified by Modified Urban Influence Code Metropolitan Counties Metropolitan core county (small metro--fewer than 1 million residents) Douglas Lancaster Metropolitan outlying county (small metro) Cass Dixon Saunders Washington Dakota Sarpy Seward Non-metropolitan Counties Micropolitan core county (contains a city of at least 10,000 residents) Adams Dodge Lincoln Platte Buffalo Gage Madison Scotts Bluff Dawson Hall Micropolitan outlying county Banner Howard McPherson Pierce Clay Kearney Merrick Stanton Gosper Logan County with largest town of 2,500-9,999 residents Box Butte Custer Keith Red Willow Butler Dawes Kimball Richardson Cherry Hamilton Nemaha Saline Cheyenne Holt Otoe Wayne Colfax Jefferson Phelps York Cuming County with largest town having less than 2,500 residents Antelope Fillmore Hooker Rock Arthur Franklin Johnson Sheridan Blaine Frontier Keya Paha Sherman Boone Furnas Knox Sioux Boyd Garden Loup Thayer Brown Garfield Morrill Thomas Burt Grant Nance Thurston Cedar Greeley Nuckolls Valley Chase Harlan Pawnee Webster Deuel Hayes Perkins Wheeler Dundy Hitchcock Polk 29
31 Table 8: Number of Births for Nebraska and Its Counties: Source: Nebraska Health and Human Services System Vital Statistics Reports County Adams Antelope Arthur Banner Blaine Boone Box Butte Boyd Brown Buffalo Burt Butler Cass Cedar Chase Cherry Cheyenne Clay Colfax Cuming Custer Dakota Dawes Dawson Deuel Dixon Dodge Douglas 7,147 7,103 7,152 6,973 7,113 7,146 6,904 6,951 7,042 7,212 7,404 7,209 6,989 6,872 6,774 Dundy Fillmore Franklin
32 County Frontier Furnas Gage Garden Garfield Gosper Grant Greeley Hall Hamilton Harlan Hayes Hitchcock Holt Hooker Howard Jefferson Johnson Kearney Keith Keya Paha Kimball Knox Lancaster 3,061 3,117 3,237 3,123 3,196 3,108 2,993 3,014 2,968 3,174 3,103 3,199 3,069 3,245 3,129 Lincoln Logan Loup Madison McPherson Merrick Morrill Nance Nemaha Nuckolls Otoe
33 County Pawnee Perkins Phelps Pierce Platte Polk Red Willow Richardson Rock Saline Sarpy 1,801 1,765 1,747 1,707 1,809 1,795 1,751 1,816 1,788 1,950 1,952 1,858 1,879 1,824 1,949 Saunders Scotts Bluff Seward Sheridan Sherman Sioux Stanton Thayer Thomas Thurston Valley Washington Wayne Webster Wheeler York NE Total 27,335 27,164 26,954 26,254 26,099 25,540 24,425 23,813 23,904 24,205 24,362 23,947 23,336 23,197 23,131 Metropolitan 13,653 13,585 13,658 13,310 13,577 13,500 13,039 13,089 13,134 13,658 13,873 13,577 13,159 13,285 13,194 Micro Core 5,812 5,847 5,651 5,503 5,399 5,204 5,094 4,826 4,780 4,829 4,907 4,938 4,920 4,844 4,839 Rest of State 7,870 7,732 7,645 7,441 7,123 6,836 6,292 5,898 5,990 5,718 5,582 5,432 5,257 5,068 5,098 Under 2003 defintions, metropolitan counties are Cass, Dakota, Dixon, Douglas, Lancaster, Sarpy, Saunders, Seward, and Washington. Micropolitan core counties (containing a city of 10,000+ persons) are Adams, Buffalo, Dawson, Dodge, Gage, Hall, Lincoln, Madison, Platte, and Scotts Bluff. 32
34 Table 8: Number of Births for Nebraska and Its Counties: (continued) Source: Nebraska Health and Human Services System Vital Statistics Reports County Adams ,439 4,119 2,950 Antelope , Arthur Banner Blaine Boone , Box Butte ,656 1,746 1,055 Boyd Brown Buffalo ,790 5,516 4,426 Burt , Butler ,377 1, Cass ,477 3,176 2,242 Cedar ,946 1, Chase Cherry , Cheyenne ,568 1, Clay , Colfax ,452 1,449 1,317 Cuming ,606 1, Custer ,861 1, Dakota ,100 3,381 2,732 Dawes ,429 1, Dawson ,257 3,840 3,073 Deuel Dixon Dodge ,147 4,334 3,429 Douglas 6,956 7,014 7,122 7,090 7,133 7,558 7,698 7,962 7,987 8,343 8,199 8,548 70,743 70,563 56,295 Dundy Fillmore , Franklin
35 County Frontier Furnas Gage ,255 2,602 1,905 Garden Garfield Gosper Grant Greeley Hall ,198 8,352 6,486 Hamilton ,474 1, Harlan Hayes Hitchcock Holt ,437 1, Hooker Howard Jefferson , Johnson Kearney , Keith , Keya Paha Kimball Knox ,528 1, Lancaster 3,166 3,293 3,223 3,388 3,594 3,758 3,708 3,821 4,043 4,126 4,067 4,095 30,991 32,409 27,618 Lincoln ,642 4,468 3,384 Logan Loup Madison ,712 5,477 3,939 McPherson Merrick ,227 1, Morrill Nance Nemaha , Nuckolls Otoe ,048 1,751 1,318 34
36 County Pawnee Perkins Phelps ,529 1, Pierce , Platte ,333 4,606 3,193 Polk Red Willow ,964 1, Richardson ,436 1, Rock Saline ,750 1,476 1,325 Sarpy 1,982 2,005 1,961 1,954 2,089 2,102 2,206 2,340 2,335 2,376 2,431 2,520 17,929 19,453 16,310 Saunders ,691 2,430 1,720 Scotts Bluff ,172 5,289 3,748 Seward ,199 1,748 1,349 Sheridan , Sherman Sioux Stanton , Thayer Thomas Thurston ,790 1,514 1,104 Valley Washington ,087 2,002 1,565 Wayne ,385 1, Webster Wheeler York ,388 1,807 1,228 NE Total 23,221 23,271 23,313 23,533 23,900 24,643 24,818 25,381 25,900 26,324 26,142 26, , , ,930 Metropolitan 13,410 13,647 13,688 13,825 14,290 14,846 15,049 15,596 15,768 16,313 16,204 16, , , ,379 Micro Core 4,806 4,762 4,825 4,917 4,845 5,049 5,067 5,070 5,340 5,328 5,269 5,410 52,945 48,603 36,533 Rest of State 5,005 4,862 4,800 4,791 4,765 4,748 4,702 4,715 4,792 4,683 4,669 4,709 68,545 50,660 33,018 Under 2003 defintions, metropolitan counties are Cass, Dakota, Dixon, Douglas, Lancaster, Sarpy, Saunders, Seward, and Washington. Micropolitan core counties (containing a city of 10,000+ persons) are Adams, Buffalo, Dawson, Dodge, Gage, Hall, Lincoln, Madison, Platte, and Scotts Bluff. 35
37 Table 9: Number of Deaths in Nebraska and Its Counties: Source: Nebraska Health and Human Services System Vital Statistics Reports County Adams Antelope Arthur Banner Blaine Boone Box Butte Boyd Brown Buffalo Burt Butler Cass Cedar Chase Cherry Cheyenne Clay Colfax Cuming Custer Dakota Dawes Dawson Deuel Dixon Dodge Douglas 3,292 3,405 3,323 3,292 3,421 3,537 3,344 3,425 3,442 3,355 3,337 3,364 3,443 3,474 3,405 Dundy Fillmore Franklin
38 County Frontier Furnas Gage Garden Garfield Gosper Grant Greeley Hall Hamilton Harlan Hayes Hitchcock Holt Hooker Howard Jefferson Johnson Kearney Keith Keya Paha Kimball Knox Lancaster 1,337 1,300 1,324 1,471 1,365 1,432 1,418 1,399 1,487 1,508 1,500 1,494 1,494 1,512 1,617 Lincoln Logan Loup Madison McPherson Merrick Morrill Nance Nemaha Nuckolls Otoe
39 County Pawnee Perkins Phelps Pierce Platte Polk Red Willow Richardson Rock Saline Sarpy Saunders Scotts Bluff Seward Sheridan Sherman Sioux Stanton Thayer Thomas Thurston Valley Washington Wayne Webster Wheeler York NE total 14,465 14,580 14,567 14,695 14,633 14,893 14,662 14,820 14,858 14,776 14,751 14,647 14,577 14,967 14,974 Metropolitan 5,793 5,913 5,865 5,977 5,918 6,250 5,956 6,198 6,202 6,139 6,119 6,151 6,189 6,340 6,349 Micro Core 3,187 3,187 3,161 3,142 3,180 3,232 3,291 3,187 3,330 3,246 3,251 3,252 3,222 3,331 3,352 Rest of State 5,485 5,480 5,541 5,576 5,535 5,411 5,415 5,435 5,326 5,391 5,381 5,244 5,166 5,296 5,273 Under 2003 defintions, metropolitan counties are Cass, Dakota, Dixon, Douglas, Lancaster, Sarpy, Saunders, Seward, and Washington. Micropolitan core counties (containing a city of 10,000+ persons) are Adams, Buffalo, Dawson, Dodge, Gage, Hall, Lincoln, Madison, Platte, and Scotts Bluff. 38
40 Table 9: Number of Deaths in Nebraska and Its Counties: (continued) Source: Nebraska Health and Human Services System Vital Statistics Reports County Adams ,245 3,211 2,068 Antelope Arthur Banner Blaine Boone Box Butte ,253 1, Boyd Brown Buffalo ,964 3,016 2,287 Burt ,243 1, Butler ,164 1, Cass ,898 2,005 1,481 Cedar ,300 1, Chase Cherry Cheyenne ,125 1, Clay Colfax ,168 1, Cuming ,150 1, Custer ,750 1,725 1,086 Dakota ,406 1,570 1,118 Dawes Dawson ,219 2,349 1,569 Deuel Dixon Dodge ,739 3,903 2,815 Douglas 3,665 3,542 3,570 3,540 3,670 3,534 3,646 3,682 3,634 3,505 3,536 3,561 33,836 35,010 25,098 Dundy Fillmore , Franklin
41 County Frontier Furnas ,062 1, Gage ,970 2,983 1,962 Garden Garfield Gosper Grant Greeley Hall ,540 4,899 3,521 Hamilton Harlan Hayes Hitchcock Holt ,426 1, Hooker Howard Jefferson ,168 1, Johnson Kearney Keith Keya Paha Kimball Knox ,457 1, Lancaster 1,537 1,675 1,563 1,582 1,682 1,653 1,681 1,742 1,718 1,691 1,700 1,645 14,041 15,656 11,830 Lincoln ,124 3,321 2,389 Logan Loup Madison ,266 3,418 2,413 McPherson Merrick Morrill Nance Nemaha , Nuckolls Otoe ,957 1,946 1,243 40
42 County Pawnee Perkins Phelps ,230 1, Pierce Platte ,404 2,391 1,716 Polk Red Willow ,338 1, Richardson ,727 1,559 1,003 Rock Saline ,662 1,702 1,107 Sarpy ,407 4,534 4,239 Saunders ,021 1,844 1,252 Scotts Bluff ,672 4,032 3,051 Seward ,436 1,599 1,157 Sheridan Sherman Sioux Stanton Thayer ,045 1, Thomas Thurston Valley Washington ,365 1,535 1,126 Wayne Webster Wheeler York ,403 1, NE total 15,216 15,435 15,271 15,181 15,580 14,979 15,171 15,721 15,439 14,647 14,950 14, , , ,801 Metropolitan 6,569 6,715 6,587 6,614 6,825 6,589 6,894 7,008 6,922 6,737 6,819 6,814 60,211 64,458 47,783 Micro Core 3,321 3,509 3,380 3,446 3,459 3,362 3,376 3,464 3,508 3,273 3,339 3,469 32,143 33,523 23,791 Rest of State 5,326 5,211 5,304 5,121 5,296 5,028 4,901 5,249 5,009 4,637 4,792 4,611 54,595 52,618 34,227 Under 2003 defintions, metropolitan counties are Cass, Dakota, Dixon, Douglas, Lancaster, Sarpy, Saunders, Seward, and Washington. Micropolitan core counties (containing a city of 10,000+ persons) are Adams, Buffalo, Dawson, Dodge, Gage, Hall, Lincoln, Madison, Platte, and Scotts Bluff. 41
43 Table 10: Natural Change in Nebraska and Its Counties: Source: Nebraska Health and Human Services System Vital Statistics Reports County Adams Antelope Arthur Banner Blaine Boone Box Butte Boyd Brown Buffalo Burt Butler Cass Cedar Chase Cherry Cheyenne Clay Colfax Cuming Custer Dakota Dawes Dawson Deuel Dixon Dodge Douglas 3,855 3,698 3,829 3,681 3,692 3,609 3,560 3,526 3,600 3,857 4,067 3,845 3,546 3,398 3,369 Dundy Fillmore Franklin
44 County Frontier Furnas Gage Garden Garfield Gosper Grant Greeley Hall Hamilton Harlan Hayes Hitchcock Holt Hooker Howard Jefferson Johnson Kearney Keith Keya Paha Kimball Knox Lancaster 1,724 1,817 1,913 1,652 1,831 1,676 1,575 1,615 1,481 1,666 1,603 1,705 1,575 1,733 1,512 Lincoln Logan Loup Madison McPherson Merrick Morrill Nance Nemaha Nuckolls Otoe
45 County Pawnee Perkins Phelps Pierce Platte Polk Red Willow Richardson Rock Saline Sarpy 1,511 1,435 1,439 1,384 1,493 1,444 1,415 1,411 1,422 1,568 1,572 1,455 1,507 1,421 1,533 Saunders Scotts Bluff Seward Sheridan Sherman Sioux Stanton Thayer Thomas Thurston Valley Washington Wayne Webster Wheeler York NE total 12,870 12,584 12,387 11,559 11,466 10,647 9,763 8,993 9,046 9,429 9,611 9,300 8,759 8,230 8,157 # Nat. Increase # Nat. Decrease Metropolitan 7,860 7,672 7,793 7,333 7,659 7,250 7,083 6,891 6,932 7,519 7,754 7,426 6,970 6,945 6,845 Micro Core 2,625 2,660 2,490 2,361 2,219 1,972 1,803 1,639 1,450 1,583 1,656 1,686 1,698 1,513 1,487 Rest of State 2,385 2,252 2,104 1,865 1,588 1,
46 Table 10: Natural Change in Nebraska and Its Counties: (continued) Source: Nebraska Health and Human Services System Vital Statistics Reports County Adams , Antelope Arthur Banner Blaine Boone Box Butte , Boyd Brown Buffalo ,826 2,500 2,139 Burt Butler Cass ,579 1, Cedar Chase Cherry Cheyenne Clay Colfax Cuming Custer Dakota ,694 1,811 1,614 Dawes Dawson ,038 1,491 1,504 Deuel Dixon Dodge , Douglas 3,291 3,472 3,552 3,550 3,463 4,024 4,052 4,280 4,353 4,838 4,663 4,987 36,907 35,553 31,197 Dundy Fillmore Franklin
47 County Frontier Furnas Gage Garden Garfield Gosper Grant Greeley Hall ,658 3,453 2,965 Hamilton Harlan Hayes Hitchcock Holt , Hooker Howard Jefferson Johnson Kearney Keith Keya Paha Kimball Knox Lancaster 1,629 1,618 1,660 1,806 1,912 2,105 2,027 2,079 2,325 2,435 2,367 2,450 16,950 16,753 15,788 Lincoln ,518 1, Logan Loup Madison ,446 2,059 1,526 McPherson Merrick Morrill Nance Nemaha Nuckolls Otoe
48 County Pawnee Perkins Phelps Pierce Platte ,929 2,215 1,477 Polk Red Willow Richardson Rock Saline Sarpy 1,513 1,492 1,421 1,444 1,561 1,599 1,572 1,712 1,717 1,782 1,817 1,872 14,522 14,919 12,071 Saunders Scotts Bluff ,500 1, Seward Sheridan Sherman Sioux Stanton Thayer Thomas Thurston Valley Washington Wayne Webster Wheeler York NE total 8,005 7,836 8,042 8,352 8,320 9,664 9,647 9,660 10,461 11,677 11,192 11, ,744 84,612 74,129 # Nat. Increase # Nat. Decrease Metropolitan 6,841 6,932 7,101 7,211 7,465 8,257 8,155 8,588 8,846 9,576 9,389 9,789 73,992 71,490 62,596 Micro Core 1,485 1,253 1,445 1,471 1,386 1,687 1,691 1,606 1,832 2,055 1,933 1,941 20,802 15,080 12,742 Rest of State ,950-1,958-1,209 47
49 48
50 Table 11: County Rankings for Fertility, Teen Births, and Unmarried Births: 2002 to 2006 Sources: Nebraska Vital Statistics Reports, Nebraska Health and Human Services; Population Estimates Program, U.S. Census Bureau, released Rank County Fertility Teen Birth Percent Rate County Rate County Unmarried Births 1 Colfax Thurston Thurston Thurston Colfax 80.7 Colfax Logan 99.5 Hall 68.3 Hall Dawson 97.7 Dawson 66.9 Scotts Bluff Dakota 94.7 Dakota 61.3 Dakota Arthur 91.8 Scotts Bluff 58.2 Sheridan Hall 89.0 Douglas 45.6 Dawson Keya Paha 83.7 Madison 45.5 Kimball Sheridan 81.2 Lincoln 44.4 Saline Madison 80.7 Sheridan 43.2 Madison Cuming 79.9 Keith 41.5 Douglas Douglas 78.9 Box Butte 40.7 Dodge Polk 76.7 Chase 39.8 Box Butte Scotts Bluff 76.6 Kimball 39.6 Lincoln Thomas 76.2 Dundy 38.1 Richardson Platte 76.0 Otoe 37.0 Keith Sarpy 75.8 Adams 36.2 Adams Cedar 74.2 Dodge 36.1 Knox Nuckolls 74.0 Saline 35.5 Otoe Gosper 74.0 Cherry 35.3 Cherry Johnson 73.5 Cheyenne 34.6 Dawes Perkins 73.3 Gosper 33.4 York Box Butte 73.3 Platte 33.2 Platte Dodge 73.2 Red Willow 33.1 Red Willow Dixon 73.1 Nuckolls 32.0 Wayne Knox 72.5 Banner 30.3 Deuel Greeley 72.2 Knox 29.5 Burt Lincoln 71.5 Lancaster 29.5 Gage Nance 70.6 Gage 29.3 Lancaster Chase 70.2 Logan 29.0 Garden Holt 70.1 Furnas 28.6 Nemaha Valley 70.1 Jefferson 28.3 Jefferson Custer 69.2 Johnson 28.1 Johnson Cherry 68.6 Richardson 27.8 Cheyenne Red Willow 68.6 Cuming 27.5 Harlan Saline 68.4 Custer 26.8 Clay Phelps 66.8 Sarpy 26.6 Buffalo Thayer 66.8 Holt 26.3 Morrill Adams 66.8 Harlan 25.7 Howard Lancaster 66.7 Nemaha 25.5 Phelps Sherman 66.3 Rock 25.4 Dixon Cheyenne 66.3 Phelps 25.4 McPherson Otoe 66.0 Stanton 24.7 Holt Stanton 65.9 Burt 24.5 Cass Hitchcock 65.6 Dixon 24.4 Chase
51 Rank County Fertility Rate County Teen Birth Rate County Percent Unmarried Births 46 Saunders 65.5 Morrill 23.7 Fillmore Howard 65.5 McPherson 23.3 Gosper Kimball 65.0 Nance 22.9 Butler Dundy 64.9 Valley 22.7 Merrick Jefferson 64.7 York 22.5 Valley Keith 63.9 Clay 22.5 Brown Morrill 63.5 Polk 22.4 Nance Burt 63.4 Buffalo 21.9 Sherman York 63.4 Hooker 21.4 Boone Buffalo 63.0 Garfield 21.1 Washington Blaine 62.8 Kearney 20.8 Cuming Hamilton 62.7 Hamilton 20.5 Webster Gage 62.4 Cass 19.9 Frontier Clay 62.2 Fillmore 19.9 Boyd Harlan 61.9 Sherman 19.8 Nuckolls Rock 61.6 Perkins 19.4 Custer Merrick 61.3 Brown 19.1 Kearney Cass 61.3 Greeley 18.9 Dundy Fillmore 61.2 Thayer 18.9 Franklin Antelope 61.2 Boyd 18.7 Stanton Kearney 60.6 Hitchcock 18.7 Saunders Richardson 60.1 Howard 18.4 Pierce Boone 59.7 Deuel 18.3 Sarpy Furnas 59.6 Saunders 18.3 Hamilton Pierce 59.3 Merrick 18.1 Banner Butler 59.3 Boone 17.7 Polk Brown 58.8 Frontier 17.1 Antelope Nemaha 58.4 Dawes 16.3 Pawnee Garfield 57.9 Washington 15.7 Logan Seward 57.1 Keya Paha 15.5 Furnas Washington 56.1 Butler 15.4 Thayer Franklin 55.3 Webster 14.5 Hitchcock Hayes 55.3 Cedar 13.2 Seward Deuel 55.2 Pierce 13.1 Perkins Webster 55.0 Arthur 13.0 Hooker Wheeler 54.4 Seward 12.6 Cedar Frontier 54.4 Pawnee 12.6 Greeley Hooker 54.0 Antelope 12.3 Arthur Grant 53.4 Franklin 12.1 Rock Garden 52.4 Garden 12.0 Hayes McPherson 51.7 Hayes 10.7 Garfield Loup 51.6 Sioux 10.1 Sioux Pawnee 49.7 Wayne 10.0 Thomas Boyd 46.8 Loup 8.7 Wheeler Dawes 46.5 Grant 7.4 Loup Sioux 41.7 Blaine 0.0 Grant Wayne 41.7 Thomas 0.0 Keya Paha Banner 38.5 Wheeler 0.0 Blaine
52 51
53 52
54 53
Nebraska s Population and Economic Trends
 Nebraska s Population and Economic Trends Jerry Deichert, David Drozd UNO Center for Public Affairs Research Twenty-first Annual Nebraska State Data Center Summer Conference August 17, 2010 CPACS Collaborating
MANITOBA'S ABORIGINAL COMMUNITY: A 2001 TO 2026 POPULATION & DEMOGRAPHIC PROFILE
 MANITOBA'S ABORIGINAL COMMUNITY: A 2001 TO 2026 POPULATION & DEMOGRAPHIC PROFILE MBS 2005-4 JULY 2005 TABLE OF CONTENTS I. Executive Summary 3 II. Introduction.. 9 PAGE III. IV. Projected Aboriginal Identity
Community Forum Scottsbluff
 Community Forum Scottsbluff Jerry Deichert Center for Public Affairs Research University of Nebraska at Omaha December 3, 2013 State Population Summary In 2010, Nebraska had a population count of 1,826,341
Figure 39. Yearly Trend in Death Rates for Drowning: NSW, Year
 10.0 DROWNING 10.1 Deaths due to Drowning: The drowning death rate showed a statistically significant decrease between 199 and 1999 (Figure 39). Between 199 and 1999, 46 people died from drowning, at a
2017 Nebraska Profile
 2017 Nebraska Profile State, 9 NEW Regions, 93 Counties, plus 31 Cities Three Volumes Demographic Change in the State Economic Influences at Work Housing Statistics and Trends Summary of Findings Discuss
WHERE ARE ARIZONA DEMOGRAPHICS TAKING US? HOW GROWING SLOWER, OLDER AND MORE DIVERSE AFFECTS REAL ESTATE
 WHERE ARE ARIZONA DEMOGRAPHICS TAKING US? HOW GROWING SLOWER, OLDER AND MORE DIVERSE AFFECTS REAL ESTATE March 2017 Tom Rex Office of the University Economist and Center for Competitiveness and Prosperity
Michigan Population Trends: The School Age Population
 Michigan Population Trends: The School Age Population Eric Guthrie Michigan s State Demographer January 16, 2018 State Demographer Michigan s liaison with the U.S. Census Bureau for most programs including
Briefing Paper #1. An Overview of Regional Demand and Mode Share
 2011 Metro Vancouver Regional Trip Diary Survey Briefing Paper #1 An Overview of Regional Demand and Mode Share Introduction The 2011 Metro Vancouver Regional Trip Diary Survey is the latest survey conducted
Demographic Change in North Carolina
 Demographic Change in North Carolina 5 Trends to Watch North Carolina Aggregates Association June 29, 2017 Rebecca Tippett, PhD Director, Carolina Demography July 1 Population (Millions) North Carolina
NC Demographic Trends Through 2035
 NC Demographic Trends Through 2035 House Select Committee on Strategic Transportation Planning and Long Term Funding Solutions February 22, 2016 Rebecca Tippett, University of North Carolina July 1 Population
Oakmont: Who are we?
 Oakmont: Who are we? A Snapshot of our community from the April 2010 US Census Contents Age and Gender... 1 Marital Status... 2 Home Ownership and Tenure... 3 Past Demographic Characteristics... 5 Income
Population & Demographics
 Population & Demographics Conditions and Trends When looking at trends in the total number of people living in Windham (population) and at the characteristics of the people who live here by factors such
NC Demographic Trends Through 2035
 NC Demographic Trends Through 2035 Joint Appropriation Committee on Transportation February 21, 2017 Rebecca Tippett, PhD Director, Carolina Demography July 1 Population (Millions) North Carolina s Total
REPORT OF THE ENGINEERING & PLANNING DEPARTMENT PLANNING DIVISION
 REPORT OF THE ENGINEERING & PLANNING DEPARTMENT PLANNING DIVISION 2008 09 22 TO: Mayor John Rowswell and Members of City Council SUBJECT: Official Plan Review 2008 Part 1 - Population and Household Projections
TRENDS IN PARTICIPATION RATES FOR WILDLIFE-ASSOCIATED RECREATION BY RACE/ETHNICITY AND GENDER:
 TRENDS IN PARTICIPATION RATES FOR WILDLIFE-ASSOCIATED RECREATION BY RACE/ETHNICITY AND GENDER: 1980-2001 Allan Marsinko Professor Department of Forestry and Natural Resources Clemson University Clemson,
HEALTH INSURANCE COVERAGE STATUS American Community Survey 1-Year Estimates
 S2701 HEALTH INSURANCE COVERAGE STATUS 2014 American Community Survey 1-Year Estimates Supporting documentation on code lists, subject definitions, data accuracy, and statistical testing can be found on
Evaluating the Influence of R3 Treatments on Fishing License Sales in Pennsylvania
 Evaluating the Influence of R3 Treatments on Fishing License Sales in Pennsylvania Prepared for the: Pennsylvania Fish and Boat Commission Produced by: PO Box 6435 Fernandina Beach, FL 32035 Tel (904)
1999 On-Board Sacramento Regional Transit District Survey
 SACOG-00-009 1999 On-Board Sacramento Regional Transit District Survey June 2000 Sacramento Area Council of Governments 1999 On-Board Sacramento Regional Transit District Survey June 2000 Table of Contents
Participation. Workers Compensation Insurance Seminar. May 22, Nick Beleiciks
 Oregon s Falling Labor Force Participation Workers Compensation Insurance Seminar May 22, 2013 Nick Beleiciks Let s start with a simple graph. Oregon Employment Loss by Recession 0% % Job Loss from Peak
Utah s Demographic Transformation
 Utah s Demographic Transformation A View into the Future Pamela S. Perlich, Ph.D. University Of Utah December 3, 2009 Based on a paper with the same title, available on-line: www.bebr.utah.edu Utah: Trend
3 Introductory text and technical notes 53
 Vital Statistics 3 Introductory text and technical notes 53 Table 3.1 Live births, deaths and marriages, and rates per 1,000 population 57 Graph Birth, death and marriage rates per 1,000 population 57
Student Population Projections By Residence. School Year 2016/2017 Report Projections 2017/ /27. Prepared by:
 Student Population Projections By Residence School Year 2016/2017 Report Projections 2017/18 2026/27 Prepared by: Revised October 31, 2016 Los Gatos Union School District TABLE OF CONTENTS Introduction
Developing Regional Solutions In Southeast Michigan
 Developing Regional Solutions In Southeast Michigan Presentation to Metropolitan Detroit Medical Library Group March 15, 2018 Membership Map 171 Total Members Including education members: Livingston Educational
Fishing and Hunting Recruitment and Retention in the U.S. from 1990 to 2005
 U.S. Fish & Wildlife Service Fishing and Hunting Recruitment and Retention in the U.S. from 1990 to 2005 Addendum to the 2001 National Survey of Fishing, Hunting, and Wildlife-Associated Recreation Report
NC s Shifting Population: Growth, Decline, and Rebound
 NC s Shifting Population: Growth, Decline, and Rebound House Select Committee on Strategic Transportation Planning and Long-Term Funding Solutions April 30, 2018 Rebecca Tippett, PhD Director, Carolina
Hunter and Angler Expenditures, Characteristics, and Economic Effects, North Dakota,
 Agribusiness and Applied Economics Report No. 507-S January 2003 Hunter and Angler Expenditures, Characteristics, and Economic Effects, North Dakota, 2001-2002 Dean A. Bangsund and F. Larry Leistritz*
CIRCLE The Center for Information & Research on Civic Learning & Engagement. Electoral Engagement Among Minority Youth
 FACT SHEET CIRCLE The Center for Information & Research on Civic Learning & Engagement Electoral Engagement Among Minority Youth By Mark Hugo Lopez, Research Director and Emily Kirby, Research Associate
Demographic Characteristics and Trends of Bexar County and San Antonio, TX
 Demographic Characteristics and Trends of Bexar County and San Antonio, TX Leadership San Antonio Understand Infrastructure. Prepare for Growth. May 2, 2012 San Antonio, TX Select Growing States, 2000-2010
ANNUAL REPORT OF THE FARGO MOORHEAD METROPOLITAN AREA FARGO MOORHEAD METROPOLITAN COUNCIL OF GOVERNMENTS PREPARED BY:
 ANNUAL REPORT OF THE FARGO MOORHEAD METROPOLITAN AREA community & demographics roadway system freight & interstate travel bicycle & pedestrian network transit network PREPARED BY: FARGO MOORHEAD METROPOLITAN
Missing Opportunities: Racial and Ethnic Disparities in the Twin Cities Metro in 2016
 New MetroStats Missing Opportunities: Racial and Ethnic Disparities in the Twin Cities Metro in 2016 10/2/2017 Community Development Committee What s New American Community Survey data released (9/14)
Wenlin Liu, Senior Economist. Stateof Wyoming. Economic Analysis Division State of Wyoming 1
 WYOMING DEMOGRAPHIC AND ECONOMIC TREND LCCC LIFE Program April 7, 2012 Cheyenne, Wyoming Wenlin Liu, Senior Economist Economic Analysis Division Stateof Wyoming Economic Analysis Division State of Wyoming
Americans in Transit A Profile of Public Transit Passengers
 Americans in Transit A Profile of Public Transit Passengers published by American Public Transit Association December 1992 Louis J. Gambacclnl, Chairman Rod Diridon, Vice Chairman Fred M. Gilliam, Secretary-Treasurer
THE 2010 MSP REGION TRAVEL BEHAVIOR INVENTORY (TBI) REPORT HOME INTERVIEW SURVEY. A Summary of Resident Travel in the Twin Cities Region
 REPORT HOME INTERVIEW SURVEY. A Summary of Resident Travel in the Twin Cities Region") THE 2010 MSP REGION TRAVEL BEHAVIOR INVENTORY (TBI) REPORT HOME INTERVIEW SURVEY A Summary of Resident Travel in the Twin Cities Region October 2013 WHAT IS THE TBI? The Travel Behavior Inventory (TBI)
THE 2010 MSP REGION TRAVEL BEHAVIOR INVENTORY (TBI) REPORT HOME INTERVIEW SURVEY A Summary of Resident Travel in the Twin Cities Region October 2013 WHAT IS THE TBI? The Travel Behavior Inventory (TBI)
Texas Housing Markets: Metropolitan vs. Border Communities. September 22, 2014
 Texas Housing Markets: Metropolitan vs. Border Communities Luis Bernardo Torres Ruiz, Ph.D. Research Economist El Paso Branch Dallas Federal Rio Grande Economic Association September 22, 2014 Contents
Encouraging generosity:
 Encouraging generosity: The demographics of charitable estate planning Russell James, J.D., Ph.D., CFP Professor Texas Tech University It s kind of a BIG DEAL Why this new data is so important Small one-time
Travel and Rider Characteristics for Metrobus
 Travel and Rider Characteristics for Metrobus 040829040.15 Travel and Rider Characteristics for Metrobus: 2012-2015 Overview The Miami Dade County Metropolitan Planning Organization (MPO) conducted a series
BIG DEAL. It s kind of a. Wills that Won t. Why this new data is so important. Russell James. The demographics of charitable estate planning 9/8/2015
 Wills that Won t The demographics of charitable estate planning Russell James Professor Texas Tech University It s kind of a BIG DEAL Why this new data is so important 1 Small one-time snapshots in life
Rio Grande County Births and Deaths 2015
 Rio Grande County Births and Deaths 2015 Selected birth characteristics: County residents, 2015... 2 Selected birth characteristics by age group of mother: County residents, 2015... 3 Selected birth characteristics
Three Strikes Analysis:
 Three Strikes Analysis: Demogr aphic Char acteristics of Strike Offenders Jessica Jin 16 Francesca Hidalgo-Wohlleben 17 with assistance from: Shaneli Jain 18 Shivani Pandya 18 Jennifer Walsh, PhD, Project
CHAPTER 10 TOTAL RECREATIONAL FISHING DAMAGES AND CONCLUSIONS
 CHAPTER 10 TOTAL RECREATIONAL FISHING DAMAGES AND CONCLUSIONS 10.1 INTRODUCTION This chapter provides the computation of the total value of recreational fishing service flow losses (damages) through time
2015 Victorian Road Trauma. Analysis of Fatalities and Serious Injuries. Updated 5 May Page 1 of 28. Commercial in Confidence
 2015 Victorian Road Trauma Analysis of Fatalities and Serious Injuries Updated 5 May 2016 Page 1 of 28 Commercial in Confidence VICROADS_n3445896_2015_Victorian_Trauma_Report_- _updated_may_2016.docx 2015
Population trends in Hungary in the 2nd half of the 20th century and in the last 15 years
 Population trends in Hungary in the 2nd half of the 20th century and in the last 15 years Péter Őri (Hungarian Demographic Research Institute, Budapest) Driving forces behind demographic trends in Visegrad
A Hare-Lynx Simulation Model
 1 A Hare- Simulation Model What happens to the numbers of hares and lynx when the core of the system is like this? Hares O Balance? S H_Births Hares H_Fertility Area KillsPerHead Fertility Births Figure
Final Report, October 19, Socioeconomic characteristics of reef users
 Socioeconomic Study of Reefs in Southeast Florida - Executive Summary By Hazen and Sawyer in association with Florida State University and National Oceanic and Atmospheric Administration, October 19, 2001
Report to the Benjamin Hair-Just Swim For Life Foundation on JACS4 The Jefferson Area Community Survey
 Report to the Benjamin Hair-Just Swim For Life Foundation on JACS4 The Jefferson Area Community Survey Prepared by: Kara Fitzgibbon, M.A. Research Analyst Matthew Braswell, M.A. Research Analyst Yuliya
CASUALTY REVIEW
 SOMERSET HEADINGROAD SAFETY PARTNERSHIP CASUALTY REVIEW 22-27 IMPROVING ROAD SAFETY WORKING TOGETHER TO REDUCE CASUALTIES HEADING HEADING CONTENTS 3 1. EXECUTIVE SUMMARY........................................
2011 Origin-Destination Survey Bicycle Profile
 TRANS Committee 2011 Origin-Destination Survey National Capital Region December 2012 TRANS Committee Members: City of Ottawa, including OC Transpo Ville de Gatineau Société de transport de l Outaouais
The Quality of Life of the People in Norway
 1 Example Report The Quality of Life of the People in Norway The Management Institute for Quality-of-Life Studies December 2018 2 Introduction This report provides a detailed picture of the quality of
WORLD. Geographic Trend Report for GMAT Examinees
 2012 WORLD Geographic Trend Report for GMAT Examinees WORLD Geographic Trend Report for GMAT Examinees The World Geographic Trend Report for GMAT Examinees identifies mobility trends among candidates applying
National Community and Transportation Preferences Survey. September 2017
 National Community and Transportation Preferences Survey September Executive Summary - Overview The Community and Transportation Preferences Survey echoes many of the major findings from the previous surveys.
Housing, Economics and People in the U.S. and Wisconsin
 Housing, Economics and People in the U.S. and Wisconsin Morris A. Davis, Ph. D. Academic Director, James A. Graaskamp Center for Real Estate Associate Professor, Department of Real Estate and Urban Land
SECTION SEVEN. Characteristics of People with IDD and Staff in Large Public Residential Facilities
 SECTION SEVEN Characteristics of People with IDD and Staff in Large Public Residential Facilities FY Section 7: Characteristics of People with IDD and Staff in Large State-Operated IDD Facilities This
Compression Study: City, State. City Convention & Visitors Bureau. Prepared for
 : City, State Prepared for City Convention & Visitors Bureau Table of Contents City Convention & Visitors Bureau... 1 Executive Summary... 3 Introduction... 4 Approach and Methodology... 4 General Characteristics
Bicycle Helmet Use Among Winnipeg Cyclists January 2012
 Bicycle Helmet Use Among Winnipeg Cyclists January 2012 By: IMPACT, the injury prevention program Winnipeg Regional Health Authority 2 nd Floor, 490 Hargrave Street Winnipeg, Manitoba, R3A 0X7 TEL: 204-940-8300
Acknowledgements. Ms. Linda Banister Ms. Tracy With Mr. Hassan Shaheen Mr. Scott Johnston
 Acknowledgements The 2005 Household Travel Survey was funded by the City of Edmonton and Alberta Infrastructure and Transportation (AIT). The survey was led by a steering committee comprised of: Dr. Alan
ENROLLMENT PROJECTIONS JANUARY 8, 2018 BOARD OF EDUCATION PRESENTATION JEFF CIMMERER CHIEF INFORMATION OFFICER
 1 ENROLLMENT PROJECTIONS JANUARY 8, 2018 BOARD OF EDUCATION PRESENTATION JEFF CIMMERER CHIEF INFORMATION OFFICER Pittsford Central School District Enrollment Comparison Between 2016 and 2017 Grades Actual
2014 QUICK FACTS ILLINOIS CRASH INFORMATION. Illinois Emergency Medical Services for Children February 2016 Edition
 2014 QUICK FACTS ILLINOIS CRASH INFORMATION February 2016 Edition Illinois Emergency Medical Services for Children www.luhs.org/emsc Illinois Emergency Medical Services for Children TABLE OF CONTENTS
2012 QUICK FACTS ILLINOIS CRASH INFORMATION. Illinois Emergency Medical Services for Children September 2014 Edition
 2012 QUICK FACTS ILLINOIS CRASH INFORMATION September 2014 Edition Illinois Emergency Medical Services for Children www.luhs.org/emsc Illinois Emergency Medical Services for Children TABLE OF CONTENTS
12. School travel Introduction. Part III Chapter 12. School travel
 12. School travel 12.1 Introduction This chapter presents the evidence on changes in travel patterns for the journey to school in the three towns over the period of the Sustainable Travel Town project.
User Characteristics and Use Trends Since the 1990s on Paved State Bicycle Trails
 User Characteristics and Use Trends Since the 1990s on Paved State Bicycle Trails State paved bicycle trails (segments studied are mapped) Paul Bunyan segment near Bemidji Heartland Paul Bunyan Gitchi-Gami
METROPOLITAN PROFILE 2016 ANNUAL REPORT OF THE FARGO-MOORHEAD METROPOLITAN AREA
 METROPOLITAN PROFILE 2016 ANNUAL REPORT OF THE FARGO-MOORHEAD METROPOLITAN AREA community & demographics roadway system freight & interstate travel bicycle & pedestrian network transit network PREPARED
1998 SURVEY OF FRONT SEAT OCCUPANT RESTRAINT USE IN EIGHTEEN TEXAS CITIES. by Katie N. Womack. October 1998
 1998 SURVEY OF FRONT SEAT OCCUPANT RESTRAINT USE IN EIGHTEEN TEXAS CITIES by Katie N. Womack October 1998 This report was prepared in cooperation with the Traffic Operations Division Texas Department of
Demographic Projection in Russian Interindustrial Model. Vadim Potapenko Institute of Economic Forecasting Russian Academy of Sciences
 Demographic Projection in Russian Interindustrial Model Vadim Potapenko Russian population on 1 st January, million people 150 145 140 148.5 143.7 146.4 135 130 125 120 115 110 1960 1965 1970 1975 1980
More than half the world lives on less than $2 a day
 More than half the world lives on less than $2 a day PRB s 2005 World Population Data Sheet reveals persisting global inequalities in health and well-being Presentation by Bill Butz, Carl Haub, Linda Jacobsen,
2016 Capital Bikeshare Member Survey Report
 2016 Capital Bikeshare Member Survey Report Prepared by: LDA Consulting Washington, DC 20015 (202) 548-0205 February 24, 2017 EXECUTIVE SUMMARY Overview This report presents the results of the November
Issues in the Long-Term Economic Outlook for Canada
 Policy and Economic Analysis Program Rotman School of Management University of Toronto Issues in the Long-Term Economic Outlook for Canada Office of the Chief Actuary Canada Pension Plan Seminar September
The Wisconsin and Minnesota Economies: What can we learn from each other? Noah Williams
 The Economies: What can we learn from each other? Noah University of Wisconsin - Madison Future Wisconsin Summit 2016 Economies Location, size, demographics, and history make Wisconsin and Minnesota natural
Community Outreach Resource Center
 Community Outreach Resource Center Tier 1 Report: Gillespie County Child & Adolescent Health Child Abuse Rates in Gillespie County 23 7 Gillespie County Children Living in Poverty 23 7 Rate per 1, 14.
Appendix C. Corridor Spacing Research
 Appendix C. Corridor Spacing Research Task 3 of the Twin Cities Bicycle Study called for the development of bicycle corridor spacing guidelines. This section summarizes research of the spacing of planned
TRAFFIC CRASHES involving BICYCLISTS
 The Office of the Chief of Police in Berlin BERLIN TRAFFIC CRASHES involving BICYCLISTS A special research project concerning bicycle crashes in West Berlin in the years 1981 through 1985 Police Analyst
A Comparison of Highway Construction Costs in the Midwest and Nationally
 A Comparison of Highway Construction Costs in the Midwest and Nationally March 20, 2018 Mary Craighead, AICP 1 INTRODUCTION State Departments of Transportation play a significant role in the construction
Relationship Between Child Pedestrian Accidents and City Planning in Zarqa, Jordan
 112 TRANSPORTATION RESEARCH RECORD 1281 Relationship Between Child Pedestrian Accidents and City Planning in Zarqa, Jordan ADU H. AL-BALBISSI, MOHAMED T. ABOUL-ELA, AND SABAH SAMMOUR The relationship between
Background: Introduction:
 Background: Iowa s 2014 Child Passenger Safety Survey Project Conducted by the University of Iowa Injury Prevention Research Center Under contract to Iowa Governor s Traffic Safety Bureau Since 1985, Iowa
Bicycle Helmet Use Among Winnipeg Cyclists 2010
 Bicycle Helmet Use Among Winnipeg Cyclists 2010 IMPACT, the injury prevention program Winnipeg Regional Health Authority NA335-700 McDermot Avenue Winnipeg, Manitoba, R3E 0T2 Phone: (204) 787-1873 September
RTC TRANSIT OPERATING STATISTICS RTC RIDE RTC RAPID RTC INTERCITY SIERRA SPIRIT
 RTC TRANSIT OPERATING STATISTICS RTC RIDE RTC RAPID RTC INTERCITY SIERRA SPIRIT September 218 RTC TRANSIT OPERATING STATISTICS REPORT TABLE OF CONTENTS RTC Transit Highlights... Page ii RTC Transit Summary...
Trends in Graduation Success Rates and Federal Graduation Rates at NCAA Division I Institutions NCAA Research Staff November 2018
 Trends in Graduation Success Rates and Federal Graduation Rates at NCAA Division I Institutions NCAA Research Staff November 2018 Executive Summary Federal Graduation Rate vs. Graduation Success Rate Federal
The Outlook for Real Estate and Residential Construction. Patrick M. Barkey, Director Bureau of Business and Economic Research University of Montana
 The Outlook for Real Estate and Residential Construction Patrick M. Barkey, Director Bureau of Business and Economic Research University of Montana Montana s Real Estate Performance: Getting Back to Boom
Joint Strategic Needs Assessment (JSNA) Picture of Lewisham 2018
 Picture of Lewisham 2018") Joint Strategic Needs Assessment (JSNA) Picture of Lewisham 2018 Lewisham s Population Lewisham is the 13 th largest borough in London by population size and the 5 th largest in Southwark Inner London
Joint Strategic Needs Assessment (JSNA) Picture of Lewisham 2018 Lewisham s Population Lewisham is the 13 th largest borough in London by population size and the 5 th largest in Southwark Inner London
Nevada County Population Projections 2013 to 2032 Based On The Last Estimate Year of 2012
 Nevada County Population Projections 2013 to 2032 Based On The Last Estimate Year of 2012 Prepared By: The Nevada State Demographer s Office Jeff Hardcastle, AICP NV State Demographer University of NV
Understanding the. Dr. Christopher Waller. Federal Reserve Bank of St. Louis
 Understanding the Unemployment Picture Dr. Christopher Waller Senior Vice President and Director of fresearch Federal Reserve Bank of St. Louis By David Andolfatto and Marcela Williams A Look at Unemployment
Nevada County Population Projections 2015 to 2034
 Nevada County Population Projections 2015 to 2034 Prepared By: Jeff Hardcastle, AICP Nevada State Demographer Nevada Department of Taxation Reno Office: 4600 Kietzke Lane, Building L Suite 235 Reno, NV
Evaluating the Design Safety of Highway Structural Supports
 Evaluating the Design Safety of Highway Structural Supports by Fouad H. Fouad and Elizabeth A. Calvert Department of Civil and Environmental Engineering The University of Alabama at Birmingham Birmingham,
Iowa Child Passenger Safety Survey 2016
 Iowa Child Passenger Safety Survey 2016 Conducted by the University of Iowa Injury Prevention Research Center Under contract to Iowa Governor s Traffic Safety Bureau Background Since 1985, Iowa has had
2016 Capital Bikeshare Member Survey Report
 2016 Capital Bikeshare Member Survey Report Prepared by: LDA Consulting Washington, DC 20015 (202) 548-0205 February 24, 2017 EXECUTIVE SUMMARY Overview This report presents the results of the November
2020 K Street NW, Suite 410 Washington, DC (202)
") 2020 K Street NW, Suite 410 Washington, DC 20006 (202) 463-7300 Interview dates: October 24 25, 2013 Interviews: 1,008 adults CONDUCTED BY IPSOS PUBLIC AFFAIRS These are findings of an Ipsos online poll
2020 K Street NW, Suite 410 Washington, DC 20006 (202) 463-7300 Interview dates: October 24 25, 2013 Interviews: 1,008 adults CONDUCTED BY IPSOS PUBLIC AFFAIRS These are findings of an Ipsos online poll
REPORT BACKGROUND... 3 SCOPE OF WORKS... 3 HISTORICAL STATE POPULATION TRENDS... 4
 Contents REPORT BACKGROUND... 3 INTRODUCTION... 3 SCOPE OF WORKS... 3 HISTORICAL STATE POPULATION TRENDS... 4 INTRODUCTION... 4 NSW POPULATION... 4 POPULATION GROWTH... 4 Population forecasts... 6 NSW
Life Transitions and Travel Behaviour Study. Job changes and home moves disrupt established commuting patterns
 Life Transitions and Travel Behaviour Study Evidence Summary 2 Drivers of change to commuting mode Job changes and home moves disrupt established commuting patterns This leaflet summarises new analysis
Capital Bikeshare 2011 Member Survey Executive Summary
 Capital Bikeshare 2011 Member Survey Executive Summary Prepared by: LDA Consulting Washington, DC 20015 (202) 548-0205 June 14, 2012 EXECUTIVE SUMMARY Overview This report presents the results of the 2012
2012 Capital Bikeshare Member Survey Report
 2012 Capital Bikeshare Member Survey Report Prepared by: LDA Consulting Washington, DC 20015 (202) 548-0205 May 22, 2013 EXECUTIVE SUMMARY Overview This report presents the results of the November 2012
Geometric Categories as Intersection Safety Evaluation Tools
 Geometric Categories as Intersection Safety Evaluation Tools John R. Campbell Ayres Associates N19 W24075 Riverwood Drive, Suite 300 Waukesha, WI 53188 campbellj@ayresassociates.com Keith K. Knapp Engineering
Modal Shift in the Boulder Valley 1990 to 2009
 Modal Shift in the Boulder Valley 1990 to 2009 May 2010 Prepared for the City of Boulder by National Research Center, Inc. 3005 30th Street Boulder, CO 80301 (303) 444-7863 www.n-r-c.com Table of Contents
Commuting in America 2013
 Commuting in America 2013 The National Report on Commuting Patterns and Trends Brief 7. Vehicle and Transit Availability September 2013 About the AASHTO Census Transportation Planning Products Program
3 ROADWAYS 3.1 CMS ROADWAY NETWORK 3.2 TRAVEL-TIME-BASED PERFORMANCE MEASURES Roadway Travel Time Measures
 ROADWAYS Approximately 6 million trips are made in the Boston metropolitan region every day. The vast majority of these trips (80 to percent, depending on trip type) involve the use of the roadway network
A SURVEY OF 1997 COLORADO ANGLERS AND THEIR WILLINGNESS TO PAY INCREASED LICENSE FEES
 Executive Summary of research titled A SURVEY OF 1997 COLORADO ANGLERS AND THEIR WILLINGNESS TO PAY INCREASED LICENSE FEES Conducted by USDA Forest Service Rocky Mountain Research Station Fort Collins,
RECOMMENDED CITATION: Pew Research Center, February 2014, Public Skeptical of Decision to Hold Olympic Games in Russia
 NUMBERS, FACTS AND TRENDS SHAPING THE WORLD FOR RELEASE FEBRUARY 4, 2014 FOR FURTHER INFORMATION ON THIS REPORT: Carroll Doherty, Director of Political Research Seth Motel, Research Assistant 202.419.4372
Active Travel and Exposure to Air Pollution: Implications for Transportation and Land Use Planning
 Active Travel and Exposure to Air Pollution: Implications for Transportation and Land Use Planning Steve Hankey School of Public and International Affairs, Virginia Tech, 140 Otey Street, Blacksburg, VA
Factors Associated with the Bicycle Commute Use of Newcomers: An analysis of the 70 largest U.S. Cities
 : An analysis of the 70 largest U.S. Cities Ryan J. Dann PhD Student, Urban Studies Portland State University May 2014 Newcomers and Bicycles Photo Credit: Daveena Tauber 2 Presentation Outline Introduction
American River College Student Equity Disproportionate Impact Analyses Fall 2015
 Disproportionate Impact Analyses Fall 2015 This document introduces the set of data ARC s Research Office compiled in Fall 2015. The data reported here were sourced from the California Community College
SUMMARY MEMBERSHIP ANALYSIS FOR THE STATE OF. Trends of first-time 4 to 8 year-old male ice hockey players to
 SUMMARY MEMBERSHIP ANALYSIS FOR THE STATE OF New York Trends of first-time 4 to 8 year-old male ice hockey players 1997-98 to 27-8 p.2 -Background and Methodology p.3 -National Acquisition and Retention
Appendix T 1: Additional Supporting Data
 Appendix T 1: Additional Supporting Data Project Delivery Delays with the implementation of the 2000 TIP became apparent early in the decade. In response to direction among policy officials, ARC began