Rotoiti Nature Recovery Project Triennial Report July June 2001
|
|
|
- Letitia Rose
- 5 years ago
- Views:
Transcription
1 Rotoiti Nature Recovery Project Triennial Report July June 2001 ST ARNAUD'S MAINLAND ISLAND, NELSON LAKES NATIONAL PARK Rotoiti Nature Recovery Project Team Compiled by David Butler October 2003 Published by Department of Conservation Nelson/Marlborough Conservancy Private Bag 5 Nelson
2 Occasional Publication No. 56 October 2003, Department of Conservation ISSN ISBN Cover Photo: Checking stoat trap Arno Gasteiger NELCO-32367
3 WOW! what an awesome place. I ve never seen so many bellbird and tui in one place and I saw it at a low bird activity time of day just after lunch. It must just be fantastic at dawn. Places like Rotoiti are an inspiration to us as pest managers and all New Zealanders alike. Cees Bevers, Wanganui Conservancy, May 2000.
4 CONTENTS EXECUTIVE SUMMARY 5 1. INTRODUCTION 8 2. GOALS AND OBJECTIVES TIMELINE OF MAJOR PROJECT EVENTS RESULTS - PEST CONTROL & MONITORING Possum Control and Monitoring 16 Objectives 16 Performance Target 16 Methods 16 Results 19 Non-target Impacts 22 Diet Study 22 Discussion Rodent Control and Monitoring Ship Rats 24 Objectives 24 Performance Target 24 Methods 24 Results 28 Discussion Mice 38 Objectives 38 Performance Target 38 Methods 39 Results 39 Discussion Relationship between rat and mouse numbers Mustelid Control & Monitoring 49 Objectives 49 Performance Target 49 Methods 49 Results 51 Discussion Feral Cat Control & Monitoring 64 Objectives 64 Performance Target 64 Methods 64 Results 64 Discussion Wasp Control & Monitoring 67 Objectives 67 Performance Targets 67
5 Methods 68 Results 70 Discussion 79 St Arnaud Community Association Wasp Control Programme Deer and Chamois Control and Monitoring 82 Objective 82 Performance target 82 Methods 82 Results 82 Discussion Pig Control & Monitoring Hedgehog Control & Monitoring Hare and Rabbit Monitoring Weed Control & Monitoring RESULTS - MONITORING OF NATIVE SPECIES AND SYSTEMS Bird Monitoring 86 Objectives Multi-species Monitoring 86 Methods 86 Results 88 Discussion Kaka Monitoring 98 Objectives 98 Methods 98 Results 98 Discussion Robin Monitoring and Research 103 Objectives 104 Methods 104 Results 105 Discussion Kea Monitoring and Research Falcon Monitoring Invertebrate Monitoring Flying Insects 110 Objectives 110 Methods 110 Results 111 Discussion 112
6 5.2.2 Ground Invertebrates 113 Objectives 113 Results Land Snail Monitoring 113 Objectives 113 Methods 113 Results 114 Discussion Beech Scale Insects and Honeydew Monitoring 115 Objectives 115 Methods 115 Results 115 Discussion Bat Survey and Monitoring 117 Objectives 117 Methods 117 Results 117 Discussion Lizard Survey and Monitoring 118 Objectives 118 Methods 118 Results 118 Discussion Plant and Vegetation Monitoring Vegetation Survey Mistletoes Pittosporum patulum Foliar Browse Index Vegetation Plots Deer Exclosures Beech Seeding Tussock Seeding Toxin Monitoring Monitoring lake system Target and non-target monitoring ADVOCACY AND EDUCATION Developing and Maintaining Project Profile Community Liaison Iwi Liaison Media Liaison Education Programmes Visitor Services Volunteer Involvement Individual Volunteers Community Volunteers 146
7 7. RESEARCH Nationally-funded Research Research funded or assisted by the Project PROJECT MANAGEMENT Budget Staffing Training Skills Sharing Health and Safety Data Management Review ACKNOWLEDGEMENTS 154 REFERENCES 156 APPENDIX 1: PERSONNEL 160 APPENDIX 2: REVIVE ROTOITI NEWSLETTER 161 APPENDIX 3: WEATHER DATA 168
8 Executive Summary This reports documents the third to fifth years of the Rotoiti Nature Recovery Project (from 1 July 1998 to 30 June 2001 based on the Department s financial year) which were the second, third and fourth seasons of comprehensive pest control. Significant progress is recorded towards achieving two of the project s three objectives, namely pest control/species recovery and advocacy. Initial discussions have begun regarding the third objective that covers re-introducing species lost from the area. KEY RESULTS ARE AS FOLLOWS Possum Control Vegetation Response Possums were maintained at low numbers below the target level throughout this period. Positive responses from the vegetation are becoming evident in the rare plants we monitor, mistletoes and Pittosporum patulum, and in the foliage condition of other palatable species. Rodent Control Bird Response Rodent numbers remained low and below target levels through to July Unusually heavy seeding of beech trees that autumn, following significant seeding the previous year, saw rats rise to unprecedented levels in non-treatment areas and to above our target in the treatment area. The low rat numbers in 1998/99 and 1999/00 were associated with very successful breeding seasons for robins. In 2000/01, though rat numbers went above our target, we were still able to exert sufficient control to see robins do significantly better than in the non-treatment area. Rat control switched from using brodifacoum in to traps in 2000/01, following a departmental review of the use of the toxin. Whether the change of technique was also a factor in the increase of rat numbers can only be determined in the future. We were not able to control mice effectively with our current spacing of bait stations/traps. Mustelid Control Bird Response Our stoat trapping programme, combined with a likely secondary poisoning impact on this predator in , resulted in significantly higher nesting success of kaka in the project area (80% of nests successful) than elsewhere (5-10% success). The combination of rat and mustelid control was associated with significant increases in a variety of native bird species. Bellbirds, rifleman and parakeets showed the strongest effects, the average number of the former doubling from two to four per count. All nine falcon eggs laid in the block (3 nests ) led to fledged chicks compared to only 27% of those at other sites in the area. 5
9 Wasp Control Invertebrate Response Wasp activity was reduced in c300ha of the lower part of the block each year by a bait station operation. Over 90% of nests there were considered killed in 1998/99 and 2000/01 and a lower proportion in 1999/2000. A significant response was recorded in the output of honeydew by the beech scale insect, an important food source for native fauna. Honeydew remained above target levels in the treated area and fell below that due to wasps in the non-treatment area. Malaise trap samples have been collected to examine the impacts on other invertebrates and there are early signs of the expected positive effects. Land Snail Monitoring Our initial monitoring of the Powelliphanta population has been completed and suggests that it is relatively healthy in the one smallish area of tussock. It will be several years before a re-monitor is due to look for positive changes there and in the forest nearby. Advocacy and Education Our advocacy and education programmes have developed significantly. A major effort was put into increasing what the site can offer to visitors. Two short walks, the Bellbird Walk and Honeydew Walk have been constructed to the Department s highest standard, leading into the project area from Kerr Bay at Lake Rotoiti. The Bellbird Walk provides a 10- minute loop suitable for wheelchairs and the Honeydew Walk a minute loop with a wide gravel surface. Interpretation panels have been positioned on these tracks and a new display area developed in the Visitor Centre. A major Open Day was held in 2000 and an increasing number of varieties of groups were given guided walks or talks about the project. Educational resources were developed at primary and secondary levels and the project participated in the LEARNZ programme in 2001 when several thousand pupils from schools all around the country participated in virtual field trips to the site. Experimental Work It has been identified that Mainland Islands like Rotoiti should be sites where techniques are developed, tested or refined for application at other sites. It is thus appropriate to emphasise activities of this type as follows: A trial of two designs of trap cover for trapping of mustelids and of fresh and plastic eggs as bait led to clear preferences (wooden tunnel/fresh white egg) which were adopted throughout our trap network. Research to investigate optimum bait station spacing for control of rodents in beech mast years suggested that a 20x20m grid would be needed for effective control of mice. The project continued to foster significant student research here. Its own studies provided further information on possum and mouse diets. 6
10 Spreading the Message We also emphasise the idea that mainland islands can act as catalysts, encouraging others to apply similar techniques on land they manage. Such information transfer is a weekly event by phone or though some specific activities can be identified: Provision of advice to local landowner seeking to tie pest control into a QEII covenant over forest on his property. Visit to the project by Jan and Arnold Heine of MIRO, a group proposing a community-based mainland island in Wellington s East Coast Bays. Followed by an invitation to talk at the AGM of East Harbour Association in July Invitation received to participate in a workshop to discuss the formation of a community-based mainland island in the Waitakere Ranges of Auckland (August 1999). Organising of a Mainland Island hui in 2000 one result was that the Bushy Park Homestead and Forest Trust turned around three quarters of its restoration programme (Allan Anderson, pers. comm.). 7
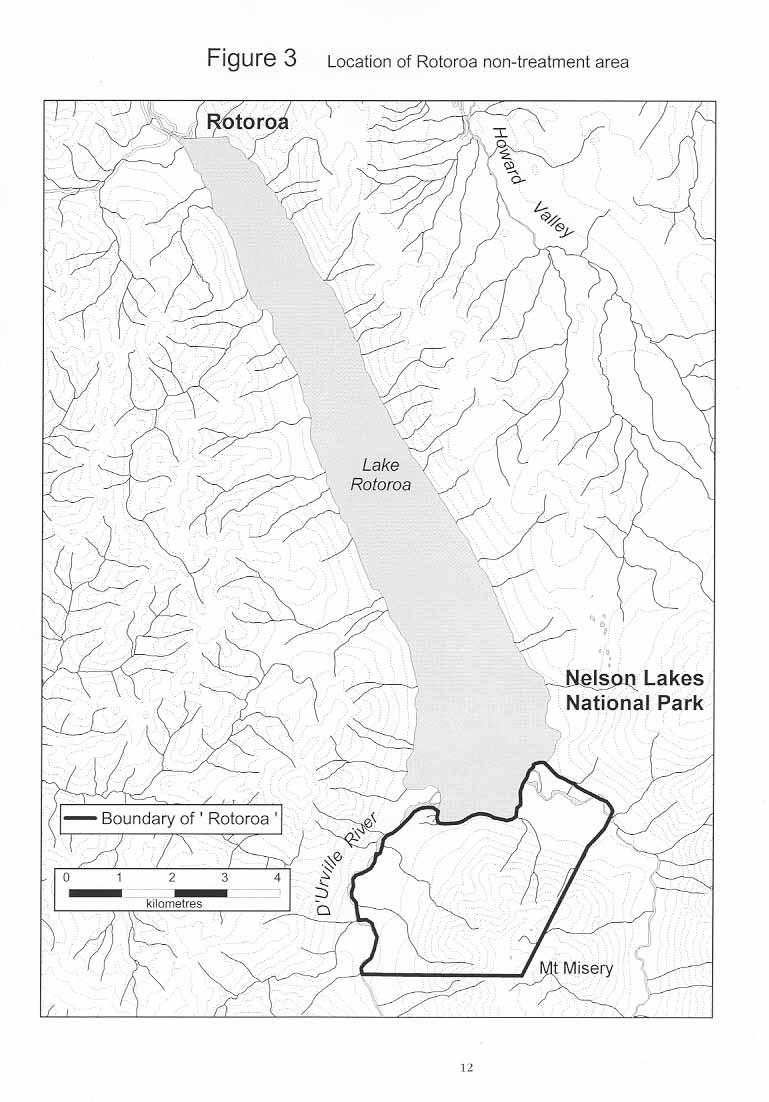
11 1. Introduction The Rotoiti Nature Recovery Project is the title given to a mainland island project based on beech forests containing honeydew, one of six such projects funded within a national programme focussed on different habitats. The project area covers 825ha on the slopes of the St Arnaud Range, Nelson Lakes National Park, bordered to the east by Lake Rotoiti and to the north-east by St Arnaud village and farmland (Figure 1). The site was chosen as representative of a habitat type that occupies about 1 million hectares or 15% of New Zealand s indigenous forests (Beggs 2001) particularly in the northern South Island, at a location accessible to visitors. It is crossed by three popular walking tracks adjacent to St Arnaud, the main gateway into the National Park. A more detailed description of the site is available in the project s Strategic Plan (Butler, 1998). Two sites are used as non-treatment areas in which no pest control is undertaken but monitoring is carried out on a range of pest and native species. One, known as Lakehead, is situated at the head of Lake Rotoiti c.5km from the treatment area covering similar aspect and altitudinal range (Figure 2). It is used for monitoring possums, rodents, birds, and some components of vegetation. The second, known as Rotoroa or Mt Misery, is situated at Lake Rotoroa 18km to the west of Lake Rotoiti, which extends to lower altitude (Figure 3). This site is used to monitor wasps, other flying invertebrates and honeydew, partly due to prior work by Landcare Research and partly due to the relative lack of honeydew and wasps at Lakehead. It is also where we monitor kaka, being sufficient distance from the treatment site for such a wide ranging species, and beech seeding and rodents to tie in with a c.20-year data set obtained by Landcare Research (and previously DSIR Ecology Division). This illustrates some of the difficulties we found in obtaining one, ideal non-treatment area. The key to using non-treatment areas, which have some differences from the treatment area, is not to compare the two directly but instead to compare trends within one over time with trends at the other. This report covers a three-year period that took the project up to an initial review. Work began in the spring of 1996 and the first season was spent establishing the site, building infrastructure, undertaking some baseline monitoring and developing the project s public profile. Comprehensive pest control and monitoring began in the 1997/98 year and the first report was produced at the conclusion of that (Butler 2000). The 1998/99, 1999/2000 and 2000/2001 years have seen the continuation of control programmes, an increased emphasis on monitoring, and the construction of new tracks and interpretative material for visitors. Combining the three in one report was not the original intention, but it does have some advantages when it comes to interpreting trends and seeing patterns through a beech masting cycle. Beech trees seeded in each of the years, lightly in 1998, heavily in 1999 and even more heavily in 2000 leading to an increase in rodent numbers considered the most dramatic in about 30 years. The one report also serves to pull together the results of the first phase of the project up to the recently completed review. This report presents its results within the project s three objectives (2.0 below). Readers are referred to the Strategic Plan (ibid) for the thinking behind these objectives and their translation into a long-term programme of scientifically based activities. 8
12 There is a close linkage between many different parts of the programme. Results are presented firstly by the different pests, detailing the control programmes and their effects on animal numbers or activity Result Monitoring (section 4). This is followed by information on the different native species and systems monitored (section 5) which is generally looking for responses due to the pest control, or Outcome Monitoring. So, for example, section 4.1. deals with possum control and changes in possum numbers (result) and section 5.3 presents information on changes in vegetation (outcome), most of which we directly attribute to reduced possum numbers. 9
13 10
14 11
15 12
16 2. Project Goal and Objectives Goal Restoration of a beech forest community with emphasis on the honeydew cycle. Objectives To reduce wasp, rodent, stoat, feral cat, possum and deer populations to sufficiently low levels to allow the recovery of the indigenous ecosystem components (especially kaka, yellow-crowned parakeet, tui, bellbird, robin, long-tailed bat, and mistletoe) and ecosystem processes (especially the honeydew cycle). To re-introduce recently depleted species, such as yellowhead (mohua), kiwi and kokako (S.I. sub-species if possible), once the beech forest ecosystem is sufficiently restored. To advocate for indigenous species conservation and long-term pest control, by providing an accessible example of a functioning honeydew beech forest ecosystem, so a large number of people can experience a beech forest in as near-to-pristine condition as possible. 13
17 3. Timeline of Major Project Events Figure 4 provides a representation of key project activities and major environmental factors from 1996 to the present. It summarises the main elements of the pest control programme targeting rodents, possums and mustelids not including wasps which were poisoned each year in January/February by a similar method. The main natural events outlined are the annual patterns of beech seeding and the related population fluctuations of key pests based on non-treatment area results (or trapping in the case of stoats). Note: This report will relate fluctuations in several animal populations to beech seeding. It should be noted that this is an over-simplification. Studies (e.g. Alley et al., 2001) have shown that the flower-fall that precedes seeding provides a significant food source and that this is associated with increased insect populations which may have flow-on effects to mammals and birds. The term also does not take into account variation shown by the three different species of beech tree. 14
18 Figure 4: Timeline of Major Events SEE separate link to pdf of this document. 15
19 4. Results - Pest Control and Monitoring 4.1 BRUSHTAIL POSSUM (TRICHOSURUS VULPECULA) CONTROL AND MONITORING Objectives To reduce possum numbers and hold them continuously at a low level such that: preferred browse species (see 5.5 Plant Monitoring) show increased growth/productivity and further plants re-establish; impacts on invertebrates, particularly land-snails (see 5.2.3) are reduced to a level that is insignificant compared to other mortality factors; impacts on birds through nest predation are reduced to a level that is insignificant compared to other mortality factors (see 5.1 Bird Monitoring ); impacts on other forest biodiversity, e.g. fungi, are reduced to levels that are insignificant compared to other factors (no monitoring of these impacts is currently in place). Performance Targets Result - residual index using trap catch methodology (Warburton 1997) of <2% all years. Outcome see section 5.5 Plant Monitoring. Methods Poisoning Using Philproof Bait Stations In 1996/97 a grid system was set up over the whole block using Philproof bait stations. Stations were spaced every 100m x 100m over the lower parts of the block, at 100m x 150m on the higher areas (above 900m a.s.l.), and at 150m x 150m at the top of the forest (for c450m 3 lines - below the bush-line at c1400m) (Figure 5). 16
20 17
21 In October 1997 all bait stations were pre-fed with non-toxic Waimate RS 5 cereal pellets over 2-3 weeks followed by one feed of toxic 1080, 0.15% W/W lured with cinnamon at 5% with 1000g per station. The 1080 was removed after a two-week period. From December 1997 until July 2000 a regime of poisoning using Talon 20WP TM (active ingredient brodifacoum) was put in place. The amount of bait placed in each station, the frequency of bait replacement and the coverage of different parts of the block were varied, largely in response to bait take and weather. After the initial knockdown of possum numbers with 1080 most of the variation in the Talon regime was a response to rodent activity and is covered in section 4.2. However for the first fill 500g of bait was placed in stations on the northern boundary in direct response to the pattern of take by possums (see results below) and 250g through the rest of the block. More detailed descriptions of the methods used in the poisoning operation, including the weighing of poison into bags by which the bait was applied and the measuring of bait take are available in unpublished Operational Plans. This is also the case for other activities included in this report. Cyanide Operation Using Feratox on Northern Boundary This further control technique was added in November 1998 following continuing results showing a consistently high take of Talon on the northern boundary of the recovery area which indicated re-invasion of the block by possums along this front. A line of 54 Feratox (encapsulated cyanide) stations was established along this boundary with the objective of reducing re-invasion of the recovery area by possums. Each station was loaded with two peanut butter balls with one toxic capsule secreted in each. The peanut butter was initially combined with flour and oats to bulk it up, but this was discontinued as it proved to accelerate mould growth as the cereal absorbed moisture. Approvals were obtained from the Medical Officer of Health, the Department of Conservation, Tasman District Council, and the adjacent landowner. Conditions imposed by the MOH required all stations to be cleared of baits during school and public holiday periods. After adhering to this over the summer break, an amendment was sought and granted where only those stations within 200m of any track needed to be cleared at such times. Cyanide Poisoning and Trapping on Buffers From July 2000 to the present the project has operated without the use of brodifacoum, following the recommendations of a Departmental review. Possum control shifted to the use of pre-feed followed by cyanide poisoning on buffers, ridges to the north and south of the original area (Figure 5). Philproof bait stations were set up as follows: Totara Ridge 24 stations, Pin Cushion 16 stations and Tin Can 15 stations. In September 2000 they were supplied with non-toxic pre-feed for 2 weeks then cyanide paste for three nights and in June 2001 the pattern was repeated with the cyanide left out for an additional two nights. 18
22 Trap-Catch Monitoring Annual monitoring of possum numbers was undertaken in April or May each year in the treatment area and non-treatment site at Lakehead (head of Lake Rotoiti 6km from southern boundary) using the standard method of Warburton (1997) (Version 4.0). This methodology was largely the same as that used in the project since 1997, with the following changes: : Possums caught were released if uninjured and this was the case with all animals caught. The reason for this was that it was considered that possum densities were now so low in the treatment area that removing animals by trapping might have a significant impact on the remaining population. Future monitoring would then be measuring the combined impact of trapping and poisoning, rather than poisoning alone as intended. Traps used were Victor 1 steel-jaw leg-hold (1999 onward) traps instead of the larger, stronger Victor 1.5 traps used previously. With the change in policy to release all trapped animals it was felt the 1 s would ensure fewer injuries. Two of the trap lines at Lakehead (non-treatment area) were also shifted slightly for ease of access and travel : In 1999 the traps were used on raised sets on to ( Scott boards and L brackets) owing to the arrival of several weka in the area (as discussed in Thomson et al., 1996) and this practice has continued : All animals captured were individually marked prior to release with one No.3 tab-end wing band in each ear. 2001: This year possums caught during the monitor in the treatment area were humanely put down. We decided to return to this practice, as in the first years, because possum control had shifted to buffers and animals that had reached the block needed to be removed. Results Kills of Feratox Operation 54 Feratox stations were operational for approximately 10,000 station nights from November 1998 to the end of June (The opportunity for a further 2500 station nights was lost due to permit conditions requiring removal of baits during school holidays.) In this period eight possum kills were recorded (0.0008/trap station night). A further seven baits were removed with no carcass found nearby. Of these seven baits, the toxic capsules of three were recovered from the ground beneath the station, having presumably been discarded by the animal taking the bait. Between 10 October 2000 and 30 June 2001 a further 25 possums were killed, 6 males, 4 females and 15 unknown. 19
23 Kills of Buffer Operation Seven possums were killed in September 2000 (1 juvenile male, 1 juvenile female, 2 adult males, 3 adult females) and 4 in June 2001 (2 juvenile males, 1 adult male, 1 adult female). Take of Toxin The years were characterised by relatively low numbers of possums within the treatment area and increasing numbers of rodents. So whereas in 1997/98 it was possible to attribute most of the take from bait stations to possums and determine a pattern to this, in this was not possible. It is evident though that the pattern of increased take on the northern boundary (Butler 2000) had gone. We plan to spatially represent the toxin take when GIS/GPS/Database information is integrated. Trap-Catch Monitoring The results from 1997 to 2001 are shown on Table 1 and Figure 6. TABLE 1: RESULTS OF POSSUM TRAPPING DATE TRAP NIGHTS NO. OF POSSUMS CAUGHT POSSUMS CAUGHT AS % OF TRAP NIGHTS (± 1 STANDARD ERROR) Treatment Area September 1997 (pre control) ± 0.011% November 1997 (post 1080 control) ± % May 1998 (post Talon maintenance) ± 1.1 % April 1999 (post Talon maintenance) ± 0.8% April 2000 (post Talon maintenance) ± 0.9% April 2001 (post buffer control) ± 0.76% Non Treatment November # ± 0.033% June ± 2.8%% April * 4.67 ± 1.43% April ± 2.8% April ± 5.79 % # Weather only allowed two nights of trapping. * This figure includes only one capture of an individual caught twice. 20
24 FIGURE 6: RNRP POSSUM TRAP CATCH (+- 1 SE) 14.0% 12.0% 10.0% % trap catch 8.0% 6.0% RNRP Lakehead 4.0% 2.0% 0.0% Sep-97 Nov-97 May-98 Apr-99 Apr-00 May-01 Chew Stick Monitoring A further monitoring regime was established in February 2001, placing single wax chewsticks, supplied by Malcolm Thomas of Pest Control Research, at the location of each tracking tunnel used for rodent monitoring (section 4.2)(see Figure 8). The sticks were placed on no. 8 wire stands 40 cm off the ground with a small plate below them to prevent rats climbing up, and set for a single night. No chews attributable to possums were detected. Disturbance of Equipment A further measure of the effectiveness of possum control is the lack of disturbance of project equipment on the block compared to non-treatment areas. During rodent monitoring (section 4.2) up to 45% of tunnels were found disturbed at Rotoroa and 50% at Lakehead compared to 5% in the treatment area (Figure 7). While there is no proof that possums are involved in all cases, the consistent removal of trays to get at the bait or the complete tipping of tunnels is difficult to attribute to any other animals. Hedgehogs, another possible culprit, can be ruled out as they have not been detected at Lakehead or Rotoroa but are encountered often in the project area. All non-treatment area tunnels were changed in June-July 2000 to longer, metal versions that markedly reduced interference. The new length was such that a possum could not reach the peanut butter bait set in the centre of the tunnel. 21
25 FIGURE 7: PERCENTAGE OF TRACKING TUNNELS DISTURBED AT DIFFERENT SITES (N=100 TUNNELS AT RNRP AND ROTOROA, 40 AT LAKEHEAD) % tunnels disturbed Nov-98 Feb-99 May-99 Aug-99 Nov-99 Feb-00 May-00 Date Aug-00 Nov-00 Feb-01 May-01 RNRP Rotoroa Lakehead Non-Target Impacts Post-mortems of stoats, ferrets and feral cats trapped on the block have shown significant numbers of these to have picked up Talon through secondary poisoning (see section 4.3). This is a beneficial impact of the use of this toxin that enhances our ability to control predators. On the negative side, two juvenile kaka found dead have tested positive for brodifacoum and at least in one of the two this is considered the cause of death (section 5.1.2). The toxin has not been implicated in any deaths of adults. Possum Diet in the Area (Cochrane & Buunk, 2000) The contents of 61 possum stomachs obtained in 1997/98 were analysed at Canterbury University. Most (56) of these had already been pre-sorted by an Otago University student studying leaf-veined slugs (Athoracophoridae) (no slugs were found in the sample) so yielded less detailed data as they could not be analysed by layers. The five intact stomachs yielded 19 food types of which the most abundant were unidentified flowers (contributing 28% to overall diet by dry weight), decaying wood (21.3%), Muehlenbeckia sp. (19.2%), bark/wood (14.2%) and Nothofagus fusca (9.2%). Items found in 3 or more of the five were decaying wood, Muehlenbeckia sp., Pseudopanax spp., invertebrates, N. solandri and fungi. The most common items from the 56-stomach sample were N. solandri (71.4% frequency of occurrence), bryophytes/lichen (57.1%) (mostly moss), unidentified leaf stalks (44.6%), grasses (42.9%), unidentified seeds (39.3%), animal hair (37.5%) and Coprosma spp. (30.4%). Twenty-two different species or genera of trees and shrubs were included. Unidentified bird feathers were found in a single stomach in each of the samples. 22
26 These results show broad similarities to those from studies in the Hurunui, Springs Junction (Palmers Road) and South Westland. However some items were heavily used at Rotoiti but rarely recorded at one or more of the others, e.g. Nothofagus spp., bryophytes/lichen, Muehlenbeckia spp., bark & decaying wood and Coprosma spp. All studies showed significant usage of non-foliage items such as flowers, bark, fruit, fungi and invertebrates. Discussion These results represent an ongoing successful control operation that is maintaining possums at low densities in the block, well within our target range. No such reduction to low numbers has occurred at Lakehead. It is interesting to note that the Lakehead index dropped from 8% in 1997/98 to around 5% for 1999/2000 before climbing again. The decline led one to raise the question of whether our control was having an influence on numbers over that distance (c5km). Research in the Hurunui has shown possums to be eating significant amount of beech seed in 2000 and it is tempting to relate an apparent increase in 2001 to the huge masting of the previous year. However there is high variability in the data so no real conclusions can be drawn from it. (Note: our diet sample was taken in when beech seeding was slight, thus seed did not feature as an identified item). The changes in the trap-catch monitoring technique are likely to have had some influence on the comparability of the index from season to season. Thomas & Brown (2001) have shown that more possums may be caught in ground sets than raised sets but they found such differences not to be statistically significant. Any influences would also be expected to be the same in both treatment and non-treatment areas so would not alter the overall conclusions. The picture at Rotoiti is not quite as clear-cut as portrayed with a treatment area and a non-treatment area 6km away. A small-scale possum control operation using toxins and traps has been in operation at several sites close to the shore of the lake since 1992 with the aim of protecting the rata growing there. One such site is between the treatment and non-treatment areas. While the scale of the operation is tiny compared to the recovery project it has killed a number of possums, thus contributing to the gains seen but also probably reducing numbers in the non-treatment area slightly. An interesting result of this work was that possums were apparently present in much higher densities close to the lake shore indexes from 18-44% on non-treatment lines on both sides of the lake in The diet results suggest that our current vegetation monitoring (section 5.5) will only be partially successful at measuring the impacts of possums in the area and the outcomes of their control. Some plants that feature in our species-specific or FBI monitoring do show up in the diet: Aristotelia serrata (wineberry), Pseudopanax spp., Metrosideros sp., Podocarpus sp. (if totara), Griselinia littoralis (broadleaf), but others do not: Elaeocarpus hookerianus (pokaka), Libocedrus bidwillii (cedar), Fuchsia excorticata (fuchsia), Peraxilla sp & Alepis flavida (mistletoes). Non-foliage items which made up a major part of the diet are not monitored and most would prove very difficult to quantify. Our approach is still robust if the plants we are monitoring are the preferred items and thus the most sensitive to an increase in possum numbers. It is interesting in this respect to look at fuchsia and wineberry, the two most frequent diet items in South Westland (Owen & Norton, 1995). Both are currently quite rare in the project area, particularly 23
27 wineberry, yet this made up 4.5% of the diet in the smaller sample (from one stomach). As their numbers recover, which appears to be starting to happen, one would expect them to feature more in future stomach samples. If this does not occur then the value of monitoring these species could be questioned. Low possum numbers have allowed us to move away from using the bait station operation for possum control into working in buffer zones. We will need to keep a check on activity within the original treatment area and the use of a trained dog has been suggested as one way of doing this. There are plans for Animal Health Board operations against possums over the coming two years in forests to the north and east of the block. This should further reduce re-invasion pressure. We are some way from being able to determine what level of possum control, i.e. what trap catch or chew stick indices, we need to aim for to obtain specific vegetation responses. However there are indications from our vegetation monitoring that numbers of possums are currently low enough to bring about the desired improvements in the condition and numbers of browse-sensitive species. Thus a 1 to 2% trap-catch rate remains an appropriate target to work to. 4.2 RODENT CONTROL & MONITORING Ship Rats (Rattus rattus) Objectives To reduce rat numbers to levels at which: predation of nesting birds (see 5.1 bird monitoring) predation of ground dwelling invertebrates inhibition of plant regeneration (through eating of fruit, seed) is insignificant alongside other mortality factors affecting these groups. To monitor the interaction between rats, mice and their predators to aid control of all species in future years. To investigate the role of rats in secondary poisoning by linking to ongoing research on this issue Performance Target Post-control tracking tunnel or trap-catch index of 5% maintained throughout. Methods Control Control was undertaken in by poisoning with brodifacoum (Talon) in the bait stations also targeting possums. Following the Departmental review of the use of brodifacoum and a detailed analysis of all available alternatives a switch was made to trapping in July
28 Poisoning with Brodifacoum Which stations were loaded with bait and the amount placed in them was varied in response to possum and rodent activity. From July to November 1998 when rodent activity was low, bait was placed on the northern boundary (directed at managing possum re-invasion) and on strips four bait stations (400m) wide around the two northernmost rodent tracking tunnel lines ( Snail, Loop )(Figure 8). Comparing the rodent indices on the two tracking tunnel lines in the poisoned strip with those outside was used to determine when poisoning of the full block should occur. This began in December Bait quantities were varied between g on the boundary and g in the remainder of the block. Targeted Trapping A single Victor Professional rat trap was placed at each of the Philproof bait station locations. Each trap was placed inside a tunnel constructed of coreflute with a plywood base and weld-mesh end and an entrance of approximately 35 x 35 mm. Tunnels alternated between black and white coreflute to test if rats showed preference for either colour. Traps were opened across the block between 16th August and 1st September with the last of the Talon removed on 24th August. Checking was either weekly or fortnightly. Non-Targeted Trapping Significant numbers of rats were caught in Fenn traps set for stoats (section 4.3) Monitoring Monitoring was carried out using tracking tunnels set according to standard protocols (King et al., 1994) on the five lines established in 1997/98 in the treatment and Rotoroa non-treatment areas and later on additional lines (see below) (Figure 8). The frequency of monitoring was increased to monthly in the treatment area, from quarterly in the first year, in response to beech seeding (section 5.5.7). Two further lines were established in February 1999 in the sub-alpine zone (to the top of the ridge) in the treatment area, to investigate rodent activity in response to the heaving seeding of tussock grasses there. A final two new lines were set up in May 1999 at the Lakehead non-treatment site and monitored monthly on the same night as the treatment area. Snap-trapping was also undertaken on two lines within the project area (Figure 8), as used in 1997/98 (Butler 2000), and on Landcare Research s transect on Mt Misery. The protocol was of paired mouse and rat traps under a tunnel baited with rolled oats and peanut butter set for three fine nights. This monitoring had two purposes: firstly to allow calibration between the two techniques of snap trapping and tracking tunnels and secondly to allow comparisons with the long data set from Mt Misery based on snap trapping (Wilson et al., 1998). 25
29 26
30 27
31 Results Toxin Take It is not possible to separate the take of Talon by rats from that by mice and possums. Data has been collected on the presence of rat droppings in bait stations which could be analysed to look for any spatial pattern. Kill Trapping A total of 2212 rats were trapped on the grid in 2000/01. They showed no significant preference for tunnel colour, 1148 (51.9%) caught under black tunnels and 1064 (48.1%) under white. A plot of cumulative captures (Figure 9) shows a steady increase over time. Over 4000 mice were trapped over the same time (section 4.2.2). FIGURE 9: CUMULATIVE CAPTURES OF RATS AT ROTOITI Cumulative captures Trap days The tracking tunnel monitoring results are set out in Table 2 and Figures 10 to 14 and the snap-trapping results on Figure
32 TABLE 2: RAT TRACKING TUNNEL INDICES (FIGURES AS % OF TUNNELS TRACKED, N = MAXIMUM OF TUNNELS SURVEYED) SITE SITE MONTH RNRP N=100 LAKEHEAD N=40 ROTOROA N=100 MONTH RNRP N=100 LAKEHEAD N=40 ROTOROA N=100 May-98 0 Jan Aug-98 0 Feb Sep-98 0 Mar Nov Apr Dec-98 0 May Jan-99 0 Jul Feb Aug Mar-99 7 Sep Apr-99 0 Oct May Nov Jun Dec Jul Jan Aug Feb Sep Mar Oct Apr Nov May * 92.5 Dec Jun Aug Sep *Counts on lower two lines only due to snow. Note: The May 1999 Lakehead figure is considered unreliable and an underestimate as the tunnels had only been out for 1 night before tracking occurred so the rats would not have been used to them. An interval of several weeks between placing of tunnels and running them was the norm. 29
33 FIGURE 10: MONTHLY INDICES OF RAT ABUNDANCE RNRP, LAKEHEAD AND ROTOROA % of tunnels tracked RNRP Lakehead Rotoroa 20 0 May-98 Aug-98 Nov-98 Feb-99 May-99 Aug-99 Nov-99 Feb-00 Month May-00 Aug-00 Nov-00 Feb-01 May-01 Aug-01 FIGURE 11: QUARTERLY RAT TRACKING TUNNEL INDICES 120 % of tunnels tracked Nov-98 Feb-99 May-99 Aug-99 Nov-99 Feb-00 May-00 Month Aug-00 Nov-00 Feb-01 May-01 Aug-01 RNRP Lakehead Rotoroa The two tracking tunnel lines at Lakehead cover only lower altitudes (below 800m asl) whereas some of those at the other two sites extend almost to bush-line. Figures 12 and 13 address this issue by comparing tunnels within two altitudinal ranges below and above 800m asl. Figure 14 compares the results for the different ranges within the one site, Rotoroa. 30
34 FIGURE 12: QUARTERLY INDICES OF RAT ABUNDANCE BELOW 800M ASL 100 % of tunnels tracked RNRP Lakehead Rotoroa 0 Feb-99 May-99 Aug-99 Nov-99 Feb-00 May-00 Aug-00 Nov-00 Feb-01 May-01 Date FIGURE 13: QUARTERLY INDICES OF RAT ABUNDANCE ABOVE 800M ASL 100 % of tunnels tracked RNRP Rotoroa 0 Feb-99 May-99 Aug-99 Nov-99 Feb-00 May-00 Aug-00 Nov-00 Feb-01 May-01 Date 31
35 FIGURE 14: QUARTERLY RAT INDICES AT ROTOROA BY ALTITUDE 100 % of tunnels tracked above 800m below 800m 0 Feb- 99 May- 99 Aug- 99 Nov- 99 Feb- 00 May- 00 Aug- 00 Nov- 00 Feb- 01 May- 01 Date For the August/September and November 1998 monitors at the treatment site, Talon was limited to areas around two of the tracking tunnel lines, so 3 of the 5 lines measure activity in an area without poison. Breaking down the figures for these monitors at this site gives: DATE TALON PRESENT TALON ABSENT RAT INDEX (%) TUNNEL NIGHTS RAT INDEX (%) TUNNEL NIGHTS 31 Aug 1 Sept Nov Rats were not recorded in tunnels set in tussock above bushline. Figure 16 presents the Mt Misery snap-trapping results alongside those obtained using the same technique by Landcare Research since 1975 (note: gaps in the plot show seasons when no trapping was done not zero captures, e.g. no trapping in 1985, , ). 32
36 FIGURE 16: RAT SNAP-TRAPPING INDICES, MT MISERY Feb-75 Feb-77 Feb-79 Feb-81 Feb-83 Feb-85 Feb-87 Feb-89 Feb-91 Feb-93 Feb-95 Feb-97 Feb-99 Captures/100 trap-nights Feb-01 Month Comparisons of tracking tunnel and snap-trapping indices (Figure 17) shows a positive correlation between the two though the relationship is weak (R 2 =0.38). FIGURE 17: RAT TRACKING RATE VS TRAPPING RATE IN THE RNRP AND AT LAKE ROTOROA/MT MISERY (COMBINED) 9 8 Trapping rate (C/100TN) y = x R 2 = Tracking rate (% tunnels tracked) Incidental data on rat numbers and activity is also available through their capture as nontargets during Fenn trapping aimed at stoats (Figure 18). 33
37 FIGURE 18: MONTHLY CAPTURES OF RATS IN FENN TRAPS No. trapped Jul- 98 Sep- 98 Nov- 98 Jan- 99 Mar- 99 May- 99 Jul- 99 Sep- 99 Nov- 99 Jan- 00 Mar- 00 May- 00 Jul- 00 Sep- 00 Nov- 00 Jan- 01 Mar- 01 May- 01 Month The monthly captures are not corrected for trap nights. Dates used are not dates of capture but dates of checking i.e. figures from a weekly check done on 2 May will appear in May though in theory the majority would have been caught in April. The overall pattern of captures would be similar to that shown but some figures would shift from one month to the previous in most cases. Total number of traps generally available was 298. Full trap network was not established till December 1998 so captures before that are based on fewer traps. Fewer traps of the completed network were available to catch rats in later seasons as stoat captures increased (see section 4.3). Brodifacoum residues in rats The livers of 71 rats trapped in the area in 1999/2000 and 2000/01 years have been analysed for brodifacoum residues as part of a study by Landcare Research. Lincoln. Of a sample of 41 caught in Fenn traps while brodifacoum was in use, 29 (71%) carried traces of the toxin and 10 of these had over 1ppm in their liver samples. A further 30 animals caught in snap traps after brodifacoum use ceased were also tested (prior to 30 June 2001) and 15 (50%) of these had detectable levels of the toxin though only one had more than 1ppm (E. Spurr pers. comm.). Discussion 1. Impact of control on rat numbers The period reported on covered two seasons using brodifacoum for rat control followed by one season using trapping. It was also marked by dramatic fluctuations in the natural numbers of rats associated with beech seeding (section 5.5.7). Interpretation of the results and in particular any comparison of the relative effectiveness of the two control techniques is thus difficult. 34
38 Tracking tunnel indices from Lakehead and Rotoroa (Figures 10 & 11) provide an indication of the fluctuations of rat numbers in un-treated sites. Both show increased rat activity from 1999 reaching a peak in 2000 though this occurred much earlier at Lakehead. This could perhaps be explained by the fact that the lines at Lakehead cover lower altitudes only whereas at Rotoroa they extend close to bush-line (Figure 8). However the same pattern is shown if the results are analysed for lower (below 800m asl) and upper (above 800m asl) altitudinal ranges separately (Figures 12 & 13). There is a suggestion that rat numbers did increase faster at lower levels at Rotoroa than at higher ones (Figure 14) but this was still at least seven months later than the increase at Lakehead. The likely explanation for the differences between Lakehead and Rotoroa is the habitat differences between the two (described in section 5.5.1), in particular the presence of a silver beech-red beech-matai/five-finger type forest at Rotoroa not found at Lakehead. The large number of podocarps within this habitat means that the food supply for rats will show a different pattern less dominated by beech seeding. The habitats at Lakehead and the treatment area are more similar, both lacking this podocarp element. So the best indication of the effectiveness of the project s rodent control will come from comparing the Lakehead results with those from the lower tunnels (below 800m asl) in the treatment area. The overall non-treatment area pattern begins with low rat activity in 1998, a year of little seedfall. In 1999 activity increased dramatically at Lakehead following significant beech seedfall and was maintained at high levels through winter/spring 2000 after the very heavy seedfall that autumn. In contrast only the 2000 seedfall resulted in a significant increase of activity at Rotoroa. By the 2001 winter activity had dropped to low levels at both sites in the absence of any seeding that autumn. Between May 1998 and May 1999 rat activity in the treatment area (RNRP, figures 10 & 11) remained low, as it did at Rotoroa. (Monitoring at the Lakehead site commenced later after concerns about the differences between the treatment area and Rotoroa). There is evidence that brodifacoum was exerting some slight control over rats from the monitor of November The two lines running through areas with the toxin present recorded no rats whereas one of the three lines elsewhere recorded two tracks from 19 tunnels or a 10.5% index. During the next eleven months, May 1999 to April 2000, rat numbers remained below our 5% target level in the treatment area but increased dramatically at Lakehead. This difference is considered to be a very successful outcome of the poisoning regime with brodifacoum. An increase level of rat activity was seen in the treatment area over the period from May to August 2000 which marked the end of the brodifacoum regime before trapping became fully operational on 1 st September. There seem two possible explanations for this. One is that the brodifacoum regime was relaxed slightly at the end while the field effort was re-directed into establishing the rat traps. There is only very slight evidence for this as the final baits were left out for 81 days (6 th June to 24 th August) when the average had been 67 days. However the previous baiting period which covered May, when the rat index first increased above the 5% target level, was a more typical 69 days (28 th March to 6 th June). Also in neither period were many stations emptied of bait so this appeared not to be a limiting factor. The more likely explanation is that the poisoning regime was simply unable to counteract the increase in rat activity associated with the very beech 35
39 heavy seeding that autumn. Faced with this super-abundance of natural food it seems likely that rats showed less interest in the baits. Using our tunnel tracking indices alone does suggest that trapping was a less effective rat control measure than brodifacoum. From June 1999 to June 2001 rat activity appears almost uniformly high at Lakehead. From June 1999 to August 2000 with brodifacoum it remained low in the treatment area (maximum 11% - monthly average 2.8%) whereas from September 2000 to June 2001 with trapping it was much higher (maximum 41% - monthly average 24.9%). (Breaking the results down to consider only tunnels located below 800m asl in the treatment area, to be more comparable to Lakehead as discussed above, hardly changes the figures at all: June 1999 to August 2000 max. 10%, av. 3.2%, September 2000 to June 2001 max. 42.5%, av. 23.1%). However there is strong evidence that rat numbers in non-treatment areas were significantly higher in 2000/2001 than in 1999/2000 even though this is not shown by the Lakehead tracking index. Firstly there is the pattern at Rotoroa (Figures 10 & 11) where indices were markedly higher in the second year. Secondly, the monthly by-catch of rats in Fenn traps was about an order of magnitude higher in 2000/01 than 1999/2000 (Figure 18). Thirdly there was huge media coverage of a plague of rats in beech forests in the region in 2000/01, seen as road kills and incursions into barns and dwellings, not reported in 1999/2000. The two seasons are thus not comparable and it is not possible to say whether brodifacoum would have been any more successful than trapping at keeping rat numbers down in the boom year of 2000/01. The beech seedfall in 2000 was the highest since records began at Mt Misery (section 5.5.7). Media coverage of rat plagues similar to that in 2000/01 was last seen in 1972/73 when casual observations suggested another massive seedfall. So the conditions seen in 2000/01 had not been recorded for about 30 years. Our trapping clearly did keep rat activity well below the levels seen in both non-treatment areas (Figures 10 & 11) although it was well above our 5% tracking index target. A better assessment of the relative effectiveness of trapping will be possible once it is run over years with less extreme seedfall and we can judge whether it can also maintain rats below the target in the way brodifacoum did. During the time of peak rat activity it was clear that the frequency with which the traps were emptied was a limiting factor. A brief trial was run in November 2000 as rat numbers increased dramatically, to assess the benefits of checking the traps more frequently. In October traps in the lower part of the block, which equates well with the area sampled by the two lower tracking tunnel lines ( Loop and Rata ), were checked weekly. Then in November this same area was checked up to three days a week and the Loop block within it (sampled by the Loop tracking tunnel line) up to daily. The result was that the tracking index dropped quite sharply over one week (7 to 15 November) (Table 3), at a time when it would have been expected to increase, but returned almost to previous levels in early December once checking was reduced again. 36
40 TABLE 3: EFFECT OF INCREASED CHECKING OF RAT TRAPS ON TRACKING TUNNEL INDICES TRAP CHECKING WEEK BEGINNING 30 OCT 6 NOV 13 NOV 20 NOV 27 NOV 4 DEC No. of checks in lower block outside Loop No. of checks in Loop TRACKING TUNNEL INDEX DATE 2 NOV 7 NOV 15 NOV 6 DEC Index on Rata & Loop 38.5% 32.5% 13.2% 27.0% Index on Loop 30% 20% 16.7% 29.4% Quarterly snap-trap monitoring was re-started on Mt Misery in March 2000 (Figure 16) after a gap of several years since Landcare Research s study finished, in an effort to place the events of 2000/2001 in a historical context. It can be seen that rat captures reached very high levels in the 2001 summer but they were exceeded by those in November 1995 another year of heavy seeding (section 5.5.7). 2. Outcomes of rat control The key outcome measure for rat control was the nesting success of robins (section 5.1.3). During the 1998/99 and 1999/2000 breeding seasons (October February) the rat tracking index remained below 5% in the treatment area and robin nesting success was very high (over 90% section 5.1.3). In the 2000/01 season the differences between rat activity in the treatment area and Rotoroa, resulting from trapping, were sufficient to show corresponding differences in robin nesting success (Table 28 in section 5.1.3). Our results using brodifacoum thus tend to confirm those of other studies, that a poisoning regime based on a 100 x100m grid or 100x150m grid can control rats, and that keeping them below a 5% tracking index allows significantly increased productivity of some birds. 3. Impact of the trapping regime The steadily increasing cumulative plot of rat captures (Figure 9) suggests that trapping was continually cropping the population rather than knocking it down and then showing the effects of re-invasion. The trials done in November 2000 suggested that a population knock-down was possible if sufficient effort was put in, i.e. daily checking at a time of high rat numbers, but this was not sustainable with the resources available. Further data analysis is needed to assess the extent to which captures of mice (following section) reduced the availability of traps to rats. If this was a major factor then there may be options to prevent mice having access, e.g. by raising the traps off the ground. 37
41 4. Changes in the altitudinal range of rats The previous studies at Mt Misery found rats to be absent above c1025m in altitude (R.H. Taylor, unpubl. data). However this was clearly not the case in the boom season of 2000/01. Rats were caught right up to the top trapping line just below the bush edge during the peak of the irruption (Dec. 00 Feb. 01), at an altitude of about 1400m. One animal was recorded in tracking tunnels set in the sub-alpine area in November 2000 at an altitude of c1500m. Several were caught in Fenn traps on the line right along the top of the range at c1750m. The presence of rats at higher altitudes or new sites was a widespread phenomenon this season and it lead to catastrophic losses of mohua (yellowheads) (Mohoua ochrocephala) at several sites (P. Gaze, P. Dilks unpubl. reports). 5. Monitoring Techniques A comparison between the Fenn trapping results (Figure 18) and tracking indices (Figures 10 & 11) indicates the relatively lack of sensitivity of the latter monitoring protocol at high densities. Tracking indices were at a similar level in the 1999 and 2000 spring/summer periods, yet trapping suggests that rat numbers may be have been an order of magnitude higher during the latter. The calibration of tracking tunnels and snap-trapping (Figure 17) suggests that the relationship between the two is not as precise as hoped. In particular there was significant variation in snap-trap captures for high tracking tunnel rates from almost zero to over 7 captures/100 trap-nights. Previous research has provided a calibration of rat density against tracking tunnels in a grid layout (Brown et al., 1996) but research is still required on how these tunnels and snap-traps along a line relate to true densities in beech forest. (See similar discussion in mouse section below) Mice (Mus musculus) Objectives To reduce mouse numbers to consistently low levels to reduce their impact on invertebrates and native plants (seed predation) To prevent the dramatic increases in number associated with beech mast years A further and possibly conflicting objective under consideration, while brodifacoum was in use, was to maintain mice in the area in sufficient numbers and carrying sufficient dosage of poison to control mustelids and feral cats through secondary poisoning. Performance Target We set no target in the first year of pest control (1997/98) as there were no other studies to base one on. This situation has not changed, however we did enter the 1998/99 season with an arbitrary figure of 10% under discussion based on the following: we expected mouse numbers to increase in response to the seeding of beech that occurred in the 1998 autumn, i.e. they would be unlikely to remain below a 5% index as they had done through 1997/98; 38
42 though little is known of the impacts of mice we considered a higher target than for rats to be appropriate, because mice are generally preying on lower trophic levels (e.g. invertebrates rather than birds) which have a greater productivity and thus can tolerate more predation. Our results soon showed such a target was not achievable. Methods Control was initially undertaken alongside that of possums and rats with the bait station operation using brodifacoum, with sticks placed to provide mice with access to stations. From July 2000, mice were not targeted for any control but were caught as a significant by-catch during rat trapping. Monitoring was carried out through a combination of snaptrapping and tracking tunnels as for rats. Results Toxin take It is not possible to separate the take of Talon by mice from that by rats and possums. Data has been collected on the presence of mouse droppings in bait stations which could be analysed to look for any spatial pattern. By-catch in rat trapping A total of 4145 mice were caught on the grid in 2000/01. They showed no significant preference for tunnel colour, 2020 (48.7%) being caught under white tunnels and 2125 (51.3%) under black. A plot of cumulative captures (Figure 19) indicates that the rate of capture was slowing down steadily over the period. Table 4 and Figures 20 to 24 present the mouse tracking tunnel results and Figure 25 the snap-trapping results. FIGURE 19: CUMULATIVE CAPTURES OF MICE AT ROTOITI Cumulative captures Trap days
43 TABLE 4: MOUSE TRACKING TUNNEL INDICES. (FIGURES AS % OF TUNNELS TRACKED. N = MAXIMUM NUMBER OF TUNNELS SURVEYED) SITE SITE MONTH RNRP FOREST n=100 RNRP TUSSOCK n=40 LAKEHEAD n=40 ROTOROA n=100 MONTH RNRP FOREST n=100 RNRP TUSSOCK n=40 May-98 5 Jan LAKEHEAD n=40 ROTOROA n=100 Aug-98 0 Feb Sep-98 4 Mar Nov Apr Dec-98 8 May Jan-99 5 Jul Feb Aug Mar Sep Apr Oct May Nov Jun Dec Jul Jan Aug Feb Sep Mar Oct Apr Nov May * 5 Dec Jun Aug Sep-01 0 *Counts on lower two lines only due to snow. Note: The May 1999 Lakehead figure is considered unreliable and an underestimate as the tunnels had only been out for 1 night before tracking occurred so the mice would not have been used to them. An interval of several weeks between placing of tunnels and running them was the norm. For the August/September and November 1998 monitors at the treatment site, Talon was limited to areas around two of the tracking tunnel lines, so 3 of the 5 lines measure activity in an area without poison. Breaking down the figures for these monitors at this site gives: 40
44 DATE TALON PRESENT TALON ABSENT MOUSE INDEX (%) TUNNEL NIGHTS MOUSE INDEX (%) TUNNEL NIGHTS 31 August 1 Sept Nov FIGURE 20: MONTHLY INDICES OF MOUSE ABUNDANCE RNRP, LAKEHEAD AND ROTOROA % of tunnels tracked RNRP Lakehead Rotoroa May-98 Sep-98 Jan-99 May-99 Sep-99 Jan-00 Month May-00 Sep-00 Jan-01 May-01 Sep-01 FIGURE 21: QUARTERLY MOUSE TRACKING TUNNEL INDICES % of tunnels tracked Nov-98 Feb-99 May-99 Aug-99 Nov-99 Feb-00 May-00 Month Aug-00 Nov-00 Feb-01 May-01 Aug-01 RNRP Lakehead Rotoroa 41
45 The monitoring lines above tree line indicate the expected response of mice to the heavy seeding of tussocks there that coincided with the beech mast (Figure 22). No bait stations or rodent traps are present in this habitat. FIGURE 22: MONTHLY INDICES OF MOUSE ABUNDANCE RNRP AND TUSSOCK % of tunnels tracked RNRP Tussock 0 May-98 Sep-98 Jan-99 May-99 Sep-99 Jan-00 May-00 Sep-00 Jan-01 May-01 Month Tracking tunnel results were broken down into tunnels above and below 800m (Figures 23 and 24) to facilitate more direct comparisons of similar habitats as done for rats. FIGURE 23: QUARTERLY INDICES OF MOUSE ABUNDANCE BELOW 800M ASL % of tunnels tracked RNRP Lakehead Rotoroa 10 0 Feb-99 May-99 Aug-99 Nov-99 Feb-00 May-00 Aug-00 Nov-00 Feb-01 May-01 Date 42
46 FIGURE 24: QUARTERLY INDICES OF MOUSE ABUNDANCE ABOVE 800M ASL 100 % of tunnels tracked RNRP Rotoroa 0 Feb-99 May-99 Aug-99 Nov-99 Feb-00 May-00 Aug-00 Nov-00 Feb-01 May-01 Date FIGURE 25: MOUSE SNAP-TRAPPING INDICES RNRP AND MT MISERY Captures/100 trap-nights Mt Misery RNRP Aug-99 Nov-99 Feb-00 May-00 Aug-00 Nov-00 Feb-01 Month 43
47 Comparison of the Misery Mt snap-trapping results with those from Landcare Research s data set (Figure 26) shows the 2000/01 year to have been an exceptional one for mouse activity. (Note: Gaps in plot are seasons with no trapping not zero captures, e.g ). FIGURE 26: MOUSE SNAP-TRAPPING INDICES, MT MISERY Captures/100 trap-nights Feb-74 Feb-76 Feb-78 Feb-80 Feb-82 Feb-84 Feb-86 Feb-88 Feb-90 Feb-92 Feb-94 Feb-96 Feb-98 Feb-00 Month Comparisons of tracking tunnel and snap-trapping indices (Figure 27) shows a positive correlation between the two with a stronger correlation (R 2 =0.68 compared to 0.38) than shown in the case of rats. FIGURE 27: MOUSE TRACKING VS TRAPPING RATE IN THE RNRP & ROTOROA/MT MISERY (COMBINED) Trapping rate (C/100TN) y = 0.391x R 2 = Tracking rate (% tunnels tracked) 44
48 Brodifacoum residues in mice The livers of 20 mice caught in the area in 1999/2000 and 2000/01 as part of the snap-trap monitoring have been analysed for brodifacoum residues as part of a study by Landcare Research. Lincoln. Exactly half had detectable levels of the toxin with an average of.49 ppm and a maximum of 4.57 ppm. A further 11 animals caught in snap traps after brodifacoum use ceased were also tested, 8 of 9 caught in the following 3 months containing the toxin, but neither of the two caught from 4 to 6 months after use recorded detectable levels (E. Spurr, pers. comm.). Mouse control research The project commissioned Ecosystems Research to conduct a study to determine the effectiveness of bait station grids of different spacing to control mice using brodifacoum (Ecosystems Consultants, 2000). During spring 1999, project staff set up two 200 x 200m replicates of five different grids with bait stations spaced as follows: 100 x 100m, 100 x 50m, 50 x 50m, 50 x 25m, and 25 x 25m. Grids were at least 250m apart and the replicates at least 300m apart running one above the other parallel to the shore of Lake Rotoiti. Tracking tunnel monitoring lines were established running through each grid and the intervening forest. 250g of Talon bait was applied to the grids, the first replicate on 1 September and the second on 20 September and stations kept generally full of bait until 8 October. The results were largely the same for both replicates. A clear relationship was established between mouse tracking rates after poisoning and bait station density. Post-poisoning rates varied from c90% on the 100 x 100 grids (which equate to 2.25 stations per hectare) to c.45% on the 25 x 25m grids (20.25 stations/ha). Extrapolating these figures suggested that to reduce mice to a 10% tracking index would require a station density of 39 per hectare or a 20 x 20m grid. Mouse diet research The invertebrate component of mouse diet in the treatment area was studied under a contract by Landcare Research using the stomach contents of animals caught in snap-traps (Watts, 2001). Overall, invertebrate remains were found in 90% of stomachs (Table 5) with the main groups being caterpillars (73.3% occurrence), spiders (67%), beetles (67%) and weta (including eggs) (20%). FOOD CATEGORY % OCCURRENCE (N=30) Invertebrates 90.0 Plant Material 77.0 Bait 93.0 Poison 17.0 Other (eg. fur)
49 Discussion 1. Impact of control on mouse numbers Mouse activity was low at all sites up to the autumn of 1999, at which point the population increased in response to beech seeding in an almost identical fashion in the treatment area and at Rotoroa (Figures 17 & 18). Clearly the poisoning regime was unable to prevent this increase within the RNRP and the nominal target of a 10% tracking index was exceeded almost immediately reaching a peak index of 83% in October Activity fell away at both sites in the summer of 2000 but then increased rapidly that autumn in response to the very heavy beech seeding, the index in the RNRP reaching a peak of 92.5% in May High activity was sustained in the RNRP through the summer and autumn of 2001, unlike the previous year, despite the absence of any significant beech seeding during the latter season, and only fell away sharply in August Clearly, snaptrapping targeted at rats was unable to prevent an increase in mice activity. The picture at Lakehead where monitoring only began in May 1999 was very similar to that of the RNRP in 1999/2000, though at reduced levels of activity, but quite different in 2000/01 when no increase of activity occurred. These patterns raise many questions. Considering the effectiveness of the poisoning regime first, it is apparent that some depression in activity did result by looking at the results when only part of the area was treated. No mice were recorded where brodifacoum was present but indices on the other lines were 7 and 9% in August and November However no apparently significant control was exerted in 1999 and research showed that bait station spacing was probably a major influence on this. Our grid of 100 x 100m or 100 x 150m spacing was clearly far removed from the 20 x 20m that appeared to be necessary to maintain a tracking tunnel index of 10% in September/October 1999 when the research was undertaken. Thus when mice were at high population densities the home ranges of some would have been small enough that they never encountered a station. A compounding factor may have been that mice faced with abundant beech seed might have shown a preference for this over the baits analysis of bait take and further examination of stomach contents may help examining this question. In 2000/01 we were not aiming to control mice and as expected the by-catch in the traps set for rats was insufficient to have any detectable effect on mouse activity that season. The issue of mouse control is a key one for the project in the future. The lack of detailed knowledge of the impacts of mice in beech forests means that the need for such control is not immediately clear. However in years of high numbers mice must be dramatically altering the flow of energy through the system, removing food (insects and plant matter) that would have otherwise perhaps been eaten by insectivores or herbivores and making it available to detritivores through their droppings and carcasses. Such altered flows are not part of the natural beech forest ecosystem and thus reversing them could be a logical aim of restoration. For control to be worthwhile three elements should be in place: 1. an effective control technique; 2. a means of monitoring mouse numbers (result monitoring); 3. a means of measuring the benefits of mouse control (outcome monitoring). 46
50 Currently we are lacking the first and third (ground invertebrates are recognised as one key group for the latter but distinguishing the impacts of mice and rats a problem) and there are some doubts about the second (see later monitoring techniques discussion). The project is thus a strong advocate for more research to address these elements. 2. Variation between years and sites Two key questions were identified in the previous discussion. Firstly, why was high mouse activity sustained right through the autumn/winter in 2000/01 but not in 1999/2000? Understanding such a question may be important for future management. There seem to be several possible explanations. Firstly, the amount of beech flower/seed that fell was significantly higher in the second and may directly, or indirectly through invertebrates, have provided an abundance of food over the longer period. Secondly, the 2000/01 winter was milder than the 1999/2000 one (see plot of average daily minimum temperatures in Appendix 3). Thirdly the rodent control technique in place was different, brodifacoum in the first season and rat traps in the second, which may have markedly affected mortality. A longer time sequence of mouse activity, beech seeding and climate data is likely to be the only way that this question will be resolved. Secondly, why was the Lakehead pattern so different from that at the other two sites with mouse activity markedly suppressed there in 2000/01 (Figures 21 & 22)? Breaking the data into comparable altitudes below 800m asl (Figure 23) serves only to confirm this pattern. One explanation is based on the interaction between mice and rats which is discussed in detail below (section ). 3. Monitoring techniques The relationship between snap-trapping and tracking tunnel indices was quite strong for mice (Figure 27) suggesting that results obtained from one can be compared with results from the other with some confidence using the line of best fit as a rough correction factor. This correspondence between the two makes it more likely that they are measuring the same thing which we hope to be mouse abundance. Research in Fiordland using small grids (160m2) has shown however that tracking tunnel indices were not good indicators of mouse density, whereas one-night or three-night (as here) trap captures were (Ruscoe et al. 2001). This work needs to be extended to larger areas to determine if this conclusion is still valid and the Department has decided that tracking tunnels will continue to be its main rodent monitoring tool until that happens (C. Gillies, pers. comm.). The project has also put forward more work on relating indices to actual densities as one of its ongoing research needs Relationship between rat and mouse numbers Comparison of rat and mouse indices at the same sites (RNRP Figure 28) (Lakehead Figure 29) suggests a possible inverse relationship between them, i.e. the higher the rat activity the lower the mouse. In the RNRP there was generally high mouse activity and low rat activity whereas the reverse was the case at Lakehead. At Rotoroa (Figure 30) the effect is not so clear with some evidence of a switch over from higher levels of mice and low rats in March-July 1999 and the opposite in March-July 2000, but then mice increasing to high levels in November 2000 in the presence of high rat activity. If there is indeed an inverse relationship it could be explained by a direct effect of rats preying on mice and controlling their numbers or a result of competition for food. It is also possible that it was 47
51 partly an artefact of monitoring, with rats tending to exclude mice from the tracking tunnels or removing the baits rendering the tunnels less attractive to enter. An alternative explanation for the different patterns between RNRP and Lakehead is that lower numbers of stoats in the former resulted in fewer mice being eaten there (D. Kelly, pers. comm.). Research currently being conducted by Landcare Research may help separate these effects (W. Ruscoe, pers. comm.). FIGURE 28: MONTHLY INDICES OF RAT AND MOUSE ABUNDANCE - RNRP % of tunnels tracked Mice Rat 10 0 May-98 Aug-98 Nov-98 Feb-99 May-99 Aug-99 Nov-99 Feb-00 Month May-00 Aug-00 Nov-00 Feb-01 May-01 FIGURE 29: MONTHLY INDICES OF RAT AND MOUSE ABUNDANCE - LAKEHEAD % of tunnels tracked Mice Rat 20 0 Jun-99 Aug-99 Oct-99 Dec-99 Feb-00 Apr-00 Jun-00 Month Aug-00 Oct-00 Dec-00 Feb-01 Apr-01 Jun-01 48
52 FIGURE 30: QUARTERLY INDICES OF RAT AND MOUSE ABUNDANCE - ROTOROA % of tunnels tracked Mice Rat 0 Nov-98 Feb-99 May-99 Aug-99 Nov-99 Feb-00 May-00 Aug-00 Nov-00 Feb-01 Month 4.3 MUSTELID (STOAT MUSTELA ERMINEA, FERRET MUSTELA FURO, WEASEL MUSTELA NIVALIS) CONTROL AND MONITORING Objective To reduce mustelid numbers to a sufficiently low level that they have minimal negative impacts on the breeding success of resident birds (particularly kaka) and on bats, and that would allow the re-introduction of other species vulnerable to mustelid predation (e.g. yellowhead, mohua, kiwi). A further objective could be to maintain mustelid numbers at a level that would allow native fauna to recover to the density in this area that would have been present before the introduction of these mammals to New Zealand. However achievement of this objective is hard to measure as we have no way of determining those densities. Mustelid-free offshore islands could provide an indication but none of similar habitat is thought to exist. Performance Target No targets in terms of mustelid numbers could be determined initially without an independent monitoring system. The main measure used to judge the effectiveness of control was the breeding success of kaka (section 5.1.2). Methods Control A system of single Mark VI Fenn traps set in single entry/exit tunnels established in 1997/98 (Figure 31) was maintained throughout Traps were checked weekly unless weather (e.g. snowfall) prevented this. During a nationally co-ordinated trial was completed looking at designs of trap cover (wood or mesh) and egg baits (white or brown, fresh or plastic) (results below). 49
53 50
54 Trap covers were alternated throughout the trapping system and baits rotated in a repeating sequence of white hen s egg, white plastic egg, brown hen s egg, brown plastic egg. From July 2000 all traps were placed under wooden covers using white fresh eggs as a result of this trial. All mustelids caught in good condition were collected. A sample of stomachs were removed to alcohol, for subsequent analysis of diet, and a sample of livers sent to Landcare Research, Lincoln, for testing for brodifacoum residue. Monitoring No result monitoring was undertaken for mustelids. A modified version of the rodent tracking tunnel system has been used previously at other sites but this has been discredited due to lack of independence between tunnels for such wide-ranging animals. Research is being undertaken to develop a new system (involving widely spaced groups of tunnels) but this had not been proven in time for adoption in this period. It was thus decided that the effort required to set up either a discredited or unproven system for questionable results was better spent on other activities. Several sessions of live-trapping for stoats were carried out in 1999/2000 using cage traps baited with rabbit aimed at gaining information on the effectiveness of the kill trap regime, secondary poisoning and the ranging of animals in the area. Traps were set either on the Borlase farm that borders the project, or further up the eastern shore of Lake Rotoiti beyond the project boundary. Personnel working for Fish and Game also set traps up the Travers Valley under the guidance of the project team between Lakehead Hut and the swing-bridge. Results 1. Fenn trapping captures Figure 32 shows the overall monthly pattern of stoat captures. (Note: this plot uses date trap was checked data so does not precisely reflect actual captures. Some animals will have been caught in the month before that shown). Figures 33 & 34 show the same data for weasels and ferrets. Figure 35 provides an annual comparison for all mammalian predators. Table 6 summarises all Fenn trapping data for the period. 51
55 FIGURE 32: MONTHLY CAPTURES OF STOATS IN FENN TRAPS - RNRP Month /99 Year 99/00 Year 00/01 Year 10 0 Jul Aug Sep Oct Nov Dec Jan No. caught Feb Mar Apr May Jun FIGURE 33: MONTHLY CAPTURES OF WEASELS IN FENN TRAPS - RNRP No. Caught /99 Year 99/00 Year 00/01 Year 1 0 Jul Aug Sep Oct Nov Dec Jan Feb Mar Apr May Jun Month 52
56 FIGURE 34: MONTHLY CAPTURES OF FERRETS IN FENN TRAPS - RNRP 4 3 No. Caught 2 98/99 Year 99/00 Year 00/01 Year 1 0 Jul Aug Sep Oct Nov Dec Jan Feb Mar Apr May Jun Month FIGURE 35: FENN CAPTURES/100 CORRECTED TRAP NIGHTS 0.7 Captures/100 corrected trap nights stoat w easel ferret cat rat hedge 98/99 99/00 00/01 Species 53
57 TRAP LINE NO. OF TRAPS TABLE 6: FENN TRAP CAPTURES BY LINE TRAP NIGHTS (T/N) STOATS FERRETS WEASELS RATS HEDGEHOGS OTHERS TOTAL CAPTURES Snail Boundary Grunt Boundary Borlase Boundary Captures Captures/100 T/N's Captures Captures/100 T/N's Captures Captures/100 T/N's Lake Edge Captures Captures/100 T/N's Vet Legends Captures Captures/100 T/N's Slave Driver Captures St Arnaud Range Captures/100 T/N's Captures Captures/100 T/N's Note: The trap-night figure has not yet been corrected so makes no allowance for traps being unavailable for part of a period due to captures, for sprung or vandalised (very rare) traps, or for traps being blocked by snow. Figure 36 shows the relative stoat captures on the different trap-lines and Figure 37 breaks this down into two periods, when bro difacoum was in use to control possums and rodents, and when brodifacoum was not present and trapping used for rats, to allow some assessment of the impact of the toxin. 54
58 FIGURE 36: RELATIVE STOAT CAPTURES BY TRAP LINE Stoats per 100 trap/nights Snail Boundary Grunt Boundary Borlase Boundary Lake Edge Vet Legends Slave Driver St Arnaud Range Trap Line FIGURE 37: STOAT CAPTURES PER TRAP LINE 1998/2000 AND 2000/2001 Stoats per 100 trap/nights / /01 Snail Boundary Grunt Boundary Borlase Boundary Lake Edge Vet Legends Trap Line Slave Driver St Arnaud Range 55
59 2. Bait and Cover Trial Tables 7 and 8 present the trial results. TABLE 7: FENN TRAP CAPTURES BY TRAP COVER TYPE WIRE CAGE WOOD TUNNEL No. of stoats (%) 37 (24%) 120 (76%) No. of rats 19 (13%) 127 (87%) No. of weasels 2 (13%) 13 (87%) No. of hedgehogs 68 (53%) 61 (47%) The expected percentage for the two cover types if no preference was shown was 50:50. A Chi-square test showed the difference to be significant (χ 2 =7.86 p=0.005). TABLE 8: FENN TRAP CAPTURES BY BAIT TYPE WHITE FRESH WHITE PLASTIC BROWN FRESH BROWN PLASTIC Stoat (%) 74 (47%) 18 (11%) 42 (27%) 23 (15%) Rat 39 (27%) 44 (30%) 31 (21.5%) 31 (21.5%) Weasel 7 (47%) 5 (33%) 2 (13%) 1 (7%) Hedgehog 33 (26%) 20 (15%) 36 (28%) 40 (31%) The expected percentages across the four bait types if no preferences were shown were 25:25:25:25 and overall these differences were not significant χ 2 = 4.13 p>0.02). Analyses of fresh vs. plastic eggs using χ 2 and crosstab statistics within SPSS (C. Gillies pers. comm.) suggested fresh eggs to be preferred but not strongly so. 3. Secondary poisoning Table 9 presents the results of brodifacoum assays from liver samples from mustelids trapped at Rotoiti. (The support of Landcare Research, Lincoln in funding a proportion of these assays and making the data available is gratefully acknowledged). 56
60 TABLE 9: BRODIFACOUM RESIDUES IN ANIMALS TRAPPED IN THE PROJECT AREA (N = NUMBER ANALYSED, % POSITIVE, MEAN PARTS/MILLION (PPM), RANGE PPM). (SOURCE: ERIC SPURR, LANDCARE RESEARCH) PERIOD TRAPPED STOAT FERRET July 98 July 2000 (Continuous brodifacoum use) N = 54 67% +ve 0.13 ppm ppm N = 6 83% +ve 0.82 ppm ppm 4-6 months post-brodifacoum N=1 100% +ve 0.03 ppm N = months post-brodifacoum N=23 63% +ve 0.05 ppm ppm N = 0 4. By-catch in rat trapping Eighteen stoats and 13 weasels were caught in the 706 snap traps set for rats between 22 August 2000 and 30 June 2001 with their monthly distribution as follows: JUL AUG SEP OCT NOV DEC JAN FEB MAR APR MAY JUNE No. Stoats No. Weasels There was no clear spatial pattern of captures, in particular no evidence that more were caught towards the perimeter. 57
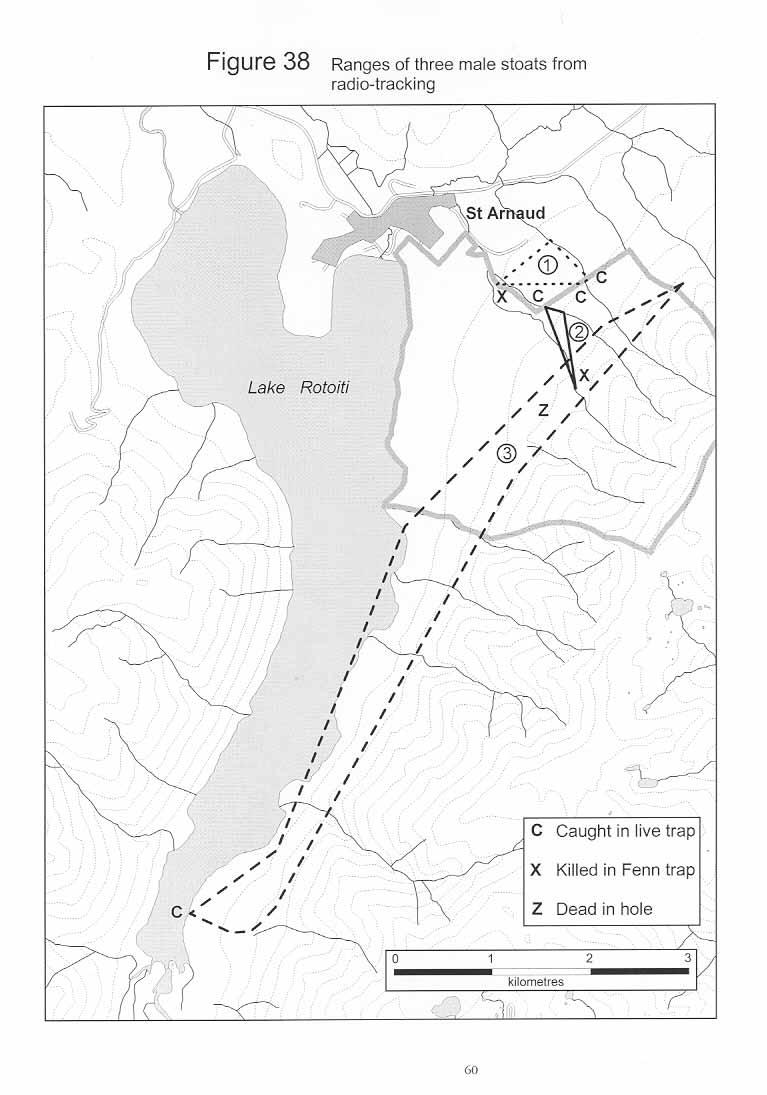
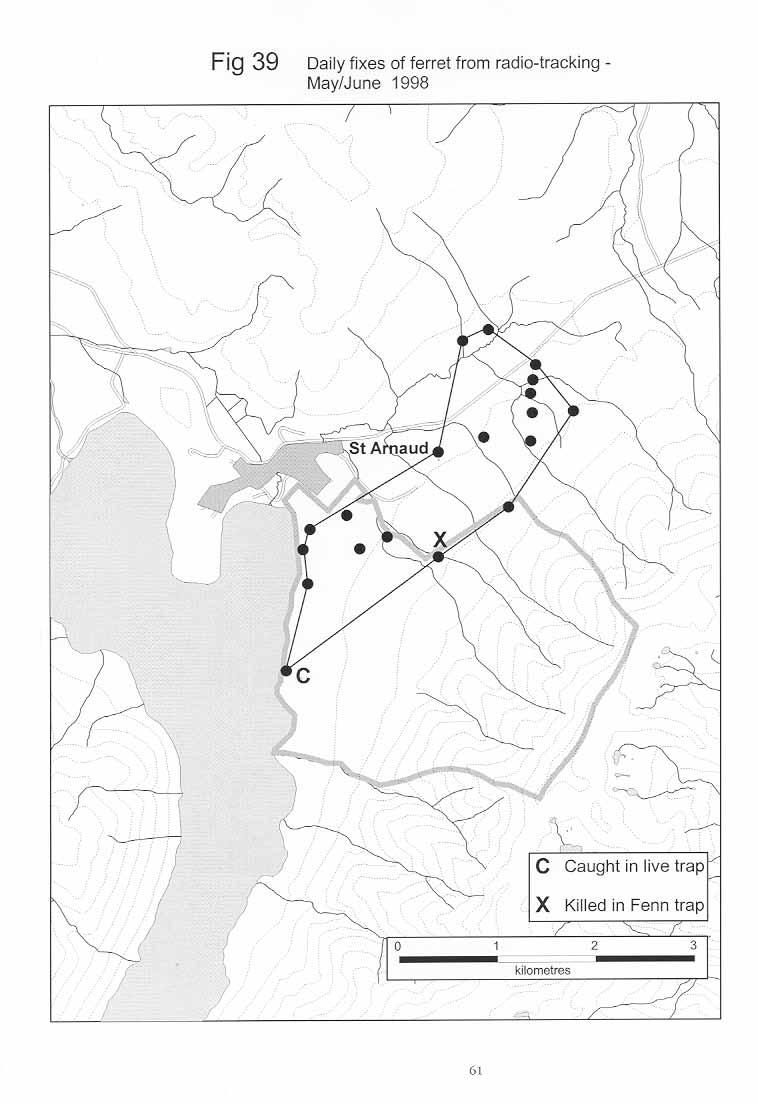
61 5. Live trapping TABLE 10: SUMMARY OF LIVE TRAPPING RESULTS. LOCATION: FARM (WITHIN 1 KM OF PROJECT BOUNDARY DATE SET DATE CLOSED NIGHTS BAIT TYPE NO. OF TRAPS TRAP NIGHTS CAPTURES 23/03/99 26/03/99 3 Rabbit 42 wire tunnels 126 none 29/03/99 31/03/99 2 Rabbit 42 wire tunnels 84 none 28/04/99 30/04/99 2 Rabbit 42 wire tunnels 84 none 4/05/99 7/05/99 3 Rabbit/deer liver 42 wire tunnels 126 none 10/01/00 14/01/00 4 Rabbit/egg 42 wire tunnels 168 none 18/01/00 20/01/00 2 Egg 42 wire tunnels 84 1 stoat (dead) LOCATION: LAKE EDGE (1 1/2-6KM FROM S. BOUNDARY OF PROJECT) 28/04/99 30/04/99 2 Rabbit 10 Havahart cage traps 20 none 3/05/99 7/05/99 4 rabbit/deer liver 10 " " 40 1 adult female cat 10/05/99 14/05/99 4 deer liver 10 " " 40 none 11/11/99 12/11/99 1 Rabbit 10 " " 10 1adult male cat, 1 female cat, 1 weka 15/11/99 19/11/99 4 Rabbit 10 " " 40 1 weka 9/05/00 12/05/00 3 Rabbit 6 Hava.cage/4 small 30 1 weka 16/05/00 19/05/00 3 Rabbit " ''/'' '' 30 none 22/05/00 26/05/00 4 Hare 10 Havahart cages 40 none LOCATION: LAKEHEAD (6KM FROM S. BOUNDARY OF PROJECT) 19/05/99 21/05/99 2 eggs/deer liver 33 wire tunnels 66 none 24/05/99 28/05/99 4 eggs/deer liver 33 wire tunnels black male cat - tx fitted LOCATION: TRAVERS VALLEY (10KM FROM S. BOUNDARY OF PROJECT) Feb 2000 Feb Rabbit 10 Havahart cages 70 4 stoats, 2 cats Figures 38 and 39 and Table 11 present the results of tracking a ferret and three stoats caught near the project area. An additional ferret was caught and followed for a period in the Buller Valley near Teetotal but it did not visit the project area. 58
62 TABLE 11: SUMMARY OF RADIO-TRACKING OBSERVATIONS: SEX FERRET 1 STOAT 1 STOAT 2 STOAT 3 FEMALE MALE MALE MALE Date live-trapped 29/5/98 14/01/01 15/01/01 24/03/00 Last location fix prior to death 29/06/98 17/01/01 17/01/01 07/04/00 Date found dead 1/07/98 30/01/01 24/01/01 11/04/00 Cause of death Fenn trap Fenn trap Fenn trap Wedged in hole? Days alive in project area 33 (3)* 4-13** Notes * Only 3 days alive in area following opening of Fenn trap lines **Animal had many maggots when found so died several days previously Transmitter dead when found so may have been in trap for several days Animal entered project area from south on 4/3/00 59
63 60
64 61
65 Non-target impacts Twenty-eight non-target animals have been caught (excluding rats, hedgehogs and cats which were caught in larger numbers and are considered elsewhere in this report). INTRODUCED MAMMALS NATIVE BIRDS INTRODUCED BIRDS SPECIES Rabbit Possum Mouse Hare Bellbird Tui Weka Blackbird Thrush NO Discussion The overall trapping results (Figure 32) show the expected pattern of increased stoat captures following beech seeding, a response attributed to increased numbers of rodents as food. The seasonal pattern shown is also typical with most captures in summer when many are young animals. Weasels were not caught in 1998/99 and appeared in small numbers in 1999/2000 and 2000/2001 (Figure 33) which again was probably due to the beech seeding. We cannot determine whether weasels increased in numbers as stoats were reduced, as some researchers have suggested, as we have no independent measure of numbers. Ferrets were trapped in very small numbers each year showing a slightly different seasonal pattern with captures from late summer to winter (Figure 34). The trial clearly showed higher capture rates for stoats and weasels in wooden tunnels compared to wire cages, so all traps were placed in tunnels for the 2000/01 season. There was no apparent variation between the sexes. Wooden tunnels were also clearly preferred by rats, which are a useful by-catch of this trapping. Hedgehogs showed no preference. The bait result was less clear cut. Stoats showed a preference for fresh eggs, suggesting they use scents more in hunting (though fresh and plastic eggs did look slightly different) and a tendency to favour white over brown. As they are the main pest targeted by the Fenn trapping, we will move to use only white fresh eggs next year (though suppliers are becoming increasingly hard to find). Rats and hedgehogs showed no preferences, indicating that they are hunting mostly using visual clues. Two further controls were operating in addition to the Fenn Traps, secondary poisoning in whose impact we cannot precisely quantify, and by-catch during rat trapping in 2000/01 which we can. Addressing the first, two-thirds of the stoats and over three-quarters of the ferrets trapped while brodifacoum was in use had detectable levels of the toxin in their livers. Several of these had very high levels (maximum 4.57ppm) above the range found in stoats killed by the poison in studies in South Westland (range ppm) (Alterio & Moller, 2000). This indicates that some stoats are likely to have been killed by poisoning alone without encountering traps. It is likely that most brodifacoum was picked up by eating live or dead rodents carrying the toxin, for there were very few possums in the area following the 1080 operation. A similar proportion of stoats were carrying brodifacoum at least seven months after the operation ceased though the average level was lower (0.05ppm compared to 0.13ppm), an indication of the toxin s persistence in the system (E. Spurr, pers. comm.). 62
66 Rat trapping killed 18 stoats and 13 weasels in the 2000/01 year. Though the former is a relatively small number compared to the 260 caught in Fenn traps over the same period, each one is of significance as it has penetrated through the Fenn trap lines to the interior of the treatment area. The relative contribution of rat traps to the control of weasels is that much greater as only 25 were caught in Fenn traps in that time. There was some variation in the entrance size of the tunnels, which may have meant that some would allow weasels to enter, but not stoats. This issue is currently being addressed and entrances may all be enlarged to 50mm square. The spatial pattern of stoat captures (Figure 36) was presented largely to determine if the two internal lines, Vet Legends and Slave Driver, had lower frequencies of captures as would have been hoped if most stoats were being intercepted before they reached the interior of the block. There was some evidence for this: 1.46 animals were caught per 1000 trap nights on perimeter lines compared to 1.03 animals per 1000 trap nights on these internal lines, though the difference was not statistically significant at 5% level (t-test for equality of means p= 0.072). Stoats were caught at all altitudes, from the Lake Edge line at about 620m a.s.l. to the top of the St Arnaud range at m a.s.l. Separating the data into the years with brodifacoum in use and the one without (Figure 37) shows marked differences. On average, the frequency of captures per line was 3.6 times higher in 2000/01 than in with two lines, Snail Boundary (6.3 times) and Vet Legends (5.3 times) showing increases well above this average. More detailed analyses including the number of captures at individual traps will need to be undertaken to interpret these patterns and determine their significance. However one difference of possible significance is that capture rates on the two internal lines (Vet Legends and Slave Driver) both increased more than the average between the two periods, and there was very little difference between internal and external lines capture rates in 2000/01: 2.15 captures/1000 trap nights on internals, 2.45 captures/1000 trap nights on externals (t-test for equality of means p= 0.34). This suggests that relatively more animals were present inside the block when trapping rather than brodifacoum was the rodent control mechanism. Ensuring all the rat trap tunnels are large enough to admit stoats may in future make the trapping an equally effective secondary control as brodifacoum. Live trapping proved relatively unsuccessful in the vicinity of the project area as shown in Table 10. Only 1 stoat was caught in 672 trap-nights (wire tunnels) within the farm, none in 250 trap-nights (cage traps) along the lake edge and none in 198 trap-nights (wire tunnels) at Lakehead - 1 capture per 1120 trap-nights overall. However trapping was very successful further up the Travers Valley 4 stoats caught in 70 trap-nights or 1 capture per 17.5 trap nights. It is tempting to conclude that the control operation had created an area beyond the block with very few animals, though this cannot be proved as trapping was not carried out simultaneously in the different areas, nor done prior to control starting in the treatment area. What the live trapping did show was that the animals captured did not survive long in the presence of the Fenn trap lines, from as few as three days to at the most about ten. The sample is limited and may have been biased towards animals that would enter traps, and trapping was only carried out at lower altitude sites, but the results are encouraging. Had animals been surviving in the treatment area for long periods it would have been a matter of concern. 63
67 Only a small number of non-target kills occurred, in addition to significant numbers of rats, hedgehogs and cats which we consider as secondary targets. Sixteen of these were other introduced mammals, mostly juvenile lagomorphs, which could also be considered a desirable outcome in terms of the project s objectives. Four native birds were caught of which the most significant were two weka. This species was not present in the area when the project started and their arrival in the area was first detected in traps. Both were caught in traps set in wire tunnels so all these were then modified with extra mesh and no further weka were caught. We anticipate that the problem will have been removed entirely by the replacement of all mesh tunnels by wooden ones in FERAL CAT CONTROL & MONITORING Objectives To reduce feral cat numbers to a sufficiently low level that they have a minimal deleterious effect on the breeding success of resident birds and lizards and that would allow the re-introduction of other species vulnerable to cat predation (e.g. kiwi). In the longer term to reduce the population of pet cats at St Arnaud with support of the local community. To assess the benefits of cat control, balancing negative impacts on native fauna with positive impacts controlling rodents (and rabbits in farmland) Performance Target None could be determined in advance without a good method to monitor cats. There is also a lack of studies showing the impacts of cats on the mainland. Methods The programme for these years in the project area was to set Havahart cage traps, baited with rabbit, in response to sightings or sign (droppings, kills) of cats. Other individuals have also been caught there as a by-catch in live or kill-trapping for mustelids. Cats have typically been detected, and traps set, along the base of the project area by the lake. There has also been an ongoing programme to control feral cats at the rubbish dump on the northern edge of St Arnaud village. Results In 1998/99 14 cats were trapped or shot at the rubbish tip and at least one trapped in the village. In 1999/ male was trapped at the tip and then the traps were removed as its management changed to a system that did not encourage rodents and thus cats. Two were caught in cage traps set along Lake Edge and one shot in the Travers Valley. Twentysix cats have been killed in Fenn traps in the period (Table 12), mostly on the Lake Edge and Borlase Boundary lines with none along the top of the St Arnaud range. 64
68 TABLE 12: MONTHLY KILLS OF CATS IN FENN TRAPS, MONTH APR 1999 MAY 1999 NOV 1999 MAY 2000 DEC 2000 JAN 2001 FEB 2001 APR 2001 MAY 2001 JUN 2001 No. killed The livers of 9 cats caught from various traps between July 1998 and July 2000 while brodifacoum was in use were tested for the toxin. Eight of these tested positive giving an average of 0.46ppm and a range of 0 to 1.25ppm. All of eight further animals tested in 2000/01, four to six months after poisoning ceased, tested positive though with much lower levels (average 0.09ppm, range ppm) (E. Spurr, pers. comm.). Two cats were also live-trapped near Lakehead Hut in cages set for stoats and it was decided to put transmitters on these. The male, trapped on 25 May 1999 was monitored over 17 weeks in which he ranged right around Lake Rotoiti spending some time in St Arnaud village and in the treatment area (Figure 40). Contact was lost on 4 th October but the transmitter was recovered on the 5 th November lying on the Track up the Travers Valley c7km south of the head of Lakehead Hut. He was finally caught back near the hut in a live trap set on 7 th February The female on the other hand, captured on 10 August 1999, had a much smaller range around the head of the lake (Figure 40). Contact was lost with her at the end of January Discussion The Fenn trap data suggests that there has been some increase in cat activity in this period. Some animals were caught in the autumn of 1999 and many more in summer/autumn 2000, consistent with the view that cats responded to the presence of more rodents following the 1999 and 2000 beech seedfalls. Their response appears to have been related to the size of the seedfall event. However no monitoring has been possible to confirm this. It seems likely that some cats will have been killed in the block by secondary poisoning with 1080 and then brodifacoum. Now that this factor is no longer operating some kill trap lines are being established for cats in Cat control and monitoring can probably remain as quite a low priority with the Fenn traps, coupled with incidental observations, able to provide some measure of future activity. The ranging of the male fitted with a transmitter showed that, if we were aiming to reduce cat activity in the block to very low levels, we would need to trap over a relatively huge area. The cat issue continues to be addressed by low key advocacy aimed at reducing holdings in the village and preventing the dumping of unwanted pests. A pamphlet covering the management of cats and dogs is proposed. The closure of the St Arnaud rubbish tip and the establishment of a new cat-free subdivision may play their part in reducing the problem. 65
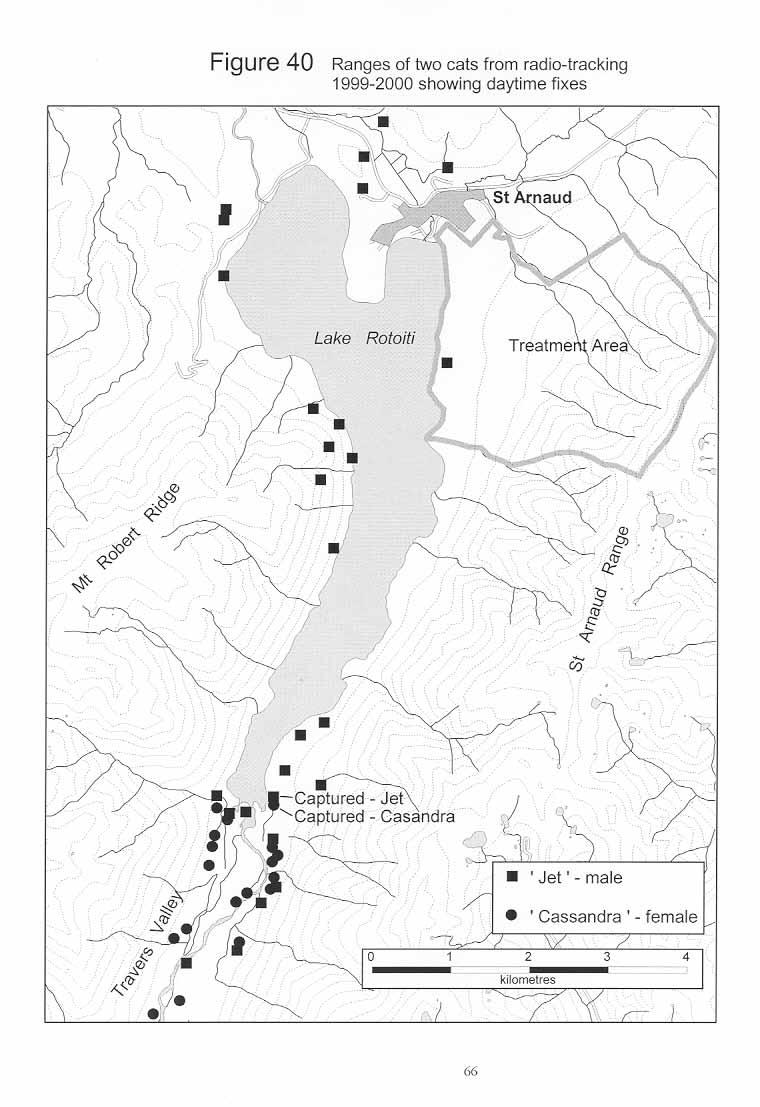
69 66
70 4.5 WASP (VESPULA SPP.) CONTROL & MONITORING Common wasps (Vespula vulgaris) build up to high densities in these forests in summer when they depress the levels of honeydew which is a significant food source for native fauna, and take large numbers of native invertebrates. Objectives General objectives were: to reduce the take of honeydew; to reduce predation on native invertebrates and bird nestlings (Moller, 1990) so that the impacts of wasps are insignificant alongside other mortality factors affecting these groups; to improve the public s experience visiting the beech forest in late summer. As with all our work there has been a further un-stated objective of increasing the costeffectiveness of our pest control. Performance Targets Four possible measures of wasp control performance developed from studies by Landcare Research, Nelson were identified in the Strategic Plan (Butler, 1998). To reduce wasp numbers to: avoid reduction of honeydew standing crop by more than 94% of peak value - i.e. keep it above 2500 J m -2 (Moller et al., 1996). About a 92% reduction in wasps may be needed to achieve this to protect the birds that use honeydew; to ensure that honeydew anal filaments are not visited more frequently than every 3 hours by wasps (Moller et al. 1996a); to minimise the time that the energy level of honeydew falls below 1.4 joules/drop, the point at which it ceases to be energetically profitable for kaka to feed on honeydew (Beggs & Wilson, 1991), or to prevent this fall; to reduce wasp densities to 2 nests/ha or reduce nest size by equivalent amount (Thomas et al., 1989). (An 83% reduction of wasp density would be necessary to achieve this in their study). For the seasons we focussed on the honeydew response using the first measure in our analysis, though we also collected data that allows assessment of the fourth as well. In 2000 and 2001 we introduced a new performance measure, an Ecological Damage Threshold (EDT), based on recent studies by Landcare Research (Beggs & Rees, 1999). They found that wasp activity above a level of 2.7 wasps being caught per Malaise trap per day was associated with significant losses of large free-living caterpillars. 67
71 The measure is thus: reduce wasp activity so that the average capture of wasps per Malaise trap is less than 2.7 per day. The wasp work has been developed as a close partnership with Landcare Research, Nelson, building on their original poisoning studies (e.g. Spurr (1991), Beggs et al. (1998)). In any season their staff were closely involved in planning and analysis and to varying extents in the actual poisoning and monitoring fieldwork. Methods 1. Wasp Control Control was undertaken each year, as in 1998, using a toxin applied in bait stations in January/February over the lower third of the block (the area with abundant honeydew). Each season this was divided into two areas, Block A and Block B with different bait station spacing. The bait consisted of a toxin mixed with sardine-based cat food. In 1998 the toxin was sulphuramid in a bait called Finitron TM, in 1999, 2000 and 2001 the toxin was fipronil in a bait provisionally known as Extinguish TM. This latter was applied through an experimental permit held by Landcare Research who are developing the formulation with Rhone-Poulenc Ltd (now Aventis). Though the toxin was the same through the three seasons were sufficiently different in methodology and results that these are presented separately. Of particular significance has been the changing spacing of bait stations and these are highlighted in bold in the tables that follow Season The timing of poisoning was assessed by placing non-toxic bait in a sample of stations daily from late January, with a trigger of the average number of wasps on each after one hour exceeding five. This point was never reached so poisoning was carried out on 4th February. The baits containing 1% Fipronil were formulated as frozen tubes from which they were applied with a caulking gun into paper cake cups sitting in KK bait stations screwed to trees. A loading of c.320g/ha was achieved using the set up of Table 13. TABLE 13: WASP POISONING SET-UP 1999 AREA A AREA B Area (approx.) in ha No. bait stations Bait stations/ha Bait station spacing 100 x 50 m 50 x 50 m Amount of bait/station (g) 60g 30g It took six people one day to put out all the bait. Baits were left out for two days, then any left were removed. 68
72 A rough assessment was made of the amounts of bait left by measuring a sample of 25 baits removed from each block using a volumetric scale. The scale was based on levelling the bait against the side of a Petri Dish placed above graph paper. This was calibrated by placing known quantities of bait (10, 20, 30, 40, 50 and 60g) dried out to the same texture as the bait removed above the paper. Monitoring of wasp nests was carried out using the strip transect methodology as in 1998, along transects c.500m in length set up in each block and in a non-treatment area at the head of Lake Rotoroa. Individual nests were also monitored outside the plots when required. Wasp activity was also measured by the numbers caught in malaise traps, the primary tool for measuring changes in the invertebrates preyed on by wasps (section 5.2.1). Outcomes of the control were also measured through changes in honeydew available (section 5.2.4) Season Initial poisoning of both blocks took place on 7 th February using a re-canned X-stinguish formulation (fipronil in sardines toxin concentration was 0.2% prior to canning but this will have been reduced in processing to nearer 0.1%) as in Table 14. TABLE 14: INITIAL WASP POISONING SET-UP 2000 AREA A AREA B Area (approx.) in ha No. bait stations Bait stations/ha Bait station spacing 200 x 200 m 100 x 50 m Amount of bait/station (g) 100g 39g However few wasps were seen on the baits and there was no noticeable reduction in nest activity the following day (activity prior to poisoning on 7 Feb: (mean + SE), activity after poisoning on 8 Feb: , n=9 nests). So a further poisoning was conducted on 10 Feb using freshly mixed 0.1% fipronil in sardines again few wasps were seen on the baits. Following this result, Landcare Research undertook some wasp diet sampling to investigate whether there was anything unusual about the prey being taken that would explain the relative lack of interest in baits. Subsequent monitoring (nests and malaise traps) showed that the kill in Block A at the wider spacing of 200 x 200m had not been as significant as in Block B (100 x 50m spacing), so a further poisoning of Block A alone was conducted on 10 th March. For this the block was divided into two sub-blocks to test the value of pre-baiting, given the relative small numbers of wasps seen taking baits this season, and treated at 100 x 50m spacing. One sub-block received non-toxic sardines in the bait stations the day before the toxic bait was put out. Nests located south of the project area along Lake Rotoiti were monitored as non-treatments. 69
73 Monitoring was conducted as in 1999 with the addition of an experiment to compare direct predation rates by the temporary placing of live kowhai moth caterpillars in treatment and non-treatment areas (see Beggs & Rees (1999) for detailed methodology) Season TABLE 15: WASP POISONING SET-UP 2001 AREA A AREA B Area (approx.) in ha No. bait stations Bait stations/ha Bait station spacing 200 x 50 m 100 x 50 m Amount of bait/station (g) 80g 40g Poisoning took place on 18 th January, earlier than usual, following non-toxic counts averaging 1.9 wasps/bait after 1hr (the trigger having been reduced from the 5 wasps/bait used in 1999) on 17 th. Seven people completed the poisoning in half a day all stations filled by 12.30pm. Canned bait was used comprising c.0.05% fipronil (0.1% prior to canning) in a kahawai (fish) preparation. Monitoring was as in the previous year except that honeydew monitoring was dropped as a clear enough pattern had been established. Landcare Research also undertook a study to the south of the treatment area, investigating the distance from the boundary at which poisoning had a detectable effect. The fate of nests was studied in strip plots at varying distances from the project boundary (0-50m, , , , , , , and a few nests over 1200m away), through traffic counts the day before poisoning and 8 and 36 days afterwards (Harris et al. 2001). Results The results are presented annually but will largely be grouped in the discussion that follows. This is required to discuss the two experimental themes that underpin the annual work; one being the development of the most cost-effective system based on bait station spacing and the other the development of the best bait. Each year the analysis of nests provides a measure of the immediate impact of the poisoning in the treatment area, malaise trapping shows wasp activity throughout the season in both treatment and nontreatment areas, and caterpillar experiments in 2000 and 2001 provide a direct assessment of benefits to insects. There is usually some additional observational data reported on that may help to interpret the different effectiveness of control in different situations. 70
74 1999 Nest results The strip plot results in Table 16 show an overall 96.7% reduction of active nests in the treatment area (RNRP) compared to a 7.7% reduction at Rotoroa over the same time period. Traffic counts within the strip plots showed an average reduction in overall wasp activity of 100% compared to an increase of 24% in the non-treatment area. TABLE 16: STRIP PLOT SUMMARY 1999 RNRP BLOCK A (100 x 50m spacing) BLOCK B (50 x 50m spacing) OVERALL ROTOROA NO. OF NESTS IN PLOT OUTSIDE IN PLOT OUTSIDE IN PLOTS OUTSIDE IN PLOT Pre-poisoning Post-poisoning NESTS/HA Pre-poisoning 9.8 n/a 11.3 n/a 10.5 n/a 20 Post-poisoning 0.7 n/a 0 n/a 0.4 n/a 18.5 % REDUCTION NESTS Nests 93.30% 100% 96.70% 7.70% Nests/ha 92.90% 100% 96.60% 7.70% TRAFFIC COUNTS Pre-poisoning Post-poisoning WORKER WASPS/HA Pre-poisoning n/a n/a n/a Post-poisoning 11 n/a 0 n/a 6 n/a TABLE 16 (CONTINUED) % REDUCTION IN PLOT OUTSIDE IN PLOT OUTSIDE IN PLOTS OUTSIDE IN PLOT Counts 99.70% 100% 100% % Workers/ha 100% 100% 99.90% % * Obtained by multiplying half the traffic count at a nest by (nest correction factor) and by the nest density/ha. The correction factor was obtained by Landcare Research who first counted traffic at nests then dug them up to count the no. of workers present. 71
75 Malaise trapping: Counts of wasps in malaise traps at Rotoiti and Rotoroa (Figure 41) show the dramatic effect of poisoning, keeping numbers at Rotoiti at a low level throughout the season when without poisoning the pattern would have been expected to be as at Rotoroa. The Ecological Damage Threshold (EDT) of 2.7 wasps/group/day was not used as a performance measure this season. However in retrospect the procedures in place achieved a near perfect result in this respect i.e. poisoning occurred when the EDT was reached and kept numbers below that level throughout. FIGURE 41: CAPTURES OF WASPS IN MALAISE TRAPS 1998/99 Mean no. of wasps per trap group/day /11/ /11/1998 Incidental observations: Rotoiti poisoned 10/12/ /12/1998 7/01/ /01/1999 4/02/ /02/1999 4/03/1999 Date 18/03/1999 1/04/ /04/ /04/ /05/1999 Rotoiti Rotoroa Observation showed that wasps took bait during the first few hours after it was put out and some nests were dying that same day. By next day there was almost no wasp activity and only blow-flies were observed on the baits in any numbers. The baits had also dried out over that time. It was noted that wasps were attracted to moisture around the baits first, eating the paper of the cups as they absorbed liquid. A crude analysis on a sample of the baits recovered indicated that 43.7% of the bait had been eaten in Area A and 42% in Area B so there was clearly more than enough applied on each grid. Comparison of spacing grids: The more closely-spaced grid (50 x 50m) achieved a 100% kill but the wider spaced (100 x 50m) was also clearly highly effective. 72
76 2000 Nest results: The strip plot results in Table 17 comparing results after the two poisonings in February show an overall 27% reduction of active nests in the treatment area while no reduction was recorded at Rotoroa over the same time period (18-19/1/00 to 24-25/2/00). Traffic counts within the strip plots showed an average reduction in overall wasp activity of 55% compared to a reduction of 17% in the non-treatment area. Clearly there were major differences between the two grids treated (see below). TABLE 17: STRIP PLOT SUMMARY 2000 RNRP BLOCK A (200 X 200M SPACING) BLOCK B (100 X 50M SPACING) OVERALL ROTOROA NO. OF NESTS IN PLOT OUTSIDE IN PLOT OUTSIDE IN PLOTS OUTSIDE IN PLOT Pre-poisoning Post-poisoning NESTS/ha Pre-poisoning 6.3 n/a 7.5 n/a 6.9 n/a 13.8 Post-poisoning 6.3 n/a 3.8 n/a 5.1 n/a 13.8 % REDUCTION NESTS Nests 5.60% 53% 27.30% 0.0% Nests/ha 0.00% 50% 26.30% 0.0% TRAFFIC COUNTS Pre-poisoning Post-poisoning WORKER WASPS/HA* Pre-poisoning n/a n/a n/a Post-poisoning n/a 6727 n/a n/a % REDUCTION ACTIVITY Counts 40.70% 81% 57% 16.90% Workers/ha 46% 67% 55.00% 16.90% * Obtained by multiplying half the traffic count at a nest by (nest correction factor) and by the nest density/ha. The correction factor was obtained by Landcare Research who first counted traffic at nests then dug them up to count the no. of workers present. 73
77 The results of the March poisoning in the two halves of Block A, pre-fed and no prefeed, were analysed by Landcare Research (Table 18) (Harris, 2000). Significantly higher wasps were seen taking toxic baits in the pre-fed area over the first two to three hours, but the overall changes in traffic counts in the two halves 2 and 12 days after poisoning were not statistically different. In both the poisoning did clearly reduce activity while it increased in non-treatment nests over the same period. TABLE 18: CHANGES IN TRAFFIC COUNTS AFTER POISONING WITH AND WITHOUT PREFEEDING (SOURCE: LANDCARE RESEARCH) PREFED NO PREFEED NON-TREATMENT PRE-POISONING 2 DAYS AFTER 12 DAYS AFTER PRE-POISONING 2 DAYS AFTER 12 DAYS AFTER PRE-POISONING 2 DAYS AFTER 12 DAYS AFTER Mean Upper CI Lower CI Note: Data was transformed so CI s not SE s are shown. The traffic counts from individual nests monitored on four occasions (before 1 st poisoning (7 Feb), before and after 2 nd poisoning (10Feb), and after both poisonings) at Rotoiti are shown in Figure 42. All but one of the nests did show a drop in activity over the period after both poisonings the exception being a large nest in Block A. FIGURE 42: TRAFFIC COUNTS OF 14 INDIVIDUAL WASP NESTS RNRP A11 A12 A13 Total traffic count (logarithmic scale) A14 A15 A16 A17 A18 A19 B1 B Jan 10-Feb 11-Feb 24-Feb Date counted B3 B4 B5 74
78 Malaise trapping: Figure 43 shows that the separation between the treatment and non-treatment areas was not as great as the previous season. Non-toxic trials were again used as the trigger, rather than the EDT, and though the poisoning was only slightly later than in the previous season (7 Feb c.f. 4 Feb) wasp numbers were well above the EDT (2.7 wasps per trap group/day) by this time. FIGURE 43: CAPTURES OF WASPS IN MALAISE TRAPS Mean no. of wasps per trap group/day RotoitiA RotoitiB Rotoroa 10/11/ /11/1999 8/12/ /12/1999 5/01/ /01/2000 2/02/ /02/2000 1/03/ /03/ /03/ /04/ /04/ /05/2000 Date Caterpillar experiment: 30 caterpillars were placed towards the centre of the treatment area and in the nontreatment area at the same time on 18 January, prior to wasp control, and 23 March following the three poisoning attempts. The results were as follows: ROTOITI TREATMENT AREA ROTOROA NON-TREATMENT AREA 18 JANUARY 23 MARCH 18 JANUARY 23 MARCH No. caterpillar s surviving % surviving
79 Incidental observations: The diet of wasps was investigated by Landcare Research after the second poisoning by collecting samples from workers returning to six nests on 22 and 24 th February (R. Toft, unpubl. data). The results were consistent with previous studies finding Diptera (flies) (35% occurrence), Lepidoptera (moths) caterpillars (22%) and Araneae (spiders) (15%) to predominate. Particular emphasis was placed on analysing the caterpillars as there was speculation that wasps were concentrating their feeding in the forest canopy. Most (72%) of the caterpillars were associated with foliage and interestingly about 70% of these were leaf-rollers (Tortricidae), showing wasps to be efficient at locating and extracting them from their shelters. Comparison of spacing grids: The closely-spaced grid (100 x 50m - Block B) was more effective as shown by the strip plot results (Table 17), half the nests being killed there whereas all survived in the wider grid (200 x 200m Block A). The malaise results show a similar effect (Figure 43) with numbers caught in Block A higher through February/mid-March Nest results: The overall strip plot results in Table 19 show a 95% reduction of active nests in the treatment area compared to an increase of 21% at Rotoroa over the same time period. Traffic counts within the strip plots showed an average reduction in overall wasp activity of 98.5% in the treatment area compared to an increase of 168% at Rotoroa. TABLE 19: STRIP PLOT SUMMARY 2001 RNRP BLOCK A (200 X 50M SPACING) BLOCK B (100 X 50M SPACING) OVERALL ROTOROA NO. OF NESTS IN PLOT OUTSIDE IN PLOT OUTSIDE IN PLOTS OUTSIDE IN PLOT OUTSIDE Pre-poisoning Post-poisoning NESTS/HA Pre-poisoning 8.4 n/a 12 n/a 10.1 n/a 10 n/a Post-poisoning 1.4 n/a 0.8 n/a 1.1 n/a 12.3 n/a % REDUCTION NESTS Nests 90.00% 95% 95.00% -21% Nests/ha 83.00% 93% 89.00% -23% TRAFFIC COUNTS Pre-poisoning Post-poisoning
80 TABLE 19: CONTINUED WORKER WASPS/HA* Pre-poisoning n/a n/a n/a n/a Post-poisoning 248 n/a 12 n/a 193 n/a n/a % REDUCTION ACTIVITY Counts 97.3% 99.7% 98.5% % Workers/ha 99.3% 100% 99.8% % * Obtained by multiplying half the traffic count at a nest by (nest correction factor) and by the nest density/ha. The correction factor was obtained by Landcare Research who first counted traffic at nests then dug them up to count the no. of workers present. Malaise trapping: Malaise trap results (Figure 44) show that poisoning was triggered when counts reached the EDT (2.7 wasps/group/day). Captures were depressed below this level for a month but then rose above it. Poisoning did achieve major differences between captures at treatment and non-treatment areas. FIGURE 44: CAPTURES OF WASPS IN MALAISE TRAPS 2000/01 40 Mean No. wasps per trap group per day /11/ /11/ /11/2000 Rotoiti poisoned Comparison of spacing grids: 28/11/2000 5/12/ /12/ /12/ /12/2000 2/01/2001 9/01/ /01/ /01/ /01/2001 6/02/ /02/ /02/ /02/2001 Date 6/03/ /03/ /03/ /03/2001 3/04/ /04/ /04/ /04/2001 1/05/2001 8/05/ /05/ /05/ /05/2001 Rotoiti Lakehead Rotoroa Both spacing grids achieved very high kills of nests and workers (Table 18) though the closer spacing was slightly more effective (Block B (100 x 50m) recording nest reduction of 95% compared to Block A (200 x 50m) at 90%. Malaise counts showed that the subsequent increase in wasps, considered a result of re-invasion by foraging workers, was actually higher in Block B which probably relates more to its location bounded by more continuous forest. 77
81 Impacts beyond boundary of treated area (Landcare Research): Eight days after poisoning there was a noticeable decline in nest traffic rates up to and including the m strip but no detectable impact at 800m. After 36 days 67% of the nests up to 150m out had been killed and 45% between 151 and 400m but no impact was recorded at 800m (Harris et al., 2001). Comparisons over the 3 years of wasp poisoning Table 20 and Figure 45 summarise nest density data from strip plots: TABLE 20: WASP NEST DENSITIES YEAR ST ARNAUD ROTOROA ST ARNAUD ROTOROA ST ARNAUD ROTOROA Initial nests/ha Date recorded 27/1 11/2 27/1 11/2 2 February 3 February 19 January 18 January Post nests/ha Date recorded 19 26/ / /3 7 February 24 February 25 January FIGURE 45: WASP NEST DENSITIES AT ROTOITI AND ROTOROA BEFORE AND AFTER CONTROL AT ROTOITI 100 Nests/ha (logarithmic scale) 10 1 Rotoiti before Rotoiti after Rotoroa before Rotoroa 'after' Year 78
82 Discussion During two out of the three years, 1999 and 2001, poisoning with fipronil was very successful leading to an almost complete elimination of wasp activity assessed by monitored nests. The 2000 season proved less successful reducing activity by only about half. These results compare with a reduction of over three-quarters in 1998 using sulphuramid (Figure 45). Fipronil proved faster acting with many nests showing dramatically reduced activity on the day of poisoning, whereas sulphuramid appeared to take two weeks to show its full effect. (Note: Harris & Etheridge (2001) provide a detailed comparison between the 1999 results using fipronil and the 1998 ones using sulphuramid). Comparing the two most successful years first, malaise trap results show that in 1999 wasp numbers remained below their pre-poisoning level in the treatment area throughout the season, though in 2001 they increased above this level after about six weeks and remained above it for a further six. No new nests will have developed during the periods in question, so wasps trapped will either be the progeny of surviving nests within the treatment area or foragers from nests outside it. The kill of nests within the treatment area was similar in both years (c.f. 96% in 1999 and 95% in 2001) though the poisoning did take place about two weeks earlier in 2001 (18 January cf. 4 February in 1999). The timing of poisoning remains a key factor. With the benefit of hindsight, 1999 can be seen as the perfect season as wasp numbers only reached the EDT briefly just prior to poisoning. In 1998 it appears that the poisoning was done too late, particularly as it took about two weeks to have its full effect (though the EDT was not available then to allow it to be used as a possible trigger). In 2000, timing is now considered a major factor key behind the initial failure as discussed below. The measures used to trigger poisoning were then adjusted and applied with success in With the earlier triggering that resulted that year, it appears that a second poisoning would have been appropriate to maintain levels below the EDT throughout the season. The 2000 season warrants detailed examination in an attempt to explain why the results were so different. Wasps showed little interest in the first baits put out on 7 February and one factor influencing this was thought to be the canning process. The second poisoning 3 days later was thus done with fresh baits and though more wasps were seen taking it there were still not large numbers and far fewer than in previous years. After the second poisoning there were five days of rain and captures in malaise traps dropped sharply in treatment and non-treatment areas (Figure 43). They did then increase again at Rotoroa but not in the treatment area. Captures after poisoning in Block B (100 x 50m spacing) consistently tracked lower than those in Block A (200 x 200m) though this difference was only statistically significant in one time period (22 Feb 2 March) (Harris, 2000). Figure 42 shows traffic counts from the 14 individual nests sampled at Rotoiti that season outside the strip plots. The second counts were done during the afternoon of the second poisoning (10 Feb) at which point 5 of the nests had reduced activity and 9 had increased. By the following afternoon (11 Feb) 11 of the 19 nests showed reduced activity from the day before, indicating the positive impact of the second poisoning. All but one of the nests showed a further reduction between then and 24 Feb, four dropping to zero, but the exception was one of the larger nests (A16) whose count had a major influence on the average. There was a similar pattern shown by the nests in block A (200 x 200m grid) and Block B (100 x 50m grid) (dotted lines on plot) though the sample size is small. The key difference, apart from nest A16, is that only one (11.1%) of the Block A 79
83 nests went to zero whereas 3 (60%) of the Block B ones did. The same detail is not available for strip plot nests, which were only checked twice. Their results suggest a similarity of pattern between Block A at Rotoiti and the non-treatment area at Rotoroa with most nests dropping, a few increasing and one at each site going to zero. However in Block B significantly more nests again dropped to zero. The conclusion was that poisoning had shown an effect in Block B, but not in Block A. The rainfall following the first two poisonings will have altered wasp foraging behaviour by reducing the availability of honeydew by washing it off the trees, so that workers would have had to forage longer to obtain the energy they needed to then collect protein for larvae. Observations suggested that a large proportion of the wasps were foraging high in the canopy over this period, which would both reduce the numbers encountering baits as well as the numbers entering malaise traps. Landcare Research staff conducted diet assessments at a few nests to determine if the wasps were concentrating on a particular abundant prey item that was making the baits relatively less attractive. However the pattern of items was similar to that in previous studies. The reduced success of the 2000 poisoning thus cannot be pinned down to a specific cause, but is a reminder of the variability likely to be encountered in any natural system, particularly when working with invertebrates. Grid spacing and amount of toxin used Steady progress has been made towards the identification of the most cost-effective spacing grid and 1999 work showed that 50 x 50m and 100 x 50m grids achieved similar success, so that the closer could then be dropped. 100 x 50m thus became the standard against which 200 x 200m was tested in 2000 and found to be significantly less effective, and then 200 x 50m tested in 2001 and found to be almost as effective. 200 x 50m was thus carried forward as the standard for 2002 onwards. The key factor determining the labour involved is the number of bait station lines (at 100m apart) that have to be walked, rather than the number of stations along the lines that have to be filled, so walking every second line (to give the 200m) leads to a major saving. We have also been able to slightly reduce the amount of toxin used. In gms were placed per hectare in the two grid spacings and then reduced to 97.5g/ha and 37g/ha in The latter was on the 200 x 200m grid and was considered too little, as poisoning was unsuccessful, so g/ha was used in To date the approach has been to err on the side of placing out more bait than was needed and bringing back the unused, so as not to be caught out by higher numbers in any year and run out in some areas. However it may be possible to refine this in the future by assessing wasp densities prior to poisoning and adjusting the amounts of poison accordingly. Clearly labour savings would be made if it was not necessary to retrieve unused bait. Annual changes in wasp density Overall results (Table 20) (Figure 45) show that wasp nest densities were highest in 1998 and that Rotoroa generally has higher densities than St Arnaud irrespective of wasp control. Nest densities in any year appear to be related to weather, showing a negative effect of spring rainfall, and an inverse relationship with the number of queens produced in the previous autumn (Barlow et al., in press). There is no clear trend of declining initial nest densities at St Arnaud (16.2 to 10.5 to 6.9 to 10.1) which could have indicated some carry-over effect from one season s poisoning to the establishment of nests in the next 80
84 season. Such an effect has been considered unlikely. For each nest that survives the season can produce queens (Leathwick et al., 1999) and each queen can disperse as far as 30-70km (estimated from the rate that common wasps spread from St Arnaud to the West Coast in the 1980s) (Moller et al., 1990). Re-colonisation should thus occur from nests outside the treatment area. However a carry-over effect will be more likely to occur as the area poisoned increases (planned in 2002). Outcomes of wasp control Wasp control was sufficient to meet the key honeydew performance target used in 1999 and Monitoring (section 5.2.4) showed a significant summer peak in energy availability from mid-february to the end of April. At Rotoiti levels reached a peak of c.45,000 joules/m 2 in both years and were well above the performance target of 2500 j/m 2 in every week sampled during the period of wasp activity. At Rotoroa levels were depressed by wasps and fell below this target in some samples. The secondary target of reducing nest densities to 2 nests/ha was achieved in 1999 and 2001 but not in 2000 (nor in 1998 with sulphuramid). In the area where control worked best in 2000, the 100x50m grid, nest density was 3.8/ha after poisoning. We have two alternatives for measuring the beneficial outcomes of wasp control on other invertebrates, the caterpillar experiments and sampling through malaise traps. Caterpillars were used in 2000 when the control was only partially successful, yet caterpillar survival was still three times higher at Rotoiti after control compared with the non-treatment site at the same time. The analysis of non-wasp invertebrates in the malaise traps (section 5.2.1) is running c.2 years behind the field programme. Analyses of 1998/99 samples suggested that there was a small hint that three tipulid (crane-fly) species were showing some benefit from wasp control. However the inherently large natural variation in invertebrate populations from year to year and site to site has made any such effects hard to prove. More seasons of sampling are considered necessary. St Arnaud Community Association (SACA) s wasp control programme The SACA continued a wasp control programme in the village and its surroundings, with funding from external agencies, as they had in In 1999 the operation consisted of locating and poisoning nests with Permex and in 2000 it included the addition of bait station poisoning with fipronil and an increased monitoring effort. A planned 2001 programme was curtailed by changes in the Association s officers and the project team undertook some control in the village then. Aerial poisoning research The Department commissioned research from Landcare Research, Nelson over this period to investigate the possibility of aerial poisoning of wasps (Investigation no. 2337) and project staff assisted them with bait trials. The study concluded that some form of aerial baiting would be feasible, but that reduced attractiveness to wasps of pelletised baits and non-target issues meant that further research was required (Harris & Rees, 2000). Two ways of improving the cost-effectiveness of ground operations were suggested, placing baits on branches instead of in bait stations and not collecting unused bait afterwards. The effects of these procedures on non-target species, particularly ants and weta, would need assessing first. 81
85 4.6 DEER (CERVUS ELAPHUS) AND CHAMOIS (RUPICAPRA RUPICAPRA) CONTROL AND MONITORING Objective The project s initial objective was to control deer numbers so that they have minimal impact on the forest ecosystem. However though this might be a long-term objective, it was revised in the short-term to collect information on deer activity and diet to improve our ability to monitor impacts of deer at Rotoiti. We undertook no specific activities targeting chamois though one was shot during the helicopter hunt in March Only a few animals are considered resident in this part of the park. Performance Target These three seasons continued the low-key work of the first aimed at assessing deer impacts and trialling ground and aerial shooting. The emphasis of the latter was as much to obtain stomach samples for diet analysis to better focus our outcome monitoring as it was to assess its effectiveness as a possible control method. Methods Shooting was carried out above tree-line in summer. Impacts of deer were assessed through monitoring browse on susceptible species particularly broadleaf, through epicormic growth and photographic sampling of individual trees, 20x20m vegetation plots and a 20x20m deer-fenced exclosure (see section 5.5). All animals shot had their liver removed for toxicological analysis by Landcare Research at Lincoln. The stomach was also removed and shaken and mixed up to remove the layering, and a one litre sample taken for dietary analysis. Results Sightings/incidental encounters From several thousand person days of effort only two red deer (one hind and one spiker on separate occasions) have been seen as incidental encounters. Whilst sign (footprints and droppings) has been encountered there has been no attempt to record this in a systematic and quantifiable way. 82
86 Hunting Two sessions of aerial hunting by helicopter have been undertaken covering the northern St Arnaud Range as far south as the Arnst River. DATE FLY TIME ANIMALS SEEN ANIMALS SHOT GRID REFERENCE SAMPLES TAKEN 3/00 90 min Red deer hind and yearling Red deer hind N Liver and stomach 2 x chamois nanny 2 x chamois kids 1 x chamois nanny N Liver and stomach 2/01 63 min 1 x buck chamois (6 yr) 1 x buck chamois N Liver and stomach 1 x buck chamois (6 yr) 1 x buck chamois N Liver and stomach Limited ground-based hunting has also been undertaken. DATE HUNTER EFFORT RESULT GRID REFERENCE SAMPLES TAKEN 3/99 6 hrs Nil 3/00 5 hrs Red deer hind N Liver and stomach 9/00 3 hrs Nil 6/01 8 hrs Nil Livers from five deer and three chamois were sent for brodifacoum assays and all tested negative for the poison (Reference: Landcare Toxin Residue database reports T0665, T1088, T1132, T1323). Discussion The low incidence of encounters and relative low returns from hunting suggest low deer and chamois numbers in the area. However this does not necessarily mean that they are having an insignificant effect, if for example they are feeding very selectively on a few species that are already reduced in number and condition. Aiming to control deer in a c800ha block within continuous forest was seen as impractical. However as the project expands to operate on a larger, landscape scale, then deer and chamois control may be more worthwhile. In the meantime the focus will be on trying to quantify the impact they are having, e.g. through this use of exclosures, as much as resources will allow. The area has been closed to recreational hunting due to the use of toxins in the area combined with the near continuous presence of staff. Thus hunting activity by project staff has been the major factor in limiting deer numbers. We were concerned that the closure of the area to recreational hunting may create a perception that mainland island management will limit access to recreational hunting resources. As a result we invited the Nelson and Marlborough branches of the New Zealand Deerstalkers Association to participate in deer control in the area. This was aimed at achieving deer control without compromising staff safety, and providing data on hunter returns for effort undertaken. However no hunters came forward. 83
87 4.7 PIG (SUS SCROFA) CONTROL & MONITORING Feral pigs were not included in the Strategic Plan as they have traditionally been absent from the project area. However pig rooting was detected well into the project area in August Staff were asked to look for further sign to determine the extent of any pig incursion or whether this was a one off. No further sign was detected, and the animals responsible never sighted. (Since the period covered by this report further activity has been detected and some control initiated). 4.8 HEDGEHOG (ERINACEUS EUROPAEUS) CONTROL AND MONITORING Hedgehogs continued to be caught in significant numbers in Fenn traps. Two hundred and sixty-seven were caught in the period, most (191-72%) along Borlase Boundary the line adjacent to farmland, but others right through the forest up to bushline (Table 5). Hedgehogs showed no apparent preference for wire cages or wooden tunnels (cf. 68 in cages, 61 in tunnels 1998/99). Captures will have been reduced following modification of wire cages along Borlase Boundary and Lake Edge in November 1999 to prevent accidental capture of weka, which made them less accessible to hedgehogs. A broad comparison of the three years probably reflects this, i.e. 129 caught in 1998/99, 65 in 1999/2000 and 73 in 2000/01 (a detailed assessment of changing captures in wire cages has yet to be done). Hedgehogs do use tracking tunnels and have been recorded regularly during monitors of the treatment area, particularly in spring and summer on the lower lines. However none have been recorded at the lines set at Lakehead and at Rotoroa suggesting that the absence of any adjoining pasture in these areas may make them less suitable. Studies of hedgehogs have been carried out at Boundary Stream and Trounson mainland islands. At the former, Chris Berry estimated densities of between 4 and 9 a hectare (reported on at 1998 Mainland Island Hui) and suggested they could be having significant impacts, particularly on native invertebrates. Research may be needed at Rotoiti to determine numbers and identify what they are feeding on in beech forests. Whether specific control is initiated is probably best considered as an issue for mainland islands nationally, so a coordinated approach can be organised. 4.9 HARE AND RABBIT CONTROL AND MONITORING No activities were undertaken, though work assessing the impacts of hares in the subalpine zone was considered a priority for outside research. Anecdotal observations suggest that there were no dramatic changes in numbers of either species that would need to be taken into account in interpreting predator data, though there were more rabbits in the village in the spring/summer of 2000/01 and some shooting was initiated. 84
88 4.10 WEED CONTROL & MONITORING Weeds are not present in any significant numbers in the recovery area. Those that are present do not pose a significant threat to the forest ecosystem, but can impact on the composition of ecotone areas (riverbeds, forest margins). Limited control has been undertaken, partly under an Area office programme, as follows: Rowan (mountain ash): Numerous seedlings and several saplings pulled out around the new walking tracks and campground area at Kerr Bay. One adult cut and painted with herbicide inside the block. Given the high number of seedlings encountered compared to saplings and adults, it is considered that rowan has difficulty establishing inside the forest. Blackberry: One area of blackberry was sprayed on fence-line of farm boundary. Approximately fifty plants were pulled around the new tracks at Kerr Bay by volunteers at community tree planting day in May 1999 and re-emerging ones are removed on an ongoing basis. Ragwort: Encountered in each of the four open riverbeds within the recovery area. Some patches pulled, others left and allowed to flower and seed. Also found along fence-line of farm boundary where unable to be grazed by stock. Willow: Plants and branches removed from lakeside. (Branches removed before they have a chance to strike.) Radiata pine: One seedling removed from Percolator Creek. Broom: One broom removed from lake edge. Cotoneaster: Two plants removed from village/project area boundary. Douglas Fir: Two seedlings removed from Kerr Bay, along lake edge. Area staff continue to work with local residents and bach owners to remove actual and potential weed species in areas adjacent to forest and to encourage more appropriate plantings in gardens. 85
89 5. Results - Monitoring of Native Species and Systems The results of monitoring native flora and fauna are presented here, by groups or species. Performance targets could rarely be determined from existing knowledge. Performance is thus generally measured by assessing whether there has been positive change in numbers or productivity, either compared to a base level before pest control started or compared with a non-treatment area where no control is taking place. 5.1 BIRD MONITORING Objectives Programme objective: to increase bird numbers through the reduction of predation and competition by pest species. Monitoring objective: to document changes in bird populations and determine those that relate to pest control programmes Multi-Species Monitoring Five Minute Counts Objectives To record changes in the full range of bird populations and identify which of these are likely to be due to pest control by comparison with a non-treatment area. Methods The two transects established to carry out 5-minute bird counts in the treatment area (St Arnaud Range track with 21 stations) and Lakehead non-treatment (14 stations covering the same altitudinal range, were counted quarterly (end Feb., end May, end Aug., end Nov.) using two observers over three days. The November 1998 census was missed due to logistical constraints and the August counts were dropped from 2000 onwards to free up time for other work. The counts were done to a standard technique based on Dawson & Bull (1975). Results were entered into an Access database from which data was transferred to Excel for analyses. 86
90 The altitude of the different count stations is shown in Table 21: TABLE 21: ALTITUDE OF BIRD COUNT STATIONS (METRES ASL) ST ARNAUD LAKEHEAD STATION ALTITUDE (APPROX.) STATION ALTITUDE (APPROX.) A B O * * * * Note: Counts are not done at these stations. Though 200m apart along the track the zigzags bring them too close to adjacent stations 87
91 Results Analyses show a range of different trends for different species as shown in the figures that follow. Most are presented in similar format with Excel trendlines added where there was a visual suggestion of a trend. However many of these have a very low R 2 value i.e. the trendline fits the data very poorly. For other species such as kea, kaka and falcon too few individuals were counted for any useful results to be obtained. Five species, bellbird (Figure 46), yellow-crowned parakeet (Figure 47), tui (Figure 48), tomtit (Figure 49) and rifleman (Figure 50) suggest increases in numbers in the treatment area not shown at the Lakehead non-treatment area. In the case of rifleman this increase has been accompanied by an extension of altitudinal range (Figure 51), and in bellbirds the increase has been most dramatic at lower altitudes below 900m asl. (Figure 52). There is a strong relationship between bellbird counts and altitude (Figure 53) though there is a levelling off above c1200m. There is a very good linear fit to the counts below 1250m (R 2 =0.899, F=141,P<0.001) suggesting bellbird numbers decrease linearly with altitude up to this point (D. Kelly, pers. comm.). FIGURE 46: MEAN NO. OF BELLBIRDS/COUNT y = x R 2 = Mean No. Birds y = x R 2 = Lakehead St Arnaud Linear (Lakehead) Linear (St Arnaud ) May-97 Nov-97 May-98 Nov-98 May-99 Nov-99 May-00 Nov-00 May-01 Date 88
92 FIGURE 47: MEAN NO. OF PARAKEETS/COUNT 0.45 Mean No./Count y = x R 2 = Lakehead St Arnaud Linear (Lakehead) Linear (St Arnaud) y = 3E-05x R 2 = Jan-97 Oct-97 Aug-98 Jun-99 Apr-00 Feb-01 Month FIGURE 48: MEAN NO. OF TUI/COUNT Mean No./Count y = 8E-05x R 2 = y = 1E-05x R 2 = Lakehead St Arnaud Linear (Lakehead) Linear (St Arnaud) 0 Jan-97 Oct-97 Aug-98 Jun-99 Apr-00 Feb-01 Month 89
93 FIGURE 49: MEAN NO. OF TOMTITS/COUNT y = x R 2 = Mean No./Count y = x R 2 = Lakehead St Arnaud Linear (Lakehead) Linear (St Arnaud) 0 Jan-97 Oct-97 Aug-98 Jun-99 Apr-00 Feb-01 Month FIGURE 50: MEAN NO. OF RIFLEMAN/COUNT y = x R 2 = Mean No/Count Lakehead St Arnaud Linear (Lakehead) Linear (St Arnaud) 0.2 y = x R 2 = Jan-97 Oct-97 Aug-98 Jun-99 Apr-00 Feb-01 Month 90
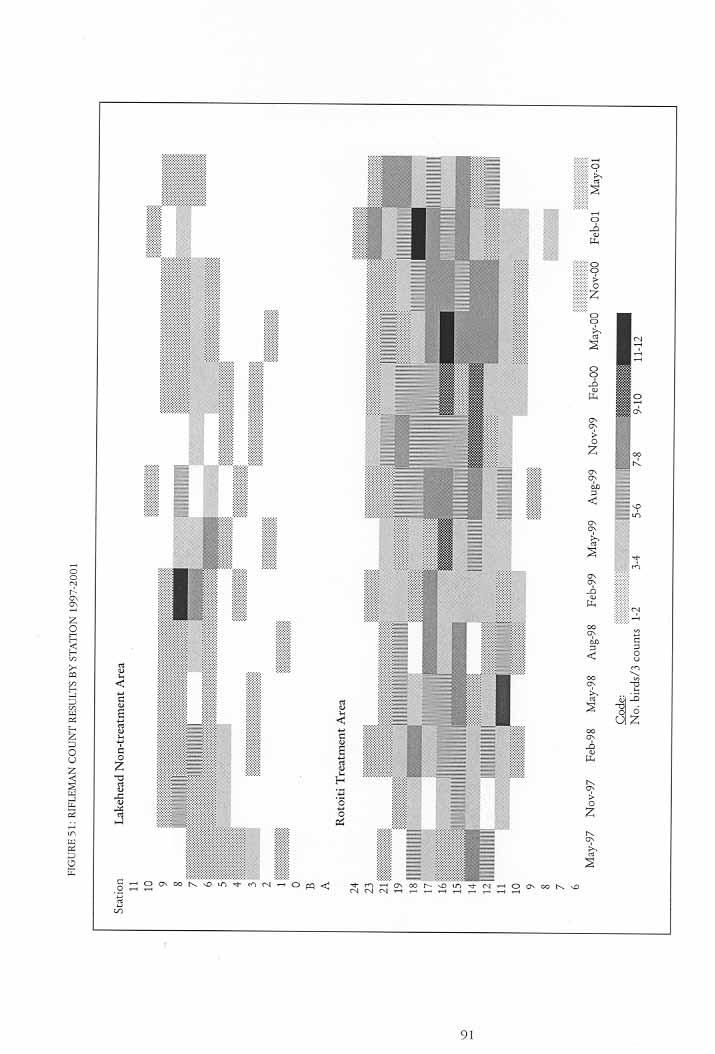
94 91
95 FIGURE 52: MEAN NO. OF BELLBIRDS BY ALTITUDE AT ST ARNAUD 7.00 y = x R 2 = Mean No Low High Linear (Low ) Linear (High) 1.00 y = x R 2 = Jan-97 Oct-97 Aug-98 Jun-99 Apr-00 Feb-01 Month Note to Figure 52: Low altitude includes counts from stations 1 to 10 (656 to 870m asl.) (n=10) and high altitude counts from stations 11 to 24 (901 to 1481m asl.)(n=11). FIGURE 53: RELATIONSHIP BETWEEN BELLBIRD COUNTS AND ALTITUDE ST ARNAUD 7 6 Mean No. bellbirds Altitude of station (metres a.s.l.) For other native species (Figures 54 to 57) and for the three most abundant introduced species (Figures 58 to 60) there were apparently no positive changes associated with the treatment area. The grey warbler plot (Figure 57) is the most striking showing remarkably similar results from the two sites. 92
96 FIGURE 54: MEAN NO. OF SILVEREYE/COUNT Mean No./Count Jan-97 Oct-97 Aug-98 Jun-99 Apr-00 Feb-01 Month Lakehead St Arnaud FIGURE 55: MEAN NO. OF FANTAILS/COUNT Mean No Lakehead St Arnaud Mar-97 Jan-98 Nov-98 Aug-99 Jun-00 Apr-01 Month 93
97 FIGURE 56: MEAN NO. OF ROBINS/COUNT Mean No./Count Lakehead St Arnaud Jan-97 Oct-97 Aug-98 Jun-99 Apr-00 Feb-01 Dec-01 Oct-02 Month FIGURE 57: MEAN NO. OF GREY WARBLER/COUNT Mean No./Count Lakehead St Arnaud 0 Apr-97 Feb-98 Dec-98 Sep-99 Jul-00 May-01 Month 94
98 FIGURE 58: MEAN NO. OF BLACKBIRDS/COUNT Mean No Lakehead St Arnaud Mar-97 Jan-98 Nov-98 Aug-99 Jun-00 Apr-01 Date FIGURE 59: MEAN NO. OF CHAFFINCHES/COUNT Mean No./Count Lakehead St Arnaud Mar- 97 Sep- 97 Apr- 98 Nov- 98 May- 99 Dec- 99 Jun- 00 Jan-01 Jul-01 Month 95
99 FIGURE 60: MEAN NO. OF SONG THRUSH/COUNT Mean No./Count Lakehead St Arnaud 0 May-97 Nov-97 May-98 Nov-98 May-99 Nov-99 May-00 Nov-00 May-01 Month Discussion These results show some positive changes in response to the project s pest control. However they need to be interpreted with caution. Firstly, the relationship between the number of birds counted and the number actually present will vary, particularly, seasonally depending on how active and vocal individuals are. Secondly the two areas are different (see section describing their vegetation) so would naturally support differing numbers of birds, and comparisons cannot be made directly between the two but only between the trend at one compared with the trend at the other. However one advantage of working in beech forests is that any changes in under-storey vegetation associated with the project s animal control will occur very slowly, so one can confidently say that there will have been no changes in detectability due to this effect. There are two reasons that the counts may underestimate the positive effects of the project s management. Firstly, bird numbers at Lakehead will probably have been positively affected to some degree by the project through two mechanisms. Young reared in the treatment area will have dispersed to Lakehead demonstrated in the case of a banded juvenile robin and predator numbers may have been reduced there through control exerted in the treatment area. Secondly, the increased bellbird song in the treatment area makes it harder to hear other species there and these are likely to be underestimated over time. In the absence of pest control, the beech masts in 1999 and 2000 and associated higher numbers of rodents, mustelids and perhaps feral cats had obvious consequences for many species. February or May 2001 counts at Lakehead were the lowest since the project started in the case of fantails, rifleman, tomtits and chaffinches and equal to the lowest for blackbirds, tui and parakeets. An exception appears to be silvereye which had unusually high counts everywhere in May
100 The species showing most apparent benefit from pest control share some characteristics. They were either ones for which we know stoats to be major nest predators (parakeets, bellbirds), or hole nesters (parakeets, rifleman) or honeydew feeders (bellbird, tui). Another, the tomtit, is known to be vulnerable to nest protection by rats. Species showing no effects include insectivores like the fantail and grey warbler and ones that could be classed as generalists, blackbird, chaffinch and silvereye. This might suggest that the project has brought immediate benefit to some species through reducing predation and/or increasing the availability of honeydew. It may not as yet have made a significant difference to the availability of other foods like invertebrates and fruits. It is informative to compare our 5-minute count results with those of some of the other mainland islands that have used the same technique. Boundary Stream also documented increases in bellbird, tui and rifleman but not tomtit (Department of Conservation, 2000). In the Northern Te Urewera most species have increased, particularly silvereye and kakariki of those also present at Rotoiti, tomtits have shown little change and grey warblers have declined. Developing a better understanding of the benefits of the project for different species requires more detailed work on an individual basis, which will be undertaken for a scientific publication. Some information can be gained by looking at 5-minute count results in more detail, such as focussing on birds seen which can remove some variability associated with singing behaviour, or comparing the same months year by year. Figure 61 shows, as an example, bellbird counts in May which reinforce the differences between the two sites shown by the total counts (Figure 46). Spatial information can also be informative, as was the case with rifleman. But these cannot substitute for doing detailed studies of the fates of individually marked birds and their nests. Within available resources we have been able to monitor two species in detail, kaka (section 5.1.2) largely through the work of a team from Science and Research, and robins (section 5.1.3). For both of these species 5-minute counts are of almost no use as a monitoring tool as will be discussed later. FIGURE 61: MEAN BELLBIRD COUNTS IN MAY y = 0.314x R 2 = Mean no./count y = 0.062x R 2 = St Arnaud Lakehead Linear (Lakehead) Linear (St Arnaud) Year 97
101 5.1.2 Kaka (Nestor meridionalis) monitoring Kaka monitoring has been undertaken as part of a research project by a Science & Research Unit team of Ron Moorhouse and Les Moran. The information presented here is largely drawn from three unpublished interim reports produced by Moorhouse (1999, 2000, 2001). Objective To determine whether predator control measures, implemented as part of the Rotoiti Nature Recovery Project, are an effective means of conserving kaka. Methods The key activity has been to document nesting success through locating nest sites, monitoring the outcome of all nesting attempts and determining causes of nest failure. This has been based on following adults that have been caught in mist-nets and fitted with radio-transmitters. Nestlings have been banded in the nest and a sample radio-tagged to monitor their post-fledging survival and dispersal. A significant effort was required to replace transmitters on birds in 2000/2001 as many of the original ones were failing sooner than manufacturers had specified. Most work has been carried out in the treatment area with a smaller sample of birds studied at a non-treatment site on the eastern side of Lake Rotoroa. Four female kaka were transferred to the project area from Whenua Hou (Codfish Island) in February 1999, at a time the local population was considered to be strongly biased towards males. They were held in an aviary within the forest of the project area until accustomed to an artificial diet and then released on the 8 th March. They were fitted with radio-transmitters and their fate and breeding attempts monitored. Results Breeding Success Kaka bred in the 1998/99 and 1999/2000 seasons but not in 2000/01. This was in line with previous findings suggesting that nesting only occurs in years when there is beech seed available in autumn. The outcomes of 14 nesting attempts within the RNRP area have now been determined between 1997 and 1999 (Table 22). TABLE 22. SUMMARY OF KAKA BREEDING SUCCESS IN THE RNRP AREA. BREEDING SEASON NO. NESTS NO. SUCCESSFUL NESTS NO. CHICKS FLEDGED 1997/ / / Total
102 The 1997/98 breeding season was a one-off because local nest protection measures were employed in lieu of stoat trap-lines which were not yet in place (Butler 2000). Subsequent discussion of nesting success will be confined to nests monitored after that season. Nesting success was found to be significantly higher in the treatment area than in previous studies at Big Bush and simultaneous studies at Lake Rotoroa (Table 23) (onetailed Fisher s exact test; RNRP area vs Rotoroa, p = 0.003; RNRP area vs Big Bush, p = 0.000). The proximity and similarity of the former DSIR/Landcare study-site in Big Bush to the RNRP area is such that the Big Bush data is considered to be a valid time-control ( before ) for kaka nesting success measured in the RNRP area. The Rotoroa data provides a spatial, independent control obtained at the same time as data collected in the RNRP area. TABLE 23: COMPARISON OF KAKA BREEDING SUCCESS IN THE RNRP AREA WITH THAT IN BIG BUSH (DSIR/LANDCARE DATA) AND THE ROTOROA NON-TREATMENT SITE. BIG BUSH (`85-`96)* RNRP (`98-`99) ROTOROA (`98-`99) No. nests No. successful nests % nesting success No. chicks fledged *Data set differs from that published in Wilson et al. (1998) because, at Dr. Beggs s suggestion, Dr. Moorhouse removed protected nest trees (which included 1 of the 2 successful nests) and included a failed nesting attempt we recorded in the 1996 season. Although predators killed the majority of radio-tagged females at both Rotoroa and Big Bush there has been no predation of nesting females in the RNRP area (Table 24). With the exception of a female that was killed during the nestling period in Big Bush (Wilson et al. 1998), all females killed by predators died during incubation. The 3 females preyed on at Rotoroa were killed in the 1999 season. One corpse displays the paired canine punctures and damage to the base of the skull that are typical of stoat predation (C. Gillies pers. comm.) but the other two don t look like typical stoat kills. Both show massive damage to the front of the skull and one has a crushed tarsus. Possum fur was found inside one of these birds nest sites. TABLE 24: CAUSES OF NESTING FAILURE IN BIG BUSH, THE RNRP AREA AND ROTOROA. (THE TOTAL NUMBER OF FEMALES RADIO-TAGGED IS SHOWN IN BRACKETS AFTER THE NUMBER PREYED ON.) BIG BUSH (`85-`96) RNRP (`98-`99) ROTOROA (`98-`99) No. females preyed on (no. present) 5 (7) 0 (5) 3 (5) No. nests failed in incubation 12 1* 5 No. nests failed in nestling period Total no. failed nests *Although a nestling in this nest may have hatched before being preyed on, this nest was put in the failed during incubation category because incubation was still in progress. 99
103 Most nesting attempts monitored at Big Bush and half of those at Rotoroa failed during incubation (Table 24). Wilson et al. (1998) did not routinely inspect nests that failed at this stage of the breeding cycle (P. R. Wilson, pers. comm.) so it is not clear why so many of the clutches they monitored in Big Bush failed to hatch. However, in all cases where nests failed during incubation at Rotoroa or the RNRP subsequent inspection revealed damaged, or missing, eggs. We found possum fur in the chamber of one such nest but in the other cases there were no clues to suggest which predator, or predators, might have been responsible. The one case of nest failure during the nestling period within the RNRP area involved a brood of c. 8 week old nestlings which were found dead with mortal injuries within a week of when they d last been seen alive. Spacings between canine punctures on their skulls and vertebrae were within the stoat size range (Moorhouse 1999). The 1999/2000 season was remarkable for the unusually high reproductive productivity displayed by kaka in the Nelson Lakes region, presumably a response to the big beech seed crop available that year. Two females in the RNRP area successfully fledged second broods and a female at Rotoroa was killed on the nest while attempting to produce a second brood. Another female nesting just outside the RNRP s northern boundary laid a record clutch of 8 eggs, twice the usual clutch size, after a predator destroyed her first clutch. Although this could be a case of egg-dumping by another female, given the surplus of males in this population there would seem little reason for females to do this. This season was also of much longer duration than 1998/99 one: c.f. dates from detection of initiation of first nest to completion of last: 21/11/98 c.5/3/99 and 26/11/00-8/6/01. Post-fledging survival A total of 35 fledglings have so far been produced within the RNRP area, 29 of which were radio-tagged to allow monitoring of post-fledging survival (Table 25). Twelve (41.3%) of these are known to have died, 5 (17.2%) are still alive, and the fate of 12 (41.3%) is unknown. In this last category are birds whose transmitters stopped working, birds (males) whose transmitters were removed and not replaced, and any birds that moved outside the range covered by our receivers (confirmed by an aerial survey in just one case). In 1997 the full predator management regime was not in place. Excluding this year hardly changes the pattern with 4 of 20 (20%) birds fledged in 1998 and 1999 still alive (Table 25). 100
104 TABLE 25: SUMMARY OF POST-FLEDGING SURVIVAL OF RADIO-TAGGED CHICKS FLEDGED WITHIN THREE BREEDING SEASONS IN THE RNRP AREA TOTAL % OF TOTAL No. died within 2 months No. died after 2-month period No. definitely alive as at 30/6/ No. not located/tx failed or removed Total no. fledglings radio-tagged All but three of the twelve fledglings confirmed to have died did so between 2 and 79 days after fledging, i.e. within the first three months. The exceptions were found about 13, 20 and 30 months after fledging. Ten of the twelve are considered to have been killed by predators, typically missing large body parts (wing, leg, head) and some being cached underground. For two, only the transmitters were recovered showing the carcasses had been dismembered. One exception was a bird that had fledged on 4/6/00 and was found dead on 11 August A subsequent autopsy and analysis suggested that the bird died from brodifacoum poisoning (0.09 mg/g brodifacoum in the liver). One of the chicks killed by a predator that year (on 6/3/ days after leaving the nest) had a small amount (0.01 mg/g) of brodifacoum in its liver and another tested negative. The other exception was a 1998 fledgling from a nest just outside the northern boundary of the RNRP area which apparently died of a diseased spleen (Twentyman 1999). There has been suggestion of a bias of fledgling mortality towards females cf. 47% compared to 8.3% for males (Table 26). However this difference is not statistically significant (Chi-square=3.27, p>0.05). TABLE 26: COMPARISON OF MORTALITY OF MALE AND FEMALE KAKA FLEDGLINGS FEMALES MALES % DIED SURVIVED DIED WITHIN 2 MTHS SURVIVED DIED WITHIN 2 MTHS FEMALE MALE 1997/ / / Total Fate of Whenua Hou (Codfish Island) birds One of the four females released in March 1999 was found dead a couple of months later (24 th May) in Big Bush. One bird has established itself within the project area and first nested on 17 th March 2000 though its nest was lost to a predator just on hatching. The remaining two birds moved to Teetotal Valley and Big Bush and were last located in November 2000 and January 2001 respectively. 101
105 Female productivity Six females have been monitored breeding in the project area and it is considered unlikely that any other breeding birds were missed. Their production is summarised in Table 27. TABLE 27: PRODUCTIVITY OF INDIVIDUAL FEMALE KAKA - RNRP FEMALE (AS TX NO.) COMMENTS 1997/ / /2000 TOTAL 04 No. eggs No. chicks fledged * No. eggs No. chicks fledged # 6* Died June '99 No. eggs No. chicks fledged (dead) No. eggs No. chicks fledged (not monitored) 3 2? 5 79 No. eggs No. chicks fledged Transferred from Whenua Hou 02/99 No. eggs No. chicks fledged (not present) (not 0? 0 * Two clutches laid that season # Clutch lost to predator just prior to Failed at egg stage Discussion It is concluded that kaka nesting success has been dramatically increased as a result of the project s pest control and mortality of nesting females eliminated in the three seasons studied. Control of stoats is considered the key factor (section 4.3), though reduced numbers of possums and rats may have played a role. Increased availability of honeydew through reduced wasp numbers could also have been important to the energetics of adults, particularly when feeding chicks. Losses of fledglings, as observed in the 1997/98 season, have continued. Observations indicate that, apart from their first few days out of the nest, fledglings, like adults, spend virtually all their time in the canopy. One aspect of fledgling behaviour that could predispose them to predation is their frequent and distinctive calling (Moorhouse & Greene 1995) which could allow predators to locate them more easily than adults. Fledglings are also likely to be more naïve than adults and consequently may not attempt to escape from predators. Most of the dead fledglings were considered to have been killed by predators and stoats were again implicated in several. The 1999/2000 season provided the first evidence that kaka at Rotoiti were being exposed to brodifacoum. The fledgling thought to have died from ingesting the toxin was independent of its parents and may have obtained it directly from in or around a bait station, while the other which obtained a trace was still being fed by its parents. Kaka deaths from this poison have previously been recorded on Kapiti Island when 3 or 4 of a sample of 20 birds were killed after the second drop of bait. Brodifacoum levels (of the 3 that were testable) were higher than at Rotoiti at 4.1, 3.3 and 1.2 mg/kg. It may be that birds only become habituated to cereal baits after a certain period. 102
106 Even if brodifacoum was a factor in the death of the second fledgling at Rotoiti, perhaps making it more vulnerable to predation, it is considered highly likely that the use of the poison will have been of benefit to the kaka population overall. It is likely that brodifacoum will have killed stoats in the project area, judging by the number of trapped individuals containing the toxin (section 4.3) and it has certainly played a role in keeping two other possible predators of kaka nests, possums and rats, at low densities. (Note: A possum has since been confirmed as the predator of a kaka nest in the North Island in 2002.) The mortality rate of fledgling kaka within the first few months (31% n=29) was similar to those found at Waipapa (38.9% n=18) (T. Greene pers. comm.) but much greater than in the Eglinton (15% n=13) (P. Dilks, pers. comm.). Without comparable data on the densities of stoats and other predators, it is not possible to determine whether these results relate to a differing effectiveness of predator control or some other factor. Brodifacoum could be involved as it was in use at both Rotoiti and Waipapa. However at the latter all fledging mortality occurred within 10 days of fledging (when birds were still obtaining most food from their parents) and was ascribed to either predation or natural causes such as starvation. The pattern of later mortality at Rotoiti could perhaps be explained by fledglings foraging for themselves picking up the toxin. Monitoring in a season without brodifacoum should shed light on this. No chicks reared in the RNRP area have yet bred. However some would have been three years old by the 2000/01 season and would have been expected to breed then had any nesting occurred. The recruitment of chicks and their subsequent nesting history will be important in determining whether the early kaka results translate into benefits at a population level. Moorhouse and G. Elliott (unpubl. data) have developed a preliminary model with the aim of establishing the area that would need to be managed to achieve such benefits. It considered the pattern of dispersal of young birds and concluded that an area of c.1500ha would be sufficient to have enough birds nesting at 80% productivity to offset losses (assuming that those nesting outside this area had only 10% success). Clearly in ideal conditions kaka can be very productive. The average number of eggs laid per female per breeding season was 3.42 (n=12, Table 26). However breeding did not occur every year. The pattern observed adds to the finding of previous studies, that kaka are significantly more likely to breed if beech trees are going to seed (Wilson et al., 1998). Breeding occurred in 1998/99 and 1999/2000 ahead of heavy and very heavy seeding of beeches those years (section 5.5.7) but did not occur in 2000/01 ahead of very light seeding. The transfer of the four females from Whenua Hou did not prove crucial to the maintenance of the Rotoiti population as more birds were found locally than initially seemed to be the case. However it did demonstrate that adult birds could be moved successfully into a new habitat, all surviving the transfer and initial aviary confinement, and three out of the four establishing themselves. Only one of the four remained in the project area. Acclimatising the birds to an artificial diet and then providing this diet after release in a feeder set near the holding aviary, appears neither necessary to allow the birds to survive the transfer, nor successful in encouraging all to remain on site. No birds were recorded using the feeder upon release. 103
107 5.1.3 Robin (Petroica australis) monitoring Introduction Robins were used primarily to monitor the success of the project s rat control, based on video camera studies elsewhere showing this predator to be responsible for the majority of nest failures (Brown, 1994). They can also act as an indicator of the success of overall predator control, as both cats and stoats may take birds. The treatment area monitored each year covered the lower part of the project area and a non-treatment area monitored in 1999/2000 and 2000/01 was located at Lake Rotoroa including the Sabine River delta and the lower slopes of Mt Misery. Objectives and Performance Measures Objective 1 To record the success of breeding attempts in the treatment area as a measure of the effectiveness of rat control. Performance measures Fate of nesting attempts of at least ten pairs. Data collected was number of nesting attempts, eggs laid, eggs hatched and number of chicks fledged. Objective 2 Record survival of robins as a measure of the effectiveness of overall predator control. Performance measures Survival of banded birds, records of mortality and the proportion of unpaired males. Objective 3 Document an increase in the robin population over time. Performance measures The number of territories that are occupied by breeding pairs and also number of territories occupied by unmated males. Territory size will also be recorded over time. Objective 4 Document robin dispersal at Rotoiti to determine the value of the treatment area as a source of birds to colonise other sites. Performance measures Record sightings of the number of birds located outside the block Methods The methodology closely followed Powlesland (1997) based on one or both individuals of a pair being colour-banded. In 1998/99 10 pairs were monitored in the treatment area (one unbanded), beginning on the 17 th of August and finishing in mid February. All pairs were visited at least once a week and at critical times of development twice. 104
108 In 1999/ pairs were followed at Rotoiti from the 8th of September to the 10th of February at Rotoiti and six (all that could be readily located) at Rotoroa from the 11th of September to the 24th of January. At Rotoiti all pairs were visited at least once a week and at critical times of development twice, whereas at Rotoroa birds were visited once a week due to limitations of time and resources. In 2000/01 9 pairs were monitored at Rotoiti from 18th September to mid-february and 8 pairs at Rotoroa from 20th September to mid-january (two of which were located partly through the season). The first two seasons of monitoring were associated with the use of brodifacoum for rat control and the third with trapping. Results Objective 1 nesting success TABLE 28: NESTING SUCCESS SEASON: 1998/ / /01 SITE: RNRP RNRP ROTOROA RNRP ROTOROA No. pairs monitored No. nesting attempts No. nesting attempts/pair No. nests fledging young % of nests successful TABLE 29: PRODUCTION OF JUVENILES SEASON 1998/ / /01 SITE RNRP RNRP Rotoroa RNRP Rotoroa No. pairs monitored No. juveniles fledged No. juveniles/pair
109 TABLE 30: LIKELY CAUSES OF NEST FAILURE SEASON 1998/ / /01 SITE RNRP RNRP ROTOROA RNRP ROTOROA Predation 1 1 (rat) 0 2 (rat) 2 (rat) 5 (at least 2 rat) Natural (weather) 2 (wind damage, rain) (rain) 1 Unknown some assigned to rat on basis of hair and/or faeces and/or teeth marks on eggs. Other could not be assigned to a specific predator 2 predation could not be ruled out TABLE 31: PRODUCTIVITY OF PAIRS IN RNRP TREATMENT AREA IN 1998/99 - FIGURES SHOW NUMBER OF CHICKS FLEDGED. PAIR AUG SEPT OCT NOV DEC JAN 99 FEB 99 NO. OF NO. OF ATTEMPTS SUCCESSFUL ATTEMPTS This pair proved elusive through much of the season and could have had earlier nesting attempts that were not recorded. 106
110 Objective 2: Survival Many birds have been banded in the treatment area, St Arnaud Village and Lake Rotoroa and future analysis of subsequent sightings of these will be used to provide some estimates of survival/mortality. Preliminary results from 1998/99 suggest higher survival in the project area than the village (Figure 62), however much less time was spent searching in the village so data from subsequent years needs to be looked at to confirm any pattern. FIGURE 62: NUMBER OF ADULT ROBINS SEEN BETWEEN TWO BREEDING SEASONS Number of robins / /99 0 RNRP St Arnaud Village Location Patterns of female mortality during the breeding season have varied annually (Table 32). TABLE 32 SEASONAL SUMMARY OF FEMALE MORTALITY AND PROPORTION OF UNMATED MALES. 1998/ / /01 RNRP RNRP ROTOROA RNRP ROTOROA No deaths of banded adults during breeding season (0%). All males located had mates. 2 females lost during breeding season (20%). 1 male without a mate. 2 females lost during breeding season (33%). Most males without mates. 2 females lost during breeding season (22%) 1 male without a mate. 4 females lost during breeding season (50%) 4 males without a mate. Overall the RNRP had a well-balanced sex ratio of males to females and there were very few males recorded without a female throughout an entire season. However at Rotoroa a number of males were located at the start of a season who never found a female - typically around 14 males found initially but only 8-10 of these ever had a female. Objective 3 Document an increase in the robin population over time. 107
111 Further investigation is needed to report on this objective. There does not yet appear to have been a significant increase in the number of breeding territories in the project area and there is a suggestion that habitat may be a limiting factor. All breeding territories have contained some swamp with thick cover (particularly from Coprosma spp.) while areas of more open beech forest have not been occupied. For Objective 4: Dispersal No specific resources have been able to be allocated to searching for dispersing birds. However staff have observed several significant movements in the course of other work. Two birds, banded as juveniles in the treatment area in the 1998/99 season, moved relatively long distances to the south: one to the Hopeless Creek junction up the Travers valley about 15km away and the other to Lakehead 6 kilometres away. Two birds moved west, one to Teetotal Valley and one to Big Bush, about 7 kilometres away. There also seemed to be significant movement of juveniles between the village and the RNRP. Discussion Nesting success in the RNRP treatment area was consistently very high for three seasons - 90% (n= 10 attempts) in a shorter study in 1997/98 (Butler 2000), 88.9% in1998/99 and 89.6% in 1999/2000 (Table 28). Over this period the tracking tunnel index for rats was below 5%. Reduced success was apparent in 2000/01 (76.9%) when the rat index did climb to 34% for a time, a point which coincided with the loss of breeding females and nests. Significantly higher nesting success occurred in the treatment area than in the nontreatment area in both 1999/2000 and 2000/01. Table 31 shows the high level of productivity achieved in 1998/99 including what was considered the first record of a New Zealand robin pair rearing four broods in a season a result which lead to a brief publication (Etheridge & Powlesland, 2001). The patterns of female mortality (Table 32) were consistent with changes in predator populations. In the treatment area no birds were lost in 1998/99 but then losses occurred in the next two years at a time that predator populations increased following beech masting. A consistently higher proportion of females were lost in the non-treatment area. The long distance dispersal movements observed indicate the potential for a productive robin population in the treatment area to stock other areas. (Interestingly, observations made over the 1980s suggested that robins were not found up the Travers any further than Hopeless Creek (Butler, 1991)). Clearly there are doubts about the breeding success and survival of robins where there is no predator control but birds have persisted at Lakehead in small numbers throughout the period. These results have been taken to establish a consistent link between robin productivity and rat control, so intensive monitoring has now ceased to allow resources to be redirected to other activities. Some mapping of territories and banding/mortality/ recruitment studies will continue but without detailed checks of nesting. 108
112 5.1.4 Kea (Nestor notabilis) Monitoring & Research The nesting of kea in the treatment area has been monitored with varying effort. Up to 1999 it was included in a research study conducted by Josh Kemp (Kemp & Elliott, in prep.) and some birds were fitted with radio-transmitters. Over that period the occupation of a single nest at around 1000m altitude was monitored through following the male Bob. Following the death of his mate in 1997 (reported in Butler 2000), no nesting was recorded in 1998/99, but this did resume in 1999/2000. That season transmitters were placed on the female and the two chicks that fledged. Both chicks typically spent most of the time foraging with Bob who was used to frequenting the village. One caused great drama by becoming entangled in fishing line at the top of a tall beech in the village, from which Ron Moorhouse rescued it with a rope climb. It was seen during a census at the Rainbow Ski field in winter The second was found dead in the village after behaving strangely for a few days and an autopsy revealed poisoning by lead, which the bird was thought to have obtained from lead-headed nails on house roofs which it was observed chewing on. No nesting was noted in 2000/01. In the wider study, kea had an average nest survival of 46.6% and low female mortality (Kemp & Elliott, in prep.). It is suggested that their nests suffer less predation than kakas due to most being located at higher altitudes and breeding being earlier in the season. The mixed results from our treatment area show the dangers faced by kea living in association with human settlements Falcon (Falco novaeseelandiae) Monitoring We have continued to monitor falcon nesting in the treatment area, locating breeding territories by the aggressive behaviour of the occupants and then locating nests when possible by ground searches. 1998/99: A pair nested within the southern part of the block in the same territory as in the previous year. The nest was not monitored closely, but subsequent observations of a family group suggested at least two chicks were fledged. 1999/2000: A pair nested at a new site on the edge of the block adjacent to the farm (N ). Three eggs were being incubated by 8/11 and all hatched producing two males and a female which were banded and fitted in early February with tail-mount transmitters. The adult female was also caught and banded. The juvenile female was found dead a few weeks after fledging, apparently either killed or scavenged by a predator, and the two males later disappeared. Attempts were made to locate their transmitter signals during regular sweeps for kaka and a flight during which they were also searched for was undertaken on 18 January /2001: Nesting occurred at both the 1998/99 site and the 1999/2000 one, giving two pairs in the treatment area for the first time since the project started. The re-use of the former site suggests that one of the pair there had lost its mate and thus did not breed in 1999/2000 but re-paired in 2000/01. Each pair successfully reared three young, two females and a male, which were subsequently banded. 109
113 Four seasons of successful nesting is encouraging. It suggests that falcons were not generally picking up significant toxins through secondary poisoning during when brodifacoum was in use which some had raised as a possible concern. Productivity in the treatment area has also been very high compared to nests at other sites in the area (cf. 100% to 27.3% combining years - Table 33). It is suggested that birds at the former are benefiting from reduced predator numbers, being vulnerable through their habit of nesting on the ground. Eggs went missing from two of the nests elsewhere and possums were implicated in the failure of a third. TABLE 33: NESTING SUCCESS OF FALCON IN THE PROJECT AREA AND AT OTHER SITES IN THE VICINITY 1999/ /01 RNRP Other RNRP Other No. of nests No. eggs laid No. chicks fledged % of eggs producing fledglings % nesting success It is hoped that by colour-banding chicks reared in the treatment area, their recruitment into the local population can subsequently be recorded. 5.2 INVERTEBRATE MONITORING Flying Insects Objectives To document the beneficial impacts of the control of wasps on the populations of the native insects that make up their prey. Methods The twenty malaise traps set up in the lower part of the treatment area were run each season along with ten traps moved from their previous site in the Howard Valley to the slopes of Mt Misery (to tie in better to previous and ongoing work by Landcare Research). In 2000/2001 an additional 10 traps were established 3km south of the southern boundary of the treatment area near the shore of Lake Rotoiti, identified as Lakehead. Traps were typically run from November to May. Several adjustments have been made to the detailed methodology each year to reduce the time involved in collecting and sorting samples including moving to a largely fortnightly collecting cycle and counting wasps in the field. 110
114 Analyses have been running at least a season behind the collecting process. The focus on the three target groups identified by Toft & Dugdale (1998), crane-flies (Tipulidae), bristleflies (Tachinidae) and geometrid moths (Geometridae) has continued. Sandlant (2000) analysed a sub-sample of the 1998/99 collection (samples from every 3 rd or 4 th week) and Landcare Research were contracted to count the indicators from two weeks of the 2000/01 one, before they assay these destructively to measure the biomass of different insect groups. (The biomass approach has shown up some differences relating to wasp control in their research at Lake Rotoroa.) Results Figure 63 presents an example of the results for 1998/99 obtained by Sandlant (2000) showing the counts for one of the tipulids (Atarba eluta). Similar plots were presented for all the species/groups sampled. FIGURE 63: ATARBA ELUTA PLOT FROM SANDLANT (2000) Landcare Research examined samples from the two periods of 20-23/11/00 to 6/12/00 and 27-28/02/01 to 6-7/03/01 from each of the three study areas and the results are summarised in Table
115 TABLE 34: COUNTS OF INDICATOR SPECIES CAUGHT OVER TWO WEEKS IN SEASON (LANDCARE RESEARCH) MEAN NO./TRAP/DAY SPECIES/GROUP RNRP TREATMENT AREA LAKEHEAD ROTOROA NOV/DEC 2000 FEB/MAR 2001 NOV/DEC 2000 FEB/MAR 2001 NOV/DEC 2000 FEB/MAR 2001 Atarba eluta Elephantomyia zealandica Toxorhina ochraceum Austrolimnophila argus Austrolimnophila chrysorrhoea Rhamphophila sinistra Discobola venustula A-guild Tachinidae B-guild Tachinidae C-guild Tachinidae The beetles (Coleoptera) in our 1997/98 samples were analysed by a Canterbury University M.For.Sci. student (Jones, 2000). She found higher species diversity in the treatment area but considered that this was due to habitat differences rather than the effects of wasp control. Discussion The data presented serve more as an indication of the sampling being undertaken at this stage rather than providing any clear conclusions. Sandlant (2000) suggested after his 1998/99 analyses that there was a small hint that three tipulid species, Austrolimnophila argus, A. chrysorrhoea and Limonia venustula (or Discobola venustula) were showing some benefit from wasp control. He also indicated large differences for tipulids and tachinids between Rotoiti and Rotoroa, which lead to the adoption of the third site at Lakehead. Something that stands out from a superficial look at the small sample of 2000/01 results is the much higher counts of tachinids at Rotoiti compared to the other sites. This was not so apparent in 1998/99 for one of the three groups ( A-guild ) in Sandlant s data, but true for the other two. Analyses to be conducted over the next few months should clarify whether any benefits to certain species or groups are apparent and determine future work in this area. Counts of indicator species after five years of control and biomass measurements after four years will allow us to assess the relative value of these two approaches to further assessing the benefits of wasp control. 112
116 It could be worthwhile to examine Coleoptera diversity in more recent samples to assess the cumulative effects of several seasons of wasp and rodent control, as a follow-up to Jones s work Ground Invertebrates Objectives To further investigate the use of pitfall trapping as a means to assess changes in ground invertebrate numbers in relation to predator control. Results A research student, Todd Banks of Canterbury University, worked here over the 1998/99 summer conducting pitfall trapping in the treatment area (3 transects, 60 traps at each) and Lakehead non-treatment area (2 transects, 60 traps at each), and identifying invertebrate remains in hedgehog, stoat, possum and rat stomachs. Initial sorting of the beetles identified 98 recognisable taxonomic units of which 40 were Curculionidae (weevils). The weta fauna is particularly interesting. A recent review of ground weta (Hemiandrus spp.) identified three species present in or near the treatment area, two of which are poorly known with their nearest relatives apparently found at either end of the country (Johns 2001). Some altitudinal differences in samples have been noted. The final results of this research are still awaited. It is hoped that they will lead to the project undertaking its own pitfall trapping, focusing on species that are rat and mouse prey to identify the benefits accruing from control of these species. Johns review did record that the mainland island would without doubt help preserve the interesting weta fauna in Nelson Lakes National Park (Johns, op. cit.) Land Snails (Powelliphanta St Arnaud ) A small population of snails was located in 1997 in tussock and mountain beech forest at tree line at the northern end of the block. Morphological analyses of the snails collected since has grouped them with specimens from Speargrass and Mt Murchison as a new taxon about which very little is known (Walker K., unpubl. data). Monitoring of this population is ongoing. Objectives Document population trends of this snail as pest control proceeds. Methods The standard monitoring protocol (Walker, 1993) is being applied with the marking of 5 x 5m permanent plots and the recording and measuring in them of all live and dead snails at intervals of several years. Six plots were previously established in the season, four in tussock and two in mountain beech forest on the northern boundary of the Mainland Island (Butler, 2000). Six more plots were established in , four in mountain beech and two in tussock. 113
117 Results The results of all the monitoring to date are summarised in Table 35. TABLE 35: SNAIL PLOT RESULTS Plot site Tussock Forest Tussock Forest No. of plots No. live snails No. dead snails No. dead snails whole No. dead snails broken as fragment, 1 showing possible possum damage. 2-2 crushed, 2 broken from unknown cause. In addition a search of a wider area of forest beneath the colony in 1999 produced 21 shells of which 10 were intact, 4 showed probable thrush damage, 2 had tiny scratches which could have been caused by mice, 1 was crushed and 4 were broken from an unknown cause. Four dead shells were found by a departmental deer hunter (Graeme Omlo) in 1999 in the tussock approximately one kilometre north of the Mainland Island. (GR & ) This may represent a population that could be used as a control. Discussion All existing plots have been measured once and it is proposed that they be re-measured in summer 2003 which may give an indication of any population trend. Overall, a higher proportion of live snails and intact shells have been found than in many lowland populations of Powelliphanta, probably indicating lower levels of exotic predator mortality than elsewhere. The tussock appears to be a better habitat than the forest to judge by the higher proportion of live snails found there. This could be related to reduced thrush predation, higher humidity or more food there. One hypothesis is that the forest may become more suitable in the future as pest numbers are reduced and understorey condition improves. Strategies are being developed for poorly known taxa of Powelliphanta like this one, as part of a Recovery Plan for the genus (Walker, K. pers. comm.), which may help to guide future work at St Arnaud. One issue that has been identified by Walker is the relatively large numbers of hare and deer pellets found in the plots, particularly in the tussock. The vegetation zone at and just above tree-line is a diverse one which may well be a favoured site for these mammals. The monitoring of snails inside and outside exclosures designed to keep hares and deer out could determine whether these pests were having significant impacts. 114
118 5.2.4 Beech scale insects (Ultracoelostoma spp.) and honeydew monitoring Objectives To document changes in honeydew levels associated with reduced numbers of wasps following their control. The honeydew produced by beech scale insects is an important resource for native fauna and taken in large quantities by wasps in summer. It was predicted that an increase in the honeydew resource should occur as a result of wasp control. Performance Measure Maintaining honeydew energy levels at above 2500J/m 2 was one of the objectives of wasp control (section 3.5). Methods Honeydew was sampled from 1997 to 2000 using a standard protocol developed by Landcare Research. A 50 x 5 cm quadrat was placed on the north side of selected honeydew trees, 1.5 m from the ground. The numbers of threads, both with and without drops, were counted within the quadrat. Volume was measured by uptake into capillary tubes and sugar concentration was obtained using a refractometer allowing the available honeydew to be expressed as energy (Joules) per m 2. Honeydew was generally sampled weekly at both the treatment site and Rotoroa unless rain intervened (counts required no rain in previous 3 days) and from November through to April. Results Figures 64 and 65 show highly elevated levels of honeydew in the treatment area (Rotoiti) around weeks 15 to 22 (mid-february to first week April) which were not found at Rotoroa. This coincides with the period of the highest impact of wasp control (section 4.5.) maintaining low numbers in the treatment area at a time of very high wasp numbers at the non-treatment. (Note to graphs: A zero reading indicates that sampling was not undertaken rather than the absence of honeydew). 115
119 FIGURE 64: HONEYDEW ENERGY LEVELS 1998/99 (NOVEMBER-APRIL) Mean Concentration (J/m 2 ) Rotoiti Rotoroa Week (numbered from 1st week November) FIGURE 65: HONEYDEW ENERGY LEVELS 1999/2000 (NOVEMBER-APRIL) Mean concentration (J/m 2 ) Rotoiti Rotoroa Week (numbered from 1st week November) Discussion This monitoring established a very clear link between wasp numbers and honeydew availability in 1998, 1999 and Concentrations were maintained above the target 2500 J/m 2 in the treatment area almost every sample, but dropped below this at intervals in the non-treatment area. The link was considered clear enough to discontinue this monitoring after 2000 to free up resources for other work. Future work would involve monitoring wasps alone, assuming that if numbers could be reduced to the levels seen in 116
120 then a significant honeydew response would occur. It was recommended that some honeydew monitoring should be re-instated after a few years in March to check that the marked differential between treatment and non-treatment areas was maintained. 5.3 BAT SURVEY AND MONITORING Objectives To document any presence of long-tailed and short-tailed bats in the treatment area. To design a monitoring regime in the future to detect any benefits of pest control on bat populations. Methods In the 1998/99 summer, automatic batbox detectors were placed at several sites in the treatment area as part of a wider Area Office programme. They were set to a 40khz frequency initially to locate any long-tailed bats, and then at 28khz for short-tailed after one of the former was detected. Results At 40 khz (within frequency range for long-tailed but not short-tailed) 11 fine nights. 1 pass At 28 khz (within frequency range for short-tailed but not long-tailed) 6 fine nights, 0 passes The one long-tailed bat pass was recorded at the same site that passes were detected at the same frequency in on the forest-farm boundary. Discussion The work done has been preliminary and there were problems with the equipment - VOR setting was possibly set too low on nine nights, so not detecting to maximum efficiency. Long-tailed bats were searched for at forest edges and open areas and have been found to be present. Limited searching was done for short-tailed bats which as they would probably use the interior of the forest were going to be much harder to detect. Then, detecting the presence of bats was not going to achieve much in itself without a system for monitoring any changes. So no resources were allocated to this task in 1999/2000 and 2000/01 to allow more work on other priorities. However a monitoring protocol for long-tailed bats using line transects has recently been established (O Donnell & Sedgeley 2001). This involves walking a minimum of 50 1-km transects to develop a picture on a landscape scale and should be considered as a future activity at Rotoiti if resources allow. Transects could be established running north-south in a series from the Rainbow Valley through St Arnaud to Rotoroa and Murchison to achieve a baseline against which any changes associated with the project s pest control might subsequently be measured. Recent studies have shown that long-tailed bats have very large ranges in beech forest, averaging almost 1600ha for the wider-ranging males (O Donnell, 2001), so that any area that seeks to protect a population will need to be much larger than the current site at Rotoiti. 117
121 5.4 LIZARD SURVEY AND MONITORING Objectives Conduct annual surveys to detect lizards present in the MI, with a view to developing monitoring systems in the future to detect population changes in response to management. Methods Tony Whitaker, a local herpetologist, was contracted in early 1999 to provide staff with training in techniques to locate both diurnal and nocturnal lizards and to develop a survey programme. We also contributed funds towards the publication of a Conservancy-wide key (Whitaker, 2000) to aid identification of any lizards found. Results Geckos: no geckos were located during 6 person-hours of day and night searches during Tony s visit and none have been observed to date in the treatment area. Several Nelson green geckos (Naultinus stellatus) are occasionally found in the general vicinity. Skinks: No skinks were located during the training in the project area, though only 3 person-hours were spent searching in sub-alpine areas. Several common skinks (Oligosoma nigriplantare polychroma) were found around the village. In February 2001 one skink was seen at the top of the range and follow-up work is planned to capture and identify any found in the vicinity. Discussion The initial training proved very valuable in raising the awareness of the project team about lizards and the signs to look for. Limited follow-up survey work took place as this was assigned a fairly low priority and had to compete with other activities for the necessary periods of suitable weather. The overall lack of sightings, both during the few surveys and the huge number of hours that staff have been working in the treatment area, leads to the conclusion that reptiles are in very low numbers there at present. Numbers are indeed so low that survey work is likely to be unproductive and a robust monitoring regime completely impractical. It is thus considered that we have established a form of baseline. For the time spent in the treatment area in a single skink has been observed. Any reptiles present are expected to benefit from the project s predator control however they breed very slowly, geckos typically producing two young a year and skinks perhaps 5 to 10 young. In 5 to 10 years time their presence may become more apparent. If we continue not to detect lizards one could conclude that they are locally extinct or at such low numbers that there is limited capacity for populations to recover. Transfers of species into the treatment area could thus be considered as future options. 118
122 5.5 PLANT AND VEGETATION MONITORING Vegetation Survey (Norton, Brown & van Eyndhoven, 2000) The project contracted two Canterbury University students, Erik van Eyndhoven and Rayna Brown, to undertake a field survey of the vegetation of the treatment area and Lakehead non-treatment area. Information from a 1970s study of the Mt Misery nontreatment area by John Leathwick was also incorporated in the report. Objectives To identify and map the plant communities by type present in the mainland island and the non-treatment areas of Lakehead and Mt Misery. This knowledge of the plant communities present will be used to direct future vegetation monitoring in the treatment and non treatment areas. Methods Forest Research Institute methodology of the unbounded Recce plot of c10m radius (Allen & McLennan 1983) was used to sample 116 sites in the treatment area and 58 sites at Lakehead. These sites were randomly located using bait station lines in the former and three lines extending from lakeshore to tree-line at the latter. This data along with historical records from 41 sites collected by Landcare Research were analysed using PC Recce and ordination carried out using CANOCO. Distribution maps were produced showing where the plots of the different forest types were located. There was too much small-scale variation, particularly on the lateral moraine and terraces, for these to be used to produce vegetation maps for sites with any degree of confidence. Results Eight forest types were identified (Table 36). 119
123 TABLE 36. FOREST TYPES AS IDENTIFIED BY VEGETATION SURVEY. NO. DOMINANT SPECIES PRESENT TYPE DESCRIPTIVE 1 Notofagus menziesii-n. fusca-prumnopitys taxifolia/pseudopanax colensoi - (Coprosma rotundifolia-neomyrtus pedunculata-carpodetus serratus- Griselinia littoralis)/microlaena avenacea Silver beech-red beech-matai/five-finger 2 Nothofagus solandri-(n. menziesii)/leptospermum scoparium-kunzea ericoides-griselinia littoralis Mountain beech-silver beech/(manuka) 3 Nothofagusfusca-N. menziesii-(n. solandri)/(griselinia littoralis-coprosma microcarpa) Red beech-silver beech 4 Nothofagus fusca-n. menziesii-(n. solandri) Red beech-silver beech-(mountain beech) 5 Nothofagus fusca- N. menziesii/n. fusca-n. menziesii-weinmannia racemosa-griselinia littoralis/coprosma microcarpa-(c. rhamnoides)/blechnum discolor Red beech-silver beech/coprosma microcarpa 6 Nothofagus solandri/n. solandri-(coprosma pseudocuneata) Mountain beech 7 Nothofagus solandri-(n. menziesii) Mountain beech-silver beech 8 Nothofagus solandri/coprsosma pseudocuneata-c. sp. aff. parviflora- Chionocloa pallens-dracophyllum uniflorum-gaultheria depressa-olearia lacunosa/uncinia spp. Mountain beech-coprosma Of the eight forest types identified, five were present in the treatment area, and two were found in all three areas. Table 37 and Figure 66 to 69 show where each vegetation type was found, and what proportion of each area these types represent. TABLE 37. FOREST TYPES BY NUMBER AND PROPORTION OF PLOTS BY SURVEY AREA. RNRP MT MISERY LAKEHEAD TOTAL FOREST TYPE NO. % NO. % NO. % NO. % Total
124 FIGURE 66: DISTRIBUTION OF FOREST TYPES ACROSS STUDY AREAS % of plots RNRP Lakehead Mt Misery Type 1 Type 2 Type 3 Type 4 Type 5 Type 6 Type 7 Type 8 Forest Type FIGURE 67: FOREST COMPOSITION OF RNRP TREATMENT AREA Type 8 Type 7 Type 6 Forest type Type 5 Type 4 Type 3 Type 2 Type % of plots 121
125 FIGURE 68: FOREST COMPOSITION AT LAKEHEAD Type 8 Type 7 Type 6 Forest Type Type 5 Type 4 Type 3 Type 2 Type % of plots FIGURE 69: FOREST COMPOSITION AT MT MISERY Type 8 Type 7 Type 6 Forest type Type 5 Type 4 Type 3 Type 2 Type % of plots Discussion The forest types found are described as typical of beech forests in the region, transitional between the dry eastern mountain beech forests and the wetter western mixed beechpodocarp forests (Norton et al, 2000). The Mt Misery site is more towards the latter category with a podocarp element at lower altitudes. 122
126 The survey shows some differences in the forest types found at the three sites. The treatment area has one type (2 mountain beech-silver beech/ (manuka)) not found at either non-treatment area. This was recognised early on and attempts were made to find similar lateral moraine sites of impeded drainage. The nearest equivalent sites appeared to be in the Howard Valley but access to these was considered too difficult. The non-treatment sites do have habitats not found in the treatment area. This can be considered less of an issue. For our vegetation monitoring we would ignore these areas and compare trends within the habitats found in the treatment area. However the presence of these types may influence other species we monitor, for example the fruiting of the podocarps at Mt Misery is likely to influence rat numbers there. A careful approach is thus needed when interpreting our results, looking at trends in rat numbers over similar altitudinal ranges to address the issue mentioned. The key to maintaining an adequately robust approach is not to compare numbers between areas but trends between areas. The vegetation of the Mt Misery site differs significantly from that of the other two as one would expect from it being further west and extending to lower altitude (Rotoroa lake level 450m cf 620m at Rotoiti). The emphasis of monitoring at this site is on widerranging species for which Lakehead was considered too close, e.g. kaka, and also on aspects for which there is a long history of data here (from DSIR Ecology Division then Landcare Research) such as beech seeding and rodents. Brown & Norton (in prep.) gave further consideration to the project design. In recognising that it is often not possible in natural systems to find perfectly matching treatment and non-treatment sites, they emphasised the importance of replicating nontreatment sites. This report shows that progress is being made in this regard with monitoring for rodents, wasps (malaise traps) and mistletoes occurring at both Lakehead and Mt Misery and plans to extend this to birds. The possibility of replicating treatment areas will be considered during the development of a new strategic plan for the project. A key use of the vegetation survey will be in the stratification of the project s vegetation monitoring. As an example it has since been possible to ensure that 20x20m plots cover each habitat type and roughly in proportion to their occurrence Mistletoes Objectives Monitor the health of selected plants within the treatment and non-treatment areas to test the hypothesis that the apparent decline is the result of possum browse Record the anticipated recovery of the mistletoe population with sustained possum control Use mistletoes to monitor possum presence/impact within the treatment area. Methods Plants have been located in the course of other work, and as a result of a specific walkthrough survey as part of the vegetation survey. All plants found to date have been tagged and a standard set of data collected from each, including measurements and amounts of browse using the Foliar Browse Index methodology (Payton et al., 1997) and photo points taken. All new plants will be added to the dataset but only thirty of each species will be 123
127 monitored annually. Individuals will be rotationally monitored, such that each is included at least once every three years. Results Peraxilla tetrapetala Seventy two plants have been reported, tagged and surveyed from the lake edge, almost to the alpine zone. Most are established on trunks ranging from ground level to the canopy, forty one of which were on Nothofagus solandri, with thirty one on Nothofagus fusca, and one unrecorded. Plant size ranges from dormant haustoria (no branches or leaves) to large cylindrical clumps surrounding a metre or more of the host. Visual observations suggest that possum browse was widespread 4 6 years ago and that possum browse has been largely absent in the intervening years. However several plants suffered heavy attack in the months prior to the first treatment of the block with 1080 in October Several plants have been found as 5cm or less clumps of new growth on mid trunk, suggesting recovered growth from some past disturbance. Two individuals have died due to the death of the host or host limb. A further sample of more than 70 plants have been incidentally encountered and have yet to have baseline records made. Peraxilla colensoi Twenty three plants have been reported and surveyed, all between the lake and the toe slopes of the St Arnaud Range. All are hosted by Nothofagus menziesii. A further four have been incidentally encountered and have yet to have baseline records made. Alepis flavida Sixteen plants have been found, fifteen on Nothofagus solandri, and one on Nothofagus fusca. As this is the most common mistletoe in nearby Kerr Bay and generally widespread in the Park, the small sample is probably due to the difficulty of seeing them rather than a real scarcity. Alepis generally attach to branches, often in the outer foliage and have sparse foliage similar in colour to beech when viewed from beneath. One plant in Kerr Bay is established on a Coprosma tayloriae shrub, indicating that there is potential to find this less host-specific mistletoe on plants other than beech. A further 11 plants have been incidentally encountered and have yet to have baseline records made. Non-treatment sampling Minimal non-treatment work has been undertaken following plants studied by Landcare Research on Mt Misery and new plants found in the course of other work at that site. Data not presented as insufficient. Further plants are required to make a sample of sufficient size, particularly for Peraxilla colensoi and Alepis flavida. Further plants are known at Lakehead and at Mt Misery which may be included in a non-treatment sample. 124
128 Table 38 presents results of foliar browse analyses for the three species. TABLE 38: MISTLETOE FOLIAR BROWSE RESULTS SPECIES YEAR N CANOPY FOLIAGE DENSITY BROWSE CATEGORY (%) MEAN SE 0 0 OR 1 Peraxilla tetrapetala % 96% % 100% % 100% % 100% Peraxilla colensoii % 100% % 100% % 100% % 100% Alepis flavida % 100% % 100% % 100% % 100% Note for table 38 N = sample size. Sample size in 1999 includes repeat sampling of 1998 plants plus some additions. Browse (0 or 1) = Plants exhibiting scale 0 or scale 1 browse, as per FBI methodology Browse (0) = Plants exhibiting scale 0 browse (no browse) as per FBI methodology Discussion Table 38 shows that by 2000 all plants were exhibiting no browse (100% in category 0 ). There has also generally been an increase in the canopy foliar density. While these are likely to represent successful outcomes of the possum control operation, the results need interpreting with some caution. The sample size for all three species has been increased as it was considered that the 1998 sample size was insufficient (with the possible exception of that of Peraxilla tetrapetala). As the sample size has changed between monitors, any changes in the figures may be an artefact of sampling as well as representing a change in the condition of the populations. Future analysis can be broken down to look at changes in individuals as one way of addressing this problem. However as many of the current sample were incorporated after the commencement of pest control, it will be necessary to have a non-treatment area to be more definite about the outcomes of possum control. 125
129 Although no performance measure has been set as yet, it is anticipated that it will include a proportion exhibiting no browse (perhaps 90%), with a subsidiary target of a greater figure exhibiting scale 1 or less (perhaps 95%). Such figures can be developed after measuring values for plants in non-treatment areas. Volumetric measurements have been taken for all plants but have not yet been analysed Pittosporum patulum Pittosporum patulum is an endangered South Island endemic species subject to browse by deer and possums. Objectives To use Pittosporum patulum to monitor possum presence/impact within the treatment area and to document improved growth and survival of seedlings in response to possum control. Methods As for mistletoes, though details of measurements taken differ. Results Seventy one plants have been found within the project site. Fifty four of these have been tagged and monitored, of which 19 have been monitored initially for a baseline and subsequently. The plants are mainly above 800m a.s.l. in mountain beech forest, with a population present on each of the five spurs of the mainland island. Of the monitored plants 52 are juvenile with one individual exhibiting adult foliage, and another changing from juvenile to adult. Plant sizes range from 180 to 3200mm, with a mean of 1238mm. Individual plant health: (a subjective assessment) N = 54 Unhealthy = 5 (9%) Healthy = 29 (54%) Very healthy = 20 (37%) Health trend: (change in health from baseline to subsequent monitor) n = 18 No change = 13 (72%) Positive change = 5 (28%) Negative change = 0 (0%) Mean height change = 14mm, n = 18 Height trend (change in height between baseline and subsequent monitor) N = 18 Positive growth = 13 (72%) Negative growth = 5 (28%) 126
130 Discussion Although health is assessed subjectively, it appears that 91% of the population are either healthy or very healthy, and that 28% of those monitored more than once have improved in health, with none declining. Also encouraging is the positive growth of 72% of individuals and a positive change in mean height for the population. In the presence of high possum and/or deer numbers it would be expected that a greater number of plants would show negative changes in both height and health. As this is not the case it may be inferred that deer/possum populations are sufficiently suppressed to allow this species to make headway Foliar Browse Index Objectives Foliar browse analyses are used to detect responses to herbivore control in relatively abundant, browse-sensitive and herbivore palatable plants. Methods A standard methodology developed by Landcare Research was used (Payton et al., 1997). Results Six transect lines have been surveyed to date and cedar, broadleaf, Raukawa simplex, pokaka, Pseudopanax colensoi, P. ternatus, lancewood, Halls totara and rata recorded, with the presence of wineberry and fuchsia also noted. Table 39 presents the results showing that there are five species with a sample size that makes analysis worthwhile. TABLE 39 FOLIAR BROWSE RESULTS SPECIES YEAR N CFD S.E. B0 B0+1 Ela hoo % 100% % 100% % 100% % 100% GRI lit % 96% % 100% % 100% % 100% LIB bid % 98% % 100% % 100% 127
131 TABLE 39 (CONTINUED) SPECIES YEAR N CFD S.E. B0 B0+1 MET umb % 100% % 100% POD hal % 100% % 100% PSE cra % 100% % 100% % 100% % 100% PSE col % 0% % 100% % 100% % 100% RAU sim % 62% % 100% % 100% % 100% WEI rac % 100% Species codes Ela hoo Elaeocarpus hookerianus - pokaka Gri lit Griselinia littoralis broadleaf Lib bid Libocedrus bidwillii mountain cedar Met umb Metrosideros umbellata southern rata Pod hal - Podocarpus hallii Hall s totara Pse cra Pseudopanax crassifolius lancewood Pse col Pseudopanax colensoi mountain five-finger Rau sim Raukawa simplex raukawa Wei rac Weinmannia racemosa - kamahi CFD (se) = Mean Canopy Foliage Density with standard error, as per FBI methodology. Browse (0+1) = Plants exhibiting scale 0 and scale 1 browse, as per FBI methodology. Browse (0) = Plants exhibiting scale 0 browse (no browse) as per FBI methodology. 128
132 Figure 70 plots the changes in canopy foliar density for those five species (codes as Table 39). FIGURE 70: CHANGES IN CANOPY FOLIAR DENSITY RNRP % Density Ela hoo Gri lit Lib bid Pse cra Rau sim Species Discussion All monitored plants were showing no browse by 2000 or 2001 with the exception of kamahi which was showing none when first monitored in 1999 (Table 39). Most showed some browse when first monitored and its disappearance can be considered a likely outcome of our maintenance of the possum population at low levels. All five adequatelysampled species showed a steady increase in canopy foliage density between 1998 and 2000 (Figure 70) though this dropped back in three cases in However there was considerable overlap between the standard errors for most species so that these changes are unlikely to be statistically significant. The one that showed the most significant changes was raukawa which may be one of the best indicators of possum activity in the project area. FBI sampling needs to be applied in non-treatment areas to strengthen the link with possum control and this work will be guided by the results of the vegetation survey (section 5.5.1). It was anticipated that the possum dietary information obtained from stomach analyses (section 4.1) would help guide which species to concentrate on monitoring for possum impact. Of those species used for FBI analyses, Pseudopanax spp. remains were found in most of the intact samples examined but the other species were not detected individually. Most of the diet items, e.g. unidentified flowers, Nothofagus solandri, wood/bark and Muehlenbeckia spp. (climbers) are not so readily monitored. 129
133 5.5.5 Vegetation Plots Twenty standard 20m x 20m recce plots have been established in the treatment area, eleven of which have been re-surveyed so far. The results have yet to be analysed. Twelve plots are established in non-treatment areas. Further paired plots and exclosures are to be established in the treatment area (see section 5.5.6) Deer Exclosure One 20m x 20m exclosure fenced to exclude deer and domestic stock has been established in the block near to the farmland boundary, paired with a 20m x 20m recce plot. Further exclosures are planned in more representative areas. These will be guided by data from the vegetation survey in conjunction with the results of stomach (diet) samples from deer shot in the project area and literature relevant to deer diet in beech forests Beech seeding Objective The periodic seeding cycles of beech are major sources of energy for native and exotic components of this ecosystem. Quantification of the seedfall events allow ecosystem responses to be put in historical context. Methods A sample of metal funnel-shaped seed trays of 0.28 m 2 collect litter and seed that fall from the canopy. Collecting bags are placed on these traps from the beginning of March through to the end of June. Litter is dried and seed sorted from litter which is discarded. Seed is counted (or estimated by counting a sub-sample and weighing in years of heavy seeding) and then tested for viability by submerging in pure ethanol (any non-viable seed floats). Twenty seed trays located at Mt Misery have been operated by Landcare Research (formerly DSIR Ecology Division) from 1974 to 1997 and by this project thereafter. Twenty-seven seed trays have been operated at Duckpond in Big Bush by Landcare Research from 1986 to 1997 and by this project from 1998 to The Duckpond sample was discontinued after 2000 as it showed no significant differences from the Mt Misery dataset. Twenty seed trays have been set up by the project within the treatment area to show local conditions and operated from Results The results are presented in Table 40 and Figure
134 TABLE 40: BEECH SEED RESULTS RED BEECH SILVER BEECH MOUNTAIN BEECH SPECIES COMBINED LOCATION DATE Total Viable %viable Total Viable %viable Total Viable %viable Grand Total Seeds/ m 2 Log Seeds/ m 2 RNRP Big Bush Mt Misery FIGURE 71: INDEX OF BEECH SEEDING No. of seeds collected (log scale) Red Silver Mountain RNRP Big Bush Mt Misery Location & Year Note to Figure: Mt Misery counts in 1997 and 1998 were analysed differently so are not directly comparable. However Fig. 72 shows the pattern then was similar to the other sites. 131
135 Beech seed fell at all sites monitored in the years 1998, 1999 and 2000 but differed in each by an order of magnitude: 10 s of seed/m 2 in1998, 100 s in 1999, 1000 s in The year 1999 can be considered as a partial mast with not all species seeding in high numbers, and with only moderate seed viability (Wilson pers. comm. 2002). The year 2000 was a full mast with all three species seeding heavily, and with good viability across species may be considered a non-seed year. Placing these results in a more historical context by adding the Mt Misery counts to the dataset collected there since 1974 (Figure 72), shows that 2000 was the heaviest seeding since counts began. It was preceded by a year of significant seeding in 1999 (the sixth heaviest in the sequence), a pattern of consecutive masting only seen once before (to a lesser extent) in 1989 and FIGURE 72: ANNUAL BEECH SEEDFALL MT MISERY log seeds/m Year Note: No data was collected in 1997 and Other gaps represent insignificant seedfall. Discussion Whilst the 2000 seedfall was numerically the largest seedfall for the Nelson Lakes area on record, its importance as a trigger for the resultant dramatic increase in rodent numbers is even greater than the overall figures suggest. Firstly the seedfall was dominated by red beech (numerically and by volume) which has the largest seed, highest energy value, and highest nutrient value. Secondly red beech is dominant at low altitude which is the probable refuge for rats surviving from one seed year to the next. Thirdly the 2000 seedfall was preceded by that of 1999 (which had resulted in increased rodent numbers) which meant that rat numbers were at an elevated starting point compared with seed years that follow non-seed years. 132
136 Another feature of the data is that more than negligible seed fell each year between 1995 and 2000 whereas earlier in the sequence there were many years with no seed. It is possible that this changing pattern is a result of carbon dioxide enrichment in the atmosphere (i.e. climate change) as it has been shown that variability in carbon dioxide concentrations is affecting pollen and seedfall production in the US (R. Allen pers. comm.). It is interesting to note that in a 37-year study of mountain beech seeding at Craigieburn the largest seedfall was 12,500 seeds/m 2 (in 1971) and that levels around 5000 seeds/m 2 occurred several times (R. Allen pers. comm.). The highest figure for mountain beech in our area in 2000 was 4883 seeds/m 2 (at Mt Misery) suggesting that one year we may face an even more dramatic event with more serious implications for project management Tussock seeding Objectives Seeding of tussock is used as a good indication of the intensity of beech seeding that can be expected in the same year, although the relationship is not mathematically perfect. Methods Two species of tussock are monitored over a 500 metre transect. Ten counts at five metre spacings inside of fifty metre intervals are made. An historical transect at Mt Misery is measured by Landcare Research was the first year that tussock counts were made at Rotoiti. Chionochloa pallens was recorded travelling uphill. All seed heads in an arc in front of the observer from outstretched arms side to side round to the front are counted. This area is equivalent to one square metre. C.australis are counted travelling downhill on the same transect. All seedheads in a 0.5m x 0.5m quadrat are counted. Results The results are summarised in Figure 73 though it should be noted that the results for the two species are not directly comparable as the count method differed. 133
137 FIGURE 73: COUNTS OF CHIONOCHLOA TUSSOCK SPECIES MT MISERY & RNRP Mean no. seedheads/count C. australis C. pallens C.australis C.pallens Mt Misery RNRP Note to Figure: No counts were conducted in the RNRP in Discussion Whilst the tussock seed gives an indication of the likely intensity of beech seedfall this relationship is not evident when two or more successive seasons are mast years. Tussock seems unable to respond two years in a row, whereas beech can. 5.6 TOXIN MONITORING Toxin monitoring falls into two areas: Firstly, monitoring the lake system (water and trout) to ensure no detectable level of toxin reaching it, and secondly monitoring nontarget impacts: on deer (as part of a national system), on predators to assess the extent of secondary poisoning, and on native fauna Monitoring lake system Objective To detect any toxins entering the lake system and thus possibly available for uptake by people. Methods Trout were gill netted in Kerr Bay by Nelson Marlborough Fish and Game in May 1998 and 1999 and sections of muscle frozen and sent to Landcare Research for testing for the presence of brodifacoum. Also freshwater mussels were collected from the lakebed near the mouth of one of the streams in May 1999 and similarly tested to assess whether there was any potential for them to uptake brodifacoum. 134
138 Results No brodifacoum was detected in any samples. Discussion The results found were as expected. Though there were theoretical pathways for brodifacoum to reach fish, through their recorded feeding very occasionally on mice, and reach mussels through filtering of the water, it was considered highly unlikely that this would be detected even if it occurred given the size of the lake and the amount of brodifacoum entering the forest system Target and non-target monitoring Pest mammals Liver samples from mammals trapped by the project have been analysed for brodifacoum as part of a national departmentally-funded study and more recently for a research project by Landcare Research, Lincoln. During the period of brodifacoum use, the percentage of trapped animals carrying detectable amounts of toxin was as follows (Spurr, Eason & Wright unpubl. data): Hedgehog 48% (n=21) Mouse 50% (n=20) Stoat 67% (n=54) Ferret 83% (n=6) Ship rat 84% (n=31) Possum 86% (n=7) Cat 89% (n=9). Most species analysed also showed traces of brodifacoum several months after poisoning ceased. 135
139 6. Advocacy and Education Objectives The project s third overall objective is To advocate for indigenous species conservation and long-term pest control, by providing an accessible example of a functioning honeydew beech forest ecosystem, so a large number of people can experience a beech forest in as near-to-pristine condition as possible. The advocacy and education programme under development is working towards this, and has identified five aims as follows: Develop a high public profile for the project, enhancing opportunities for its key message to be put across. Develop and seek opportunities to express the key message that the conservation of indigenous species requires the control of pests. The use of poisons, shooting and traps are currently the only practical options for this control. Develop opportunities to involve the St Arnaud and wider community in the project. Extend the work of the project into the St Arnaud village area through the involvement of its community. Develop opportunities for schools to contribute to the project and achieve education outcomes at the same time. 6.1 DEVELOPING AND MAINTAINING PROJECT PROFILE Development of the high profile began with the project launch in February 1997, followed by the launch of the Department s Strategic Business Plan and our Wasp Control Programme in January 1998 and a First Anniversary and Open Day in April A second Open Day involving the opening of new tracks and interpretative panels occurred in February Open Day 2000 The day s programme (below) provides a good outline of activities. The day was considered very successful with perfect weather, a good attendance during the afternoon, mostly from people outside the local community, and then many from St Arnaud filling the Lodge in the evening. There was good media coverage. The Forest Speaks show proved an effective way of getting the project s results across though it was demanding of the staff working with puppets and song. 136
140 11.00am Powhiri, Welcome 11.45am Speeches Opening of Bellbird and Honeydew Walks by the Hon Sandra Lee MP, Minister of Conservation 12.30pm Lunch some food and refreshment will be provided 1.30pm The Forest Speaks A fascinating journey, for all ages, through some of the findings of our past year It s a Rotoiti Rave into fun and fac presented by our project team in a lively performance which includes story, bird puppets and music, with environmental-educator John Crick. (Find out if the Kaka Dance is just for kids?!!) 2.30pm Guided tours along the new Walks 4.00pm A Dream of the Huia A story to touch your heart. Created & performed by John Crick 4.30pm Poroporoaki Farewell Followed by evening concert/dance/supper at Rotoiti Lodge, 7.00pm Mainland Island hui The project hosted the July 2000 mainland island hui. The c40 attendees included representatives from ten Department of Conservation restoration projects and five projects run by outside agencies. In addition to sessions addressing technical issues, research needs and community participation, two evening performances were organised one by John Crick who had been involved in the Open Day and the other by Richard Nunns and Hirini Melbourne, renown musicians. This event served to further increase the project s profile. It also fostered extensive information exchange one of the results of which was that the Bushy Park Homestead and Forest Trust subsequently changed around three quarters of its restoration programme (Allan Anderson, pers. comm.). 137
141 Internet coverage A specific outlet capable of enhancing the project s profile widely is the Internet. A search using the project s title in 1999 turned up 3 sites with 11 well-illustrated pages, 10 in two copies of the Online Magazine NZIne from material compiled by Paul McArthur, and 1 in the Minister of Conservation s site featuring our wasp control. In 2001 one of the major search engines produced 6 pages of sites! The first two of these six contained links to departmental sites, our own and one for Ministry of Agriculture & Fisheries, to research institutions Landcare Research and Otago University, to tourism operators including Nelson Helicopters and natureandco.com, to Nelson City Council and the local MP, to media articles and even an international site for World Wildlife. The most comprehensive material was on a LEARNZ site (see under Education below). Clearly an increased profile has been established within this medium. Ecological Society Conference The 1999 New Zealand Ecological Society Conference held in Blenheim provided a particular opportunity to increase our profile with scientists from throughout the country. About 40 came on guided walks to the project as one of their field trips and a poster was also displayed at the meeting venue. Display Panels Two large display panels (4m x 4m) were produced in 2000 in a project coordinated by Lindy Peters with Janet Bathgate contracted to undertake the final design and production (one reproduced as Figure 74). These are designed for use at sites away from St Arnaud, primarily in Nelson and Blenheim, to introduce the project and encourage people to visit. They have since been used at several events such as the EcoFest s held in Nelson. Spreading the Message An address was given to a workshop organised by the Waitakere Ranges Protection Society in Auckland (August 1999) discussing establishment of a mainland island there the Ark in the Park, and another to the AGM of East Harbour Association (July 1999), a group proposing a community-based mainland island (MIRO) in Wellington s East Coast Bays. Talks on the project were presented at the Australasian Wildlife Management Society s Conference in Queenstown, the Insular Biotas Conference in Wellington, a pest management conference in Hawaii (by Advisory Group members) and a poster presented at a meeting of the Scientific Advisory Group to the Conference of the Parties to the Convention on Biological Diversity in Montreal. Ron Moorhouse spoke on the kaka work at a conference in Australia. The project aims to act as a catalyst, stimulating other mainland restoration work. The outcomes can be unexpected as this from an Auckland Regional Council (ARC) staff member shows: I just wanted to let you know that two separate visits from owners of two companies in North Auckland (names supplied) to Rotoiti have lead to formal support of the Tawharanui project (an ARC mainland island) with sponsorship and professional expertise. 138
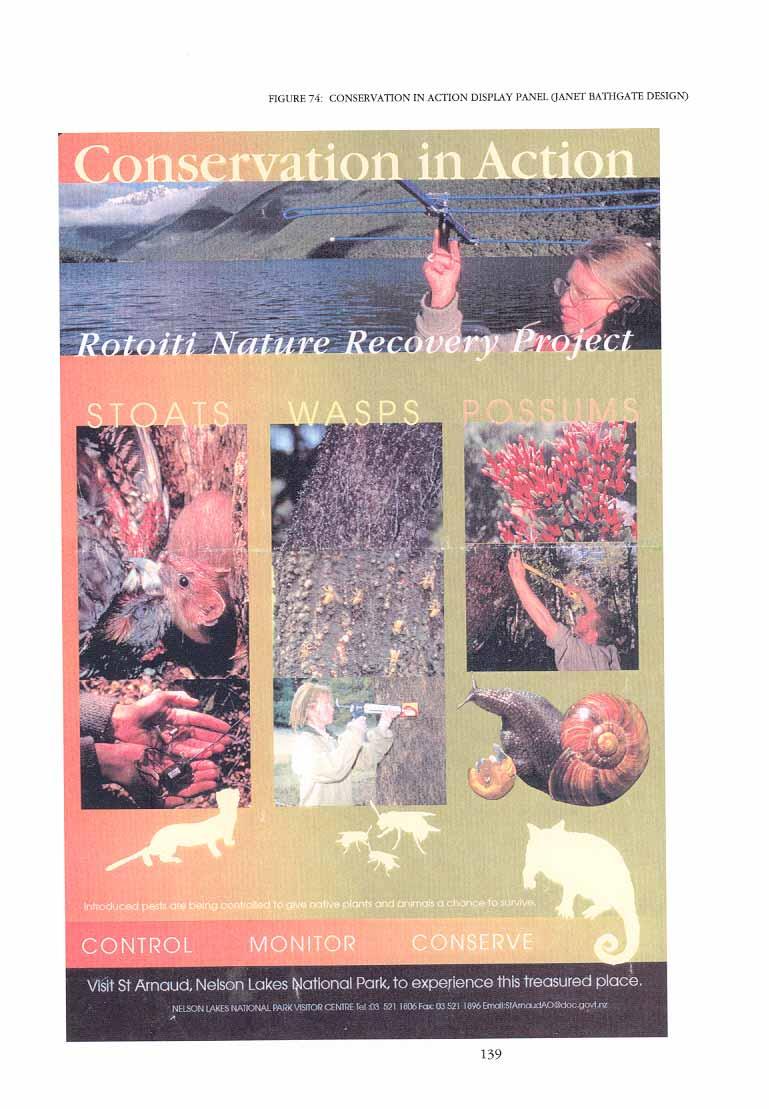
142 139
143 6.2 COMMUNITY LIAISON Ongoing community support is vital to the long-term future of the project. We aim to keep the community informed through a newsletter, and indirectly through the media, and offer opportunities for more in-depth contact through talking to groups or providing guided walks. Specific activities are organised with local schools (5.5 below). Revive Rotoiti Newsletter Four editions of our 4-page A4 newsletter Revive Rotoiti were produced in the period (August 98, February 99, Spring 99, Winter (October) 2000) (See Appendix 2 for example). A two-colour format was added in 1998 and the print-run has steadily increased to Our address list continues to expand as we receive new requests and now totals over 500. Newsletters (or photocopies of them) are continually available in the National Park Visitors Centre and local media make good use of each edition in following up stories. Material has been placed regularly in the Lake Rotoiti Community News (fortnightly), the Conservancy s Outlook newsletter, and at intervals in other wider local newsletters, Murchison News and Village Voice, and in the Rotoiti District Community Council annual report. Meetings Project information has been supplied regularly to meetings of the St Arnaud Community Association, to the Murchison A & P Show, and to Community Forums held by the Department in Nelson and Murchison. Talks and Guided Walks The 1998/99 year can be used as an example to document specific activities: Groups given talks on the project during 1998/99 included: Marlborough Girls College Marlborough Boys College Nelson Tramping Club Nelson Probus Rai Valley School Newlands College, Wellington Nelson College Preparatory School Nelson/Blenheim Rotary Club Nelson and Marlborough Tramping Clubs Groups given guided walks round the project site were: Attendees at NZ Ecological Society Conference Nelson Tree Crops Association Shilco Christian Academy School Wakefield School Nelson Tramping Club, Waimea Tramping Club Walking Group and Nelson Rotary Club (see below). Nelson Probus English Tourists (100+) from a cruise liner berthed at Picton Nelson Polytechnic students 140
144 Tapawera School Linkwater School Members of National Science Teachers Conference (Nelson) Attendees at Departmental Ecological Processes and Animal Management Training Courses. An increased level of activity occurred in 1999/2000 and 2000/01 with a great variety of groups involved from Mongolian Parks staff on a study tour to the Financial Planners Association, the Marine Farmers Association, the New Zealand Conservation Authority and the Local Government and Environment Select Committee. The demand for walks and talks has grown but we have not yet had to decline any requests. This may need to be considered in the future and a strategy is planned which will identify the key groups that we will be able to support in this way. The two new tracks (see 6.6) have facilitated the provision of 1-2 hour walks, which have become the dominant of the two activities. The interpretative panels along the tracks also enable visitors to self-guide and learn about what is being undertaken here, which may become an increasing emphasis for the future. For two years we have provide guided walks for overseas tourists associated with the Clipper Odyssey cruise ship on visits to Nelson. Staff time has been charged on these occasions as a commercial enterprise was involved, and put back into the project. 6.3 IWI LIAISON The involvement of local iwi in the project has been an increasingly important element with the assistance of our Kaupapa Atawhai Manager, Barney Thomas. Representatives of several Te Tau Ihu (Top of the South Island) iwi have participated in key events and all, together with Ngai Tahu, have been consulted in the course of the Project Review. Examples of significant involvement include: the transfer of kaka from Whenua-hou (Codfish Island) receiving the birds from Ngai Tahu in a ceremony at Kerr Bay and later releasing them from an aviary in the project area Open Day 2000 with a powhiri and poroporoaki and feeding everyone from hangi. Mainland Island hui with a powhiri and poroporoaki and support at an evening concert of traditional Maori instruments by Hirini Melbourne and Richard Nunns. Project staff participated along with others from the Area Office in a weekend at Omaka Marae at the invitation of Ngati Apa. Skills in the weaving of flax (harakeke) learned there were put to good effect in the building of a ceremonial arch for Open Day
145 6.4 MEDIA LIAISON Significant coverage in local media, particularly the Nelson Mail, Marlborough Express, Leader (free community newspaper), Fifeshire Radio and Planet Radio, has been obtained through the use of press releases and visits by journalists to the site. Several themes have been maintained particularly creating a possum-free future, kaka breeding and stoat control, and the country s largest wasp control operation, but an additional emphasis has been on the dramatic beech mast cycle and its effects. Several magazine articles have been written about the project including two for Wilderness Magazine and the Federated Mountain Clubs magazine by Shaun Barnett, one for Forest & Bird by Kathy Ombler and two for New Zealand Geographic by Andrew Macalister. Veronica Meduna and photographer Arno Gasteiger collected material for an article for the German-based GEO magazine, which though cancelled did provide some photos purchased for use on our interpretative panels. A photography student, Matthew Minson, produced a photo essay on the project for a course assignment and also made photos available to us. TVNZ used the project as part of an Assignment documentary on Biosecurity and Biodiversity, obtaining footage at a kaka nests and looking at wasp control. Several film crews have obtained concessions to obtain documentary footage on the project, including a German one in January 2000 with a focus on wasps, and a Danish one in January The Future Eaters documentary including scenes filmed at Rotoiti with Tim Flannery in 1998 was finally screened on New Zealand TV in EDUCATION PROGRAMMES School programmes We again worked with Lake Rotoiti School, a primary school taking children to Form 2, and Rotoiti Lodge, an outdoor education centre visited by all the secondary schools in the region. Two activities were organised with Lake Rotoiti School in 1998/99. Firstly, all pupils visited the Visitor Centre in a ceremony to unveil the quilt they had produced for last year s Anniversary Day, now hanging inside the Visitor Centre. Secondly, older pupils assisted in a practical way by monitoring the robins in the village. This activity proved very popular, generating several newspaper articles and was repeated in 1999/2000. In 2000 the school had a major involvement in the Open Day singing a waiata for the Minister of Conservation and receiving a copy of a resource kit from her for trialling (see below). They were also able to see kiwi in transit from the West Coast to an island in the Marlborough Sounds. Discussions were held in 1998 with Lake Rotoiti Lodge and Nelson College for Girls staff about developing further education programmes for the Lodge. One outcome from this was modification of the existing honeydew project. Then in 2000 the Lodge was handed over from the Department to a Trust and some funds that were previously allocated to its maintenance were provided to develop further educational materials. Planning for their use occurred in 2000/
146 Resource Kit A resource kit for Primary Schools was developed by Lindy Peters and Brenda Carling, to provide schools with an educational field trip using the interpretative panels around the Bellbird and Honeydew walks (6.6 below). Its development was assisted by a visit from Liz Moore, a Tasmanian environmental educator on a study-tour coordinated by Head Office. Field testing of the kit s worksheets was carried out by pupils from Lake Rotoiti School in June 2000 and Nelson Central School s whanau class in September Changes were then made and the kit was published in late It is hoped that all Primary Schools in the region will use it to bring classes to learn about the project and have fun there. Royal Society Fellowship Margaret McFarlane, a science teacher from Waimea College, obtained a Royal Society Fellowship enabling her to work with the project from December 2000 to December While contributing significantly to the fieldwork effort, her main objectives have been the development of educational materials. By 30 June 2001 she had developed some materials for Primary Schools and was working on a project video and on material for Secondary Schools visiting Rotoiti Lodge. LEARNZ The project went live on the Internet during 2001 on the LEARNZ education website. A LEARNZ teacher, Audrie Mackenzie made several visits to St Arnaud to obtain information and photographs from the project team to set up the site. Then for three weeks in May she ran virtual field trips from Rotoiti including daily diary updates and audioconferences in which project staff, Lake Rotoiti School pupils and local residents took part. The project proved very popular with several thousand pupils from schools around the country participating in the audio-conferences and the web site receiving 608,000 hits that month. The site remains a very detailed source of information on the project the page containing links to over 50 further pages on different aspects. Ecoquest This North Island-based ecological education company has made two visits to the project (November 1999 and October 2000) bringing c.20 American students each time. They have received talks about the project and engaged in a day of field research on beech seed germination in 1999 and a guided walk in Carleton College Global Education Designs, an Australian company, brought their second group of students from Carleton College in the US to St Arnaud for a week-long ecology study trip in February 2000, following a first visit in They spent one and a half days learning about the project and conducting research on wasp foraging on baits. 143
147 6.6 VISITOR SERVICES A contract was let in 1997/98 for the planning of visitor services associated with the project (Tourism Resource Consultants, 1998). Work began in 1998/99 with the construction by departmental staff lead by Dale Chittenden, of two new short walks in a loop from Kerr Bay. The Bellbird Walk provides a minutes loop to a wheelchair standard circling through beech forest beside Lake Rotoiti. The minute Honeydew Walk provides a longer circuit a short distance along the Lakeside Track, again built to the Department s path standard but on a slightly steeper contour. A new underground track counter is being trialled on these walks. After a tendering process a contract was let to Janet Bathgate Design for the production of interpretative panels on these walks and introductory displays in the Visitor Centre. Four large vertical panels placed at the start of the Bellbird Walk introduce the project and place it in historical and national contexts. Two further horizontal panels on that walk cover the honeydew cycle and Browsing Invaders. Four panels placed along the Honeydew Walk cover cycles of predation associated with beech seeding, wasp control (detail reproduced as Figure 75), native birds and animals and the vision for the future. Both tracks have proved very popular with positive feedback usually noting the bird song that can be heard along them. Close views of bellbirds can be guaranteed and the luckier visitors see kaka and kakariki. The interpretation panels have also struck a chord with some, as shown by the following comments in an from a visitor living in Thailand: I work in the environmental consulting industry and was very impressed at the level of information made available as we walked along the Honeydew Walk. However, perhaps more impressive for me was watching how much interest my wife got out of it, as she doesn t share my level of background. For both of us, the rest of that walk and the next day as we walked round the Lake, was a revelation as we were able to observe many of the things pointed out to us that we would have otherwise overlooked. I warmly congratulate you both on the merit of the project and the exceptional presentation on the project provided. A two-panel display was built under a Visitor Centre window overlooking the project site. Using an aerial photograph taken from the same angle, this shows the visitor the boundaries of the project site and its tracks, together with an introduction to the project. A large vertical panel introduces four of the staff working on the project and the activities they undertake. In addition there is a hollowed out tree, modelled on a real kaka nest, which opens to reveal a stuffed stoat with a stuffed kaka in its mouth a display which feedback has shown to be very effective. The Visitor Services Concept Plan identifies further Visitor Centre displays to be produced and these were budgeted for the year 2000 but postponed following changes in funding. They would focus largely on presenting the detailed results achieved to date. 144
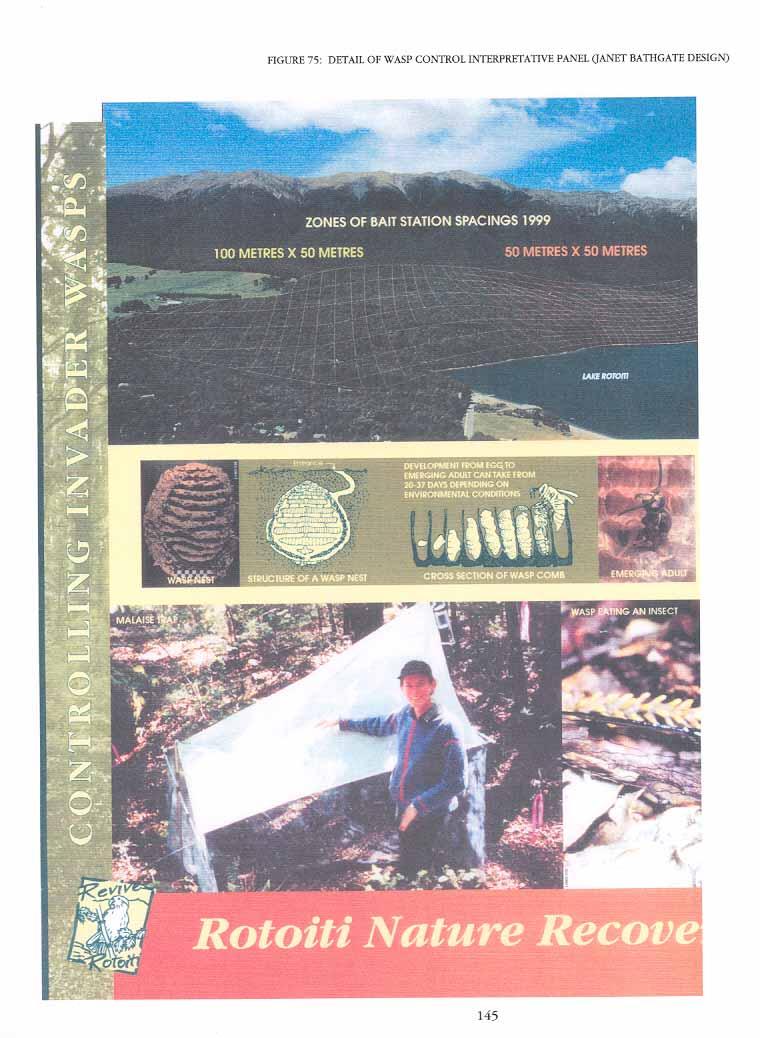
148 145
149 6.7 VOLUNTEER INVOLVEMENT Individual Volunteers In these two years the project provided opportunities for several types of volunteers. Firstly we had four long-term overseas volunteers: Rosemary Mirza from Canada who spent five months with the project tied into a Conservation Course she was undertaking; Alex Phillips and Tom Agombar from Edinburgh for one month in winter; and Brenda Carling from Canada for three months in which she worked on the education resource kit (above). Shorter-term overseas volunteers staying two to three weeks were Meike Mainzer and Roberto Cameransi from Germany, Omer Frenkel from Israel, Marieke Van Dyke from Holland, Tanja Bohme and Ina Lenert from Germany. In addition to their practical contribution, we have found the different perspectives brought by overseas volunteers challenged us to think more deeply about our work. Secondly we have provided shorter periods of work-based training for New Zealanders, Wendy Sullivan (Lincoln University), Leigh Marshall (Otago University), Ayako Tsukihara and Bevan Spooner (Nelson/Marlborough Institute of Technology), Will Kahl and Tim Bourke, for a Samoan, Faafetai Uitime and for Tairawhiti Polytechnic s feral control course. Thirdly, the Whenua-iti Conservation Corps, based in the Motueka Valley, has become an important part of the project team. Each year there have been three or four very productive week-long visits from six to ten young people and one or two trainers, some of the Corps members going on to volunteer for the project as individuals for further periods. Rodent tracking and trapping has been one activity that the Corps has concentrated on. Fourthly in 1999 we organised a week-long Conservation Holiday as part of the Department s national programme attended by Odette Singleton, Murray Sanders, Ariana Meiers and Michelle Ashbury Community Volunteers Finally we were at last able to offer an opportunity to local people who have long expressed an interest in practical involvement in the project. The construction of the Bellbird Walk left an area of old track and gravel roadway to be re-planted to speed up its return to forest. Three community groups and local people were involved in two planting days in May 1999 using locally-sourced plants held in the Area Office s nursery in May. An excellent take of a variety of plants, beeches, wineberry, fuchsia, and hebes should ensure this area is rapidly rehabilitated. 146
150 7. Research 7.1 NATIONALLY-FUNDED RESEARCH EVALUATION OF ADVOCACY Funding was obtained through the national science round for a Wellington researcher, Bev James, to be contracted to evaluate the advocacy work of this project and kiwi work in Northland (James, 2001). She made two visits to St Arnaud in spring/summer 1999/2000 and interviewed 48 people individually or in focus groups, including local residents, bach owners, farmers and teachers and students. Key findings were as follows: Advocacy is essential to the overall success of the Project and has raised public awareness of the Project. A wide range of advocacy methods and techniques are used. Community involvement in the Project could be enhanced through more opportunities for hands-on involvement in the Project and for consultation. There are opportunities for increasing the use of the Project as an educational resource. We have already responded to the latter two points. A Friends of Rotoiti group is to be formed in late 2001 to engage in practical pest control alongside the project and consultation opportunities were provided during the project review (see 8.7.). Educational opportunities are increasing with the development of the Resource Kit and the work of the Royal Society Fellow. 7.2 RESEARCH FUNDED OR ASSISTED BY THE PROJECT In 1998/99 the project provided varying levels of support to 3 research students. The annual Rotoiti Research Scholarship of $1000 was awarded to Todd Banks, School of Forestry, Canterbury University for a MSc study entitled Introduced small mammals and invertebrate conservation in a mixed beech forest. Travel and accommodation funds were provided to him and to Diane Jones of the University of Canterbury for a study on the effects of Vespula vulgaris on a beech forest Coleoptera community (Jones, 2000) and accommodation to Chelsea Brindle undertaking a study of how robins find worms and to Rob Ewers looking at invertebrate associations with honeydew (Ewers, 2000). A thesis was received on the robin research conducted by Amanda Byrne at Rotoiti in the 1997/98 season (Byrne, 1999). Rayna Brown and Erik van Eyndhoven of Canterbury University, who were employed by the project to carry out the vegetation survey in the summer, also undertook research projects with University funding on the differences in vegetation between our treatment and non-treatment areas (Brown 1999) and on Pittosporum patulum respectively. Occasional field support was provided to Josh Kemp an MSc student from Otago University studying kea and to a Landcare Research team investigating baits for possible aerial application to control wasps (a DOC-funded contract). 147
151 Specimens of the moth, Dumbletonius characterifer, caught in malaise traps were provided to Dr Barbara Brown of Lincoln University for an evolutionary study. DNA showed local specimens to be no different to populations from the North Island. Discussions were held with Laura Sessions and copies of her mistletoe MSc received (Sessions, 2001). Victoria University Earth Science students conducted field trips to the site sampling soils and invertebrates. Possum stomachs were examined for the presence of leaf-veined slug by an Otago University student. Malaise samples were examined by two German researchers undertaking research on the systematics and phylogeny of fungus gnats (Sciaroidea) who located new taxa. Sam Brown was assisted with some Landcare Research stoat trapping trials. Stomachs from some stoats have been sent to Elaine Murphy and Lloyd Robbins for diet analysis. Stoat carcasses were sent to Robbie Macdonald, Waikato University investigating the incidence of the bacteria, Bartonella, as possible agent to assist in biocontrol. Stomachs of these carcasses were then sent to a student of Kim King s at the same institution. 148
152 8. Project Management 8.1 BUDGET It is very difficult to provide a comparable detailed budget for the three years as there have been changes to the Department s financial planning systems each year, particular in the way that the hours of permanent staff and some overheads have been represented and in the output class structure. It should also be noted that the budget is only a guide and the actual expenditure will have differed from this according to the actual pest populations encountered, the weather and the breeding seasons of native fauna. In 1998/99 project funds were split between two output classes (4 - species and 5 - pests) and the total budget was c$370,000 including $76,000 allocated as an additional item for Visitor Services developments (new tracks and interpretation section 6.6.). In 1999/00 and 2000/01 the budgets were within a single new output class (5.02 Mainland Islands). In 1999/2000 the total was c$332,000 including a further $42,500 allocated to Visitor Services. In 2000/01 there was no allocation to Visitor Services and some costs (c$60,000) were transferred to an Area input project leaving an operating total of c$230,000. Some breakdowns to individual activities are presented in Tables 41-43, as staff hours and operating costs which in some years included the costs of temporary staff hours and in others were only equipment, materials, outside contractors, etc. It should also be noted that the separation of activities was not as clear cut in practice, e.g. the bait station operation was targeting both possums and rodents and the split of costs between each was therefore rather arbitrary. However the figures do give an idea of the relative effort in each activity. TABLE 41: BUSINESS PLAN BREAKDOWN BY MAIN TASKS 1998/99 (EXCLUDING VISITOR SERVICES) ACTIVITY STAFF HOURS OPERATING COSTS ($$) (INCLUDING COSTS OF TEMPORARY STAFF HOURS) Wasp control & monitoring Possum control & monitoring Rodent control & monitoring Stoat control & monitoring Deer control Cat control Vegetation monitoring Invertebrate monitoring Bird/bat/reptile monitoring Advocacy
153 TABLE 42: BUSINESS PLAN BREAKDOWN BY MAIN TASKS 1999/2000 (EXCLUDING VISITOR SERVICES) ACTIVITY STAFF HOURS OPERATING COSTS ($$) (EXCLUDING COSTS OF TEMPORARY STAFF HOURS) Wasp control & monitoring Possum, rodent & deer control & monitoring Stoat & cat control & monitoring Vegetation monitoring Native fauna monitoring Advocacy & Education Project management* *This item was spread across different activities in 1998/99. TABLE 43: BUSINESS PLAN BREAKDOWN BY MAIN TASKS 2000/2001 (THERE WAS NO VISITOR SERVICES WORK THIS YEAR) ACTIVITY STAFF HOURS OPERATING COSTS ($$) (EXCLUDING COSTS OF TEMPORARY STAFF HOURS) Wasp control & monitoring Possum, rodent & deer control & monitoring Stoat & cat control & monitoring Vegetation monitoring Native fauna monitoring Advocacy & Education Project management* The project was also supported by the kaka research programme funded by the Science & Research Unit which employed a full-time scientist, a research assistant, and had some operating funds. 8.2 STAFFING From its inception through to March 2001 the project was managed largely on a standalone basis with its own co-ordinator and project team. This changed following the department s Programme Manager Review which saw the project integrated more with other biodiversity work under the management of the Programme Manager (Biodiversity/Threats). 150
154 The project team up to the change consisted of two full-time permanent staff, several contract staff (usually three on 3-year contracts, one on a 1-year contract and several others for up to 6 months), and three other permanent staff within the Area Office who contributed almost a person-year between them. This team received considerable support from other staff in the Area Office and Nelson/Marlborough Conservancy Office and the national Mainland Island Technical Co-ordinator, and advice from scientists within and outside the Department. Staff have been assisted by volunteers who have put in over 620 days work in the period. Though some time is spent in training and inducting volunteers and monitoring their work, they represent a very significant input to the project. The Working Group of Area and Conservancy staff, which had met every two months or so for the first years of the project, ceased during the reporting period as the project s activities were by then well defined. An annual review and planning input continued to be provided by a Technical Advisory Group. Appendix 1 names the staff who have worked on the project and the members of the Advisory Group. 8.3 TRAINING In addition to providing work-based training opportunities for people from other agencies (section 6.7.1), the project has been increasingly contributing to departmental training. Trainee Rangers from the recently established departmental course at Nelson Polytechnic have been significant additions to the staff from 2000 onwards. Chris Hughes worked for two months from January 2000 and Ray Clapp-Mara for 1 month later that year. Several Ecological Management training courses (Ecosystems Processes, Animal Management, Pest Animal Management) have been held at St Arnaud and project staff have assisted with lectures or practical demonstrations. The project hosted the Mainland Island hui in July 2000 and visits from staff from Boundary Stream and Trounson mainland islands and from the MIRO project in Wellington. 8.4 SKILLS SHARING Mainland Island staff have been encouraged to set aside specific time for sharing skills with other projects. Examples in the report period include assistance to Whangarei Area Office with Poor Knights Island weed control (Matt), to Science & Research for trapping trials involving human scent (Darren), to Sounds Area Office for transfer of mohua to Nukuwaiata (Nic) and kakapo work on Maud Island (Matt & Genevieve), to Nelson/Marlborough Conservancy for reptile and invertebrate monitoring on the Chetwodes (Genevieve and Rosemary Mirza as a volunteer) and involvement with other local projects such as vegetation surveys in the Raglan (Matt). 151
155 Staff have also been involved in national office-based work, including participating as one of the Steering Committee for the National Review of Mainland Islands (Dave), in a Mainland Restoration Workshop (Dave & Darren), and in a review team for the Kiwi Recovery Programme (Darren). Many have participated in different courses or assisted on review groups during the development of the Quality Conservation Management programme for pest control. 8.5 HEALTH & SAFETY Specific sections were developed for the St Arnaud Area s Hazard Database covering the possum control, wasp control and mustelid trapping and live capture programmes. These identified hazards and means to eliminate or minimise them. All project staff working over the summer received training in the injecting of adrenalin to manage any anaphylaxis associated with wasp stings, but no problems occurred. Staff who were to use Talon for significant periods were given blood tests before they started handling the poison and again at the end of their contracts or the end of each year. 8.6 DATA MANAGEMENT The project database (in Access) established last year by a Victoria University student has been used to store most data collected. However the development of the database, particularly the reporting end was delayed while the Department sorted out its software needs heading into the new Connect 2000 system. We have been working towards using a Geographic Information System (GIS) to map the project area in detail by obtaining fixes using a Global Positioning System (GPS) of many elements e.g. bait stations, traps. 8.7 REVIEW A review of the project in its fifth year was planned from the outset to assess achievements in relation to the objectives and consider future options, recognising the experimental nature of the work. It involved project staff, members of the Technical Advisory Group, local iwi and the local and wider Nelson/Marlborough community. The overall conclusion was that the project had made significant progress towards achieving many of its objectives in a very short time frame, and that there was strong support for its continuation. Specific conclusions were that there were already measures of positive responses in the vegetation to lowered numbers of possums; robin and kaka nesting success had been high compared to other sites, attributed particularly to the control of rats and stoats respectively; many bird species showed increases in numbers; and the country s largest wasp control operation had increased honeydew availability over summer. These gains were maintained during a period of high pest numbers following major beech seeding 152
156 events. It had however not proved possible to control mice effectively with current techniques. On the advocacy side, the project had developed a high public profile and a good measure of support locally. It had developed new tracks and interpretative panels for visitors and educational resources. It had fostered or carried out research aimed at increasing our capacity to manage beech forests elsewhere. There was some discussion of future options which lead to an expansion of control effort in 2001/02. Longer term direction will be developed in a new Strategic Plan for the project in
157 9. Acknowledgements This report is based on the contributions of many of the project team and the Advisory Group and has also benefited from the comments of Dr Dave Kelly. Thanks are also due to Charmayne King of the Nelson/Marlborough Conservancy office who undertook the formatting and Gary Holz who prepared the maps and co-ordinated the printing of the report. The results represent a significant team effort. Thirty-two Departmental staff have worked on the project from time to time from the St Arnaud Area Office (Appendix 1) supported by others from the Nelson/Marlborough Conservancy, Regional and Central Offices, including the kaka team from Science & Research. These people have been joined by some wonderful volunteers (section 6.5). All should be acknowledged for their efforts and enthusiasm. Sir David Attenborough in his 1997 address at the project launch identified that a project like this succeeds: if it has the scientific knowledge, if it has the decisive backing financially and intellectually, and if it has the goodwill of the people who actually live here. The exciting nature of the project and the openness of the Departmental team have lead to the involvement of many scientists and others from outside the Department, both as members of our Advisory Group (Appendix 1) and in other capacities. These people have helped ensure the knowledge and intellectual backing. The support on the financial side from staff up the Department s line has been unwavering and the interest taken in the project by the Director-General and successive Ministers of Conservation has been a major boost to project staff. Finally we have enjoyed the goodwill and support of the people of the local area. The St Arnaud Community has participated in several activities, and we would like to acknowledge the contribution of Lake Rotoiti School and its teachers. Iwi from the Top of the South Island, particularly Ngati Apa, have lent their warm support. We would also like to single out Phillip and Fiona Borlase and thank them for allowing us access through their farm adjacent to the National Park. Many from wider afield have supported events such as the open days and directly conveyed their support. Comprehensive mainland restoration projects like this differ from many of the other projects the Department undertakes, in that there is never a break in the field programme. There is a requirement to keep a measure of pest control and monitoring going throughout the year, particularly in a season of beech seeding such as we faced recently. Fieldworkers have shown considerable dedication to maintain this unrelenting effort. The rewards are becoming plain for all to see. 154
158 Finally in a spirit of celebration: This was a morning that would soon grow very warm. At that early hour about half-past six one could already smell the honeydew. It is exuded by a tiny insect and sweats in transparent globules through a black, mossy parasite that covers the trunks of native beech trees in New Zealand. Chip-dry twigs snapped under my feet. Bellbirds, exactly named, absent-mindedly prolonging their dawn-song, tinkled in the darker reaches of the bush. From our hidden tents, the smell of woodsmoke and frying bacon drifted through the trees. Someone climbed down to the river for water and a bucket clanked pleasantly. I came to a halt and there at once was the voice of the river filling the air in everlasting colloquy with its own wet stones. It was then abruptly that I was flooded by happiness. In an agony of gratitude, I flung my arms around the nearest honeyed tree and hugged it. I was fourteen years old. Ngaio Marsh writing of the year 1912 in her autobiography Black Beech and Honeydew Collins, London. (With appreciation to Bev James for locating this paragraph). 155
159 References Allen, R.B. & M.J. McLennan Indigenous Forest Survey Manual: Two inventory methods. FRI Bulletin No. 48, Forest Research Institute, Christchurch. Alley, J.C., Berben, P.H., Dugdale, J.S., Fitzgerald, B.M., Knightbridge, P.I., Meads, M.J. & R.A. Webster Responses of litter-dwelling arthropods and house mice to beech seeding in the Orongorongo Valley, New Zealand. J. Royal Society of NZ 31(2): Alterio, N. & H. Moller Secondary poisoning of stoats (Mustela erminea) in a South Island podocarp forest, New Zealand: implications for conservation. Wildlife Research 27: Barlow, N.D; Beggs, J.R.; Barron, M.C. In press: Dynamics of common wasps in New Zealand beech forests: a model with density-dependence and weather. Journal of Animal Ecology. Beggs, J.R The ecological consequences of social wasps (Vespula spp) invading an ecosystem that has an abundant carbohydrate resource. Biological Conservation 99: Beggs, J.R. & P.R. Wilson The Kaka Nestor meridionalis, a New Zealand parrot endangered by introduced wasps and mammals. Biological Conservation. 56: Beggs, J.R., Toft, R.J., Malham, J.P., Rees, J.S., Tilley, J.A.V., Moller, H. & P. Alspach The difficulty of reducing introduced wasp (Vespula vulgaris) populations for conservation gains. N.Z. J. of Ecology 22: Beggs, J.R. & Rees, J.S. 1999: Restructuring of insect communities by introduced Vespula wasps in a New Zealand beech forest. Oecologia 119: Brown, K Predation at North Island robin (Petroica australis longipes) and North island tomtit (Petroica macrocephala toitoi) nests. Unpubl. MSc Thesis, University of Otago, Dunedin. Brown, R Mainland Island treatment and non-treatment areas: A vegetation comparison based on the Rotoiti Nature Recovery Project. Unpubl. BFSci dissertation, School of Forestry, University of Canterbury, Christchurch. Brown, K.P., Moller, H., Innes, J. & N. Alterio Calibration of tunnel tracking rates to estimate relative abundance of ship rats (Rattus rattus) and mice (Mus musculus) in a New Zealand forest. NZ J. of Ecology 20(2): Brown, R & D.A. Norton. (in prep.) Experimental design and ecosystem restoration: vegetation of the Rotoiti Nature Recovery Project treatment and non-treatment areas. Butler, D.J Birdlife of Nelson Lakes National Park. Science & Research Series No. 24, Department of Conservation, Nelson. Butler, D.J Rotoiti Nature Recovery Project. St Arnaud s Honeydew Beech Mainland Island Strategic Plan. Department of Conservation, Nelson/Marlborough Conservancy, Nelson. 52pp. Butler, D.J Rotoiti Nature Recovery Project. Annual Report Occasional Publication No. 45, Department of Conservation, Nelson/Marlborough Conservancy, Nelson. 64pp. Byrne, A.J Effects of population bottlenecks on the South island robin, Petroica australis australis. Unpubl. MSc Thesis (Zoology), University of Canterbury, Christchurch. Cochrane, H. & I. Buunk Possum diet in St Arnaud beech forests. N.Z. School of Forestry Conservation Research Group Report No. 3 (Draft). University of Canterbury, Christchurch. 156
160 Dawson, D.G. & P.C. Bull Counting birds in New Zealand forests. Notornis 22(2): Department of Conservation Vertebrate Pest Control Manual Toxins and Poisons. Department of Conservation, Wellington. Department of Conservation Boundary Stream Mainland Island Project Report Department of Conservation, East Coast Hawkes Bay Conservancy, Gisborne. Ecosystems Consultants Controlling feral house mouse (Mus musculus) populations during beech seeding in a New Zealand forest using Brodifacoum in bait stations. Ecosystems Consultants Report No. 15, Dunedin. Etheridge, N. & R.G. Powlesland High productivity and nesting success of South Island robins (Petroica australis australis) following predator control at St Arnaud, Nelson Lakes, South Island. Notornis 48: Ewers, R.M The influence of honeydew density and wasps on the arthropod community in a New Zealand beech forest. Unpubl. BSc Honours (Zoology) Thesis, University of Canterbury, Christchurch. Harris, R.J. 2000: Fipronil baits for wasp control. Unpublished Landcare Research contract report (LC 9900/119) to Aventis Cropscience Pty. Ltd. Harris, R.J. & J.S. Rees Aerial poisoning of wasps. Science for Conservation 162, Department of Conservation, Wellington. Harris, R.J. & N.D. Etheridge Comparison of baits containing fipronil and suplhuramid for the control of Vespula wasps. N.Z. J. of Zoology 28: Harris, R.; Toft, R. & J. Rees.S 2001: Development of canned X-stinguish wasp bait. Landcare Research Contract Report: LC 0102/010 to Aventis Cropscience Pty. Ltd. King, C.M., C.J.F. O Donnell & S.M. Phillipson Monitoring and control of mustelids on conservation lands Part 2: Field and workshop guide. Department of Conservation Technical Series No.4, Wellington. James, B Rotoiti Nature Recovery Project: An Evaluation of Advocacy. Science for Conservation pp. Department of Conservation, Wellington. Johns, P.M Distribution and conservation status of ground weta, Hemiandrus species (Orthoptera: Anostostomatidae). Science for Conservation 180, Department of Conservation, Wellington. Jones, D.C Disturbance effects of harvesting and exotic wasps (Vespula vulgaris) on Coleoptera biodiversity in New Zealand Nothofagus forests. Unpubl. M. Forestry Sci. Thesis, University of Canterbury, Christchurch. Leathwick, D. M.; Godfrey, P. L.; Fordham, R. A.; Potter, M. A.1999: Comparative growth and seasonality of Vespula germanica and V. vulgaris (Hymenoptera: Vespidae) colonies in the Manawatu region of New Zealand. New Zealand Journal of Zoology 26: Moller, H Wasps kill nestling birds. Notornis 37: Moller, H.; Beggs. J.R.; Tilley, J.A.V.; Toft, R.J.; Wilson, N.J.; Alspach, P.A. 1990: Ecology and control of wasps populations in New Zealand. Contract report to Department of Conservation. 82 pp. Moller, H., J.A.V. Tilley, R. Bell, B.W. Thomas & R.J. Toft Responses of honeyeater birds to fluctuations in honeydew in a New Zealand beech forest. Ch. 5. pps in Beekeeping and conservation values of protected areas University of Otago Wildlife Management Report Number 51, Dunedin. 157
161 Moller, H., R.J. Toft, B.W. Thomas & J.A.V. Tilley. 1996a. Honeydew renewal rates in beech forest of South Island, New Zealand. Ch. 6 pps in Beekeeping and conservation values of protected areas University of Otago Wildlife Management Report Number 51, Dunedin. Moorhouse, R. J Interim report: Kaka research in Nelson Lakes National Park. Unpubl. report, Science & Research, Department of Conservation, Wellington (file SAV 0127). Moorhouse, R. J nd Interim report:: Kaka research in Nelson Lakes National Park. Unpubl. report, Science & Research, Department of Conservation, Wellington (file SAV 0127). Moorhouse, R. J rd Interim report:: Kaka research in Nelson Lakes National Park. Unpubl. report, Science & Research, Department of Conservation, Wellington (file SAV 0127). Moorhouse, R.J. & Greene, T.C Research plan for kaka (Nestor meridionalis) Unpubl. report, Department of Conservation, Wellington. Norton, D.A., Brown, R & van Eyndhoven, E Plant communities in the Rotoiti Nature Recovery Project area and in adjacent non-treatment areas. Conservation Research Group Report No.4, N.Z. School of Forestry, University of Canterbury, Christchurch. O Donnell, C.F.J Home range and use of space by Chalinolobus tuberculatus, a temperate rainforest bat from New Zealand. J. Zool. Lond. 253: O Donnell, C.F.J. & J.A. Sedgeley Guidelines for surveying and monitoring long-tailed bat populations using line transects. DOC Science Internal Series pp. Payton, I.J., C.J. Pekelharing & C.M. Frampton Foliar Browse Index: A method for monitoring possum damage to forests and rare or endangered species. Contract Report LC 9697/60, Landcare Research, Lincoln. Powlesland. R.G Protocols for monitoring New Zealand robins (Petroica australis) Department of Conservation technical series No.13, Wellington. Ruscoe, W.A., Goldsmith, R. & D. Choquenot A comparison of population estimates and abundance indices for house mice inhabiting beech forests in New Zealand. Wildlife Research 28: Sandlant, G.R Analysis of Malaise Trap samples from Nelson Lakes National Park Rotoiti Nature Recovery Programme 2: The season. Unpubl. Report to St Arnaud Area Office, Department of Conservation, St Arnaud. Sessions, L Monitoring leaf loss and possum impact on New Zealand beech mistletoes. Unpubl. MSc Thesis (Botany), University of Canterbury, Christchurch. Spurr, E.B Reduction of wasp (Hymenoptera: Vespidae) populations by poison baiting: experimental use of sodium monoflouroactetate (1080) in canned sardine. N.Z. J. of Zoology 18: Thomas, C.D., H.Moller, R.J. Toft, J.A.V. Tilley, G.M. Plunkett & R. Harris Impact of Vespula wasps on native insects and birds - Second-year research report. Contract Report No. 25 to Department of Conservation, DSIR Ecology Division, Nelson. Thomson, C., Warburton B. & L. Moran Weka and Kiwi-safe Trap Sets. Landcare Research Contract Report LC9596/130 to Department of Conservation, Private Bag 5, Nelson. 13pp. Toft, R.J. & J.S. Dugdale Identification Guide for Key Groups of Insects in Malaise Trap Samples. Unpubl. report to St Arnaud Area Office, Department of Conservation, Landcare Research, Nelson. 158
162 Tourism Resource Consultants Lake Rotoiti Nature Recovery Project Visitor Services Concept Plan. Tourism Resource Consultants, Wellington. 27pp. Twentyman, C.M Unpubl. pathology report: Accession no , Massey University, Palmerston North. Walker, K Techniques for monitoring populations of Powelliphanta land snails. Internal Report No. 11, Nelson/Marlborough Conservancy, Department of Conservation, Nelson. 11pp. Warburton, B Trap-catch for monitoring possum populations. Unpubl. report, Landcare Research, Lincoln. Watts, C Analysis of invertebrates in mouse stomachs from Rotoiti Nature Recovery Project. Contract Report LC0102/009 for St Arnaud Area Office, Department of Conservation. Landcare Research, Hamilton. 10pp. Whitaker, T Lizards of Nelson and Marlborough: a field key. Unpublished report, Nelson/Marlborough Conservancy, Department of Conservation, Nelson. 20pp. Wilson, P.R., Karl, B.J., Toft, R.J., Beggs, J.R. & R.H. Taylor The role of introduced predators and competitors in the decline of kaka (Nestor meridionalis) populations in New Zealand. Biological Conservation 83(2):
163 Appendix 1: Personnel Staff employed, in full or in part, by the project in the course of the period: David Butler Darren Peters Nic Etheridge Matt Maitland Genevieve Taylor Bruce Waddell Linda Peters James McConochie James Thorneycroft Hannah Edmonds Moira Pryde Rosemary Mirza Mark Pengelly Stu Davidson Simon Hillerby Odette Singleton Michel Boulay Jeanette Winn Shaun Bilham Rayna Brown Erik van Eyndhoven Graham Sandlant Area Office staff with some of their hours dedicated to the project: Paul McArthur Graeme Ure Graeme Omlo Dale Chittenden Lindsay Barber Ross Campbell Kimberley Parlane Paul Gasson Other Area Office staff spent time on the project within their own programmes, particularly Allan and Fred Richards. Advisory Group Members: Jacqueline Beggs, (Landcare Research, Nelson) Peter Wilson (Landcare Research, Nelson) Eric Spurr (Landcare Research, Lincoln) David Norton, School of Forestry, Canterbury University Rowley Taylor, Nelson (1999 only) Charlie Eason, Landcare Research (2001 only) Peter Gaze, Mike Hawes, Martin Heine, Nelson/Marlborough Conservancy, DOC Ron Moorhouse, Science & Research, DOC Alan Saunders, National Technical Co-ordinator (Mainland Islands), Science & Research, DOC Ian Westbrooke, the Department s Statistician attended one meeting and has also provide the project with significant advice. 160
164 Appendix 2: Revive Rotoiti newsletter 161
 has grown six times larger!")

165 Rotoiti Nature Recovery Project Nelson/Marlborough Conservancy Newsletter No. 8 Summer The project expands Bigger and better the Rotoiti Nature Recovery Project (RNRP) has grown six times larger! Lines of Fenn traps to catch stoats have been extended down to the head of Lake Rotoiti and across to Big Bush. The trap lines now total over 70km in length and provide cover over more than 5000 hectares. Each trap is checked at least once a month. The rat and wasp control has been extended into Duckpond Stream, taking in more honeydew beech forest and an important kaka breeding area. Rat trapping is taking place over 1400 hectares with rat trapping by the Friends of Rotoiti linking the two RNRP areas, by Lake Rotoiti and at Big Bush. Wasp control has expanded to 1100 hectares. The expansion took place though a bitterly cold winter and a horribly wet spring in Andrew Taylor, Sam Symonds, Rob Fraser and the Whenua Iti Conservation Corps joined the RNRP team to build trap tunnels, mark lines and carry the traps out. The expanded rat and wasp control has given promising results over the last year, and we hope that this will continue. Last summer had not seen sufficient reduction of stoats in the expanded area to benefit kaka (see kaka breeding story below). Bird numbers rise Pest control has expanded to Big Bush (at front) and further down the St Arnaud Range (see map on Page 6). Analysis of five years of bird counts has allowed us to describe the responses to the dramatic beech mast cycle of the recent years. The result has been pretty good news in the project area but bad news outside it. Bellbird, tui, tomtit, rifleman and parakeet numbers have all increased steadily in the project area. When the project started we used to hear about four bellbirds in each five-minute bird count near the lake; now it is up to nine or ten which is as many as we can distinguish without confusing individuals. The benefits of the years of wasp control and fewer stoats and rats are becoming apparent. 162


166 At Lakehead, where no pest control had been taking place prior to the recent control area expansion, bellbird, tui and parakeet numbers have changed little and tomtits and rifleman numbers have gone down. The rifleman story is an interesting one. When we started our counts, which go up the St Arnaud Track in the project area, they were just found in a narrow range in the middle of the hill. Increasing numbers have seen an expansion in their range, up to the bushline and almost down to the stream crossing. We hope that in another few years they will be back in the village as they were years ago. Rifleman numbers have increased and their range expanded. [Photo by M.F. Soper] Friends of Rotoiti DOC s Andy Taylor (left) and conservation corps members building rat trap tunnels. One bird which seems not to have cared about our work at all is the grey warbler! Numbers have gone up and down in an identical fashion in the project area and at Lakehead. This suggests that introduced predators don t influence their numbers and that they probably respond more to the weather and the availability of insects. Some have worried that our work might fill up the forest with introduced birds. In fact there are signs the reverse has been the case and chaffinches, thrushes and blackbirds appear to have declined in the project area but not at Lakehead. It is great to think that returning forest towards its original condition may give our native species the advantage. We can take much satisfaction from the results in the project area. It is no surprise though to find a sad picture beyond the reach of the trap lines after the forest has gone through its most dramatic beech seed cycle in around 30 years. The plagues of rats and mice in recent years and associated higher numbers of stoats have left tomtits, fantails, parakeets, rifleman in their lowest numbers since counts began in We re pleased that our expanded pest control effort with the support of the Friends of Rotoiti will mean we can expect to be protecting more birds. For the rest, let s hope they have some good seasons to recover before the next plague. How it all began The Friends of Rotoiti held their first meeting in October 2001 with a lot of enthusiastic discussion on how the group would run and what they wanted to achieve. They were unified in their desire to extend the trapping programme and made a commitment to have traps out by that Christmas. Tunnel-building working bees were organised and trap-setting training sessions co-ordinated. A group from the Nelson West Rotary Club spent a day in the workshop, then took piles of plywood and weldmesh back to Nelson where they did a magnificent job building nearly 200 Fenn trap tunnels. A big thanks goes to Mark Gillard and his team for all their work. A wet weekend saw a group of Nelsonians and locals from the village stringing up huge clotheslines of rat-traps freshly stained to extend their lives. Whenua Iti Conservation Corps arrived at the lake in mid-november 2001 to do field work. Although the rain kept them in the workshop all week they did a great job producing stacks of tunnels to house the new rat-traps. 163

167 Andrea Logan and Jane Gosden use a video monitor to check a kaka nest. Kaka breeding Rat and stoat trapping Friends of Rotoiti made good their promise to have traps out and operating by Christmas About three-quarters of the village and peninsula traps were put out two weeks before Christmas and the first rat was caught the very next day less than 24 hours after the traps were set! The remainder of the rat traps were out by the end of January and a trap checking roster established. Unfortunately there was a hold up with the Fenn traps, which didn t arrive until early January, however, the line was laid out at the earliest opportunity and began catching ferrets straight away. Kaka nest minders A group of Friends of Rotoiti volunteers also helped with kaka nest checks during the breeding season. They were out on the hill over Christmas and the New Year ensuring that the birds were checked nearly every day. As many nests as possible had cameras mounted inside the nest hole, enabling nest minders to quickly see what was happening inside the tree without having to constantly disturb the birds, and to confirm that all was well. Nest checks involved carrying a small monitor to the nests, plugging it into the line leading to the camera and watching the telly! Early in the season the female would be on the nest, incubating eggs, so the check was to see that she was OK and to count eggs if possible. Once the chicks hatched, the mother left the nest for long periods, only coming back to feed the chicks. Checks at this time ensured that the chicks were OK. A special thank you to Matt and Jean Rynn, Andrea Logan, Jane Gosden, Kerry Beaton, Fraser Paton and Freya Gilkison. This year the Friends are doing lizard monitoring in the village and on Black Hill. Lizards are preyed on by rats so we hope to see an increase in the local populations thanks to their rat trapping efforts. If you are interested in joining Friends of Rotoiti and helping with rat and stoat control contact Kimberley Parlane at DOC s St Arnaud. Area Office, Ph or kparlane@doc.govt.nz. Battling to protect nests The kaka breeding season started with a hiss and a roar. We had 18 potential mothers to monitor the kaka population at Rotoiti was set to soar! However, the predators were ahead of us in newly-trapped Big Bush. The first few weeks of November 2001 were devastating for staff working frantically to track females, identify and monitor nests only to find themselves extracting dead breeding females from their nest holes. Kaka are especially vulnerable to predators during the breeding season. The female nests in hollow cavities in large trees, and if a stoat or a possum enters the nest she can be easily cornered and killed. In the second week of November we lost two adult females inside the Big Bush area and one outside the project area. At this point our contingency protocol was activated and all further nests in Big Bush were protected with aluminium bands wrapped around the nest tree to prevent predator access to the nests. Nests were identified as soon as the females became stationary and the trees were banded immediately. Once again it was a race against time. We lost a further two birds from within Big Bush in the last week of November; predators were killing the females as soon as they settled into their nest holes. In one case we suspect the bird was killed as a staff member was walking out to protect her nest. 164

168 In all seven females were lost. What this showed was that the traps in the new area had not been in place long enough to reduce the predator numbers enough to protect kaka. In the old core area on the St Arnaud range the kaka story was happier and none of the four nesting females was lost. Up until February, we had three nests, the first of which failed when the chicks disappeared from the nest, probably due to a predator. The mother, Bond, thankfully survived. On Waitangi Day we got a huge surprise when Astarte, who had previously been one of the egg laying stars, finally decided to nest, some four months behind the others. Her three chicks hatched on 26 February and were doing well until Saturday 9 March at 3pm when a stoat entered the nest from above and killed all three chicks. It then dug a hole through the bottom of the nest platform and dragged the chicks down. The whole thing was captured on video the first time a stoat predation has been recorded confirming what we previously had suspected from circumstantial evidence. A second predation was filmed when Bond lost her 21 day old chick from her second clutch to a stoat on 19 April, inside the core project area. In all 15 kaka chicks fledged - five in Big Bush and ten from the St Arnaud Range of which 10 have survived. Although the breeding season result seemed disappointing, with a low 40% success rate, areas with no stoat control reached only 5-10% success. Kakacam beamed live pictures of kaka nests into the Visitor Centre for the first time last summer. At the time of writing, we don t yet know if kaka will breed this summer or not. We are watching to see if the beech flowers, a sign that kaka will breed, and looking for any nesting activity by females. Kakacam Visitors who came into the Visitor Centre out of the rain last Christmas were intrigued by the live image beaming down from a kaka nest on the St Arnaud Range. The progress of the three chicks that hatched just before Christmas was avidly followed by locals, bach owners and campers. People were fascinated by the rapid growth of the chicks, and the changes as their feathers came through their fuzzy, grey down. Many visitors came in several times a day to check on the babies and to see if they could catch mum on one of her trips to the nest to feed the chicks. After the chicks in the first nest fledged we changed the aerial to receive Katie s nest for a week or two, then moved it again to Astarte s after Katie s chicks fledged. Unfortunately, a stoat killed Astarte s three chicks that afternoon. The whole episode was seen live on the Kakacam by Shirley Hutchison from the Visitor Centre and a visitor to the area. This tragic event was horrible to watch. Astarte was not in the nest at the time but she returned less than a minute after the killing, looking for her chicks. She encountered the stoat but fended it off. Kakacam is to become a regular breeding season feature of the renovated project display in the Visitor Centre. Wasp control The wasp control operation happened on 21st January With the expansion into Big Bush, the wasp control area has gone up from the original 300 hectares in the core to
Pest animal control. Guiding principles for community groups and landowners
 Pest animal control Guiding principles for community groups and landowners Guiding principles for pest animal control When starting a pest animal control project, there are five key principles that will
The science behind the Department of Conservation s beech mast response and predator control
 The science behind the Department of Conservation s beech mast response and predator control Orange-fronted parakeet, Photo: Sabine Bernert 1 Department of Conservation (DOC) scientist Graeme Elliott
Animal pest control for freshwater wetlands
 R. Morris Dept. of Conservation (1982) An introduction Animal pest control for freshwater wetlands assistance Purpose of module To assist owners of freshwater wetlands, or properties adjacent to these,
Predator R E S P O N S E
 Predator RESPONSE THE PROBLEM 25 million native birds are killed by predators like possums, stoats and rats each year 1 Heavy seeding of trees in our native forests will again this year drive higher than
Developing a programme to make Taranaki predator-free
 Factsheet: 6 Developing a programme to make Taranaki predator-free The Taranaki Regional Council wants to initiate an innovative change in managing predators to benefit our native plants and wildlife,
12 th Sanctuary Workshop: Ark in the Park. John Innes Landcare Research HAMILTON
 12 th Sanctuary Workshop: Ark in the Park John Innes Landcare Research HAMILTON Tues. 15 September 2015 Previous workshops 2004 Maungatautari 2005 Tawharanui 2006 Te Kauri 2007 Silverstream (Zealandia)
Biodiversity benefits from NZ s major predator control regimes
 Biodiversity benefits from NZ s major predator control regimes Rachelle Binny Biosecurity Bonanza 23 May 2017 What are the biodiversity benefits from predator control for New Zealand s major control regimes?
Project No: R Visual Lures for Possums. Malcolm Thomas and Fraser Maddigan. Pest Control Research Ltd PO Box 7223 Christchurch New Zealand
 Project No: R-80622 Visual Lures for Possums Malcolm Thomas and Fraser Maddigan Ltd PO Box 7223 Christchurch New Zealand Contract Report: 2004/5 PREPARED FOR: Animal Health Board PO Box 3412, Wellington
PROJECT AORANGI HAUMANU KIA HAUMAKO PEST CONTROL PROGRAMME
 PROJECT AORANGI HAUMANU KIA HAUMAKO PEST CONTROL PROGRAMME OSPRI, the Department of Conservation (DOC), Aorangi Recreational Hunters (ARH) Group and the Aorangi Restoration Trust (ART) are teaming up again
SH16 Causeway Pest Control Report. June - December 2014
 June - December 2014 June - December 2014 December 2014 Prepared on Behalf of: Causeway Alliance Prepared By: Joel Leong, Richard Gribble Te Ngahere PO Box 71109 Rosebank Post Centre, Auckland 1348 59
Abel Tasman Birdsong Trust Trapping Report March 2017
 Abel Tasman Birdsong Trust Trapping Report March 2017 Introduction Traps are checked and baited by Abel Tasman Birdsong Trust volunteers approximately twice per month. The results for trap checking are
Pesty Science. Is Predator-Free NZ a reasonable reality or an impossible dream?
 Pesty Science Is Predator-Free NZ a reasonable reality or an impossible dream? Predator-Free NZ Fenced sanctuaries Fenced sanctuaries Offshore islands Fenced sanctuaries Offshore islands Mainland islands
Safe Pest Control in kea habitat
 Safe Pest Control in kea habitat Kea Conservation Trust Best Practice Standard -1.0 Contact: info@keaconservation.co.nz Contents 1.0 Purpose 2.0 Background 3.0 Scope 4.0 Kea risk factors 4.1 Life-stage
Sanctuaries, & biodiversity responses to pest control
 Sanctuaries, & biodiversity responses to pest control John Innes, Rachelle Binny Andrea Byrom, Neil Fitzgerald, Alex James, Roger Pech Manaaki Whenua - Landcare Research Colbourne LINK seminar, Wellington,
UMUKARIKARI AERIAL BOVINE TB CONTROL OPERATION
 UMUKARIKARI AERIAL BOVINE TB CONTROL OPERATION The Umukarikari aerial pest control operation is planned for spring 2017, weather dependant. This operation will cover approximately 12,000 hectares and is
Exemplar for Internal Achievement Standard. Geography Level 2
 Exemplar for Internal Achievement Standard Geography Level 2 This exemplar supports assessment against: Achievement Standard 91245 Explain aspects of a contemporary New Zealand geographic issue An annotated
Paired trial of fresh and long-life stoat baits in a warm, coastal environment
 Paired trial of fresh and long-life stoat baits in a warm, coastal environment DOC SCIENCE INTERNAL SERIES 100 Nigel Miller Published by Department of Conservation PO Box 10-420 Wellington, New Zealand
New Zealand Fisheries Assessment Research Document 98/21. Not to be cited without permission of the authork) Malcolm Clark
 Malcolm Clark") Not to be cited without permission of the authork) New Zealand Fisheries Assessment Research Document 98/21 A summary of commercial catch and effort information for orange roughy (Hoplostethus atlanticus)
Not to be cited without permission of the authork) New Zealand Fisheries Assessment Research Document 98/21 A summary of commercial catch and effort information for orange roughy (Hoplostethus atlanticus)
Possum monitoring using raised leg-hold traps
 Possum monitoring using raised leg-hold traps RESEARCH INVESTIGATION NO: 3253 KEY OUTPUT: 4.2 Malcolm. D. Thomas 1 and Jennifer. A. Brown 2 1 PO Box 7223, Christchurch New Zealand Email info@pcr.co.nz
New developments in pest control and monitoring
 New developments in pest control and monitoring Dr Jamie MacKay and Dr Helen Blackie Sanctuaries of New Zealand workshop 2013 University of Auckland, Lincoln University & Connovation Ltd Next steps in
PREDATOR CONTROL. Information Pack. CREATED BY: Wendy Sporle, National Mentor for Advocacy, Kiwis for kiwi IN PARTNERSHIP WITH
 PREDATOR CONTROL Information Pack CREATED BY: Wendy Sporle, National Mentor for Advocacy, Kiwis for kiwi IN PARTNERSHIP WITH Information pack on kiwi If kiwi have touched your life in some way and you
Phillip Island Nature Parks Integrated Pest Mammal Strategy
 Phillip Island Nature Parks Integrated Pest Mammal Strategy 2013-2018 Summary On Phillip Island the introduced red fox is the greatest land based threat to the faunal biodiversity of the island. Eradication
SCIENCE & RESEARCH INTERNAL REPORT NO.132 MONITORING POSSUM NUMBERS FOLLOWING 1080 POISON CONTROL AT MAPARA RESERVE. Theo Stephens
 SCIENCE & RESEARCH INTERNAL REPORT NO.132 MONITORING POSSUM NUMBERS FOLLOWING 1080 POISON CONTROL AT MAPARA RESERVE by Theo Stephens This is an internal Department of Conservation report and must be cited
MONITORING AND CONTROL OF MUSTELIDS ON CONSERVATION LANDS PART 2. FIELD AND WORKSHOP GUIDE
 DEPARTMENT OF CONSERVATION TECHNICAL SERIES No. 4 MONITORING AND CONTROL OF MUSTELIDS ON CONSERVATION LANDS PART 2. FIELD AND WORKSHOP GUIDE by C.M. King, Colin F.J. O'Donnell, and Stephen M. Phillipson
NOTIFICATION OF IMPENDING COMMENCEMENT OF KARNBACH POERUA POSSUM CONTROL OPERATION Vector Free Marlborough Limited (VFML) has been engaged by TBfree
 has been engaged by TBfree") NOTIFICATION OF IMPENDING COMMENCEMENT OF KARNBACH POERUA POSSUM CONTROL OPERATION Vector Free Marlborough Limited (VFML) has been engaged by TBfree New Zealand to carry out an aerial possum control operation
NOTIFICATION OF IMPENDING COMMENCEMENT OF KARNBACH POERUA POSSUM CONTROL OPERATION Vector Free Marlborough Limited (VFML) has been engaged by TBfree New Zealand to carry out an aerial possum control operation
Nga Uruora animal pest control operational plan
 Nga Uruora animal pest control operational plan 2015-2018 December 2015 1 Nga Uruora animal pest control operational plan 2015-2018 Our area Our core area for animal pest control is the Paekakariki-Pukerua
A pheasant researcher notebook:
 A pheasant researcher notebook: what we are learning about pheasants and pheasant hunters in Nebraska TJ Fontaine Nebraska Cooperative Fish and Wildlife Research Unit Managing pheasants is challenging
Response to SNH s Scientific Advisory Committee (SAC) Review of the SNH Licence for Strathbraan: removal of ravens
 Review of the SNH Licence for Strathbraan: removal of ravens") Response to SNH s Scientific Advisory Committee (SAC) Review of the SNH Licence for Strathbraan: removal of ravens Summary 1. The SAC review of the Strathbraan Community Collaboration for Waders (SCCW)
Response to SNH s Scientific Advisory Committee (SAC) Review of the SNH Licence for Strathbraan: removal of ravens Summary 1. The SAC review of the Strathbraan Community Collaboration for Waders (SCCW)
Ngā Uruora animal pest control operational plan
 Ngā Uruora animal pest control operational plan 2018-2021 June 2018 1 Ngā Uruora animal pest control operational plan 2017-2021 Our area Our core area for animal pest control is the Paekakariki-Pukerua
Managing Burrowing Mammals
 Managing Burrowing Mammals Roger A. Baldwin UCCE Wildlife Specialist Department of Wildlife, Fish, & Conservation Biology University of California, Davis Species Identification (Ground Squirrels) Gray-brown
What s happening with stoat research?
 What s happening with stoat research? Report on the five-year stoat research programme JANUARY 2000 What s happening with stoat research? Report on the five-year stoat research programme JANUARY 2000 Published
STOATS. New Zealand s mainland and some islands.
 STOATS 1. Description of the problem Location of the case-study New Zealand s mainland and some islands. History (origin, pathway and dates, including time-period between initial entry/first detection
Cycle journeys on the Anderston-Argyle Street footbridge: a descriptive analysis. Karen McPherson. Glasgow Centre for Population Health
 Cycle journeys on the Anderston-Argyle Street footbridge: a descriptive analysis Karen McPherson Glasgow Centre for Population Health March 2017 Key points: There were 116,334 cycle journeys made using
Abel Tasman Birdsong Trust Newsletter. What s been happening on Adele?
 Hello everyone and welcome to the Abel Tasman Birdsong Trust s final newsletter for 2017. In this issue we highlight our efforts to undertake local projects for local benefits. What s been happening on
MOLESWORTH BOVINE TB CONTROL OPERATION (YEAR 1)
") MOLESWORTH BOVINE TB CONTROL OPERATION (YEAR 1) OSPRI S TBFREE PROGRAMME The TBfree programme aims to control and eventually eradicate bovine tuberculosis (TB) from New Zealand s farmed cattle and deer
MOLESWORTH BOVINE TB CONTROL OPERATION (YEAR 1) OSPRI S TBFREE PROGRAMME The TBfree programme aims to control and eventually eradicate bovine tuberculosis (TB) from New Zealand s farmed cattle and deer
CHAPTER 6: RODENT MANAGEMENT
 CHAPTER : RODENT MANAGEMENT OANRP has managed MIP and OIP species that are subject to rodent predation with various strategies since 1997. This chapter discusses rodent control methods utilized over the
Page 1 of 7. Development of a rat bait with slug-repellent properties 1. July 14, 2016
 Page 1 of 7 Development of a rat bait with slug-repellent properties 1 July 14, 2016 Introduction: Slugs are generalist feeders that are attracted to the peanut butter baits our program uses in rat traps
Predator Free NZ 2050: an achievable vision or a mirage?
 Predator Free NZ 2050: an achievable vision or a mirage? Can we cross the desert and reach the oasis Or Is it just a mirage and we will die trying to reach it? If so We should stay where we are and dig
Heartwood Forest Small Mammal Survey Report October 2012
 Small Mammals at Heartwood In early we were lucky to be visited by Veronica Carnell from Northumbria Mammal Group (pictured left). She kindly led a small group of volunteers in small mammal trapping as
Appendix 21 Sea angling from the shore
 Appendix 21 Sea angling from the shore LUC SMRTS2015 Final Report 342 March 2016 Appendix 21 Sea angling from the shore Table A21.1: Summary of sample confidence levels Responses Spatial data Questionnaire
Internship Report. Ark in the Park. 3 August December 2016
 Internship Report Ark in the Park 3 August 2016-17 December 2016 Dorothee Clausen dc142382@uni-greifswald.de Student of landscape ecology and nature conservation Ernst-Moritz-Arndt-University Greifswald
Year Avg. TAC Can Others Totals
 SKATE IN DIVISIONS 3L, 3N, 3O AND SUBDIVISION 3Ps Background There are 8 to 1 species of skate in the waters around Newfoundland. Of these, thorny skate (Raja radiata) is by far the most common, comprising
BRIEFING on IBERIAN LYNX (Lynx pardinus) MANAGEMENT PLAN AT DOÑANA NATIONAL PARK
 MANAGEMENT PLAN AT DOÑANA NATIONAL PARK") BRIEFING on IBERIAN LYNX (Lynx pardinus) MANAGEMENT PLAN AT DOÑANA NATIONAL PARK Doñana, 11 th march 2003. 1. SUMMARY Management Plan approved in 1988 and in implementation since. Jointly drafted by scientific
BRIEFING on IBERIAN LYNX (Lynx pardinus) MANAGEMENT PLAN AT DOÑANA NATIONAL PARK Doñana, 11 th march 2003. 1. SUMMARY Management Plan approved in 1988 and in implementation since. Jointly drafted by scientific
Heaphy Track Mountain Bike Trial
 Heaphy Track Mountain Bike Trial 2011-2013 September 2013 Report prepared by Jane Roberts, Eric de Boer, Ian Wightwick photo: Stephen Roberts 1 INTRODUCTION In December 2010 the Department of Conservation
DO COLOURS THAT DETER BIRDS AFFECT CEREAL BAIT ACCEPTANCE BY POSSUMS (TRICHOSURUS VULPECULA)?
?") DAY TIM D. and DAY MATTHEWS: and LINDSAY COLOURED R. MATTHEWS CEREAL BAIT Animal Behaviour and Welfare Research Centre, AgResearch Ruakura, Private Bag 3123, Hamilton, New Zealand. E-mail: dayt@agresearch.cri.nz
DAY TIM D. and DAY MATTHEWS: and LINDSAY COLOURED R. MATTHEWS CEREAL BAIT Animal Behaviour and Welfare Research Centre, AgResearch Ruakura, Private Bag 3123, Hamilton, New Zealand. E-mail: dayt@agresearch.cri.nz
Friends of the Island Fox
 Friends of the Island Fox a Program of the Channel Islands Park Foundation, a 501 (c) (3) public benefit org. 1901 Spinnaker Drive, Ventura CA 93001 (805) 288-4123 or admin@islandfox.org Visit us at www.islandfox.org
Assessment of Guide Reporting & Preliminary Results of Lion Monitoring
 Assessment of Guide Reporting & Preliminary Results of Lion Monitoring Mara Predator Project December 21 Sara Blackburn Laurence Frank maralions@gmail.com lgfrank@berkeley.edu SUMMARY The Mara Predator
Animal Pest Field Trial Reporting Template
 Animal Pest Field Trial Report for Efficacy of DOC 200 versus Victor Professional Rat traps at catching rats in the Mangaone Core Area of the Te Urewera Mainland Island September 2004 June 2006 Anastacia
Catch and Recapture Rates of Tweed Salmon and the Effect of Recaptures on the Catch Statistics
 Catch and Recapture Rates of Tweed Salmon and the Effect of Recaptures on the Catch Statistics A. CATCH RATES What proportion of the salmon running the Tweed actually get caught by anglers? 1. The most
Enviroteach. From the Editor. Inside this issue. An Environmental Education Resource for Teachers
 Enviroteach An Environmental Education Resource for Teachers Nga Manu Images From the Editor Kia ora This issue of Enviroteach focuses on pest animals in Southland. It provides information for teachers
Dauphin Lake Fishery. Status of Walleye Stocks and Conservation Measures
 Dauphin Lake Fishery Status of Walleye Stocks and Conservation Measures Date: December, 21 Dauphin Lake Fishery Status of Walleye Stocks and Conservation Measures Background: Walleye stocks in Dauphin
Ecology and Environmental Impact of Javan Rusa Deer (Cervus timorensis russa) in the Royal National Park
 in the Royal National Park") Ecology and Environmental Impact of Javan Rusa Deer (Cervus timorensis russa) in the Royal National Park Andrew James Moriarty B. App. Sc. (Hons.) A thesis submitted in fulfillment of the requirements
Ecology and Environmental Impact of Javan Rusa Deer (Cervus timorensis russa) in the Royal National Park Andrew James Moriarty B. App. Sc. (Hons.) A thesis submitted in fulfillment of the requirements
Justification for Rainbow Trout stocking reduction in Lake Taneycomo. Shane Bush Fisheries Management Biologist Missouri Department of Conservation
 Justification for Rainbow Trout stocking reduction in Lake Taneycomo Shane Bush Fisheries Management Biologist Missouri Department of Conservation December 14, 2017 Lake Taneycomo was formed by the construction
Assessment of the effectiveness of. ultrasonic devices for repelling stoats (Mustela erminea)
") Assessment of the effectiveness of Transonic ESP and Yard Gard ultrasonic devices for repelling stoats (Mustela erminea) E B Spurr Manaaki Whenua - Landcare Research PO Box 69 Lincoln New Zealand Published
Assessment of the effectiveness of Transonic ESP and Yard Gard ultrasonic devices for repelling stoats (Mustela erminea) E B Spurr Manaaki Whenua - Landcare Research PO Box 69 Lincoln New Zealand Published
A review of 2015 fatal collision statistics as of 31 December 2015
 A review of fatal collision statistics as of 31 December This report summarises the main trends in road fatalities that have emerged in. This has been prepared by the Road Safety Authority following analysis
Where now for slug control without Draza?
 Where now for slug control without Draza? Gordon Port Mollusc Centre of Expertise School of Biology Newcastle University Where now for slug control without Draza? Slug species and damage Slug life cycles
West Coast Rock Lobster. Description of sector. History of the fishery: Catch history
 West Coast Rock Lobster Description of sector History of the fishery: The commercial harvesting of West Coast rock lobster commenced in the late 1800s, and peaked in the early 1950s, yielding an annual
CHECKS AND BALANCES. OVERVIEW Students become managers of a herd of animals in a paper-pencil, discussionbased
 CHECKS AND BALANCES 5 OVERVIEW Students become managers of a herd of animals in a paper-pencil, discussionbased activity. BACKGROUND White Tailed Deer White-tailed deer have always been a part of the forest
Field trials of fresh and long-life stoat baits in Northland, New Zealand
 Field trials of fresh and long-life stoat baits in Northland, New Zealand R.J. Pierce, N. Miller, E. Neill, C. Gardiner, and M. Kimberley DOC Research & Development Series 262 Published by Science & Technical
Community participation in large scale pest management. Becky Niemiec, Pike Brown and Roger Pech
 Community participation in large scale pest management Becky Niemiec, Pike Brown and Roger Pech Why is community involvement so important? Cape-to-City project 26,000 ha: rural and residential 163 properties:
Summary of discussion
 Tweedsmuir Caribou Modelling Project: Caribou Population Ecology Meeting Notes held March 5, 2008 Participants: Mark Williams, Debbie Cichowski, Don Morgan, Doug Steventon, Dave Daust Purpose: The purpose
Phillip Island Nature Park an example of sustainable ecotourism
 Phillip Island Nature Park an example of sustainable ecotourism Structure of presentation What is the Phillip Island Nature Parks The Nature Parks funding model Visitation Wildlife Research and Ecosystem
Squirrels and Rabbits
 Squirrels and Rabbits (Dave Pehling) Slide 1 Title Slide Slide 2 Squirrels can be a serious problem in the garden; in particular, the Eastern Gray Squirrel, and that is the species we will be concentrating
las vegas wash coordination committee
 las vegas wash coordination committee lvwash.org Proposal to Conduct a Small Mammal Study in the Las Vegas Wash, Nevada March 2009 Proposal to Conduct a Small Mammal Study in the Las Vegas Wash, Nevada
Job Title: Game Management, Subsection B Game Management Mountain Lion. SPECIES: Mountain Lion
 SPECIES: Goal: Manage the mountain lion population, its numbers and distribution, as an important part of Arizona s fauna and to provide mountain lion hunting recreation opportunity while maintaining existing
Best Management Practices for Trapping Weasels in the United States
 Best Management Practices for Trapping Weasels in the United States Best Management Practices (BMPs) are carefully researched educational guides designed to address animal welfare and increase trappers
DOC SCIENCE INTERNAL SERIES 24
 Weka- and kiwi-safe possum trap sets DOC SCIENCE INTERNAL SERIES 24 C. Thomson, B. Warburton and L. Moran Published by Department of Conservation P.O. Box 10-420 Wellington, New Zealand DOC Science Internal
The science behind the Department of Conservation s predator control response
 The science behind the Department of Conservation s predator control response 1 Department of Conservation (DOC) scientist Graeme Elliott discusses the current beech mast, an event that will mean high
Know Your River Conwy Salmon & Sea Trout Catchment Summary
 Know Your River Conwy Salmon & Sea Trout Catchment Summary Introduction This report describes the status of the salmon and sea trout populations in the Conwy catchment. Bringing together data from rod
Warmer temperatures, molt timing and lobster seasons in the Canadian Maritimes
 Warmer temperatures, molt timing and lobster seasons in the Canadian Maritimes John Tremblay 1, Jean Lavallee 2 and Ross Claytor 1 1 Population Ecology Division, Fisheries and Oceans, Bedford Institute
Navel orangeworm biology, monitoring, and management
 Navel orangeworm biology, monitoring, and management Chuck Burks 1, Elizabeth Fichtner 2, and Brad Higbee 3 1 USDA-ARS, Parlier, CA 2 UCCE, Tulare, CA 3 Paramount Farming, Bakersfield, CA Topics, NOW Monitoring
Developing a target selective bait delivery technique for control of feral goats.
 Developing a target selective bait delivery technique for control of feral goats. R Hunt 1, A Claridge 1, D Mills 1 B Russell 1 and P Fleming 2 1 NSW National Parks and Wildlife Service, PO Box 733, Queanbeyan
SC China s Annual report Part II: The Squid Jigging Fishery Gang Li, Xinjun Chen and Bilin Liu
 3 rd Meeting of the Scientific Committee Port Vila, Vanuatu 28 September - 3 October 215 SC-3-9 China s Annual report Part II: The Squid Jigging Fishery Gang Li, Xinjun Chen and Bilin Liu National Report
Danish gambling market statistics Third quarter, 2017
 Danish gambling market statistics Third quarter, Third Quarter, 7. december Third Quarter, Danish gambling market statistics 1 Indhold A. Introduction... 2 B. Quarterly market statistics for the Danish
Job Title: Game Management, Subsection B Game Management Mountain Lion
 Job Title:, Subsection B Goal: Manage the mountain lion population, its numbers and distribution, as an important part of Arizona s fauna and to provide mountain lion hunting recreation opportunity while
WHAT CAN WE LEARN FROM COMPETITION ANALYSIS AT THE 1999 PAN PACIFIC SWIMMING CHAMPIONSHIPS?
 WHAT CAN WE LEARN FROM COMPETITION ANALYSIS AT THE 1999 PAN PACIFIC SWIMMING CHAMPIONSHIPS? Bruce Mason and Jodi Cossor Biomechanics Department, Australian Institute of Sport, Canberra, Australia An analysis
Job Title: Game Management, Subsection B Game Management Mountain Lion. SPECIES: Mountain Lion
 SPECIES: Goal: Manage the mountain lion population, its numbers and distribution, as an important part of Arizona s fauna and to provide mountain lion hunting recreation opportunity while maintaining existing
Appendix 22 Sea angling from a private or chartered boat
 Appendix 22 Sea angling from a private or chartered boat LUC SMRTS2015 Final Report 359 March 2016 Appendix 22 Sea angling from a private or chartered boat Table A22.1: Summary of sample confidence levels
mustelids Pest Animal Factsheet Introduction
 mustelids Introduction The introduction of mustelids is regarded as one of the worst mistakes ever made by European colonists in New Zealand. They were introduced to reduce the rabbit population, but have
System Flexibility Indicators
 System Flexibility Indicators Place your chosen image here. The four corners must just cover the arrow tips. For covers, the three pictures should be the same size and in a straight line. Operational Forum
Wisconsin 511 Traveler Information Annual Usage Summary January 3, Wisconsin 511 Phone Usage ( )
") Wisconsin 511 Traveler Information 211 Annual Usage Summary January 3, 212 Overall to-date Summary 36 months of operation 1,16,63 total calls the 1 Million mark was passed on December 3, 212 3,627,527
Wisconsin 511 Traveler Information 211 Annual Usage Summary January 3, 212 Overall to-date Summary 36 months of operation 1,16,63 total calls the 1 Million mark was passed on December 3, 212 3,627,527
Lake Winnibigoshish Fisheries Information Newsletter
 Lake Winnibigoshish Fisheries Information Newsletter 03/21/2016 An annual fisheries newsletter for Lake Winnibigoshish In This Issue 2016 Population Assessment Invasive Species VHS Interesting Links Invasive
FEEDING BY CAPTIVE RARE BIRDS ON BAITS USED IN POISONING OPERATIONS FOR CONTROL OF BRUSHTAIL POSSUMS
 E.B. SPURR Manaaki Whenua - Landcare Research, P.O. Box 31-011, Christchurch, New Zealand. 13 FEEDING BY CAPTIVE RARE BIRDS ON BAITS USED IN POISONING OPERATIONS FOR CONTROL OF BRUSHTAIL POSSUMS Summary:
FISH COMMUNITIES AND FISHERIES OF THE THOUSAND ISLANDS AND MIDDLE CORRIDOR
 St. Lawrence River Discussion Paper FISH COMMUNITIES AND FISHERIES OF THE THOUSAND ISLANDS AND MIDDLE CORRIDOR Issues Below is a synopsis of fish community issues and proposed management approaches. More
FACILITATING THE MANAGEMENT OF FOXES ON PRIVATE LAND: ARE LANDHOLDERS INTERESTED?
 13th Australasian Vertebrate Pest Conference Proceedings Keven Drew Te Papa Wellington, New Zealand 2-6 May 2005 Hosted by Manaaki Whenua Landcare Research PO Box 69, Lincoln 8152, New Zealand. www.landcareresearch.co.nz
Draft Wild Horse Management Plan
 Draft Wild Horse Management Plan Each year, Kosciuszko National Park provides thousands of visitors with experiences that are not available anywhere else. Maintaining the balance between protecting the
Producer Price Index - Agriculture (PPI-A) (January March 2001)
 (January March 2001)") Producer Price Index - Agriculture (PPI-A) (January March 2001) Introduction The Producer Price Index-Agriculture (PPI-A) gives a measure of the average change in the selling prices which producers receive
Producer Price Index - Agriculture (PPI-A) (January March 2001) Introduction The Producer Price Index-Agriculture (PPI-A) gives a measure of the average change in the selling prices which producers receive
Appendix 9 SCUBA diving in the sea
 Appendix 9 SCUBA diving in the sea Firth of Clyde Forum SMRTS2015 Final Report 195 March 2016 Appendix 9 SCUBA diving in the sea Table A9.1: Summary of sample confidence levels Responses Spatial data Questionnaire
Application of a New Method for Monitoring Lake Trout Abundance in Yukon: Summer Profundal Index Netting (SPIN)
") Application of a New Method for Monitoring Lake Trout Abundance in Yukon: Summer Profundal Index Netting (SPIN) Prepared by: Lars Jessup Nathan Millar November 2011 Application of a New Method for Monitoring
Application of a New Method for Monitoring Lake Trout Abundance in Yukon: Summer Profundal Index Netting (SPIN) Prepared by: Lars Jessup Nathan Millar November 2011 Application of a New Method for Monitoring
Conservation Limits and Management Targets
 Conservation Limits and Management Targets Setting conservation limits The use of conservation limits (CLs) in England and Wales (E&W) has developed in line with the requirement of ICES and NASCO to set
Of bitterns, bats and bellbirds: recent research on mammalian predators and predator control in wetlands, alpine habitats and forests
 Of bitterns, bats and bellbirds: recent research on mammalian predators and predator control in wetlands, alpine habitats and forests Colin O Donnell Biodiversity Group, Department of Conservation codonnell@doc.govt.nz
Winter 2017 Pest Removal Fact Sheets
 Winter 2017 Pest Removal Fact Sheets Operational information - page 2 Brodifacoum information - page 6 1 Operational Information The Brook Waimarama Sanctuary Trust s (the Trust) vision is to be New Zealand
Enclosed, please find the 2018 Spotlight Deer Survey Report and Recommendations that we have prepared for your review and records.
 July 26, 2018 YO Ranchlands Landowner Association 1323 Whispering Pines Houston, TX 77055 To the Wildlife Committee: Enclosed, please find the 2018 Spotlight Deer Survey Report and Recommendations that
Results of the 2015 nontidal Potomac River watershed Smallmouth Bass Young of Year Survey
 Results of the 2015 nontidal Potomac River watershed Smallmouth Bass Young of Year Survey Natural reproduction of smallmouth bass in the nontidal Potomac River mainstem has been assessed annually since
Abel Tasman Birdsong Trust Trapping Report - February 2017
 Abel Tasman Birdsong Trust Trapping Report - February 2017 Overview Traps are checked Abel Tasman Birdsong Trust volunteers twice per month. The results for trap checking are recorded and entered into
MAMMALS. Cannizaro Park is a haven for a large variety OF CANNIZARO PARK
 MAMMALS OF CANNIZARO PARK Cannizaro Park is a haven for a large variety of the native British animals with the notable exception of the deer family. All of the mammals are generally wary of humans and
Use of bait stations for possum and feral cat control
 Use of bait stations for possum and feral cat control SCIENCE FOR CONSERVATION: 86 M.D. Thomas, D.A. Wright, J. Mason and K.W. Briden Published by Department of Conservation P.O. Box 10-420 Wellington,
So we re seeking sponsorship from local businesses - to help fund the purchase of backyard traps and help makes this vision a reality.
 "If we get everyone believing in this... we've got a real chance of achieving a Predator Free New Zealand by 2050." - Next Foundation Chairman Chris Liddell WHO ARE WE? Predator Free Miramar is a volunteer,
Northland Region road trauma for Northland Region. Road casualties Estimated social cost of crashes* Major road safety issues
 ISSN 1176-841X July 26 Land Transport has prepared this road safety issues report. It is based on reported crash data and trends for the 21 25 period. The intent of the report is to highlight key road
Who is Out at Night in the Kuse Nature Preserve, a Nearby Woods or Maybe in Your Backyard?
 Rabbit That Has Gnawed Bark of Cedars During the Night Who is Out at Night in the Kuse Nature Preserve, a Nearby Woods or Maybe in Your Backyard? A nature preserve is not like a zoo. At a zoo, animals