Northland Region road trauma for Northland Region. Road casualties Estimated social cost of crashes* Major road safety issues
|
|
|
- Moris Wilkins
- 5 years ago
- Views:
Transcription

1 ISSN X July 26 Land Transport has prepared this road safety issues report. It is based on reported crash data and trends for the period. The intent of the report is to highlight key road safety issues and as a resource, identify possible ways to reduce the number of road deaths and injuries in the. With a population of 148,6 in 25, the is tenth in population size in the group of 14 regional authorities. The crash rate for the ranks higher though, with the in sixth place for crashes per head of population. crash numbers have increased faster than the population growth. In 21, there were around 2 crashes reported per 1, people, but by 25, there were 33 crashes per 1, people. The crash rate on open road state highways is higher than most with the ranking fourth out of the 14 authorities. The crash rate per kilometre travelled on rural state highways is 32 percent higher in the than the national average. The good news is that less crashes occurred on the open road across the in 25 compared to previous years. Fatal and serious crashes also reduced and the cost to society as a result of crashes in the Northland Region was lower than previous years, totalling $213 million in 25. Major road safety issues Alcohol Loss of control on bends Speed Crossing and turning crashes Nationally Speed Alcohol Failure to give way Restraints road trauma for Deaths 22 Serious casualties 132 Minor casualties 542 Fatal crashes 21 Serious injury crashes 16 Minor injury crashes 36 Non-injury crashes 939 Road casualties User type % 8% 27% 7% 5% Estimated social cost of crashes* Social cost ($ million) 52% car drivers car passengers cyclists motorcyclists pedestrians heavy vehicles local roads state highways * The estimated social cost includes loss of life or life quality (estimated by the amount ers are prepared to pay to reduce their risk of fatal or non-fatal injury), loss of output due to injuries, medical and rehabilitation costs, legal and court costs, and property damage. These costs are expressed at June 25 prices.
2 Crash types In rural areas, on high-speed roads, losing control on bends dominated and these crashes were overrepresented when compared to other parts of the country. The trend for this crash type has been increasing over past years. In 25, 59 percent of the s crashes on rural roads involved losing control on a bend. The proportion was even higher on the local road network (excluding state highways) where 68 percent of rural crashes involved losing control on a bend. number of crashes Rural loss of control crashes The two crash types that were over-represented in urban areas were vehicles hitting pedestrians and rear-end crashes. Over the past few years the number of crossing or turning crashes, rear-end crashes, pedestrian crashes and loss of control on urban bends has been increasing. Urban crash types straight roads bends Road user types Car drivers were the most commonly injured road users in the. The number of car drivers, passengers, cyclists and motorcyclist casualties has increased in recent years. Females now make up more of the casualties. In urban crashes, female casualties outnumbered males in 25. The most common age group for both male and female casualties was years. Pedestrian crash numbers increased in 22 and remained at that level over the next three years. Children are over-represented in the pedestrian casualty figures. number of casualties Vulnerable road user casualties motorcyclists cyclists pedestrians A large proportion of casualties in the Northland Region are Maori who made up 46 percent of urban casualties and 38 percent of rural casualties. Ethnicity of casualties 6 5 other number of crashes Asian Pacific Islander Maori 1 European % 1% 2% 3% 4% 5% 6% 7% bend-loss of control/head-on crossing/turning rear-end/obstruction pedestrian vs vehicle percentage of ethnicity Crash rate on rural state highways Southland Otago Hawkes Bay Northland Gisborne Taranaki West Coast Nelson/Marlborough Manawatu/Wanganui all all regions Waikato Bay of Plenty Auckland Wellingon Canterbury Wearing a safety belt dramatically reduces the chance of injury or death if a crash does occur. The wearing of safety belts in the has improved noticeably. Recent surveys showed 93 percent of adults were wearing front seat safety belts compared to 88 percent in 21; however, this is still behind the national figure of 95 percent. Child restraint use was measured at 98 percent in the, well above the national figure of 89 percent number of crashes
3
4
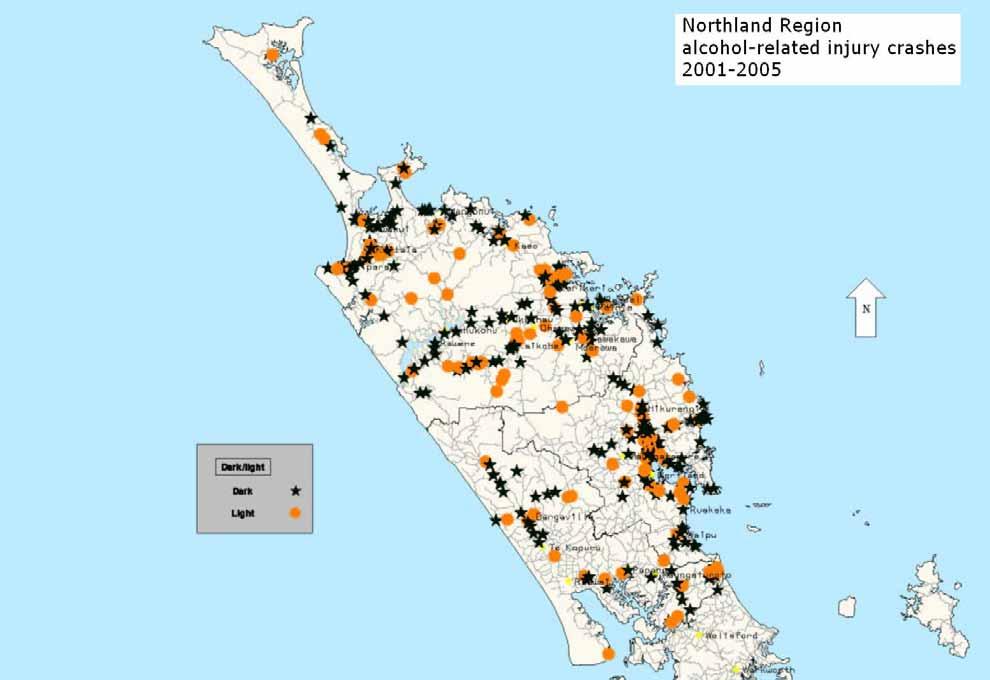
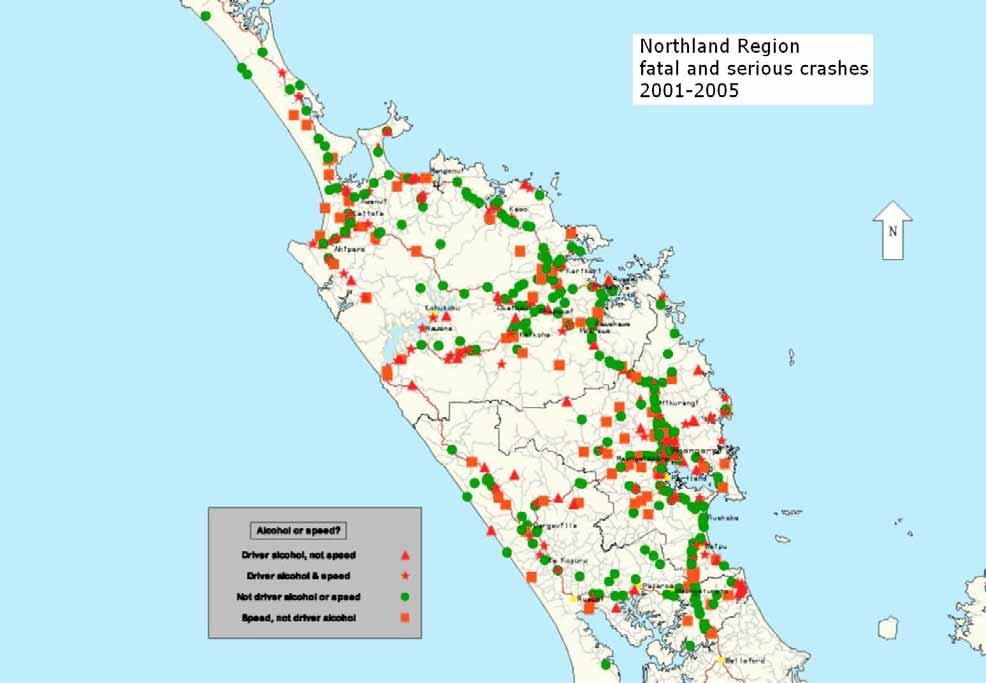
5 Crash factors Crashes are often caused by drivers not paying attention, not being observant or not checking adequately. Poor vehicle handling skills are often mentioned. These factors are common in many crashes but are also often combined with other factors. Over-represented factors in the s rural crashes have been identified as speed, alcohol and road factors. In urban crashes, speed, alcohol and road factors were also identified along with pedestrian factors. The has one of the highest proportions of crashes involving alcohol and one of the highest levels of drivers exceeding the alcohol limit. Alcohol factors have hovered at around percent of urban crashes over recent years and at about 2 21 percent of rural crashes. Within the, the Far North District is particularly over-represented in alcohol-related incidents. For crashes on rural roads, contributing factors included speed, poor handling, alcohol and road factors. These have increased in recent years. number of factors Increasing rural crash factors alcohol too fast poor handling road factors Travelling too fast for the conditions was a factor in 28 percent of rural road crashes in 25. The generally has a high number of speed-related crashes, not just on the open road but in urban areas too. This could contribute to the high proportion of crashes where drivers lose control. As well as drivers travelling at speeds too fast for the conditions, speed can also relate to drivers exceeding the posted speed limit. Observance of open road speed limits in the has improved but a high percentage of drivers are exceeding urban speed limits. In urban areas, the crash factors of failing to give way or stop, not checking, poor handling and cyclist involvement have risen considerably over the past few years. Speed as a factor in urban crashes showed a decline in 25. Road and environmental factors In the, the proportion of rural crashes on local authority roads (off the state highway network) have been increasing year by year. In 25, 47 percent of rural crashes occurred on local authority roads compared with 21 when this was 32 percent. Over the past few years, there has been a reduction in the number of crashes at rural intersections. Crashes on wet roads remain above average in the with around a third of rural crashes occurring on wet roads and around a quarter on urban roads. Crashes at night have been increasing. In 25, 37 percent of rural road crashes occurred in darkness. The is well over-represented in crashes on unsealed roads, particularly on local roads in the Far North and Kaipara Districts. In 25, 34 percent of the crashes on s local road network were on unsealed roads. percentage of crashes Crashes on unsealed local rural roads 4% 35% 3% 25% 2% 15% 1% 5% % Hitting a solid roadside object can increase the possibility of injury or the severity of injury in a crash. In the, ditches, trees and cliffs or banks were over-represented as objects struck in a crash. December is clearly the most common month for crashes and Saturday is the most common day of the week. percentage of crashes Crashes by month of year 14% 12% 1% 8% 6% 4% 2% % Jan Feb Mar Apr May Jun Jul Aug Sep Oct Nov Dec
6 Reporting crashes Crash reporting rate Not all crashes are reported to the Police; not even all the serious ones. The reporting rate measure compares the number of serious casualties reported to hospitals with those that are reported by Police. The reporting rate of crashes in the has increased from 21 when it was 56 percent, to 68 percent in 26. The national rate is now 7 percent. This means that more information on crashes is now available for targeting resources on improving roads, directing enforcement and developing community programmes. Reporting rate of serious injuries to hospital admissions reporting rate 75% 7% 65% 6% 55% 5% 45% 4% 35% 3% Hospitalisations Crashes that result in admission to hospital are being measured. In the, the hospitalisation rate had been reducing but started to increase again in 25. Crash reduction studies All three district councils in the region and Transit NZ are now conducting regular crash reduction studies to find and treat the high-risk crash locations on the local road and state highway networks. The treated sites are being monitored for reductions in crash numbers and have shown impressive results in crash and casualty savings. Crash reductions at study sites Kaipara Contacts Land Transport Partnership Manager Northern Peter Kippenberger Private Bag 16 62, Auckland Phone Manager Programmes John Garvitch Education Advisor Karen Sandoy See contact details at the bottom of the page. Road Safety Coordinator (Far North) Kiri Sloan PO Box 2, Kaitaia Phone Road Safety Coordinator (Whangarei/Kaipara) Gillian Archer PO Box 1124, Whangarei Phone Police Inspector Clifford Paxton Private Bag 916, Whangarei Phone Mid/Far North Area Controller Inspector Chris Scahill PO Box 31, Kerikeri Phone Whangarei/Kaipara Area Controller Inspector Paul Dimery Private Bag 916, Whangarei Phone Transit Area Engineer Northland Richard Green PO Box 1899, Whangarei Phone Highways North Incident reporting Phone Whangarei Far North percentage reduction in crashes Whangarei Office Level 1, NZ Post Building Cnr Rathbone and Robert Streets PO Box 1664 Whangarei Telephone Fax state highway local road
Road Safety Report 2003 to 2007
 RRMasterton District Road Safety Report to 7 Performance Information Land Transport New Zealand - Wakefield Street PO Box 7 9 WELLINGTON Ph. () 9 89 Fax. () 9 899 Web: www.landtransport.govt.nz April 8
road safety issues 2002 road trauma for TNZ Region Two July 2003 Road deaths Estimated social cost of crashes* Major road safety issues
 road safety issues July 23 22 road trauma for TNZ Region Two The Land Transport Safety Authority (LTSA) has prepared this road safety issues report. It is based on reported crash data and trends for the
Napier City road trauma for Napier City. Road casualties Estimated social cost of crashes* Major road safety issues.
 ISSN 1176-841X July 25 Land Transport New Zealand has prepared this road safety issues report. It is based on reported crash data and trends for the 2 24 period. The intent of the report is to highlight
2003 road trauma for. Wairoa District. Road casualties Estimated social cost of crashes* Major road safety issues WAIROA DISTRICT JULY 2004
 WAIROA DISTRICT JULY 24 T he Land Transport Safety Authority (LTSA) has prepared this road safety issues report. It is based on reported crash data and trends for the 1999 23 period. The intent of the
road safety issues 2001 road toll for Gisborne district July 2002 Road user casualties Estimated social cost of crashes*
 GISBORNE DISTRICT road safety issues July 22 The Land Transport Safety Authority (LTSA) has prepared this Road Safety Issues Report. It is based on reported crash data and trends for the 1997 21 period.
Hawkes Bay Region State Highways Road Safety Report 2005 to 2009
 Hawkes Bay Region State Highways Road Safety Report 25 to 29 Performance Information NZ Transport Agency PO Box 74 Dunvegan House 215 Hastings St NAPIER 414 Ph. (6)974 552 Fax. (6)974 5529 Web: www.nzta.govt.nz
road safety issues 2002 road trauma for Tauranga District July 2003 Regional crash causes Estimated social cost of crashes*
 road safety issues July 23 22 road trauma for Tauranga District The Land Transport Safety Authority (LTSA) has prepared this road safety issues report. It is based on reported crash data and trends for
briefing notes - road safety issues
 briefing notes road safety Waikato District briefing notes - road safety issues Waikato District New Zealand Transport Agency has prepared this eleventh road safety issues report. It is based on reported
Western Bay of Plenty/ Tauranga Area
 ISSN 1176-841X July 5 Land Transport New Zealand has prepared this report. It is based on reported crash data and trends for the 4 period. The intent of the report is to highlight the key and provide partners
2 ROAD SAFETY OUTCOMES
 . 2 ROAD SAFETY OUTCOMES 9 8 fatal/serious crashes with alcohol (suspected) fatal/serious crashes with alcohol (+ve test) 7 6 4 3 2 1 26 28 21 212 214 216 3 ROAD SAFETY OUTCOMES 3 3 2 2 1 1 Overall outcomes:
Water Safety New Zealand Drowning Prevention Report
 Water Safety New Zealand Drowning Prevention Report 2017 2017 Overview Drowning is the respiratory impairment of lungs due to submersion/immersion in liquid.* It can be fatal (mortality), or non-fatal
A review of 2015 fatal collision statistics as of 31 December 2015
 A review of fatal collision statistics as of 31 December This report summarises the main trends in road fatalities that have emerged in. This has been prepared by the Road Safety Authority following analysis
Deaths/injuries in motor vehicle crashes per million hours spent travelling, July 2007 June 2011 (All ages) Mode of travel
 Mode of travel") Cyclists CRASH STATISTICS FOR THE YEAR ENDED 31 DECEMBER 211 Prepared by the Ministry of Transport CRASH FACTSHEET 212 Cyclists have a number of risk factors that do not affect car drivers. The main risk
Cyclists CRASH STATISTICS FOR THE YEAR ENDED 31 DECEMBER 211 Prepared by the Ministry of Transport CRASH FACTSHEET 212 Cyclists have a number of risk factors that do not affect car drivers. The main risk
People killed and injured per million hours spent travelling, Motorcyclist Cyclist Driver Car / van passenger
 Cyclists CRASH FACTSHEET 27 CRASH STATISTICS FOR THE YEAR ENDED 31 DEC 26 Prepared by Strategy and Sustainability, Ministry of Transport Cyclists have a number of risk factors that do not affect car drivers.
Water Safety New Zealand Drowning Prevention Report
 Water Safety New Zealand Drowning Prevention Report 2016 2016 Overview Drowning is the respiratory impairment of lungs due to submersion/immersion in liquid. It can be fatal (mortality), or non-fatal (morbidity).*
MTCF. Michigan Traffic Crash Facts FACT SHEETS
 FACT SHEETS This page left intentionally blank GENERAL FACTS The driver, the roadway, and the motor vehicle contribute in some measure to every crash. A preponderance of evidence, however, points to driver
MTCF. Michigan Traffic Crash Facts FACT SHEETS
 FACT SHEETS This page left intentionally blank GENERAL FACTS The driver, the roadway, and the motor vehicle contribute in some measure to every crash. A preponderance of evidence, however, points to driver
WATER SAFETY NEW ZEALAND DROWNING PREVENTION REPORT 2015
 WATER SAFETY NEW ZEALAND DROWNING PREVENTION REPORT Contents Introduction National Overview Progress Towards New Zealand Water Safety Strategy Goals Mortality Quick Facts Acknowledgements With special
the Ministry of Transport is attributed as the source of the material
 Cyclists 2015 Disclaimer All reasonable endeavours are made to ensure the accuracy of the information in this report. However, the information is provided without warranties of any kind including accuracy,
NEW ZEALAND DROWNING REPORT
 NEW ZEALAND DROWNING REPORT Contents 17 lives tragically lost in National Overview Mortality per Capita Mortality by Age Group Mortality by Gender Mortality by Ethnicity Mortality by Environment Mortality
Encouraging Taxi Drivers to Behave: Grafton Bridge Taxi and Bus Lane Trial. Rob Douglas-Jones Tim Segedin, Edin Ltd.
 Encouraging Taxi Drivers to Behave: Grafton Bridge Taxi and Bus Lane Trial Rob Douglas-Jones Tim Segedin, Edin Ltd. 2.1km 12 mins Hospital 1.5km 9 mins To Newmarket 5 500 bikes per day 500 pedestrians
2010/11 Road Policing Programme (RPP) A variation of the 2009/12 RPP
 A variation of the 2009/12 RPP") 2010/11 Road Policing Programme (RPP) A variation of the 2009/12 RPP ISSN 978-0-478-37120-8 (electronic) The 2010/11 Road Policing Programme (RPP) is a variation of the 2009/12 RPP. It was prepared by
2010/11 Road Policing Programme (RPP) A variation of the 2009/12 RPP ISSN 978-0-478-37120-8 (electronic) The 2010/11 Road Policing Programme (RPP) is a variation of the 2009/12 RPP. It was prepared by
2015 Victorian Road Trauma. Analysis of Fatalities and Serious Injuries. Updated 5 May Page 1 of 28. Commercial in Confidence
 2015 Victorian Road Trauma Analysis of Fatalities and Serious Injuries Updated 5 May 2016 Page 1 of 28 Commercial in Confidence VICROADS_n3445896_2015_Victorian_Trauma_Report_- _updated_may_2016.docx 2015
BSA New Zealand All District Health Board Coverage Report
 BSA New Zealand All District Health Board Coverage Report For the period ending 31 March 2018 Citation: Ministry of Health. April 2018. BSA New Zealand District Health Board Coverage Report: period ending
Bicycle Crashes. Number of Bike Crashes. Total Bike Crashes. are down 21% and severe bike crashes down 8% since 2013 (5 years).
.") Bicycle Crashes The City of Fort Collins is well known for its bike culture, and there is a strong focus on encouraging increased riding. Bike safety is an important component of supporting these efforts.
Bicycle Crashes The City of Fort Collins is well known for its bike culture, and there is a strong focus on encouraging increased riding. Bike safety is an important component of supporting these efforts.
For Information Only. Pedestrian Collisions (2011 to 2015) Resolution. Presented: Monday, Apr 18, Report Date Tuesday, Apr 05, 2016
 Resolution. Presented: Monday, Apr 18, Report Date Tuesday, Apr 05, 2016") Presented To: Operations Committee For Information Only Pedestrian Collisions (0 to 0) Presented: Monday, Apr 8, 06 Report Date Tuesday, Apr 0, 06 Type: Correspondence for Information Only Resolution For
Presented To: Operations Committee For Information Only Pedestrian Collisions (0 to 0) Presented: Monday, Apr 8, 06 Report Date Tuesday, Apr 0, 06 Type: Correspondence for Information Only Resolution For
Crash Patterns in Western Australia. Kidd B., Main Roads Western Australia Willett P., Traffic Research Services
 Crash Patterns in Western Australia Kidd B., Main Roads Western Australia Willett P., Traffic Research Services Abstract Examination of crash patterns is one way of identifying key factors on which focus
Road Safety Trends, Targets and Safety Programs in New Zealand. by Dr Shane Turner
 Road Safety Trends, Targets and Safety Programs in New Zealand by Dr Shane Turner New Zealand Kiwi s vs Aussies Outline Land transport organisations NZ & US crash/accident trends NZ safety targets & priorities
DROWNINGS & OTHER WATER-RELATED INJURIES DURING LAND & AIR TRANSPORT
 PART 7 DROWNINGS & OTHER WATER-RELATED INJURIES DURING LAND & AIR TRANSPORT Most land and air transport drownings involve either travel off-road over ice by snowmobiles or on-road over bridges and highways
ROAD SAFETY ANNUAL REPORT 2018 ISRAEL
 ROAD SAFETY ANNUAL REPORT 2018 ISRAEL ISRAEL Israel recorded 321 road fatalities in 2017, representing a 3.9% decrease when compared to 2016. The mortality rate is 3.6 deaths per 100 000 population. Since
Cambridgeshire and Peterborough Road Safety Partnership Handbook
 and Peterborough Road Safety Partnership Handbook ANNUAL STATISTICS SUMMARY- 2016 Contents Introductions 1 Key points 2 Summary table 3 Overall trends 3 Casualties by prevailing speed limit 4 Casualties
Alberta. Traffic Collision Statistics. Office of Traffic Safety Transportation Services Division May 2017
 Traffic Collision Statistics Office of Traffic Safety Transportation Services Division May 217 This page was intentionally left blank. 2 Table of Contents Traffic Collisions... 4 Traffic Collision Rates...
Cambridgeshire and Peterborough Road Safety Partnership Handbook
 and Peterborough Road Safety Partnership Handbook ANNUAL STATISTICS SUMMARY 2015 3941 CCC_Road Safety HBook.indd 1 19/08/2016 14:59 Contents Introduction 2 Key points 3 Summary table 4 Overall trends 4
2017 Drowning Prevention Report (Provisional)
") 2017 Drowning Prevention Report (Provisional) Introduction 12 January 2017 Drowning is the respiratory impairment of lungs due to submersion / immersion in liquid. It can be fatal (mortality), or non-fatal
2017 Drowning Prevention Report (Provisional) Introduction 12 January 2017 Drowning is the respiratory impairment of lungs due to submersion / immersion in liquid. It can be fatal (mortality), or non-fatal
New Zealand Cycling Safety Summit
 New Zealand Cycling Safety Summit Briefing Notes 15 April 2014 Introduction Establishment of the New Zealand Cycling Safety Panel During 2013 Coroner Gordon Matenga conducted a review of recent cycling
Review of Fatal Collisions
 Review of Fatal Collisions January to July 1 st 16 Review of 16 fatal collision statistics as of 1st July 16 Overview This report summarises the main trends in road fatalities that have emerged up to the
the Ministry of Transport is attributed as the source of the material
 Disclaimer All reasonable endeavours are made to ensure the accuracy of the information in this report. However, the information is provided without warranties of any kind including accuracy, completeness,
VEHICLE / PEDESTRIAN COLLISIONS
 VEHICLE / PEDESTRIAN COLLISIONS HRM: April 018 DISCLAIMER: All figures presented in this report reflect the information held on HRP systems at the time of data extraction and are subject to change without
the Ministry of Transport is attributed as the source of the material
 Pedestrians 216 Disclaimer All reasonable endeavours are made to ensure the accuracy of the information in this report. However, the information is provided without warranties of any kind including accuracy,
Summary of bicycle helmet law results in Western Australia
 Summary of bicycle helmet law results in Western Australia * All graphs, charts and tables presented in this document are scanned directly from reports published by Western Australia government departments,
NCSP New Zealand Northland District Health Board Coverage Report
 NCSP New Zealand Northland District Health Board Coverage Report For the period ending 30 June 2018 Citation: Ministry of Health. July 2018. NCSP New Zealand District Health Board Coverage Report: period
NCSP New Zealand Northland District Health Board Coverage Report
 NCSP New Zealand Northland District Health Board Coverage Report For the period ending 31 December 2017 Citation: Ministry of Health. January 2018. NCSP New Zealand District Health Board Coverage Report:
NCSP New Zealand All District Health Board Coverage Report
 NCSP New Zealand All District Health Board Coverage Report For the period ending 31 March 2018 Citation: Ministry of Health. April 2018. NCSP New Zealand District Health Board Coverage Report: period ending
MEMORANDUM. City Constituents. Leilani Schwarcz, Vision Zero Surveillance Epidemiologist, SFDPH
 MEMORANDUM TO: FROM: CC: City Constituents Leilani Schwarcz, Vision Zero Surveillance Epidemiologist, SFDPH Megan Wier, Co-Chair, San Francisco Vision Zero Task Force, SFDPH Commander Ann Mannix, Traffic
SWISS Traffic Figures May 2004
 SWISS Traffic Figures May 2004 SWISS continues seat load factor improvement in May SWISS s load factor for May was 4.8 percentage points better than for the same period last year. Seat load factor for
2014 QUICK FACTS ILLINOIS CRASH INFORMATION. Illinois Emergency Medical Services for Children February 2016 Edition
 2014 QUICK FACTS ILLINOIS CRASH INFORMATION February 2016 Edition Illinois Emergency Medical Services for Children www.luhs.org/emsc Illinois Emergency Medical Services for Children TABLE OF CONTENTS
2012 QUICK FACTS ILLINOIS CRASH INFORMATION. Illinois Emergency Medical Services for Children September 2014 Edition
 2012 QUICK FACTS ILLINOIS CRASH INFORMATION September 2014 Edition Illinois Emergency Medical Services for Children www.luhs.org/emsc Illinois Emergency Medical Services for Children TABLE OF CONTENTS
Police Recorded Injury Road Traffic Collisions and Casualties Northern Ireland. Detailed Trends Report 2015
 Police Service of Northern Ireland Police Recorded Injury Road Traffic Collisions and Casualties Northern Ireland Detailed Trends Report 2015 Annual Bulletin Published 30 th June 2016 Contact: Traffic
Transport Safety Action Plan
 Transport Safety Action Plan Issue 1 March 2010 ! "! # $! %$! " $ & ' $ ( )* $ )* ) +*, $! # )+#, # -.# ) / -. $$ 01 01 01 0!1 0$1 0-1 061 2(3 )& * 4 " 5# )& # ) )* ) / ) )4 i 1. Introduction 1.1. Purpose
2 nd Road Safety PIN Conference 23 June 2008 Countdown to only two more years to act!
 2 nd Road Safety PIN Conference 23 June 2008 Countdown to 2010 - only two more years to act! EU ambition EU target to cut by 50% yearly road deaths between 2001 and 2010 Countries have similar national
Lincolnshire JSNA: Road Traffic Accidents
 Road Traffic Accidents What do we know? Summary A higher proportion of road traffic collisions in Lincolnshire result in death compared to other areas. This may be due to the types of road in the County
Road Safety Partnership
 Cambridgeshire and Peterborough Road Safety Partnership Cambridgeshire and Peterborough Road Safety Partnership Introduction Road accidents can have a devastating impact not only for the people directly
Discover the Safe System Approach
 Discover the Safe System Approach Aim Take you on a journey of discovery Inform, engage, enthuse and share with you the Safe System approach to saving death and injury on our roads Change to less graphic
Table of Content. Cyclist Injury Crashes APPENDIX GIS Heat Maps by Municipality P a g e
 Table of Content INTRODUCTION... 5 ALCOHOL... 6 Impaired Driving - Fatalities... 6 Youth Alcohol... 11 Youth Impaired Driving - Fatalities... 11 Alcohol-Impaired Driving Injury crashes... 16 SPEEDING &
NCSP New Zealand Hawke s Bay District Health Board Coverage Report
 NCSP New Zealand Hawke s Bay District Health Board Coverage Report For the period ending 30 tember 2017 Citation: Ministry of Health. November 2017. NCSP New Zealand District Health Board Coverage Report:
Motor Vehicle Related Fatalities 10-year Statistics for British Columbia Research and Data Unit Policy and Strategic Initiatives Branch
 Motor Vehicle Related Fatalities 1-year Statistics for British Columbia 27-216 Research and Data Unit Website: www.gov.bc.ca/roadsafetybc Twitter: http://twitter.com/ Contents Contents... 2 Introduction
Road Safety in 2016 Provisional Results
 Annual number of road traffic fatalities in France mainland 4500 4000 3500 3000 2500 Target 2010-2020 Fatalities 2000 1500 2010 2011 2012 2013 2014 2016 2017 2018 2019 2020 Road Safety in 2016 Provisional
COMPARISON OF FIXED & VARIABLE RATES (25 YEARS) CHARTERED BANK ADMINISTERED INTEREST RATES - PRIME BUSINESS*
 CHARTERED BANK ADMINISTERED INTEREST RATES - PRIME BUSINESS*") COMPARISON OF FIXED & VARIABLE RATES (25 YEARS) Fixed Rates Variable Rates FIXED RATES OF THE PAST 25 YEARS AVERAGE RESIDENTIAL MORTGAGE LENDING RATE - 5 YEAR* (Per cent) Year Jan Feb Mar Apr May Jun Jul
COMPARISON OF FIXED & VARIABLE RATES (25 YEARS) Fixed Rates Variable Rates FIXED RATES OF THE PAST 25 YEARS AVERAGE RESIDENTIAL MORTGAGE LENDING RATE - 5 YEAR* (Per cent) Year Jan Feb Mar Apr May Jun Jul
SOMERSET ROAD SAFETY PARTNERSHIP CASUALTY REVIEW Working together to reduce casualties
 CASUALTY REVIEW 27-29 Working together to reduce casualties 3 CONTENTS 1 EXECUTIVE SUMMARY 2 2 INTRODUCTION: CASUALTY REDUCTION TARGETS 3 3 COLLISION AND CASUALTY TRENDS 4 4 KILLED AND SERIOUSLY INJURED
Safety and Active Transport. Dr. Maureen Carew, Medical Officer of Health Renfrew County and District Health Unit May 30, 2014
 Safety and Active Transport Dr. Maureen Carew, Medical Officer of Health Renfrew County and District Health Unit May 30, 2014 Active Transport Vision Increase levels of walking and cycling Reduce vehicle
Truck Tractor Trailer Crash Analysis
 Building Tribal Traffic Safety Capacity Truck Tractor Trailer Crash Analysis Arizona Department of Transportation (ADOT) Motor Vehicle Crash (MVC) Data ITCA, Inc. 04/18/06 Truck Tractor Trailer Crash Analysis
Published 24th June 2016 Published 31 st August Police Service of Northern Ireland Police Service of Northern Ireland
 Police Service of Northern Ireland Police Service of Northern Ireland Police Recorded Injury Road Traffic Police Recorded Injury Road Traffic Collisions and Casualties Collisions and Casualties Northern
Auckland Transport Monthly Indicators Report 2018/19
 Attachment 1 Auckland Transport Monthly Indicators Report 218/19 August 218 Table of Contents Page 2. 1. Summary of indicators 1.1 SOI performance measures 1.2 AT Metro patronage breakdown 2. Monthly indicators
Traffic Safety Plan Traffic Safety Plan 2015
 Traffic Safety Plan 2015 Purpose Airdrie s last Traffic Safety Plan was created in 2011. The 2015 Traffic Safety Plan is a revised model of the traffic operations for the City of Airdrie. The purpose of
Figure 1. Indiana fatal collisions by young driver involvement,
 INDIANA TRAFFIC SAFETY FACTS YOUNG DRIVERS 2016 MAY 2017 ISSUE 17-C06 IN 2016: In 2016, 13.4 percent of all drivers involved in Indiana collisions were young drivers. Young drivers were involved in 105
Police Recorded Injury Road Traffic Collisions and Casualties Northern Ireland
 Police Service of Northern Ireland Police Recorded Injury Road Traffic Collisions and Casualties Northern Ireland Monthly Report Covering the reporting period 1 st January 2018 31 st August 2018 Published
Traffic Safety Basic Facts 2008
 In 2006 1, more than 4.700 seniors died in road traffic accidents in 14 European countries. Fatalities of elderly people in road traffic accidents reduced by over 3 between 1997 and 2006. Traffic Safety
DEPARTMENT OF TRANSPORT AND PUBLIC WORKS SAFELY HOME: ROAD SAFETY OVERVIEW
 DEPARTMENT OF TRANSPORT AND PUBLIC WORKS SAFELY HOME: ROAD SAFETY OVERVIEW Fifth Monthly Road Safety Workshop Childsafe-Woolworths Building, Hector Eliott Red Cross Children's Hospital 26 February 2015
2017 North Texas Regional Bicycle Opinion Survey
 2017 North Texas Regional Bicycle Opinion Survey Sustainable Development Program Kevin Kokes, AICP Public Meetings April, 2018 North Central Texas Council of Governments MPO for the Dallas-Fort Worth Region
Occ c u c pa p n a t pro r t O ec e t c i t O i n
 Occupant Protection Occupant Protection Introduction Buckling up or being buckled in is the most effective protection during a car crash. The simple truth is that the great majority of people ejected from
EMERGO TRAIN SYSTEM EXERCISE SCHEDULE ETS EXERCISES 2009 JAN FEB MAR APRIL MAY JUNE JULY AUGUST SEPT OCT NOV DEC. 30-Jun. 11-Dec. 12-Nov.
 EMERGO TRAIN SYSTEM EXERCISE SCHEDULE ETS EXERCISES 2009 30-Jun Canterbury Bertie ChCh Gisborne 23-Sep ChCh International Airport Big Bird 12-Nov Capital Coast Aftershock WLG Hosp 14-Nov 11-Dec Hawkes
Auckland Transport Monthly Indicators Report 2018/19
 Attachment 1 Auckland Transport Monthly Indicators Report 218/19 October 218 Table of Contents Page 2. 1. Summary of indicators 1.1 SOI performance measures 1.2 AT Metro patronage breakdown 2. Monthly
Child Road Safety in Great Britain,
 Child Road Safety in Great Britain, 21-214 Bhavin Makwana March 216 Summary This short report looks at child road casualties in Great Britain between 21 and 214. It looks at how children travel, the geographical
 Children (Aged
 ADDIS ABABA ROAD SAFETY STRATEGY
 ADDIS ABABA ROAD SAFETY STRATEGY (2017-2030) Feb 22, 2017 Presentation: Daniel Molla Overview Addis Ababa Capital City of Ethiopia, Seat of AU Area: 540 km 2 Population 3.4 million Road safety crises 400
COLLISION STATISTICS May Engineering Services Box 5008, th Avenue Red Deer, AB T4N 3T4
 COLLISION STATISTICS 2016 2016 Red Deer Annual Motor Vehicle Collision Report May 2017 Engineering Services Box 5008, 4914 48th Avenue Red Deer, AB T4N 3T4 engineering@reddeer.ca RCMP GRC Red Deer City
For further information contact: Alberta Transportation Office of Traffic Safety Main Floor, Twin Atria Building Avenue Edmonton, Alberta T6B
 Alberta Traffic Collision Statistics 2009 Alberta Traffic Collision Statistics 2009 For further information contact: Alberta Transportation Office of Traffic Safety Main Floor, Twin Atria Building 4999
Tampa Bay. Pedestrian Safety Skills
 Tampa Bay Pedestrian Safety Skills Today s Presentation After this session, attendees should be able to: Describe the grassroots WalkWise Pedestrian Safety Campaign Understand why pedestrian fatalities
Alberta. Traffic Collision Statistics
 Alberta Traffic Collision Statistics 2002 Alberta Traffic Collision Statistics 2002 For further information contact: Alberta Transportation Driver Safety, Research and Traffic Safety Initiative 1st Floor,
For further information contact: Alberta Infrastructure and Transportation Office of Traffic Safety Main Floor, Twin Atria Building Avenue
 Alberta Traffic Collision Statistics 2006 Alberta Traffic Collision Statistics 2006 For further information contact: Alberta Infrastructure and Transportation Office of Traffic Safety Main Floor, Twin
AUCKLAND REGIONAL ROAD SAFETY PLAN 2009/12 CREATING A SAFER TRANSPORT SYSTEM FOR AUCKLANDERS
 AUCKLAND REGIONAL ROAD SAFETY PLAN 2009/12 CREATING A SAFER TRANSPORT SYSTEM FOR AUCKLANDERS www.roadsafeauckland.org.nz www.arta.co.nz www.arta.co.nz The Auckland Regional Transport Authority (ARTA) was
THE EPIDEMIOLOGY OF TRAUMATIC BRAIN INJURIES IN NEW YORK STATE
 THE EPIDEMIOLOGY OF TRAUMATIC BRAIN INJURIES IN NEW YORK STATE Michael Bauer, Sarah Sperry, Kainan Sun, Susan Hardman New York State Department of Health, Bureau of Injury Prevention What is Traumatic
Louisiana Traffic Records Data Report 2017
 Louisiana Traffic Records Data Report 2017 crashdata.lsu.edu Dr. Helmut Schneider September 2018 Overview Trends in crashes, fatalities & injuries Findings from the Occupant Protection Survey of 2018 Driving
Increasing Awareness of Road Safety Risk Factors
 IRF Road Safety Challenge for Africa Session IV: Safer Road Users Increasing Awareness of Road Safety Risk Factors International Conference 11-12 March 2015, Addis Ababa, Ethiopia Randall Cable Pr Eng,
SWISS reports stable load factors
 SWISS Corporate Communications Phone: +41 (0)848 773 773 Fax: +41 (0)44 564 2127 communications@swiss.com SWISS.COM Media release Zurich Airport, October 10, 2008 SWISS reports stable load factors SWISS
CYCLING SCOTLAND SCOTTISH CHARITY NO.SCO Annual Cycling Monitoring Report
 CYCLING SCOTLAND SCOTTISH CHARITY NO.SCO29760 Annual Cycling Monitoring Report 2018 Annual Cycling Monitoring Report 2018 4 CYCLING SCOTLAND Annual Cycling Monitoring Report 2018 National cycling.scot
Speed Limits in the Hoddle Grid
 Speed Limits in the Hoddle Grid Recent History of speed limits March 2013 Docs # 7738485 1 Introduction Muncipalities have power to Erect speed limit signs BUT Municipalities DO NOT have the power to approve
Road Safety Action Plan
 Road Safety Action Plan for Christchurch City July 2015 June 2016 Goal: To enable collaborative planning among road safety inter-agencies in Christchurch. 1 Christchurch City Road Safety Action Plan 2015
Utility Debt Securitization Authority 2013 T/TE Billed Revenues Tracking Report
 Utility Debt Securitization Authority 2013 T/TE Billed Revenues Tracking Report Billing Budgeted Billed Dollar Percent Month Revenues Revenues Variance Variance Jan 2018 11,943,180.68 12,697,662.47 754,481.79
July 2015 Sept Cork City Pedestrian Counter Report
 July 2015 Sept 2015 Cork City Pedestrian Counter Report Disclaimer Cork City Council has produced this report based on information extracted from our Pedestrian Counter Monitoring System. Although care
Cyclist Safety in Australia
 Cyclist Safety in Australia From BITRE Trauma Statistical Summary, August 218 http://www.bitre.gov.au/publications/ongoing/road_deaths_australia_annual_summaries.aspx Trends in cyclist trauma numbers These
Towards Zero: Using Evidence and Aspiration to Reduce Road Trauma in Western Australia
 Towards Zero: Using Evidence and Aspiration to Reduce Road Trauma in Western Australia Iain Cameron Executive Director Office of Road Safety Western Australia, Australia iain.cameron@mainroads.wa.gov.au
Alberta. Traffic Collision Statistics
 Alberta Traffic Collision Statistics 2015 Alberta Traffic Collision Statistics 2015 For further information contact: Alberta Transportation Office of Traffic Safety Main Floor, Twin Atria Building 4999
Targeting collisions resulting in killed or serious injury (KSI) victims
 victims") Targeting collisions resulting in killed or serious injury (KSI) victims Superintendent Steve Lyne Dorset Police @SuptSteveLyne Why important? 1.25m deaths a year globally (WHO, 2015) ¾ deaths are male
Targeting collisions resulting in killed or serious injury (KSI) victims Superintendent Steve Lyne Dorset Police @SuptSteveLyne Why important? 1.25m deaths a year globally (WHO, 2015) ¾ deaths are male
Road Safety Annual Report 2016 OECD/ITF Chapter 26. Morocco
 Road Safety Annual Report 2016 OECD/ITF 2016 Chapter 26 Morocco This chapter presents 2014 road safety data for Morocco along with provisional data from 2015. It looks at trends in traffic and road safety
Road safety Strategy and road safety Targets for Bulgaria
 Road safety Strategy Road safety Strategy and road safety Targets for Bulgaria Alan Ross Road crash fatality reduction targets Country Base-year for target Year in which target is to be realised Target
Unintentional injuries
 Unintentional injuries Key points In 1998 451 children aged less than 15 years were admitted to hospital with burns from hot objects or substances, caustic or corrosive substances, and steam. In 1998 the
STUDY AND ANALYSIS OF ACCIDENTS ON NH 71-A
 STUDY AND ANALYSIS OF ACCIDENTS ON NH 71-A SARANSH Department of Civil Engineering Institute of technology and science Bhiwani S.S KAZAL Department of Civil Engineering. Institute of technology and science
Risk on the Road. Pedestrians, Cyclists and Motorcyclists August 2015
 Risk on the Road Pedestrians, Cyclists and Motorcyclists August 215 Contents Key Facts... 4 Pedestrians... 5 Pedestrian risk by time of day and age... 8 Cyclists... 11 Motorcyclists... 14 Glossary... 17
French Road Safety Observatory ONISR
 Road Safety in 2016 estimated as of January 23, 2017 Development of road traffic fatalities in France mainland : 3 469 persons are estimated to have died on the French mainland roads in 2016, representing