Louisiana Traffic Records Data Report 2017
|
|
|
- Ann Miles
- 5 years ago
- Views:
Transcription

1 Louisiana Traffic Records Data Report 2017 crashdata.lsu.edu Dr. Helmut Schneider September 2018
2 Overview Trends in crashes, fatalities & injuries Findings from the Occupant Protection Survey of 2018 Driving Under the Influence of Alcohol: Crashes and DWI Arrests Driver score card: violations and crashes
3 Trends What are the trends in crashes, fatalities and injuries? What are the trend in rates? What are one-year changes What are changes from 2010/11 to 2017 Highlights: Interstates Bicycles Pedestrians Motorcycles Young drivers Crash costs
4 Trends in Fatalities & Fatality Rate Since 2012 the fatalities have been on the rise again: 2.1% from % from Fatalities per 100 million miles traveled have been increasing by a smaller percentage since % from % from For comparison, the U.S fatality rate was at 1.18 in
5 Crashes, Vehicles, Occupants (1,000) Number of occupants and number of vehicles in crashes had increased dramatically from 2014 & 2015, but have fallen in If we still had the same fatality rate per occupant as in 2007 we would expect 1,023 fatalities in Fatality Rate Per 1,000 Occupants Occupants Vehicles Crashes
6 Injury Rate (per 100 Million Miles) Injuries per 100 Million Miles From 2016 to 2017 Dropped from 166 to 156 From 2010 to 2017 Increased from 151 to

7 17,000 16, Moderate and Severe Injury 16, , Moderate-to- Severe Injuries: Increased in 2015 and 2016, but dropped in 2017 to 2014 levels. 14,000 13, ,000 12,000 11, The Moderate-to- Severe-Injury Rate: per 100 million miles: Increased in 2015, BUT NOT IN 2016 and dropped in 2017 to the lowest level since 1999 when the injury code was first used. 10, Moderate to Severe Injuries Injury Rate
8 Increase in Crashes by Troop 50% 40% 39% 30% 20% 17% 17% 20% 23% 10% 0% -10% -20% 2% 1% 1% Troop D had the highest increase from 2010 to A B C D E F G I L But the 2017 crashes are only slightly above 2005 numbers. This is likely due to changes in the oil industry. Troop C had a large decline in crashes from 2010 to Year of Crash -16% Date A B C D E F G I L Changes in Troop A, B and L are likely related to increase in traffic in the I10/I12 corridor. Changes in Troop F have a less clear causes ,611 38,762 6,496 10,838 9,434 7,911 16,802 22,866 12, ,708 36,404 7,037 8,222 8,759 8,034 16,742 21,406 10, ,976 42,673 5,913 11,401 8,940 9,606 16,842 21,713 12,789 % Change 2010 to % 17% -16% 39% 2% 20% 1% 1% 23%

9 Interstate Fatalities From 2016 to 2017 Fatalities decreased by 3.8% Fatality rate decreased by 0.9% From Fatalities increased by 21.5% Fatality Rate increased by 5.4% FATAL CRASHES FATALITIES 100 MILLION MILES TRAVELED

10 Bicyclist Fatalities increase Bicyclist fatalities up 155.6% Alcohol involved bicyclists death up 266.7% Increase Bicyclist fatalities up 9.5% Alcohol involved bicyclists death up 175% 0 NUMBER KILLED NUMBER KILLED Involving Alcohol


11 Bicycle Crashes by Parish Bicycle Injuries Bicycle Fatalities

12 Time of Day Injuries: 46.1% African American, 49.6% Caucasian Fatalities: 41.2% African American, 48% Caucasian
13 Bicycle Fatalities In 31% of the fatalities, the bicyclist had consumed alcohol and 50% involved either drugs and/or alcohol of the bicyclist. Injury Fatality VIOLATION TYPE Bicycle Motor Vehcile Bicycle Motor Vehcile OTHER VIOLATION 37.5% 24.7% 48.5% 31.2% FAILURE TO YIELD 14.1% 8.9% 17.5% 0.7% DISREGARDED TRAFFIC CONTROL 8.2% 1.7% 7.8% 0.7% CARELESS OPERATION 6.8% 6.2% 5.8% 8.6% NO VIOLATIONS 33.3% 58.6% 20.4% 58.9% Example of Nighttime Bicycle Fatality

14 Motorcyclist Fatalities Change Motorcyclist fatalities up 3.2% Alcohol involved motorcyclists death up 31% KILLED Alcohol Change Motorcyclist fatalities up 32.9% Alcohol involved motorcyclists death up 72.7%
15 Motorcycle Fatalities & Severe Injuries 86.5% of motorcyclist in crashes were wearing a helmet in Only 72.9% of fatal motorcyclists were wearing a helmet properly FATAL SEVERE

16 Pedestrian Fatalities & Injuries 1,600 1, change 1, % increase in pedestrian fatalities 1, % increase in pedestrian injuries 1, Change 9.4% decrease in pedestrian fatalities 13.2% increase in pedestrian injuries INJURIES FATALITIES
17 FATALITIES BY QUARTER FATALITIES BY QUARTER QTR 1 QTR 2 QTR 3 QTR
18 Young Drivers in Fatal Crashes Crash Rates Per 100,000 Licensed Drivers Poly. (18-20)
19 Cost of Crashes Type Average Cost per Person Injuries Total Cost by Injury Category in Billion Dollars Fatal Injuries Severe Injuries Moderate Injuries Complaint Injuries Occupants with No Injury Property Damage $1,566, $1.21 $400,758 1,327 $0.53 $117,571 11,940 $1.40 $25,512 63,175 $1.61 $4, ,169 $1.80 $6, ,362 $2.16 Grand Total Cost 761,746 $8.72 Cost per licensed Driver $2,922 Percent change from past year -3.5% The Economic and Societal Impact Of Motor Vehicle Crashes, 2010, page 12, unit cost are adjusted by CPI.
20 Cost of Crashes Including Loss of Quality of Life Type Average Cost per Person Injuries Total Cost by Injury Category In Billion $ Fatal Injuries $10,243, $7.92 Severe Injuries $1,721,424 1,327 $2.28 Moderate Injuries $499,348 11,940 $5.96 Complaint Injuries $51,542 63,175 $3.26 Occupants with No Injury $4, ,169 $1.80 Property Damage $6, ,362 $2.16 Grand Total Cost 761,746 $23.38 Cost per licensed Driver Including Loss of Quality of Life $7,837 The Economic and Societal Impact Of Motor Vehicle Crashes, 2010, page 22, unit cost are adjusted by CPI.
21 The four Major Contributing Factors Alcohol 78% of the 2017 fatalities Involved one of the four factors. The 5-year average is also 78%. Distraction Aggressive Driving Safety Belt
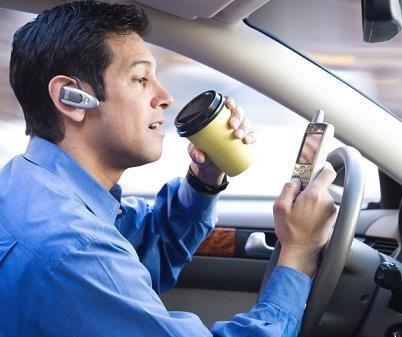
22 Distractions


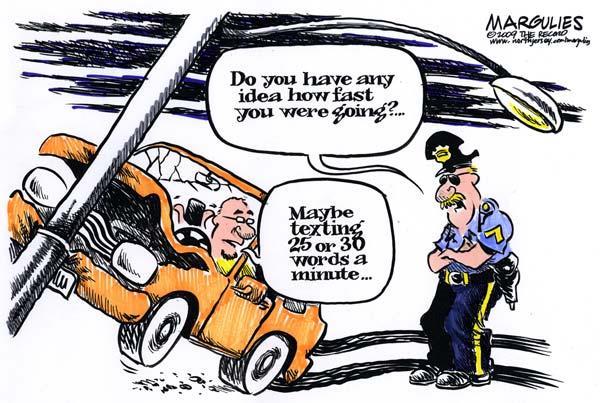
23 Distractions & Inattentive Cell Phone Use 0.8% 0.8% 0.8% Cell Phone use while driving is about 10% according to surveys. But cell phone use in crashes is only about 1%. 32% 30% Distractions & Inattentive % 0.8% 0.7% 0.7% 0.7% 0.7% 0.7% Distractions & Inattentiveness in all crashes are slightly above 30% and about 20% of fatalities are associated with distractions and inattentiveness. But distractions & inattentiveness are difficult to address with enforcement. 28% 26% 24% 22% % 20% Fatalities Driver using Cell Pone in Crash % Number of Crashes Fatalities
24 Aggressive Driving Aggressive Driving is defined as either Exceeding stated speed limit Exceeding safe speed limit Failure to Yield Following too closely Improper passing Disregarded traffic control Careless operation

25 Aggressive Driving Violations 125, , , , , , , , , , , , , , Aggressive driving has been on the rise, But has declined over the past year. 95, , Crashes Fatalities


26 Occupant Protection What progress has Louisiana made over the past 19 years? What are the insights from the 2018 data? How are fatalities linked to belt use by troop area?
27 Seat Belt Usage (Survey) 90.0% 85.0% Seat belt use rates have leveled off since 2016 at about 87%. The increase has averaged about one percent per year over the past 19 years. 82.0% 84.1% 85.9% 87.8% 87.1% 86.9% 80.0% 75.0% 73.8% 75.0% 77.7% 74.8% 75.2% 75.5% 74.5% 75.9% 77.7% 79.3% 70.0% 67.0% 68.2% 68.1% 68.6% Belt Use = 1.07%xYear % 60.0%

28 Belt Use by Gender Belt use among male is still significantly below female belt use. 90.7% 86.9% 83.8% TOTAL MALE FEMALE
29 Belt Use By Ethnicity There is still a 4 percentage points gap between belt use of white and black front seat occupants. White Occupants 87.8% Black Occupants 83.8% Hispanic Occupants 89.9% Other Occupants 95.2% 75% 80% 85% 90% 95% 100%


30 Belt Use by Vehicle Type There is still a 7.5 to 8.7 percentage point gap in belt use between pickup trucks and other vehicle occupants. 100% 95% 90% 88.8% 90.0% 89.9% 85% 80% 81.3% 75% Car Pick-up SUV Van

31 Seat Belt Use by Region 7. Shreveport Region Estimate STD Error FIGURE 1: LOUISIANA SURVEY REGIONS 5. Lake Charles 4. Lafayette 8. Monroe 6. Alexandria 2. Baton Rouge 3. Houma 1. New Orleans Diff New Orleans 2-Baton Rouge 3-Houma 4-Lafayette 5-Lake Charles 6-Alexandria 7-Shreveport 8-Monroe LA total 91.3% 0.4% 1.0% 87.7% 0.7% 2.6%* 89.3% 0.8% 1.2% 88.4% 1.3% 2.0% 89.2% 1.6% -3.0% 81.3% 0.6% -1.5% 83.8% 1.1% -2.0% 85.4% 1.4% -1.6% 86.9% 0.4% -0.2%
32 Seat Belt Usage by Region Region Estimate STD Error Diff New Orleans 91.3% 0.4% 1.0% 2-Baton Rouge 87.7% 0.7% 2.6%* 3-Houma 89.3% 0.8% 1.2% 4-Lafayette 88.4% 1.3% 2.0% 5-Lake Charles 89.2% 1.6% -3.0% 95% 90% 85% 80% 75% 91.3% 87.7% 89.3% 88.4% 89.2% 81.3% 83.8% 85.4% 86.9% Alexandria 81.3% 0.6% -1.5% 7-Shreveport 83.8% 1.1% -2.0% 70% Monroe 85.4% 1.4% -1.6% LA total 86.9% 0.4% -0.2% 65% 60% 1 (NO) 2 (EBR) 3 (Houma) 4 (Lafayette) 5 ( Lake Charles) 6 ( Alexandria) 7 (Shreveport) 8 (Monroe) Louisiana
33 Is there a sample bias for belt use by region?
34 Distribution of Vehicle Type by Region Region % Car % Pickup % SUV % Van 1-New Orleans 39.7% 21.1% 34.3% 5.0% 2-Baton Rouge 43.6% 29.4% 23.5% 3.5% 3-Houma 38.6% 30.8% 26.3% 4.4% 4-Lafayette 42.7% 30.7% 22.4% 4.2% 5-Lake Charles 31.4% 32.6% 30.8% 5.2% 6-Alexandria 38.1% 32.3% 24.7% 4.9% 7-Shreveport 39.8% 28.1% 29.0% 3.2% 8-Monroe 34.6% 32.4% 28.9% 4.1% LA Total 40.0% 28.4% 27.4% 4.2%
35 Gender Distribution by Region Region % Males % Females %Unknown 1-New Orleans 52.8% 47.2% 0.0% 2-Baton Rouge 54.9% 44.6% 0.5% 3-Houma 55.2% 44.8% 0.0% 4-Lafayette 56.2% 43.6% 0.2% 5-Lake Charles 53.4% 46.5% 0.1% 6-Alexandria 53.3% 46.7% 0.0% 7-Shreveport 50.2% 48.1% 1.7% 8-Monroe 50.9% 49.0% 0.0% LA Total 53.5% 46.1% 0.4%
36 Ethnicity by Region Region % White Occupants % Black Occupants % Hispanic Occupants % Other Occupants % Unknown 1-New Orleans 2-Baton Rouge 3-Houma 4-Lafayette 67.6% 26.8% 3.8% 1.8% 65.2% 28.9% 2.9% 2.2% 69.7% 22.6% 6.3% 1.3% 68.7% 25.3% 3.8% 1.8% 0.0% 0.9% 0.0% 0.4% 5-Lake Charles 86.3% 10.6% 1.1% 2.0% 0.1% 6-Alexandria 81.9% 15.0% 2.3% 0.8% 0.0% 7-Shreveport 8-Monroe LA Total 68.6% 27.9% 1.7% 0.5% 70.6% 26.9% 1.6% 0.8% 69.7% 25.2% 3.1% 1.5% 1.4% 0.1% 0.5%
37 Seat Belt Use by Troop Diff Troop Estimate STD Error 2017 Troop A-Baton Rouge 87.9% 0.6% 2.4%* A-Baton Rouge B-New Orleans 89.5% 0.5% 1.1% B-New Orleans C-Houma 90.4% 1.0% 0.0% C-Houma D-Calcasieu 89.2% 1.6% -3.0% D-Calcasieu E-Natchitoches 80.6% 0.8% -3.1%* E-Natchitoches F-Monroe 85.1% 1.2% -2.2% F-Monroe G-Shreveport 84.6% 1.3% -0.6% G-Shreveport I-Lafayette 88.4% 1.3% 2.0% I-Lafayette L-Hammond 90.8% 1.1% 0.9% L-Hammond
38 Belt Use by Parish 1. Union 2. Assumption 3. Washington 4. Rapides 5. De Soto Union and Washington had large increases in belt use in Assumption Rapides and DeSoto stayed low in Parish OCCUPANTS- OCCUPANTS- OCCUPANTS- OCCUPANTS- OCCUPANTS- 5-Year Average Lafourche 94.4% 94.9% 94.3% 94.8% 87.7% 93.2% Terrebonne 94.0% 93.6% 95.7% 90.0% 92.8% 93.2% Beauregard 93.2% 96.2% 91.0% 90.9% 91.0% 92.5% Jefferson Davis 89.7% 92.5% 93.5% 92.5% 89.2% 91.5% St. Tammany 94.4% 92.6% 86.4% 87.9% 88.7% 90.0% St. Charles 93.5% 92.4% 93.0% 83.1% 87.5% 89.9% Calcasieu 92.6% 93.8% 93.4% 78.9% 88.3% 89.4% Vermilion 93.8% 88.2% 89.4% 91.5% 83.2% 89.2% Ascension 90.0% 87.4% 88.2% 91.3% 87.4% 88.9% St. Landry 91.1% 86.8% 89.2% 88.9% 87.5% 88.7% Pointe Coupee 92.0% 92.2% 92.4% 83.4% 83.0% 88.6% St. Martin 89.5% 86.5% 92.1% 86.7% 85.4% 88.0% Bossier 85.2% 86.9% 87.0% 89.6% 91.2% 88.0% Evangeline 89.0% 86.7% 88.0% 93.6% 82.6% 88.0% Caddo 84.7% 87.0% 88.9% 89.5% 87.6% 87.5% Vernon 85.4% 87.3% 86.6% 84.5% 93.2% 87.4% East Baton Rouge 89.3% 88.7% 89.2% 83.3% 85.2% 87.2% Lincoln 87.5% 89.4% 88.7% 87.1% 81.8% 86.9% Jefferson 89.5% 90.0% 88.5% 83.6% 80.7% 86.5% Acadia 87.8% 93.2% 87.5% 82.0% 81.8% 86.4% Lafayette 91.5% 87.6% 89.0% 78.7% 84.1% 86.2% Livingston 89.3% 89.1% 85.8% 82.1% 82.6% 85.8% West Baton Rouge 91.0% 86.3% 82.9% 79.9% 85.7% 85.1% St. Mary 90.0% 91.5% 82.0% 82.6% 79.6% 85.1% St. James 91.5% 84.6% 80.1% 82.3% 86.3% 85.0% Tangipahoa 87.8% 87.1% 82.3% 81.9% 82.1% 84.3% Ouachita 85.1% 87.9% 87.1% 83.9% 76.9% 84.2% Natchitoches 83.8% 87.4% 85.5% 81.5% 81.7% 84.0% Orleans 91.8% 89.0% 90.1% 75.5% 72.2% 83.7% De Soto 75.9% 81.1% 92.1% 86.3% 82.8% 83.7% Assumption 75.8% 77.4% 83.9% 94.5% 86.3% 83.6% Iberville 77.4% 83.1% 87.1% 80.0% 87.1% 82.9% Washington 95.5% 79.3% 76.9% 77.3% 82.6% 82.3% Sabine 73.7% 83.6% 85.9% 86.2% 79.5% 81.8% Iberia 88.8% 88.3% 84.0% 68.8% 79.0% 81.8% St. John 87.1% 86.4% 82.2% 76.0% 69.2% 80.2% Rapides 78.9% 80.9% 82.0% 87.5% 68.7% 79.6% Union 90.8% 75.8% 76.2% 86.0% 59.2% 77.6%
39 Vehicle Type Car 88.7% 0.6% 89.5% 1.1% 88.8% 0.6% 0.2% Pick-up 81.3% 0.9% 81.3% 2.0% 81.3% 0.8% -0.4% SUV 89.9% 0.7% 90.5% 1.2% 90.0% 0.7% -0.1% Van 90.5% 1.7% 88.1% 3.9% 89.9% 1.6% -2.1% Driver Passenger All Occupants Estimate STDError Estimate STDError Estimate STDError Diff from Past Year Sex Male 83.9% 0.6% 83.1% 1.5% 83.8% 0.6% -0.3% Female 90.7% 0.6% 90.8% 0.8% 90.7% 0.5% 0.0% No statistically significant change. Race White 87.4% 0.5% 89.5% 0.9% 87.8% 0.5% -0.4% Black 84.3% 0.8% 81.3% 1.9% 83.8% 0.8% 0.0% Hispanic 91.0% 1.0% 86.4% 1.7% 89.9% 1.8% 3.7% Other 95.1% 0.9% 95.4% 0.5% 95.2% 1.1% 6.0%
40 Road Type and Vehicle Type Diff Road Type Estimate STD Error Interstate 90.1% 0.4% 1.1% US & State 87.1% 0.2% -0.3% Local Road 86.0% 0.9% -0.2% Pickup truck belt use is the lowest in the three northern regions. Region CAR STD Error PICKUP STD Error SUV STD Error VAN STD Error 1-New Orleans 92.1% 0.5% 86.9% 1.2% 93.2% 0.6% 91.7% 2.8% 2-Baton Rouge 88.1% 1.0% 83.5% 1.5% 91.2% 1.2% 93.7% 1.2% 3-Houma 89.8% 1.2% 85.8% 1.6% 93.6% 1.3% 85.9% 4.9% 4-Lafayette 87.4% 2.4% 85.9% 1.8% 91.7% 1.9% 94.2% 3.2% 5-Lake Charles 92.8% 1.9% 87.2% 2.6% 88.3% 4.0% 90.7% 5.6% 6-Alexandria 85.2% 0.9% 75.2% 1.3% 83.2% 1.3% 83.9% 2.6% 7-Shreveport 87.5% 1.0% 75.5% 2.2% 85.3% 1.9% 96.3% 1.2% 8-Monroe 89.0% 2.2% 76.2% 2.9% 92.8% 1.6% 79.3% 7.0% LA total 88.8% 0.6% 81.3% 0.8% 90.0% 0.7% 89.9% 1.6%
41 Rear Seat Belt Use Auto Pickup SUV Van Total Rear Seat % 12.50% 31.30% 29.40% 27.20% Rear Seat % 47.80% 77.20% 90.70% 58.40% Rear Seat % 40.30% 71.40% 93.60% 53.80% Rear Seat % 46.97% 67.09% 62.30% 54.84% Rear Seat 2014 Rear Seat 2015 Rear Seat 2016 Rear Seat 2017 Rear Seat % 42.39% 69.31% 77.36% 54.92% 67.85% 55.12% 80.53% 79.22% 68.86% 70.92% 45.83% 80.52% 84.09% 68.83% 65.75% 50.00% 71.22% 77.78% 65.61% 61.97% 57.58% 73.91% 89.47% 65.53%
42 % Fatalities w/o Seat Belt Unbelted Fatalities: Percentage versus number of fatalities 75.0% 70.0% E 65.0% 60.0% 55.0% 50.0% F B C G I A 45.0% D L 40.0% 35.0% 30.0% Number of Fatalities without Seat Belt
43 Child Occupant Protection Age Group Ages Weight Facing Restraint Device Infant < 1 < 20 pounds rear-facing infant seat 1-3 1, 2, pounds forward-facing 4-5 4, pounds (not specified) , 7, 8, 9, 10, 11, or more pounds (not specified) child safety seat (with internal harness) belt positioning booster seat (backless or high-backed) child booster seat or safety belt
44 2018 Child Occupant Protection Survey Age < 1 (n=107) Age 1-3 (n=341) Age 4-5 (n=330) Age 6-12 (n=978) Rear-Facing Carrier 94.4% (n=101) 7.0% (n=24) 0% (n=0) 0% (n=0) Forward-Facing Carrier 4.7% (n=5) 80.1% (n=273) 2.4% (n=8) 0.1% (n=1) Booster Seat 0% (n=0) 0.3% (n=1) 56.3% (n=186) 0.4% (n=4) Vehicle Safety Belt 0% (n=0) 0.6% (n=2) 17.3% (n=57) 87.9% (n=860) No Restraint Used 0.9% (n=1) 12.0% (n=41) 23.9% (n=79) 11.6% (n=113)
45 2018 Child Safety by Region 52.2% (n=13) But 43.8% in Regions Age < 1 Age 1-3 Age 4-5 Age 6-12 Age <6 Age <13 Error Age <6 Error Age <13 1. New Orleans 100.0% 95.3% 89.2% 90.6% 93.8% 91.8% 2.1% 2.5% 2. Baton Rouge 100.0% 93.4% 84.9% 85.5% 90.7% 87.4% 3.0% 2.3% 3. Houma/Thibodaux 100.0% 83.6% 80.8% 87.8% 85.4% 86.9% 3.1% 2.5% 4. Lafayette 100.0% 97.0% 52.2% 93.4% 81.1% 88.9% 3.1% 1.7% 5. Lake Charles 100.0% 100.0% 78.8% 89.2% 92.3% 90.3% 7.2% 3.1% 6. Alexandria 100.0% 95.5% 76.2% 91.9% 89.0% 90.8% 3.6% 2.2% 7. Shreveport 98.1% 77.0% 71.1% 80.4% 78.7% 79.8% 3.9% 3.1% 8. Monroe 100.0% 79.5% 74.7% 83.2% 80.7% 82.3% 3.0% 3.3% Statewide 99.8% 91.3% 77.7% 88.1% 87.6% 87.9% 1.2% 1.0% Error 0.2% 1.7% 2.4% 1.4% 1.2% 1.0%
46 2018 CHILD RESTRAINT USAGE ESTIMATES BY TROOP Troop Region Age < 1 Age 1-3 Age 4-5 Age 6-12 Age < 6 Age < 13 Standard Error Age <6 Standard Error Age <13 A (Baton Rouge) 100.0% 96.6% 81.5% 85.5% 90.8% 87.4% 2.1% 2.5% B (New Orleans) 100.0% 92.1% 88.3% 88.0% 92.2% 89.5% 3.0% 2.3% C (Houma) 100.0% 90.3% 84.9% 93.9% 90.0% 92.4% 3.1% 2.5% D (Lake Charles) 100.0% 100.0% 78.8% 89.2% 92.3% 90.3% 3.1% 1.7% E (Alexandria) 100.0% 95.5% 76.2% 91.9% 89.0% 90.8% 7.2% 3.1% F (Monroe) 100.0% 79.5% 74.7% 83.2% 80.7% 82.3% 3.6% 2.2% G (Shreveport) 98.1% 77.0% 71.1% 80.4% 78.7% 79.8% 3.9% 3.1% I (Lafayette) 100.0% 97.0% 52.2% 93.4% 81.1% 88.9% 3.0% 3.3% L (Hammond) 100.0% 91.3% 93.4% 93.1% 93.4% 93.2% 3.0% 3.3% Standard Error 0.2% 1.7% 2.4% 1.4% 1.2% 1.0%
47 2018 Child Restraint Usage v. 5-Year Average 2018 Child Restraint Usage (Age < 13) per Region 7. Shreveport (79.8%) 5. Lake Charles (90.3%) 4. Lafayette (88.9%) 8. Monroe (82.3%) 6. Alexandria (90.8%) 2. Baton Rouge (87.4%) 3. Houma (86.9%) 1. New Orleans (91.8%) Five-year Average Child Restraint Usage (Age < 13) per Region 7. Shreveport (68.9%) 5. Lake Charles (81.6%) 4. Lafayette (73.5%) 8. Monroe (70.1%) 6. Alexandria (79.6%) 2. Baton Rouge (87.0%) 3. Houma (72.3%) 1. New Orleans (85.9%)
48 Child Occupant Protection by Seating Position 100.0% 90.0% 80.0% 70.0% 99.1% 70.0% 89.9% 88.2% 94.1% 79.9% 80.5% 60.0% 50.0% 40.0% 30.0% 20.0% 10.0% 0.0% Age <1 Age 1-3 Age 4-5 Age 6-12 Front Seat Usage Rear Seat Usage
49 Child Occupant Protection by Year and Age Group 100.0% 90.0% 80.0% 99.8% 91.3% 77.7% 88.1% 87.6% 87.9% 70.0% 60.0% 50.0% 40.0% 30.0% 20.0% 10.0% 0.0% Age<1 Age 1-3 Age 4-5 Age 6-12 Age <6 Age < Average
50 CHILD RESTRAINT USAGE ESTIMATE BY AGE GROUP AND DRIVER BELT USE 100% 90% 80% 70% 60% 50% 40% 30% 20% 10% 0% 1.0% 4.7% 11.5% 6.1% 72.4% 75.0% 75.4% 99.0% 95.3% 88.5% 93.9% 100.0% 27.6% 25.0% 24.6% Age<1 Age 1-3 Age 4-5 Age 6-12 Age<1 Age 1-3 Age 4-5 Age 6-12 Driver Belted Restraint Unrestraint Driver Not Belted

51 OMV Recorded Seat Belt Violations have been trending down since 2013.

52 Drinking and Driving
53 YEAR BAC 0 PENDING AND ALCOHOL NOT TESTED AND ALCOHOL USE USE UNKOWN HIGHWAY SAFETY RESEARCH UNKOWN GROUP UNKNOWN KNOWN BAC > 0 TEST REFUSED DRIVERS % DRIVERS % DRIVERS % DRIVERS % DRIVERS % DRIVERS DRIVERS ALL DRIVERS % % % % % % % % % % 0 1, % % % % % % % % % % 0 1, % 3 0.3% % 9 0.8% % 1 1, % 1 0.1% % 0 0.0% % 1 1,117 DIFFERENCE - ALL DRIVERS 1 YEAR 2.7% 2.1% -66.7% -0.2% -5.2% -1.1% % -0.8% -1.3% 0.0% 0.0% -1.2% 5 YEAR 20.7% 3.6% -98.8% -8.5% 74.1% 9.1% % -3.4% 8.2% -0.8% 0.0% 12.6% AVERAGE 11.5% 2.1% -97.2% -3.5% 29.6% 4.6% % -1.7% -0.8% -1.6% 150.0% 7.1% FATALITIES % % % % % % % % % % % % % % % % % % 6 1.1% % % 1 0.2% % 3.6% % % 1 0.2% % 0.0% % DIFFERENCE - FATAL DRIVERS 1 YEAR 12.1% 3.1% 0.0% 0.0% -6.8% -1.8% % -0.6% 3.6% -0.7% 5.7% 5 YEAR 39.9% 10.0% -98.3% -12.5% 76.9% 4.8% % -4.4% 21.0% 2.0% 13.5% AVERAGE 21.9% 7.0% -96.0% -5.0% 8.8% 0.4% % -2.2% 5.1% -0.2% 6.0% TOTAL
54 Fatalities in Crashes with BAC>=


55 DWI Fatalities (>0.08) & Alcohol-Related DWI Alcohol-Related 45.00% 40.00% 35.00% 30.00% 25.00% 38.54% 42.80% 33.44% 36.72% 42.52% 39.76% 37.50% 38.68% 34.79% 50.00% 45.00% 40.00% 35.00% 30.00% 43.15% 31.31% 45.74% 45.95% 41.90% 43.76% 44.33% 39.06% 41.72% 42.15% 40.52% 42.98% 38.56% 20.00% 25.00% 15.00% 20.00% 15.00% 10.00% 10.00% 5.00% 5.00% 0.00% %
56 Fatalities Underage DUI 50 Percent of Alcohol involvement of Year-Old Drivers in Fatal Crashes 33% 35% % 45 26% % 21 27% 20 21% 21% % 15 14% 9 19% 12 14% 10 10% 9 24% 18 30% 25% 20% 15% 10% 5% % DUI % Alcohol
57 Youth Drivers and Alcohol Involvement 40 Fatal Crashes per 100,000 Licensed Drivers Poly. (18-20)

58 % DWI Fatalities DWI Fatalities and % DWI Fatalities Involving of BAC>=0.08 by Troop Area 50% 45% Size of bubble represents total number of fatalities. B 40% C I 35% A 30% F G L 25% E D 20% Number of Fatalities BAC>08

59 % Alcohol-Related Fatalities DWI Fatalities & DWI Arrests by Troop Area 50% 45% Size of bubble represents total number of fatalities. 40% B C I 35% A 30% F G 25% L D E 20% Number DWI/Lic Dr (1,000)
60 % DWI Fatalities Fatalities: DWI and Seat Belt Use 50% Size of bubble represents total number of fatalities. 45% 40% C B I 35% A 30% L F G 25% D E 20% 35.0% 40.0% 45.0% 50.0% 55.0% 60.0% 65.0% 70.0% % Fatalities w/o Seat Belt
61 DWI Arrests ,808 1,740 8,576 8,311 7,949 1,908 1,805 1,620 8,854 7,444 6,830 6,115 2,019 1,989 1,770 1,609 5,426 5,569 1,120 1,004 15,238 16,185 15,659 14,931 12,450 11,753 4, , , Rule of Thumb: For every 1,000 hours Saturation Patrol 4 fewer fatalities. For every SFST conducted 3 fewer fatalities ,180 10,886 10,925 11,049 9,678 8,378 10,014 Source: Target of Opportunity Report ,085 4,500 4,557 4,173 5,889 6,129 5,682 5,316 4,567 4,541 3,969 4,064 4, No DWI ADULT-DWI Underage-Dui Refused
62 LA Driving Records: Percent of Arrests by Type 0.0% 2.8% 0.8% 3.8% 24.8% 59.0% 4.4% 2.6% 0.4% 1.3% 911aCall Checkpoint Citizen Report Crash Dangerous Condition Improper Operation Investigate Circumstances Not Listed Traffic Stop (blank)
63 Distribution of BAC % Refused 10.5% BAC=0 77% Male Of those BAC>0 8.3% had BAC< % had BAC> % had BAC>0.2
64 Drugged Driving Number of Drug Cases by Category , , , ,124 Description Crash Fatality Hit & Year Investigation D.W.I Crash Run , , , , Cannabinoid Narcotics Stimulants Cannabinoids have increased by 60% from 2016 to 2017.
65 Drugs in Fatal Crashes 120 Drugs in Fatal Crashes Cannabinoids have increased by 32% from 2016 to Cannabinoid Narcotics Stimulants
66 Driving Record Perspective
67 Number of Crashes 10,000,000 2,021,848 1,058,882 1,000, , , , ,000 72,346 36,887 19,237 10,484 10,000 5,829 3,280 1,9431,202 One driver had 59 crashes 3,280 drivers had 10 crashes Also, 8,671 drivers had at least 10 crashes 1,

68 Aggressive Driving Aggressive Driving is defined as either Exceeding stated speed limit Exceeding safe speed limit Failure to Yield Following too closely Improper passing Disregarded traffic control Careless operation
69 Aggressive Driving Violations 1,000,000629, ,000 10, ,941 95,975 44,940 22,488 11,843 6,608 3,763 2,162 1, One driver had 41 aggressive driver violations 1,354 drivers had 10 aggressive driver violations Also, 3,768 driver had at least 10 aggressive driver violations 1,
70 Number of Seat Belt Violations Example: 4,050 drivers had 5 seat belt tickets 72 drivers had 10 seat belt tickets 10,000,000 3,737,465 1,000, ,000 10,000 1, ,883 90,373 28,755 10,254 4,050 One driver had 20 seat belt violations 72 drivers had 10 seat belt tickets 4,050 drivers had 5 seat belt tickets 7,128 drivers had at least 5 seat belt tickets 502,393 drivers had at least one seat belt violation 1,
71 DWI 1 st and COBRA Arrests 95.44% had no DWI arrest 29% of arrests lead to conviction of DWI 1 st to DWI3+ (Excluding 984) Mr. M.P Age 33 4 DWI Arrests above the legal limit 2 while under age 4 times refused In 2 crashes In crash once no test given No Convicted DWI DWI Arrest in COBRA (BAC>0.08 or BAC>0.02 & underage) Number DWI 1st ,046,397 91,716 12,517 2, ,009 24,589 10,355 2, ,805 2,057 1, Mr. M.G. Age 28 6 DWI Arrests above the legal limit 6 while under age Twice refused In 8 crashes In crash once tested at 0.127, refused once, no test given six times Convicted DWI 2nd Note: COBRA includes only breathalyzer tests from Arrests using blood as evidence are not included, but convictions are.
72 Two Recent Examples of Drivers with no DWI conviction but multiple Arrests in COBRA Last Name Parish DWI_Year Test Refused L Natchitoches 2005 NULL Yes L Natchitoches No L Natchitoches 2006 NULL Yes L Natchitoches 2008 NULL Yes L Natchitoches 2015 NULL Yes L Natchitoches No R Cameron No R St. Landry No R St. Landry 2007 NULL Yes R Bossier No R Evangeline No R St. Landry No R St. Landry No
73 Final Thoughts 78% of the fatal crashes involve one of the four issues: No seat belt use Alcohol Aggressive driving Distraction An information system that tracks repeat offenders is critical to assessing the magnitude of the problem. LADRIVING Will increase tracking of DWI offenders, but can information be used in traffic stops? Diversion Programs Good for first-time offenders, but do we loose information? Checkpoints Good to publicize enforcement, but may be responsible for reduced arrest rates
JANUARY Danger Zones: A summary of pedestrian fatality trends in Louisiana
 JANUARY 2014 Danger Zones: A summary of pedestrian fatality trends in Louisiana TEN YEARS OF DANGER: Pedestrian Deaths in Louisiana Although vehicular deaths have decreased in Louisiana, pedestrian deaths
Alberta. Traffic Collision Statistics. Office of Traffic Safety Transportation Services Division May 2017
 Traffic Collision Statistics Office of Traffic Safety Transportation Services Division May 217 This page was intentionally left blank. 2 Table of Contents Traffic Collisions... 4 Traffic Collision Rates...
Louisiana Immunization Network for Kids Statewide (LINKS) LOUISIANA
 LOUISIANA") Louisiana Immunization Network for Kids Statewide (LINKS) Results Of Public Clinic Assessments, Percent Of Children 19-35 Months Old Who Were Up-To-Date (4-DTP, 3-Polio & 1-MMR), for 2000-2008 LOUISIANA
Louisiana Immunization Network for Kids Statewide (LINKS) Results Of Public Clinic Assessments, Percent Of Children 19-35 Months Old Who Were Up-To-Date (4-DTP, 3-Polio & 1-MMR), for 2000-2008 LOUISIANA
MTCF. Michigan Traffic Crash Facts FACT SHEETS
 FACT SHEETS This page left intentionally blank GENERAL FACTS The driver, the roadway, and the motor vehicle contribute in some measure to every crash. A preponderance of evidence, however, points to driver
CDRT. Child Death Review Team Dallas County. Brief Report Traffic-related Child Deaths OVERVIEW
 Dallas County CDRT Child Death Review Team 2013 Brief Report Traffic-related Child Deaths 2006-2011 OVERVIEW In Dallas County, traffic-related injury death rates among children are typically less than
MTCF. Michigan Traffic Crash Facts FACT SHEETS
 FACT SHEETS This page left intentionally blank GENERAL FACTS The driver, the roadway, and the motor vehicle contribute in some measure to every crash. A preponderance of evidence, however, points to driver
Figure 1. Indiana fatal collisions by young driver involvement,
 INDIANA TRAFFIC SAFETY FACTS YOUNG DRIVERS 2016 MAY 2017 ISSUE 17-C06 IN 2016: In 2016, 13.4 percent of all drivers involved in Indiana collisions were young drivers. Young drivers were involved in 105
2014 QUICK FACTS ILLINOIS CRASH INFORMATION. Illinois Emergency Medical Services for Children February 2016 Edition
 2014 QUICK FACTS ILLINOIS CRASH INFORMATION February 2016 Edition Illinois Emergency Medical Services for Children www.luhs.org/emsc Illinois Emergency Medical Services for Children TABLE OF CONTENTS
2012 QUICK FACTS ILLINOIS CRASH INFORMATION. Illinois Emergency Medical Services for Children September 2014 Edition
 2012 QUICK FACTS ILLINOIS CRASH INFORMATION September 2014 Edition Illinois Emergency Medical Services for Children www.luhs.org/emsc Illinois Emergency Medical Services for Children TABLE OF CONTENTS
BIA INDIAN HIGHWAY SAFETY PROGRAM FY2016 LAW ENFORCEMENT OVERTIME GRANT
 SECTION A: General Information. This section must be completed for all applicants. Name of Tribe: Click here to enter text. Address : Click here to enter text. City: Click here to enter text. State: Click
Occ c u c pa p n a t pro r t O ec e t c i t O i n
 Occupant Protection Occupant Protection Introduction Buckling up or being buckled in is the most effective protection during a car crash. The simple truth is that the great majority of people ejected from
BIA INDIAN HIGHWAY SAFETY PROGRAM FY2016 LAW ENFORCEMENT GRANT. SECTION A: General Information. This section must be completed for all applicants.
 SECTION A: General Information. This section must be completed for all applicants. Name of Tribe: Click here to enter text. Address : Click here to enter text. City: Click here to enter text. State: Click
Draft Report: Traffic Crashes in the Denver Region
 Click to edit Master title style Click to edit Master title style Draft Report: Traffic Crashes in the Denver Region Presented by: Steve Cook Board Nov. 16, 2016 Click Report Click to to edit on edit Master
August 1, Dear Agents and Ag Teachers in Sugarcane Producing Parishes:
 August 1, 2017 TO: 4-H Agents and Vocational Agricultural Teachers (Sugarcane Producing Parishes) RE: 2017 Sugarcane Festival 4-H Livestock Show & Sale, September 21-23 Dear Agents and Ag Teachers in Sugarcane
Mission: The mission of FARS is to make vehicle crash information accessible and useful so that traffic safety can be improved
 Mission: The mission of FARS is to make vehicle crash information accessible and useful so that traffic safety can be improved NHTSA created FARS in 1975 National Center for Statistics and Analysis (NCSA)
Maine Highway Safety Facts 2016
 Maine Highway Safety Facts 216 216 MAINE HIGHWAY SAFETY FACTS The Bureau of Highway Safety and the Maine Department of Transportation are pleased to present the 216 edition of Maine Highway Safety Facts.
Traffic Safety Facts 2007 Data
 Traffic Safety Facts 2007 Data Bicyclists and Other Cyclists DOT HS 810 986 Bicyclists and other cyclists include riders of two-wheel nonmotorized vehicles, tricycles, and unicycles powered solely by pedals.
This Workbook has been developed to help aid in organizing notes and references while working on the Traffic Safety Merit Badge Requirements.
 This Workbook has been developed to help aid in organizing notes and references while working on the Traffic Safety Merit Badge Requirements. Visit www.scoutmasterbucky.com for more information SCOUT S
COLLISION STATISTICS May Engineering Services Box 5008, th Avenue Red Deer, AB T4N 3T4
 COLLISION STATISTICS 2016 2016 Red Deer Annual Motor Vehicle Collision Report May 2017 Engineering Services Box 5008, 4914 48th Avenue Red Deer, AB T4N 3T4 engineering@reddeer.ca RCMP GRC Red Deer City
Alberta. Traffic Collision Statistics
 Alberta Traffic Collision Statistics 2002 Alberta Traffic Collision Statistics 2002 For further information contact: Alberta Transportation Driver Safety, Research and Traffic Safety Initiative 1st Floor,
2012 TOWN OF CASTLE ROCK MOTOR VEHICLE ACCIDENT FACTS PREPARED BY THE PUBLIC WORKS DEPARTMENT
 ATTACHMENT A 2012 TOWN OF CASTLE ROCK MOTOR VEHICLE ACCIDENT FACTS PREPARED BY THE PUBLIC WORKS DEPARTMENT ACKNOWLEDGEMENTS This report was assembled from data provided by the Castle Rock Police Department
Traffic Safety Facts. State Traffic Data Data. Overview
 Traffic Safety Facts 2015 Data June 2017 DOT HS 812 412 State Traffic Data Key Findings Traffic fatalities increased by 7 percent from 2014 to 2015 (32,744 to 35,092) for the United States. The fatality
BIA INDIAN HIGHWAY SAFETY PROGRAM FY2016 TRAFFIC RECORDS GRANT. SECTION A: General Information. This section must be completed for all applicants.
 SECTION A: General Information. This section must be completed for all applicants. Name of Tribe: Click here to enter text. Address : Click here to enter text. City: Click here to enter text. State: Click
Alberta. Traffic Collision Statistics
 Alberta Traffic Collision Statistics 2015 Alberta Traffic Collision Statistics 2015 For further information contact: Alberta Transportation Office of Traffic Safety Main Floor, Twin Atria Building 4999
For further information contact: Alberta Infrastructure and Transportation Office of Traffic Safety Main Floor, Twin Atria Building Avenue
 Alberta Traffic Collision Statistics 2006 Alberta Traffic Collision Statistics 2006 For further information contact: Alberta Infrastructure and Transportation Office of Traffic Safety Main Floor, Twin
FLORIDA TRANSPORTATION COMMISSION HIGHWAY SAFETY REPORT CALENDAR YEAR 2008
 FLORIDA TRANSPORTATION COMMISSION HIGHWAY SAFETY REPORT CALENDAR YEAR 2008 January 15, 2010 HIGHWAY SAFETY REPORT FOR CALENDAR YEAR 2008 January 15, 2010 2 TABLE OF CONTENTS INTRODUCTION 5 STRATEGIC HIGHWAY
the Ministry of Transport is attributed as the source of the material
 Cyclists 2015 Disclaimer All reasonable endeavours are made to ensure the accuracy of the information in this report. However, the information is provided without warranties of any kind including accuracy,
For further information contact: Alberta Transportation Office of Traffic Safety Main Floor, Twin Atria Building Avenue Edmonton, Alberta T6B
 Alberta Traffic Collision Statistics 2009 Alberta Traffic Collision Statistics 2009 For further information contact: Alberta Transportation Office of Traffic Safety Main Floor, Twin Atria Building 4999
Kolkata City Fatal Accident Study (April 2016 March 2017)
") Kolkata City Fatal Accident Study (April 2016 March 2017) Submitted to Deputy Commissioner of Police (Traffic), Kolkata City 18 April, 2017 18 April 2017 Kolkata city fatal accident study 1 Overview JPRI
Kolkata City Fatal Accident Study (April 2016 March 2017) Submitted to Deputy Commissioner of Police (Traffic), Kolkata City 18 April, 2017 18 April 2017 Kolkata city fatal accident study 1 Overview JPRI
2015 Victorian Road Trauma. Analysis of Fatalities and Serious Injuries. Updated 5 May Page 1 of 28. Commercial in Confidence
 2015 Victorian Road Trauma Analysis of Fatalities and Serious Injuries Updated 5 May 2016 Page 1 of 28 Commercial in Confidence VICROADS_n3445896_2015_Victorian_Trauma_Report_- _updated_may_2016.docx 2015
Florida Class E Knowledge Exam Road Rules Practice Questions
 1. If you are being followed too closely while driving, you should: A. Drive closer to the car in front of you. B. Speed up to increase the distance between you and the following vehicle. C. Slow down
2003 road trauma for. Wairoa District. Road casualties Estimated social cost of crashes* Major road safety issues WAIROA DISTRICT JULY 2004
 WAIROA DISTRICT JULY 24 T he Land Transport Safety Authority (LTSA) has prepared this road safety issues report. It is based on reported crash data and trends for the 1999 23 period. The intent of the
Motor Vehicle Related Fatalities 10-year Statistics for British Columbia Research and Data Unit Policy and Strategic Initiatives Branch
 Motor Vehicle Related Fatalities 1-year Statistics for British Columbia 27-216 Research and Data Unit Website: www.gov.bc.ca/roadsafetybc Twitter: http://twitter.com/ Contents Contents... 2 Introduction
officer Traffic Safety National Law Enforcement Officers Memorial Fund September 2012
 officer Traffic Safety National Law Enforcement Officers Memorial Fund September 2012 Did you know? On average, a law enforcement officer is killed somewhere in the U.S. every 54 hours There are some 60,000
Police Recorded Injury Road Traffic Collisions and Casualties Northern Ireland. Detailed Trends Report 2015
 Police Service of Northern Ireland Police Recorded Injury Road Traffic Collisions and Casualties Northern Ireland Detailed Trends Report 2015 Annual Bulletin Published 30 th June 2016 Contact: Traffic
THE EPIDEMIOLOGY OF TRAUMATIC BRAIN INJURIES IN NEW YORK STATE
 THE EPIDEMIOLOGY OF TRAUMATIC BRAIN INJURIES IN NEW YORK STATE Michael Bauer, Sarah Sperry, Kainan Sun, Susan Hardman New York State Department of Health, Bureau of Injury Prevention What is Traumatic
Alabama Observational Survey of Occupant and Child Restraint Use 2010
 Alabama Observational Survey of Occupant and Child Restraint Use 21 Contact Information: Alabama Department of Public Health Bureau of Health Promotion & Chronic Disease Injury Prevention Branch RSA Tower,
Retrospective Study of Juvenile Motor Vehicle Deaths
 Retrospective Study of Juvenile Motor Vehicle Deaths Karin Wells, BA Michelle A. Jorden, MD Santa Clara County Medical Examiner-Coroner s Office Why this study? Dr. Jorden is Chair of the Child Death Review
Lane Area Transportation Safety and Security Plan Vulnerable Users Focus Group
 Lane Area Transportation Safety and Security Plan Vulnerable Users Focus Group Agenda 1. Planning Process Review 2. What are Emphasis Areas? 3. Your Role Today 4. Data Review 5. Small group discussion
Road Safety Annual Report 2016 OECD/ITF Chapter 26. Morocco
 Road Safety Annual Report 2016 OECD/ITF 2016 Chapter 26 Morocco This chapter presents 2014 road safety data for Morocco along with provisional data from 2015. It looks at trends in traffic and road safety
Annual Crash Report. Valdosta-Lowndes County Metropolitan Planning Organization
 212-216 Annual Crash Report Valdosta-Lowndes County Metropolitan Planning Organization June 217 1 Contents Introduction... 3 Highway Safety Plan Goals... 4 Other Charts and Data... 16 High Crash Locations...
Keep Customers and Ourselves Safe. Mark Shelton, District Engineer. Tracker. Measures of Departmental Performance
 Keep Customers and Ourselves Safe Mark Shelton, District Engineer Tracker Measures of Departmental Performance Safety is a daily commitment for all MoDOT employees. From design and construction to operations
NEW JERSEY LAW ENFORCEMENT LIAISON NEWSLETTER
 NEW JERSEY LAW ENFORCEMENT LIAISON NEWSLETTER SEPTEMBER 2017/12 WWW.NJSACOP.ORG DRIVE SOBER OR GET PULLED OVER NJ DIVISION OF HIGHWAY TRAFFIC SAFETY The mission of the Division of Highway Traffic Safety
Annual Crash Report
 21-212 Annual Crash Report Valdosta-Lowndes County Metropolitan Planning Organization July 213 Table of Contents Introduction... 3 Highway Safety Plan... 4 High Crash Locations... 12 Conclusions... 14
Northland Region road trauma for Northland Region. Road casualties Estimated social cost of crashes* Major road safety issues
 ISSN 1176-841X July 26 Land Transport has prepared this road safety issues report. It is based on reported crash data and trends for the 21 25 period. The intent of the report is to highlight key road
Pinellas County Metropolitan Planning Organization (MPO) 2014 Crash Data Report
 2014 Crash Data Report") Pinellas County Metropolitan Planning Organization (MPO) 2014 Crash Data Report MPO Board July 8, 2015 2 Crash Data Collection Motorcycle drove between stopped cars, ran a red light and collided with a
Pinellas County Metropolitan Planning Organization (MPO) 2014 Crash Data Report MPO Board July 8, 2015 2 Crash Data Collection Motorcycle drove between stopped cars, ran a red light and collided with a
Analysis of Pennsylvania Crash Statistics Data
 Analysis of Pennsylvania Crash Statistics Data By: Louis Pesci, Ph.D., Jeffrey Grim, P.T.P, Lucas Tatarko and Joseph Franze Indiana University of Pennsylvania May 2017 Executive Summary In 2015, 1,200
ROAD SAFETY ANNUAL REPORT 2018 ISRAEL
 ROAD SAFETY ANNUAL REPORT 2018 ISRAEL ISRAEL Israel recorded 321 road fatalities in 2017, representing a 3.9% decrease when compared to 2016. The mortality rate is 3.6 deaths per 100 000 population. Since
NEW YORK STATE 2018 Observational Survey of Seat Belt Use
 NEW YORK STATE 2018 Observational Survey of Seat Belt New York State Governor s Traffic Safety Committee Chuck DeWeese, Assistant Commissioner Empire State Plaza Albany, New York 12228 NEW YORK STATE
the Ministry of Transport is attributed as the source of the material
 Disclaimer All reasonable endeavours are made to ensure the accuracy of the information in this report. However, the information is provided without warranties of any kind including accuracy, completeness,
WYDOT Customer Satisfaction Survey 2016
 February 16 th, 2017 WYDOT Customer Satisfaction Survey 2016 Presenting results of the WYDOT Customer Satisfaction Survey, 2016 Presented By Brian Harnisch Senior Research Scientist Wyoming Survey & Analysis
A review of 2015 fatal collision statistics as of 31 December 2015
 A review of fatal collision statistics as of 31 December This report summarises the main trends in road fatalities that have emerged in. This has been prepared by the Road Safety Authority following analysis
Deaths/injuries in motor vehicle crashes per million hours spent travelling, July 2007 June 2011 (All ages) Mode of travel
 Mode of travel") Cyclists CRASH STATISTICS FOR THE YEAR ENDED 31 DECEMBER 211 Prepared by the Ministry of Transport CRASH FACTSHEET 212 Cyclists have a number of risk factors that do not affect car drivers. The main risk
Cyclists CRASH STATISTICS FOR THE YEAR ENDED 31 DECEMBER 211 Prepared by the Ministry of Transport CRASH FACTSHEET 212 Cyclists have a number of risk factors that do not affect car drivers. The main risk
TOWARD ZERO DEATHS: A NATIONAL STRATEGY ON HIGHWAY SAFETY
 TOWARD ZERO DEATHS: A NATIONAL STRATEGY ON HIGHWAY SAFETY June 2014 Dear Highway Safety Stakeholder: As associations that represent government agencies with a professional role in highway safety, we are
NEW JERSEY LAW ENFORCEMENT LIAISON NEWSLETTER
 NEW JERSEY LAW ENFORCEMENT LIAISON NEWSLETTER JULY 2017/10 WWW..ORG NJ DIVISION OF HIGHWAY TRAFFIC SAFETY DRIVE SOBER OR GET PULLED OVER 2017 MOBILIZATION The mission of the Division of Highway Traffic
Part 1 Road Transport
 Part 1 Road Transport Chapter 1 Road Traffic Accident Trends I Outline of Present Situation Title 1 Land Transport 1 Long-Term Transition of Road Traffic Accidents Traffic fatalities are reduced in 1 consecutive
North Carolina. Bicycle Crash Facts Prepared for
 North Carolina Bicycle Crash Facts 2006-2010 Prepared for The North Carolina Department of Transportation Division of Bicycle and Pedestrian Transportation Prepared by The University of North Carolina
Napier City road trauma for Napier City. Road casualties Estimated social cost of crashes* Major road safety issues.
 ISSN 1176-841X July 25 Land Transport New Zealand has prepared this road safety issues report. It is based on reported crash data and trends for the 2 24 period. The intent of the report is to highlight
road safety issues 2002 road trauma for TNZ Region Two July 2003 Road deaths Estimated social cost of crashes* Major road safety issues
 road safety issues July 23 22 road trauma for TNZ Region Two The Land Transport Safety Authority (LTSA) has prepared this road safety issues report. It is based on reported crash data and trends for the
Transportation and Public Works Annual Motor Vehicle Collision Report
 Transportation and Public Works 22 Annual Motor Vehicle Collision Report Table of Contents Table of Contents.. 2 Introduction.. 3 22 Collision Summary. 4 Demographics 5 Collisions by Severity.. 5 Personal
2012 Petaluma Traffic Safety Report Collisions Rise for 2 nd Year in a Row
 NEWS RELEASE For Immediate Release/Broadcast Thursday, March 7, 2013 2012 Petaluma Traffic Safety Report Collisions Rise for 2 nd Year in a Row The 2012 annual review of traffic safety in Petaluma has
Officer Safety on our Roadways
 Lifesavers 30th National Conference on Highway Safety Priorities Officer Safety on our Roadways June 15, 2012 Craig W. Floyd Chairman & CEO National Law Enforcement Officers Memorial Fund Memorial Fund
2017 Annual Traffic Safety Report
 2017 Annual Traffic Safety Report City of Santa Cruz Public Works Department I. Introduction The purpose of the 2017 City of Santa Cruz Traffic Safety Report is to provide an overview of traffic safety
Traffic Safety and Active Transportation in Santa Clara County
 Traffic Safety and Active Transportation in Santa Clara County A data brief on the impact of motor vehicle collisions, active transportation, and air quality in Santa Clara County 2 0 1 4 Traffic Safety
Community of Practice on Traumatic Brain Injury
 Community of Practice on Traumatic Brain Injury Second Meeting October 15, 2013, 3:00-4:00 PM ET For audio, please call 866-835-7973. Your phone line is currently muted. Today s Agenda Overview of TBI
OUR HIGH SCHOOL PROGRAM
 OUR HIGH SCHOOL PROGRAM Mission Statement Accident Awareness Inc. is committed to educating the public to the dreadful realities of fatal motor vehicle collisions, how quickly they can occur and the grim
Background: Introduction:
 Background: Iowa s 2014 Child Passenger Safety Survey Project Conducted by the University of Iowa Injury Prevention Research Center Under contract to Iowa Governor s Traffic Safety Bureau Since 1985, Iowa
Review of Fatal Collisions
 Review of Fatal Collisions January to July 1 st 16 Review of 16 fatal collision statistics as of 1st July 16 Overview This report summarises the main trends in road fatalities that have emerged up to the
Community Traffic Safety Awards Program 2017 Application
 EASY APPLICATION Community Traffic Safety Awards Program 2017 Application AAA Community Traffic Safety Awards are presented to communities for their efforts to improve local traffic safety for all modes
DANGEROUS DRIVING 2008
 May 2009 A collision produces three levels of data: collision, unit (vehicles), and individual. For this reason, readers should pay particular attention to the wording of statements about the data to avoid
Pedestrian and Bicycle Crashes
 Pedestrian and Bicycle Crashes Pedestrian and Bicycles Overview Pedestrian-related crashes represent 3.6% of the total reported traffic crashes; however, they account for 11.1% of all traffic crash deaths.
the Ministry of Transport is attributed as the source of the material
 Pedestrians 216 Disclaimer All reasonable endeavours are made to ensure the accuracy of the information in this report. However, the information is provided without warranties of any kind including accuracy,
Factors Leading to Older Drivers Intersection Crashes
 Factors Leading to Older Drivers Intersection Crashes APHA Annual Meeting 2007 Washington, DC November 7, 2007 Keli A. Braitman Bevan B. Kirley Neil K. Chaudhary Projections of population and licensure
Iowa Child Passenger Safety Survey 2016
 Iowa Child Passenger Safety Survey 2016 Conducted by the University of Iowa Injury Prevention Research Center Under contract to Iowa Governor s Traffic Safety Bureau Background Since 1985, Iowa has had
Protecting our Children and Youth. The Life Saving Benefits of Child Safety Seats, Boosters, and Seat Belts
 Protecting our Children and Youth The Life Saving Benefits of Child Safety Seats, Boosters, and Seat Belts The Problem Motor vehicle crashes are the leading cause of death among children ages 3 and over.
WEEK 3 DRIVING SAFETY
 WEEK 3 DRIVING SAFETY Driving Safe starts before the engine. Most drivers are aware of the affect that things like drinking and cell phone use have on their driving safety, while giving little consideration
Table of Content. Cyclist Injury Crashes APPENDIX GIS Heat Maps by Municipality P a g e
 Table of Content INTRODUCTION... 5 ALCOHOL... 6 Impaired Driving - Fatalities... 6 Youth Alcohol... 11 Youth Impaired Driving - Fatalities... 11 Alcohol-Impaired Driving Injury crashes... 16 SPEEDING &
Partners for Child Passenger Safety Fact and Trend Report October 2006
 Partners for Child Passenger Safety Fact and Trend Report October In this report: Background: Child Restraint Laws in PCPS States Page 3 Restraint Use and Seating Page 3 Vehicles Page People and Injuries
MEMORANDUM. City Constituents. Leilani Schwarcz, Vision Zero Surveillance Epidemiologist, SFDPH
 MEMORANDUM TO: FROM: CC: City Constituents Leilani Schwarcz, Vision Zero Surveillance Epidemiologist, SFDPH Megan Wier, Co-Chair, San Francisco Vision Zero Task Force, SFDPH Commander Ann Mannix, Traffic
Update MnDOT s County Roadway Safety Plans 2012 Traffic Records Forum Biloxi, MS October 29, 2012 Brad Estochen
 Update MnDOT s County Roadway Safety Plans 2012 Traffic Records Forum Biloxi, MS October 29, 2012 Brad Estochen MnDOT, CH2M HILL, SRF Consulting Group, P.E. Services 1 County Road Safety Plans Funding
Truck Tractor Trailer Crash Analysis
 Building Tribal Traffic Safety Capacity Truck Tractor Trailer Crash Analysis Arizona Department of Transportation (ADOT) Motor Vehicle Crash (MVC) Data ITCA, Inc. 04/18/06 Truck Tractor Trailer Crash Analysis
BICYCLING ON ROADWAYS
 Massachusetts State Police Academy Training Bulletin 2017-11 BICYCLING ON ROADWAYS Legal Update: Effective April 2017, Chapter 456 of the Acts of 2016 adds section 4D to Chapter 89 of the General Laws,
NEW JERSEY LAW ENFORCEMENT LIAISON NEWSLETTER
 NEW JERSEY LAW ENFORCEMENT LIAISON NEWSLETTER APRIL 2018/19 WWW.NJSACOP.ORG NJ DIVISION OF HIGHWAY TRAFFIC SAFETY The mission of the Division of Highway Traffic Safety is the Safe Passage of all roadway
2013 Third Quarter Report
 City of Manassas Police Department 9518 Fairview Ave Manassas, VA 211 213 Third Quarter Report 212-213 3rd Quarter Comparison Summary ALL OFFENSES - 4% increase (1,274) PART I OFFENSES 23% decrease (257)
road safety issues 2002 road trauma for Tauranga District July 2003 Regional crash causes Estimated social cost of crashes*
 road safety issues July 23 22 road trauma for Tauranga District The Land Transport Safety Authority (LTSA) has prepared this road safety issues report. It is based on reported crash data and trends for
It is the policy of the LSU AgCenter, Louisiana Cooperative Extension Service that no person shall be subjected to discrimination on the grounds of
 It is the policy of the LSU AgCenter, Louisiana Cooperative Extension Service that no person shall be subjected to discrimination on the grounds of race, color, national origin, religion, gender, age or
Bicycle - Motor Vehicle Collisions on Controlled Access Highways in Arizona
 Bicycle - Motor Vehicle Collisions on Controlled Access Highways in Arizona Analysis from January 1, 1991 to June 30, 2002 Richard C. Moeur, PE Traffic Design Manager, Northern Region Michelle N. Bina
U.S. Bicycling Participation Study
 U.S. Bicycling Participation Study Report of findings from the 2016 survey Conducted by Corona Insights Commissioned by PeopleForBikes Released July 2017 Table of Contents Background and Objectives 3 Research
TEXAS TRAFFIC SAFETY TASK FORCE. Jeff Moseley Texas Transportation Commission
 TEXAS TRAFFIC SAFETY TASK FORCE Jeff Moseley Texas Transportation Commission June 7, 2016 Fatalities and fatal crashes 2010 2015 4,000 3,500 3,417 3,407 3,536 3,533 3,000 3,061 3,067 2,782 2,803 3,037
Safety and Active Transport. Dr. Maureen Carew, Medical Officer of Health Renfrew County and District Health Unit May 30, 2014
 Safety and Active Transport Dr. Maureen Carew, Medical Officer of Health Renfrew County and District Health Unit May 30, 2014 Active Transport Vision Increase levels of walking and cycling Reduce vehicle
TRAFFIC CRASHES involving BICYCLISTS
 The Office of the Chief of Police in Berlin BERLIN TRAFFIC CRASHES involving BICYCLISTS A special research project concerning bicycle crashes in West Berlin in the years 1981 through 1985 Police Analyst
Dear Fellow Nebraskans:
 Dear Fellow Nebraskans: In accordance with the provisions in the Safe, Accountable, Flexible, and Efficient Transportation Equity Act A Legacy for Users (SAFETEA LU), each state is required to develop
Road Safety Partnership
 Cambridgeshire and Peterborough Road Safety Partnership Cambridgeshire and Peterborough Road Safety Partnership Introduction Road accidents can have a devastating impact not only for the people directly
CHAPTER NINE SELECTED INDIANA LAWS
 CHAPTER NINE SELECTED INDIANA LAWS Child Safety Restraint Laws Motorcycle Helmet Laws Indiana Speed Limit Laws Indiana Safety Belt Laws Safety Belt Laws by State Indiana s Comparative Negligence Law Indiana
KANSAS STRATEGIC HIGHWAY SAFETY PLAN
 KANSAS STRATEGIC HIGHWAY SAFETY PLAN 214 Annual Dashboard Report Preliminary Statewide Fatality Analysis The accident data herein, as of February 19, 215, reflect the reporting officer s observations and
Keep Customers and Ourselves Safe. Mark Shelton, District Engineer. Tracker. Measures of Departmental Performance
 Keep Customers and Ourselves Safe Mark Shelton, District Engineer Tracker Measures of Departmental Performance Safety is a daily commitment for all MoDOT employees. From design and construction to operations
 http://www.itarda.or.jp/english/info36/36top.html Page 1 of 2 Introduction It is difficult to understand how someone could end up driving in the wrong direction on the highway. However, 1 in 300 accidents
South Carolina s Strategic Highway Safety Plan
 Target Zero South Carolina s Strategic Highway Safety Plan 215-218 March 4, 215 Dear Highway Safety Partner: The South Carolina Department of Public Safety (SCDPS) and the South Carolina Department of
DOT HS September Crash Factors in Intersection-Related Crashes: An On-Scene Perspective
 DOT HS 811 366 September 2010 Crash Factors in Intersection-Related Crashes: An On-Scene Perspective DISCLAIMER This publication is distributed by the U.S. Department of Transportation, National Highway
SOMERSET ROAD SAFETY PARTNERSHIP CASUALTY REVIEW Working together to reduce casualties
 CASUALTY REVIEW 27-29 Working together to reduce casualties 3 CONTENTS 1 EXECUTIVE SUMMARY 2 2 INTRODUCTION: CASUALTY REDUCTION TARGETS 3 3 COLLISION AND CASUALTY TRENDS 4 4 KILLED AND SERIOUSLY INJURED