2012 TOWN OF CASTLE ROCK MOTOR VEHICLE ACCIDENT FACTS PREPARED BY THE PUBLIC WORKS DEPARTMENT
|
|
|
- Clementine Blankenship
- 5 years ago
- Views:
Transcription

1 ATTACHMENT A 2012 TOWN OF CASTLE ROCK MOTOR VEHICLE ACCIDENT FACTS PREPARED BY THE PUBLIC WORKS DEPARTMENT
2 ACKNOWLEDGEMENTS This report was assembled from data provided by the Castle Rock Police Department accident report data from the year Each accident record, whether completed by a local police officer or a member of the Colorado State Patrol, was sent to Castle Rock and entered into a centralized database maintained by the Public Works Department. The report itself was created by personnel in the Public Works Department. For more information, please contact: Transportation Engineering Division Town of Castle Rock 4175 N. Castleton Ct. Castle Rock, CO

3 2012 TOWN OF CASTLE ROCK MOTOR VEHICLE ACCIDENT FACTS Table of Contents Public Works Director s Letter... i Executive Summary... 1 SECTION 1: Public Works Statistical Analysis 2 Road & Intersection Safety... 2 SECTION 2: 2012 Raw Data Summaries 5 Quick Facts... 5 Accident Pin Map... 6 Accident Rates by Location... 7 Time Trends... 9 Types of Crashes Accident Location Accident Environment The Driver Alcohol and Drug Involvement Involvement by Age and Gender Annual Trends Definitions... 17


4
5 2012 TOWN OF CASTLE ROCK MOTOR VEHICLE ACCIDENT FACTS EXECUTIVE SUMMARY The mission of the Public Works Department is To provide outstanding service, safety and support for transportation infrastructure and maintenance. We believe that by analyzing our accident data on a regular basis we can help identify locations where the roadway environment may be a contributing factor to accidents. Following this we can then use the information to develop options for improvements and program projects for correction. Since 2004, when Public Works first reported accident statistics, the numbers of fatalities, and persons injured have been declining. Additionally, the crash rate per town population has also been generally decreasing since These trends are encouraging indications of the overall safety of travel on Town roadways. are the result of many factors. These factors can generally be classified into three main categories: 1) human factors, 2) vehicle factors, and 3) roadway environment. By far, the largest percentage of accidents can be attributed to human factors. These are the factors that drivers can control and are usually the simplest to correct. Basic driver awareness and respect for all users of the Town s roadways will go the farthest towards reducing the number of accidents. Education, Enforcement and Engineering, the three E s, all play an important role in improving safety. However it will take conscious decisions by drivers to change their behavior in order to make our roadway system safer. Addressing vehicle factors is the responsibility of everyone who owns and operates a motor vehicle. Regular vehicle inspections along with preventative maintenance procedures will help reduce the chances of an accident occurring as a result of a vehicle malfunction. The roadway environment is something that is out of the driver s control, but it is within the control of the Town, or CDOT in the case of the State system. We work to identify locations where roadways themselves could be a contributing factor in an accident and implement treatments to correct these. Public Works uses statistical modeling to identify the locations where corrections to the roadway environment may improve safety. This helps direct limited resources to the locations where the most benefit can be obtained and avoids directing these resources toward locations where problems may not exist. In the 2011 Accident Report, the intersection of SH 86 / Crowfoot Valley Rd. was identified as a location where the accidents fell outside of the expected range. Last year, CDOT changed the phasing of the traffic signal so that eastbound left turns from SH 86 could only be made on a green arrow. The permissive movement, where the eastbound left turning vehicles could turn during the east-west green phase, was eliminated. This seems to have helped reduce the left-turn related accidents. Since this signal phasing change represented a change in conditions, this intersection has been moved back to the 1-year of data category. The Colorado Department of Transportation (CDOT) will be provided with these findings and support provided where possible to assist them with further review of these locations for improvements. 1
6 SECTION 1: Public Works Statistical Analysis The first section of this report summarizes the statistical review of the 2012 raw data. The purpose of this is to provide an initial screen to identify the signalized intersections that are producing accident numbers that exceed the number that may be expected to occur when compared to a model intersection sharing similar characteristics. Since accidents are expected to occur, it s important to determine which locations are experiencing accidents at a higher rate than should be expected. ROAD & INTERSECTION SAFETY One important goal from this accident data is to identify locations where the road environment may be a contributing factor to accidents. This is possible through statistical analysis. The goal in this regard is to identify locations where roadways could be a contributing factor and implement treatments to correct these. The definition of the safety of a road section or intersection used by the Transportation Planning and Traffic Engineering Division is the number of accidents expected to occur at these locations during a specified period as compared to what actually has occurred. Because there are factors that are not related to the physical roadway environment that contribute to accidents, road sections and intersections are expected to have accidents occur. Since what is expected cannot be known, safety can only be estimated, and estimation is in degrees of precision. The precision of an estimate is usually expressed by its standard deviation. For practical reasons Traffic Engineering is interested in the safety of a road section or intersection that seems to have too many accidents. If the estimation of safety is based only on accident counts or accident rates, the estimate would be biased. The existence of this regression-to-mean bias has been long recognized. It is known to produce inflated estimates of countermeasure effectiveness. To estimate roadway safety, Traffic Engineering utilizes the Empirical Bayes (EB) method. This method increases the precision of the estimates and corrects for the regression-to-mean bias. The EB method recognizes that accident counts or rates are not the only clue to safety. Another clue is in what is known about the safety of similar entities. To identify the safety of similar entities, safety performance functions (SPFs), which are models, need to be developed from existing data (accidents, vehicle volumes, etc.). SPF models from other jurisdictions can also be adopted if these SPFs are found to fit the Town s local trends. The refinement of SPFs increases as more data becomes available. This is important in not only identifying locations with potential safety issues, but also in helping ensure that limited resources are not exhausted on problems that may not exist. As the Town s Traffic Engineering Division collects more accident records and continues to develop these SPFs, locations that seem to stand out as having a high accident rate will be looked into closer to determine if any accident trends are occurring that may indicate an issue that should be further examined. Currently, only a model for signalized intersections has been developed. This is natural as signalized intersections exist on higher volume roads where accident probability is higher due to normal exposure. The Transportation Planning and Traffic Engineering Division will continue to collect data in hopes of developing SPFs for non-signalized intersections, and roadway segments when possible. 2
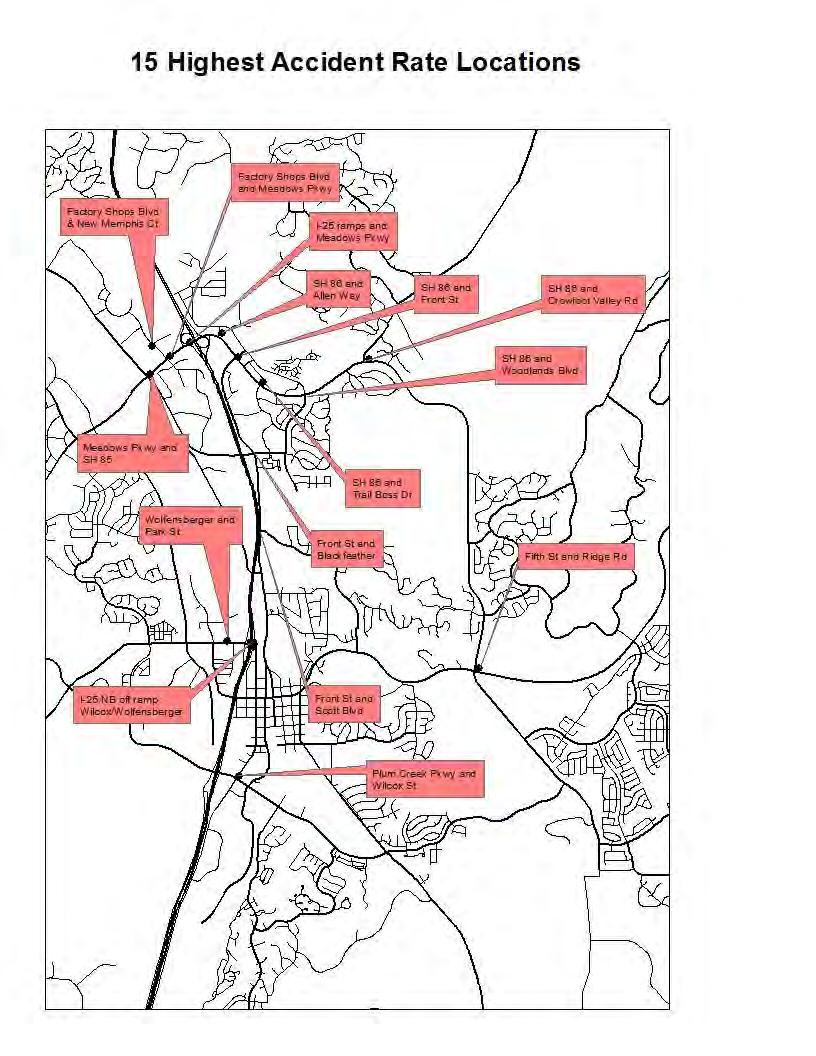
7 An SPF has been developed for signalized intersections within the Town. This SPF provides an indication of the average number of accidents that are expected at similar signalized intersections. This combined with the actual accident records of each signalized site allows for a more precise safety estimate of each signalized intersection utilizing the EB method. The estimates improve as more annual records become available. The table on page seven summarizes the signalized intersections with the highest accident rates. The result of the analysis shows that the majority of signalized intersections have accident rates that are consistent, or better, than signalized intersections of a similar nature. None of the intersections had an accident experience worse than what could be expected. From the date collected, there is no indication that the roadway environment or design is the primary cause of accidents at the highest accident locations. This does not mean that changes to the roadway environment could not increase intersection safety. However, since these accidents are more likely to be related to vehicle or human factors, spending resources on the roadway environment would not likely be cost effective. This information will be passed onto the Colorado Department of Transportation for their use along with intersections accident diagrams to allow for further assessment to determine if any improvements may be beneficial. In summary, everyone that utilizes the public roadway system has a responsibility when it comes to reducing the number of accidents. There are agencies that specialize in certain areas such as police enforcement, communications, education, and engineering that through their combined efforts will go a long way toward increasing the safety of the Town s roads. ANNUAL DATA FOR INTERSECTIONS WITH THE HIGHEST ACCIDENT RATES The following tables summarize the 2012 highest accident rate locations (signalized). The actual accident total is shown for informational purposes only. The EB model uses this total within the formulas itself along with a weight to adjust for the fluctuation around the mean. As more years get added, the actual weighting decreases and the total number of accidents gets closer to the total expected Rank Locations with 1-year of accident data Intersection Actual 3 Range of at Similar Location Peer Comparison 14 SH 86 / Crowfoot Valley Similar 11 Front / Scott St Similar 2012 Rank Locations with 2-years of accident data Intersection Actual (2 years) Range of at Similar Location Peer Comparison 8 SH 86 / Woodlands / Allen Similar
8 2012 Rank 1 Locations with 3-years of accident data Intersection Actual (3 years) Range of at Similar Location Peer Comparison I-25 / SH 86 (NB off Ramp) Better Factory Shops / New Memphis Similar 10 Front St. / Blackfeather Similar 2012 Rank 3 Locations with 4-years of accident data Actual (4 years) Range of at Similar Location Peer Comparison Intersection I-25 NB off-ramp / Wolfensberger Similar 13 Plum Creek Pkwy. / Wilcox Similar 2012 Rank Locations with 5-years of accident data Actual (5 years) Range of at Similar Location Peer Comparison Intersection Meadows Blvd. / Prairie Hawk Similar 7 Wolfensberger / Park St Similar 9 I-25 / US 85 (SB off ramp) Better 2012 Rank Locations with 6-years of accident data Intersection Actual (6 years) Range of at Similar Location Peer Comparison Plum Creek Pkwy. / Perry St Similar 5 SH 86 / Fifth St. / Ridge Rd Similar 2012 Rank Locations with 7-years of accident data Intersection Actual (7 years) Range of at Similar Location Peer Comparison 15 SH 86/Trailboss Better Wilcox / Fifth St Similar 4
9 2012 Rank Locations with 8-years of accident data Intersection Actual (8 years) Range of at Similar Location Peer Comparison 2 US 85 / Factory Shops Blvd Similar 4 SH 86 / Allen Way Similar 12 SH 86 / Front St Better 6 US 85 / Meadows Pkwy Similar Factory Shops Blvd. / New Memphis Ct. This is the intersection with the highest accident rate, and although it doesn t exceed the total that could be expected, we feel that some improvements need to be considered. Our data showed us that nine of the accidents at this intersection involved left turning vehicles and through vehicles. We are investigating the sight distances for the left turning vehicles from the south and west approaches, as vehicles waiting to turn on the north and east approaches may be blocking the view of these drivers. We are also looking to make adjustments in the signal timing plan for this intersection in hopes of improving the coordination between this signal and the Meadows/Factory Shops traffic signal. The southbound vehicle queues often back from Meadows to New Memphis. CDOT is planning to add an additional lane to eastbound Meadows from Factory Shops to the I-25 northbound on-ramp, and this should help relieve the backups on Factory Shops as traffic will be able to turn left easier. We plan to eventually build a round-a-bout at this intersection. This information will help us in prioritizing this project. SECTION 2: 2012 Raw Data Summaries This section summarizes the raw accident data for 2012 by various categories. The totals include all forms of transportation and include pedestrian, bicycle and motorcycle accidents. The purpose of this is for general public interest as well as for use by other staff departments that may use this information to assist with improving their operations. QUICK FACTS Persons Killed Persons Injured Reported On average, one traffic accident was reported every 15.5 hours. For every hundred accidents, eight injuries occurred. Of all drivers involved in accidents, 7.5% were age 19 years old, or less; 28% were under 25 years of age; and 14% were over the age of 60. Of all accidents 24% occurred at night. 5
10 Accident Pin Map for 2012 This map shows the accident locations throughout the town. Many of these locations had several accidents reported. The arterial and collector streets have the highest incident of accidents, which is expected considering that they also have the highest traffic volumes. When reviewing new developments, we limit the number of new access points on these classifications of streets. By doing this, the potential for accidents decreases. 6
11 Intersections ACCIDENT RATES BY LOCATION At Intersections Number of Avg. Volume through intersection Rate Rank (2012)/(2011) US Factory Shops Blvd 44 62, /4 SH Allen Way 36 55, /8 I-25 SB US , /11 US Meadows Pkwy , /5 SH Fifth St. / Ridge Rd , /9 I-25 NB off Wilcox / Wolfensberger 15 22, SH Front St , /3 Factory Shops New Memphis Ct , /1 SH Woodlands Blvd , Plum Creek Wilcox 12 39, /12 SH Crowfoot Valley 10 34, /14 SH Trailboss 9 32, /10 Front Blackfeather 9 22, Park 9 19, Front Scott Blvd. 8 22,
12 8
13 TIME TRENDS By Month % Deaths % January 42 7% 0 0% February 38 7% 0 0% March 34 6% 0 0% April 43 8% 0 0% May 46 8% 0 0% June 47 8% 0 0% July 51 9% 0 0% August 49 9% 0 0% September 39 7% 0 0% October 51 9% 0 0% November 52 9% 0 0% December 73 13% 0 0% Total % 0 100% By Day of Week % Deaths % Sunday 66 12% 0 0% Monday 82 15% 0 0% Tuesday 77 13% 0 0% Wednesday 83 15% 0 0% Thursday 91 16% 0 0% Friday 85 15% 0 0% Saturday 81 14% 0 0% Total % 0 100% By Time of Day % Deaths % Midnight 5 1% 0 0% 1:00am 3 1% 0 0% 2:00am 7 1% 0 0% 3:00am 4 1% 0 0% 4:00am 1 0% 0 0% 5:00am 4 1% 0 0% 6:00am 11 2% 0 0% 7:00am 25 4% 0 0% 8:00am 23 4% 0 0% 9:00am 28 5% 0 0% 10:00am 29 5% 0 0% 11:00am 43 8% 0 0% 12:00pm 41 7% 0 0% 1:00pm 40 7% 0 0% 2:00pm 36 6% 0 0% 3:00pm 50 9% 0 0% 4:00pm 52 9% 0 0% 5:00pm 48 8% 0 0% 6:00pm 32 6% 0 0% 7:00pm 26 5% 0 0% 8:00pm 18 3% 0 0% 9:00pm 20 4% 0 0% 10:00pm 13 2% 0 0% 11:00pm 6 1% 0 0% Total % 0 100% 9
14 TYPES OF CRASHES Number of Fatalities First Harmful Event Number of Injuries Number of % of Hit Other % Vehicle Hit Fixed or % Other Object Rollover % Hit % Animal Hit % Pedestrian Hit % Bicyclist Hit % Railway Train Hit % Parked Vehicle All % Others TOTAL % Vehicle Type Vehicles Involved in % of Vehicles Auto % SUV % Pick-up % Truck(over 10,000 lbs) 17 2% Motorcycle/Moped % Bicycle 3 0.5% Other 29 3% TOTAL 1, % 10
15 At Intersections Intersections By Classification ACCIDENT LOCATION Number Of Number Of People Killed Number Of People Injured Arterial/Arterial Arterial/Collector Arterial/ Local Collector/Collector Collector/Local Local/Local Total Non-Intersections Segments Number of Number of People Killed Number of People Injured Multi-lane Arterial or Collector Two-lane Arterial Or Collector Local Total
16 ACCIDENT ENVIRONMENT Traffic control % Railroad Device 1 0.5% Yield Sign 1 0.5% Stop Sign 53 9% Traffic Signal % None* % Total % *These include accidents not occurring at a controlled location, such as rear-end accidents and accidents where a vehicle left the roadway and hit a fixed object. Weather % Clear % Rain 20 3% Snow/Sleet 38 7% Other 1 0% Total % Road Conditions % Dry % Wet 32 6% Icy/Slushy 56 10% Other 0 0% Total % 12 Lighting Condition % Day % Night % Total %
17 THE DRIVER Primary Cause of % Failed to Yield Right of 87 15% Way Careless/Reckless % Driving Violation of Red Signal 22 4% Unsafe Backing 13 2% Speeding too fast for 25 4% conditions Following too closely 58 10% Turned Left in Front of 3 1% Approaching Traffic All Other/Unknown % Total % Condition of Drivers Drivers % No Defect or Unknown % Other* ( includes: aggressive driving, % fatigue, inexperienced drivers, distractions, illness) Cell Phone 8 1% *Alcohol related accidents are found in a separate table on the next page 13

18 Drivers Influenced by Alcohol or Drugs Age All Drivers Male Female < > Total Less than 5% of the total accidents reported in 2012 involved alcohol or drugs. This was the same as reported in 2011 and is approximately the same as the national average. Percent of Drivers Involved in Traffic by Age and Gender 14

 644 604 610 588 591 565 523 538 541 2004 2005 2006 2007 2008 2009 2010 2011 2012 Year The number of injury accidents and the")
19 ANNUAL TRENDS The Town of Castle Rock reached a milestone in 2012 by reaching a population of 50,000. Considering the fact that an increase in accidents usually follows an increase in population in accordance with more people traveling on the Town s roads, our residents are not doing all that badly. As can be seen in the graph below, the number of accidents has remained within a fairly constant range for the past five years. Reported Total Reported ( ) Year The number of injury accidents and the corresponding injury accident rate have dramatically decreased since There was a 10% decrease from 2011 to 2012 reported injuries. This could be as a result of increased enforcement of the seat belt law, better observance of the speed limits and traffic control devices. Total Persons Injured ( ) Injured Persons Year 15
20 Rate (/ 1,000 pop.) Total Crash, Fatality, & Injury Rates per Total Fatalities Population ( ) of Fatalities Fatality Rate Year Year Crash Rate Injury Rate 16
21 DEFINITIONS The following special terms are used throughout this report, and are provided to clarify the meaning of the data. 1. Accident (or traffic accident): An unintended event involving a motor vehicle that causes death, injury, or property damage. 2. Alcohol Involvement Accident: Any motor vehicle accident in which a driver, pedestrian, or bicyclist had consumed alcohol. 3. Fatal Accident: A traffic accident which involving the death of one or more persons. 4. Hit-Other-Vehicle: A type of collision in which the first harmful event involves a collision between two or more vehicles. 5. Injury Accident: An accident involving injuries to one or more persons which may or may not require transportation to a medical facility. 6. Motor Vehicle: Any motorized (mechanically or electrically powered) vehicle not operated on rails. 7. Other Non-collision: An event during an accident sequence which does not involve a collision with another vehicle or object. 8. Property Damage Accident: An accident not involving either a fatality of an injury to any party but which does include damage to one or more vehicles. 9. Rollover: An accident in which the overturning of a vehicle was the first harmful event. 10. Type of Crash: The category which best describes the general type of collision which was the first event. 17
3.0 Future Conditions
 3.0 Future Conditions In order to be able to recommend appropriate improvements to the transportation system of the Town, it is important to first understand the nature and volume of traffic that is expected
Technical. BACKGROUND corridor from. The Castle Rock. To: RE: SH 86-Founders. results and. as high volumes. This. no formal. intersection.
 Technical Memorandum To: The Castle Rock Town Council and Public Works Commission From: CDOT Region 1 Traffic Operations Unit RE: SH 86-Founders Pkwy/Allen Way Intersection Assessment of Alternatives INTRODUCTION
Alberta. Traffic Collision Statistics. Office of Traffic Safety Transportation Services Division May 2017
 Traffic Collision Statistics Office of Traffic Safety Transportation Services Division May 217 This page was intentionally left blank. 2 Table of Contents Traffic Collisions... 4 Traffic Collision Rates...
Maine Highway Safety Facts 2016
 Maine Highway Safety Facts 216 216 MAINE HIGHWAY SAFETY FACTS The Bureau of Highway Safety and the Maine Department of Transportation are pleased to present the 216 edition of Maine Highway Safety Facts.
San Francisco 2009 Collisions Report April 21, 2011
 San Francisco 29 Collisions Report April 21, 211 City and County of San Francisco San Francisco Municipal Transportation Agency 1 South Van Ness Avenue, 7 th Floor San Francisco CA 9413 CONTENTS About
MTCF. Michigan Traffic Crash Facts FACT SHEETS
 FACT SHEETS This page left intentionally blank GENERAL FACTS The driver, the roadway, and the motor vehicle contribute in some measure to every crash. A preponderance of evidence, however, points to driver
For further information contact: Alberta Infrastructure and Transportation Office of Traffic Safety Main Floor, Twin Atria Building Avenue
 Alberta Traffic Collision Statistics 2006 Alberta Traffic Collision Statistics 2006 For further information contact: Alberta Infrastructure and Transportation Office of Traffic Safety Main Floor, Twin
MTCF. Michigan Traffic Crash Facts FACT SHEETS
 FACT SHEETS This page left intentionally blank GENERAL FACTS The driver, the roadway, and the motor vehicle contribute in some measure to every crash. A preponderance of evidence, however, points to driver
Signalization and Safety. A Study of the Safety Effects of Signalizing Intersections on Colorado State Highways
 Presentation by Richard G. Sarchet, P.E. of the Colorado Department of Transportation at the TRB National Roundabout Conference in Vail, Colorado May 2005 P Why do we Install Traffic Signals? Because They
DEPARTMENT OF ENVIRONMENTAL SERVICES. North Harrison Street (Lee Highway to Little Falls Road) Comparative Analysis. Prepared for:
 Comparative Analysis. Prepared for:") DEPARTMENT OF ENVIRONMENTAL SERVICES North Harrison Street (Lee Highway to Little Falls Road) Comparative Analysis Prepared for: Arlington County Department of Environmental Services 2100 Clarendon Boulevard,
DEPARTMENT OF ENVIRONMENTAL SERVICES North Harrison Street (Lee Highway to Little Falls Road) Comparative Analysis Prepared for: Arlington County Department of Environmental Services 2100 Clarendon Boulevard,
MEMORANDUM. City Constituents. Leilani Schwarcz, Vision Zero Surveillance Epidemiologist, SFDPH
 MEMORANDUM TO: FROM: CC: City Constituents Leilani Schwarcz, Vision Zero Surveillance Epidemiologist, SFDPH Megan Wier, Co-Chair, San Francisco Vision Zero Task Force, SFDPH Commander Ann Mannix, Traffic
COLLISION STATISTICS May Engineering Services Box 5008, th Avenue Red Deer, AB T4N 3T4
 COLLISION STATISTICS 2016 2016 Red Deer Annual Motor Vehicle Collision Report May 2017 Engineering Services Box 5008, 4914 48th Avenue Red Deer, AB T4N 3T4 engineering@reddeer.ca RCMP GRC Red Deer City
Welcome! San Jose Avenue Open House August 25, 2015
 Welcome! San Jose Avenue Open House August 25, 2015 Vision Zero The City and County of San Francisco adopted Vision Zero San Francisco Vision Zero High Injury Network as a policy in 2014, committing an
2012 Petaluma Traffic Safety Report Collisions Rise for 2 nd Year in a Row
 NEWS RELEASE For Immediate Release/Broadcast Thursday, March 7, 2013 2012 Petaluma Traffic Safety Report Collisions Rise for 2 nd Year in a Row The 2012 annual review of traffic safety in Petaluma has
For further information contact: Alberta Transportation Office of Traffic Safety Main Floor, Twin Atria Building Avenue Edmonton, Alberta T6B
 Alberta Traffic Collision Statistics 2009 Alberta Traffic Collision Statistics 2009 For further information contact: Alberta Transportation Office of Traffic Safety Main Floor, Twin Atria Building 4999
Alberta. Traffic Collision Statistics
 Alberta Traffic Collision Statistics 2015 Alberta Traffic Collision Statistics 2015 For further information contact: Alberta Transportation Office of Traffic Safety Main Floor, Twin Atria Building 4999
Alberta. Traffic Collision Statistics
 Alberta Traffic Collision Statistics 2002 Alberta Traffic Collision Statistics 2002 For further information contact: Alberta Transportation Driver Safety, Research and Traffic Safety Initiative 1st Floor,
Vision Zero Task Force February 28, Collision Landscape Analysis
 Vision Zero Task Force February 28, 2017 Collision Landscape Analysis Welcome! What happened since our last Task Force meeting: City Council adopted the Vision Zero Resolution Applied for an OTS grant
Northbound San Jose Avenue & I-280 Off-Ramp Road Diet Pilot Project
 Project Overview Fed by a two-lane Interstate-280 (I-280) off-ramp, high vehicular volumes and speeds are longstanding issues along San Jose Avenue. Residents in the surrounding neighborhoods have expressed
2015 Victorian Road Trauma. Analysis of Fatalities and Serious Injuries. Updated 5 May Page 1 of 28. Commercial in Confidence
 2015 Victorian Road Trauma Analysis of Fatalities and Serious Injuries Updated 5 May 2016 Page 1 of 28 Commercial in Confidence VICROADS_n3445896_2015_Victorian_Trauma_Report_- _updated_may_2016.docx 2015
PRELIMINARY DRAFT FIRST AMENDMENT TO VISION 2050: A REGIONAL LAND USE AND TRANSPORTATION PLAN FOR SOUTHEASTERN WISCONSIN
 PRELIMINARY DRAFT FIRST AMENDMENT TO VISION 2050: A REGIONAL LAND USE AND TRANSPORTATION PLAN FOR SOUTHEASTERN WISCONSIN ESTABLISHING TARGETS FOR FEDERAL PERFORMANCE MEASURES: HIGHWAY SAFETY SOUTHEASTERN
Study on fatal accidents in Toyota city aimed at zero traffic fatality
 Study on fatal accidents in Toyota city aimed at zero traffic fatality Toru Kiuchi, Yoshihisa Kanno, Makoto Shiota Toyota Motor Corporation, 1 Toyota-cho, Toyota-shi, Aichi 471-8571, Japan Abstract - Since
2013 Traffic Safety Report
 Traffic Safety Report Introduction Every year on the more than 1, miles of unincorporated Larimer County roadways, about 375 vehicular traffic crashes occur. Those crashes include about 75 severe crashes
officer Traffic Safety National Law Enforcement Officers Memorial Fund September 2012
 officer Traffic Safety National Law Enforcement Officers Memorial Fund September 2012 Did you know? On average, a law enforcement officer is killed somewhere in the U.S. every 54 hours There are some 60,000
Colorado Department of Transportation Crash Data Program Alisa Babler, PE
 Colorado Department of Transportation Crash Data Program Alisa Babler, PE 2014 Colorado 115,388 Total Crashes 39,353 Injuries 488 Fatalities 489.85 100MVMT 88,258 Roadway Center Line Miles Media Question:
2014 QUICK FACTS ILLINOIS CRASH INFORMATION. Illinois Emergency Medical Services for Children February 2016 Edition
 2014 QUICK FACTS ILLINOIS CRASH INFORMATION February 2016 Edition Illinois Emergency Medical Services for Children www.luhs.org/emsc Illinois Emergency Medical Services for Children TABLE OF CONTENTS
Rebecca Szymkowski, P.E., PTOE Wisconsin Department of Transportation. ITE Midwestern District Annual Meeting June 30, 2015
 Rebecca Szymkowski, P.E., PTOE Wisconsin Department of Transportation ITE Midwestern District Annual Meeting June 30, 2015 Strategic Highway Safety Plan (SHSP) Roundabout Safety Analysis J-turn Experiences
KANSAS STRATEGIC HIGHWAY SAFETY PLAN
 KANSAS STRATEGIC HIGHWAY SAFETY PLAN 214 Annual Dashboard Report Preliminary Statewide Fatality Analysis The accident data herein, as of February 19, 215, reflect the reporting officer s observations and
2012 QUICK FACTS ILLINOIS CRASH INFORMATION. Illinois Emergency Medical Services for Children September 2014 Edition
 2012 QUICK FACTS ILLINOIS CRASH INFORMATION September 2014 Edition Illinois Emergency Medical Services for Children www.luhs.org/emsc Illinois Emergency Medical Services for Children TABLE OF CONTENTS
Arvada Traffic Engineering DiExSys Roadway Safety Systems Detailed Summary of Crashes Report
 79983 Location: 7A Begin:.87 End:.9 From:// To:/3/ Severity PDO: 8 INJ: FAT: Number of Vehicles Location One Vehicle: 8 Two Vehicles: Three or More: On Road: 77 Off Road Left: 3 Off Road Right: Off Road
Memorandum. TO: Town of Lysander Comprehensive Plan Update Committee
 Memorandum TO: Town of Lysander Comprehensive Plan Update Committee FROM: Meghan Vitale, SMTC DATE: January 7, 2015 RE: Accident data analysis () ~~~~~~~~~~~~~~~~~~~~~~~~~~~~~~~~~~~~~~~~~~~~~~~~~~~~~~~~~~~~~~~~~~
FINAL DESIGN TRAFFIC TECHNICAL MEMORANDUM
 FINAL DESIGN TRAFFIC TECHNICAL MEMORANDUM July 2014 FINAL (SR 43) Project Development and Environment Study From State Road 60 (Adamo Drive) to I-4 (SR 400) Hillsborough County, Florida Work Program Item
PEDESTRIAN/BICYCLIST CRASH ANALYSIS 2015
 PEDESTRIAN/BICYCLIST CRASH ANALYSIS 2015 Central Arkansas Regional Transportation Study Table of Contents Executive Summary... 3 CARTS Pedestrian/Bicycle Crash Analysis... 3 Report Format... 3 Results...
North Carolina. Bicycle Crash Facts Prepared for
 North Carolina Bicycle Crash Facts 2006-2010 Prepared for The North Carolina Department of Transportation Division of Bicycle and Pedestrian Transportation Prepared by The University of North Carolina
For Information Only. Pedestrian Collisions (2011 to 2015) Resolution. Presented: Monday, Apr 18, Report Date Tuesday, Apr 05, 2016
 Resolution. Presented: Monday, Apr 18, Report Date Tuesday, Apr 05, 2016") Presented To: Operations Committee For Information Only Pedestrian Collisions (0 to 0) Presented: Monday, Apr 8, 06 Report Date Tuesday, Apr 0, 06 Type: Correspondence for Information Only Resolution For
Presented To: Operations Committee For Information Only Pedestrian Collisions (0 to 0) Presented: Monday, Apr 8, 06 Report Date Tuesday, Apr 0, 06 Type: Correspondence for Information Only Resolution For
Bicycle - Motor Vehicle Collisions on Controlled Access Highways in Arizona
 Bicycle - Motor Vehicle Collisions on Controlled Access Highways in Arizona Analysis from January 1, 1991 to June 30, 2002 Richard C. Moeur, PE Traffic Design Manager, Northern Region Michelle N. Bina
Mission: The mission of FARS is to make vehicle crash information accessible and useful so that traffic safety can be improved
 Mission: The mission of FARS is to make vehicle crash information accessible and useful so that traffic safety can be improved NHTSA created FARS in 1975 National Center for Statistics and Analysis (NCSA)
Lake Zurich Police Department Traffic Safety Division 200 Mohawk Trail Lake Zurich, IL 60047
 Lake Zurich Police Department Traffic Safety Division 200 Mohawk Trail Lake Zurich, IL 60047 Telephone (847) 719-1690 Fax (847) 719-1691 January 15, 2015 This report is being submitted regarding the implementation
the Ministry of Transport is attributed as the source of the material
 Cyclists 2015 Disclaimer All reasonable endeavours are made to ensure the accuracy of the information in this report. However, the information is provided without warranties of any kind including accuracy,
Effects of Traffic Signal Retiming on Safety. Peter J. Yauch, P.E., PTOE Program Manager, TSM&O Albeck Gerken, Inc.
 Effects of Traffic Signal Retiming on Safety Peter J. Yauch, P.E., PTOE Program Manager, TSM&O Albeck Gerken, Inc. Introduction It has long been recognized that traffic signal timing can have an impact
Chapter 5 DATA COLLECTION FOR TRANSPORTATION SAFETY STUDIES
 Chapter 5 DATA COLLECTION FOR TRANSPORTATION SAFETY STUDIES 5.1 PURPOSE (1) The purpose of the Traffic Safety Studies chapter is to provide guidance on the data collection requirements for conducting a
Keep Customers and Ourselves Safe. Mark Shelton, District Engineer. Tracker. Measures of Departmental Performance
 Keep Customers and Ourselves Safe Mark Shelton, District Engineer Tracker Measures of Departmental Performance Safety is a daily commitment for all MoDOT employees. From design and construction to operations
4.0 Recommended Transportation Plan
 4.0 Recommended Transportation Plan The Town wants to provide a multi modal transportation system for its residents in order to provide them with options when making trips. The automobile has always been
Draft Report: Traffic Crashes in the Denver Region
 Click to edit Master title style Click to edit Master title style Draft Report: Traffic Crashes in the Denver Region Presented by: Steve Cook Board Nov. 16, 2016 Click Report Click to to edit on edit Master
Maine Department Of Transportation - Traffic Engineering, Crash Records Section Crash Summary Report Report Selections and Input Parameters
 Maine Department Of Transportation - Traffic Engineering, Crash Records Section Crash Summary Report Report Selections and Input Parameters REPORT SELECTIONS Crash Summary I - Single Node REPORT DESCRIPTION
Enclosure 1. Crimson Drive Traffic Safety and Calming Review Report
 Enclosure 1 Crimson Drive Traffic Safety and Calming Review Report Prepared by: Tahir Hameed, P.Eng. Traffic Safety Engineer Planning Engineering and Safety Transportation Planning and Engineering Date:
Lessons Learned from the Minnesota County Road Safety Plans. Richard Storm CH2M HILL
 Lessons Learned from the Minnesota County Road Safety Plans Richard Storm CH2M HILL May 21, 2014 Overview of the MN CRSP: Why Prepare Safety Plans for Local Systems? MAP-21: Requires states to address
Officer Safety Webinar
 Officer Safety Webinar Hosted by: December 8, 2015 Start time: 9:30 AM (MST) 11:30 AM (EST) 1 About Laser Technology, Inc. 1 st proximity laser for NASA missions 1 st commercial speed laser 1 st recreational
Most Dangerous Roads for Walking And How States Can Make them Safer. Route 110, Long Island, New York Image by Dougtone
 Most Dangerous Roads for Walking And How States Can Make them Safer Route 110, Long Island, New York Image by Dougtone Tri-State Transportation Campaign February 2013 Introduction Key Findings More than
Evaluation of M-99 (Broad Street) Road Diet and Intersection Operational Investigation
 Road Diet and Intersection Operational Investigation") Evaluation of M-99 (Broad Street) Road Diet and Intersection Operational Investigation City of Hillsdale, Hillsdale County, Michigan June 16, 2016 Final Report Prepared for City of Hillsdale 97 North Broad
Evaluation of M-99 (Broad Street) Road Diet and Intersection Operational Investigation City of Hillsdale, Hillsdale County, Michigan June 16, 2016 Final Report Prepared for City of Hillsdale 97 North Broad
Louisiana Traffic Records Data Report 2017
 Louisiana Traffic Records Data Report 2017 crashdata.lsu.edu Dr. Helmut Schneider September 2018 Overview Trends in crashes, fatalities & injuries Findings from the Occupant Protection Survey of 2018 Driving
8. Collisions INTRODUCTION
 8. Collisions INTRODUCTION While traffic collisions can affect anyone, they have a disproportionate impact on bicyclists, who along with pedestrians are the most vulnerable users of the transportation
LINCOLNWOOD POLICE DEPARTMENT
 LINCOLNWOOD POLICE DEPARTMENT 6900 N. Lincoln Avenue, Lincolnwood, IL 60712 (847) 673-2167 Robert LaMantia Chief of Police September 19, 2017 Illinois Department of Transportation Traffic Operations Bureau
4.0 Recommended Transportation Plan
 4.0 Recommended Transportation Plan The Town wants to provide a multi modal transportation system for its residents in order to provide them with options when making trips. The automobile has always been
Figure 1. Indiana fatal collisions by young driver involvement,
 INDIANA TRAFFIC SAFETY FACTS YOUNG DRIVERS 2016 MAY 2017 ISSUE 17-C06 IN 2016: In 2016, 13.4 percent of all drivers involved in Indiana collisions were young drivers. Young drivers were involved in 105
Report on Traffic Crashes in the Denver Region
 Denver Regional Council of Governments Report on Traffic Crashes in the Denver Region REVIEW DRAFT October 2016 1290 Broadway Denver, CO 80203 www.drcog.org Table of Contents 1. Introduction... 1 A. Background
4/27/2016. Introduction
 EVALUATING THE SAFETY EFFECTS OF INTERSECTION SAFETY DEVICES AND MOBILE PHOTO ENFORCEMENT AT THE CITY OF EDMONTON Karim El Basyouny PhD., Laura Contini M.Sc. & Ran Li, M.Sc. City of Edmonton Office of
Analysis of the Red Light Camera Program in Garden Grove, CA By Jay Beeber, Executive Director, Safer Streets L.A., Member ITE
 Analysis of the Red Light Camera Program in Garden Grove, CA By Jay Beeber, Executive Director, Safer Streets L.A., Member ITE The following report is a detailed discussion of the Red Light Camera (RLC)
VDOT Crash Analysis Procedures for Roadway Safety Assessments
 Crash analysis is a critical component of road safety analysis. The crash analysis procedures defined in this document will help: Identify where to target resources for detailed crash analysis Assess the
Walking in Traffic Violence. The pervasiveness of motor vehicle crashes with pedestrians in New York City
 Walking in Traffic Violence The pervasiveness of motor vehicle crashes with pedestrians in New York City 2 Walking in Traffic Violence New York City is a walking and public transit city. We are proud of
Transportation and Public Works Annual Motor Vehicle Collision Report
 Transportation and Public Works 22 Annual Motor Vehicle Collision Report Table of Contents Table of Contents.. 2 Introduction.. 3 22 Collision Summary. 4 Demographics 5 Collisions by Severity.. 5 Personal
Pinellas County Metropolitan Planning Organization (MPO) 2014 Crash Data Report
 2014 Crash Data Report") Pinellas County Metropolitan Planning Organization (MPO) 2014 Crash Data Report MPO Board July 8, 2015 2 Crash Data Collection Motorcycle drove between stopped cars, ran a red light and collided with a
Pinellas County Metropolitan Planning Organization (MPO) 2014 Crash Data Report MPO Board July 8, 2015 2 Crash Data Collection Motorcycle drove between stopped cars, ran a red light and collided with a
Napier City road trauma for Napier City. Road casualties Estimated social cost of crashes* Major road safety issues.
 ISSN 1176-841X July 25 Land Transport New Zealand has prepared this road safety issues report. It is based on reported crash data and trends for the 2 24 period. The intent of the report is to highlight
DRAFT BUENA VISTA 2020 TRANSPORTATION PLAN
 DRAFT BUENA VISTA 2020 TRANSPORTATION PLAN DEVELOPED BY THE TRANSPORTATION PLANNING DIVISION OF THE VIRGINIA DEPARTMENT OF TRANSPORTATION IN COOPERATION WITH THE U.S. DEPARTMENT OF TRANSPORTATION, FEDERAL
Safer Cycling: How the City of Vancouver is Proactively Improving Cycling Safety
 Safer Cycling: How the City of Vancouver is Proactively Improving Cycling Safety Brian Patterson, MCIP, RPP Urban Systems 2015 Canadian Association of Road Safety Professionals (CARSP) Conference Session
MONTCLAIR TOWNSHIP PEDESTRIAN SAFETY COMMITTEE
 + MONTCLAIR TOWNSHIP PEDESTRIAN SAFETY COMMITTEE + PEDESTRIAN SAFETY COMMITTEE CURRENT MISSION: The Committee was formed in 2013 to call attention to and eliminate unsafe conditions on Montclair streets
CDRT. Child Death Review Team Dallas County. Brief Report Traffic-related Child Deaths OVERVIEW
 Dallas County CDRT Child Death Review Team 2013 Brief Report Traffic-related Child Deaths 2006-2011 OVERVIEW In Dallas County, traffic-related injury death rates among children are typically less than
REPORT ON TRAFFIC CRASHES IN THE DENVER REGION
 REPORT ON TRAFFIC CRASHES IN THE DENVER REGION March 2017 This report and other documents are available at the DRCOG website: www.drcog.org. Visit these agency websites for more information: Colorado Department
Appendix A: Safety Assessment
 Appendix A: Safety Assessment Safety Assessment Appendix A A Statement of Philosophy The efficient and responsible investment of resources in addressing safety problems is a difficult task. Since crashes
Introduction to Highway Safety Course
 Introduction to Highway Safety Course Introduction to Crash Analysis Prepared by Robert K. Seyfried, PE, PTOE Northwestern University Center for Public Safety Introduction to Highway Safety Series Course
Pedestrian and Bicycle Crashes
 Pedestrian and Bicycle Crashes Pedestrian and Bicycles Overview Pedestrian-related crashes represent 3.6% of the total reported traffic crashes; however, they account for 11.1% of all traffic crash deaths.
Appendix B. Summary of Public Comments Tri County Health Department Comments
 Appendix B Summary of Public Comments Tri County Health Department Comments PUBLIC COMMENTS RECEIVED AT THE OPEN HOUSES HELD ON NOVEMBER 17, 2010, NOVEMBER 18, 2010 AND NOVEMBER 22, 2010, AND FROM THE
CITY OF JANESVILLE TRANSPORTATION COMMITTEE 8 NOVEMBER 2017
 CITY OF JANESVILLE TRANSPORTATION COMMITTEE 8 NOVEMBER 2017 C. STOP SIGNS/YIELD SIGNS 1. EASTWOOD AVENUE & S FREMONT STREET REQUESTOR: ADDRESS: REQUEST: Kevin Schafer 56 S Fremont Street I am deciding
Introduction 4/28/ th International Conference on Urban Traffic Safety April 25-28, 2016 EDMONTON, ALBERTA, CANADA
 4/28/2016 EVALUATING THE SAFETY EFFECTS OF INTERSECTION SAFETY DEVICES AND MOBILE PHOTO ENFORCEMENT AT THE CITY OF EDMONTON Karim El Basyouny PhD., Laura Contini M.Sc. & Ran Li, M.Sc. City of Edmonton
BICYCLE SAFETY OBSERVATION STUDY 2014
 County of Santa Cruz Health Services Agency BICYCLE SAFETY OBSERVATION STUDY BACKGROUND AND PURPOSE The County of Santa Cruz Health Services Agency (HSA) in conjunction with the Community Safety Coalition
Safety Effectiveness of Pedestrian Crossing Treatments
 Portland State University PDXScholar TREC Friday Seminar Series Transportation Research and Education Center (TREC) 10-13-2017 Safety Effectiveness of Pedestrian Crossing Treatments Christopher Monsere
Officer Safety on our Roadways
 Lifesavers 30th National Conference on Highway Safety Priorities Officer Safety on our Roadways June 15, 2012 Craig W. Floyd Chairman & CEO National Law Enforcement Officers Memorial Fund Memorial Fund
MEMORANDUM. DATE March 1, 2012 TO Town of Milton Mark Abbott, Seth Asante, and Efi Pagitsas Boston Region MPO Staff
 MEMORANDUM DATE March 1, 212 TO Town of Milton FROM RE Mark Abbott, Seth Asante, and Efi Pagitsas Boston Region MPO Staff FFY 211 Safety and Operations Analyses at Selected Boston Region MPO Intersections:
Selected Intersection Crash Analysis for Prepared by: Rita Morocoima-Black Susan Chavarría Lucas Cruse
 Selected Intersection Crash Analysis for 1993-1998 Prepared by: Rita Morocoima-Black Susan Chavarría Lucas Cruse Champaign-Urbana Urbanized Area Transportation Study (CUUATS) July 16, 2001 Table of Contents
REVIEW OF LOCAL TRAFFIC FLOW / LONG RANGE PLANNING SOLUTIONS STUDY
 ITEM Town of Atherton TRANSPORTATION COMMITTEE STAFF REPORT TO: FROM: MEMBERS OF THE COMMITTEE ROBERT OVADIA, PUBLIC WORKS DIRECTOR DATE: FEBRUARY 12, 2019 SUBJECT: REVIEW OF LOCAL TRAFFIC FLOW / LONG
Traffic Safety Plan Traffic Safety Plan 2015
 Traffic Safety Plan 2015 Purpose Airdrie s last Traffic Safety Plan was created in 2011. The 2015 Traffic Safety Plan is a revised model of the traffic operations for the City of Airdrie. The purpose of
Road Safety Annual Report 2016 OECD/ITF Chapter 26. Morocco
 Road Safety Annual Report 2016 OECD/ITF 2016 Chapter 26 Morocco This chapter presents 2014 road safety data for Morocco along with provisional data from 2015. It looks at trends in traffic and road safety
Part 1 Road Transport
 Part 1 Road Transport Chapter 1 Road Traffic Accident Trends I Outline of Present Situation Title 1 Land Transport 1 Long-Term Transition of Road Traffic Accidents Traffic fatalities are reduced in 1 consecutive
Integrating Safety into the Transportation Decision Making Process
 Wednesday, February 17th, 2016 Integrating Safety into the Transportation Decision Making Process Priscilla Tobias, PE State Safety Engineer Illinois Department of Transportation Increased Focus of Safety
PEDESTRIAN/BICYCLE CRASH STUDY
 PEDESTRIAN/BICYCLE CRASH STUDY This report summarizes an analysis of pedestrian and bicycle crashes that has been conducted by the CRCOG staff. In 2004, CRCOG completed a study of pedestrian crash data
TRAFFIC CRASHES involving BICYCLISTS
 The Office of the Chief of Police in Berlin BERLIN TRAFFIC CRASHES involving BICYCLISTS A special research project concerning bicycle crashes in West Berlin in the years 1981 through 1985 Police Analyst
Traffic Safety Study Report City Wide Intersection Study City of Coconut Creek Broward County, Florida
 EXHIBIT "A" Traffic Safety Study Report City Wide Intersection Study City of Coconut Creek Broward County, Florida Prepared by: June 8, 2017 Revised January 18, 2018 TABLE OF CONTENTS 1. Introduction...
road safety issues 2001 road toll for Gisborne district July 2002 Road user casualties Estimated social cost of crashes*
 GISBORNE DISTRICT road safety issues July 22 The Land Transport Safety Authority (LTSA) has prepared this Road Safety Issues Report. It is based on reported crash data and trends for the 1997 21 period.
City of Toronto Pedestrian Collision Study. Transportation Services Division Traffic Data Centre and Safety Bureau
 City of Toronto Pedestrian Collision Study Transportation Services Division Traffic Data Centre and Safety Bureau January 2007 EXECUTIVE SUMMARY Pedestrian safety is a primary concern for the city of
HSIP Project Selection Criteria
 HSIP Project Selection Criteria The purpose of the Highway Safety Improvement Program (HSIP) is to reduce the number of fatal and injury crashes by targeting high crash locations and causes. Projects,
Per the Illinois Compiled Statutes, 625 ILCS 5/ Automated Traffic Law Enforcement System:
 Per the Illinois Compiled Statutes, 625 ILCS 5/11-208.6 Automated Traffic Law Enforcement System: (k-7) A municipality or county operating an automated traffic law enforcement system shall conduct a statistical
Purdue Road Show IN-TIME Executive Session March 8, 2016
 Purdue Road Show IN-TIME Executive Session March 8, 2016 Sources of Congestion Traffic Congestion and Reliability. FHWA (September 2005) Traffic Congestion and Reliability. FHWA (September 2005) 2 Secondary
Per the Illinois Compiled Statutes, 625 ILCS 5/ Automated Traffic Law Enforcement System:
 Per the Illinois Compiled Statutes, 625 ILCS 5/11-208.6 Automated Traffic Law Enforcement System: (k-7) A municipality or county operating an automated traffic law enforcement system shall conduct a statistical
SPEED MANAGEMENT FOR VISION ZERO
 SPEED MANAGEMENT FOR VISION ZERO LUANN HAMILTON, DEPUTY COMMISSIONER FOR PROJECT DEVELOPMENT CHICAGO DEPARTMENT OF TRANSPORTATION NACTO DESIGNING CITIES 2017 Vision Zero Action Plan Speed management and
Deaths/injuries in motor vehicle crashes per million hours spent travelling, July 2007 June 2011 (All ages) Mode of travel
 Mode of travel") Cyclists CRASH STATISTICS FOR THE YEAR ENDED 31 DECEMBER 211 Prepared by the Ministry of Transport CRASH FACTSHEET 212 Cyclists have a number of risk factors that do not affect car drivers. The main risk
Cyclists CRASH STATISTICS FOR THE YEAR ENDED 31 DECEMBER 211 Prepared by the Ministry of Transport CRASH FACTSHEET 212 Cyclists have a number of risk factors that do not affect car drivers. The main risk
Texas Strategic Highway Safety Plan Update. 2 nd Emphasis Area Team Meeting Older Road Users 3/7/2017 Austin, TX
 Texas Strategic Highway Safety Plan Update 2 nd Emphasis Area Team Meeting Older Road Users 3/7/2017 Austin, TX Agenda Welcome and introductions (roll call) Review revised strategies Review new data runs
A review of 2015 fatal collision statistics as of 31 December 2015
 A review of fatal collision statistics as of 31 December This report summarises the main trends in road fatalities that have emerged in. This has been prepared by the Road Safety Authority following analysis
Military Road Safety Improvements
 Military Road Safety Improvements 26 th Road North to 31 st Street North SUMMARY OF DATA REVIEW AND PRELIMINARY RECOMMENDATIONS Prepared for: Department of Environmental Services Traffic Engineering and
Analyses and statistics on the frequency and the incidence of traffic accidents within Dolj County
 UNIVERSITY OF PITESTI SCIENTIFIC BULLETIN Faculty of Mechanics and Technology AUTOMOTIVE series, year XXIV, no. 28 Analyses and statistics on the frequency and the incidence of traffic accidents within
Per the Illinois Compiled Statutes, 625 ILCS 5/ Automated Traffic Law Enforcement System:
 Per the Illinois Compiled Statutes, 625 ILCS 5/11-208.6 Automated Traffic Law Enforcement System: (k-7) A municipality or county operating an automated traffic law enforcement system shall conduct a statistical