REPORT ON TRAFFIC CRASHES IN THE DENVER REGION
|
|
|
- Dwain Blankenship
- 6 years ago
- Views:
Transcription


1 REPORT ON TRAFFIC CRASHES IN THE DENVER REGION March 2017
2 This report and other documents are available at the DRCOG website: Visit these agency websites for more information: Colorado Department of Transportation National Highway Traffic Safety Administration Fatality Analysis Reporting System www-fars.nhtsa.dot.gov Preparation of this report has been financed in part through grants from the U.S. Department of Transportation, Federal Highway Administration and Federal Transit Administration.
3 Contents 1. Introduction 5 A. Background and Purpose 5 B. Summary of Key Results 6 C. Notes on Crash Data 6 2. Denver Region Crash Data 7 A. Traffic Fatality Trends 7 B. Serious Injury Trends 10 C. Total Traffic Crash Trends Demographics of People Involved in Crashes Crash Characteristics 13 A. Crash Types 13 B. Crash Conditions 13 C. Crash Causes Specific Crash Types 16 A. Truck-Related Crashes 16 B. Motorcycle-Related Crashes 19 C. Pedestrian-Related Crashes 21 D. Bicycle-Related Crashes 25 E. Construction Zone Crashes 30 F. Wildlife-Related Collisions High Risk Behavior Crashes 34 A. Impaired Driving 34 B. Speeding 37 C. Red-Light Running Identification of High Crash Locations 42 A. Freeway Segment Crashes Safety Efforts 45 A. Engineering Safer Roadways 45 B. Emergency Response and Crash Clearance 45 C. Move-Over Law 46 Table of Contents 3
4 List of Tables Table 1. Crash Types ( ) 13 Table 2. Prevailing Conditions at Time of Crash ( ) 13 Table 3. Causes of Traffic Crashes by Driver Vehicle Action ( ) 14 Table 4. Traffic Crashes Involving Other Human Factors ( ) 15 Table 5. Truck Crash Characteristics ( ) 16 Table 6. Motorcycle Fatality Rate in the Denver Region ( ) 21 Table 7. Age of Pedestrians in Traffic Crashes ( ) 22 Table 8. Pedestrian Crash Characteristics ( ) 23 Table 9. Age of Bicyclists in Traffic Crashes ( ) 26 Table 10. Bicycle Crash Characteristics ( ) 27 Table 11. Impaired Driving Crashes by Time of Day ( ) 35 List of Figures Figure 1. Annual Traffic Fatalities and Fatal Crash Rate in the Denver Region ( ) Figure 2. Fatal Crash Events (2013) 9 Figure 3. Serious Injuries and Injury Crash Rate in the Denver Region ( ) 10 Figure 4. Total Crashes and Crash Rate in the Denver Region ( ) 11 Figure 5. Drivers Involved in Fatal and Serious Injury Crashes by Age and Gender ( ) Figure 6. Colorado Fatal Truck Crashes by Truck Type ( ) 16 Figure 7. Crash Events Involving Trucks (2013) 18 Figure 8. Motorcycle Fatalities in the Denver Region ( ) 19 Figure 9. Crash Events Involving Motorcycles (2013) 20 Figure 10. Pedestrian Fatalities in the Denver Region ( ) 21 Figure 11. Crash Events Involving Pedestrians (2013) 24 Figure 12. Bicyclist Fatalities in the Denver Region ( ) 26 Figure 13. Crash Events Involving Bicyclists (2013) 29 Figure 14. Construction Zone Crashes in the Denver Region ( ) 30 Figure 15. Wildlife-Vehicle Collisions in the Denver Region ( ) 31 Figure 16. Crash Events Involving Wildlife (2013) 32 Figure 17. Impaired Driving Fatalities in the Denver Region ( ) 34 Figure 18. Impaired Drivers by Age Group Resulting in Fatalities ( ) 35 Figure 19. Crash Events Involving Impaired Driving (2013) 36 Figure 20. Age of Driver in Speeding-Related Fatalities ( ) 37 Figure 21. Speeding-related Fatalities by Facility Type ( ) 38 Figure 22. Crash Events Involving Speeding (2013) 39 Figure 23. Crash Events Involving Red-Light Running (2013) 41 Figure 24. Safety Performance Function-Urban Six-Lane Freeways 42 Figure 25. Freeway Segment Level of Service of Safety ( ) Table of Contents
5 INTRODUCTION 1 A. Background and Purpose Traffic crashes represent a major concern to all who use roadways drivers, pedestrians, bicyclists and transit riders. Crashes are also of interest to municipal leaders and planners, who work to minimize them. In 2015, more than 38,000 people died on our nation s roadways. Every day in the Denver region, there are about 220 reported traffic crashes. The crashes result in about five seriously injured individuals per day and four traffic fatalities per week, but such statistics only hint at the tragedy experienced by individuals, families and communities. These crashes incur large costs including property damage, medical expenses, lost productivity, excess traffic congestion and the pain and suffering associated with an injury or fatal crash. The purpose of this report is to raise awareness of traffic safety issues among planners, engineers, elected officials, and the general public within the Denver region. The crash data presented in this report will also help DRCOG develop longrange goals and targets. Extensive information is provided on many different types of crashes, causes and characteristics. Techniques to help reduce crashes are also presented in applicable sections. This report is divided into the following seven sections: regional traffic crash trends crash demographics crash characteristics (for example, crash causes and time of day) specific crash types (for example, bicycle and pedestrian crashes) high-risk behavior crashes locations of crashes other safety efforts Introduction 5
6 B. Summary of Key Results Some of the key findings of safety conditions in the Denver region are as follows: The overall crash rate decreased between 2001 and The number of annual traffic fatalities in the region has increased since Although the number of annual traffic fatalities decreased between 2001 and 2009, the number of annual fatalities has since increased 49 percent. Young male drivers are involved in more crashes. Young male drivers between the ages of 15 and 34 are involved in disproportionately more crashes in particular, fatal crashes. Pedestrians are particularly vulnerable transportation system users. Between 2011 and 2013, pedestrians accounted for 22 percent of traffic fatalities. Motorcyclists make up an increasing proportion of all traffic fatalities. Motorcyclists made up 14 percent of traffic fatalities in 2000, increasing to 23 percent in Many crashes are preventable. CDOT estimates 85 percent of crashes are due to improper driver behavior, while only 15 percent of crashes occur due to conditions beyond the driver s control. However, transportation safety is multidisciplinary in nature, and involves the effort of many entities, including all roadway users, educators, law enforcement, tow truck operations, emergency medical response professionals and government agencies. DRCOG will collaborate with CDOT on incident management, crash analysis, data reporting and other efforts. Assistance will be provided to local governments regarding traffic safety problems and the identification of safety improvement projects. DRCOG will further evaluate methods for incorporating safety into the project evaluation and selection policies for the Transportation Improvement Program. C. Notes on Crash Data Crash data is not perfect, as field reports may not contain complete information. The majority of the detailed crash data used in this report reflects the latest data available (through 2013) from the Colorado Department of Transportation (CDOT) 1. Fatal crash data is presented through 2015, as it must be immediately reported to the National Highway Traffic Safety Administration (NHTSA) 2. NHTSA then presents data annually through the Fatality Analysis Reporting System 3. 6 Introduction
7 DENVER REGION CRASH DATA 2 A. Traffic Fatality Trends The number of annual traffic fatalities in the Denver region reached a three-decade low in Between 2001 and 2009, the number of traffic fatalities decreased by 44 percent (285 to 160). Since 2009, however, annual fatalities have increased 49 percent (160 to 238 in 2015). Another way of presenting crash information is by the rate of crashes per amount of miles that vehicles are driven. The amount of driving is usually defined as vehicle miles of travel or VMT. For example, on Denver regional roadways in 2015: Motor vehicles were driven over 25 billion VMT (78 million per weekday). Dividing the 238 fatalities into 26 billion results in a rate of 0.91 fatalities per 100 million VMT. The chart below shows the number of traffic fatalities and the fatal crash rate per 100 million VMT from 1980 to The fatality rate has decreased from 2.75 to 0.91 during the last 35 years, though there has been a slight increase since Figure 1. Annual Traffic Fatalities and Fatal Crash Rate in the Denver Region ( ) Fatalities Rate Fatalities Fatalities per 100 million VMT Denver Region Crash Data 7

8 Regardless of what the data show, one traffic fatality is one too many, even if a fatality occurs only once every 125 million vehicle miles traveled. A new initiative, known as Toward Zero Deaths, was established by the United States Department of Transportation 4 in The initiative has been embraced by the Colorado Department of Transportation (CDOT) and will be incorporated into DRCOG s Metro Vision Regional Transportation Plan A third way of presenting traffi c fatality data is in a public health perspective. For the Denver region, in 2015 there were 6.8 fatalities per 100,000 people in the Denver region. The seriousness of the traffi c safety issue is comparable to other public health issues. Several factors have contributed to the reduction of the traffi c fatality rate during the past 35 years. Improvements in vehicle safety design (for example, the increased prevalence of front and side airbags) and phasing out older vehicles have played a critical role, as has increased seat belt use. According to CDOT, overall seat belt use in Colorado rose from 50 percent in 1990 to 82 percent in Education and enforcement efforts have drastically reduced the occurrence of impaired-driving fatal crashes. In the Denver region, impaired-driving fatalities dropped by 62 percent between 2004 and 2013 (from 111 to 42 fatalities). Improvements in emergency response and medical care technology, as well as better designed roadways and safety features, have also helped to reduce traffi c fatalities. However, preliminary data for 2015 and 2016 indicate impaired-driving fatalities are increasing. Figure 2 shows a map of fatal crash locations in Traffi c fatalities occur throughout the region and on all roadway facility types. In 2013, 26 percent of fatal crashes occurred on freeway facilities and 74 percent along streets or at intersections. Later sections of this report will provide further detail on certain types of fatal crashes, such as those associated with pedestrians, bicyclists, motorcyclists, trucks and construction zones. 8 Denver Region Crash Data
")
9 Figure 2. Fatal Crash Events (2013) Denver Region Crash Data 9
10 B. Serious Injury Trends The number of people seriously injured in traffic crashes has fluctuated, ranging from 1,600 to 1,940 injuries per year between 2006 and The rate of injuries was dropping through 2010, but has since been on the rise. Figure 3. Serious Injuries and Injury Crash Rate in the Denver Region ( ) 2, , Serious injuries 1, , Rate Serious injuries Serious injury crashes per 100 million VMT C. Total Traffic Crash Trends The number of reported crashes in the region increased from about 50,000 in 1991 to about 80,000 in The increase was likely due primarily to the rapid growth in VMT. The number of reported crashes decreased to approximately 60,000 by 2012, but increased to approximately 64,000 in Specific reasons for the fluctuation are not easy to define. As shown in the chart below, the crash rate per 100 million VMT increased just slightly from 1991 to 2001, but has declined since. The overall crash data shown in this report does not include unreported traffic crashes. NHTSA estimates that about half of all crashes are reported to the authorities. 10 Denver Region Crash Data
11 Figure 4. Total Crashes and Crash Rate in the Denver Region ( ) 90,000 80, , , Crashes 50, , , Rate 20,000 10, Total crashes Crashes per 100 million VMT Denver Region Crash Data 11
12 3 DEMOGRAPHICS OF PEOPLE INVOLVED IN CRASHES Crashes were analyzed by the age and gender of the people involved. The term involvement in a crash does not imply the person was at fault. Figure 5 shows crash involvement statistics by age and gender based on data from 2011 to Figure 5. Drivers Involved in Fatal and Serious Injury Crashes by Age and Gender ( ) 16% 14% 12% 10% 8% 6% 4% 2% Plus Males Females 62% of individuals involved in fatal crashes were male. This value is almost twice that of females. Young male drivers between the ages of 15 and 34 are involved in disproportionately more crashes in particular, fatal crashes. One in every fi ve licensed 16-year-olds was involved in a crash, according to Drive Smart Colorado. Teen drivers are a high-risk crash demographic primarily because they lack driving experience. Motor vehicle crashes are a leading cause of death for 15- to 20-year-olds, according to the National Center for Health Statistics. Several efforts have been made in Colorado to reduce teen involvement in crashes. Graduated drivers license laws restricting the number of occupants in the vehicle of a young driver were initiated in Laws also prohibit mobile phone use by drivers younger than 18. New vehicle technologies have also been introduced to improve safety for all drivers (including youth), such as stereo disabling if seat belts are not fastened. Although statistics do not indicate a disproportionately high number of crashes among older adults (age 65-plus), there are specifi c concerns for this rapidly growing population group. Many concerns can be addressed through roadway engineering actions such as clearer pavement markings, larger text size on signs, and improved pedestrian crossings. New vehicle safety features such as driver alerts, automated braking, and run-off-road prevention may also help improve safety among older drivers. 12 Demographics of People Involved in Crashes
13 CRASH CHARACTERISTICS 4 A. Crash Types Table 1 shows the distribution of crash types. The majority of crashes (68 percent) occur between two or more moving motor vehicles. About 17 percent of crashes involve a fi xed object. Among crashes occurring between moving motor vehicles, about half are rear-end collisions and 26 percent are broadside collisions (a front-toside impact). Table 1. Crash Types ( ) Crash type Percent of crashes Moving motor vehicle 67.6 Fixed object (for example, light pole) 17.3 Parked vehicle, train or bicycle 8.6 Rollover or non-collision 4.1 Pedestrian 1.3 Animal 1.0 Total Collisions between moving vehicles Percent of crashes Front-to-rear 52.3 Front-to-side 25.9 Sideswipe in the same direction 14.2 Front-to-front 5.3 Sideswipe in the opposite direction 1.1 Rear-to-side or rear-to-rear 1.2 Total B. Crash Conditions Table 2 shows the lighting and road surface conditions during crashes. The majority of crashes occur during daylight. Fatalities during dark and twilight hours occur at a much higher proportion than the share of travel (VMT) occurring at these times. It should be noted many snow crashes go unreported. Lighting Table 2. Prevailing Conditions at Time of Crash ( ) Percent of crashes Percent of fatalities Percent of VMT Daylight Dark, dawn or dusk Total HALF of all crashes between moving vehicles are rear-end collisions. Following too closely and inattentiveness are the primary reasons for rear-end collisions. Crash Characteristics 13
14 Road condition Percent of crashes Percent of fatalities Dry Wet Snow, ice, slush Foreign materials, debris Total C. Crash Causes 38% of all traffi c crashes are attributed to careless driving. Table 3 and Table 4 show the contributing causes of traffi c crashes, based on the responding law enforcement offi cer s report. A specifi c driver action with the vehicle was indicated in about 85 percent of the 182,700 crashes in Careless driving was the most common driver vehicle action, with following too closely the next most common. Other human factors contributing to the driver s specifi c vehicle action are summarized in Table 4. Distracted driving was the most common humancontributing factor. Table 3. Causes of Traffic Crashes by Driver Vehicle Action ( ) Driver vehicle action Individuals Percent of total Careless driving 59, Follow too close 28, Fail to yield to right-of-way at stop sign 22, Lane violation 13, Exceeded safe/posted speed 9, Failed to stop at signal 7, Improper backing 4, Improper turn 3, Disregard stop sign 2, Reckless driving 2, Turning from wrong lane or position 1, All other driver actions 2, Total for crashes with driver action noted 156, Crash Characteristics
15 Table 4. Traffic Crashes Involving Other Human Factors ( ) Other human factors Individuals Percent of total Distracted driving 25, Driver inexperience 16, Aggressive driving 10, DUI, Driving While Ability Impaired, or Driving 9, Under Influence of Drugs Driver unfamiliar with area 5, Illness/medical 1, Asleep at wheel 1, Driver fatigue 1, All other human factors 25, Total for crashes with other human factors 98, Crash Characteristics 15
.")
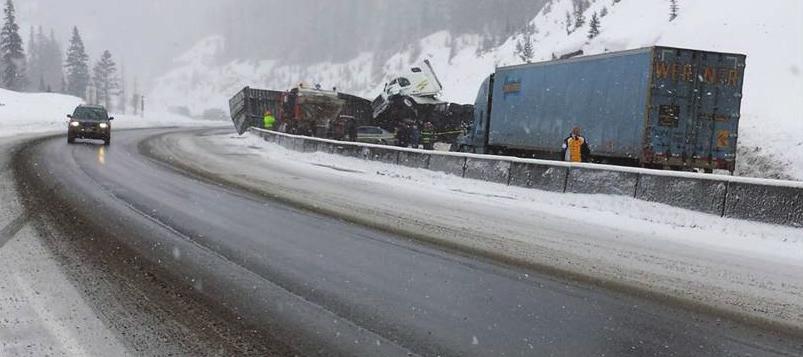
16 5 SPECIFIC CRASH TYPES A. Truck-Related Crashes Heavy trucks are an important consideration in traffi c safety because of their proportionally greater negative effects per crash (injuries, fatalities, congestion). Trucks also have specifi c maneuverability and visual considerations in relation to roadway design and other road users. The CDOT crash database classifi es a truck as a vehicle with a gross weight greater than 10,000 pounds. As a point of reference, a Ford F-350 pickup marks the bottom end of the weight threshold. In 2013, there were about 2,600 crashes involving trucks in the Denver region, resulting in 51 serious injuries and 12 fatalities. There were 162 fatal truck crashes in the state of Colorado between 2012 and 2014 (NHTSA). When analyzed by truck type, 114 of the fatal truck crashes in Colorado (70.4 percent) involved a tractor-trailer. Figure 6. Colorado Fatal Truck Crashes by Truck Type ( ) Truck tractor 70.4% Medium/heavy pickup or step van 3.7% Single unit truck 25.9% Table 5 shows truck crash characteristics from 2011 to An equal number of truck crashes occurred on arterials (36 percent), freeways (34 percent) and local roads (31 percent). About half of truck-related crashes occurred at non-intersections, while intersection-related crashes accounted for about one-third (38 percent). The most common truck movement at the time of the crash was going straight (43 percent). Most truck-related crashes occurred during the day. Table 5. Truck Crash Characteristics ( ) Facility type Crashes Percent Arterials 2, Freeways 2, Collector or local roads 2, Total truck crashes 7, Specifi c Crash Types

17 Crash location Crashes Percent Non-intersecting 3, At intersection or intersection-related 2, At driveway access Highway interchange (ramp) In alley Parking lot Roundabout Unreported Total truck crashes 7, Truck movement Crashes Percent Going straight 3, Making left turn Making right turn Stopped in traffic Changing lanes Backing Slowing Parked Total truck movements* 7, *Note The larger number of movements is due to the number of truck crashes that involved more than one truck. Lighting Crashes Percent Daylight 5, Dark 1, Dawn or dusk Unknown Total truck crashes 7, Truck Crash Mitigation The Colorado State Patrol campaign, Ticketing Aggressive Cars and Trucks, was launched in 2010 and aims to reduce crashes between passenger cars and trucks. A new campaign titled Give Trucks More Room and Less Vroom also recently started 6. The diagram below, featured in the campaign brochure, highlights truck blind spots. 6 cspgivetrucksmoreroom/index.htm Specific Crash Types 17

18 18 Specific Crash Types Figure 7. Crash Events Involving Trucks (2013)

19 Other examples of truck safety improvements include: speed and lane restrictions in mountainous areas winter chain requirements and providing safe pull-off areas for operators to install or remove chains, or check brakes truck parking and rest areas B. Motorcycle-Related Crashes Motorcyclists are more vulnerable to serious injuries and fatalities than individuals driving cars. They have less physical protection than people in cars and are harder to see. Between 2011 and 2013, an average of 1,200 motorcycle crashes occurred each year in the Denver region. The chart below shows motorcycle fatalities from 2000 to 2015, averaging 36 fatalities per year. Motorcyclists make up an increasing proportion of all traffi c fatalities (from 14 percent in 2000 to 23 percent in 2015). Figure 8. Motorcycle Fatalities in the Denver Region ( ) 60 30% Motorcycle fatalities 50 25% 40 20% 30 15% 20 10% 10 5% Percentage of all traffic fatalities 0 0% Motorcycle fatalities Motorcycle percentage of fatalities The number of motorcycle registrations has increased substantially during the last fi ve years. The fatality rate per number of motorcycle registrations has remained about the same (see Table 6). CDOT found motorcyclists were at fault in 7 out of 10 fatal crashes in In Colorado, helmet use is not required for adult motorcyclists, but is required for operators and passengers younger than 18. For additional information on CDOT motorcycle safety efforts, visit Specifi c Crash Types 19
20 20 Specific Crash Types Figure 9. Crash Events Involving Motorcycles (2013)
21 Table 6. Motorcycle Fatality Rate in the Denver Region ( ) Year Motorcycle registrations Motorcycle fatalities Motorcycle fatalities per 1,000 registrations , , , , , Figure 9 shows a map of motorcycle crash locations from C. Pedestrian-Related Crashes Pedestrians are the most vulnerable roadway users. They are more diffi cult to see in many situations, and face high odds of serious injury or death if hit by a car or truck. Between 2011 and 2013, an average of 1,363 pedestrian crashes occurred per year in the Denver region, resulting in 113 fatalities and 517 serious injuries during that time. The chart below shows pedestrian fatalities in the region from 2000 to Pedestrians account for a disproportionately high percentage of traffi c fatalities, considering the distance and time pedestrians travel on roadways. Between 2011 and 2013, pedestrians accounted for 22 percent of traffi c fatalities, but less than 5 percent of all person-miles of travel in the region (DRCOG Travel Model, 2015). Figure 10. Pedestrian Fatalities in the Denver Region ( ) 60 30% Pedestrian Fatalities 50 25% 40 20% 30 15% 20 10% 10 5% Percentage of All Traffic Fatalities 0 0% Pedestrian Fatalities Pedestrian % of Fatalities Table 7 shows the ages of pedestrians involved in crashes. Pedestrians between the ages of 15 and 24 had the highest involvement in crashes. Specifi c Crash Types 21
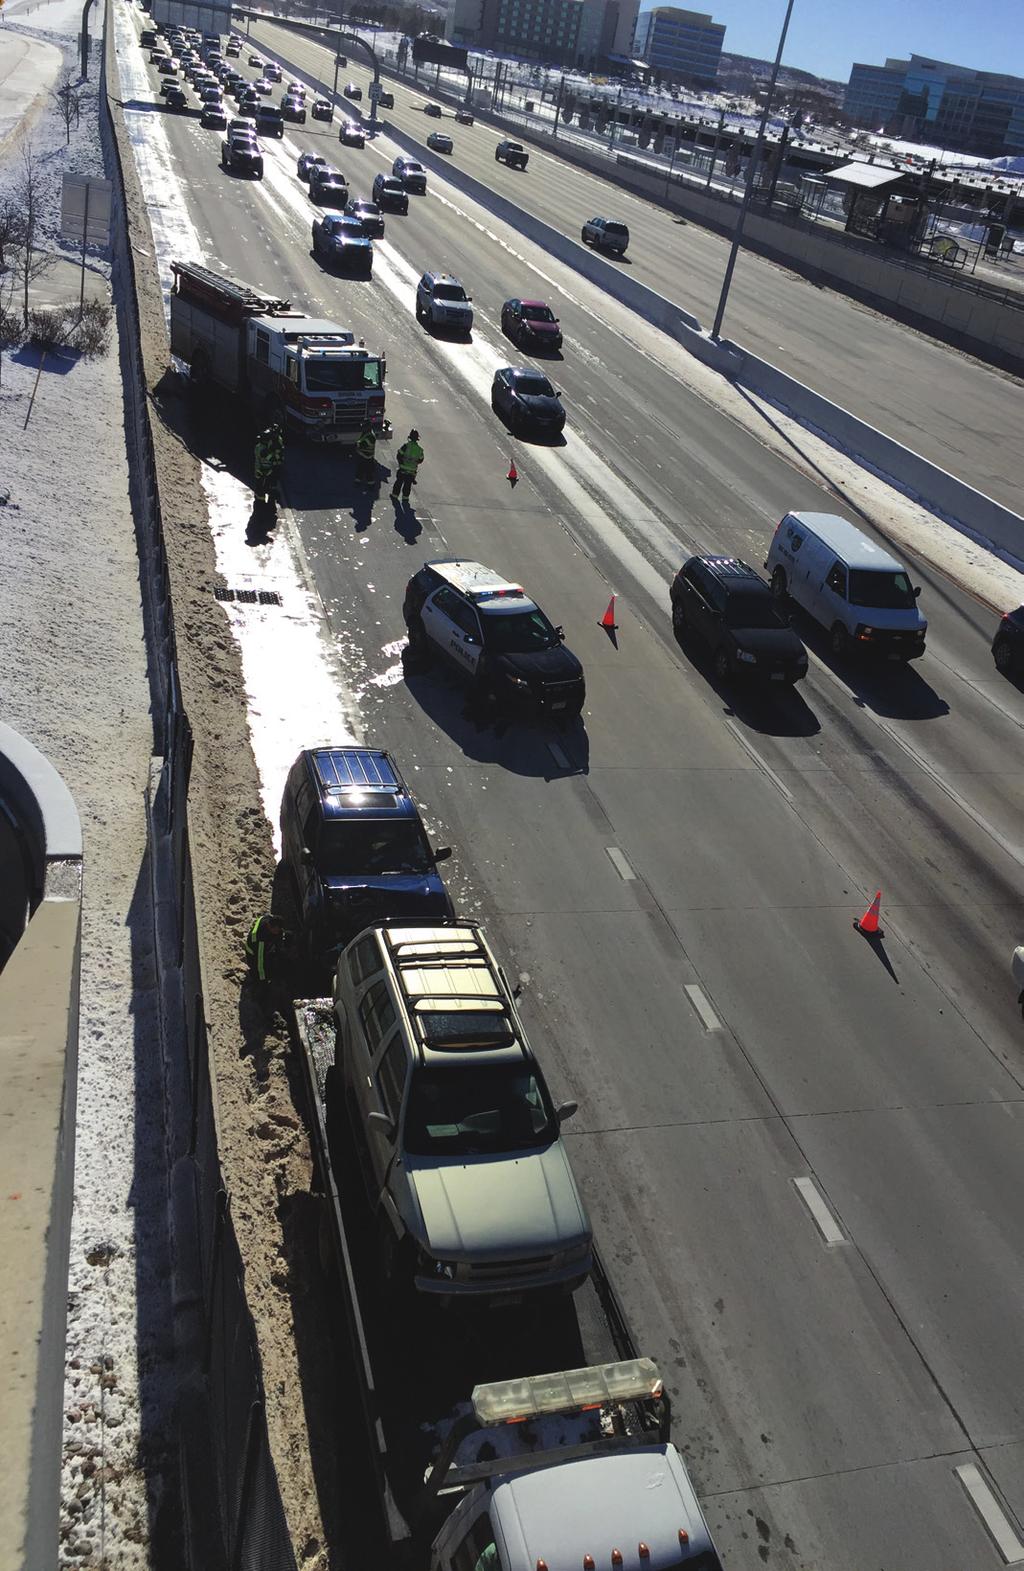
22 Table 7. Age of Pedestrians in Traffic Crashes ( ) Pedestrians involved in crashes Pedestrians killed Pedestrians seriously injured Age group Number Percent Number Percent Number Percent plus Total reported Age unreported Total pedestrians 3, , Table 8 shows pedestrian crash characteristics from 2011 to An equal number of crashes involving pedestrians occurred on arterials (49 percent) and local roads (48 percent) and the majority occurred at intersections (63 percent). In addition, in a crash involving a pedestrian, the most common vehicle path is traveling straight; the second most common path is making a left turn. One-third of crashes occurred at night. Pedestrians were impaired by alcohol or drugs in eight percent of crashes involving pedestrians. Also of note in Table 8 is the number of pedestrian crashes on freeways. Emergency responders and other individuals at crash scenes are extremely vulnerable to being struck by a fast-moving motor vehicle. 22 Specific Crash Types
23 Table 8. Pedestrian Crash Characteristics ( ) Facility type Crashes Percent Collector or local roads 1, Arterials 1, Freeways Total pedestrian-related crashes 4, Crash location Crashes Percent At intersection or intersection related 2, Non-intersection 1, At driveway access In alley Highway interchange Other Unreported Total pedestrian-related crashes 4, Vehicle movement Crashes Percent Colorado law requires drivers to move into the left lane when passing emergency vehicles on the shoulder (when at least two lanes in one direction are available). Going straight 1, Making left turn Making right turn All other movements Unreported Total vehicle movements 4, Lighting Crashes Percent Daylight 2, Dark 1, Dawn or dusk Unreported Total pedestrian-related crashes 4, Impairment Crashes Percent Pedestrian sober 3, Pedestrian impaired Total pedestrian-related crashes 4, Specifi c Crash Types 23

24 24 Specific Crash Types Figure 11. Crash Events Involving Pedestrians (2013)

25 Figure 11 shows a map of pedestrian crashes from There may be more than one crash at each identifi ed intersection location. Pedestrian Crash Mitigation Strategies Several safety treatments can reduce the occurrence of pedestrian crashes. See DRCOG s Guidelines for Successful Pedestrian and Bicycle Facilities in the Denver Region (2010) 7 for an overview of pedestrian facility design considerations. A few examples of pedestrian safety improvements include mid-block crossing treatments; median refuge islands; and giving the pedestrian signal phase a three-second start-up time, allowing the pedestrian to begin crossing before motorists see a green light (for example, implemented at 13th Avenue and Broadway in Denver). The Manual on Uniform Traffi c Control Devices recently lowered the assumed pedestrian walk design speed to 3.5 feet per second (from 4.0 feet per second), therefore giving the pedestrian a longer time to cross the intersection. CDOT s Safe Routes to School program funds traffi c safety education and infrastructure, such as sidewalk and signage enhancements, which enable schoolage children to walk or bicycle to school safely. CDOT s Share the Road campaign aims to raise driver awareness of pedestrians and bicyclists. For more information on these CDOT programs visit: D. Bicycle-Related Crashes 7 les/ resources/2010%20ped%20bike%20 Guidelines%20booklet.pdf Similar to pedestrians, bicyclists are more vulnerable road users. Additionally, bicyclists spend a greater amount of time in roadways than pedestrians. Between 2011 and 2013, an average of 877 bicycle crashes occurred per year, resulting in 7 fatalities and 96 serious injuries per year. The chart below shows bicyclist fatalities in the Denver region from 2000 to Bicyclist fatalities have remained about the same during the last fi fteen years, and make up about three percent of all traffic fatalities. Specifi c Crash Types 25
26 Figure 12. Bicyclist Fatalities in the Denver Region ( ) % Bicyclist fatalities 8 4.8% 6 3.6% 4 2.4% 2 1.2% Percentage of all traffic fatalities 0 0% Bicyclist fatalities Bicyclist percentage of fatalities Table 9 shows the ages of bicyclists involved in traffic crashes. Similar to pedestrian crashes, bicyclists between the ages of 15 and 24 had the highest involvement in crashes. Bicyclists between the ages of 45 and 54 experienced the highest number of fatalities. Table 9. Age of Bicyclists in Traffic Crashes ( ) Bicyclists involved in crashes Bicyclists killed Bicyclists seriously injured Age group Number Percent Number Percent Number Percent plus Total reported 1, Age unreported 1, Total bicyclists 2, Specific Crash Types
27 Table 10 shows bicycle crash characteristics between 2011 and The table shows that over 60 percent of bicycle crashes occur on local roads and the vast majority occur at intersections (73 percent). The most common motor vehicle movement in a bicycle crash is making a left turn. Sixteen percent of bicycle crashes occurred at night. Table 10. Bicycle Crash Characteristics ( ) Facility type Crashes Percent Collector or local roads 1, Arterials Freeways Total bicycle-related crashes 2, % of bicycle crashes occurred at an intersection. Crash location Crashes Percent At intersection or intersection related 1, Non-intersection At driveway access Alley related On/off ramp Parking lot Total bicycle-related crashes 2, Motor vehicle movement Crashes Percent Making left turn Going straight Making right turn All other movements Total vehicle movements 2, *Note Some crashes involved more than one vehicle resulting in a higher number of movements Lighting Crashes Percent Daylight 2, Dark Dawn or dusk Unknown Total bicycle-related crashes 2, Specifi c Crash Types 27
 facilities can help reduce crashes while potentially encouraging bicycle use.")
28 Bicycle Crash Mitigation Strategies As the interest in bicycling as a viable mode of travel increases among a wider segment of the population, so does the demand for facilities that are both safe and comfortable. Providing high comfort (or low-stress) facilities can help reduce crashes while potentially encouraging bicycle use. Some examples of improvements that can improve comfort and safety include: conventional or protected bike lanes and intersections buffered bike lanes bicycle boulevards shared-use paths shared-use bridges/overpasses and underpasses paved-shoulder bicycle routes better maintenance of on-street and off-street bicycle facilities The following resources include guidance for bicycle facility design: Urban Bikeway Design Guide, 2014 Second Edition, (National Association of City Transportation Offi cials) Guide for the Development of Bicycle Facilities, 2012 Fourth Edition, (American Association of State Highway and Transportation Offi cials) CDOT Roadway Design Guide Chapter 14 Bicycle and Pedestrian Facilities, January 2013, Revision 1, (CDOT) Specifi c Crash Types
29 Specific Crash Types 29 Figure 13. Crash Events Involving Bicyclists (2013)
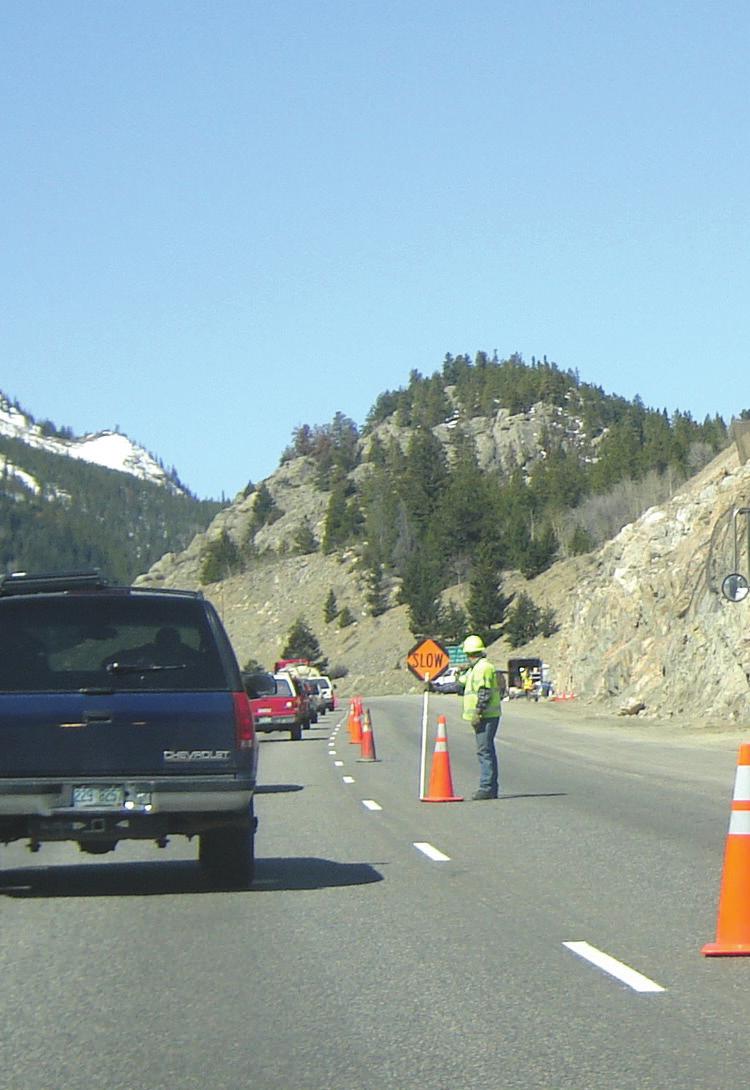
30 E. Construction Zone Crashes Construction zones expose vulnerable workers to motor vehicle traffi c on a day-today basis. Drivers may also have more diffi culty maneuvering through these zones. Between 2011 and 2013, an average of 709 construction zone crashes occurred per year, resulting in 26 serious injuries and 3 fatalities per year. As shown in the chart below, the number of construction zone crashes is highly variable, depending on the location and amount of construction occurring each year. Figure 14. Construction Zone Crashes in the Denver Region ( ) 1,600 1,400 Construction zone crashes 1,200 1, According to CDOT, 85 percent of work zone fatalities are motorists or vehicle occupants. Also, in a typical fi ve-day workweek, an average of seven motorists and one highway worker are killed nationwide. Rear-end collisions are by far the most common crash type, representing 70 percent of all collisions between moving motor vehicles in Colorado construction zones in Careless driving and following too close were the most common driver actions, while distracted driving was the most common human factor. Construction Zone Crash Mitigation Strategies 8 CDOT s Slow for the Cone Zone campaign 8 aims to enhance safety for motorists and workers in construction zones at construction projects each year from June to September. Higher fi nes for violating traffi c laws in a construction zone also help to reduce unsafe behavior. In 2006, nearly all types of fi nes doubled in Colorado work zones. Because inadequate markings and insuffi cient guidance to drivers contribute to crashes and congestion, it is imperative for construction and maintenance teams to provide clear markings, warnings, and guidance for motorists through construction sites. 30 Specifi c Crash Types
31 F. Wildlife-Related Collisions Wildlife-vehicle collisions increased from about 400 per year to 800 per year between 1991 and From 2011 to 2013 an average of 5 serious human injuries occurred per year in the Denver region due to wildlife-vehicle collisions. Beyond the initial safety threat of the collision, dead animals on the roadway also present a hazard due to drivers swerving to miss the carcass. The Rocky Mountain Insurance Information Association found that the average claim for a wildlife-vehicle collision is $3,171. Figure 15. Wildlife-Vehicle Collisions in the Denver Region ( ) Wildlife-vehicle collisions Figure 16 shows a map of wildlife-vehicle collisions during 2013 and the open space and fl ood plains within the region. When analyzed by crash location in 2013, 66 percent of wildlife-vehicle collisions occurred within a quarter-mile of open space. 66% of wildlife-vehicle collisions occurred within a quarter-mile of open space in Specifi c Crash Types 31

32 32 Specific Crash Types Figure 16. Crash Events Involving Wildlife (2013)


33 Animal-Vehicle Crash Mitigation Strategies CDOT s Wildlife on the Move campaign 9 reminds drivers to drive with caution, especially in the fall, when animal migration is most common. The majority of wildlife-vehicle collisions occur at nighttime; therefore CDOT has designated certain at-risk corridors as wildlife zones, reducing the nighttime speed limit from September to April. The U.S. 36 corridor from Boulder to Lyons is a designated wildlife zone. Wildlife-vehicle collisions make up over 65 percent of nighttime crashes on this corridor. 9 environmental/wildlife/wildlifeonthemove CDOT also recently constructed a wildlife exclusion fence and crossing on U.S. 6 in Golden. The eight-foot-tall fence extends 2.5 miles and funnels animals to a single wildlife crossing. Flashing beacons and dynamic message signs at the crossing alert motorists when an animal is detected. Specifi c Crash Types 33
34 6 33% of impaired drivers involved in fatal crashes were younger than 25. HIGH-RISK BEHAVIOR CRASHES A. Impaired Driving Between 2011 and 2013, an average of 3,265 impaired-driving crashes occurred per year. These crashes resulted in an average of 291 serious injuries and 38 fatalities per year. The chart below shows trends in impaired-driving fatalities from 2004 to Impaired-driving fatalities in the Denver region experienced a downward trend from 2004 to However, preliminary data indicate an upward trend in 2014 through Figure 17. Impaired Driving Fatalities in the Denver Region ( ) % Impaired-driving fatalities % 80 40% 60 30% % 10% Percent 0 0% Fatalities Percent of fatalities 28% of impaired driving crashes occur between midnight and 3 a.m. The chart below shows the demographics of impaired drivers that were involved in a fatal crash between 2011 and Drivers younger than 45 make up the vast majority of impaired drivers in fatal crashes with 33 percent being between the ages of 15 and High-Risk Behavior Crashes
35 Figure 18. Impaired Drivers by Age Group Resulting in Fatalities ( ) 35% Percentage of impaired drivers 30% 25% 20% 15% 10% 5% plus Table 11 shows impaired driving crashes by time of day. The highest hours are from midnight to 3 a.m., when 28 percent of impaired driving crashes occur, but only 1.4 percent of daily VMT. Figure 19 shows a map of impaired driving crash locations from Table 11. Impaired Driving Crashes by Time of Day ( ) Time of Day Crashes Percent crashes Percent VMT Midnight 3 a.m. 2, a.m a.m a.m. noon p.m p.m. 1, p.m. 1, p.m. midnight 2, Total 10, High-Risk Behavior Crashes 35
36 36 High-Risk Behavior Crashes Figure 19. Crash Events Involving Impaired Driving (2013)
37 Impaired Driving Education and Enforcement Efforts CDOT runs several campaigns and programs to reduce impaired driving. The Heat is On! campaign raises public awareness of driving under the infl uence through highvisibility enforcement and sobriety checkpoints during 12 key periods of the year (for example, Labor Day, Fourth of July, Memorial Day and New Year s Eve). From Memorial Day to Labor Day, the 100 Days of Heat campaign increases enforcement visibility by placing two large banners at the Eisenhower and Johnson tunnels on Interstate 70 and a portable dynamic message sign counts the number of DUI arrests made year-to-date. Visit for more information on CDOT enforcement activities and DUI arrest statistics. CDOT recently launched a new education campaign on marijuana-impaired driving. Visit to learn more and to fi nd drugged-driving statistics. B. Speeding Speeding generally involves exceeding the posted speed limit or driving too fast for the road conditions. For this report, speeding was defi ned as a driver traveling at 10 miles or more per hour above the speed limit. Between 2011 and 2013, an average of 3,040 speeding-related crashes occurred per year in the Denver region. These crashes resulted in an average of 19 fatalities and 91 serious injuries per year. Speeding was involved in about 11 percent of all fatal crashes between 2011 and The charts below show the age of drivers involved in speed-related fatal crashes and the types of roadways where speeding-related fatal crashes occurred. Figure 20. Age of Driver in Speeding-Related Fatalities ( ) Percentage of fatalities in age group 30% 25% 20% 15% 10% 5% plus High-Risk Behavior Crashes 37
38 11% of fatal crashes between 2011 and 2013 were speeding-related. Young drivers make up the vast majority of fatalities occurring due to excessive speed. Drivers age 15 to 34 represent more than half of all fatalities. Speedingrelated fatalities occur on all types of roadways. As shown in the chart (Figure 21), 39 percent of speeding-related fatal crashes occurred on arterials, 37 percent on collector/local roads, and 25 percent on freeways. Figure 21. Speeding-related Fatalities by Facility Type ( ) Arterial 39% Freeway/ramp 25% Local 37% Figure 22 shows the locations of speeding-related crashes in Speeding Education and Enforcement Efforts 10 c-engineering-annual-report CDOT s Speed Enforcement and Control program aims to reduce speed-related crashes through concentrated, repetitive and high-visibility speed enforcement. In 2009 and 2010, the program provided funds to the Denver Police Department to focus on speeding violations on the Interstate 25 and I-70 corridors. For more information on the Speed Enforcement program activities see CDOT s Transportation Safety and Traffi c Engineering Annual Report 10. Many speeding-related crashes occur due to high speed differentials between vehicles on a roadway. Achieving speed harmonization (all vehicles traveling at roughly the same speed greatly enhances roadway safety. In August 2011, CDOT began implementing 55-mph pacing vehicles on the I-70 mountain corridor to reduce crashes and congestion during peak travel times. 38 High-Risk Behavior Crashes
")
39 High-Risk Behavior Crashes 39 Figure 22. Crash Events Involving Speeding (2013)

40 C. Red-Light Running From 2011 to 2013, an average of 2,500 red-light running (RLR) crashes occurred per year in the Denver region. These crashes resulted in an average of 7 fatalities and 130 serious injuries per year. In 2011, according to the Insurance Institute for Highway Safety, about half of the red-light running deaths in the United States were people other than the red-light runner. Figure 23 shows the locations of red-light running crash locations in Red-Light Running Crash Mitigation RLR crash mitigation is divided into two categories; engineering treatments to reduce unintentional RLR and enforcement activity, which reduces intentional RLR. In regard to engineering countermeasures, some common treatments include: improved signal visibility (placement of a signal head over each through lane), installation of signal ahead warning signs, adjustment of the yellow and all-red clearance intervals signal upgrades to allow for dilemma zone preemption (such as extending the length of the green signal when a vehicle is detected in the dilemma zone) Increased enforcement, via RLR cameras, is commonly used to reduce intentional RLR. There are about 50 intersections in the Denver region with RLR cameras. 40 High-Risk Behavior Crashes
41 High-Risk Behavior Crashes 41 Figure 23. Crash Events Involving Red-Light Running (2013)
42 7 IDENTIFICATION OF HIGH CRASH LOCATIONS A. Freeway Segment Crashes CDOT tabulates and analyzes freeway crashes using the Level of Service of Safety (LOSS). LOSS reflects how a roadway segment is performing in regard to its expected accident frequency and severity at a specific level of annual average daily traffic. LOSS is based on the concept of Safety Performance Functions (SPF). SPF represents the statistically expected accidents per mile per year (APMPY) for unique types of facilities. The LOSS ranges from I to IV, with a LOSS IV assigned to segments with a crash history at least 1.5 standard deviations higher than the average for that facility type. As an example, the SPF for total crashes on a six-lane urban freeway is shown in the chart below. Figure 24. Safety Performance Function-Urban Six-Lane Freeways Urban 6-Lane Freeways ( ) Total Graphs - Sections => 0.9 Miles APMPY (Total) APMPY (Total) Lower Limit (Total) Upper Limit (Total) APMPY (Total) LOSS IV LOSS III δ 80 APMPY 60 LOSS II δ LOSS I 0 50,000 75, , , , , ,000 AADT CDOT tabulated and mapped freeway segment LOSS scores for the timeframe, as shown in Figure 25. High crash segments are scattered throughout the DRCOG region, with the highest concentration of segments located in the central part of the region along I-25, I-70 and U.S Identification of High Crash Locations
43 Identification of High Crash Locations 43
44 Figure 25. Freeway Segment Level of Service of Safety ( ) 44 Identification of High Crash Locations
45 OTHER SAFETY EFFORTS 8 A. Engineering Safer Roadways A large part of roadway safety results from proper signage, roadway design, maintenance and vehicle design. The American Association for State and Highway Transportation Officials (AASHTO) publishes several manuals that provide roadway and roadside design criteria based on the functional classification and traffic volume on the facility. In addition to appropriate design, regular maintenance, resurfacing and restriping are needed to maintain roadway safety Proper communication with the roadway user, via signage and signals, is also critical to roadway safety. The Manual on Uniform Traffic Control Devices governs the design and placement of traffic signs, signals, and pavement markings nationwide. The purpose of the MUTCD is to ensure uniformity of traffic control devices, as user understanding is greatly enhanced when messages are displayed in the same way at all times. Also, advancements in vehicle technology can help prevent crashes. Vehicle technology is advancing quickly; including traffic sign recognition (such as recognition of speed limit signs), lane deviation alerts, automatic braking when a collision is sensed, and post-crash pedestrian protection systems. Autonomous vehicles and connected vehicle technology are also on the horizon. B. Emergency Response and Crash Clearance Crashes on freeways and major roads during peak hours have a major effect on traffic congestion. For this reason and the safety of emergency responders, removal of an incident from the traffic stream is very important. CDOT has several programs underway to aid in faster clearance of the roadway following a traffic crash. These programs include: CDOT s Mile High Courtesy Patrol provides assistance for passenger cars and other small vehicles when stalled or involved in minor traffic crashes along key areas of I-25, I-70, I-225, and U.S. 6 during rush hours. The program provides services including flat tire repair, fueling, jump starts, short-distance towing, accident scene protection and minor mechanical assistance. CDOT s Heavy Tow Quick Clearance program 11 clears stalled commercial vehicles from the travel lanes on I-70 between Floyd Hill and Vail Pass. The program operates on weekends and holidays between November and April. The average clearance time was improved from 50 minutes in 2007 to 22 minutes in CommercialVehicles.html Two Colorado laws facilitate quicker clearance of crash scenes. Colorado s quick clearance law (C.R.S ) allows the removal of any vehicle or debris standing upon any portion of a highway right-of-way in such a manner as to constitute an obstruction to traffic or proper highway maintenance. The move-it law (C.R.S ) requires drivers involved in non-injury crashes Other Safety Efforts 45
46 to move their vehicle off the traveled portion of the roadway. Emergency responders request that drivers in such crashes, or in broken-down vehicles, pull over off the road as far as possible. If on the right side of the road, exit from the passenger side if possible. If using emergency warning triangles, they should be placed far back from the vehicle, to provide ample time and distance for drivers to react to the crash scene. C. Move-Over Law Emergency responders are particularly vulnerable to being seriously injured or killed along Colorado s highways. There are two important aspects of Colorado s moveover law (C.R.S ) associated with roadway emergencies and incidents. 1. Moving over to allow emergency response vehicles to pass: The law stipulates all vehicles are required to move to the right side of the roadway and stop, clearing a path for the emergency vehicle to have the right of way. On a divided highway, vehicles traveling the same direction as the emergency response vehicle are required to pull over to the right and stop until the vehicle passes. 2. Approaching vehicles stopped along the roadway: In the case of emergency or response vehicles stopped along the roadway including maintenance trucks and vehicles from CDOT, counties, and municipalities the move-over law requires drivers to slow down and drive responsibly when on two-lane highways. On divided multilane highways, drivers are required to slow down and move to a lane away from the emergency vehicle to allow maximum space for responders. 46 Other Safety Efforts
47 17MAR28-ABL


48 1290 Broadway, Suite 100 Denver, CO Main: MAR28-ABL
Report on Traffic Crashes in the Denver Region
 Denver Regional Council of Governments Report on Traffic Crashes in the Denver Region REVIEW DRAFT October 2016 1290 Broadway Denver, CO 80203 www.drcog.org Table of Contents 1. Introduction... 1 A. Background
Draft Report: Traffic Crashes in the Denver Region
 Click to edit Master title style Click to edit Master title style Draft Report: Traffic Crashes in the Denver Region Presented by: Steve Cook Board Nov. 16, 2016 Click Report Click to to edit on edit Master
2014 QUICK FACTS ILLINOIS CRASH INFORMATION. Illinois Emergency Medical Services for Children February 2016 Edition
 2014 QUICK FACTS ILLINOIS CRASH INFORMATION February 2016 Edition Illinois Emergency Medical Services for Children www.luhs.org/emsc Illinois Emergency Medical Services for Children TABLE OF CONTENTS
2012 QUICK FACTS ILLINOIS CRASH INFORMATION. Illinois Emergency Medical Services for Children September 2014 Edition
 2012 QUICK FACTS ILLINOIS CRASH INFORMATION September 2014 Edition Illinois Emergency Medical Services for Children www.luhs.org/emsc Illinois Emergency Medical Services for Children TABLE OF CONTENTS
MTCF. Michigan Traffic Crash Facts FACT SHEETS
 FACT SHEETS This page left intentionally blank GENERAL FACTS The driver, the roadway, and the motor vehicle contribute in some measure to every crash. A preponderance of evidence, however, points to driver
2012 TOWN OF CASTLE ROCK MOTOR VEHICLE ACCIDENT FACTS PREPARED BY THE PUBLIC WORKS DEPARTMENT
 ATTACHMENT A 2012 TOWN OF CASTLE ROCK MOTOR VEHICLE ACCIDENT FACTS PREPARED BY THE PUBLIC WORKS DEPARTMENT ACKNOWLEDGEMENTS This report was assembled from data provided by the Castle Rock Police Department
MTCF. Michigan Traffic Crash Facts FACT SHEETS
 FACT SHEETS This page left intentionally blank GENERAL FACTS The driver, the roadway, and the motor vehicle contribute in some measure to every crash. A preponderance of evidence, however, points to driver
North Carolina. Bicycle Crash Facts Prepared for
 North Carolina Bicycle Crash Facts 2006-2010 Prepared for The North Carolina Department of Transportation Division of Bicycle and Pedestrian Transportation Prepared by The University of North Carolina
Signalization and Safety. A Study of the Safety Effects of Signalizing Intersections on Colorado State Highways
 Presentation by Richard G. Sarchet, P.E. of the Colorado Department of Transportation at the TRB National Roundabout Conference in Vail, Colorado May 2005 P Why do we Install Traffic Signals? Because They
Emergency Roadside Technician Dies When Struck by a Single-Unit Truck on an Interstate Shoulder. Incident Number: 05KY001
 Emergency Roadside Technician Dies When Struck by a Single-Unit Truck on an Interstate Shoulder Incident Number: 05KY001 Location on bridge where responder attempted to avoid semi. Kentucky Fatality Assessment
Maine Highway Safety Facts 2016
 Maine Highway Safety Facts 216 216 MAINE HIGHWAY SAFETY FACTS The Bureau of Highway Safety and the Maine Department of Transportation are pleased to present the 216 edition of Maine Highway Safety Facts.
Deaths/injuries in motor vehicle crashes per million hours spent travelling, July 2007 June 2011 (All ages) Mode of travel
 Mode of travel") Cyclists CRASH STATISTICS FOR THE YEAR ENDED 31 DECEMBER 211 Prepared by the Ministry of Transport CRASH FACTSHEET 212 Cyclists have a number of risk factors that do not affect car drivers. The main risk
Cyclists CRASH STATISTICS FOR THE YEAR ENDED 31 DECEMBER 211 Prepared by the Ministry of Transport CRASH FACTSHEET 212 Cyclists have a number of risk factors that do not affect car drivers. The main risk
PRELIMINARY DRAFT FIRST AMENDMENT TO VISION 2050: A REGIONAL LAND USE AND TRANSPORTATION PLAN FOR SOUTHEASTERN WISCONSIN
 PRELIMINARY DRAFT FIRST AMENDMENT TO VISION 2050: A REGIONAL LAND USE AND TRANSPORTATION PLAN FOR SOUTHEASTERN WISCONSIN ESTABLISHING TARGETS FOR FEDERAL PERFORMANCE MEASURES: HIGHWAY SAFETY SOUTHEASTERN
CDRT. Child Death Review Team Dallas County. Brief Report Traffic-related Child Deaths OVERVIEW
 Dallas County CDRT Child Death Review Team 2013 Brief Report Traffic-related Child Deaths 2006-2011 OVERVIEW In Dallas County, traffic-related injury death rates among children are typically less than
COLLISION STATISTICS May Engineering Services Box 5008, th Avenue Red Deer, AB T4N 3T4
 COLLISION STATISTICS 2016 2016 Red Deer Annual Motor Vehicle Collision Report May 2017 Engineering Services Box 5008, 4914 48th Avenue Red Deer, AB T4N 3T4 engineering@reddeer.ca RCMP GRC Red Deer City
People killed and injured per million hours spent travelling, Motorcyclist Cyclist Driver Car / van passenger
 Cyclists CRASH FACTSHEET 27 CRASH STATISTICS FOR THE YEAR ENDED 31 DEC 26 Prepared by Strategy and Sustainability, Ministry of Transport Cyclists have a number of risk factors that do not affect car drivers.
Alberta. Traffic Collision Statistics. Office of Traffic Safety Transportation Services Division May 2017
 Traffic Collision Statistics Office of Traffic Safety Transportation Services Division May 217 This page was intentionally left blank. 2 Table of Contents Traffic Collisions... 4 Traffic Collision Rates...
Toward Zero Deaths: Proactive Steps for Your Community
 Est. Dec. 2014 Toward Zero Deaths: Proactive Steps for Your Community Presented by: Brian Roberts, P.E., National Association of County Engineers Marie Walsh, Ph.D., Louisiana Local Technical Assistance
Florida Class E Knowledge Exam Road Rules Practice Questions
 1. If you are being followed too closely while driving, you should: A. Drive closer to the car in front of you. B. Speed up to increase the distance between you and the following vehicle. C. Slow down
2013 Traffic Safety Report
 Traffic Safety Report Introduction Every year on the more than 1, miles of unincorporated Larimer County roadways, about 375 vehicular traffic crashes occur. Those crashes include about 75 severe crashes
General Design Factors
 Chapter 3: 3-1.0 Introduction General Design Factors Mn/DOT s goals include encouraging and accommodating safe bicycling. From a design perspective, these goals are achieved by first having an understanding
Lane Area Transportation Safety and Security Plan Vulnerable Users Focus Group
 Lane Area Transportation Safety and Security Plan Vulnerable Users Focus Group Agenda 1. Planning Process Review 2. What are Emphasis Areas? 3. Your Role Today 4. Data Review 5. Small group discussion
Truck Tractor Trailer Crash Analysis
 Building Tribal Traffic Safety Capacity Truck Tractor Trailer Crash Analysis Arizona Department of Transportation (ADOT) Motor Vehicle Crash (MVC) Data ITCA, Inc. 04/18/06 Truck Tractor Trailer Crash Analysis
Pinellas County Metropolitan Planning Organization (MPO) 2014 Crash Data Report
 2014 Crash Data Report") Pinellas County Metropolitan Planning Organization (MPO) 2014 Crash Data Report MPO Board July 8, 2015 2 Crash Data Collection Motorcycle drove between stopped cars, ran a red light and collided with a
Pinellas County Metropolitan Planning Organization (MPO) 2014 Crash Data Report MPO Board July 8, 2015 2 Crash Data Collection Motorcycle drove between stopped cars, ran a red light and collided with a
Road Safety Audit Course Participant Guidebook. August 22 & 23, Cleveland Avenue Columbus, Ohio
 Road Safety Audit Course Participant Guidebook August 22 & 23, 2017 Cleveland Avenue Columbus, Ohio 1 2 Table of Contents Executive Summary... 5 Cleveland Avenue City of Columbus... 6 Road Location Details...
Figure 1. Indiana fatal collisions by young driver involvement,
 INDIANA TRAFFIC SAFETY FACTS YOUNG DRIVERS 2016 MAY 2017 ISSUE 17-C06 IN 2016: In 2016, 13.4 percent of all drivers involved in Indiana collisions were young drivers. Young drivers were involved in 105
Pedestrians safety. ROAD SAFETY SEMINAR PIARC/AGEPAR/GRSP Lome, Togo October 2006 Lise Fournier, Canada-Qu
 Pedestrians safety ROAD SAFETY SEMINAR Lome, Togo October 2006 Lise Fournier, Canada-Qu Québec Contents WHO s data Risk factors Pedestrian needs Pedestrian facilities Conclusion Source: WHO WHO reports
SLOW DOWN A STUDY OF SPEEDING ON MCGUINNESS BLVD
 SLOW DOWN A STUDY OF SPEEDING ON MCGUINNESS BLVD ACKNOWLEDGEMENTS This report was prepared by Shawn Macias, in consultation with the McGuinness Boulevard Working Group. This report would not have been
DEPARTMENT OF ENVIRONMENTAL SERVICES. North Harrison Street (Lee Highway to Little Falls Road) Comparative Analysis. Prepared for:
 Comparative Analysis. Prepared for:") DEPARTMENT OF ENVIRONMENTAL SERVICES North Harrison Street (Lee Highway to Little Falls Road) Comparative Analysis Prepared for: Arlington County Department of Environmental Services 2100 Clarendon Boulevard,
DEPARTMENT OF ENVIRONMENTAL SERVICES North Harrison Street (Lee Highway to Little Falls Road) Comparative Analysis Prepared for: Arlington County Department of Environmental Services 2100 Clarendon Boulevard,
the Ministry of Transport is attributed as the source of the material
 Cyclists 2015 Disclaimer All reasonable endeavours are made to ensure the accuracy of the information in this report. However, the information is provided without warranties of any kind including accuracy,
REDUCING COLLISIONS AT HIGH CRASH LOCATIONS
 REDUCING COLLISIONS AT HIGH CRASH LOCATIONS Presented by Nazir Lalani P.E. Traffex Engineers Inc. N_lalani@hotmail.com ACCIDENTS AND SAFETY Why is safety important? Safety components Who is responsible?
Active Transportation Facility Glossary
 Active Transportation Facility Glossary This document defines different active transportation facilities and suggests appropriate corridor types. Click on a facility type to jump to its definition. Bike
Rebecca Szymkowski, P.E., PTOE Wisconsin Department of Transportation. ITE Midwestern District Annual Meeting June 30, 2015
 Rebecca Szymkowski, P.E., PTOE Wisconsin Department of Transportation ITE Midwestern District Annual Meeting June 30, 2015 Strategic Highway Safety Plan (SHSP) Roundabout Safety Analysis J-turn Experiences
 http://www.itarda.or.jp/english/info36/36top.html Page 1 of 2 Introduction It is difficult to understand how someone could end up driving in the wrong direction on the highway. However, 1 in 300 accidents
Bicycle - Motor Vehicle Collisions on Controlled Access Highways in Arizona
 Bicycle - Motor Vehicle Collisions on Controlled Access Highways in Arizona Analysis from January 1, 1991 to June 30, 2002 Richard C. Moeur, PE Traffic Design Manager, Northern Region Michelle N. Bina
Toward Zero Deaths. Regional SHSP Road Show Meeting. Virginia Strategic Highway Safety Plan. presented by
 Toward Zero Deaths Regional SHSP Road Show Meeting presented by Virginia Strategic Highway Safety Plan December 1, 2016 1 Welcome & Introductions Purpose of the Meeting Objectives & Key Outcomes Agenda»
Safety Benefits of Raised Medians and Pedestrian Refuge Areas. FHWA Safety Program.
 Safety Benefits of Raised Medians and Pedestrian Refuge Areas FHWA Safety Program http://safety.fhwa.dot.gov There s a signal up the block, but looking left there s a gap in traffi c. Looking right there
road safety issues 2001 road toll for Gisborne district July 2002 Road user casualties Estimated social cost of crashes*
 GISBORNE DISTRICT road safety issues July 22 The Land Transport Safety Authority (LTSA) has prepared this Road Safety Issues Report. It is based on reported crash data and trends for the 1997 21 period.
SAFETY GUIDE FOR SCHOOL CHILDREN & PARENTS. toronto.ca/visionzeroto #VisionZeroTO
 SAFETY GUIDE FOR SCHOOL CHILDREN & PARENTS toronto.ca/visionzeroto #VisionZeroTO VISION ZERO ROAD SAFETY PLAN Toronto s Vision Zero Road Safety Plan is a five-year strategy for eliminating traffic-related
Parental Responsibilities
 Bicycle riding is a fun way to exercise and enjoy the outdoors. To remain safe on Illinois roads, bicyclists must obey the same traffic safety laws that govern vehicle drivers. No amount of bicycle safety
Pedestrian Safety Action Plan Bicycle Safety Action Plan
 Pedestrian Safety Action Plan Bicycle Safety Action Plan January 24, 2017 VISION: Safe travel for all MISSION STATEMENT: Partner with the community to plan and fund transportation projects and programs
BICYCLING ON ROADWAYS
 Massachusetts State Police Academy Training Bulletin 2017-11 BICYCLING ON ROADWAYS Legal Update: Effective April 2017, Chapter 456 of the Acts of 2016 adds section 4D to Chapter 89 of the General Laws,
DEFINITIONS Activity Area - Advance Warning Area Advance Warning Sign Spacing Advisory Speed Approach Sight Distance Attended Work Space
 DEFINITIONS Activity Area - that part of a TTC zone activity area where the work actually takes place. It consists of the work space, traffic space and one or more buffer spaces. Advance Warning Area -
Napier City road trauma for Napier City. Road casualties Estimated social cost of crashes* Major road safety issues.
 ISSN 1176-841X July 25 Land Transport New Zealand has prepared this road safety issues report. It is based on reported crash data and trends for the 2 24 period. The intent of the report is to highlight
REGIONAL BICYCLE AND PEDESTRIAN DESIGN GUIDELINES
 REGIONAL BICYCLE AND PEDESTRIAN DESIGN GUIDELINES November 16, 2011 Deb Humphreys North Central Texas Council of Governments Bicycle and Pedestrian Advisory Committee Snapshot of the Guide 1. Introduction
Planning Guidance in the 2012 AASHTO Bike Guide
 Planning Guidance in the 2012 AASHTO Bike Guide Presentation by: RJ Eldridge Peter Lagerwey August 22, 2012 WEBINAR 2: PLANNING GUIDANCE IN THE 2012 AASHTO BIKE GUIDE Today s Webinar Significant Updates
Transportation and Public Works Annual Motor Vehicle Collision Report
 Transportation and Public Works 22 Annual Motor Vehicle Collision Report Table of Contents Table of Contents.. 2 Introduction.. 3 22 Collision Summary. 4 Demographics 5 Collisions by Severity.. 5 Personal
Chapter #4 Traffic Control Devices and Laws
 Chapter #4 Traffic Control Devices and Laws Chapter #4 Overview Unit 4 will introduce the student to traffic control devices, including signs, signals and pavement markings, as well as traffic laws specific
Closing Plenary Session
 TRAFFIC SAFETY CONFERENCE Closing Plenary Session June 9, 2017 Las Colinas, TX Order of Report Out June 9, 2017 Las Colinas, TX Distracted Driving Prioritized Countermeasures Countermeasure 4a Systemically
444 North Capitol Street NW, Suite 249, Washington, DC (202) Fax: (202) ERRATA
 Fax: (202) ERRATA") Larry L. Butch Brown, Sr., President Executive Director, Mississippi Department of Transportation John Horsley, Executive Director 444 North Capitol Street NW, Suite 249, Washington, DC 20001 (202) 624-5800
Larry L. Butch Brown, Sr., President Executive Director, Mississippi Department of Transportation John Horsley, Executive Director 444 North Capitol Street NW, Suite 249, Washington, DC 20001 (202) 624-5800
PEDESTRIAN/BICYCLIST CRASH ANALYSIS 2015
 PEDESTRIAN/BICYCLIST CRASH ANALYSIS 2015 Central Arkansas Regional Transportation Study Table of Contents Executive Summary... 3 CARTS Pedestrian/Bicycle Crash Analysis... 3 Report Format... 3 Results...
INTERSECTION CRASH COUNTERMEASURES
 INTERSECTION CRASH COUNTERMEASURES ALL SEVERE INTERSECTION (include gap CRASHES High Friction Surface Treatment - Intersection Markings - advanced acceptance and intersection approaches to intersections
AMATS Complete Streets Policy
 AMATS Complete Streets Policy Table of Contents: Section 1. Definition of Complete Streets Section 2. Principles of Complete Streets Section 3. Complete Streets Policy Section 4. Consistency Section 5.
Traffic Safety Plan Traffic Safety Plan 2015
 Traffic Safety Plan 2015 Purpose Airdrie s last Traffic Safety Plan was created in 2011. The 2015 Traffic Safety Plan is a revised model of the traffic operations for the City of Airdrie. The purpose of
Characteristics of Fatal Pedestrian Crashes on Freeways. Kay Fitzpatrick Texas A&M Transportation Institute
 Characteristics of Fatal Pedestrian Crashes on Freeways Kay Fitzpatrick Texas A&M Transportation Institute Transportation Short Course Design Session October 15, 2013 Project Background (0-6702) Motivation:
Analysis of the Red Light Camera Program in Garden Grove, CA By Jay Beeber, Executive Director, Safer Streets L.A., Member ITE
 Analysis of the Red Light Camera Program in Garden Grove, CA By Jay Beeber, Executive Director, Safer Streets L.A., Member ITE The following report is a detailed discussion of the Red Light Camera (RLC)
6.8 Transportation Safety & Security
 6.8 Transportation Safety & Security This chapter addresses transportation safety and security as required under MAP-21 and California s Strategic Highway Safety Plan. Transportation safety and security
2003 road trauma for. Wairoa District. Road casualties Estimated social cost of crashes* Major road safety issues WAIROA DISTRICT JULY 2004
 WAIROA DISTRICT JULY 24 T he Land Transport Safety Authority (LTSA) has prepared this road safety issues report. It is based on reported crash data and trends for the 1999 23 period. The intent of the
NYC Pedestrian Safety Study & Action Plan. NYTMC Brown Bag Lunch Presentation December 15, 2010
 NYC Pedestrian Safety Study & Action Plan NYTMC Brown Bag Lunch Presentation December 15, 2010 1 Introduction DOT Safety Goal Strategic Plan: Reduce Fatalities by 50% by 2030 From 274 (2007) to 137 (2030)
Department of Transportation
 Department of Transportation I. Internal Scan The number of older drivers in the United States will double over the next 30 years. By 2030 one in five Americans will be age 65 or older. On a licensed-driver
Temporary Traffic Control for Highway Work Zones
 Temporary Traffic Control for Highway Work Zones MONTHLY DELMARVA MISS UTILITY MEMBER MEETING MARCH 20, 2014 PRESENTED BY: Adam Weiser, P.E. PTOE Safety Programs Manager Delaware Department of Transportation
Safety and Active Transport. Dr. Maureen Carew, Medical Officer of Health Renfrew County and District Health Unit May 30, 2014
 Safety and Active Transport Dr. Maureen Carew, Medical Officer of Health Renfrew County and District Health Unit May 30, 2014 Active Transport Vision Increase levels of walking and cycling Reduce vehicle
Homework Module 7.01 Drivers Manual Study Questions
 Homework Module 7.01 Drivers Manual Study Questions Name: Date: Directions: Use the Oregon Driver Manual to answer each of the following questions. It is suggested that you underline or highlight each
8. Collisions INTRODUCTION
 8. Collisions INTRODUCTION While traffic collisions can affect anyone, they have a disproportionate impact on bicyclists, who along with pedestrians are the most vulnerable users of the transportation
Truck Climbing Lane Traffic Justification Report
 ROUTE 7 (HARRY BYRD HIGHWAY) WESTBOUND FROM WEST MARKET STREET TO ROUTE 9 (CHARLES TOWN PIKE) Truck Climbing Lane Traffic Justification Report Project No. 6007-053-133, P 101 Ι UPC No. 58599 Prepared by:
Louisiana Traffic Records Data Report 2017
 Louisiana Traffic Records Data Report 2017 crashdata.lsu.edu Dr. Helmut Schneider September 2018 Overview Trends in crashes, fatalities & injuries Findings from the Occupant Protection Survey of 2018 Driving
2015 Victorian Road Trauma. Analysis of Fatalities and Serious Injuries. Updated 5 May Page 1 of 28. Commercial in Confidence
 2015 Victorian Road Trauma Analysis of Fatalities and Serious Injuries Updated 5 May 2016 Page 1 of 28 Commercial in Confidence VICROADS_n3445896_2015_Victorian_Trauma_Report_- _updated_may_2016.docx 2015
Dear Fellow Nebraskans:
 Dear Fellow Nebraskans: In accordance with the provisions in the Safe, Accountable, Flexible, and Efficient Transportation Equity Act A Legacy for Users (SAFETEA LU), each state is required to develop
Speed Management Action Plan
 Speed Management Action Plan National Selection Criteria Criteria Description Fatalities The number of fatalities resulting from speeding-related crashes. Percentage Compares total fatalities in each State
RESOLUTION NO ?? A RESOLUTION OF THE CITY OF NEPTUNE BEACH ADOPTING A COMPLETE STREETS POLICY
 RESOLUTION NO. 2018-?? A RESOLUTION OF THE CITY OF NEPTUNE BEACH ADOPTING A COMPLETE STREETS POLICY WHEREAS, safe, convenient, and accessible transportation for all users is a priority of the City of Neptune
Northbound San Jose Avenue & I-280 Off-Ramp Road Diet Pilot Project
 Project Overview Fed by a two-lane Interstate-280 (I-280) off-ramp, high vehicular volumes and speeds are longstanding issues along San Jose Avenue. Residents in the surrounding neighborhoods have expressed
Public Information Centre
 WELCOME Public Information Centre Father Tobin Road Lougheed Middle School - Library Wednesday November 7, 2012 7:00 p.m.to 9:00 p.m. Please sign in Neighbourhood Traffic Calming Guide Background The City
Preliminary Review of the T-REX Southeast Corridor Highway and Light Rail Transit Project
 Preliminary Review of the T-REX Southeast Corridor Highway and Light Rail Transit Project DRCOG Congestion Mitigation Program White Paper 07-1 (February 16, 2007) On time and under budget! Festivities
NY Route 5 Comprehensive Pedestrian Safety Study: A Corridor Perspective CDTC Planning Committee. January 7, 2015
 NY Route 5 Comprehensive Pedestrian Safety Study: A Corridor Perspective CDTC Planning Committee January 7, 2015 Project Objective Study Scope: Perform an analysis of pedestrian related accidents, An engineering
CTDOT Pedestrian and Bicycle Safety Initiatives
 CTDOT Pedestrian and Bicycle Safety Initiatives 2017 Northeast Transportation Safety Conference Mark F. Carlino, P.E. Traffic Engineering Division Chief Bureau of Engineering and Construction Connecticut
Keep Customers and Ourselves Safe. Mark Shelton, District Engineer. Tracker. Measures of Departmental Performance
 Keep Customers and Ourselves Safe Mark Shelton, District Engineer Tracker Measures of Departmental Performance Safety is a daily commitment for all MoDOT employees. From design and construction to operations
G AT E WAY PLAN. Community BRIEFING KIT GATEWAY BIKE
 G AT E WAY PLAN GATEWAY BIKE Community BRIEFING KIT PLAN August 2016 TABLE OF CONTENTS INTRODUCTION... 1 THE BENEFITS OF A BIKEABLE COMMUNITY... 2 ECONOMY...2 SAFETY...3 HEALTH...3 HOUSEHOLD SPENDING...3
Institute of Transportation Engineers Safety Action Plan
 I Institute of Transportation Engineers Safety Action Plan 1. Introduction 2. Intersection Crashes 3. Keep Vehicles on the Road 4. Minimize Consequences When Vehicles Leave the Road 5. School Crossing
A review of 2015 fatal collision statistics as of 31 December 2015
 A review of fatal collision statistics as of 31 December This report summarises the main trends in road fatalities that have emerged in. This has been prepared by the Road Safety Authority following analysis
BICYCLE RULES OF THE ROAD
 ILLINOIS ILLINOIS ILLINOIS ILLINOIS ILLINOIS ILLINOIS ILLINOIS ILLINOIS BICYCLE RULES OF THE ROAD Jesse White Secretary of State Bicycle riding is a great way to get into shape and enjoy the outdoors.
Keep Customers and Ourselves Safe. Mark Shelton, District Engineer. Tracker. Measures of Departmental Performance
 Keep Customers and Ourselves Safe Mark Shelton, District Engineer Tracker Measures of Departmental Performance Safety is a daily commitment for all MoDOT employees. From design and construction to operations
Pedestrian and Bicycle Crashes
 Pedestrian and Bicycle Crashes Pedestrian and Bicycles Overview Pedestrian-related crashes represent 3.6% of the total reported traffic crashes; however, they account for 11.1% of all traffic crash deaths.
MUTCD Part 6G: Type of Temporary Traffic Control Zone Activities
 MUTCD Part 6G: Type of Temporary Traffic Control Zone Activities 6G.01 Typical Applications Each temporary traffic control (TTC) zone is different. Many variables, such as location of work, highway type,
Arvada Traffic Engineering DiExSys Roadway Safety Systems Detailed Summary of Crashes Report
 79983 Location: 7A Begin:.87 End:.9 From:// To:/3/ Severity PDO: 8 INJ: FAT: Number of Vehicles Location One Vehicle: 8 Two Vehicles: Three or More: On Road: 77 Off Road Left: 3 Off Road Right: Off Road
Appendix A: Safety Assessment
 Appendix A: Safety Assessment Safety Assessment Appendix A A Statement of Philosophy The efficient and responsible investment of resources in addressing safety problems is a difficult task. Since crashes
Characteristics of Traffic Accidents in Highway Work Zones
 Characteristics of Traffic Accidents in Highway Work Zones A DETAILED ANALYSIS OF WORK ZONE ACCIDENTS REPORTED ON NEW YORK STATE DEPARTMENT OF TRANSPORTATION CONSTRUCTION PROJECTS ESTABLISHED THE PREDOMINANT
In 2014, the number of traffic fatalities in the United States reached its lowest level at. Bicycle Collisions. Effective in Reducing
 CASE STUDY Pierre Aden/shutterstock.com Countermeasures Prove Effective in Reducing Bicycle Collisions By Nazir Lalani, P.E. and Kristopher Gunterson In 2014, the number of traffic fatalities in the United
Lessons Learned from the Minnesota County Road Safety Plans. Richard Storm CH2M HILL
 Lessons Learned from the Minnesota County Road Safety Plans Richard Storm CH2M HILL May 21, 2014 Overview of the MN CRSP: Why Prepare Safety Plans for Local Systems? MAP-21: Requires states to address
Pinellas County Safety Initiatives
 Florida Department of TRANSPORTATION Pinellas County Safety Initiatives Whit Blanton, FAICP Pinellas County MPO A Distinctive County A unique geography Multi-jurisdictional Key demographics seniors and
Agenda. Overview PRINCE GEORGE S PLAZA METRO AREA PEDESTRIAN PLAN
 PRINCE GEORGE S PLAZA METRO AREA PEDESTRIAN PLAN May 28, 2008 Agenda Welcome and introductions Project overview and issue identification Planning context and strengths Design challenges and initial recommendations
WELCOME Public Information Centre
 WELCOME Public Information Centre Fernforest Drive Brampton Soccer Centre Community Room #2 Tuesday January 19, 2016 6:30 p.m.to 9:00 p.m. Please sign in Neighbourhood Traffic Calming Guide Background
Canadian Association of Chiefs of Police Association canadienne des chefs de police
 WHAT S IN THE KIT? Media Advisory Template To be used to invite the media to an event during Operation Impact. We suggest you reproduce this on your own police agency letterhead. News Release Template
BICYCLE SAFETY: A PARENT S GUIDE
 BICYCLE SAFETY: A PARENT S GUIDE Thank you for partnering with the Newport Beach Police Department to help make your child a safer bicyclist. BE A ROLL MODEL LEARN. As a parent, it is important that you
Chapter 5 DATA COLLECTION FOR TRANSPORTATION SAFETY STUDIES
 Chapter 5 DATA COLLECTION FOR TRANSPORTATION SAFETY STUDIES 5.1 PURPOSE (1) The purpose of the Traffic Safety Studies chapter is to provide guidance on the data collection requirements for conducting a
VISION ZERO ACTION PLAN
 PALM BEACH Transportation Planning Agency VISION ZERO ACTION PLAN TPA Advisory Committee Meetings March 2019 PURPOSE Present the Data Analysis Key Findings and the Action Items from the Draft Action Plan
Pedestrian Safety HANDBOOK
 City & County of San Francisco Department of Public Health Community Health Programs International Institute of San Francisco Immigration & Citizenship Program Find out more about our injury data, community-based
For Information Only. Pedestrian Collisions (2011 to 2015) Resolution. Presented: Monday, Apr 18, Report Date Tuesday, Apr 05, 2016
 Resolution. Presented: Monday, Apr 18, Report Date Tuesday, Apr 05, 2016") Presented To: Operations Committee For Information Only Pedestrian Collisions (0 to 0) Presented: Monday, Apr 8, 06 Report Date Tuesday, Apr 0, 06 Type: Correspondence for Information Only Resolution For
Presented To: Operations Committee For Information Only Pedestrian Collisions (0 to 0) Presented: Monday, Apr 8, 06 Report Date Tuesday, Apr 0, 06 Type: Correspondence for Information Only Resolution For
APPENDIX A: Complete Streets Checklist DRAFT NOVEMBER 2016
 APPENDIX A: Complete Streets Checklist DRAFT NOVEMBER 2016 Complete Streets Checklist MetroPlan Orlando s Complete Streets Checklist is an internal planning tool for staff to further implementation of
VILLAGE OF NILES TRAFFIC CALMING POLICY
 INTRODUCTION There is increasing interest across the country in developing new strategies to reduce the speed and amount of traffic in residential neighborhoods. Measurement of speeds, traffic volumes,
Traffic Collision Statistics Report
 Traffic Collision Statistics Report 2016 Prepared by Tahir Hameed, M.Eng, P.Eng, PTOE Traffic Safety Engineer Debbie Rawson, M.Sc. Transportation Integration and Safety Advisor Transportation Planning