A STUDY OF SEASONAL MOVEMENTS OF IN THE CAVE CREEK BASIN OF THE CHUUCAHUA MOUNTAINS. Joseph M. Welch. A Thesis Submitted to the Faculty of
|
|
|
- Victoria Kelly
- 6 years ago
- Views:
Transcription
1 WHITE-TAILED DEER A STUDY OF SEASONAL MOVEMENTS OF IN THE CAVE CREEK BASIN OF THE CHUUCAHUA MOUNTAINS by Joseph M. Welch A Thesis Submitted to the Faculty of WILDLIFE MANAGEMENT In Partial Fulfillment of the Requirements For the Degree of MASTER OF SCIENCE In the Graduate College UNIVERSITY OF ARIZONA I960


2 STATEMENT BY AUTHOR This thesis has been submitted in partial fulfillment of requirements for an advanced degree at the University of Arizona and is deposited in the University Library to be made available to borrowers under rules of the Library. Brief quotations from this thesis are allowable without special permission, provided that accurate acknowledgment of source is made. Requests for permission for extended quotation from or reproduction of this manuscript in whole or in part may be granted by the head of the major department or the Dean of the Graduate College when in their judgment the proposed use of the material is in the interests of scholarship. In all other instances, however, permission must be obtained from the author. APPROVAL BY THESIS DIRECTOR This thesis has been approved on the date shown below;.e K«Sowls As social e\plro lessor of Zoology [ U o
3 This study was financed by the Arizona Cooperative Wildlife Research Unit, which is cooperatively maintained by the following organizations: The University of Arizona, The Arizona Game and Fish Department, The U. S. Fish and Wildlife Service, and The Wildlife Management Institute.
4 ACKNOWLEDGEMENTS During the course of field investigations and in the preparation of this manuscript, I received help of various kinds from many people. I am indebted for the financial assistance given me by the Arizona Game and Fish Department; the Mrs. Lincoln Ellsworths grant through the American Museum of Natural History; and the Arizona Cooperative Wildlife Research Unit, which made this study possible. Sincere gratitude is due especially to lyle K. Sowls and Charles R. Huagerford of the Arizona Cooperative Wildlife Research Unit, for their continuous help and encouragement in the field; and advisement and editing of this manuscript Probably no other person is more aware of the problems involved in conducting this study than Jerry Day, Research Biologist for the Arizona Game and Fish Department. Jerry was at all times ready and willing to draw on his knowledge and experience in assisting me in carrying on agr study. Special thanks are due to Mont A. Cazier, Director of the Southwestern Research Station, who assisted the writer in obtaining financial aid, and offered many suggestions; Jack McCormick, American Museum of Natural History, for his advice and criticisms; and John G. Anderson of the Southwestern Research Station, for his help in obtaining track counts. Appreciation is extended to Steve Gallizioli, Research Supervisor, and Ronald Smith, Biologist-Statistican, of the Arizona ii
5 Game and Fish Department, for their suggestions and assistance* Thanks are also due the following members of the University of Arizona faculty: Henry Tucker, Professor of Statistics and Mathematics, for his advice and assistance with the statistical analysis of the data; E. L. Cockrum, Associate Professor of Zoology, for his assistance and advice with field work and in editing portions of this manuscript; William J. McConnell, Assistant Professor of Wildlife Management, for his comments and suggestions on the statistical analysis; and Donald Sayner, Instructor in Zoology, for his guidance in preparing the illustrative material for this paper. The writer is very grateful to Bess Hunt, secretary of the Arizona Cooperative Wildlife Research Unit, who was always encouraging and helpful. Mention should be made of the encouragement and help given me by my friends in the University, especially Norris Crawford, Robert Whistler, Robert Yoder, Leslie Giver, and Richard Rigby. - " ' ' ' " "* - I < > '.. J, ; Their kindness and consideration will not be forgotten.. Deep appreciation is extended to my wife Lil, and son Roy, who spent many hours and walked untold miles in helping me in setting up this study. -. ill
6 TABLE OF CONTENTS Chapter Page I INTRODUCTION Study Area II METHODS Pellet-group count method Defecation rate of deer Factors affecting pellet-group counts.. 13 Plots size and shape Weathering of pellet-groups Moisture content of pellets Procedure to establish transects and plots Counting procedure Track counts Factors affecting track counts Track count procedure Use of dyes Procedure Observations Procedure III R E S U L T S Movements Winter movements Spring movements Summer movements Fall movements Findings in study area Deer density at varing elevations Sex and doe-fawn ratios Statistical analysis Analysis of variance Duncan? s multiple-range test CONCLUSIONS Movements Evaluation of the pellet-group count Evaluation of the track count Management of the coues white-tailed deer 56 iv
7 Chapter Page APPENDIX A APPENDIX B APPENDIX C LITERATUBE C U E D % , 77
8 LIST OF TABUSS..., - P&5 1 Pellet-groups per acre per month by period and area Average of triplicated::, track counts per month at three altitudinal levels..... * Tracks counted after fresh snows at three different elevations Pellet-groups per acre per month from three counts obtained in the Fly1s -Peak study area 37 5 Average number of deer per square mile 38 6 Analysis of variance of pellet-group counts Comparison of the mean number of pellet-groups per plot per day by period and area Comparison of the mean number of pellet-groups per plot per day for periods and areas at.the. 95 percent confidence level Comparison of the mean number.of pellet-groups per plot per day by areas in each period at the 95 percent confidence level Comparison of the mean number of pellet-groups per plot per day for periods and areas by Duncan*» multiple-range test Comparison of the mean number of pellet-groups perplot per day for areas in each period by Duncan* s multiple-range i t e s t Major plant species occurring in study areas Moisture content of'individual pellets vhen fresh and after weathering vi
9 LIST OF FIGURES sure Fly Park, typical of the parks above 8,000 feet. Note the hedging on spruce Engelmann spruce (Picea Engelmanni) showing heavy use The writer standing beside a heavily browsed Douglas fir (Pseudotsuga taxifolia). near Onion Saddle. 6 Gambel oak (Onereus Qambelii) near Turkey Park, showing critical utilization Page Mountain mahogany (Gercocarpus breviflorus). the key browse species in the area View of Cave Creek Basin. Note the contrast between the open browse covered slopes to the dense brush in the b a s i n Map showing location of study areas Comparison of pellet-groups per acre per month by period and a r e a Comparison of rainfall and mean monthly temperatures for Silktassel (Garrya Wrightii) showing the critical utilization of browse around permanent sources of water Diagramatic view of transects and base line in study area Diagramatic view of transects and base line in. study area Diagramatic view of transects and base line in study area Diagramatic view of transects and base line for study areas 4 and 5 *». «66 vii
10 Figure Page 15 Diagramatic view of transects and base line for study area Diagramatic view of transects and base line for study area 7* 70 viii
11 ' _ CHAPTER X - INTRODUCTIOH.. :. The Coues White-tailed Deer (Qdocoileua virginianua couesi) is an important big-game animal in Arizona* Like other big-game species in the state, it has been subjected to an increasing amount of hunting pressure* A knowledge of such factors as movements and behavior are essential for the formulation of future programs for its management* Taylor, (1956) reported that the northern uhite-tailed deer exhibits an annual migration to avoid adverse climatic conditions and to obtain forage; but that little was known about the seasonal movements of the Coues white-tailed deer* The purpose of this paper is to present data on the seasonal movements, factors affecting seasonal movements, and notes on the behavior of the desert white-tailed deer in southern Arizona* The study was carried on in the Chiricahua Mountains, Cochise County,., in southern Arizona. Work was started in September 1958, and detailed study and observations were carried on until November 1959* Study Area ; This study was carried out in the Chiricahua Mountains which run in a general north to south direction for a distance of apprarl-
12 2 mately forty miles, and extend in an east to west direction for approximately twenty miles* The mountain merges into the desert at approximately 4,500 feet in elevation; and the high points in the area are Flysand Chiricahua Peaks, which are 9,795 feet in elevation# Seven study areas were selected on the basis of dominant vegetation, elevation, deer utilization, and accessibility. These study areas range from 5,400 to 9,500 feet in elevation in the following vegetative types $ Spruce-Fir, (Picea Engelaanni-Pseudotsuga taxi-folia): Ponderosa Pine-Douglas Fir, (Finns ponderosa-pbaudotsuga taxifolia): Oak-Juniper Mahogany, (Quercus Arizonina-Juniperus Deppeana. Cercocarpus brevlflorua): and Pine-Oak Woodland, (Pinna c-m VmaVmana-Quercus sp.). Kearney and Peebles (1951) The climate of the region is typified by two rainy and two dry periods annually# The maximum precipitation occurs as heavy showers in the summer; and the minimum precipitation falls in the winter in the form of slow continuous rain and snow# The average rainfall for the area is about twenty inches. Smith (1956). The summer rains result from a thermal low, which dominates the southwest at that time of the year; and the winter rains and snow result from the occasional passage of cold fronts through the area. The diurnal temperature range is large but the mean maximum is 70 Fahrenheit while the mean minimum is about 40 Fahrenheit, Smith (1956). The Chiricahuas lie largely within the boundary of the Coronado National Forest and are under the jurisdiction of the
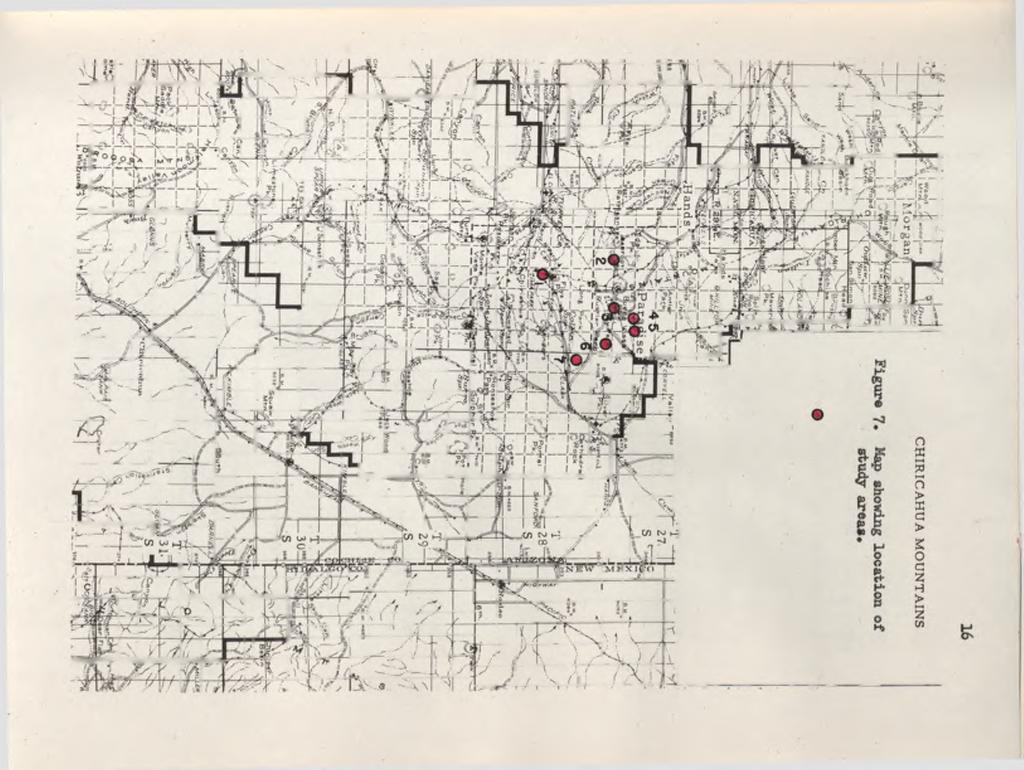
13 ' 3 U. S. Forest Service* The primary duties performed by the Forest Service here are: (l) fire suppression; (2) control of grazing allotments for domestic livestock; and (3) providing recreational areas for public use. The area is divided into grazing allotments and permittees are granted year-around grazing privileges. Some timber is cut for commercial use, but in limited areas and on a small scale. Figures 1 through 6 are photographs of the area studied.

14 4 figure 1. Fly Park, typical of the parks above 8,000 feet. Note the hedging on spruce.


15 Figure 2 5


16 Figure 3. The writer standing beside, a heavily browsed Douglas fir (Pseudotsuga taxifoil a ), near Onion Saddle, 6

17 Figure 4* Gambel oak (Onerous Gambelii) near Turkey Park, showing critical utilization*
18 Figure 5«Mountain mahogany (Cercocarpus breviflorus). the key browse species in the area.


19 Figure 6. View of Cave Creek Basin. Note the contrast between the open browse covered slopes to the dense brush in the basin. 9
20 CHAPTER II METHODS A review of the literature reveals that the methods employed to determine deer movements are of two kinds: direct and indirect* Examples of these methods are: trapping and marking deer individually with ear tags and observing them in the field, a direct method, Daamann and Taber (1958); use of dyes to color the droppings of deer to trace movements, an indirect method, Kindel (1958); pellet-group counts over. - ' " areas to determine distribution and concentration, an indirect method, McCain (1948); and Riney (1957)5 track counts along roads to determine numbers and movement, an indirect method, McDermott (1951) 5 and sight observations of recognizable individuals, Clark (1953) and Hanson and McCulloch (1955). Four methods were used to determine seasonal movements of the desert white-tailed deer in this study; these were pellet-group counts, roadside track counts, sight observations, and dyes to color the droppings of the deer* The first method consisted of obtaining periodic pellet-group counts on circular plot pellet transects in each of seven areas. Periodic counts of pellet-groups on systematic transects revealed 10
21 u the portion of the area where the deer spent their time, revealed changes in seasonal distribution and concentration, and indicated key portions of the range. Seasonal differences in the distribution of pellet groups were interpreted as evidence of deer movements within various parts of the environment. The second method consisted of obtaining monthly track counts along the roadside in the major elevational levels. Track count indices were used in conjunction with pellet-group counts in determining deer movements* The third method consisted of mixing a special dye with loose salt, placing the dyed salt in areas where deer might consume it and consequently color their droppings, and tracing their movements from the colored droppings. The fourth method consisted of observing deer, deer sign, and forage utilization in all elevational levels. Pellet-Group Count Method The pellet group count method and its origin are thoroughly described by Hazzard (1958) in his review of "Big-Game Census Techniques". The pellet group count has been used primarily to determine the number of deer in an area by obtaining periodic counts on lines or plots on a representative portion of the whole area. Since the original study by Bennett et al., (1940), the pellet-group count has been used by many workers to determine deer movements, numbers and population trends; eg. McCain (1948),
22 12 Leopold et al, (1951)# Rinegr (1957)# Rogers et al, (1958) and Robinette et al# (1958). The method is well suited for study of deer movements because pellet-groups are deposited at a constant rate and indicate the density of deer in the area# Defecation Bate of Deer. The effectiveness of the pellet- group count depends on a knowledge of the defecation rate of the deer. Rasmussen and Doman (1943) found 12.7 pellet-groups per day to be the normal defecation rate for mule deer. They arrived at this figure tdien they were conducting a study with a known-size deer herd on a 714 acre pasture in Utah. Ferguson (1955) revised this figure to by a correction of Rasmussen and Roman s data. Dasmann and Taber (1955) concluded that the defecation rate for the Columbian black-tailed deer varied seasonally as a result,i *. ' ' '. * V «. '. w '.TW -V»- - - H * of differences in seasonal diet, but felt the average approximated 13.0 groups per day. Sierhardt and Van Etteh (1956) reported a statistically significant difference (at the one percent level) in the defecation rate of white-tailed deer by age and diet, during the winter in Michigan. Other workers observed that when deer switch from a diet of browse to a diet of green succulent forage, an increase in the defecation rate resulted, Dasmann (1956). Charles Wall mo (personal communication) stated that he obtained opposite findings with the white-tailed deer in Texas. Wallmo stated We discovered that there were radical changes in the total density of pellet-groups that greatly exceeded the possibility
23 of equivalent population changes or movements. Soon we discovered that corollary vegetation studies indicated an inverse relationship between quantity of succulent vegetation and average pellet-group densities, likewise, forage use estimates indicated a comparable shift to herbaceous vegetation, and pellet group densities increased. This observation is partially corroborated by analyses of data, but these were only superficial analyses.:l Because the defecation rates found for all three species closely. approximate each other, I assumed 13.0 pellet-groups per day to be a plausible figure. Factors Affecting Pellet-Groan Counts. There sure a number of factors which introduce error in pellet-group counts. Leopold et al, (1951) listed the following sources of error in this method. 1. Deer that die during their stay on the range leave after them numbers of pellet groups that vary with the time spent alive on the area. This will tend to raise counts. 2. In hilly or mountainous country a source of error lies in counting of pellet-groups on surface acres, whereas compilation must, without considerable expense, be based on map acres. This will tend to lower counts. 3. On slopes, pellets may be washed away or covered with silt, which will tend to lower counts. 4. In rocky, brushy, or grassy country some pellet-groups may be overlooked which will make counts conservative. 5. There may be a loss of pellet groups through trampling. This will tend to lower counts. 6. Pellet-groups of the previous year may be counted as of the current year. Unless care is taken to overcome this source of error, computed populations may be much too high. 7» The conversion factor of 12.7 pellet-groups to one deerday may be higher or lower than the true average. 8. Unless a sufficient number of plots are counted to secure a reliable sample, the sampling error may be large. 13
24 . 14 Plot Size and Shape* Various types of transects and plot sizes have been used to obtain pellet-group counts. Ferguson (1955) tested three sizes of circular plots and concluded that the 100-square foot plot was the most efficient in terms of time expended. Ferguson states that the use of circular plots reduced the manpower required to establish transects and reduced fatigue error that is so prevalent in strip transects. Bobinette et al, (1958) also concurred that circular plot pellet transects were more accurate, easier to establish and read than strip transects. Because circular plots are considered better than strip transects the writer decided to use circular plots in this study. _ Weathering of Pel T at-groups. The date when & partievilat* pellet-group was deposited is often important in making counts. For this reason it is necessary to know how quickly pellets decompose. Eberhardt and Van Etten (1956) in Michigan found pellets to remain relatively unchanged for three years. However in the arid southwest little was known about.the rate of decomposition of deer pellets. Dietary differences, both seasonal and elevational, and exposure no doubt effect the decomposition rate. Fresh pellet-groups were located in various elevations* X examined certain pellet-groups periodically and noted the effects of weathering. The results of these observations are presented in Appendix B. : Moisture Content^ of P e l l T o determine the effect o f ; moisture lose on decomposition rate/ the writer collected pellets
25 from the lower Intestinal track of four deer which were collected by Gerald I. Day of the irizcma Game and Fish Department. A sample of five pellets were taken from each animal; pellets were weighed individually and then dried at 100 Fahrenheit for five days, then reweighed and the moisture content of each pellet determined* The remainder of the pellets from each animal were placed in the area where the animal was collected. Periodically, samples were collected and moisture content ascertained and weathering effects noted. The results of these analysis and observations are presented in Appendix B, Procedure to Es^AhU Transects and Plots. Areas were selected which represented certain dominant vegetation and elevations, were utilized by deer, and that were accessible. Study areas ranged from 5,500 to 9,500 feet in elevation. Each study area was seventy-chains long and twenty chains wide, with eight transects (twenty chains long) spaced ten chains apart. On each transect were six 100-square-foot » - circular plots with centers 260 feet apart. A steel stake marked with a numbered aluminum tag marked the center of each plot, r A cruising compass and a 100 foot steel tape were used to T " establish the base line and transect azimuths. Orange engineer* s flagging was used to mark transects, with double streamers near each plot and X. shaped streamers at the end of each transect. A complete description of the vegetation, location and a diagramatic view of each ar$a is given in Appendix A. Figure 7 shows the location of the study areas in the Chiricahua Mountains. V. : '

26
27 17 Counting Procedure. A steel cable, 5*7 feet in length was slipped over the steel center stake of each plot. The plot was read by circling the stake and recording the number of pellet-groups within the circle. Pellet-groups that fell on the line were considered in the plot. In order to compensate for slope, the cable was held horizontally so that pellet-groups were counted on a planimetric surface. Counts were obtained approximately every fifty to sixty days and recorded by plot and transect numbers* Track Counts Track counts have been successfully used to determine deer population trends and movement. W i g h t and Swift (l%2) successfully measured trends in deer during the spring migration in Colorado* McDermott (1951) obtained satisfactory results and recent research indicates that populations of many species can be estimated from track counts, Tyson (1959)* McDermott (op. cit.) counted tracks each day along the road during the spring migration. Counted tracks were obliterated each day by dragging the road with pinyon trees chained together and pulled by a truck* Factors Affecting Track Counts. There are a number of factors that affect track counts. Hazzard (1958) found the following factors introduced error in track counts:
28 2 J 6 1. Tracks are less visible on rocky soil.. 2. Rain washes out fresh trades. 3. Single-file crossings of more than one deer make counts difficult. 4. Livestock obliterate tracks. 5. Vehicles obliterate tracks. 6. Occasionally fresh snow covers tracks. The above mentioned factors all tend to produce conservative counts; but despite these factors, many workers have contended that track counts are worthy of consideration in determining deer movements. Track Count Procedure. A roadside track count route was established along four miles of road ranging from 5,000 to 8,100 feet in elevation. One half mile strips were marked off with flagging, using the speedometer of a car to measure the distance. At first a weighted steel grate (four feet by four feet) was dragged behind a car along the shoulder of the road twice each time to disturb the soil and obliterate all old tracks and provide an area on which tracks could be counted. After twenty-four hours, tracks were counted along each one half mile of dragged area. This method proved very unsatisfactory because much of the area was too rocky to reveal tracks. The above procedure was modified and thirty-eight strips one-tenth of a mile long were selected along the road where soil would reveal tracks. These were in the 5,000 to 8,100 foot elevation areas. These strips were measured by using the speedometer of the
29 vehicle and marked with engineer* s flagging tied to trees* The steel grate was replaced with pinyon or juniper trees; two or three trees \t \. si1f - * were iwired together and pulled behind the car* This type of drag disturbed the soil enough that only one trip over the ground was necessary. Counts were obtained as previously described, twenty-four hours after dragging. Counts were obtained once each month but replicated three times to reveal variation in counts and to obtain a mean figure ; After the initial drag each month: fresh tracks were obliterated with 19 a broom while making the counts. ^ Uses of Dves ;'v '. Dyesshave successfully been used to trace movements of big- game in recent studies. Kindel (1958) found that whencertain dyes are consua^d by ruminants, the color would appear in the feces approximately twenty-four hours after ingestion and continue to give the same intensity of color,to the feces for a! period of forty-eight to seventy-two hours. Exposure of the colored pellets to sun, wind, ' ' ', : and rain revealed that the color remained for as long as the pellets themselves resisted weathering* '. Kindel tested twenty-three dyes and dye materials and found only four dyes which produced good fecal stains: Methylene Blue, a green-blue stain; Crystal (Gentian) Violet, a purple stain; Basic Fuse bin, a red stain; and Aniline Blue, a deep blue stain. These
30 20 dyes were mixed in a ratio of approximately one part dye to fifteen. parts of loose salt. Kindel then placed the dyed salt in boxes and distributed them at selected points in his study areas. Procedure. In this study the use of dyes was limited. One part of Basic Fuschin was combined with twenty parts of loose salt and placed in small wooden boxes located near two cattle licks where deer had been observed previously. One week after placing the dyed salt in the areas, a radius of one-half mile around the salting location was searched for colored deer droppings. No colored deer droppings were found but several colored cattle droppings were observed. Cattle remained around the licks and consumed a majority of the salt leaving little for the deer. Because the technique did not prove practical, its use was discontinued. Observations Leopold, (1933) mentions that certain individual animals can be identified by abnormalities and that data on movements have been obtained from observations on these animals. Clark, (1953) determined the home range of seven mule deer, in the Tucson Mountains,.These deer had identifying abnormalities. Hanson and McCulloch (1955) recorded the movement of recognizable individual mule deer in the Arizona Chaparral. Procedure. Deer were observed whenever possible by several methods. Vantage points were selected from which large areas could
31 be scanned with binoculars (7*35), and a spotting scope (2?x), during the early morning and evening hours. Areas were covered on foot and horseback, and observations were made from various points# After dark, concentration areas were examined with a spot light and deer were identified with the aid of binoculars#
32 CHAPTER III RESULTS Six pellet-group counts and ten roadside track counts were obtained during the study* Pellet-group counts were recorded every fifty to sixty days, while track counts were obtained on three successive days each month. The study period was divided into six segments as followst Season Period Time Interval Early Winter _ to Late Winter to Spring to Early Summer to Late Summer , to Pall to The time interval between pellet-group counts was not the same for each area during each period. Pellet-group counts are presented as pellet-groups per acre per month to make direct comparison possible. The method of converting pellet counts to pelletgroups per acre per month is described in Appendix C. 22
33 23 Table 1 shows the results of the six pellet-group counts by period and area. Area 1 is deleted because incomplete readings were obtained, and is discussed separately. Figure 8 is a graphic representation of Table 1, showing the number of pellet-groups per acre per month by period and area. Table 2 shows the results of the monthly track counts and? Table 3# counts obtained just after a fresh snowfall. Figures are means of counts obtained three days in succession each month* Movements The desert white-tailed deer apparently does not exhibit a seasonal migration in the strict sense of the word. However, seasonal movements were observed to be important in the yearly cycle. Seasonal movements were caused by various factors, the primary ones being: distribution of food and water, availability of cover, breeding activity, and the presence of hunters. Some factors affected movements throughout the year, while others influenced movements during specific seasons of the year* Pellet-group counts reflected movement, in that an increase or decrease in pellet-group density indicated various densities of ; deer. Observations and track counts were used to augment pellet- group counts in determining deer movements. The findings from pellet counts, track counts, and observations are combined in describing seasonal movements.
34 Table 1. Pellet-groups per acre per month by period and area. PERIODS Winter Spring Summer Fall Elevation Area U 5 6 Means Vegetation tooo no U O P. Pine-D. Fir P. Pine-D. Fir Mfcn. Mahog. Oak-Juniper Mtn. Mahog. Oak-Juniper Pine-Oak Woodland Pine-Oak Woodland Means


35 ^ AREAS FT FT FT FT FT F T. <D a- 200 Q) < </> 150 <5 125 % Luu PERIODS F IG.* COMPARISON OF PELLET GROUPS PER ACRE, PER MONTH BY PERIOD AND AREA. Vi
36 Table 2* Average of triplicated track counts per month at three altitudinal levels* Months of Elevations December January February March April Hay June July** August October* November* * Indicates that only one count was obtained during that month. ** Indicates that a two day count was obtained instead of three* Figure 9 shows the mean monthly temperatures and monthly precipitation for 1959 recorded by the Arizona Game and Fish Department at one of the deer-cattle exclosures located at 6,500 feet elevation in the Chiricahuas. Pellet-counts were lowest during the period of heaviest rainfall, and these counts generally started to decrease when the mean monthly temperature reached 55 Fahrenheit.
37 27 Table 3* Tracks counted after fresh snows at three different elevations. Elevations Date 5.QOO-6.QOO ; 5 12 * * No count obtained because of deep snow* * Winter Movements.' Pellet-group and track counts obtained indicated that the greatest number of d e w occurred in the 6,000-7,000 foot level during the winter* Distribution of deer coincides with the distribution of mountain mahogany, the key browse species in the area at about 6,500 feet in elevation* Results of the second winter pellet-count from January 3 to March 3, indicated.a general increase in deer activity in all study areas except 2 and 7* Activity in area 2 remained unchanged while area 7 reflected, a 50 percent decrease in deer activity* During this season, three dif ferent types of movements were observed* deer drifted into the middle elevations from upper areas; hunters moved deer out of their home ranges; and there were movements resulting from increased breeding activity. Early in November, snow fell in the upper elevations and was followed by a drop in temperature. The snow cover provided


38 o **- c o or Mean Monthly Temperature MONTHS OF YEAR Fig.9 Comparison of rainfall and mean monthly temperature Paradise Exclosure, ' 8
39 29 an opportunity to track deer and study movements. Some of the deer in the upper elevations, (above 8,000 feet) moved downward into the six and seven thousand foot levels to obtain food. Because of the steepness of the country, the distance covered by this movement was about a mile and a half. At this time of the year, deer were largely confined to the open southern and eastern exposures which support dense stands of mountain mahogany, but remained warm and relatively free of snow. The annual hunting season which occurred during the latter part of November strongly influenced deer movements. Dasmann and Taber (1956) while studying the Columbian black-tailed deer, stated that deer could not be driven from their home ranges, even by dogs. Progulske and Baskett (1958) in Missouri, found that the white-tailed deer left their home ranges as a result of hunting pressure. The heavy snow in the upper elevations restricted many hunters to hunting only the lower elevations. The decrease in deer activity in area 7 dropped from 282 to 142 pellet-groups per acre per month. This apparently resulted from heavy hunter concentrations which caused a number of the deer to move out of the area temporarily. The heavy snow that fell during the hunting season remained on the ground for several weeks and provided tracking opportunities which enabled the writer to note the effect of hunters on deer movements. Some deer made short circles of less than a quarter of a mile, others contoured the ridges and took cover on the brush covered northern
40 30 exposures, and others fled Into canyon bottoms and basins where cover afforded protection. Hunting also influenced daily activity and the choice of bedding areas. Prior to the hunt, deer were seen to bed down, or browse intermittently throughout the day. Extensive feeding occurred during the early morning and late afternoon, usually on the warm southerly exposures. When the hunt began, deer moved to the brush covered exposures where they bedded down during the entire day, coming out only at dusk and after dark to browse. Towards the latter part of the hunting season, as the number of hunters decreased, deer resumed their former routine. The necks of the bucks began to swell early in November indicating the onset of the rut, but the peak of breeding activity occurred during the latter part of December and throughout the month of January. About the middle of December, bucks were easily observed in the open throughout the day as they searched for receptive does. During this season, deer had no true pattern of activity but were apparently less active during the night. At this season does, fawns, yearlings and non-breeding immature bucks formed a small band of 3 to 11 animat? led sometimes by a doe but moving together as a unit. Bucks were seen only occasionally with these groups, and were more often sighted alone. The typical buck-harem association was not found; individual does were chased by bucks but the movements of the small bands were not controlled by a buck.
41 31 Breeding activity continued into February but during the latter part of the month bucks began to lose thelr antagonism towards each other and were seen browsing together* The fact.that deer moved about,in larger groups during the breeding season, and thus deposited more;pellet-groups than usual in some areas offers a possible explanation for the increased pelletcount s recorded during the winter season* This same factor undoubtedly affected track counts similarly* Soring Movements* Movement was not noticeable in the spring because of the marked difference in activity* The beginning of this season (March 3 - May 3) marked the termination of the rut; and deer were seen in small groups of two to three individuals«however, deer moved from the middle elevations into the upper elevations, they moved to different feeding areas, and bucks moved into areas of dense cover* In general, both track and pellet-group counts reflected a decrease in deer activity during the spring. Study areas 3, 4, and 5 reflected decreases in pellet-counts but areas 6 and 7 showed no increase or decrease from the previous period. Area 2 near Barfoot Park, indicated a marked increase in deer activity (see table l). Even though pellet-counts reflected a decrease in deer activity, numerous deer and deer signs were seen.in all study areas* The middle elevations (6,000-7,000) continued to support the highest \ number of deer. '
42 32 About the middle of March, as the weather began to-be warmer, a burst of forb growth occurred above 7,500 feet where moisture was more available than in lower elevations. In the lower elevations, forb growth was restricted to the northern exposures, which were cooler and retained some moisture. At this time some deer moved into the 8,000 foot level from marginal elevations to obtain green forage. This movement accounted for the increased deer activity in study area 2., When the mean temperature increased and moisture became critical due to the lack of rain, deer gradually began to move to the brush covered northern exposures. Here, where it was cooler and shaded, they bedded down more during the day and fed on new forb growth. This lowered the pellet-counts because the transects were primarily on southern and eastern exposures. The fact that some deer returned to the southern exposures to browse after dark resulted in some pellet-groups being deposited on the study areas,: Deer, became less active throughout the day, and fed during the early morning, late evening and after dark. After the rut, bucks were commonly seen together in groups of twos and threes. The antlers were cast about the last of March, Bucks then began to move into the dense brush on the northern exposures, which were cooler, afforded protective cover and green feed. During this period the bucks were reluctant to move and when approached while bedded down they let me come very close to them before they
43 fled, generally downward to the dense cover of the canyon bottoms. Summer Movements. Two pellet-group and four monthly track counts were recorded during the summer, (May 3 - August 29) A marked decrease in deer activity over the preceding period was reflected by pellet-group counts in all study areas, (see table l)» Track counts showed considerable variation but in general an increase was recorded in all elevational levels, over the preceding period (see table 2). -., Hot, dry conditions prevailed from the middle of February through the middle of July, when 1.7 inches of rain fell. The severity of the seasonal drought was such that streams and water seeps became dry, and permanent water was very limited. The dryness also affected the vegetation in that annual forb growth died back and the leaves on the evergreen oaks withered, died, and dropped. These conditions affected movements during this period. Throughout the months of May and June, deer continued to move to the northern brush covered areas from their previous haunts. This movement afforded shade from the intense sun, provided does with protective cover during fawning, and enabled deer to conserve moisture because these areas were cooler than the southern and eastern exposures. Even in the upper elevations, water became limited and deer moved into more moist areas. When later became very scarce in June, deer, especially the pregnant does, moved closer to permanent water. The browse 33


44 figure 10. Silktassel (Garrya Wrightii) showing the critical utilization of browse around permanent sources of water# 34
45 35 around these sources of water reflected past as well as current over-utilization (see figure 10). This has apparently resulted from deer congregating in these areas during past periods of drought. Deer gathering about these sources of water affected track counts in May and June. Higher track counts were recorded on areas near permanent water than on those away from water. A doe, which was identifiable by a limp, was observed to leave her home area late in June and move a little over two miles to available water. She remained there until the summer rains came. Deer restricted their feeding and watering until the twilight hours and after dark to avoid mid day heat. During this hot and dry period, numerous observations were obtained at night with the aid of a spotlight. Deer were seen feeding actively throughout the night; but they watered more during the twilight hours, except the pregnant does which watered throughout the day. This pattern activity continued until the summer rains started. When the summer rains started in mid-july, deer dispersed from sources of permanent water. Movements from that time on were erratic and not too well defined. Does remained in the dense cover as this marked the beginning of the fawn drop. Bucks with new antlers moved out of the dense cover and were seen in groups of twos and threes, feeding on succulent green forage. The summer rains provided an abundance of forage and many deer were observed to move back into their hone areas, yet
46 36 pellet-group counts remained low. The Chirleahua mountains are characterised by steep slopes* Slopes with 60 percent grades are not uncommon. Hard rains in August washed away or destroyed many of the pellet-groups from the plot, therefore, pellet-counts were of little value in determining deer movements during this season. Fall Movements. Movements from several different causes were determined by observations made during this season. Deer moved into the upper elevations from marginal areas, does with new fawns moved into the more open areas, and with the coming of cooler weather, deer moved into the browse areas. During autumn, (August 29,to November 26), both pellet-group and track counts indicated a slight increase in deer adtivity in all study areas, (see tables 1 and 2). Continued heavy rains through- out September undoubtedly destroyed or washed away many pellet-groups. Because of the continued heavy rains, pellet-counts did hot indicate movements clearly. No track counts were obtained in September, and the track counts recorded in October and November were not replicated because the writer was unable to be in the area continuously. At this season of the year, both forbs and the acorns of Gambel oak were abundant in the upper elevations above 7*000 feet. Unlike the oaks at the lower elevations, the Gambel oak here usually produces an annual crop of acorns because of a more dependable moisture supply in the upper elevations. Deer moved into these areas from marginal areas and concentrated around thickets of Gambel oak and meadows to feed on acorns" and forbs.
47 37 Does with new fawns remained In dense cover during the - early life of the faun, but extended their movements in mid-august away from the brushy areas and were commonly seen in meadows, open slopes and along roadsides. Northern exposures became less favorable to deer as rains and lowered temperatures continued. At this time the deer commenced to.move onto the browse-covered southern and eastern exposures. The deer also fed more during the daylight hours and bedded down on more open slopes. The need for free water decreased with lower temperatures, and only rarely were deer observed to take free water during this season. The first killing frost occurred in October; from then on deer continued to congregate on warmer areas and they remained there throughout the winter. Findings in Study Area 1 Study area 1 lies between Fly and Chiricahua Peaks and ranges from 9,000 to 9,500 feet in elevation. Engelmann's spruce and Douglas fir cover the northern exposures while white pine and ponderosa pine cover the southern exposures. Scattered throughout the area are parks and clearings. These parks are not grassy, but support a great variety of forbe which provide a seasonal source of food for deer. The writer was unable to obtain pellet-counts at these high elevations as frequently as in other study areas because snow made the higher country inaccessible from November through the middle of
48 April# I made three trips into the area on snow shoes during the winter to determine whether deer remained in the area# Scattered droppings and occasional tracks indicated that a few deer were year around residents# The transects were established on the first of November thereafter three pellet-group counts were obtained. Table 4 gives the number of pellet-groups per acre per month and the dates for the Fly Peak area# Table 4«Pellet-groups per acre per month from three counts obtained in the Fly Peak study area# Date Pellet-groups per acre oer month Time interval \r\ 'daym to to to It can be seen from Table 4 that there was little deer activity during the winter, but some increase during the spring, summer, and fall# Increases in deer activity corresponded with the forb growth in the spring and summer# The increased deer activity in the spring and summer resulted from deer drifting into this area from marginal areas to utilize the abundant forage# Deer Density at Varying Elevationa Pellet group counts are most commonly used to determine deer
49 39 density. The data in this study can be converted to deer density. Transects were selected, however, to show changes in density at different elevations and movements between these specific areas. The areas were selected to represent specific habitats and areas of average or above density of deer were used for the purpose of the study. Deer density found during the study and the variations in seasonal density shown in Table 5 are expressed in deer per square mile and the variation in the number of deer per acre., Table 5«Average number of deer per square mile. Average number of Variation in deer Elevational range deer per so. mile per so. mile 8,000 and above ,000-8, , , These figures do not constitute actual density but are estimations calculated from pellet-group counts. These figures, however, reflect varying densities by elevation and their fluctuations which result from seasonal movements. Sex and Doe-Fawn Ratios. During the study many deer were observed and classified by sex and age. Of the deer classified, 49 percent were does, 28 percent bucks, and 23 percent fawns. White (1957), while in the area in 1955, found a buck-doe ratio of 1:3*9 aud a doe-fawn ratio of 5*1* this study, I v
50 40 observed a buek-doe ratio of 1:1.7 and a doe-fawn ratio of 2.1:1 during These ratios are in part a reflection of better management and accompanying improvement in range conditions during the past five years. Statistical Analysis : A review of the literature revealed that pellet-group counts have been statistically analyzed in previous studies. Ferguson (1955)> Eberhardt and Van Etten (1956), Hiney (1957), and Robinette et al, (1958) have used various procedures to analyze pellet-group data. Schultz and Muncy (1957) concluded that pellet-group counts offered the greatest possibility of arriving at more specific and reliable conclusions through statistical analysis than other methods. Analysis of Variance. Because the time interval between areas in each counting period were of unequal length, the data was converted to pellet-groups per plot per day by period and area before being analyzed. The analysis of variance for a mixed model with sub-sampling was used. The results of the analysis indicated a statistically significant difference (one percent level) between. counting periods, between study areas, and period by area interaction, but differences between transects were not significant, (see table 6). In order to test for homogeneity of variances, the variance for each area by period was estimated as described by Snedecor (1957)
51 Table 6. Analysis of variance of pellet-group count data. Counts were converted to pellet-groups per plot per day for analysis. : Degrees of Mean Source Freedom Square F-Ratio Periods ** Areas ** Period by area ** Transects N. S. Plots in transects Total 1727 vindicates significance at the one percent level,. and found to be heterogeneous. Cochran (1947) stated that if ordinary analysis of variance methods were used when the true error variance differed from one observation to another, there was loss of efficiency of estimates of treatment effects. The validity of the F-test for all treatments, however, is least affected, but t-tests from a pooled error may give a serious distortion of significance levels, Schultz and Muncy (1957) and other workers have recommended square root transformations of the data to alter heterogeneity of variances so that an analysis of variances assumptions may be satisfied The data in this study was transformed by the square root of N plus one because the data being analyzed were decimals. An analysis of variances of the transformed and original data indicated a coefficient
52 42 of variation of the mean of 25 percent; however, the transformation did not produce homogeneity of variances. Results of F-tests in both analyses revealed the same significance, and because there appears to be little advantage in using the transformed data; the original data is reported. The F value for periods when pellet-group counts were obtained was highly significant at the one percent level. This indicated that significantly different pellet-counts were obtained from period to period. Deer moved in and out of the study areas with seasonal weather changes; these movements were reflected in increased or decreased pellet-group counts. A clear view of this may be obtained from Table 7, which shows the mean number of pellet-groups per plot per day by period and area. Going from winter through summer, the five pellet-counts reflected a general decrease as deer moved seasonally from the study areas into other areas. In the fall, counts indicated a slight increase as deer began to move back into the study areas. Secondly, the F value for areas was highly significant at the one percent level. This indicated that significantly different pellet-counts were obtained from study area to study area. Between 5,500 and 9,000 feet in elevation there were different habitats encountered, and each habitat type supported different densities of deer. This fact can obviously be seen from Tables l and 7, and that the 6,000 to 7,000 foot level supports the highest density of deer. From Table 7, it also can be seen that maximum -movements
021 Deer Management Unit
 021 Deer Management Unit Geographic Location: Deer Management Unit (DMU) 021 is 1,464 square miles in size and is located in the central Upper Peninsula (UP). This DMU is dominated by publicly owned land
DMU 005 Antrim County Deer Management Unit
 DMU 005 Antrim County Deer Management Unit Area Description Antrim County Deer Management Unit is in the Northern Lower Peninsula Region (NLP). It has roughly 74 square miles (47,451 acres) of public land
DMU 038 Jackson County
 DMU 038 Jackson County Area Description The Jackson Deer Management Unit (DMU), or DMU 038, lies in the Southern Lower Peninsula (SLP) region and covers Jackson County. The DMU consists of five percent
Deer Management Unit 252
 Deer Management Unit 252 Geographic Location: Deer Management Unit (DMU) 252 is 297 miles 2 in size and is primarily in southeastern Marquette, southwestern Alger and northwestern Delta County. This DMU
DMU 046 Lenawee County Deer Management Unit
 DMU 046 Lenawee County Deer Management Unit Area Description The Lenawee Deer Management Unit (DMU), or DMU 046, lies in the Southeastern Lower Peninsula (SLP) region and covers Lenawee County. The majority
5/DMU 069 Otsego County Deer Management Unit
 5/DMU 069 Otsego County Deer Management Unit Area Description The Otsego County Deer Management Unit (DMU 069) is in the Northern Lower Peninsula Region (NLP). It has roughly 159 Square miles (101,800
Management History of the Edwards Plateau
 Management History of the Edwards Plateau Eco regions of Texas Edwards Plateau 24,000,000 acres About 15,000 years ago, the Edwards Plateau was much cooler and was more forested than today. Pollen counts
Deer Management Unit 152
 Deer Management Unit 152 Geographic Location: Deer Management Unit (DMU) 152 is 386 miles 2 in size and is primarily in southwestern Marquette County. This DMU falls within the moderate snowfall zone and
DMU 047 Livingston County Deer Management Unit
 DMU 047 Livingston County Deer Management Unit Area Description The Livingston Deer Management Unit (DMU) lies in the Southern Lower Peninsula (SLP) region and covers only Livingston County. Most public
DMU 065 Ogemaw County Deer Management Unit
 DMU 065 Ogemaw County Deer Management Unit Area Description Ogemaw County Deer Management Unit is in the Northern Lower Peninsula Region (NLP). It has roughly 99,000 acres of public land which is about
DMU 040 Kalkaska County Deer Management Unit
 DMU 040 Kalkaska County Deer Management Unit Area Description The Kalkaska County Deer Management Unit (DMU 040) is in the Northern Lower Peninsula Region (NLP) (Figure 1). It has roughly 170,000 acres

DMU 361 Fremont Deer Management Unit Newaygo, Oceana, N. Muskegon Counties
 DMU 361 Fremont Deer Management Unit Newaygo, Oceana, N. Muskegon Counties Area Description The Fremont Deer Management Unit (DMU 361) was established in 2013. It lies within the Southwest Region and covers
SPOTLIGHT DEER SURVEY YO RANCHLANDS LANDOWNERS ASSOCIATION ±10,400 ACRES KERR COUNTY
 SPOTLIGHT DEER SURVEY YO RANCHLANDS LANDOWNERS ASSOCIATION ±10,400 ACRES KERR COUNTY WRITTEN BY: SHANE KIEFER, CWB SARAH KAHLICH, AWB PLATEAU LAND & WILDLIFE MANAGEMENT AUGUST 1, 2016 EXECUTIVE SUMMARY
Population Parameters and Their Estimation. Uses of Survey Results. Population Terms. Why Estimate Population Parameters? Population Estimation Terms
 Population Parameters and Their Estimation Data should be collected with a clear purpose in mind. Not only a clear purpose, but a clear idea as to the precise way in which they will be analysed so as to
Enclosed, please find the 2018 Spotlight Deer Survey Report and Recommendations that we have prepared for your review and records.
 July 26, 2018 YO Ranchlands Landowner Association 1323 Whispering Pines Houston, TX 77055 To the Wildlife Committee: Enclosed, please find the 2018 Spotlight Deer Survey Report and Recommendations that
DMU 024 Emmet County Deer Management Unit
 DMU 024 Emmet County Deer Management Unit Area Description Emmet County Deer Management Unit is in the Northern Lower Peninsula Region (NLP). It has roughly 126 square miles (80,371 acres) of public land
DMU 056 Midland County Deer Management Unit
 DMU 056 Midland County Deer Management Unit Area Description The Midland County Deer Management Unit (DMU) 056 is in the Northern Lower Peninsula (NLP) Region. It has roughly 333, 440 acres and consists
Deer Management Unit 127
 Deer Management Unit 127 Area Description Deer Management Unit (DMU) 127 is 328 sq. miles in size and is found in far western Gogebic County surrounding Ironwood, Bessemer and adjacent rural communities.
48 7 ( ; $ 6 :, / ' /, ) (
 (") n Texas, supplemental deer feeders are as commonplace as deer stands. In fact, in many cases, particularly in South Texas, deer feeders have largely replaced cattle feeders or at least the process of feeding
n Texas, supplemental deer feeders are as commonplace as deer stands. In fact, in many cases, particularly in South Texas, deer feeders have largely replaced cattle feeders or at least the process of feeding
Mule Deer. Dennis D. Austin. Published by Utah State University Press. For additional information about this book
 Mule Deer Dennis D. Austin Published by Utah State University Press Austin, D.. Mule Deer: A Handbook for Utah Hunters and Landowners. Logan: Utah State University Press, 2010. Project MUSE., https://muse.jhu.edu/.
Deer Management Unit 255
 Deer Management Unit 255 Area Description DMU 255 is located primarily in northern Menominee County, but also extends into a small portion of Dickinson, Marquette, and Delta counties. It has totaled 463
DMU 332 Huron, Sanilac and Tuscola Counties Deer Management Unit
 DMU 332 Huron, Sanilac and Tuscola Counties Deer Management Unit Area Description The Greenleaf Deer Management Unit (DMU 332) lies in the Southeast Region of the Southern Lower Peninsula (SLP) and covers
DMU 053 Mason County Deer Management Unit
 DMU 053 Mason County Deer Management Unit Area Description Mason County Deer Management Unit is in the Northern Lower Peninsula Region (NLP) on the Lake Michigan coast. Only 17% of the land base is public
DMU 006 Arenac County Deer Management Unit
 DMU 006 Arenac County Deer Management Unit Area Description The Arenac County Deer Management Unit (DMU) 006 is in the Northern Lower Peninsula (NLP) Region. It has roughly 248,320 acres and consists of
Competition. Competition. Competition. Competition. Competition. Competition. Competition. Long history in ecology
 Two species use the same limited resource or harm one another while seeking a resource Resource Organisms use common resources that are in short supply Resource Interference Interference Organisms seeking
DMU 008 Barry County Deer Management Unit
 DMU 8 Barry County Deer Management Unit Area Description The Barry County Deer Management Unit (DMU) 8 is in the Southwest Region and was once part of the Bellevue deer management unit 38. Bellevue DMU
Life history Food Distribution Management... 98
 BEAR: Table of Contents Overview Life history... 97 Food... 97 Distribution... 98 Management... 98 2010 Statistical Reports Controlled spring bear season harvest... 100 General season black bear harvest...
Annual Report Ecology and management of feral hogs on Fort Benning, Georgia.
 Annual Report 2005 Ecology and management of feral hogs on Fort Benning, Georgia. PROJECT INVESTIGATORS: Stephen S. Ditchkoff, School of Forestry and Wildlife Sciences, Forestry and Wildlife Sciences Bldg.,
Survey Techniques For White-tailed Deer. Mickey Hellickson, PhD Orion Wildlife Management
 Survey Techniques For White-tailed Deer Mickey Hellickson, PhD Orion Wildlife Management SURVEYS two basic types: (1) Total Counts best but rarely feasible. may be possible on small, high-fenced areas.
Deer Management Unit 349
 Deer Management Unit 349 Geographic Location: DMU 349 lies along the lake Michigan shoreline and is largely comprised of western Mackinac county with small portions of southern Luce county and southeastern
DMU 045 Leelanau County Deer Management Unit
 DMU 045 Leelanau County Deer Management Unit Area Description The Leelanau County Deer Management Unit (DMU 045) is in the Northern Lower Peninsula Region (NLP). It has roughly 7,100 acres of State Forest
DMU 043 Lake County Deer Management Unit
 DMU 43 Lake County Deer Management Unit Area Description Lake County Deer Management Unit is in the Northern Lower Peninsula Region (NLP). It has approximately 2, acres of public land which is about half
DMU 082 Wayne County Deer Management Unit
 DMU 082 Wayne County Deer Management Unit Area Description The Wayne Deer Management Unit (DMU 082) lies in the Southeast Region and borders Lake Erie to the East and includes Celeron and Stony Islands
Deer Management Unit 122
 Deer Management Unit 122 Area Description DMU 122 is located in south Dickinson County and includes a small portion of west central Menominee County. It encompasses 163 sq. miles and has remained unchanged
placed on the market.
 With Mimbres River frontage and tremendous grass forage, this jewel in New Mexico s Southern Gila Region is a must have for the discriminating buyer looking to have it all in one easily operated grazing
DMU 072 Roscommon County Deer Management Unit
 DMU 072 Roscommon County Deer Management Unit Area Description Roscommon County Deer Management Unit is in the Northern Lower Peninsula Region (NLP). It has roughly 205,000 acres of public land which is
DMU 073 Saginaw County Deer Management Unit
 Area Description DMU 073 Saginaw County Deer Management Unit The Saginaw County Deer Management Unit (DMU 073) is located in the Southern Lower Peninsula in the Saginaw Bay region of Wildlife Division
PREDATOR CONTROL AND DEER MANAGEMENT: AN EAST TEXAS PERSPECTIVE
 PREDATOR CONTROL AND DEER MANAGEMENT: AN EAST TEXAS PERSPECTIVE BEN H. KOERTH, Institute for White-tailed Deer Management and Research, Box 6109, Arthur Temple College of Forestry, Stephen F. Austin State
Ecology and Environmental Impact of Javan Rusa Deer (Cervus timorensis russa) in the Royal National Park
 in the Royal National Park") Ecology and Environmental Impact of Javan Rusa Deer (Cervus timorensis russa) in the Royal National Park Andrew James Moriarty B. App. Sc. (Hons.) A thesis submitted in fulfillment of the requirements
Ecology and Environmental Impact of Javan Rusa Deer (Cervus timorensis russa) in the Royal National Park Andrew James Moriarty B. App. Sc. (Hons.) A thesis submitted in fulfillment of the requirements
Deer Management Unit 249
 Deer Management Unit 249 Geographic Location: DMU 249 lies along the Lake Michigan shoreline and is comprised largely of Mackinac and Chippewa counties with a small portion of southeastern Luce County
ALTERNATIVE DEER MANAGEMENT PLAN FOR GAME MANAGEMENT UNITS. 12A, 12B, 13A, 13B, 16A, 45A, 45B, 45C, and White-tailed Deer Units
 ALTERNATIVE DEER MANAGEMENT PLAN FOR GAME MANAGEMENT UNITS 12A, 12B, 13A, 13B, 16A, 45A, 45B, 45C, and White-tailed Deer Units Arizona Game and Fish Department April 4, 2006 Alternative Deer Management
Population Ecology Yellowstone Elk by C. John Graves
 Population Ecology Yellowstone Elk by C. John Graves Group Names: Hour Date: Date Assignment is due: end of class Score: + - Day of Week Date Rocky Mountain elk (Cervus elaphus) living in Yellowstone National
Monitoring Population Trends of White-tailed Deer in Minnesota Marrett Grund, Farmland Wildlife Populations and Research Group
 Monitoring Population Trends of White-tailed Deer in Minnesota - 2014 Marrett Grund, Farmland Wildlife Populations and Research Group INTRODUCTION White-tailed deer (Odocoileus virginianus) represent one
2009 Update. Introduction
 29 Update Introduction The Wyoming Game & Fish Department, the University of Wyoming, and the U.S. Fish & Wildlife Service initiated the Absaroka Elk Ecology Project in January 27. Objectives of this project
Minnesota Deer Population Goals. East Central Uplands Goal Block
 Minnesota Deer Population Goals East Central Uplands Goal Block Minnesota DNR Section of Wildlife, 2015 Final Deer Population Goals Block 4: East Central Uplands The following pages provide a description
Minnesota Deer Population Goals
 This document is made available electronically by the Minnesota Legislative Reference Library as part of an ongoing digital archiving project. http://www.leg.state.mn.us/lrl/lrl.asp Minnesota Deer Population
CHECKS AND BALANCES. OVERVIEW Students become managers of a herd of animals in a paper-pencil, discussionbased
 CHECKS AND BALANCES 5 OVERVIEW Students become managers of a herd of animals in a paper-pencil, discussionbased activity. BACKGROUND White Tailed Deer White-tailed deer have always been a part of the forest
Seasonal Distribution Patterns of Deer. Neil Hudson. Field Research, Final Paper
 Seasonal Distribution Patterns of Deer Neil Hudson Field Research, 2002-03 Final Paper Abstract The study that I did was the seasonal distribution patterns of deer. This study is important because by understanding
Agriculture Zone Winter Replicate Count 2007/08
 PEACE REGION TECHNICAL REPORT Agriculture Zone Winter Replicate Count 2007/08 by: Conrad Thiessen Wildlife Biologist Ministry of Environment 400 10003 110 th Avenue Fort St. John BC V1J 6M7 November 2008
8/29/20098 SAHRA - Watershed Visualization
 Module 3 Narration Southwestern Water Cycle 001.wav 26 sec 002.wav 10 sec 003 wav 17 sec Water on Earth is constantly on the move. Water continually circulates between the surface of Earth and the atmosphere
Subject to sale, withdrawal, or error.
 We are privileged to have the exclusive listing on a very scenic ranch in the beautiful western foothills of the Jemez Mountains in the northwest central area of New Mexico. This outstanding offering is
2008 WMU 360 moose, white tailed deer and mule deer. Section Authors: Robb Stavne, Dave Stepnisky and Mark Heckbert
 2008 WMU 360 moose, white tailed deer and mule deer Section Authors: Robb Stavne, Dave Stepnisky and Mark Heckbert Suggested citation: Stavne, R., D. Stepnisky, and M. Heckbert. 2009. WMU 360 moose, white
Evaluating the Design Safety of Highway Structural Supports
 Evaluating the Design Safety of Highway Structural Supports by Fouad H. Fouad and Elizabeth A. Calvert Department of Civil and Environmental Engineering The University of Alabama at Birmingham Birmingham,
White-tailed Deer: A Review of the 2010 Provincially Coordinated Hunting Regulation
 Population Estimate White-tailed Deer: A Review of the 21 Provincially Coordinated Hunting Regulation White-tailed deer in BC were managed using a combination of General Open Season (GOS) and Limited Entry
Deer Census - How to Use It to Calculate Harvest
 Deer Census - How to Use It to Calculate Harvest The Wildlife Business William I. Morrill Wildlife Management, Inc. Boerne, Texas not just a program which utilizes a census to gain information for deer
RANCH & FARM SALES PRESENTS. Hunt Mill Hollow Ranch 730 +/- ACRES $1,900 PER ACRE
 SOUTHWEST RANCH & FARM SALES PRESENTS Hunt Mill Hollow Ranch 730 +/- ACRES $1,900 PER ACRE High Fenced, World-Class Oklahoma Hunting & Recreational Ranch. Secluded high in the Ozark Mountains of northeast
Mule and Black-tailed Deer
 Mule and Black-tailed Deer Mule and Black-tailed Deer: Because mule deer are closely tied to the history, development, and future of the West, this species has become one of the true barometers of environmental
DMU 057 Missaukee County Deer Management Unit
 DMU 057 Missaukee County Deer Management Unit Area Description Missaukee County Deer Management Unit is in the Northern Lower Peninsula Region (NLP). It has over 100,000 acres of state land, just over
Comparison of Documents Norton: FWS-WDC. 1. What is the Porcupine caribou herd's historic calving range?
 Comparison of Documents Norton: FWS-WDC In a letter dated May 15, 2001 to the Secretary of Interior, Gale Norton, Senator Frank Murkowski (Alaska), then Chairman of the U.S. Senate Committee on Energy
RANCHING Wildlife. Texas White-Tailed Deer 2017 Hunting Forecast
 RANCHING Wildlife Texas White-Tailed Deer 2017 Hunting Forecast During most summers, I take a short break and head to Colorado, Wyoming, or somewhere out west to enjoy a respite from the hot South Texas
Wildlife Introduction
 Wildlife Introduction The wildlife section of this chapter is divided into sections for various habitats and groups of species. Old growth, snags and downed wood, and riparian areas are unique habitats
Grouse in the Bavarian Alps: Status, threats and conservation Example: Black grouse in the Bavarian Alps
 Grouse in the Bavarian Alps: Status, threats and conservation Example: Black grouse in the Bavarian Alps Albin Zeitler (Consultant for the Bavarian State Ministry of the Environment) The Bavarian Alps
Utah. North Stansbury Mountains Wilderness Study Area Site-Specific Monitoring Guide
 Utah North Stansbury Mountains Wilderness Study Area Site-Specific Monitoring Guide 1 General Information WildSNAP Monitoring Peter Woodruff, American Conservation Experience Coordinator Phone (801) 989-7069
DEER HUNT RESULTS ON ALABAMA WILDLIFE MANAGEMENT AREAS ANNUAL REPORT, CHRISTOPHER W. COOK STUDY LEADER MAY, 2006
 DEER HUNT RESULTS ON ALABAMA WILDLIFE MANAGEMENT AREAS ANNUAL REPORT, 2005-2006 CHRISTOPHER W. COOK STUDY LEADER MAY, 2006 ALABAMA DIVISION OF WILDLIFE AND FRESHWATER FISHERIES Federal Aid Project funded
Status and Distribution of the Bobcat (Lynx rufus) in Illinois
 in Illinois") Transactions of the Illinois State Academy of Science received 9/14/99 (2000), Volume 93, #2, pp. 165-173 accepted 1/16/00 Status and Distribution of the Bobcat (Lynx rufus) in Illinois Alan Woolf 1, Clayton
Transactions of the Illinois State Academy of Science received 9/14/99 (2000), Volume 93, #2, pp. 165-173 accepted 1/16/00 Status and Distribution of the Bobcat (Lynx rufus) in Illinois Alan Woolf 1, Clayton
Interagency Special Status/Sensitive Species Program FY2005 Inventory & Conservation Planning Status Report
 Interagency Special Status/Sensitive Species Program FY2005 Inventory & Conservation Planning Status Report PROJECT TITLE: Crooked River National Grassland Pygmy Rabbit Habitat Assessment and Survey PROJECT
White-tailed Deer Age Report from the Deer Harvest
 White-tailed Deer Age Report from the 2016 Deer Harvest The Vermont Fish and Wildlife Department has made a concerted effort, beginning in 2015, to increase the amount of age data collected from harvested
2012 Diamond Complex Assessment BLM administered: Battle Mountain, Ely, Elko districts
 2012 Diamond Complex Assessment BLM administered: Battle Mountain, Ely, Elko districts wild horse removal scheduled January 2013 Horse Canyon, Diamond HMA July 2012 Preliminary Report (Final Version) of
FISHERIES BLUE MOUNTAINS ADAPTATION PARTNERSHIP
 FISHERIES A warming climate, by itself, substantially affects the hydrology of watersheds in the Blue Mountains. Among the key hydrologic changes projected under all scenarios for the 2040s and beyond
Research Status. Management Problems
 ARIZONA STATUS REPORT T.L. Britt and J. O1Neil Arizona Game and Fish Department By the late 1800's native elk (Cervus canadensis merriami) were believed to have been extirpated from Arizona. Consequently,
Central Hills Prairie Deer Goal Setting Block G9 Landowner and Hunter Survey Results
 Central Hills Prairie Deer Goal Setting Block G9 Landowner and Hunter Survey Results Table of Contents Public Surveys for Deer Goal Setting... 1 Methods... 1 Hunter Survey... 2 Demographics... 2 Population
2008 WMU 106 mule deer
 2008 WMU 106 mule deer Section Authors: Mike Grue and Kim Morton Suggested citation: Grue, M. and K. Morton. 2009. WMU 106 mule deer. Pages 50 54. In: N. Webb and R. Anderson. Delegated aerial ungulate
REBOUND. on the. It was the winter of 2000/2001, and it seemed like the snow
 JILLIAN COOPER / istockphoto.com 12 January / February 2018 on the While concerns remain, American marten are making a comeback in New Hampshire REBOUND by Jillian Kilborn It was the winter of 2000/2001,
ROADWAY LIGHTING Literature Summary
 ROADWAY LIGHTING There have been a number of studies done about the effect of roadway lighting, but little research has focused on its deer-vehicle crash (DVC)-reduction potential. Most DVCs occur in the
Results of Argali Survey in Big Pamir and the Wakhjir Valley by the Marco Polo Sheep Survey Team 2008
 Results of Argali Survey in Big Pamir and the Wakhjir Valley by the Marco Polo Sheep Survey Team 2008 Dr. John Winnie Jr. 1) A comparison of the habitat data points revealed that grassy habitats in the
Northern Yellowstone Cooperative Wildlife Working Group 2012 Annual Report (October 1, 2012-September 30, 2012) Member Agencies
 Member Agencies") Northern Yellowstone Cooperative Wildlife Working Group 2012 Annual Report (October 1, 2012-September 30, 2012) Member Agencies Montana Fish, Wildlife & Parks National Park Service, Yellowstone National
Northern Yellowstone Cooperative Wildlife Working Group 2012 Annual Report (October 1, 2012-September 30, 2012) Member Agencies Montana Fish, Wildlife & Parks National Park Service, Yellowstone National
Starlite Ranch INTERMOUNTAIN REALTY GROUP S Holladay Blvd., Salt Lake City, Utah,
 Starlite Ranch Millard County, Utah 960 Acres $795,000 INTERMOUNTAIN REALTY GROUP 4571 S Holladay Blvd., Salt Lake City, Utah, 84117 801-277-0800 www.intermountainrealtygroup.com Welcome to Starlite Ranch
WADE WEST INCENTIVE TAGS 2016 NDOW- REPORTING BIOLOGIST SCOTT ROBERTS
 WADE WEST INCENTIVE TAGS 2016 NDOW- REPORTING BIOLOGIST SCOTT ROBERTS PROGRAM OVERVIEW As you are all aware, the difficulty of this program is that a large portion of it is subjective. It is not based
By Kip Adams, Deer Project Leader, New Hampshire Fish and Game Department and Darrell Covell, UNH Wildlife Extension Specialist
 CHARLES H. WILLEY PHOTO By Kip Adams, Deer Project Leader, New Hampshire Fish and Game Department and Darrell Covell, UNH Wildlife Extension Specialist November/December 2001 WILDLIFE JOURNAL FEEDING DEER
2010 Wildlife Management Unit 501 moose and deer
 2010 Wildlife Management Unit 501 moose and deer Section Authors: Barb Maile and Velma Hudson Suggested Citation: Maile, B., and V. Hudson. 2010. Wildlife Management Unit 501 moose and deer. Pages 73 77.
Wildlife Ad Awareness & Attitudes Survey 2015
 Wildlife Ad Awareness & Attitudes Survey 2015 Contents Executive Summary 3 Key Findings: 2015 Survey 8 Comparison between 2014 and 2015 Findings 27 Methodology Appendix 41 2 Executive Summary and Key Observations
Circle W Ranch SPRAY, OREGON. Hunting Ranching Fly Fishing Conservation
 Circle W Ranch SPRAY, OREGON Hunting Ranching Fly Fishing Conservation Circle W Ranch SPRAY, OREGON CIntroduction The Circle W Ranch is located in North Central Oregon. The North border of the ranch runs
Northwest Parkland-Prairie Deer Goal Setting Block G7 Landowner and Hunter Survey Results
 Northwest Parkland-Prairie Deer Goal Setting Block G7 Landowner and Hunter Survey Results Table of Contents Public Surveys for Deer Goal Setting... 1 Methods... 1 Hunter Survey... 2 Demographics... 2 Population
2008 WMU 359 moose, mule deer, and white tailed deer
 2008 WMU 359 moose, mule deer, and white tailed deer Section Authors: Dave Stepnisky and Robb Stavne Suggested citation: Stepnisky, D. and R. Stavne. 2009. WMU 359 moose, mule deer, and white tailed deer.
Students use wildlife survey study techniques to discover the cause of the drop in a wood duck population.
 Fowl Play Summary Students use wildlife survey study techniques to discover the cause of the drop in a wood duck population. Background Wood ducks spend most of their time in ponds and streams near woods.
Science Skills Station
 Science Skills Station Objective 1. Interpret and analyze data so to determine the relationship between resource availability and carrying capacity of a population. 2. Identify biotic and abiotic factors
MCDERMITT, NEVADA OREGON-NEVADA BORDER
 ZIMMERMAN RANCH MCDERMITT, NEVADA OREGON-NEVADA BORDER The Zimmerman Ranch is located approximately 15 air miles directly west of the community of McDermitt, Nevada. The ranch straddles the Nevada Oregon
2017 LATE WINTER CLASSIFICATION OF NORTHERN YELLOWSTONE ELK
 2017 LATE WINTER CLASSIFICATION OF NORTHERN YELLOWSTONE ELK A collaborative survey by the Northern Yellowstone Cooperative Wildlife Working Group Report Prepared by: Karen Loveless, Montana Fish Wildlife
STUDY PERFORMANCE REPORT
 STUDY PERFORMANCE REPORT State: Michigan Project No.: F-53-R-14 Study No.: 486 Title: Assessment of lake trout populations in Michigan s waters of Lake Michigan. Period Covered: April 1, 1997 to March
ROCKWALL CENTRAL APPRAISAL DISTRICT
 ROCKWALL CENTRAL APPRAISAL DISTRICT WILDLIFE MANAGEMENT SPECIAL VALUATION GUIDELINES A SUPPLEMENT TO THE STATE OF TEXAS GUIDELINES FOR QUALIFICATION OF AG LAND IN WILDLIFE MANAGEMENT USE These guidelines
Legendre et al Appendices and Supplements, p. 1
 Legendre et al. 2010 Appendices and Supplements, p. 1 Appendices and Supplement to: Legendre, P., M. De Cáceres, and D. Borcard. 2010. Community surveys through space and time: testing the space-time interaction
The Role and Economic Importance of Private Lands in Providing Habitat for Wyoming s Big Game
 March 2004 B-1150 The Role and Economic Importance of Private Lands in Providing Habitat for Wyoming s Big Game By Roger Coupal, Department of Agricultural and Applied Economics; Gary Beauvais, Wyoming
Hunt ID: 3071-UT-G-L A-MDeer-IC4ELLOMONT-RCS-R3YJER
 Hunt ID: 3071-UT-G-L-3000-14A-MDeer-IC4ELLOMONT-RCS-R3YJER (Utah Deer Applications must be submitted by the end of February, don t miss your chance for an easy wall hanger.) If you are a Trophy Mule Deer
Job Title: Game Management, Subsection B Game Management Mountain Lion. SPECIES: Mountain Lion
 SPECIES: Goal: Manage the mountain lion population, its numbers and distribution, as an important part of Arizona s fauna and to provide mountain lion hunting recreation opportunity while maintaining existing
Managing Burrowing Mammals
 Managing Burrowing Mammals Roger A. Baldwin UCCE Wildlife Specialist Department of Wildlife, Fish, & Conservation Biology University of California, Davis Species Identification (Ground Squirrels) Gray-brown
Biologist s Answer: What are your goals? Deer Management. Define goals, objectives. Manager s Question: Should I cull or shoot spikes?
 Manager s Question: Should I cull or shoot spikes? Manager s Question: Should I cull or shoot spikes? Biologist s Answer: What are your goals? How futile it is to passively follow a recipe without understanding
DMU 487 Northern Multi-County Deer Management Unit
 DMU 487 Northern Multi-County Deer Management Unit Area Description Deer Management Unit (DMU) 487 is a multi-county DMU created to address bovine tuberculosis (btb) in the Northern Lower Peninsula Region
Factors Affecting the Reproduction of Bluegill Bream and Largemouth Black Bass in Ponds
 CIRCULAR NO. 87FERAY14 FEBRUARY 1943 Factors Affecting the Reproduction of Bluegill Bream and Largemouth Black Bass in Ponds H-. S. SWINGLE, Fish C'ulturist and E. V. SMITH, Associate Botanist AGRICULTURAL
CHARLES H. WILLEY PHOTO. 8 November/December 2006 WILDLIFE JOURNAL
 CHARLES H. WILLEY PHOTO 8 November/December 2006 WILDLIFE JOURNAL The hunter harvest is a rich source of management information for wildlife biologists. BY KENT GUSTAFSON Each fall, hunters enjoy their