hot hands in hockey are they real? does it matter? Namita Nandakumar Wharton School, University of
|
|
|
- Merry Conley
- 5 years ago
- Views:
Transcription
1 hot hands in hockey are they real? does it matter? Namita Nandakumar Wharton School, University of


2 Let s talk about streaks. ~ The Athletic Philadelphia, 11/27/ Flyers record as coin flips: first 16 games: HTHTHHTHTTHTTHTH next 16 games: TTTTTTTTTTHHHHHH the rest: THTTTHTHHHHTHHHHTTTTHHHH... This seems like a ridiculous coin.

3 Back in January, I simulated sequences of wins and losses for a team with the Flyers record and showed that it was pretty unlikely for those teams to ever reach a 10-game losing streak.
4 But I m zeroing in on a small, particularly interesting part of a larger sequence. (Another small, interesting part of a larger sequence? The Penguins have lost 3 games in a row.) The point is we need something a bit more comprehensive.
5 What do I want from a measure of streakiness? (This may differ from what you want from a measure of streakiness.) Takes the whole sequence into account. Sure, the Flyers lost 10 games in a row, but what about the rest of it? Puts the streaks in context. It s easy to go on a losing streak if you re the Arizona Coyotes. Imposes as few assumptions as possible. I am often wrong about things. Is easily computed, summarized, and conveyed. I want to quickly look at all teams and all goal scorers. Works for binary incidence data. Did a team win or not? Did a player score or not?
6 What do I mean by streakiness/clumpiness? Things are more clumped together than they would be if events in a sequence were randomly distributed, and this could be due to: Sequential dependence: The next game s outcome is impacted by whether you won the last one, or two, or three, and so forth. Non-stationarity: There is a non-constant probability of success and the team/player goes through relatively good and bad periods. Note: I m not at any point making any statements about the underlying quality of any team or player. Essentially, I m treating observed outcomes as fixed, and then seeing if they re streakier than what we d expect from flipping a (not necessarily 50/50) coin.
7 The #AdvancedStat New Measures of Clumpiness for Incidence Data addresses major problems with existing hot hand measures. In particular, Zhang et al. find that the normalized entropy of inter-event times is a robust measure of clumpiness that minimizes misclassification error compared to other metrics. Inter-event time: # of time periods between wins or goals or whatever. 1 H 2 T 3 T 4 T H Entropy is a measure borrowed from information theory that is related to disorderliness and uncertainty. More importantly, it has many desirable properties when utilized with inter-event times to evaluate clumpiness.
8 How does it work? Let s look at the Flyers again. Calculate inter-event times xi. H T H T H H T H xi = Divide by the length of the sequence + 1 to normalize. xi = Multiply each xi by the log of itself, sum it all up, divide by log(number of successes + 1), add 1 to keep things positive. Hp = (as of 2/22/2018) We know that higher values correspond to more streakiness, but is that high or low?

9 Simulate sequences to contextualize results. I simulated 10,000 sequences of wins and losses from a team, then calculated the normalized entropy for each sequence. It s clear that the Flyers actual results were quite a bit streakier than most simulated sequences of their record. In fact, they were in the 99th percentile of streakiness. Flyers Normalized Entropy Distribution 10,000 Simulations

10 Why do we need to do the simulate? You might think that if one team has a higher raw entropy value than another, they re streakier. But the range of reasonable values depends on the length of the sequence and number of successes. We d naturally expect worse teams to have larger spacings between wins Normalized Entropy Distribution by Team 10,000 Simulations
11 What about other streakiness metrics? Runs Test: Count the number of runs of heads or tails within a sequence. H T H T HH T H TT H TT H T H TTTTTTTTTT HHHHHH No statistically significant evidence of streakiness at a 5% level for the Flyers. This disagrees with our normalized entropy test, which would classify the Flyers as streaky at a 5% level of significance. Who s right? We can t ever be sure, but... Normalized entropy more accurately classified computer-generated streaky data as streaky as compared to the runs test and others (Zhang et al.).

12 Streakiness of NHL Teams Streakiness percentile represents % of randomly generated sequences from a team s win-loss record that they are streakier than. Higher = more streaky. NHL teams have not been too streaky this season except for the Flyers. Streakiness Percentile as of 2/22/2018
13 Streakiest Teams Since Columbus Blue Jackets, Philadelphia Flyers, Un-Streakiest Teams Since Dallas Stars, Philadelphia Flyers, Season summaries via Hockey Reference.

14 Streakiness of NHL Player Scoring Blake Wheeler and Nick Backstrom are usually kind of streaky. Tomas Tatar and Joe Pavelski are usually kind of un-streaky. The vast majority of players with 15+ goals in 41+ games played in each of the last 5 seasons have had relatively streaky and un-streaky seasons. Streakiness Percentile as of 2/22/2018 Distribution of Games with 1+ Goal(s)

15 Repeatability: Between Seasons
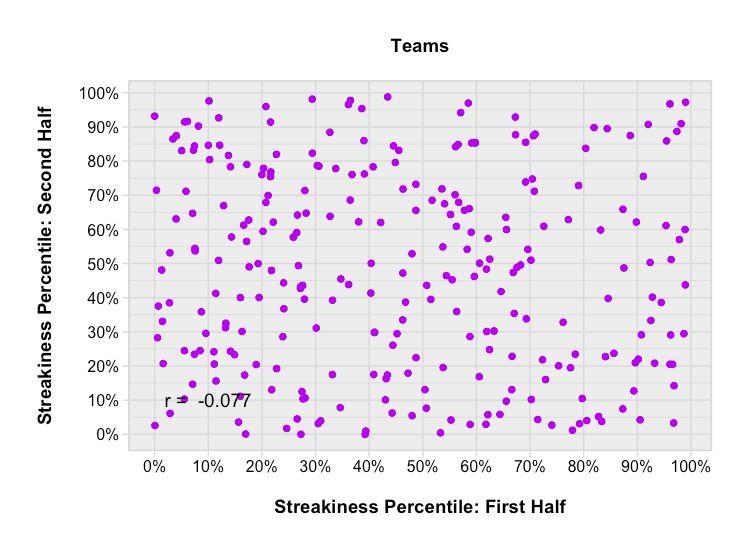

16 Repeatability: Within Season


17 Season Streakiness vs. Success (This is what we d expect due to having contextualized streakiness based on number of successes and failures.)
18 I could have just shown you this:
19 Is streakiness real? Yes, in the sense that there are certainly sequences in recent NHL history that appear streaky. Which could be due to chance, but also due to external factors (ex. CBJ injury issues in ). This is a pretty simple statement but it does matter! A frequent claim related to hot hands is that we are spotting patterns where there are none. Is streakiness repeatable? No. Does streakiness matter? No.
 for guidance Hockey Reference for data")
20 Thank you for listening! Special thanks to: Prof. Shane Jensen (Wharton Statistics) for guidance Hockey Reference for data Code/slides/data/etc. will be tweeted
21 Appendix: Normalized Entropy Calculation (Source)

22 Appendix: Runs Test Calculation (Source)
What Does It Mean to Draft Perfectly in the NHL?
 What Does It Mean to Draft Perfectly in the NHL? When is Best Player Available not the Best Strategy? Namita Nandakumar Wharton School, University of Pennsylvania @nnstats Vancouver Hockey Analytics Conference
Looking at Spacings to Assess Streakiness
 Looking at Spacings to Assess Streakiness Jim Albert Department of Mathematics and Statistics Bowling Green State University September 2013 September 2013 1 / 43 The Problem Collect hitting data for all
Section 5.1 Randomness, Probability, and Simulation
 Section 5.1 Randomness, Probability, and Simulation What does it mean to be random? ~Individual outcomes are unknown ~In the long run some underlying set of outcomes will be equally likely (or at least
Decision Trees. Nicholas Ruozzi University of Texas at Dallas. Based on the slides of Vibhav Gogate and David Sontag
 Decision Trees Nicholas Ruozzi University of Texas at Dallas Based on the slides of Vibhav Gogate and David Sontag Announcements Course TA: Hao Xiong Office hours: Friday 2pm-4pm in ECSS2.104A1 First homework
Black Sea Bass Encounter
 Black Sea Bass Encounter Below is an adaptation of the Shark Encounter (Lawrence Hall of Science: MARE 2002) lesson plan to be about Black Sea Bass and to incorporate information learned from Dr. Jensen
5.1A Introduction, The Idea of Probability, Myths about Randomness
 5.1A Introduction, The Idea of Probability, Myths about Randomness The Idea of Probability Chance behavior is unpredictable in the short run, but has a regular and predictable pattern in the long run.
1 Streaks of Successes in Sports
 1 Streaks of Successes in Sports It is very important in probability problems to be very careful in the statement of a question. For example, suppose that I plan to toss a fair coin five times and wonder,
TOPIC 10: BASIC PROBABILITY AND THE HOT HAND
 TOPIC 0: BASIC PROBABILITY AND THE HOT HAND The Hot Hand Debate Let s start with a basic question, much debated in sports circles: Does the Hot Hand really exist? A number of studies on this topic can
Taking Your Class for a Walk, Randomly
 Taking Your Class for a Walk, Randomly Daniel Kaplan Macalester College Oct. 27, 2009 Overview of the Activity You are going to turn your students into an ensemble of random walkers. They will start at
Internet Technology Fundamentals. To use a passing score at the percentiles listed below:
 Internet Technology Fundamentals To use a passing score at the percentiles listed below: PASS candidates with this score or HIGHER: 2.90 High Scores Medium Scores Low Scores Percentile Rank Proficiency
Planning and Acting in Partially Observable Stochastic Domains
 Planning and Acting in Partially Observable Stochastic Domains Leslie Pack Kaelbling and Michael L. Littman and Anthony R. Cassandra (1998). Planning and Acting in Partially Observable Stochastic Domains,
Major League Baseball Offensive Production in the Designated Hitter Era (1973 Present)
") Major League Baseball Offensive Production in the Designated Hitter Era (1973 Present) Jonathan Tung University of California, Riverside tung.jonathanee@gmail.com Abstract In Major League Baseball, there
Major League Baseball Offensive Production in the Designated Hitter Era (1973 Present) Jonathan Tung University of California, Riverside tung.jonathanee@gmail.com Abstract In Major League Baseball, there
Excel Solver Case: Beach Town Lifeguard Scheduling
 130 Gebauer/Matthews: MIS 213 Hands-on Tutorials and Cases, Spring 2015 Excel Solver Case: Beach Town Lifeguard Scheduling Purpose: Optimization under constraints. A. GETTING STARTED All Excel projects
THE USGA HANDICAP SYSTEM. Reference Guide
 THE USGA HANDICAP SYSTEM Reference Guide THE USGA HANDICAP SYSTEM Reference Guide Copyright 2017 United States Golf Association All Rights Reserved Printed in the United States of America The USGA Handicap
1. OVERVIEW OF METHOD
 1. OVERVIEW OF METHOD The method used to compute tennis rankings for Iowa girls high school tennis http://ighs-tennis.com/ is based on the Elo rating system (section 1.1) as adopted by the World Chess
Bayesian Methods: Naïve Bayes
 Bayesian Methods: Naïve Bayes Nicholas Ruozzi University of Texas at Dallas based on the slides of Vibhav Gogate Last Time Parameter learning Learning the parameter of a simple coin flipping model Prior
STANDARD SCORES AND THE NORMAL DISTRIBUTION
 STANDARD SCORES AND THE NORMAL DISTRIBUTION REVIEW 1.MEASURES OF CENTRAL TENDENCY A.MEAN B.MEDIAN C.MODE 2.MEASURES OF DISPERSIONS OR VARIABILITY A.RANGE B.DEVIATION FROM THE MEAN C.VARIANCE D.STANDARD
Massey Method. Introduction. The Process
 Massey Method Introduction Massey s Method, also referred to as the Point Spread Method, is a rating method created by mathematics professor Kenneth Massey. It is currently used to determine which teams
Queue analysis for the toll station of the Öresund fixed link. Pontus Matstoms *
 Queue analysis for the toll station of the Öresund fixed link Pontus Matstoms * Abstract A new simulation model for queue and capacity analysis of a toll station is presented. The model and its software
SUMMARIZING FROG AND TOAD COUNT DATA
 SUMMARIZING FROG AND TOAD COUNT DATA This set of protocols will take you through all the steps necessary for summarizing the frog and toad data for each NAAMP route that was been assigned to you. BEFORE
Highway & Transportation (I) ECIV 4333 Chapter (4): Traffic Engineering Studies. Spot Speed
 ECIV 4333 Chapter (4): Traffic Engineering Studies. Spot Speed") Introduction Spot Speed Speed is an important measure of the quality of travel and safety of road network. Speed by definition is the rate of movement of vehicle in distance per unit time. A typical unit
Introduction Spot Speed Speed is an important measure of the quality of travel and safety of road network. Speed by definition is the rate of movement of vehicle in distance per unit time. A typical unit
Chapter 5 - Probability Section 1: Randomness, Probability, and Simulation
 Chapter 5 - Probability Section 1: Randomness, Probability, and Simulation By the end of this section you will be able to: 1) interpret probability as a long-run relative frequency, and 2) Use simulation
Figure 1. Winning percentage when leading by indicated margin after each inning,
 The 7 th Inning Is The Key By David W. Smith Presented June, 7 SABR47, New York, New York It is now nearly universal for teams with a 9 th inning lead of three runs or fewer (the definition of a save situation
RULES AND REGULATIONS OF FIXED ODDS BETTING GAMES
 RULES AND REGULATIONS OF FIXED ODDS BETTING GAMES Royalhighgate Public Company Ltd. 04.04.2014 Table of contents SECTION I: GENERAL RULES... 6 ARTICLE 1 - GENERAL REGULATIONS... 6 ARTICLE 2 - THE HOLDING
One of the most-celebrated feats
 Joe DiMaggio Done It Again and Again and Again and Again? David Rockoff and Philip Yates Joe DiMaggio done it again! Joe DiMaggio done it again! Clackin that bat, gone with the wind! Joe DiMaggio s done
Lecture 16: Chapter 7, Section 2 Binomial Random Variables
 Lecture 16: Chapter 7, Section 2 Binomial Random Variables!Definition!What if Events are Dependent?!Center, Spread, Shape of Counts, Proportions!Normal Approximation Cengage Learning Elementary Statistics:
Measuring Relative Achievements: Percentile rank and Percentile point
 Measuring Relative Achievements: Percentile rank and Percentile point Consider an example where you receive the same grade on a test in two different classes. In which class did you do better? Why do we
Freak Waves: A Suggested Definition and Possible Consequences for Marine Structures
 Freak Waves: A Suggested Definition and Possible Consequences for Marine Structures 1. What is the target safety level of offshore structures? 2. Are rogue waves a problem? A) What is a rogues wave? B)
Application of FMCA as a Tool for Risk Assessment
 Application of FMCA as a Tool for Risk Assessment Carl A. Anderson; Robert P. Cogdill; and James K. Drennen, III IFPAC 0 January 007 Baltimore, MD Outline Introduction PAT Process Role of risk assessment
The Cold Facts About the "Hot Hand" in Basketball
 The Cold Facts About the "Hot Hand" in Basketball Do basketball players tend to shoot in streaks? Contrary to the belief of fans and commentators, analysis shows that the chances of hitting a shot are
The Art and Science of Debt Sustainability Analysis Ugo Panizza
 The Art and Science of Debt Sustainability Analysis Ugo Panizza Pictet Chair in Finance and Development The Graduate Institute & CEPR Trade and Development Board Geneva, September 2016 d = i g d ps DSA:
An Analysis of Factors Contributing to Wins in the National Hockey League
 International Journal of Sports Science 2014, 4(3): 84-90 DOI: 10.5923/j.sports.20140403.02 An Analysis of Factors Contributing to Wins in the National Hockey League Joe Roith, Rhonda Magel * Department
1. Answer this student s question: Is a random sample of 5% of the students at my school large enough, or should I use 10%?
 Econ 57 Gary Smith Fall 2011 Final Examination (150 minutes) No calculators allowed. Just set up your answers, for example, P = 49/52. BE SURE TO EXPLAIN YOUR REASONING. If you want extra time, you can
FEATURES. Features. UCI Machine Learning Repository. Admin 9/23/13
 Admin Assignment 2 This class will make you a better programmer! How did it go? How much time did you spend? FEATURES David Kauchak CS 451 Fall 2013 Assignment 3 out Implement perceptron variants See how
Table 1: Eastern Conference Final Standings (Sorted by Current Scoring System)
") Here is the full text that we sent to The Hockey News that appeared in the February 13, 2012 Issue under the heading Just Win, Baby. Following that is some additional analyses that were too lengthy to
Here is the full text that we sent to The Hockey News that appeared in the February 13, 2012 Issue under the heading Just Win, Baby. Following that is some additional analyses that were too lengthy to
Descriptive Statistics Project Is there a home field advantage in major league baseball?
 Descriptive Statistics Project Is there a home field advantage in major league baseball? DUE at the start of class on date posted on website (in the first 5 minutes of class) There may be other due dates
Matt Halper 12/10/14 Stats 50. The Batting Pitcher:
 Matt Halper 12/10/14 Stats 50 The Batting Pitcher: A Statistical Analysis based on NL vs. AL Pitchers Batting Statistics in the World Series and the Implications on their Team s Success in the Series Matt
Predator-Prey Interactions: Bean Simulation. Materials
 Predator-Prey Interactions: Bean Simulation Introduction Interactions between predators and their prey are important in 1) determining the populations of both predators and prey, and 2) determining and
JPEG-Compatibility Steganalysis Using Block-Histogram of Recompression Artifacts
 JPEG-Compatibility Steganalysis Using Block-Histogram of Recompression Artifacts Jan Kodovský, Jessica Fridrich May 16, 2012 / IH Conference 1 / 19 What is JPEG-compatibility steganalysis? Detects embedding
The difference between a statistic and a parameter is that statistics describe a sample. A parameter describes an entire population.
 Grade 7 Mathematics EOG (GSE) Quiz Answer Key Statistics and Probability - (MGSE7.SP. ) Understand Use Of Statistics, (MGSE7.SP.2) Data From A Random Sample, (MGSE7.SP.3 ) Degree Of Visual Overlap, (MGSE7.SP.
Using Markov Chains to Analyze a Volleyball Rally
 1 Introduction Using Markov Chains to Analyze a Volleyball Rally Spencer Best Carthage College sbest@carthage.edu November 3, 212 Abstract We examine a volleyball rally between two volleyball teams. Using
Introduction to Analysis of Variance (ANOVA) The Structural Model, The Summary Table, and the One- Way ANOVA
 The Structural Model, The Summary Table, and the One- Way ANOVA") Introduction to Analysis of Variance (ANOVA) The Structural Model, The Summary Table, and the One- Way ANOVA Limitations of the t-test Although the t-test is commonly used, it has limitations Can only
Introduction to Analysis of Variance (ANOVA) The Structural Model, The Summary Table, and the One- Way ANOVA Limitations of the t-test Although the t-test is commonly used, it has limitations Can only
Stat 139 Homework 3 Solutions, Spring 2015
 Stat 39 Homework 3 Solutions, Spring 05 Problem. Let i Nµ, σ ) for i,..., n, and j Nµ, σ ) for j,..., n. Also, assume that all observations are independent from each other. In Unit 4, we learned that the
Why We Should Use the Bullpen Differently
 Why We Should Use the Bullpen Differently A look into how the bullpen can be better used to save runs in Major League Baseball. Andrew Soncrant Statistics 157 Final Report University of California, Berkeley
Name May 3, 2007 Math Probability and Statistics
 Name May 3, 2007 Math 341 - Probability and Statistics Long Exam IV Instructions: Please include all relevant work to get full credit. Encircle your final answers. 1. An article in Professional Geographer
March Madness Basketball Tournament
 March Madness Basketball Tournament Math Project COMMON Core Aligned Decimals, Fractions, Percents, Probability, Rates, Algebra, Word Problems, and more! To Use: -Print out all the worksheets. -Introduce
Estimating the Probability of Winning an NFL Game Using Random Forests
 Estimating the Probability of Winning an NFL Game Using Random Forests Dale Zimmerman February 17, 2017 2 Brian Burke s NFL win probability metric May be found at www.advancednflstats.com, but the site
Policy Management: How data and information impacts the ability to make policy decisions:
 Policy Management: How data and information impacts the ability to make policy decisions: Louis Cripps Regional Transportation District, Asset Management Denver, Colorado Quick exercise... What do these
Lab 2: Probability. Hot Hands. Template for lab report. Saving your code
 Lab 2: Probability Hot Hands Basketball players who make several baskets in succession are described as having a hot hand. Fans and players have long believed in the hot hand phenomenon, which refutes
Chapter 2: Modeling Distributions of Data
 Chapter 2: Modeling Distributions of Data Section 2.1 The Practice of Statistics, 4 th edition - For AP* STARNES, YATES, MOORE Chapter 2 Modeling Distributions of Data 2.1 2.2 Normal Distributions Section
Navigate to the golf data folder and make it your working directory. Load the data by typing
 Golf Analysis 1.1 Introduction In a round, golfers have a number of choices to make. For a particular shot, is it better to use the longest club available to try to reach the green, or would it be better
NUMB3RS Activity: Walkabout. Episode: Mind Games
 Teacher Page 1 NUMB3RS Activity: Walkabout Topic: Random Walks & Grade Level: 8-12 Objective: Learn about random walks and use them to compute an approximation to. Materials: TI-83/84 Plus calculator or
U S F O S B u o y a n c y And Hydrodynamic M a s s
 1 U S F O S B u o y a n c y And Hydrodynamic M a s s 2 CONTENTS: 1 INTRODUCTION... 3 2 ACCURACY LEVELS... 3 2.1 LEVEL-0... 3 2.2 LEVEL-1... 3 2.3 PANEL MODEL... 3 3 EX 1. SINGLE PIPE. NON FLOODED... 4
NCSS Statistical Software
 Chapter 256 Introduction This procedure computes summary statistics and common non-parametric, single-sample runs tests for a series of n numeric, binary, or categorical data values. For numeric data,
Section 3.1: Measures of Center
 Section.1: Measures of Center In statistics we frequently need to perform operations on entire sets of data. One such operation is to add all values in a particular set together. We use a capital Greek
HKA TECHNOLOGIES INC. TEMPERATURE COMPENSATION
 HKA TECHNOLOGIES INC. TEMPERATURE COMPENSATION Different Methods of Air Leak Testing Conventional vs Bell Jar Pressure Decay and Differential Pressure Decay Mass Flow and Differential Mass Flow HKA mainly
Chapter 13. Factorial ANOVA. Patrick Mair 2015 Psych Factorial ANOVA 0 / 19
 Chapter 13 Factorial ANOVA Patrick Mair 2015 Psych 1950 13 Factorial ANOVA 0 / 19 Today s Menu Now we extend our one-way ANOVA approach to two (or more) factors. Factorial ANOVA: two-way ANOVA, SS decomposition,
HW #5: Digital Logic and Flip Flops
 HW #5: Digital Logic and Flip Flops This homework will walk through a specific digital design problem in all its glory that you will then implement in this weeks lab. 1 Write the Truth Table (10 pts) Consider
Add this important safety precaution to your normal laboratory procedures:
 Student Activity Worksheet Speed and Velocity Are You Speeding? Driving Question What is speed and how is it related to velocity? Materials and Equipment For each student or group: Data collection system
March Madness Basketball Tournament
 March Madness Basketball Tournament Math Project COMMON Core Aligned Decimals, Fractions, Percents, Probability, Rates, Algebra, Word Problems, and more! To Use: -Print out all the worksheets. -Introduce
Unit 5: Prioritize and Manage Hazards and Risks STUDENT GUIDE
 : Prioritize and Manage Hazards and Risks STUDENT GUIDE Objectives By the end of this unit, students will be able to: Describe several techniques that can be used to prioritize hazards for mitigation,
HANDICAP REVIEW APPENDIX PORTUGUESE GOLF FEDERATION INTRODUCTION
 HANDICAP REVIEW APPENDIX PORTUGUESE GOLF FEDERATION INTRODUCTION The handicap committee of a handicapping authority must perform a handicap review at least once a year. The main objective is to assess
We can use a 2 2 array to show all four situations that can arise in a single play of this game, and the results of each situation, as follows:
 Two-Person Games Game theory was developed, starting in the 1940 s, as a model of situations of conflict. Such situations and interactions will be called games and they have participants who are called
Simulating Major League Baseball Games
 ABSTRACT Paper 2875-2018 Simulating Major League Baseball Games Justin Long, Slippery Rock University; Brad Schweitzer, Slippery Rock University; Christy Crute Ph.D, Slippery Rock University The game of
Student Outcomes. Lesson Notes. Classwork. Discussion (20 minutes)
") Student Outcomes Students explain a proof of the converse of the Pythagorean Theorem. Students apply the theorem and its converse to solve problems. Lesson Notes Students had their first experience with
Student Outcomes Students explain a proof of the converse of the Pythagorean Theorem. Students apply the theorem and its converse to solve problems. Lesson Notes Students had their first experience with
Frequency Distributions
 Descriptive Statistics Dr. Tom Pierce Department of Psychology Radford University Descriptive statistics comprise a collection of techniques for better understanding what the people in a group look like
Introduction to Pattern Recognition
 Introduction to Pattern Recognition Jason Corso SUNY at Buffalo 12 January 2009 J. Corso (SUNY at Buffalo) Introduction to Pattern Recognition 12 January 2009 1 / 28 Pattern Recognition By Example Example:
Chapter 1 Test B. 4. What are two advantages of using simulation techniques instead of actual situations?
 Name: Date: 1. The 50 states in the United States were numbered alphabetically and a researcher decided to randomly select a number and then survey every sixth state on unemployment rates. What type of
Journal of Quantitative Analysis in Sports
 Journal of Quantitative Analysis in Sports Volume 4, Issue 1 2008 Article 3 Streaky Hitting in Baseball Jim Albert Bowling Green State University, albert@bgnet.bgsu.edu Copyright c 2008 The Berkeley Electronic
DOWNLOAD PDF TELEPHONE NUMBERS THAT PROVIDE THE WINNING NUMBERS FOR EACH LOTTERY.
 Chapter 1 : Most Common Winning Lottery Numbers Are Not The Best Numbers In the event of a discrepancy between the information displayed on this website concerning winning numbers and prize payouts and
Shedding Light on Motion Episode 4: Graphing Motion
 Shedding Light on Motion Episode 4: Graphing Motion In a 100-metre sprint, when do athletes reach their highest speed? When do they accelerate at the highest rate and at what point, if any, do they stop
Chapter 5 ATE: Probability: What Are the Chances? Alternate Activities and Examples
 Chapter 5 ATE: Probability: What Are the Chances? Alternate Activities and Examples [Page 283] Alternate Activity: Whose Book is This? Suppose that 4 friends get together to study at Tim s house for their
b) (2 pts.) Does the study show that drinking 4 or more cups of coffee a day caused the higher death rate?
 (2 pts.) Does the study show that drinking 4 or more cups of coffee a day caused the higher death rate?") Question 1 (10 pts) A study published in the August 15, 2017 issue of Mayo Clinic Proceedings tracked 44,000 people aged 20 to 87 for an average of about 16 years and found that those who drank 4 or more
Question 1 (10 pts) A study published in the August 15, 2017 issue of Mayo Clinic Proceedings tracked 44,000 people aged 20 to 87 for an average of about 16 years and found that those who drank 4 or more
Percentage. Year. The Myth of the Closer. By David W. Smith Presented July 29, 2016 SABR46, Miami, Florida
 The Myth of the Closer By David W. Smith Presented July 29, 216 SABR46, Miami, Florida Every team spends much effort and money to select its closer, the pitcher who enters in the ninth inning to seal the
First Server Advantage in Tennis. Michelle Okereke
 First Server Advantage in Tennis Michelle Okereke Overview! Background! Research Question! Methodology! Results! Conclusion Background! Scoring! Advantage Set: First player to win 6 games by a margin of
Analysis of Variance. Copyright 2014 Pearson Education, Inc.
 Analysis of Variance 12-1 Learning Outcomes Outcome 1. Understand the basic logic of analysis of variance. Outcome 2. Perform a hypothesis test for a single-factor design using analysis of variance manually
AP 11.1 Notes WEB.notebook March 25, 2014
 11.1 Chi Square Tests (Day 1) vocab *new seats* examples Objectives Comparing Observed & Expected Counts measurements of a categorical variable (ex/ color of M&Ms) Use Chi Square Goodness of Fit Test Must
Over the Edge. Forecasting beyond the Boundaries of the Regional Model
 Over the Edge Forecasting beyond the Boundaries of the Regional Model 2017 ITE Western District Annual Meeting Made Possible Using Data Courtesy of NDOT Topics Covered The difficulties with forecasting
INTRODUCTION TO PATTERN RECOGNITION
 INTRODUCTION TO PATTERN RECOGNITION 3 Introduction Our ability to recognize a face, to understand spoken words, to read handwritten characters all these abilities belong to the complex processes of pattern
Columbia University. Department of Economics Discussion Paper Series. Auctioning the NFL Overtime Possession. Yeon-Koo Che Terry Hendershott
 Columbia University Department of Economics Discussion Paper Series Auctioning the NFL Overtime Possession Yeon-Koo Che Terry Hendershott Discussion Paper No: 0506-25 Department of Economics Columbia University
Applying Generalized Pareto Curves to Inequality Analysis
 Applying Generalized Pareto Curves to Inequality Analysis Thomas Blanchet 1 Bertrand Garbinti 2 Jonathan Goupille-Lebret 3 Clara Martínez-Toledano 1 ASSA Conference, January 2018 1 Paris School of Economics
Money Lost or Won -$5 +$3 +$7
 Math 137 Unit 7 Review 1. The numbers of endangered species for several groups are listed here. Location Mammals Birds Reptiles Amphibians Total USA 63 78 14 10 Foreign 251 175 64 8 Total If one endangered
BENCH OFFICIALS HANDBOOK Men s Field Lacrosse
 BENCH OFFICIALS HANDBOOK 2010 Men s Field Lacrosse Contents Bench Officials and their Duties... 3 General Information on all Bench Officials... 3 Mistakes by Bench Officials... 4 The Game Timekeeper (GT)...
QUESTIONS and ANSWERS WHY TEST KONGSBERGS
 QUESTIONS and ANSWERS Debate over etarget accuracy without accurate data is meaningless and divisive. Information is sparse or non existent and what exists is often partisan. Assumptions are common, and
INSTITUTE AND FACULTY OF ACTUARIES. Curriculum 2019 AUDIT TRAIL
 INSTITUTE AND FACULTY OF ACTUARIES Curriculum 2019 AUDIT TRAIL Subject CP2 Actuarial Modelling Paper One Institute and Faculty of Actuaries Triathlon model Objective Each year on the Island of IFoA a Minister
The Safety Case. Structure of Safety Cases Safety Argument Notation
 The Safety Case Structure of Safety Cases Safety Argument Notation Budapest University of Technology and Economics Department of Measurement and Information Systems The safety case Definition (core): The
In my left hand I hold 15 Argentine pesos. In my right, I hold 100 Chilean
 Chapter 6 Meeting Standards and Standings In This Chapter How to standardize scores Making comparisons Ranks in files Rolling in the percentiles In my left hand I hold 15 Argentine pesos. In my right,
The Safety Case. The safety case
 The Safety Case Structure of safety cases Safety argument notation Budapest University of Technology and Economics Department of Measurement and Information Systems The safety case Definition (core): The
User Manual. Heads-Up Display (HUD) DiveCAN. Mechanical Button Version
 DiveCAN. Mechanical Button Version") User Manual Heads-Up Display (HUD) Mechanical Button Version DiveCAN Table of Contents 1. Introduction...4 1.1 Features...4 2. Physical Description...5 3. Reading the PPO2...6 3.1 Modified Smither s Code...7
User Manual Heads-Up Display (HUD) Mechanical Button Version DiveCAN Table of Contents 1. Introduction...4 1.1 Features...4 2. Physical Description...5 3. Reading the PPO2...6 3.1 Modified Smither s Code...7
The Mathematics of Gambling
 The Mathematics of Gambling with Related Applications Madhu Advani Stanford University April 12, 2014 Madhu Advani (Stanford University) Mathematics of Gambling April 12, 2014 1 / 23 Gambling Gambling:
Effects of Traffic Signal Retiming on Safety. Peter J. Yauch, P.E., PTOE Program Manager, TSM&O Albeck Gerken, Inc.
 Effects of Traffic Signal Retiming on Safety Peter J. Yauch, P.E., PTOE Program Manager, TSM&O Albeck Gerken, Inc. Introduction It has long been recognized that traffic signal timing can have an impact
Calculation of Trail Usage from Counter Data
 1. Introduction 1 Calculation of Trail Usage from Counter Data 1/17/17 Stephen Martin, Ph.D. Automatic counters are used on trails to measure how many people are using the trail. A fundamental question
RACING RULES / RACE OFFICIALS
 RACING RULES / RACE OFFICIALS RYA GUIDANCE REDRESS WHAT IS REDRESS? It is compensation awarded to a boat when, in the words of rule 62, a boat s score in a race or series has been, or may be, through no
Trial # # of F.T. Made:
 OPEN SPINNER APPLICATION APPS Prob Sim ENTER (Spin Spinner) SET UP SPINNER. TABL (graph) the blank graph disappears & will later become a table. SET (zoom) Change Sections to ENTER. ADV (window) Change
RESPIRATOR PERFORMANCE TERMINOLOGY
 RESPIRATOR PERFORMANCE TERMINOLOGY The following terms were developed by the American Industrial Hygiene Association Respiratory Protection Committee to represent respirator performance in various contexts.
Analyses of the Scoring of Writing Essays For the Pennsylvania System of Student Assessment
 Analyses of the Scoring of Writing Essays For the Pennsylvania System of Student Assessment Richard Hill The National Center for the Improvement of Educational Assessment, Inc. April 4, 2001 Revised--August
Foundation Unit 13 topic test
 Name: Foundation Unit 13 topic test Date: Time: 60 minutes Total marks available: 51 Total marks achieved: Questions Q1. Here is a fair 6-sided spinner. Jack will spin the spinner once. The spinner will
5 Free Fastpitch Drills ~ StacieMahoe.com
 Aloha and thank you for picking up this mini pack of drills! My name is Stacie Mahoe and I ve spent all kinds of time around the game of fastpitch softball since I was 9 years old. I won t tell you exactly
INSTRUCTIONS FOR USING HMS 2016 Scoring (v1)
") INSTRUCTIONS FOR USING HMS 2016 Scoring (v1) HMS 2016 Scoring (v1).xlsm is an Excel Workbook saved as a Read Only file. Intended for scoring multi-heat events run under HMS 2016, it can also be used for
INSTRUCTIONS FOR USING HMS 2016 Scoring (v1) HMS 2016 Scoring (v1).xlsm is an Excel Workbook saved as a Read Only file. Intended for scoring multi-heat events run under HMS 2016, it can also be used for