Study of Vessel Travel Behavior at Hot Spots in Sabine-Neches Waterways
|
|
|
- Lionel Hicks
- 5 years ago
- Views:
Transcription
1 Study of Vessel Travel Behavior at Hot Spots in Sabine-Neches Waterways Xing Wu, PhD, PE (Corresponding Author) Department of Civil and Environmental Engineering Lamar University xing.wu@lamar.edu Afifa Rahman Department of Civil and Environmental Engineering Lamar University arahman1@lamar.edu Victor A. Zaloom, PhD, PE Department of Industrial Engineering Lamar University victor.zaloom@lamar.edu Brian N. Craig, PhD, PE, CPE Department of Industrial Engineering Lamar University brian.craig@lamar.edu Submitted to Marine Safety and Human Factors Committee (AW) for Presentation at the th Annual Meeting of Transportation Research Board 1
2 1 ABSTRACT: This paper studied the travel behavior of vessels at two hot spots identified through the analysis of vessel conflicts along the whole Sabine-Neches Waterway (SNWW) using the automatic identification system (AIS) data. According to the AIS data in 1, more than % of total vessel conflicts occurred within these two hot spots. Using the AIS data collected in the whole year of 1, this paper summarized the information of trips that passed through these two spots inbound (toward the Port of Beaumont) or outbound (toward the Gulf of Mexico). The features of inbound and outbound trips at two spots were investigated, respectively. Especially, their distributions were studied. On the other hand, the density of vessels in the spot when a vessel went through was also examined. Moreover, the trips made by tankers were particularly studied at these two spots. The findings revealed the travel patterns of inbound and outbound trips passing these two spots. Meanwhile, these patterns also help examine the risk of vessel collisions at these two spots, respectively. Keywords: travel behavior, hot spot, AIS data, Sabine-Neches Waterway 1


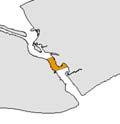
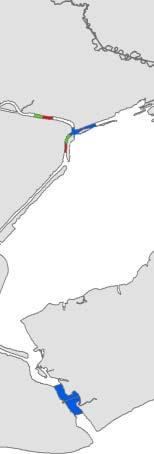
3 INTRODUCTION The Sabine-Neces Waterway (SNWW) is the major waterway in Southeast Texas (see Figure 1 (a)), which is known as the energy gateway to the U.S. SNWW connects the Port of Beaumont, as well as the Ports of Port Arthur and Orange, with the Gulf of Mexico. The SNWW serves four refineries and many chemical plants located along the waterway. From -, the import of crude oil through this waterway comprises 1% of the U.S and 1% of Western Gulf Coast imports (USACE, ). As shown in Figure 1(b), the major route of the SNWW goes from the Port of Beaumont to the Gulf via Neches River and jettied entrance channel. The channel is ft (1. m) deep and ft (1 m) wide in the section of Neches River and ft (1 m) deep and - ft (1- m) wide in the jettied entrance channel, having the capacity for oil tankers and other big vessels. The second route goes to the Port of Orange in the northeast via Sabine River, which is ft ( m) deep and ft (1 m) wide (USACE, ). To the southwest, the channel extends to Galveston via the Gulf Intracoastal Waterway (GIWW). There are two intersections in the SNWW, as shown in Figure 1(b). Intersection 1 Intersection (a) Map of Southeast Texas Figure 1 Inland waterways in Southeast Texas (b) Map of Sabine-Neches Waterway The vessel traffic in the SNWW steadily increases with the significant economic increase in the Southeast Texas in the recent decades. To accommodate to this continuously increasing demand, recently, a project with $1.1 billion budget will be implemented to improve the capacity of the SNWW. The plan includes seven phases, including deepening the channel, extending the length of channel and widening some parts of the channel (USACE, ). The SNWW is a narrow but busy waterway. Safe navigation in the narrow waterway is one of the most important concerns to maritime authorities and researchers. According to the historical data, there is an average of - vessel collisions and 1 grounding per month (SETWAC, 1). Collisions in the SNWW are more dangerous than groundings because the groundings in the SNWW are primarily soft (Wu et al., 1). Our previous research studied the risk of vessel collisions in the SNWW based on the collected automatic identification system (AIS) data in the SNWW (Wu et al, 1). In this research, the frequency of conflicts of big vessels, which is defined as the case that one vessel (at least meters) enters the domain of another (at least meters), was studied along the SNWW based on two months AIS data. Two types of domains were used, respectively: circular or elliptical domains. A vessel conflict represents a kind of potential risk of vessel collision. Three types of vessel conflicts were considered: head-on, overtaken and crossing. Therefore, the higher the frequency at one location, the higher the risk of vessel collision at this location. Along the SNWW, this study identifies six hot spots, where at least % of total vessel conflicts in the SNWW took place. It was found that based on either circular or ellipitical domains, the locations of hot spots were almost the same for different types of vessel conflicts in different months. Figure shows the locations of six hot spots based on the AIS data in March, 1. Readers are referred to Wu et al. (1) for the details of the theories and procedure of identifying hot spots, as well


 Head-on conflicts,")

 Overtaken conflicts,")


 was also employed to identify the hot")
.")


.")


4 as more results of the hot spot identification. Beaumont Beaumont % 1% Beaumontt % % 1% Intersection 1 Spot 1 % Spot 1 1% % Spot 1 Intersection Hot spot Hot spot Hot spot a) Crossing conflicts, circular domains Beaumont b) Overtaken conflicts, circular domains Beaumont % % c) Head-on conflicts, circular domains Beaumont % % 1% % Spot 1 1% Spott 1 % Spot 1 Hot spot Hot spot Hot spot d) Crossing conflicts, elliptical domains e) Overtaken conflicts, elliptical domains f) Head-on conflicts, elliptical domains % % % % 1% Figure Hotspots with occurrence of at least 1% of each typee of vessel conflicts in March, 1 (Wu et al, 1) Note*: the percentage of all conflicts is less than %, and thus strictly speaking, it may not be a hot spot Vessel conflict ranking operatorr (VCRO) model developed by Zhang et al. (1) was also employed to identify the hot spot of vessel collisions in the SNWW (Wu et al., 1). Interestingly, it was also found that hot spots are almost the same, especially for Hot spots 1 and shown in Figure. These two hot spots were found to have the highest frequency of all kinds of vessell conflicts (head-on, overtaken, and crossing), no matter under either circular or elliptical domains. Moreover, they are neither at the intersection of two channels (as Hot spot ), nor close to the ports (as Hott spot and ). Usually the risk of vessel collisions is high at the intersection and the channel near the ports. Therefore, this paper particularly studies the travel behavior of vesselss that pass these two hot spots using the AIS data. The reminder of this paper is organized as follows. Section reviews the existing studies of travel behavior and risk analysis based on AIS data; Section studies the travel behavior of general trips at two hot spots, respectively; Section specifically investigates the travel behavior of tankers at these two spots, as tankers are major vessels running in the SNWW and accidents associated with tankers would be disastrous; and Section concludes this paper.
5 LITERATURE REVIEW Since, new ships and all sea-going vessels that have gross tons or more, as well as all passengers vessels are required to equip an automatic identification system (AIS) on board. The AIS transmits the sailing status information between vessels, and from vessels to shore or vice versa. Therefore, AIS helps vessels see each other in the channel, and the waterway management agency can also monitor the status of vessels. The AIS data contains the detailed and consecutive temporal and spatial information of a vessel, as well as real maneuvering behavior of a vessel (such as speed, course, etc.). For this reason, recently, AIS data are widely used in the waterway transportation research, including the risk analysis of vessel collisions, vessel travel bahevior, etc. Mou et al. () developed linear regression models based on AIS data to evaluate the risk of vessel collisions in the North Sea off the Port of Rotterdam, based on two indicators: closest point of approach (CPA) and time to closest point of approach (TCPA) between two vessels. These two factors well reflect how veseel collisions are avoided in a given waterway. For example, if the CPA between two vessels are small, then the risk level is high for these two vessels to collide each other. Using AIS data, Weng et al. (1a, 1b) investigated the frequency of vessel conflicts in Singapore Straits, which occurs when one vessel enters the domain of another. They assumed a short time ( seconds), and assume that a vessel conflict happens if one vessel will enter the doamain of another within this short time period. They defined a vessel s domain as a circle with three times of this vessel s length. Actually, the definition of a vessel s domain varies in the literature. Fujii and Tanaka () defined an elliptical domain, where the major and minor radii are and 1. times of the length of the vessel, respectively; and Qu et al. () proposed the fuzzy quaternion ship domain. In many exisiting models, it is important to know the interactions between vessels. Since AIS data provides the navigation details of vessels, the relative speed, angle and distance can be revealed between two vessels. Such information about vessel interaction serves as input to many models. For example, Zhang et al. (1) proposed a vessel conflict ranking operator (VCRO) model which is based on a survey among maritime experts to rank the risk of various situations about the interaction between two vessels: relative speed, angle, and distance; Kujala et al. () developed a collision model to study the risk of vessel collisions and groundings in the Gulf of Finland, requiring the information of relative speeds between vessels; and Montewka et al. () developed models to calculate the probability of three types of vessel collisions: overtaken, head-on and crossing, where information of vessel interaction is required. The AIS data can be also used in building simulation models. Goerlandt and Kujala () developed a ship collision probability model where a Monte Carlo simulation was used. The AIS data provide the input to this model: traffic routes, the number of vessels on each route, the departure times of vessels, speeds and the dimensions of vessels. On the other hand, AIS data were used to investiage the travel behavior of vessels at some busy channels. For example, Xiao et al. (1) investigated the travel behavior of vessels at two spots (one is near the Port of Rotterdam, and another is near Shanghai) based on AIS data. They studied the distribution of vessel speeds, courses, and arrival time intervals.. GENERAL TRAVEL BEHAVIOR ANALYSIS The AIS data used in this paper are from the website of marinecadastre.gov ( gov). This paper employed the AIS data collected in the SNWW in each month of 1. Each record represents a vessel s status: the location (longitude and latitude), timestamp (as accurate as second), speed over ground (SOG), course over ground (COG), heading, rate one turn (ROT), voyage id, vessel id (Maritime Mobile Service Identity, i.e., MMSI), etc. Also, the information of vessels and voyages, such as vessel length, type, voyage destination and starting time, is also available. As mentioned in the first section, this paper aims to investigate travel behavior of vessels in two hot


6 spots (see Figure ), which were found to have the highest vessel conflict frequencies, even using different methods. The length of each hot spot is about 1 meters. The AIS data of the entire year of 1 were used to investigate the travel behavior of vessels in these two hot spots. After filtering data using ArcGIS, 1 and 1 vessels were found passing these two hot spots, respectively in 1, and there were 1,,1 and 1,1,1 AIS records, respectively. The following analysis is based on these records..1 Analysis of trips For each vessel, at first, the time of entering and leaving each hot spot was studied, respectively, so that the trip information can be extracted when a vessel went through this spot. However, since the time interval between two records is around 1 minute, the exact entering and leaving time may not be available. For this reason, we use the first record when a vessel enters the spot as the starting point, and last record when it leaves the spot as the ending point, so that a trip that passes through this hot spot can be revealed. These trips were divided into three groups: inbound, outbound and moored. Traffic is regarded as outbound if it moves closer to the Gulf of Mexico; on the other hand, it is regarded as inbound if it moves closer to the Port of Beaumont. Therefore, at spot 1, northbound traffic is inbound; while at spot, westbound traffic is inbound. Meanwhile, vessels may also be moored at these two locations for a while. Such behavior is very different from directly running through the spots because if a vessel is moored, its speed and course may change significantly. Therefore, such status is treated separately in this paper. Hot spot Spot 1 Hot spot Spot (a) Figure Locations of two hot spots (view in different scale) Figure (a-b) reports the monthly number of trips in each direction (inbound, outbound as well as moored) at two spots, respectively, and Figure (c-d) reports the monthly number of vessels in each diretion at two spots. There were more trips and more vessels passing spot 1 than spot, because the channel at spot 1 also serves the traffic along the Gulf Intracoastal Waterway (GIWW), which extends to Port of Orange to the east (and further east to Florida), and to Galveston to the west (and further west). Moreover, it is seen that the change from month to month is small, well indicating that the traffic in the SNWW is quite stable over time. At both spots, the number of moored trips (i.e., a vessel has been moored when it passed this spot) was much more than the number of trips that directly went through the spot without stopping. Meanwhile, the number of vessels that have been moored is also much larger than those directly passed through, as shown in Figure (c-d). On the other hand, the numbers of inbound and outbound trips (excluding moored trips), as well as the number of vessels in two directions at both spots are almost the same. Further, the distribution of vessel types in inbound and outbound traffic at both spots were investigated, respectively. The results were reported in Figure. At spot 1, it is seen that towing vessels and tankers were two major type of vessels (about % and % of the total, respectively) in each month of 1; while at spot, there were much less number of towing vessels, and consequently, making tankers the major type of vessels passing there (-% of the total). The reason is that spot 1 is in the (b)
7 channel shared by GIWW and SNWW (see Section 1 for details), and the former is primary for towing vessels. # Trips # Vessels 1 Inbound Outbound Moored Inbound Outbound Moored # Trips Jan Feb Mar Apr May Jun Jul Aug Sep Oct Nov Dec Jan Feb Mar Apr May Jun Jul Aug Sep Oct Nov Dec (a) Spot 1, number of trips (b) Spot, number of trips Inbound Outbound Moored Inbound Outbound Moored # Vessels 1 1 Jan Feb Mar Apr May Jun Jul Aug Sep Oct Nov Dec (c) Spot 1, number of vessels Jan Feb Mar Apr May Jun Jul Aug Sep Oct Nov Dec (d) Spot,, number of vessels Figure Number of trips and vessels in each direction in each month of 1 at two hotspots. Towing vessels Harbor tugs Cargos Tankers. Towing vessels Harbor tugs Cargos Tankers Jan Feb Mar Apr May Jun Jul Aug Sep Oct Nov Dec (a) Inbound trips at spot 1 (b) Outbound trips at spot 1 Towing vessels Harbor tugs Cargos Tankers. Towing vessels Harbor tugs Cargos Tanker. Jan Feb Mar Apr May Jun Jul Aug Sep Oct Nov Dec (c) Inbound trips at spot (d) Outbound trips at spot Figure Distribution of vessel types in each direction in each month of 1 at two hotspots Jan Feb Mar Apr May Jun Jul Aug Sep Oct Nov Dec Jan Feb Mar Apr May Jun Jul Aug Sep Oct Nov Dec
8 Analysis of travel speed To study the behavior of vessels that pass through these two hot spots, it is necessary to investigate their speed distribution. Fortunately, the AIS data provides the detailed information of navigation, including the speed, course, and route. After summarizing the information of trips, each trip s average speed can be obtained by simply considering the time intervel and distance between the starting and ending points of this trip when passing through each spot. Therefore, it is actually a space mean speed of each trip. In the following, we simply call it as the speed of a trip. By analysing the AIS data, the speed of each inbound or outbound trip at each spot was calculated. Note that to better describe the speed distribution of all trips in each direction, the moored trips were not considered here given their average speed were almost. At first, the statistical summary of the inbound or outbound trip speeds at two spots were investigated, respectively, as reported in Table 1. It is seen that generally, the speed is low. Even th percentiles of speed are less than 1 knot at spot 1, and less than knots at spot. It seems that at spot 1, even though the mean speeds of two directions were almost the same, inbound trips experienced large variances. That is why inbound trips had a smaller median, but a slightly larger th -percentile and a much larger th - percentile. That is, the speed of inbound trips varies in a larger range. On the other hand, at spot, inbound trips had smaller speeds than outbound trips in general. For example, even inbound trips speed suffered from larger variance, its th -percentile is still less than that of outbound trips. Table 1 Data summary and normality test of each trip s speeds at two spots (Note: 1 knot =. m/min) Spot 1 Spot Inbound Outbound Inbound Outbound Data Summary (unit: knots) Mean.... Standard deviation Median.... th -percentile th -percentile...1. th -percentile..1.. Skewness Kolmogorov-Smirnov test (normality test) P-value.1... The skewness check of four trip speed distributions shows that only the speed distrubtion of outbound trips at spot are positively skewed, and other three are negatively skewed, especially for the outbound trips at spot 1. Note that the speeds of inbound trips at spot 1 are close to be symmetrically distributed, so it is necessary to check its normality. Using the Kolmogorov-Smirnov test, it was found that none of four were normally distributed, given a significant level of., because all P-values are less than. (see Table 1), leading to reject the hypothesis of normality. This paper uses. as the significant level, which is most commonly used in statistical analysis. To better investigate the speed distributions of inbound and outbound trips at two spots, we plot these distributions in Figure, and we further attempted to fit these speeds using various distributions (totally 1 distributions were checked, conducted by EasyFitXL). Still based on the Kolmogorov-Smirnov test, the distributions with a P-value greater than. (as the pre-defined significant level) were kept. For each direction, up-to three best fitted distributions (based on P-values) were reported in Figure. Table reports the P-values of each fitted distributions. Though there is no common distribution that fits all of four speed distributions, it seems that generalized extreme value distribution fits three (at least P-values are larger enough): outbound trips at Spot 1 and both in- and out-bound trips at Spot. Equation (1) gives
9 the probability density function (PDF) of generalized extreme value distribution, which has three parameters: shape parameter, scale parameter and location parameter. Table reports the parameters of generalized extreme value distributions that fit the speed distributions of three trips. where = Density Density ( ) = (1 + ) / (1 + ) / (1)...1 Data.. Data Gen. Extreme Value.. Nakagami Beta.. Burr Speed (m/min) Speed (m/min) (a) Inbound trips at spot 1 (b) Outbound trips at spot Data Johnson SB Beta Gen. Extreme Value 1 1 Speed (m/min) Speed (m/min) (c) Inbound trips at spot (d) Outbound trips at spot Figure Speed distributions of in- and out-bound trips at two hotspots (histograms of the data and the fitted distributions) Table P-values of the fitted distributions, given a significant level of. Spot 1 Spot Inbound Outbound Inbound Outbound. (Nakagami). (Gen. Extreme Value). (Beta).1 (Burr). (Kumaraswamy).1 (Weibull). (Johnson SB).1 (Beta).(Gen. Extreme Value). (Error). (Log-logistic). (Gen. Extreme Value) Table Estimates of three parameters of the fitted generalized extreme value distributions Outbound trips at spot Inbound trips at spot Outbound trips at spot For the estimates of parameters of other fitted distribution, please refer to Appendix at the end of this Density Density Data Log-logistic Gen. Extreme Value
10 paper. Generally speaking, the trip speed distributions varies in different directions at two spots, though generalized extreme value distributions can be used to roughly describe some of these distributions. In the following, we will specifically analyze the speed distributions of trips made by tankers.. Analysis of vessel density Based on the revealed trip information, which includes both temporal and spatial information, this paper further analyzed the number of vessels in one spot when there was a vessel passing through this spot. This information is important because it is related to the risk of collisions. Note that the identification of hot spots depends on the frequency of vessel conflicts, which occur when one vessel enters the domain of another (Wu et al., 1). When it went through a spot, a vessel may encounter other vessels in three types of status: moored, running through in the opposite direction, or in the same direction. First, during the time when a vessel passed through a spot (without stopping), i.e., an in- or out-bound trip, the total number of all vessels (including this vessel itself) in this spot were recorded. This number of vessels can be regarded as vessel density if taking a spot as a unit. Then for all in- or out-bound trips, the distribution of the vessel density were investigated, as reported in Figure (a). For example, it shows that.% of all inbound trips at spot 1 in the whole year of 1 saw another vessel in the spot (i.e., vessels in total); while.% or.% of them saw or other vessels in the spot, respectively (i.e., or in total). It is seen that for trips in both directions at two spots, it is most likely to encounter - other vessels. Moreover, generally spot 1 was more congested than spot. For example, around 1% of all trips (both in- and out-bound) at spot 1 saw more than other vessels (i.e., or more in total); while at spot, such trips were less than.% of the total. It is because spot 1 is located in the channel shared by both SNWW and GIWW, so that there are lots of barges at spot 1, as discussed in Section.1... Inbound, Spot 1 Outbound, Spot 1. Inbound, Spot. Outbound, Spot More Number of vessels (a) Total number of vessels in the spot when a vessel went through without stopping (including this vessel itself) Inbound, Spot 1 Outbound, Spot 1 Inbound, Spot Outbound, Spot 1 Number of vessels More (b) Number of vessels moving in the opposing direction 1 More Number of vessels (c) Number of vessels moving in the same direction Figure Distribution of the number of vessels encoutered by a vessel that went through a hotspot without stopping Inbound, Spot 1 Outbound, Spot 1 Inbound, Spot Outbound, Spot
11 When a vessel travels through a spot, we are particularly interested in the number of vessels that were also in motion, especially those moving in the opposing direction, because apparently such numbers are more related with the risk of vessel collisions. For each trip, the numbers of vessels that moved in the opposing direction, as well as in the same direction, were investigated, respectively. Figure (b-c) reports the distrubtions of these two types of numbers. Interestingly, it was seen from these two figures that over % of in- or out-bound trips at each spot did not see another in- or out-bound trip at the same time at the same spot. That is, even if a vessel may see some other vessels in this spot when it moves through,,most of them were moored. This findings reveal that actually the risk of vessel collisions could be not as high as expected based on Figure (a). It is seen that at both spots, an inbound trip had more chances to encounter an outbound trip. For example, at both spots, around % of total outbound trips encountered an inbound trip; while around as high as % of total inbound trips encountered one outbound trip. Therefore, it seems that inbound trips may suffer the higher risk than outbound trips at both spots, considering head-on collision risk.. On the other hand, at both spots, only -% trips had a chance to see another trip in the same direction at the same time.. TRAVEL BEHAVIOR OF TANKERS Southeast Texas is famous for its oil industy in the U.S. Tankers in SNWW plays a critical role in supporting the oil industry in Southeast Texas. Section.1 shows that tankers are major vessels passing two spots, and especially, they accounted for -% of total vessels in Spot in 1. This section speciafically studied travel behavior of tankers at these two spots..1 Analysis of travel speed First, the trips made by tankers were picked out for analysis. At spots 1 and, there were 1 and inbound, and and outbound tanker trips, respectively. Table summarizes the statistical features of the speed of these trips. It is seen that at spot 1, similar to general trips made by all vessels, inbound truck trips suffered from a large variance in speed than outbound trips, though it had a smaller mean speed. The median of inbound trip was less, but roughtly from the th, the percentile of inbound trip became larger than that of outbound. On the other hand, at spot, inbound tanker trips had generally smaller speeds than outbound trips, even if it had a larger variance. This feature is also similar to those general trips of all vessels. Table Data summary and normality test of tanker trip speeds in each direction at two spots (Note: 1 knot =. m/min) Spot 1 Spot Inbound Outbound Inbound Outbound Data Summary (knot) Mean.... Standard deviation Median.... th -percentile.... th -percentile....1 th -percentile.... Skewness Kolmogorov-Smirnov test (normality test) P-value
12 Moreover, compared with general trips, it was seen that tanker trips generally had higher speeds at spot 1, but lower at spot. Furhter, Kolmogorov-Smirnov tests show that none were normally distributed, except the outbound trips at spot 1. This findings were also consistents with those about general trips. The speed distributions of tanker trips in different directions were further investigated in the following. Density Density Speed (m/min) Speed (m/min) (c) Inbound trips at spot (d) Outbound trips at spot Figure Speed distributions of in- and out-bound trips made by tankers at two hotspots (histograms of the data and the fitted distributions) Table P-values of the fitted distributions for trips made by tankers, given a significant level of. Spot 1 Spot Inbound Outbound Inbound Outbound.1 (Fatigue Life). (Lognormal).11 (Pearson ).1 (Gen. Extreme Value) Data Fatigue Life Lognormal Pearson VI Gen Extreme Value. (Burr). (Johnson SU).1 (Dagum).1 (Beta).1 (Gen. Extreme Value). (Weibull).1 (Normal).1 (Gamma). (Gen. Extreme Value).1 (Pearson VI).1 (Gamma).(Log-logistic).(Burr). (Johnson SU). (Gen. Extreme Value) This paper studied the speed distributions of tanker trips (as reported in Figure ), and attempted to use some specific distributions to fit these speed data using EasyFitXL. Figure shows the fitted distributions. It is seen that the speed distributions of tanker trips were more regular than those of general Density Density Data Burr Johnson SU Dagum Beta Gen. Extreme Value 1 1 Speed (m/min) Speed (m/min) (a) Inbound trips at spot 1 (b) Outbound trips at spot 1.1 Data.1 Data Log-Logistic Gen. Extreme Value.1 Burr.1 Pearson Johnson SU.1 Gamma Gen. Extreme Value..1 1
13 trips made by all vessels, because much more distributions were found to be able to fit the speed data, especially for outbound trips at spot. Note that only the top-ranked distributions were reported in Figure (b). Table reports the P-value of these top-ranked distributions that fit these speed distributions well. As mentioned before, P-values that are greater than. (predefined significant level) lead to not reject the hypothesis that this distribution well fits the given speed data. Interestingly, it was found that it is still the generalized extreme value distribution (see Eq. (1) for its PDF) that fits all speed data of both in- and out-bound tanker trips at two spots. Table reports the estimates of the parameters of the fitted generalized extreme value distributions. Please refer to Appendix for the estimates of the parameters for other fitted distributions. Table Estimate of three parameters of the fitted generalized extreme value distributions for. Analysis of density Outbound trips at spot Inbound trips at spot Outbound trips at spot Inbound trips at spot Also, when a tanker passed through a spot, the number of vessels in the spot were also recorded and its distribution was investigated. The finding is quite similar to that of general trips. At spot, more than % of tanker trips (both in- and out-bound) saw other vessels at this spot when it ran through. While less than.% of tanker trips saw more than other vessels at this spot. Spot 1 was more congested. Around 1% of tanker trips (both in- and out-bound) saw more than other vessels at this spot when it went through. However, the number of vessels that were not moored is much smaller More Number of vessels (b) Number of vessels moving in the opposing direction Inbound spot,1 Outbound Spot,1 Inbound Spot, Outbound Spot,. 1 More Number of vessels (a) Total number of vessels in the spot when a tanker went through without stopping (including this vessel itself) 1. Inbound spot,1 Outbound Spot,1 Inbound spot,1. Inbound Spot, Outbound Spot,1 Outbound Spot,. Inbound Spot, Outbound Spot,. (c) Number of vessels moving in the same direction Figure Distribution of the number of vessels encoutered by a tanker that went through a hotspot without stopping Still, more than % of tanker trips (both in- and out-bound) at two spots only saw moored vessels in.. 1 More Number of vessels 1
14 this spot. Only % and % of all inbound tanker trips encountered an outbound trip (by any vessel) at spots 1 and, respectively; whie only % of outbound tanker trips encountered an inbound trip at two spots, respectively. Therefore, inbound tanker trips at two spots, especially at spot, may suffer from higher risk of head-on collisions, compared with outbound tanker trips at these two spots. These findings are well consistent to the findings of general trips, as discussed in Section.. On the other hand, interestingly, it seems that ourbound tanker trips may suffer from higher risk of overtaken collisions at both two spots: around % and % of outbound tanker trips saw another outbound trip (by any vessel) at the same time at spots 1 and, repsectively; while only about 1% and % of inbound tanker trips saw another inbound trip at the same time at spots 1 and, respectively. Such features were not revealed in the analysis of general trips by all vessels.. CONCLUSIONS This paper studied the travel behavior of vessels at two hot spots in SNWW, which were identified in our previous research based on the analysis of vessel conflict frequencies using AIS data (Wu et al, 1). A vessel conflict occurs when a vessel enters the domain of another. It was found that more than % of total vessel conflicts along the whole SNWW occurred at these two hot spots. Moreover, these two spots are not located at the intersection, nor close to the port. Therefore, it would be easier to investigate the travel behavior of vessels. At each spot, using the AIS data of the whole year of 1, vessels navigation information were organized into various trips within each spot. For each trip of a vessel, the first and last time stamps within a spot are regarded as the starting and ending time of a trip within this spot, respectively, so that the time duration of a trip within this spot can be known. With the known travel distance within this spot, the average speed of a trip can be found. This speed can be regarded as space mean speed of a trip. On the other hand, with known spatial and temporal information of trips, the interaction between vessels within a spot can be also examined. This paper particularly studied the distributions of these trip speeds in each direction at each spot. The findings of this paper were summarized as follows. At both spots, the number of moored trips (i.e., a vessel had been moored at these two spots) is much larger than that of vessels directly running through (either inbound or outbound) At spot 1, the major vessel types were towing vessels (-%) and tankers (about %); while tankers accounted for -% of all vessels at spot. The traffic flow of each type of vessels were stable from month to month. The speed distributions of general trips are not normally distributed. Instead, the distributions varies. Roughly, a generalized extreme value distribution can discribe some of these distributions. While for tank trips, the speed distributions were more regular. Generalized extreme value distributions can fit all speed distributions of tanker trips in both direction at two spots. Generally, around % of trips saw - other vessels in spot 1, and - other vessels at spot at the same time. Spot 1 was found to be more congested than spot. However, in more than % of cases, the vessels that were encounted by another vessel which was running through a spot, were moored at this spot. It is also found that inbound trips at both spots suffers higher risk of head-on collisions than outbound trips. As to tankers, it was found that tankers ran faster than general trips at spot 1, but relatively slower at spot. Most vessels that a tanker encountered when it was going through a spot were moored. It was also found that inbound tanker trips at both spots, especially at spot, may suffer from higher risk of head-on collisions than outbound ones, given that it is more likely for a tanker (running inbound) to entercounter another vessel running outbound. On the other hand, outbound tanker trips may suffer from higher risk of overtaken collisions at 1
15 both spots, as a tanker running in the outbound direcition has a larger chance to have another vessel also running outbound at the same time and at the same spot. This paper investigated the travel behavior of vessels at two hot spots in SNWW based on AIS data collected during the whole year of 1. There exists some other hot spots located at the intersection of two channels, as well as those near the spots. Meanwhile, it is also important to study the human factors associated with various types of vessel behavior. It warranties futher investigation. ACKNOWLEDGEMENT This research is sponsored by the Center for Advances in Port Management of Lamar University (). The authors resume sole responsibilities for the content expressed. REFERENCE Fujii, Y. and Tanaka K.,. Traffic capacity. Journal of Navigation. (), -. Goerlandt, F. and Kujala, P. () Traffic simulation based ship collision probability modeling. Reliability Engineering and System Safety, Vol., pp. 1-. Kujala, P. Hanninen M. Arola, T. and Ylitalo, J. () Analysis of the marine traffic safety in the Gulf of Finland. Reliability Engineering and System Safety, Vol., pp Montewka, J., Hinz, T., Kujala, P., and Matusiak, J. () Probability modeling of cessel conllisions. Reliability Engineering and System Safety, Vol., pp. -. Mou, J. M., van der Tak, C. and Lighteringen, H.,. Study on collision avoidance in busy waterways by using AIS data. Ocean Engineering., -. Qu X., Meng, Q. and Suyi, L.,. Ship collision risk assessment for the Singapore Strait. Accident Analysis and Prevention,, -. SETWAC, 1. Southeast Texas Waterways Advisory Council. retrieved October nd, 1. Weng, J., Meng, Q. and Qu, X., 1a. Vessel collision frequency estimation in the Singapore Strait. Journal of Navigation., 1-1. Weng, J., Meng, Q. and Li, S., 1b. Quantitative risk assessment model for ship collisions in the Singapore Strait. In the proceeding of 1 Transportation Research Board Annual Meeting, Washington, DC. Wu, X., Mehta, A, Zaloom, V. and Craig, B. (1) Analysis of waterway transportation in Southeast Texas waterway based on AIS data. Ocean Engineering, Vol., pp.1-. Wu, X., Rahman, M. H. and Zaloom, V., 1. Probability analysis of vessel collisions and groundings in Southern Texas Waterways. Transportation Research Record., -. Xiao, F., Ligteringen, H., van Gulijk, C., Ale, B. 1. Comparison study on AIS data of ship traffic behavior. Ocean Engineering., -. U.S. Army Corps of Engineers (USACE),. Sabine-Neches waterway channel improvement project Southeast Texas and Southwest Louisiana,. Portals//docs/ civilworks/cwrb/sabine/sabine.pdf. Zhang, W., Goerlandt, F., Montewka, J. and Kujala, P., 1. A method for detecting possible near miss ship collision from AIS data. Ocean Engineering., -. 1
16 APPENDIX The following lists the probabiltiy density functions (PDFs) of a series of distributions. As to generalized extreme value distribution, please refer to Equation (1). Beta distribution: ( ) = Burr distribution: ( ) = Dagum distribution: ( ) = ( ) ( ) (, ) ( ) 1+ Error distribution: ( ) = exp( (h ) ) Fatigue life distribution: ( ) = 1+. Gamma distribution: ( ) = ( ) ( ( )/ ) ( ) Johnson SB distribution: ( ) = exp + ln, where =. ( ) Johnson SU distribution: ( ) = exp + ln + +1, where =. Kumaraswamy distribution: ( ) = (1 ) ( ), where = Log-logistic distribution: ( ) = 1 + Lognormal distribution: ( ) = Nakagami distribution: ( ) = ( ) exp ( ) Normal distribution: ( ) = Pearson VI distribution: ( ) = ( )/ (, )( ( )/ ) Weibull distribution: ( ) = exp ( ) The following list gives the estimates of the parameters of the fitted distributions. Inbound trips at Spot 1 Nakagami: =.1, =, with P-value =. Outbound trips at Spot 1 Generalizd extreme value: =.1, =., = 1.1, P-value =. Beta: α =., α =., =., =.1, P-value =. Burr: =., =., =., =.1, P-value =.1 Kumaraswamy: α =., α =.1, =., =.1, P-value =. Weibull: =.1, =., = 1., P-value =.1 Inbound trips at Spot Johnson SB: =., = 1., =., =., P-value =. Beta: =.1, =., =.1, =., P-value =.1 1
17 Generalizd extreme value: =.1, =.1, = 1.1, P-value =. Error: =., =.1, = 1., P-value =. Outbound trips at Spot Log-logistic: α =., β =., γ =., P-value =. Generalizd extreme value: =.11, =., = 1.1, P-value =. For tanker trips: Inbound trips at Spot 1 Fatigue life: =.1, =., P-value =.1 Lognormal: =.1, =., P-value =. Pearson VI: =., = 1., =., =., P-value =.11 Generalizd extreme value: =.1, =., =., P-value =.1 Outbound trips at Spot 1 Burr: =., =., =., γ = 1., P-value =.. Johnson SU: =., =., =., =., P-value =. Dagum: =., = 1., = 1., γ =., P-value =.1 Beta distribution: α =., α =., = 1., = 1., P-value =.1 Generalizd extreme value: =.11, = 1., =., P-value =.1 Normal: =., =., P-value =.1 Gamma: =., = 1.1, γ =., P-value =.1 Inbound trips at Spot Generalizd extreme value: =.1, =., = 1., P-value =. Pearson VI: = 1., = 1., =., =., P-value =.1 Gamma: =., =.1, γ =., P-value =.1 Outbound trips at Spot Log-logistic: α = 1.1, =., γ =., P-value =.. Burr distribution: = 1.1, =.1, = 1., with P-value =.. Johnson SU: =.11, =.1, =.1, = 1., P-value =. Generalizd extreme value: =.1, =., = 1., P-value =. 1
AIS data analysis for vessel behavior during strong currents and during encounters in the Botlek area in the Port of Rotterdam
 International Workshop on Next Generation Nautical Traffic Models 2013, Delft, The Netherlands AIS data analysis for vessel behavior during strong currents and during encounters in the Botlek area in the
Analysis of AIS-based Vessel Traffic Characteristics in the Singapore Strait
 Meng, Weng and Li 0 0 0 0 Analysis of AIS-based Vessel Traffic Characteristics in the Singapore Strait Qiang Meng * Associate Professor Block E, #0-0, Engineering Drive Department of Civil and Environmental
Int. J. of Marine Engineering Innovation and Research, Vol. 1(1), Dec (ISSN: ) 26. Muhammad Badrus Zaman 1
, Dec (ISSN: ) 26. Muhammad Badrus Zaman 1") Int. J. of Marine Engineering Innovation and Research, Vol. 1(1), Dec. 2016. 26-30 (ISSN: 2541-5972) 26 Study on Safety of Navigation Using Automatic Identification System for Marine Traffic area Case
Int. J. of Marine Engineering Innovation and Research, Vol. 1(1), Dec. 2016. 26-30 (ISSN: 2541-5972) 26 Study on Safety of Navigation Using Automatic Identification System for Marine Traffic area Case
World Shipping Council. National Oceanographic and Atmospheric Administration
 Comments of the World Shipping Council Submitted to the National Oceanographic and Atmospheric Administration In the matter of Endangered and Threatened Species; Petition for Rulemaking to Establish a
Inlet Specific and Seasonal Variation in Vessel Use Patterns: The case of the Northeast Florida Region
 Inlet Specific and Seasonal Variation in Vessel Use Patterns: The case of the Northeast Florida Region Nancy Montes Robert Swett University of Florida Automatic Identification System (AIS) Ships 300 or
Maritime Traffic Situations in Bornholmsgat
 http://www.transnav.eu the International Journal on Marine Navigation and Safety of Sea Transportation Volume 9 Number 1 March 2015 DOI: 10.12716/1001.09.01.14 Maritime Traffic Situations in Bornholmsgat
Delaware River Vessel Reporting System Mariners Advisory Committee For
 Delaware River Vessel Reporting System Mariners Advisory Committee For the Bay and River Delaware The Mariner's Advisory Committee is comprised of Master Mariners, River Pilots, and concerns itself with
GLMM standardisation of the commercial abalone CPUE for Zones A-D over the period
 GLMM standardisation of the commercial abalone for Zones A-D over the period 1980 2015 Anabela Brandão and Doug S. Butterworth Marine Resource Assessment & Management Group (MARAM) Department of Mathematics
Standardized catch rates of U.S. blueline tilefish (Caulolatilus microps) from commercial logbook longline data
 from commercial logbook longline data") Standardized catch rates of U.S. blueline tilefish (Caulolatilus microps) from commercial logbook longline data Sustainable Fisheries Branch, National Marine Fisheries Service, Southeast Fisheries Science
Standardized catch rates of U.S. blueline tilefish (Caulolatilus microps) from commercial logbook longline data Sustainable Fisheries Branch, National Marine Fisheries Service, Southeast Fisheries Science
WIM #36 MN 36 MP 15.0 LAKE ELMO APRIL 2014 MONTHLY REPORT
 WIM #36 MN 36 MP 15.0 LAKE ELMO APRIL 2014 MONTHLY REPORT In order to understand the vehicle classes and groupings, the MnDOT Vehicle Classification Scheme and the Vehicle Class Groupings for Forecasting
COMPARISON OF FIXED & VARIABLE RATES (25 YEARS) CHARTERED BANK ADMINISTERED INTEREST RATES - PRIME BUSINESS*
 CHARTERED BANK ADMINISTERED INTEREST RATES - PRIME BUSINESS*") COMPARISON OF FIXED & VARIABLE RATES (25 YEARS) Fixed Rates Variable Rates FIXED RATES OF THE PAST 25 YEARS AVERAGE RESIDENTIAL MORTGAGE LENDING RATE - 5 YEAR* (Per cent) Year Jan Feb Mar Apr May Jun Jul
COMPARISON OF FIXED & VARIABLE RATES (25 YEARS) Fixed Rates Variable Rates FIXED RATES OF THE PAST 25 YEARS AVERAGE RESIDENTIAL MORTGAGE LENDING RATE - 5 YEAR* (Per cent) Year Jan Feb Mar Apr May Jun Jul
WIM #37 I-94, MP OTSEGO, MN APRIL 2012 MONTHLY REPORT
 WIM #37 I-94, MP 200.1 OTSEGO, MN APRIL 2012 MONTHLY REPORT In order to understand the vehicle classes and groupings the Mn/DOT Vehicle Classification Scheme and the Vehicle Classification Groupings for
Comparisons of Discretionary Lane Changing Behavior
 THE UNIVERSITY OF TEXAS AT EL PASO Comparisons of Discretionary Lane Changing Behavior Matthew Vechione 1 E.I.T., Ruey Cheu, Ph.D., P.E., M.I.T.E. 1 Department of Civil Engineering, The University of Texas
MALL CROSSING STUDY. Testing the Effectiveness Of the 4th Street East Crossing. For: City of Charlottesville Neighborhood Development Services
 MALL CROSSING STUDY One-Year Evaluation Final Report Testing the Effectiveness Of the 4th Street East Crossing For: City of Charlottesville Neighborhood Development Services May 2007 By: CHARLOTTESVILLE
Texas Department of Transportation s Gulf Intracoastal Waterway Capacity Study. GICA 112 th Annual Seminar July 28, 2017
 Texas Department of Transportation s Gulf Intracoastal Waterway Capacity Study GICA 112 th Annual Seminar July 28, 2017 Study Purpose Determine if current levels of vessel activity on the Texas segment
The risk assessment of ships manoeuvring on the waterways based on generalised simulation data
 Safety and Security Engineering II 411 The risk assessment of ships manoeuvring on the waterways based on generalised simulation data L. Gucma Maritime University of Szczecin, Poland Abstract This paper
A Method Quantitatively Evaluating on Technical Progress of Students in Ship Handling Simulator Training ABSTRACT
 A Method Quantitatively Evaluating on Technical Progress of Students in Ship Handling Simulator Training Kinzo INOUE, Hideo USUI, Rong MA and Cemil YURTOREN Kobe University of Mercantile Marine 5-1-1 Fukae-minami
Analysis of Ship Accidents in Turkey from 2005 to 2015
 Analysis of Ship Accidents in Turkey from 005 to 05 Firat Bolat Republic of Turkey Ministry of Transport, Maritime Affairs and Communication Harbour Master Office of İstanbul İstanbul, Turkey Abstract
IMPLEMENTATION OF TRAFFIC SEPARATION SCHEME FOR PREVENTING ACCIDENTS ON THE SUNDA STRAIT
 International Journal of Technology (2015) 6: 990-997 ISSN 2086-9614 IJTech 2015 IMPLEMENTATION OF TRAFFIC SEPARATION SCHEME FOR PREVENTING ACCIDENTS ON THE SUNDA STRAIT Sunaryo 1*, Antoni Arif Priadi
CAPACITY ESTIMATION OF URBAN ROAD IN BAGHDAD CITY: A CASE STUDY OF PALESTINE ARTERIAL ROAD
 VOL. 13, NO. 21, NOVEMBER 218 ISSN 1819-668 26-218 Asian Research Publishing Network (ARPN). All rights reserved. CAPACITY ESTIMATION OF URBAN ROAD IN BAGHDAD CITY: A CASE STUDY OF PALESTINE ARTERIAL ROAD
DOI /HORIZONS.B P23 UDC : (497.11) PEDESTRIAN CROSSING BEHAVIOUR AT UNSIGNALIZED CROSSINGS 1
 PEDESTRIAN CROSSING BEHAVIOUR AT UNSIGNALIZED CROSSINGS 1") DOI 10.20544/HORIZONS.B.03.1.16.P23 UDC 656.142.054:159.922(497.11) PEDESTRIAN CROSSING BEHAVIOUR AT UNSIGNALIZED CROSSINGS 1 JelenaMitrovićSimić 1, Valentina Basarić, VukBogdanović Department of Traffic
DOI 10.20544/HORIZONS.B.03.1.16.P23 UDC 656.142.054:159.922(497.11) PEDESTRIAN CROSSING BEHAVIOUR AT UNSIGNALIZED CROSSINGS 1 JelenaMitrovićSimić 1, Valentina Basarić, VukBogdanović Department of Traffic
Appendix ELP El Paso, Texas 2003 Annual Report on Freeway Mobility and Reliability
 (http://mobility.tamu.edu/mmp) Office of Operations, Federal Highway Administration Appendix ELP El Paso, Texas 2003 Annual Report on Freeway Mobility and Reliability This report is a supplement to: Monitoring
Wind Regimes 1. 1 Wind Regimes
 Wind Regimes 1 1 Wind Regimes The proper design of a wind turbine for a site requires an accurate characterization of the wind at the site where it will operate. This requires an understanding of the sources
Naval Postgraduate School, Operational Oceanography and Meteorology. Since inputs from UDAS are continuously used in projects at the Naval
 How Accurate are UDAS True Winds? Charles L Williams, LT USN September 5, 2006 Naval Postgraduate School, Operational Oceanography and Meteorology Abstract Since inputs from UDAS are continuously used
Site Description: LOCATION DETAILS Report Prepared By: Tower Site Report Date
 Wind Resource Summary for Holyoke Site Final Report Colorado Anemometer Loan Program Monitoring Period:: 6/21/26 /6/27 Report Date: December 2, 27 Site Description: The site is 17.4 miles south of the
ASSESSMENT OF CORRECTNESS OF INFORMATION OBTAINED FROM AUTOMATIC IDENTIFICATION OF SHIP S SYSTEM (AIS)
") Journal of KONES Powertrain and Transport, Vol. 17, No. 3 2010 ASSESSMENT OF CORRECTNESS OF INFORMATION OBTAINED FROM AUTOMATIC IDENTIFICATION OF SHIP S SYSTEM (AIS) Henryk niegocki Gdynia Maritime University,
Journal of KONES Powertrain and Transport, Vol. 17, No. 3 2010 ASSESSMENT OF CORRECTNESS OF INFORMATION OBTAINED FROM AUTOMATIC IDENTIFICATION OF SHIP S SYSTEM (AIS) Henryk niegocki Gdynia Maritime University,
Traffic circles. February 9, 2009
 Traffic circles February 9, 2009 Abstract The use of a traffic circle is a relatively common means of controlling traffic in an intersection. Smaller Traffic circles can be especially effective in routing
Draft. Hiroki Yokoi, Yasuko Semba, Keisuke Satoh, Tom Nishida
 Draft Standardization of catch rate for blue marlin (Makaira mazara) exploited by the Japanese tuna longline fisheries in the Indian Ocean from 1971 to 2015 Hiroki Yokoi, Yasuko Semba, Keisuke Satoh, Tom
The Analysis of Possibilities How the Collision Between m/v 'Gdynia' and m/v 'Fu Shan Hai' Could Have Been Avoided
 International Journal on Marine Navigation and Safety of Sea Transportation Volume 2 Number 4 December 2008 The Analysis of Possibilities How the Collision Between m/v 'Gdynia' and m/v 'Fu Shan Hai' Could
SCIENTIFIC COMMITTEE SEVENTH REGULAR SESSION August 2011 Pohnpei, Federated States of Micronesia
 SCIENTIFIC COMMITTEE SEVENTH REGULAR SESSION 9-17 August 2011 Pohnpei, Federated States of Micronesia CPUE of skipjack for the Japanese offshore pole and line using GPS and catch data WCPFC-SC7-2011/SA-WP-09
MRI-2: Integrated Simulation and Safety
 MRI-2: Integrated Simulation and Safety Year 3 2 nd Quarterly Report Submitted by: Dr. Essam Radwan, P.E. (PI), Ahmed.Radwan@ucf.edu Dr. Hatem Abou-Senna, P.E., habousenna@ucf.edu Dr. Mohamed Abdel-Aty,
Determining Occurrence in FMEA Using Hazard Function
 Determining Occurrence in FMEA Using Hazard Function Hazem J. Smadi Abstract FMEA has been used for several years and proved its efficiency for system s risk analysis due to failures. Risk priority number
Title: Modeling Crossing Behavior of Drivers and Pedestrians at Uncontrolled Intersections and Mid-block Crossings
 Title: Modeling Crossing Behavior of Drivers and Pedestrians at Uncontrolled Intersections and Mid-block Crossings Objectives The goal of this study is to advance the state of the art in understanding
REPORT ON RED-LIGHT MONITORING SYSTEMS
 REPORT ON RED-LIGHT TRAFFIC CONTROL SIGNAL MONITORING SYSTEMS Prepared by the New Jersey Department of Transportation November 2011 Executive Summary Public Law 2007, Chapter 348 (P.L. 2007, c.348), signed
SWISS reports stable load factors
 SWISS Corporate Communications Phone: +41 (0)848 773 773 Fax: +41 (0)44 564 2127 communications@swiss.com SWISS.COM Media release Zurich Airport, October 10, 2008 SWISS reports stable load factors SWISS
Regional Analysis of Extremal Wave Height Variability Oregon Coast, USA. Heidi P. Moritz and Hans R. Moritz
 Regional Analysis of Extremal Wave Height Variability Oregon Coast, USA Heidi P. Moritz and Hans R. Moritz U. S. Army Corps of Engineers, Portland District Portland, Oregon, USA 1. INTRODUCTION This extremal
u = Open Access Reliability Analysis and Optimization of the Ship Ballast Water System Tang Ming 1, Zhu Fa-xin 2,* and Li Yu-le 2 " ) x # m," > 0
 x # m, > 0") Send Orders for Reprints to reprints@benthamscience.ae 100 The Open Automation and Control Systems Journal, 015, 7, 100-105 Open Access Reliability Analysis and Optimization of the Ship Ballast Water System
Send Orders for Reprints to reprints@benthamscience.ae 100 The Open Automation and Control Systems Journal, 015, 7, 100-105 Open Access Reliability Analysis and Optimization of the Ship Ballast Water System
CALIBRATION OF THE PLATOON DISPERSION MODEL BY CONSIDERING THE IMPACT OF THE PERCENTAGE OF BUSES AT SIGNALIZED INTERSECTIONS
 CALIBRATION OF THE PLATOON DISPERSION MODEL BY CONSIDERING THE IMPACT OF THE PERCENTAGE OF BUSES AT SIGNALIZED INTERSECTIONS By Youan Wang, Graduate Research Assistant MOE Key Laboratory for Urban Transportation
International regulations and guidelines for maritime spatial planning related to safe distances to multiple offshore structures (e.g.
 International regulations and guidelines for maritime spatial planning related to safe distances to multiple offshore structures (e.g. wind farms) Introduction This is a summary of the most important international
World Shipping Council. Bureau of Ocean Energy Management U.S. Department of the Interior
 Comments of the World Shipping Council Submitted to the Bureau of Ocean Energy Management U.S. Department of the Interior In the matters of Commercial Leasing for Wind Power Development on the Outer Continental
AK-APC-NTV Operating Procedures for Cargo and Passenger Non Tank Vessels Transiting and Operating in Alaska Waters December 26, 2015
 AK-APC-NTV Operating Procedures for Cargo and Passenger Non Tank Vessels Transiting and Operating in Alaska Waters December 26, 2015 The Alternative Planning Criteria (APC) Operating Procedures were developed
Analysis of Signalized Intersection Crashes Nasima Bhuiyan, EmelindaM. Parentela and Venkata S. Inapuri
 Analysis of Signalized Intersection Crashes Nasima Bhuiyan, EmelindaM. arentela and Venkata S. Inapuri Abstract The goals of providing high levels of mobility and intersection efficiency while simultaneously
Analysis of the Red Light Camera Program in Garden Grove, CA By Jay Beeber, Executive Director, Safer Streets L.A., Member ITE
 Analysis of the Red Light Camera Program in Garden Grove, CA By Jay Beeber, Executive Director, Safer Streets L.A., Member ITE The following report is a detailed discussion of the Red Light Camera (RLC)
Site Description: Tower Site
 Wind Resource Summary for Elizabeth Site Final Report Colorado Anemometer Loan Program Monitoring Period: 7/3/6 /15/7 Report Date: December 22, 7 Site Description: The site is.6 miles northeast of the
Traffic safety developments in Poland
 Traffic safety developments in Poland Siem Oppe D-2001-8 Traffic safety developments in Poland A research note D-2001-8 Siem Oppe Leidschendam, 2001 SWOV Institute for Road Safety Research, The Netherlands
95 Express Annual Operations Report: Fiscal Year
 95 Express Annual Operations Report: Fiscal Year 2014-2015 General The 95 Express Program completed its sixth full Fiscal Year of operations in June 2015. For the FDOT, its Fiscal Year (FY) is from July
An investigation of the variability of start-up lost times and departure headways at signalized intersections in urban areas
 Intersections Control and Safety 53 An investigation of the variability of start-up lost times and departure headways at signalized intersections in urban areas E. Matsoukis & St. Efstathiadis Transport
Bird strikes Swedish Airspace
 Bird strikes Swedish Airspace 1998-2005 Nordic Birdstrike Committee Arlanda 2006-09-21 Jörgen Andersson Jörgen Andersson, Swedish CAA 1 Objective Occurrence reports Bird population Birdstrikes between
SCIENTIFIC COMMITTEE SECOND REGULAR SESSION August 2006 Manila, Philippines
 SCIENTIFIC COMMITTEE SECOND REGULAR SESSION 7-18 August 2006 Manila, Philippines MEASUREMENT-POINTS EXAMINATION OF CIRCLE HOOKS FOR PELAGIC LONGLINE FISHERY TO EVALUATE EFFECTS OF HOOK DESIGN WCPFC-SC2-2006/EB
Transportation Planning Division
 Transportation Planning Division Presentation Outline Study Tasks Recap of Previous Meetings Data Collected Focus Areas within Study Limits Design Principles Tool Box Recommended Concepts Schedule Moving
Rules Practice Exam 7
 1 INTERNATIONAL ONLY The light which may be used with a vessel's whistle is to be. A. used when the whistle is broken B. used prior to sounding the whistle C. used only at night D. a white light 2 INTERNATIONAL
Road Data Input System using Digital Map in Roadtraffic
 Data Input System using Digital Map in traffic Simulation Namekawa,M 1., N.Aoyagi 2, Y.Ueda 2 and A.Satoh 2 1 College of Management and Economics, Kaetsu University, Tokyo, JAPAN 2 Faculty of Engineering,
Study Proposal for the Batu Berhenti Light Buoy
 Study Proposal for the Batu Berhenti Light Buoy Malacca Strait Council The 17 th Aids to Navigation Fund Committee meeting 22 23 September 2016, Singapore 1 Contents 1. About Batu Berhanti Light Buoy 2.
WELCOME Mission-Geneva Transportation Study
 WELCOME Mission-Geneva Transportation Study Study Process and Schedule 2005 2006 Oct Nov Dec Jan Feb Mar Apr May Jun Jul Aug Sept Oct Task 2 Develop Outreach Plan Task 3 Document Existing Conditions/ Prioritize
WORK-REST REQUIREMENTS FOR PILOTS
 AN ORDER OF THE BOARD OF PILOT COMMISSIONERS FOR THE PORT OF CORPUS CHRISTI AUTHORITY REGARDING WORK-REST REQUIREMENTS FOR PILOTS AND COMBINED BEAM RESTRICTION Whereas, the current Rules and Regulations
Task 16: Impact on Lummi Cultural Properties
 Gateway Pacific Terminal Vessel Traffic and Risk Assessment Study Task 16: Impact on Lummi Cultural Properties Prepared for Pacific International Terminals, Inc. Prepared by The Glosten Associates, Inc.
ANALYSIS OF SATURATION FLOW RATE FLUCTUATION FOR SHARED LEFT-TURN LANE AT SIGNALIZD INTERSECTIONS *
 ANALYSIS OF SATURATION FLOW RATE FLUCTUATION FOR SHARED LEFT-TURN LANE AT SIGNALIZD INTERSECTIONS * By Peng CHEN**, Hideki NAKAMURA*** and Miho ASANO**** 1. Introduction In urban corridor performance evaluation,
Study of Passing Ship Effects along a Bank by Delft3D-FLOW and XBeach1
 Study of Passing Ship Effects along a Bank by Delft3D-FLOW and XBeach1 Minggui Zhou 1, Dano Roelvink 2,4, Henk Verheij 3,4 and Han Ligteringen 2,3 1 School of Naval Architecture, Ocean and Civil Engineering,
KC Scout Kansas City s Bi-State Transportation Management Center
 KC Scout Kansas City s Bi-State Transportation Management Center Operations Report August- 215 This report contains statistical and operational data of activities at the Scout TMC for the period Saturday,
Designing a Traffic Circle By David Bosworth For MATH 714
 Designing a Traffic Circle By David Bosworth For MATH 714 Abstract We all have had the experience of sitting in a traffic jam, or we ve seen cars bunched up on a road for some no apparent reason. The use
KC Scout Kansas City s Bi-State Transportation Management Center
 KC Scout Kansas City s Bi-State Transportation Management Center Operations Report May 216 This report contains statistical and operational data of activities at the Scout TMC for the period Sunday, May
WIND DATA REPORT. Bourne Water District
 WIND DATA REPORT Bourne Water District July to September 2010 Prepared for Massachusetts Clean Energy Center 55 Summer Street, 9th Floor Boston, MA 02110 by Dylan Chase James F. Manwell Utama Abdulwahid
EFFICIENCY OF TRIPLE LEFT-TURN LANES AT SIGNALIZED INTERSECTIONS
 EFFICIENCY OF TRIPLE LEFT-TURN LANES AT SIGNALIZED INTERSECTIONS Khaled Shaaban, Ph.D., P.E., PTOE (a) (a) Assistant Professor, Department of Civil Engineering, Qatar University (a) kshaaban@qu.edu.qa
Wind Data Verification Report Arriga 50m
 Page 1 of 11 Site Name Site Details 9531 - Arriga 5m Arriga 5m Date/Time of report generation 27/11/212 4:22 PM Site Number 9531 Mast Height 5m Mast Location 32568 E 811256 N Coordinate System UTM 55K
Harrah s Station Square Casino
 Transportation Analysis Harrah s Station Square Casino Pittsburgh, Pennsylvania Submitted To: City of Pittsburgh and Pennsylvania Gaming Control Board Prepared By: DKS Associates GAI Consultants December
Research Article Application of Simulation Methods for Evaluating the Sea Waterways Traffic Organisation
 ISRN Applied Mathematics Volume 213, Article ID 715142, 8 pages http://dx.doi.org/1.1155/213/715142 Research Article Application of Simulation Methods for Evaluating the Sea Waterways Traffic Organisation
LONG TERM SITE WIND DATA ANNUAL REPORT. Mass Turnpike Authority Blandford, MA
 LONG TERM SITE WIND DATA ANNUAL REPORT Mass Turnpike Authority Blandford, MA July 1, 2012 June 30, 2013 Prepared for Massachusetts Clean Energy Center 55 Summer Street, 9th Floor Boston, MA 02110 by Dylan
Marine Accident Inquiry Agency
 Marine Accident Inquiry Agency No.4 January, 2008 Kasumigaseki 2-1-2, Chiyoda-ku, Tokyo, 100-8918 TEL +81-3-5253-8821 FAX +81-3-5253-1680 E-mail maia@mlit.go.jp URL http://www.mlit.go.jp/maia/index.htm
Final Waterborne Commerce Statistics
 Final Waterborne Commerce Statistics For Calendar Year 16 Waterborne Commerce National Totals And Selected Inland Waterways For Multiple Years Institute for Water Resources Navigation and Civil Works Decision
An Investigation of a Safety Level in Terms of. Excessive Acceleration in Rough Seas
 Proceedings of the h International Conference on the Stability of Ships and Ocean Vehicles, 4-9 June 5, Glasgow, UK. An Investigation of a Safety Level in Terms of Excessive Acceleration in Rough Seas
WAK-APC-T Operating Procedures for Oil Tankers Transiting or Operating in Western Alaska Waters
 WAK-APC-T Operating Procedures for Oil Tankers Transiting or Operating in Western Alaska Waters RECORD OF CHANGE WAK-APC-T Operating Procedures for Oil Tankers Transiting or Operating In Western Alaska
GENERAL LIMITATIONS AND RESTRICTIONS. LNGC Temporary Exemption (Effective August 21, 2018)
") RULES AND REGULATIONS GOVERNING PILOTS AND PILOTAGE ON THE CORPUS CHRISTI SHIP CHANNEL EFFECTIVE AUGUST 1, 2013 AMENDED EFFECTIVE MAY 13, 2014 AMENDED EFFECTIVE OCTOBER 1, 2014 AMENDED EFFECTIVE JANUARY
RULES AND REGULATIONS GOVERNING PILOTS AND PILOTAGE ON THE CORPUS CHRISTI SHIP CHANNEL EFFECTIVE AUGUST 1, 2013 AMENDED EFFECTIVE MAY 13, 2014 AMENDED EFFECTIVE OCTOBER 1, 2014 AMENDED EFFECTIVE JANUARY
windnavigator Site Analyst Report
 windnavigator Site Analyst Report for Central NY Created for Stephen Meister April 27, 2010 ID NUMBER: N2-128 AWS Truepower, LLC Albany - Barcelona - Bangalore p: +1.518.21.00 e: info@awstruepower.com
ASSESSMENT OF CORRECTNESS OF INFORMATION OBTAINED FROM AUTOMATIC IDENTIFICATION OF SHIP S SYSTEM (AIS)
") ASSESSMENT OF CORRECTNESS OF INFORMATION OBTAINED FROM AUTOMATIC IDENTIFICATION OF SHIP S SYSTEM (AIS) Henryk Śniegocki Akademia Morska w Gdyni, Katedra Nawigacji Aleja Jana Pawła II 3, 81-345 Gdynia,
ASSESSMENT OF CORRECTNESS OF INFORMATION OBTAINED FROM AUTOMATIC IDENTIFICATION OF SHIP S SYSTEM (AIS) Henryk Śniegocki Akademia Morska w Gdyni, Katedra Nawigacji Aleja Jana Pawła II 3, 81-345 Gdynia,
Relationship of Road Lane Width to Safety for Urban and Suburban Arterials
 Relationship of Road Lane Width to Safety for Urban and Suburban Arterials Phd. Alma AFEZOLLI Polytechnic University of Tirana Construction and Infrastructure Department of Civil Engineering Faculty Tirana,
Crash Patterns in Western Australia. Kidd B., Main Roads Western Australia Willett P., Traffic Research Services
 Crash Patterns in Western Australia Kidd B., Main Roads Western Australia Willett P., Traffic Research Services Abstract Examination of crash patterns is one way of identifying key factors on which focus
Utility Debt Securitization Authority 2013 T/TE Billed Revenues Tracking Report
 Utility Debt Securitization Authority 2013 T/TE Billed Revenues Tracking Report Billing Budgeted Billed Dollar Percent Month Revenues Revenues Variance Variance Jan 2018 11,943,180.68 12,697,662.47 754,481.79
SECTION 2 HYDROLOGY AND FLOW REGIMES
 SECTION 2 HYDROLOGY AND FLOW REGIMES In this section historical streamflow data from permanent USGS gaging stations will be presented and discussed to document long-term flow regime trends within the Cache-Bayou
6 th Meeting of the Scientific Committee Puerto Varas, Chile, 9-14 September 2018
 6 th Meeting of the Scientific Committee Puerto Varas, Chile, 9-14 September 218 SC6-Doc24 China s Annual Report, part II (Jumbo squid) Gang Li, Bilin Liu, Luoliang Xu & Xinjun Chen Annual Report of China
MICROSIMULATION USING FOR CAPACITY ANALYSIS OF ROUNDABOUTS IN REAL CONDITIONS
 Session 5. Transport and Logistics System Modelling Proceedings of the 11 th International Conference Reliability and Statistics in Transportation and Communication (RelStat 11), 19 22 October 2011, Riga,
Legendre et al Appendices and Supplements, p. 1
 Legendre et al. 2010 Appendices and Supplements, p. 1 Appendices and Supplement to: Legendre, P., M. De Cáceres, and D. Borcard. 2010. Community surveys through space and time: testing the space-time interaction
Wisconsin 511 Traveler Information Annual Usage Summary January 3, Wisconsin 511 Phone Usage ( )
") Wisconsin 511 Traveler Information 211 Annual Usage Summary January 3, 212 Overall to-date Summary 36 months of operation 1,16,63 total calls the 1 Million mark was passed on December 3, 212 3,627,527
Wisconsin 511 Traveler Information 211 Annual Usage Summary January 3, 212 Overall to-date Summary 36 months of operation 1,16,63 total calls the 1 Million mark was passed on December 3, 212 3,627,527
MAR DASHBOARD MAR. Compliant % Breakdown Mar % Late % On-time MAR APR MAY JUN JUL AUG SEP OCT NOV DEC
 Positive Response Compliance 215 Compliant 215 Non-Compliant 216 Compliant 216 Non-Compliant 1% 87% 96% 86% 96% 88% 97% 89% 89% 88% 86% 92% 93% 94% 96% 94% 8% 6% 4% 2% 13% JAN 4% 14% FEB 4% 12% 3% 11%
Underwater noise generated by merchants ships in coastal waters of the Gulf of Gdansk
 Underwater noise generated by merchants ships in coastal waters of the Gulf of Gdansk Karol LISTEWNIK 1 1 Polish Naval Academy, Poland ABSTRACT Currently, there has been a growing interest in monitoring
Operational Comparison of Transit Signal Priority Strategies
 Operational Comparison of Transit Signal Priority Strategies Revision Submitted on: November, 0 Author: Adriana Rodriguez, E.I Assistant Engineer Parsons Brinckerhoff 0 South Orange Avenue, Suite 00 Orlando,
GENERAL LIMITATIONS AND RESTRICTIONS. Draft Restrictions
 RULES AND REGULATIONS GOVERNING PILOTS AND PILOTAGE ON THE CORPUS CHRISTI SHIP CHANNEL EFFECTIVE AUGUST 1, 2013 AMENDED EFFECTIVE MAY 13, 2014 AMENDED EFFECTIVE OCTOBER 1, 2014 I GENERAL The Rules and
Application of the probabilistic-fuzzy method of assessing the risk of a ship manoeuvre in a restricted area
 Application of the probabilistic-fuzzy method of assessing the risk of a ship manoeuvre in a restricted area L. ~ucrna', Z. pietrzykowski2 Maritime University of Szczecin ul. Waly Chrobrego 1/2 70-500
Freeway ramp intersection study
 Freeway ramp intersection study Supporting Vision Zero: Zero traffic deaths in San Francisco by 2024 Study Goals: Primary Improve Safety Improve Accessibility Secondary Provide Efficient Circulation Accommodate
CCoWS. Central Coast Watershed Studies. Summary of Precipitation and Streamflow for Potrero and San Clemente Creeks in 2010
 Central Coast Watershed Studies CCoWS Summary of Precipitation and Streamflow for Potrero and San Clemente Creeks in Water-Year 2010 Santa Lucia Preserve Monterey County, California Publication No. WI-2011-01
Modelling of Extreme Waves Related to Stability Research
 Modelling of Extreme Waves Related to Stability Research Janou Hennig 1 and Frans van Walree 1 1. Maritime Research Institute Netherlands,(MARIN), Wageningen, the Netherlands Abstract: The paper deals
Saturation Flow Rate, Start-Up Lost Time, and Capacity for Bicycles at Signalized Intersections
 Transportation Research Record 1852 105 Paper No. 03-4180 Saturation Flow Rate, Start-Up Lost Time, and Capacity for Bicycles at Signalized Intersections Winai Raksuntorn and Sarosh I. Khan A review of
WIND DATA REPORT. Paxton, MA
 WIND DATA REPORT Paxton, MA July 1, 2011 September 30, 2011 Prepared for Massachusetts Clean Energy Center 55 Summer Street, 9th Floor Boston, MA 02110 by Eric Morgan James F. Manwell Anthony F. Ellis
City of Wilsonville 5 th Street to Kinsman Road Extension Project
 City of Wilsonville 5 th Street to Kinsman Road Walking Tour & Neighborhood Workshop Summary Report Public Outreach Overview On July 18 th, 2017, the City of Wilsonville hosted a neighborhood walking tour
Keywords: multiple linear regression; pedestrian crossing delay; right-turn car flow; the number of pedestrians;
 Available online at www.sciencedirect.com ScienceDirect Procedia - Social and Behavioral Scien ce s 96 ( 2013 ) 1997 2003 13th COTA International Conference of Transportation Professionals (CICTP 2013)
Collision Avoidance System using Common Maritime Information Environment.
 TEAM 2015, Oct. 12-15, 2015, Vladivostok, Russia Collision Avoidance System using Common Maritime Information Environment. Petrov Vladimir Alekseevich, the ass.professor, Dr. Tech. e-mail: petrov@msun.ru
Analysis of Factors Affecting Train Derailments at Highway-Rail Grade Crossings
 Chadwick et al TRB 12-4396 1 1 2 3 Analysis of Factors Affecting Train Derailments at Highway-Rail Grade Crossings 4 5 TRB 12-4396 6 7 8 9 Submitted for consideration for presentation and publication at
State of Texas Operations and Maintenance
 State of Texas Operations and Maintenance Barbour Terminal Ship Channel The Barbour Terminal Channel and Turning Basin is a 1.7-mile-long deep draft waterway that extends from the Houston Ship Channel
APC Operating Procedures Oil Tankers
 APC Operating Procedures Oil Tankers August 2013 The APC Operating Procedures were developed to aid the Master and Operator of oil tankers in ensuring all aspects of the APC are complied with when transiting
Redondo Pier Alternate Site Activity
 Name: Section: Redondo Pier Alternate Site Activity (Fisherman s Wharf, Redondo Beach, CA 90277) Lab 14C-1 The purpose of this activity is for you to participate in water sampling. We will examine ocean
A Conceptual Approach for Using the UCF Driving Simulator as a Test Bed for High Risk Locations
 A Conceptual Approach for Using the UCF Driving Simulator as a Test Bed for High Risk Locations S. Chundi, M. Abdel-Aty, E. Radwan, H. Klee and E. Birriel Center for Advanced Transportation Simulation