COLLECTOR WIND FARM SHADOW FLICKER ASSESSMENT
|
|
|
- Alfred Palmer
- 5 years ago
- Views:
Transcription

1 COLLECTOR WIND FARM SHADOW FLICKER ASSESSMENT Prepared by: Terry Johannesen (BEng, RPEQ)
2 1. INTRODUCTION This report discusses the shadow flicker phenomenon and presents an assessment of the associated impacts on nearby residences. The methodology and assumptions included in this assessment are in accordance with the Environment Protection and Heritage Council Draft National Wind Farm Guidelines July What is Shadow Flicker? Wind turbines due to their size cast shadows on their surrounds, when the shadow of a rotating wind turbine falls on a particular location, for example a house, it can cause a fluctuation in light levels. This phenomenon is referred to as shadow flicker. Using simple geometry incorporating the sun s path, topography and wind turbine dimensions it is possible to calculate the annual hours a receptor (residence/house) is subject to shadow flicker. The duration of shadow flicker, its intensity and the locations it affects are most strongly determined by the relative position of the sun, the turbine and the receptor. The relative position of the sun varies with latitude, time of day and time of year. Other influential factors include; The size of the wind turbine rotor and the height of the tower Surface topography Intervening vegetation Direction of the wind (and hence the rotor plane of the wind turbine) Weather (particularly cloud cover) General visibility (including presence of mist, smoke and other particulates) The key risk associated with shadow flicker is annoyance of residents. Shadow flicker can theoretically extend for many kilometres from a wind turbine. However, the intensity of the shadow cast by the wind turbine decreases with increasing distance from it. While acknowledging that different individuals have different levels of sensitivity and may be annoyed by different levels of intensity, this report limits assessment to a moderate level of intensity. 2. SITE DESCRIPTION The proposed Wind Farm is expected to comprise 68 wind turbines each with a nameplate rating of approximately 3MW. The turbines will have a hub height of around 80-95m and blade length of 45-55m. At the time of this report; the most likely configuration of the wind farm is a 68 wind turbine configuration. Two alternative turbines will be investigated in this document; 1. REPower 3xM 104 wind turbines with an overall height of 132m (80m hub and 52m blade). 2. Vestas V112 wind turbines with an overall height of 150m (94m hub height and 56m blade). Page 2 of 14
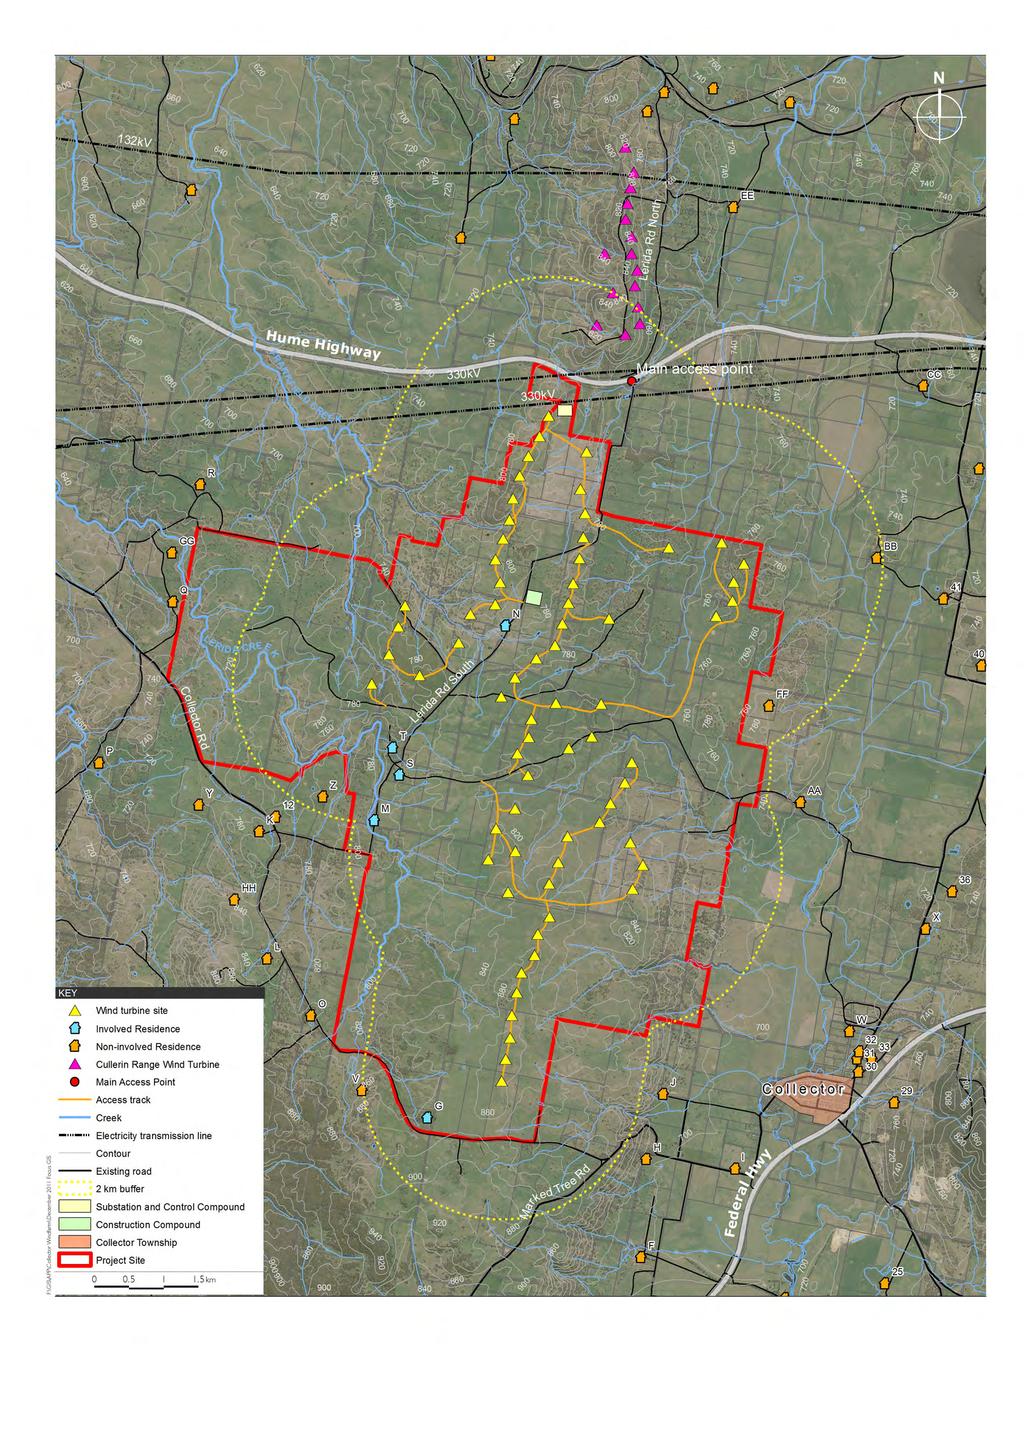
3 The area for the wind farm is located 55km north-east of Canberra and 35km southwest of Goulburn. Situated on the Great Dividing Range, the 3,300ha site is bounded by the Hume highway to the north, Road to the west and south and Creek to the east. The land can be described as undulating cleared grazing land with scattered trees predominantly covered by native pasture grazed by cattle and sheep. Residences (Receptors) A review of the general area has identified 89 residences within the vicinity of the wind farm. This includes the township of, located approximately 4km from the nearest wind turbine, with an approximate number of 60 dwellings. For the purposes of the evaluation the Town is represented by two receptors located in closest proximity to the proposed wind turbines, approximately 3.5km and 3.6km from a turbine. The relative proximity of these residences and the minimum separation to the wind turbines is included in Appendix B. A summary of the number of residences in proximity to the wind farm is shown in the table below. Distance from WTG (m) No. of Residences LIMITS, ASSUMPTIONS AND INPUTS In the simplest of cases (worst case) the turbine is assumed to be operating all the time, is perpendicular to the receptor at all times, with the sun shining at all times of the day. This case will provide the upper bound or maximum to the number of shadow hours expected each year. A more realistic account of the shadow hours (expected case) can be provided by taking into account the operation of the wind turbines (facing direction, rotational speed and operational status) and the weather conditions experienced (cloud cover) at the site. This case is still considered to be conservative as it does not take into account any screening (vegetation or structure) between the shadow source and the receptor and still considers the window or the receptor to always be perpendicular to the shadow source SHADOW DISTANCE The intensity of the shadow associated with shadow flicker is directly related to the amount of sunlight blocked by the blade. When the receptor is close to the turbine, 100% of the sunlight is blocked as the blade passes in front of the sun and the receptor experiences alternate full sunlight and full shade. As the receptor moves further away from the turbine, the apparent size of the sun remains effectively constant but the apparent size of the blade decreases. At some point the blade will Page 3 of 14
4 no longer fully cover the sun as it passes in front of it and the receptor will alternate full sunlight and partial shade. Thus, as the distance between the shadow source and the receptor grows so the shadow intensity diminishes. In South Australia, the government (Planning SA, Planning Bulletin Wind Farms, Draft for Consultation, South Australian Government, 2002) has recommended that outside a distance of 500m the intensity of shadow is sufficiently diminished so as not to have an impact. The Draft National Wind Farm Development Guidelines July 2010 recommend an assessment distance of 265 x the maximum blade chord. For the wind turbines under assessment this equates to a distance of approximately 1100m. (max. blade chord of 4.0m) For the purposes of an initial investigation a maximum length of the shadow cast from the turbine of 2000m has been used SHADOW HOURS LIMIT The shadow flicker experienced at any residence in the surrounding area must not exceed 30 hours per year as a result of the operation of the wind energy facility. ( Policy and planning guidelines for development of wind energy facilities in Victoria, Sustainable Energy Authority Victoria, 2003) Common practice for wind farm developments within Australia has seen the limit of 30 hours/year imposed, and as such this methodology has been adopted for this assessment RECEPTOR At each residence it is assumed there is a window 1m x 1m in area located 2m above ground facing perpendicular to each WTG comprising the wind farm. In this way any shadow cast from a turbine is assumed to reach a window of the receptor. This is referred to as the Greenhouse Effect. In reality the receptor window would be located on the wall of a house and would have a fixed orientation. Under the Greenhouse Effect the receptor window and the wall of the house is assumed to be able to move to allow it to always be perpendicular to the turbine under calculation. This is considered to be a conservative approach and provides an upper bound of the shadow impact hours likely. If a particular residence is found to be experiencing an impact in excess of the recommended limit then a detailed assessment of the residence should be undertaken to provide the exact size and orientation of all the windows to allow the impact to be accurately assessed WIND TURBINE In a worst case assumption the rotor of the wind turbine is considered to be orientated always perpendicular to the sun and the receptor, and is considered as a solid disc. A more realistic approach is considered where the operational hours of the turbine and hence the direction it faces is taken into account. OPERATIONAL HOURS - DIRECTION Wind turbines are controlled such that during operation they are able to rotate to be always facing into the oncoming wind. As the direction the turbine faces changes so Page 4 of 14
5 to does the relative geometry of the turbine in respect to the residence/receptor and as such the shadow it would cast. Thus the direction of operation should be included in the shadow impact calculation. The wind direction is obtained from wind records collected from monitoring on site. For the site the annual hours in each direction are provided below using the data collected from monitoring tower 4770 (717010E N Z55 MGA94) which has been operating since April Percentage Data Annual Operating Hours Wind Direction Statistics Monitoring Tower 4770 N NNE ENE E ESE SSE S SSW WSW W WNW NNW SUNSHINE PROBABILITY - CLOUD COVER The effect of the local weather conditions should also be taken into account when assessing the shadow impact. Obviously a shadow cast will have its greatest intensity on a clear cloudless day with high sunshine. As the amount of cloud cover increases the shadow intensity will decrease to the point where the shadow is negligible on a completely cloudy day. The calculation of the amount of sunshine for the wind farm site is based on data from the Bureau of Meteorology station at Goulburn located approximately 33km to the northeast of the site and collected since 1971 to current day. A second BoM site at Canberra (49km away) was also investigated with data similar for both sites, but the Goulburn site was preferred due to its closer proximity. A probability factor is applied for the amount of light experienced for clear days, cloudy days and those in between. Clear Days 1.0 Cloudy Days 0.0 Other Days 0.5 A definition of what constitutes a Clear Day and a Cloudy Day is provided in the Definitions part of this report and is sourced from the Bureau of Meteorology. Using these factors we are able to calculate the Sunshine Probability an indication of the amount of time between sun rise and sun set with sunshine. A summary of the data records obtained and the calculated Sunshine Probability is shown in the table below. Statistical data for Bureau of Meteorology Station - GOULBURN Jan Feb Mar Apr May Jun Jul Aug Sep Oct Nov Dec Clear Days Cloudy Days Other Days Sunshine Probability Page 5 of 14
6 3.6. OBSTACLES In a worst case evaluation no account is made for the protection that vegetation, surrounding buildings or other obstacles would provide between the shadow source and the receptor. In a real situation the presence of trees, shrubs and adjacent buildings would provide a barrier between the shadow source and the receptor and thus reduce the shadow impact on the receptor. 4. RESULTS The program WindPRO v2.5 was used to perform the calculations for shadow flicker impact. Detailed contour information for the site is used by WindPRO to produce an accurate model of the topography of the area. Global positioning is used to define the location of each of the dwellings within this model. The position of the turbines and their dimensions along with the assumptions outlined in the previous section are also included as inputs to the calculation INITIAL INVESTIGATION (Worst Case) Assumptions Shadow distance 2000m Receptor Greenhouse Effect Direction turbine rotor plane is always perpendicular to the line from the WTG and the sun Sunshine sun is shining all day from sunrise to sunset Obstacle no obstacles Given the shadow distance assumption made in Section 3.1 only the results for the houses generally within 2000m of a wind turbine are shown. Dwelling Estimated hours - Worst Case REPower 3xM wind turbines WORST CASE - Shadow hours / year Allowable Estimated hours - Worst Case Vestas V112 wind turbines Allowable G* 10:50 30:00 13:33 30:00 M* 7:17 30:00 9:01 30:00 N* 159:50 30:00 189:46 30:00 S* 8:58 30:00 12:18 30:00 T* 15:57 30:00 21:18 30:00 V 0:00 30:00 0:00 30:00 Z 0:00 30:00 0:00 30:00 BB 1:48 30:00 2:32 30:00 FF 0:00 30:00 0:00 30:00 * - indicates a dwelling belonging to a landholder participating in the project Page 6 of 14
7 The detailed results of the flicker analysis are included as Appendix A. As can be seen from these results there is one residence (N) which it is predicted will experience more shadow flicker than the recommended limit under the worst case scenario. This residence is owned by a participant landholder in the project and is currently being considered to be used as an office for construction and operation of the wind farm and as such the impact on it is not considered applicable. If required vegetation screening could be planted to shield any receptor windows from the shadows cast from the turbines. The windows facing to the east and west of residence would be screened in this way is desired FURTHER INVESTIGATION (Expected Case) In accordance with the methodology outlined in the Environment Protection and Heritage Council Draft National Wind Farm Guidelines July 2010, if the modelling of the shadow flicker hours estimated at the receptors is below the specified limit (30 hours/year) under the worst case scenario then there is no further analysis required. For a more realistic estimate or expected case of the actual hours of shadow impact likely to be experienced a further range of assumptions is used. Assumptions Shadow distance 265 times the maximum blade chord = 1,100m (max blade chord for V m, 3xM 3.8m; allow blade chord of 4m) Receptor Greenhouse Effect Direction from wind data records collected on-site since 2003 Sunshine from Bureau of Meteorology records for Goulburn Obstacle no obstacles included The results of the modelling with these changes in the assumptions are shown below. It should also be noted there are further changes to assumptions can be included to move closer to the actual situation, such as exact locations and dimensions of windows rather than greenhouse and the inclusion of vegetation and obstacles. Page 7 of 14
8 Dwelling Estimated hours - Worst Case REPower 3xM wind turbines EXPECTED CASE - Shadow hours / year Allowable Estimated hours - Worst Case Vestas V112 wind turbines Allowable G* 0:00 30:00 0:00 30:00 M* 0:00 30:00 0:00 30:00 N* 51:38 30:00 59:30 30:00 S* 0:00 30:00 0:00 30:00 T* 0:00 30:00 0:00 30:00 V 0:00 30:00 0:00 30:00 Z 0:00 30:00 0:00 30:00 BB 0:00 30:00 0:00 30:00 FF 0:00 30:00 0:00 30:00 * - indicates a dwelling belonging to a landholder participating in the project 5. SENSITIVITY Shadow flicker duration can be very sensitive to location, varying by up to 0.8 hours/m of horizontal displacement. Thus in an extreme case, one end of a house may experience no flicker while the other end may exceed prescribed limits. For this reason it is prudent to assess the variance within 50m from the centre of a dwelling. This assessment also allows for variations in; the offset between tower and the rotor of the wind turbine minor inaccuracies in the modelling annual variation in weather conditions topographical variations This assessment will also provide for an assessment of the potential for impact for residents using the exterior or yard of a property and the shadow impact the may be subjected to. A shadow flicker map can be produced to show the variation in flicker in the area of the wind farm. A shadow flicker map for the Vestas V112 option for the worst case in the area of the wind farm is shown below, with a resolution of 25m (25m x 25m grid size). As can be seen from this map the variance in shadow hours in the vicinity of the receptors do not show a marked degree of variation and as such the calculated hours can be considered to occur within +/- 50m of the receptor. Page 8 of 14

 Page 9")
9 Shadow Flicker Map Northern Area (Vestas V112 worst case option) Page 9 of 14

 Page")
10 Shadow Flicker Map Southern Area (Vestas V112 worst case option) Page 10 of 14
11 6. DISCUSSION AND CONCLUSION The results show that even under the worst case conditions, no neighbouring residences would experience an impact greater than the prescribed limit. Even when considering the participating landholder residences, at only one location is the number of hours experienced greater than the limits. This location is under consideration to become part of the operational facility of the wind farm and as such is not considered relevant. By incorporating suitable vegetation screening to the east and west of this location the impact of shadow flicker on it will be negated. Thus, it is stated that the impact of Shadow Flicker on residences around the wind farm is within permissible limits. Should the actual operation of the wind farm produce an amount of shadow flicker impact above that modelled in this assessment then potential mitigation measures should be investigated. Potential mitigation measures such as; vegetation screening or window shades or potential operational changes to identified turbines, such as removing them from operation during specific shadow impact periods. Page 11 of 14
12 DEFINITIONS The following definitions have been sourced from the Bureau of Meteorology Climate Data Online. Mean number of clear days Average number of clear days in a calendar month or year, calculated over the period of record. This statistic is derived from cloud cover observations, which are measured in oktas (eighths). The sky is visually inspected to produce an estimate of the number of eighths of the dome of the sky covered by cloud. A completely clear sky is recorded as zero okta, while a totally overcast sky is 8 oktas. The presence of any trace of cloud in an otherwise blue sky is recorded as 1 okta, and similarly any trace of blue on an otherwise cloudy sky is recorded as 7 oktas. A clear day is recorded when the mean of the 9 am and 3 pm cloud observations is less than or equal to 2 oktas. This definition has changed slightly over time. Prior to this, a clear day was defined as having less than or equal to 2.5 oktas averaged over the 9 am and 3 pm observations. Mean number of cloudy days Average number of cloudy days in a calendar month or year, calculated over the period of record. This statistic is derived from cloud cover observations, which are measured in oktas (eighths). The sky is visually inspected to produce an estimate of the number of eighths of the dome of the sky covered by cloud. A completely clear sky is recorded as zero okta, while a totally overcast sky is 8 oktas. The presence of any trace of cloud in an otherwise blue sky is recorded as 1 okta, and similarly any trace of blue on an otherwise cloudy sky is recorded as 7 oktas. A cloudy day is recorded when the mean of the 9 am and 3 pm cloud observations is greater than or equal to 6 oktas. This definition has changed slightly over time. Prior to this, a cloudy day was defined as having greater than or equal to 5.5 oktas averaged over the 9 am and 3 pm observations. Page 12 of 14
13 APPENDIX A DETAILED SHADOW FLICKER RESULTS Page 13 of 14
14 7/02/ :54 AM / 1 7/02/2012 9:12 AM/ Assumptions for shadow calculations Maximum distance for influence 1,100 m Minimum sun height over horizon for influence 3 Day step for calculation 1 days Time step for calculation 1 minutes Sun shine probabilities (part of time from sun rise to sun set with sun shine) Jan Feb Mar Apr May Jun Jul Aug Sep Oct Nov Dec Operational time N NNE ENE E ESE SSE S SSW WSW W WNW NNW Sum , ,786 1, ,760 To avoid flicker from WTGs not visible a ZVI calculation is performed before the flicker calculation. The ZVI calculation is based on the following assumptions Height contours used: Height Contours: Coll 10m contours.map (1) Obstacles used in calculation Eye height: 1.5 m Grid resolution: 100 m Scale 1:400,000 New WTG Shadow receptor WTGs UTM WGS84 S Zone: 55 WTG type East North Z Row data/description Valid Manufact. Type Power Diam. Height RPM [m] [kw] [m] [m] [RPM] 1 718,433 6,143, Yes VESTAS V112 3, ,303 6,143, Yes VESTAS V112 3, ,143 6,142, Yes VESTAS V112 3, ,016 6,142, Yes VESTAS V112 3, ,920 6,142, Yes VESTAS V112 3, ,869 6,142, Yes VESTAS V112 3, ,778 6,141, Yes VESTAS V112 3, ,667 6,141, Yes VESTAS V112 3, ,737 6,141, Yes VESTAS V112 3, ,665 6,140, Yes VESTAS V112 3, ,307 6,140, Yes VESTAS V112 3, ,140 6,140, Yes VESTAS V112 3, ,368 6,140, Yes VESTAS V112 3, ,269 6,140, Yes VESTAS V112 3, ,134 6,140, Yes VESTAS V112 3, ,885 6,139, Yes VESTAS V112 3, ,574 6,139, Yes VESTAS V112 3, ,978 6,143, Yes VESTAS V112 3, ,891 6,142, Yes VESTAS V112 3, ,960 6,142, Yes VESTAS V112 3, ,935 6,141, Yes VESTAS V112 3, ,164 6,141, Yes VESTAS V112 3, ,878 6,141, Yes VESTAS V112 3, ,785 6,141, Yes VESTAS V112 3, ,721 6,140, Yes VESTAS V112 3, ,303 6,140, Yes VESTAS V112 3, ,632 6,140, Yes VESTAS V112 3, ,527 6,140, Yes VESTAS V112 3, ,256 6,140, Yes VESTAS V112 3, ,952 6,139, Yes VESTAS V112 3, ,751 6,139, Yes VESTAS V112 3, ,184 6,139, Yes VESTAS V112 3, ,539 6,139, Yes VESTAS V112 3, ,192 6,139, Yes VESTAS V112 3, ,149 6,138, Yes VESTAS V112 3, ,986 6,138, Yes VESTAS V112 3, ,135 6,138, Yes VESTAS V112 3, ,725 6,138, Yes VESTAS V112 3, Continued on next page...
15 7/02/ :54 AM / 2 7/02/2012 9:12 AM/ continued from previous page UTM WGS84 S Zone: 55 WTG type East North Z Row data/description Valid Manufact. Type Power Diam. Height RPM [m] [kw] [m] [m] [RPM] ,054 6,138, Yes VESTAS V112 3, ,678 6,137, Yes VESTAS V112 3, ,952 6,137, Yes VESTAS V112 3, ,564 6,137, Yes VESTAS V112 3, ,954 6,137, Yes VESTAS V112 3, ,848 6,136, Yes VESTAS V112 3, ,633 6,138, Yes VESTAS V112 3, ,531 6,138, Yes VESTAS V112 3, ,325 6,137, Yes VESTAS V112 3, ,170 6,137, Yes VESTAS V112 3, ,708 6,137, Yes VESTAS V112 3, ,574 6,137, Yes VESTAS V112 3, ,443 6,136, Yes VESTAS V112 3, ,448 6,136, Yes VESTAS V112 3, ,277 6,136, Yes VESTAS V112 3, ,233 6,135, Yes VESTAS V112 3, ,042 6,135, Yes VESTAS V112 3, ,976 6,135, Yes VESTAS V112 3, ,905 6,134, Yes VESTAS V112 3, ,877 6,134, Yes VESTAS V112 3, ,815 6,134, Yes VESTAS V112 3, ,758 6,133, Yes VESTAS V112 3, ,646 6,136, Yes VESTAS V112 3, ,793 6,137, Yes VESTAS V112 3, ,612 6,137, Yes VESTAS V112 3, ,847 6,140, Yes VESTAS V112 3, ,081 6,140, Yes VESTAS V112 3, ,100 6,141, Yes VESTAS V112 3, ,245 6,141, Yes VESTAS V112 3, ,925 6,141, Yes VESTAS V112 3, Shadow receptor-input UTM WGS84 S Zone: 55 No. Name East North Z Width Height Height Degrees from Slope of Direction mode a.g.l. south cw window [m] [m] [m] [m] [ ] [ ] A A 716,166 6,126, "Green house mode" B B 716,366 6,126, "Green house mode" C C 717,211 6,128, "Green house mode" D D 716,571 6,129, "Green house mode" E E 716,897 6,129, "Green house mode" F F 719,761 6,131, "Green house mode" G G 716,686 6,133, "Green house mode" H H 719,839 6,132, "Green house mode" I I 721,120 6,132, "Green house mode" J J 720,081 6,133, "Green house mode" K L 714,476 6,135, "Green house mode" L K 714,263 6,137, "Green house mode" M M 715,919 6,137, "Green house mode" N N 717,810 6,140, "Green house mode" O O 715,025 6,134, "Green house mode" P P 711,956 6,138, "Green house mode" Q Q 713,019 6,140, "Green house mode" R R 713,357 6,142, "Green house mode" S S 716,282 6,138, "Green house mode" T T 716,186 6,138, "Green house mode" U U 719,285 6,130, "Green house mode" V V 715,744 6,133, "Green house mode" W W 722,766 6,134, "Green house mode" Continued on next page...
16 7/02/ :54 AM / 3 7/02/2012 9:12 AM/ continued from previous page UTM WGS84 S Zone: 55 No. Name East North Z Width Height Height Degrees from Slope of Direction mode a.g.l. south cw window [m] [m] [m] [m] [ ] [ ] X X 723,865 6,136, "Green house mode" Y Y 713,396 6,137, "Green house mode" Z Z 715,180 6,138, "Green house mode" AA AA 722,062 6,137, "Green house mode" AB BB 723,156 6,141, "Green house mode" AC CC 723,831 6,143, "Green house mode" AD DD 717,150 6,146, "Green house mode" AE EE 721,052 6,146, "Green house mode" AF FF 721,605 6,139, "Green house mode" AG Town 1 721,613 6,133, "Green house mode" AH Town 2 721,868 6,133, "Green house mode" AI GG 713,009 6,141, "Green house mode" Calculation Results Shadow receptor Shadow, worst case Shadow, expected values No. Name Shadow hours Shadow days Max shadow Shadow hours per year per year hours per day per year [h/year] [days/year] [h/day] [h/year] A A 0:00 0 0:00 0:00 B B 0:00 0 0:00 0:00 C C 0:00 0 0:00 0:00 D D 0:00 0 0:00 0:00 E E 0:00 0 0:00 0:00 F F 0:00 0 0:00 0:00 G G 0:00 0 0:00 0:00 H H 0:00 0 0:00 0:00 I I 0:00 0 0:00 0:00 J J 0:00 0 0:00 0:00 K L 0:00 0 0:00 0:00 L K 0:00 0 0:00 0:00 M M 0:00 0 0:00 0:00 N N 162: :14 59:30 O O 0:00 0 0:00 0:00 P P 0:00 0 0:00 0:00 Q Q 0:00 0 0:00 0:00 R R 0:00 0 0:00 0:00 S S 0:00 0 0:00 0:00 T T 0:00 0 0:00 0:00 U U 0:00 0 0:00 0:00 V V 0:00 0 0:00 0:00 W W 0:00 0 0:00 0:00 X X 0:00 0 0:00 0:00 Y Y 0:00 0 0:00 0:00 Z Z 0:00 0 0:00 0:00 AA AA 0:00 0 0:00 0:00 AB BB 0:00 0 0:00 0:00 AC CC 0:00 0 0:00 0:00 AD DD 0:00 0 0:00 0:00 AE EE 0:00 0 0:00 0:00 AF FF 0:00 0 0:00 0:00 AG Town 1 0:00 0 0:00 0:00 AH Town 2 0:00 0 0:00 0:00 AI GG 0:00 0 0:00 0:00
17 7/02/ :54 AM / 4 7/02/2012 9:12 AM/ Total amount of flickering on the shadow receptors caused by each WTG No. Name Worst case [h/year] 1 1 0: : : : : : : : : : : : : : : : : : : : : : : : : : : : : : : : : : : : : : : : : : : : : : : : : : : : : : : : : : : : :00 Continued on next page...
18 7/02/ :54 AM / 5 7/02/2012 9:12 AM/ continued from previous page No. Name Worst case [h/year] : : : : : : :00
19 6/02/2012 3:34 PM / 1 6/02/2012 3:33 PM/ Assumptions for shadow calculations Maximum distance for influence 2,000 m Minimum sun height over horizon for influence 3 Day step for calculation 1 days Time step for calculation 1 minutes The calculated times are "worst case" given by the following assumptions: The sun is shining all the day, from sunrise to sunset The rotor plane is always perpendicular to the line from the WTG to the sun The WTG is always operating To avoid flicker from WTGs not visible a ZVI calculation is performed before the flicker calculation. The ZVI calculation is based on the following assumptions Height contours used: Height Contours: Coll 10m contours.map (1) Obstacles used in calculation Eye height: 1.5 m Grid resolution: 100 m Scale 1:400,000 New WTG Shadow receptor WTGs UTM WGS84 S Zone: 55 WTG type East North Z Row data/description Valid Manufact. Type Power Diam. Height RPM [m] [kw] [m] [m] [RPM] 1 718,433 6,143, Yes REpower 3.XM104 3, ,303 6,143, Yes REpower 3.XM104 3, ,143 6,142, Yes REpower 3.XM104 3, ,016 6,142, Yes REpower 3.XM104 3, ,920 6,142, Yes REpower 3.XM104 3, ,869 6,142, Yes REpower 3.XM104 3, ,778 6,141, Yes REpower 3.XM104 3, ,667 6,141, Yes REpower 3.XM104 3, ,737 6,141, Yes REpower 3.XM104 3, ,665 6,140, Yes REpower 3.XM104 3, ,307 6,140, Yes REpower 3.XM104 3, ,140 6,140, Yes REpower 3.XM104 3, ,368 6,140, Yes REpower 3.XM104 3, ,269 6,140, Yes REpower 3.XM104 3, ,134 6,140, Yes REpower 3.XM104 3, ,885 6,139, Yes REpower 3.XM104 3, ,574 6,139, Yes REpower 3.XM104 3, ,978 6,143, Yes REpower 3.XM104 3, ,891 6,142, Yes REpower 3.XM104 3, ,960 6,142, Yes REpower 3.XM104 3, ,935 6,141, Yes REpower 3.XM104 3, ,164 6,141, Yes REpower 3.XM104 3, ,878 6,141, Yes REpower 3.XM104 3, ,785 6,141, Yes REpower 3.XM104 3, ,721 6,140, Yes REpower 3.XM104 3, ,303 6,140, Yes REpower 3.XM104 3, ,632 6,140, Yes REpower 3.XM104 3, ,527 6,140, Yes REpower 3.XM104 3, ,256 6,140, Yes REpower 3.XM104 3, ,952 6,139, Yes REpower 3.XM104 3, ,751 6,139, Yes REpower 3.XM104 3, ,184 6,139, Yes REpower 3.XM104 3, ,539 6,139, Yes REpower 3.XM104 3, ,192 6,139, Yes REpower 3.XM104 3, ,149 6,138, Yes REpower 3.XM104 3, ,986 6,138, Yes REpower 3.XM104 3, ,135 6,138, Yes REpower 3.XM104 3, ,725 6,138, Yes REpower 3.XM104 3, Continued on next page...
20 6/02/2012 3:34 PM / 2 6/02/2012 3:33 PM/ continued from previous page UTM WGS84 S Zone: 55 WTG type East North Z Row data/description Valid Manufact. Type Power Diam. Height RPM [m] [kw] [m] [m] [RPM] ,054 6,138, Yes REpower 3.XM104 3, ,678 6,137, Yes REpower 3.XM104 3, ,952 6,137, Yes REpower 3.XM104 3, ,564 6,137, Yes REpower 3.XM104 3, ,954 6,137, Yes REpower 3.XM104 3, ,848 6,136, Yes REpower 3.XM104 3, ,633 6,138, Yes REpower 3.XM104 3, ,531 6,138, Yes REpower 3.XM104 3, ,325 6,137, Yes REpower 3.XM104 3, ,170 6,137, Yes REpower 3.XM104 3, ,708 6,137, Yes REpower 3.XM104 3, ,574 6,137, Yes REpower 3.XM104 3, ,443 6,136, Yes REpower 3.XM104 3, ,448 6,136, Yes REpower 3.XM104 3, ,277 6,136, Yes REpower 3.XM104 3, ,233 6,135, Yes REpower 3.XM104 3, ,042 6,135, Yes REpower 3.XM104 3, ,976 6,135, Yes REpower 3.XM104 3, ,905 6,134, Yes REpower 3.XM104 3, ,877 6,134, Yes REpower 3.XM104 3, ,815 6,134, Yes REpower 3.XM104 3, ,758 6,133, Yes REpower 3.XM104 3, ,646 6,136, Yes REpower 3.XM104 3, ,793 6,137, Yes REpower 3.XM104 3, ,612 6,137, Yes REpower 3.XM104 3, ,847 6,140, Yes REpower 3.XM104 3, ,081 6,140, Yes REpower 3.XM104 3, ,100 6,141, Yes REpower 3.XM104 3, ,245 6,141, Yes REpower 3.XM104 3, ,925 6,141, Yes REpower 3.XM104 3, Shadow receptor-input UTM WGS84 S Zone: 55 No. Name East North Z Width Height Height Degrees from Slope of Direction mode a.g.l. south cw window [m] [m] [m] [m] [ ] [ ] A A 716,166 6,126, "Green house mode" B B 716,366 6,126, "Green house mode" C C 717,211 6,128, "Green house mode" D D 716,571 6,129, "Green house mode" E E 716,897 6,129, "Green house mode" F F 719,761 6,131, "Green house mode" G G 716,686 6,133, "Green house mode" H H 719,839 6,132, "Green house mode" I I 721,120 6,132, "Green house mode" J J 720,081 6,133, "Green house mode" K L 714,476 6,135, "Green house mode" L K 714,263 6,137, "Green house mode" M M 715,919 6,137, "Green house mode" N N 717,810 6,140, "Green house mode" O O 715,025 6,134, "Green house mode" P P 711,956 6,138, "Green house mode" Q Q 713,019 6,140, "Green house mode" R R 713,357 6,142, "Green house mode" S S 716,282 6,138, "Green house mode" T T 716,186 6,138, "Green house mode" U U 719,285 6,130, "Green house mode" V V 715,744 6,133, "Green house mode" W W 722,766 6,134, "Green house mode" Continued on next page...
21 6/02/2012 3:34 PM / 3 6/02/2012 3:33 PM/ continued from previous page UTM WGS84 S Zone: 55 No. Name East North Z Width Height Height Degrees from Slope of Direction mode a.g.l. south cw window [m] [m] [m] [m] [ ] [ ] X X 723,865 6,136, "Green house mode" Y Y 713,396 6,137, "Green house mode" Z Z 715,180 6,138, "Green house mode" AA AA 722,062 6,137, "Green house mode" AB BB 723,156 6,141, "Green house mode" AC CC 723,831 6,143, "Green house mode" AD DD 717,150 6,146, "Green house mode" AE EE 721,052 6,146, "Green house mode" AF FF 721,605 6,139, "Green house mode" AG Town 1 721,613 6,133, "Green house mode" AH Town 2 721,868 6,133, "Green house mode" AI GG 713,009 6,141, "Green house mode" Calculation Results Shadow receptor Shadow, worst case No. Name Shadow hours Shadow days Max shadow per year per year hours per day [h/year] [days/year] [h/day] A A 0:00 0 0:00 B B 0:00 0 0:00 C C 0:00 0 0:00 D D 0:00 0 0:00 E E 0:00 0 0:00 F F 0:00 0 0:00 G G 10: :20 H H 0:00 0 0:00 I I 0:00 0 0:00 J J 0:00 0 0:00 K L 0:00 0 0:00 L K 0:00 0 0:00 M M 7: :14 N N 159: :08 O O 0:00 0 0:00 P P 0:00 0 0:00 Q Q 0:00 0 0:00 R R 0:00 0 0:00 S S 8: :10 T T 15: :12 U U 0:00 0 0:00 V V 0:00 0 0:00 W W 0:00 0 0:00 X X 0:00 0 0:00 Y Y 0:00 0 0:00 Z Z 0:00 0 0:00 AA AA 0:00 0 0:00 AB BB 1: :10 AC CC 0:00 0 0:00 AD DD 0:00 0 0:00 AE EE 0:00 0 0:00 AF FF 0:00 0 0:00 AG Town 1 0:00 0 0:00 AH Town 2 0:00 0 0:00 AI GG 0:00 0 0:00
22 6/02/2012 3:34 PM / 4 6/02/2012 3:33 PM/ Total amount of flickering on the shadow receptors caused by each WTG No. Name Worst case [h/year] 1 1 0: : : : : : : : : : : : : : : : : : : : : : : : : : : : : : : : : : : : : : : : : : : : : : : : : : : : : : : : : : : : :00 Continued on next page...
23 6/02/2012 3:34 PM / 5 6/02/2012 3:33 PM/ continued from previous page No. Name Worst case [h/year] : : : : : : :00
24 7/02/ :22 PM / 1 7/02/ :58 AM/ Assumptions for shadow calculations Maximum distance for influence 1,100 m Minimum sun height over horizon for influence 3 Day step for calculation 1 days Time step for calculation 1 minutes Sun shine probabilities (part of time from sun rise to sun set with sun shine) Jan Feb Mar Apr May Jun Jul Aug Sep Oct Nov Dec Operational time N NNE ENE E ESE SSE S SSW WSW W WNW NNW Sum , ,786 1, ,760 To avoid flicker from WTGs not visible a ZVI calculation is performed before the flicker calculation. The ZVI calculation is based on the following assumptions Height contours used: Height Contours: Coll 10m contours.map (1) Obstacles used in calculation Eye height: 1.5 m Grid resolution: 100 m Scale 1:400,000 New WTG Shadow receptor WTGs UTM WGS84 S Zone: 55 WTG type East North Z Row data/description Valid Manufact. Type Power Diam. Height RPM [m] [kw] [m] [m] [RPM] 1 718,433 6,143, Yes REpower 3.XM104 3, ,303 6,143, Yes REpower 3.XM104 3, ,143 6,142, Yes REpower 3.XM104 3, ,016 6,142, Yes REpower 3.XM104 3, ,920 6,142, Yes REpower 3.XM104 3, ,869 6,142, Yes REpower 3.XM104 3, ,778 6,141, Yes REpower 3.XM104 3, ,667 6,141, Yes REpower 3.XM104 3, ,737 6,141, Yes REpower 3.XM104 3, ,665 6,140, Yes REpower 3.XM104 3, ,307 6,140, Yes REpower 3.XM104 3, ,140 6,140, Yes REpower 3.XM104 3, ,368 6,140, Yes REpower 3.XM104 3, ,269 6,140, Yes REpower 3.XM104 3, ,134 6,140, Yes REpower 3.XM104 3, ,885 6,139, Yes REpower 3.XM104 3, ,574 6,139, Yes REpower 3.XM104 3, ,978 6,143, Yes REpower 3.XM104 3, ,891 6,142, Yes REpower 3.XM104 3, ,960 6,142, Yes REpower 3.XM104 3, ,935 6,141, Yes REpower 3.XM104 3, ,164 6,141, Yes REpower 3.XM104 3, ,878 6,141, Yes REpower 3.XM104 3, ,785 6,141, Yes REpower 3.XM104 3, ,721 6,140, Yes REpower 3.XM104 3, ,303 6,140, Yes REpower 3.XM104 3, ,632 6,140, Yes REpower 3.XM104 3, ,527 6,140, Yes REpower 3.XM104 3, ,256 6,140, Yes REpower 3.XM104 3, ,952 6,139, Yes REpower 3.XM104 3, ,751 6,139, Yes REpower 3.XM104 3, ,184 6,139, Yes REpower 3.XM104 3, ,539 6,139, Yes REpower 3.XM104 3, ,192 6,139, Yes REpower 3.XM104 3, ,149 6,138, Yes REpower 3.XM104 3, ,986 6,138, Yes REpower 3.XM104 3, ,135 6,138, Yes REpower 3.XM104 3, ,725 6,138, Yes REpower 3.XM104 3, Continued on next page...
25 7/02/ :22 PM / 2 7/02/ :58 AM/ continued from previous page UTM WGS84 S Zone: 55 WTG type East North Z Row data/description Valid Manufact. Type Power Diam. Height RPM [m] [kw] [m] [m] [RPM] ,054 6,138, Yes REpower 3.XM104 3, ,678 6,137, Yes REpower 3.XM104 3, ,952 6,137, Yes REpower 3.XM104 3, ,564 6,137, Yes REpower 3.XM104 3, ,954 6,137, Yes REpower 3.XM104 3, ,848 6,136, Yes REpower 3.XM104 3, ,633 6,138, Yes REpower 3.XM104 3, ,531 6,138, Yes REpower 3.XM104 3, ,325 6,137, Yes REpower 3.XM104 3, ,170 6,137, Yes REpower 3.XM104 3, ,708 6,137, Yes REpower 3.XM104 3, ,574 6,137, Yes REpower 3.XM104 3, ,443 6,136, Yes REpower 3.XM104 3, ,448 6,136, Yes REpower 3.XM104 3, ,277 6,136, Yes REpower 3.XM104 3, ,233 6,135, Yes REpower 3.XM104 3, ,042 6,135, Yes REpower 3.XM104 3, ,976 6,135, Yes REpower 3.XM104 3, ,905 6,134, Yes REpower 3.XM104 3, ,877 6,134, Yes REpower 3.XM104 3, ,815 6,134, Yes REpower 3.XM104 3, ,758 6,133, Yes REpower 3.XM104 3, ,646 6,136, Yes REpower 3.XM104 3, ,793 6,137, Yes REpower 3.XM104 3, ,612 6,137, Yes REpower 3.XM104 3, ,847 6,140, Yes REpower 3.XM104 3, ,081 6,140, Yes REpower 3.XM104 3, ,100 6,141, Yes REpower 3.XM104 3, ,245 6,141, Yes REpower 3.XM104 3, ,925 6,141, Yes REpower 3.XM104 3, Shadow receptor-input UTM WGS84 S Zone: 55 No. Name East North Z Width Height Height Degrees from Slope of Direction mode a.g.l. south cw window [m] [m] [m] [m] [ ] [ ] A A 716,166 6,126, "Green house mode" B B 716,366 6,126, "Green house mode" C C 717,211 6,128, "Green house mode" D D 716,571 6,129, "Green house mode" E E 716,897 6,129, "Green house mode" F F 719,761 6,131, "Green house mode" G G 716,686 6,133, "Green house mode" H H 719,839 6,132, "Green house mode" I I 721,120 6,132, "Green house mode" J J 720,081 6,133, "Green house mode" K L 714,476 6,135, "Green house mode" L K 714,263 6,137, "Green house mode" M M 715,919 6,137, "Green house mode" N N 717,810 6,140, "Green house mode" O O 715,025 6,134, "Green house mode" P P 711,956 6,138, "Green house mode" Q Q 713,019 6,140, "Green house mode" R R 713,357 6,142, "Green house mode" S S 716,282 6,138, "Green house mode" T T 716,186 6,138, "Green house mode" U U 719,285 6,130, "Green house mode" V V 715,744 6,133, "Green house mode" W W 722,766 6,134, "Green house mode" Continued on next page...
26 7/02/ :22 PM / 3 7/02/ :58 AM/ continued from previous page UTM WGS84 S Zone: 55 No. Name East North Z Width Height Height Degrees from Slope of Direction mode a.g.l. south cw window [m] [m] [m] [m] [ ] [ ] X X 723,865 6,136, "Green house mode" Y Y 713,396 6,137, "Green house mode" Z Z 715,180 6,138, "Green house mode" AA AA 722,062 6,137, "Green house mode" AB BB 723,156 6,141, "Green house mode" AC CC 723,831 6,143, "Green house mode" AD DD 717,150 6,146, "Green house mode" AE EE 721,052 6,146, "Green house mode" AF FF 721,605 6,139, "Green house mode" AG Town 1 721,613 6,133, "Green house mode" AH Town 2 721,868 6,133, "Green house mode" AI GG 713,009 6,141, "Green house mode" Calculation Results Shadow receptor Shadow, worst case Shadow, expected values No. Name Shadow hours Shadow days Max shadow Shadow hours per year per year hours per day per year [h/year] [days/year] [h/day] [h/year] A A 0:00 0 0:00 0:00 B B 0:00 0 0:00 0:00 C C 0:00 0 0:00 0:00 D D 0:00 0 0:00 0:00 E E 0:00 0 0:00 0:00 F F 0:00 0 0:00 0:00 G G 0:00 0 0:00 0:00 H H 0:00 0 0:00 0:00 I I 0:00 0 0:00 0:00 J J 0:00 0 0:00 0:00 K L 0:00 0 0:00 0:00 L K 0:00 0 0:00 0:00 M M 0:00 0 0:00 0:00 N N 141: :08 51:38 O O 0:00 0 0:00 0:00 P P 0:00 0 0:00 0:00 Q Q 0:00 0 0:00 0:00 R R 0:00 0 0:00 0:00 S S 0:00 0 0:00 0:00 T T 0:00 0 0:00 0:00 U U 0:00 0 0:00 0:00 V V 0:00 0 0:00 0:00 W W 0:00 0 0:00 0:00 X X 0:00 0 0:00 0:00 Y Y 0:00 0 0:00 0:00 Z Z 0:00 0 0:00 0:00 AA AA 0:00 0 0:00 0:00 AB BB 0:00 0 0:00 0:00 AC CC 0:00 0 0:00 0:00 AD DD 0:00 0 0:00 0:00 AE EE 0:00 0 0:00 0:00 AF FF 0:00 0 0:00 0:00 AG Town 1 0:00 0 0:00 0:00 AH Town 2 0:00 0 0:00 0:00 AI GG 0:00 0 0:00 0:00
27 7/02/ :22 PM / 4 7/02/ :58 AM/ Total amount of flickering on the shadow receptors caused by each WTG No. Name Worst case [h/year] 1 1 0: : : : : : : : : : : : : : : : : : : : : : : : : : : : : : : : : : : : : : : : : : : : : : : : : : : : : : : : : : : : :00 Continued on next page...
28 7/02/ :22 PM / 5 7/02/ :58 AM/ continued from previous page No. Name Worst case [h/year] : : : : : : :00
29 6/02/2012 3:15 PM / 1 6/02/2012 3:12 PM/ Assumptions for shadow calculations Maximum distance for influence 2,000 m Minimum sun height over horizon for influence 3 Day step for calculation 1 days Time step for calculation 1 minutes The calculated times are "worst case" given by the following assumptions: The sun is shining all the day, from sunrise to sunset The rotor plane is always perpendicular to the line from the WTG to the sun The WTG is always operating To avoid flicker from WTGs not visible a ZVI calculation is performed before the flicker calculation. The ZVI calculation is based on the following assumptions Height contours used: Height Contours: Coll 10m contours.map (1) Obstacles used in calculation Eye height: 1.5 m Grid resolution: 100 m Scale 1:400,000 New WTG Shadow receptor WTGs UTM WGS84 S Zone: 55 WTG type East North Z Row data/description Valid Manufact. Type Power Diam. Height RPM [m] [kw] [m] [m] [RPM] 1 718,433 6,143, Yes VESTAS V112 3, ,303 6,143, Yes VESTAS V112 3, ,143 6,142, Yes VESTAS V112 3, ,016 6,142, Yes VESTAS V112 3, ,920 6,142, Yes VESTAS V112 3, ,869 6,142, Yes VESTAS V112 3, ,778 6,141, Yes VESTAS V112 3, ,667 6,141, Yes VESTAS V112 3, ,737 6,141, Yes VESTAS V112 3, ,665 6,140, Yes VESTAS V112 3, ,307 6,140, Yes VESTAS V112 3, ,140 6,140, Yes VESTAS V112 3, ,368 6,140, Yes VESTAS V112 3, ,269 6,140, Yes VESTAS V112 3, ,134 6,140, Yes VESTAS V112 3, ,885 6,139, Yes VESTAS V112 3, ,574 6,139, Yes VESTAS V112 3, ,978 6,143, Yes VESTAS V112 3, ,891 6,142, Yes VESTAS V112 3, ,960 6,142, Yes VESTAS V112 3, ,935 6,141, Yes VESTAS V112 3, ,164 6,141, Yes VESTAS V112 3, ,878 6,141, Yes VESTAS V112 3, ,785 6,141, Yes VESTAS V112 3, ,721 6,140, Yes VESTAS V112 3, ,303 6,140, Yes VESTAS V112 3, ,632 6,140, Yes VESTAS V112 3, ,527 6,140, Yes VESTAS V112 3, ,256 6,140, Yes VESTAS V112 3, ,952 6,139, Yes VESTAS V112 3, ,751 6,139, Yes VESTAS V112 3, ,184 6,139, Yes VESTAS V112 3, ,539 6,139, Yes VESTAS V112 3, ,192 6,139, Yes VESTAS V112 3, ,149 6,138, Yes VESTAS V112 3, ,986 6,138, Yes VESTAS V112 3, ,135 6,138, Yes VESTAS V112 3, ,725 6,138, Yes VESTAS V112 3, Continued on next page...
30 6/02/2012 3:15 PM / 2 6/02/2012 3:12 PM/ continued from previous page UTM WGS84 S Zone: 55 WTG type East North Z Row data/description Valid Manufact. Type Power Diam. Height RPM [m] [kw] [m] [m] [RPM] ,054 6,138, Yes VESTAS V112 3, ,678 6,137, Yes VESTAS V112 3, ,952 6,137, Yes VESTAS V112 3, ,564 6,137, Yes VESTAS V112 3, ,954 6,137, Yes VESTAS V112 3, ,848 6,136, Yes VESTAS V112 3, ,633 6,138, Yes VESTAS V112 3, ,531 6,138, Yes VESTAS V112 3, ,325 6,137, Yes VESTAS V112 3, ,170 6,137, Yes VESTAS V112 3, ,708 6,137, Yes VESTAS V112 3, ,574 6,137, Yes VESTAS V112 3, ,443 6,136, Yes VESTAS V112 3, ,448 6,136, Yes VESTAS V112 3, ,277 6,136, Yes VESTAS V112 3, ,233 6,135, Yes VESTAS V112 3, ,042 6,135, Yes VESTAS V112 3, ,976 6,135, Yes VESTAS V112 3, ,905 6,134, Yes VESTAS V112 3, ,877 6,134, Yes VESTAS V112 3, ,815 6,134, Yes VESTAS V112 3, ,758 6,133, Yes VESTAS V112 3, ,646 6,136, Yes VESTAS V112 3, ,793 6,137, Yes VESTAS V112 3, ,612 6,137, Yes VESTAS V112 3, ,847 6,140, Yes VESTAS V112 3, ,081 6,140, Yes VESTAS V112 3, ,100 6,141, Yes VESTAS V112 3, ,245 6,141, Yes VESTAS V112 3, ,925 6,141, Yes VESTAS V112 3, Shadow receptor-input UTM WGS84 S Zone: 55 No. Name East North Z Width Height Height Degrees from Slope of Direction mode a.g.l. south cw window [m] [m] [m] [m] [ ] [ ] A A 716,166 6,126, "Green house mode" B B 716,366 6,126, "Green house mode" C C 717,211 6,128, "Green house mode" D D 716,571 6,129, "Green house mode" E E 716,897 6,129, "Green house mode" F F 719,761 6,131, "Green house mode" G G 716,686 6,133, "Green house mode" H H 719,839 6,132, "Green house mode" I I 721,120 6,132, "Green house mode" J J 720,081 6,133, "Green house mode" K L 714,476 6,135, "Green house mode" L K 714,263 6,137, "Green house mode" M M 715,919 6,137, "Green house mode" N N 717,810 6,140, "Green house mode" O O 715,025 6,134, "Green house mode" P P 711,956 6,138, "Green house mode" Q Q 713,019 6,140, "Green house mode" R R 713,357 6,142, "Green house mode" S S 716,282 6,138, "Green house mode" T T 716,186 6,138, "Green house mode" U U 719,285 6,130, "Green house mode" V V 715,744 6,133, "Green house mode" W W 722,766 6,134, "Green house mode" Continued on next page...
31 6/02/2012 3:15 PM / 3 6/02/2012 3:12 PM/ continued from previous page UTM WGS84 S Zone: 55 No. Name East North Z Width Height Height Degrees from Slope of Direction mode a.g.l. south cw window [m] [m] [m] [m] [ ] [ ] X X 723,865 6,136, "Green house mode" Y Y 713,396 6,137, "Green house mode" Z Z 715,180 6,138, "Green house mode" AA AA 722,062 6,137, "Green house mode" AB BB 723,156 6,141, "Green house mode" AC CC 723,831 6,143, "Green house mode" AD DD 717,150 6,146, "Green house mode" AE EE 721,052 6,146, "Green house mode" AF FF 721,605 6,139, "Green house mode" AG Town 1 721,613 6,133, "Green house mode" AH Town 2 721,868 6,133, "Green house mode" AI GG 713,009 6,141, "Green house mode" Calculation Results Shadow receptor Shadow, worst case No. Name Shadow hours Shadow days Max shadow per year per year hours per day [h/year] [days/year] [h/day] A A 0:00 0 0:00 B B 0:00 0 0:00 C C 0:00 0 0:00 D D 0:00 0 0:00 E E 0:00 0 0:00 F F 0:00 0 0:00 G G 13: :23 H H 0:00 0 0:00 I I 0:00 0 0:00 J J 0:00 0 0:00 K L 0:00 0 0:00 L K 0:00 0 0:00 M M 9: :16 N N 189: :14 O O 0:00 0 0:00 P P 0:00 0 0:00 Q Q 0:00 0 0:00 R R 0:00 0 0:00 S S 12: :13 T T 21: :14 U U 0:00 0 0:00 V V 0:00 0 0:00 W W 0:00 0 0:00 X X 0:00 0 0:00 Y Y 0:00 0 0:00 Z Z 0:00 0 0:00 AA AA 0:00 0 0:00 AB BB 2: :12 AC CC 0:00 0 0:00 AD DD 0:00 0 0:00 AE EE 0:00 0 0:00 AF FF 0:00 0 0:00 AG Town 1 0:00 0 0:00 AH Town 2 0:00 0 0:00 AI GG 0:00 0 0:00
32 6/02/2012 3:15 PM / 4 6/02/2012 3:12 PM/ Total amount of flickering on the shadow receptors caused by each WTG No. Name Worst case [h/year] 1 1 0: : : : : : : : : : : : : : : : : : : : : : : : : : : : : : : : : : : : : : : : : : : : : : : : : : : : : : : : : : : : :00 Continued on next page...
33 6/02/2012 3:15 PM / 5 6/02/2012 3:12 PM/ continued from previous page No. Name Worst case [h/year] : : : : : : :00
34 APPENDIX B RESIDENCE LOCATIONS AND DISTANCES Dwelling Label Minimum distance to WTG (m) Nearest WTG Dwelling Label Minimum distance to WTG (m) Nearest WTG A 7, Q 3, B 7, R 3, C 5, S 1, D 4, T E 4, U 3, F 3, V 2, G 1, W 3, H 2, X 4, I 3, Y 3, J 2, Z 1, K 2, AA 2, L 3, BB 1, M 1, CC 3, N DD 2,807 1 O 2, EE 3,967 1 P 4, FF 1, Page 14 of 14
35
WindPRO version Jan 2011 Printed/Page :55 / 1. SHADOW - Main Result
 SHADOW - Main Result Assumptions for shadow calculations Maximum distance for influence Calculate only when more than 20 % of sun is covered by the blade Please look in WTG table 27.7.2011 17:55 / 1 Minimum
WindPRO version Jan 2011 Printed/Page :09 / 1. SHADOW - Main Result
 SHADOW - Main Result Assumptions for shadow calculations Maximum distance for influence Calculate only when more than 20 % of sun is covered by the blade Please look in WTG table 28.7.2011 13:09 / 1 Minimum
8 SHADOW FLICKER 8.1 INTRODUCTION 8.2 RECEIVING ENVIRONMENT
 QS-000169-02-R460-003 Assessment Report of Phase 1 and Phase 2 8 SHADOW FLICKER 8.1 INTRODUCTION A shadow flicker assessment has been undertaken for the Phase 1 and Phase 2 only part of the development
windpro WP A15-Lingewaard WTGs Shadow receptor-input
 SHADOW - Main Result Calculation: SHADOW calculation (5 x V150 @ 166m, +LT CORR, NO MITIGATION) Maximum distance for influence Calculate only when more than 20 % of sun is covered by the blade Please look
Torrild - WindSIM Case study
 Torrild - WindSIM Case study Note: This study differs from the other case studies in format, while here another model; WindSIM is tested as alternative to the WAsP model. Therefore this case should be
windnavigator Site Analyst Report
 windnavigator Site Analyst Report for Central NY Created for Stephen Meister April 27, 2010 ID NUMBER: N2-128 AWS Truepower, LLC Albany - Barcelona - Bangalore p: +1.518.21.00 e: info@awstruepower.com
HOUTEN WIND FARM WIND RESOURCE ASSESSMENT
 CIRCE CIRCE Building Campus Río Ebro University de Zaragoza Mariano Esquillor Gómez, 15 50018 Zaragoza Tel.: 976 761 863 Fax: 976 732 078 www.fcirce.es HOUTEN WIND FARM WIND RESOURCE ASSESSMENT CIRCE AIRE
Site Assessment Report. Wind farm: Ascog Farm (GB)
") Site Assessment Report Energy Yield Estimation Wind farm: (GB) 3 x E- kw with 5m hh Imprint Publisher Copyright notice ENERCON GmbH 5 Aurich Germany Phone: +9 91 97- Fax: +9 91 97-19 E-mail: info@enercon.de
Site Assessment Report Energy Yield Estimation Wind farm: (GB) 3 x E- kw with 5m hh Imprint Publisher Copyright notice ENERCON GmbH 5 Aurich Germany Phone: +9 91 97- Fax: +9 91 97-19 E-mail: info@enercon.de
WindPRO version Nov 2012 Project:
 23/11/2012 15:21 / 1 WAsP interface - Main Result Calculation: WAsP Interface example Name for WAsP Site coordinates UTM NAD27 Zone: 14 East: 451,101 North: 5,110,347 Air density calculation mode Result
Wind Data Verification Report Arriga 50m
 Page 1 of 11 Site Name Site Details 9531 - Arriga 5m Arriga 5m Date/Time of report generation 27/11/212 4:22 PM Site Number 9531 Mast Height 5m Mast Location 32568 E 811256 N Coordinate System UTM 55K
PARK - Main Result Calculation: PARK calculation (5 x 166m, + LT CORR + MITIGATION) N.O. Jensen (RISØ/EMD)
 N.O. Jensen (RISØ/EMD)") PRK - Main Result Calculation: PRK calculation (5 x V15 @ 166m, + LT CORR + MITIGTION) Wake Model N.O. Jensen (RISØ/EMD) Calculation Settings ir density calculation mode Result for WTG at hub altitude
PRK - Main Result Calculation: PRK calculation (5 x V15 @ 166m, + LT CORR + MITIGTION) Wake Model N.O. Jensen (RISØ/EMD) Calculation Settings ir density calculation mode Result for WTG at hub altitude
MICROPHONE WIND SPEED LIMITS DURING WIND FARM NOISE MEASUREMENTS
 MICROPHONE WIND SPEED LIMITS DURING WIND FARM NOISE MEASUREMENTS Abstract Jon Cooper 1 and Tom Evans 2 1 Resonate Acoustics, Level 1/23 Peel St, Adelaide SA 5000, Australia Email: jon.cooper@resonateacoustics.com
NordFoU: External Influences on Spray Patterns (EPAS) Report 16: Wind exposure on the test road at Bygholm
 Report 16: Wind exposure on the test road at Bygholm") NordFoU: External Influences on Spray Patterns (EPAS) Report 16: Wind exposure on the test road at Bygholm Jan S. Strøm, Aarhus University, Dept. of Engineering, Engineering Center Bygholm, Horsens Torben
NordFoU: External Influences on Spray Patterns (EPAS) Report 16: Wind exposure on the test road at Bygholm Jan S. Strøm, Aarhus University, Dept. of Engineering, Engineering Center Bygholm, Horsens Torben
Site Description: Tower Site
 Wind Resource Summary for Elizabeth Site Final Report Colorado Anemometer Loan Program Monitoring Period: 7/3/6 /15/7 Report Date: December 22, 7 Site Description: The site is.6 miles northeast of the
Influence of wind direction on noise emission and propagation from wind turbines
 Influence of wind direction on noise emission and propagation from wind turbines Tom Evans and Jonathan Cooper Resonate Acoustics, 97 Carrington Street, Adelaide, South Australia 5000 ABSTRACT Noise predictions
Site Description: LOCATION DETAILS Report Prepared By: Tower Site Report Date
 Wind Resource Summary for Holyoke Site Final Report Colorado Anemometer Loan Program Monitoring Period:: 6/21/26 /6/27 Report Date: December 2, 27 Site Description: The site is 17.4 miles south of the
Kodiak, Alaska Site 1 Wind Resource Report
 Kodiak, Alaska Site 1 Wind Resource Report Report written by: Douglas Vaught, P.E., V3 Energy LLC, Eagle River, AK Date of report: March 16, 2007 Photo by Doug Vaught, V3 Energy LLC Summary Information
Kodiak, Alaska Site 1 Wind Resource Report for Kodiak Electric Association
 Kodiak, Alaska Site 1 Wind Resource Report for Kodiak Electric Association Report written by: Douglas Vaught, V3 Energy LLC, Eagle River, AK Date of report: August 23, 2006 Photo Doug Vaught General Site
National Renewable Energy Laboratory. Wind Resource Data Summary Guam Naval Ordnance Annex Data Summary and Retrieval for November 2009
 National Renewable Energy Laboratory Wind Resource Data Summary Guam Naval Ordnance Annex Data Summary and Retrieval for November 2009 Prepared for: National Renewable Energy Laboratory 1617 Cole Boulevard
Urban Environmental Climate Maps for Urban Planning Considering Urban Heat Island Mitigation in Hiroshima
 Academic Article Journal of Heat Island Institute International Vol. 9-2 (2014) Urban Environmental Climate Maps for Urban Planning Considering Urban Heat Island Mitigation in Hiroshima Kaoru Matsuo* 1
Background Preliminary Review... 3
 January 23, 2012 Evaluation of Prop osed NRWC Wind Farm on Lo cal Micro climate: Preliminary Review & Work Plan For: Debbie Zimmerman Chief Executive Officer Grap e Growers of Ontario P.O. Box 100 Vineland
Wind Resource Assessment for NOME (ANVIL MOUNTAIN), ALASKA Date last modified: 5/22/06 Compiled by: Cliff Dolchok
, ALASKA Date last modified: 5/22/06 Compiled by: Cliff Dolchok") 813 W. Northern Lights Blvd. Anchorage, AK 99503 Phone: 907-269-3000 Fax: 907-269-3044 www.akenergyauthority.org SITE SUMMARY Wind Resource Assessment for NOME (ANVIL MOUNTAIN), ALASKA Date last modified:
813 W. Northern Lights Blvd. Anchorage, AK 99503 Phone: 907-269-3000 Fax: 907-269-3044 www.akenergyauthority.org SITE SUMMARY Wind Resource Assessment for NOME (ANVIL MOUNTAIN), ALASKA Date last modified:
WIND DATA REPORT. Mt. Tom
 WIND DATA REPORT Mt. Tom September 1, 2003 November 31, 2003 Prepared for Massachusetts Technology Collaborative 7 North Drive Westborough, MA 0181 by James F. Manwell Anthony F. Ellis Taylor Geer January
WIND DATA REPORT. Paxton, MA
 WIND DATA REPORT Paxton, MA July 1, 2011 September 30, 2011 Prepared for Massachusetts Clean Energy Center 55 Summer Street, 9th Floor Boston, MA 02110 by Eric Morgan James F. Manwell Anthony F. Ellis
Measured wake losses By Per Nielsen
 Measured wake losses By Per Nielsen Wake losses Cannot be measured directly, but by setting up a calculation model and comparing to measurements, with proper data filtering, the wake losses can be identified
COMPARISON OF FIXED & VARIABLE RATES (25 YEARS) CHARTERED BANK ADMINISTERED INTEREST RATES - PRIME BUSINESS*
 CHARTERED BANK ADMINISTERED INTEREST RATES - PRIME BUSINESS*") COMPARISON OF FIXED & VARIABLE RATES (25 YEARS) Fixed Rates Variable Rates FIXED RATES OF THE PAST 25 YEARS AVERAGE RESIDENTIAL MORTGAGE LENDING RATE - 5 YEAR* (Per cent) Year Jan Feb Mar Apr May Jun Jul
COMPARISON OF FIXED & VARIABLE RATES (25 YEARS) Fixed Rates Variable Rates FIXED RATES OF THE PAST 25 YEARS AVERAGE RESIDENTIAL MORTGAGE LENDING RATE - 5 YEAR* (Per cent) Year Jan Feb Mar Apr May Jun Jul
Saint Mary s, Alaska Wind Resource Report (for Pitka s Point and Saint Mary s met towers)
") Saint Mary s, Alaska Wind Resource Report (for Pitka s Point and Saint Mary s met towers) Report written by: Douglas Vaught, P.E., V3 Energy, LLC Date of Report: February 9, 2009 Doug Vaught photo Summary
Saint Mary s, Alaska Wind Resource Report (for Pitka s Point and Saint Mary s met towers) Report written by: Douglas Vaught, P.E., V3 Energy, LLC Date of Report: February 9, 2009 Doug Vaught photo Summary
APPENDIX 11 WIND EFFECTS ASSESSMENT
 APPENDIX 11 WIND EFFECTS ASSESSMENT Summerset Villages (Lower Hutt) Ltd District Plan Change Request Prepared by Urban Perspectives Ltd 17 September 2014 341 49 342 Opus Research Report 14-529D84.00 Wind
Wind Resource Assessment for FALSE PASS, ALASKA Site # 2399 Date last modified: 7/20/2005 Prepared by: Mia Devine
 813 W. Northern Lights Blvd. Anchorage, AK 99503 Phone: 907-269-3000 Fax: 907-269-3044 www.aidea.org/wind.htm Wind Resource Assessment for FALSE PASS, ALASKA Site # 2399 Date last modified: 7/20/2005 Prepared
Chapter 2 Wind: Origin and Local Effects
 Chapter 2 Wind: Origin and Local Effects All renewable energy (except tidal and geothermal power), and even the energy in fossil fuels, ultimately comes from the sun. About 1 2 % of the energy coming from
Outline. Wind Turbine Siting. Roughness. Wind Farm Design 4/7/2015
 Wind Turbine Siting Andrew Kusiak 2139 Seamans Center Iowa City, Iowa 52242-1527 andrew-kusiak@uiowa.edu Tel: 319-335-5934 Fax: 319-335-5669 http://www.icaen.uiowa.edu/~ankusiak Terrain roughness Escarpments
Wind Regimes 1. 1 Wind Regimes
 Wind Regimes 1 1 Wind Regimes The proper design of a wind turbine for a site requires an accurate characterization of the wind at the site where it will operate. This requires an understanding of the sources
Design Criteria Data
 FRESNO CA Latitude = 36.77 N WMO No. 72389 Longitude =119.7 W Elevation = 328 feet Period of Record = 1972 to 1996 Average Pressure = 29.62 inches Hg Design Criteria Data Mean Coincident (Average) Values
Design Criteria Data
 MEMPHIS TN Latitude = 35.35 N WMO No. 723345 Longitude = 89.87 W Elevation = 322 feet Period of Record = 1973 to 1996 Average Pressure = 29.68 inches Hg Design Criteria Data Mean Coincident (Average) Values
Status: Rev: Comments Date: Author: Reviewer:
 MT EMERALD WIND FARM REVISED A-WEIGHTED NOISE ASSESSMENT Rp 002 R01 2015545ML 30 January 2017 6 Gipps Street Collingwood VIC 3066 Australia T: +613 9416 1855 ABN: 53 470 077 191 www.marshallday.com Project:
WIND DATA REPORT. Mt. Lincoln Pelham, MA
 WIND DATA REPORT Mt. Lincoln Pelham, MA May 2009 to April 2010 Prepared for Massachusetts Department of Energy Resources 100 Cambridge Street, Suite 1020 Boston, MA 02114 by Jonathan D. Black James F.
Design Criteria Data
 TUCUMCARI NM Latitude = 35.18 N WMO No. 723676 Longitude =13.6 W Elevation = 465 feet Period of Record = 1973 to 1996 Average Pressure = 25.86 inches Hg Design Criteria Data Mean Coincident (Average) Values
WIND DATA REPORT. Paxton, MA
 WIND DATA REPORT Paxton, MA September 1 2003 November 30 2003 by James F. Manwell Anthony F. Ellis Kai Wu April 15, 2004 Renewable Energy Research Laboratory 160 Governors Drive, www.ceere.org/rerl (413)
Global Flow Solutions Mark Zagar, Cheng Hu-Hu, Yavor Hristov, Søren Holm Mogensen, Line Gulstad Vestas Wind & Site Competence Centre, Technology R&D
 Global Flow Solutions Mark Zagar, Cheng Hu-Hu, Yavor Hristov, Søren Holm Mogensen, Line Gulstad Vestas Wind & Site Competence Centre, Technology R&D vestas.com Outline The atmospheric modeling capabilities
Effects of directionality on wind load and response predictions
 Effects of directionality on wind load and response predictions Seifu A. Bekele 1), John D. Holmes 2) 1) Global Wind Technology Services, 205B, 434 St Kilda Road, Melbourne, Victoria 3004, Australia, seifu@gwts.com.au
Wind Resource Assessment for CHEFORNAK, ALASKA
 813 W. Northern Lights Blvd. Anchorage, AK 99503 Phone: 907-269-3000 Fax: 907-269-3044 www.akenergyauthority.org Wind Resource Assessment for CHEFORNAK, ALASKA Date last modified: 3/15/2006 Compiled by:
At each type of conflict location, the risk is affected by certain parameters:
 TN001 April 2016 The separated cycleway options tool (SCOT) was developed to partially address some of the gaps identified in Stage 1 of the Cycling Network Guidance project relating to separated cycleways.
Dick Bowdler Acoustic Consultant
 Dick Bowdler Acoustic Consultant 01383 882 644 077 8535 2534 dick@dickbowdler.co.uk WIND SHEAR AND ITS EFFECT ON NOISE ASSESSMENT OF WIND TURBINES June 2009 The Haven, Low Causeway, Culross, Fife. KY12
FINAL WIND DATA REPORT. Mattapoisett Mattapoisett, Massachusetts
 FINAL WIND DATA REPORT Mattapoisett Mattapoisett, Massachusetts January 19, 2006 June 29, 2007 Prepared for Massachusetts Technology Collaborative 75 North Drive Westborough, MA 01581 by William L. W.
Melancthon Pits Extension Noise Study Part of West Half of Lots 12 and 14, Concession 3 O.S. Township of Melancthon, County of Dufferin
 NOISE IMPACT STUDY - Project: 16099 Melancthon Pits Extension Noise Study Part of West Half of Lots 12 and 14, Concession 3 O.S. Township of Melancthon, County of Dufferin Prepared for: MHBC Planning c/o
VISUAL AIDS FOR DENOTING OBSTACLES
 CHAPTER 6. VISUAL AIDS FOR DENOTING OBSTACLES 6.1 Objects to be marked and/or lighted Note. The marking and/or lighting of obstacles is intended to reduce hazards to aircraft by indicating the presence
Figure 1 Example feature overview.
 1. Introduction This case focuses on the northeastern region of Onslow Bay, NC, and includes an initial shoreline, regional contour, wave gauges, inlets, dredging, and beach fills. Most of the features
A pheasant researcher notebook:
 A pheasant researcher notebook: what we are learning about pheasants and pheasant hunters in Nebraska TJ Fontaine Nebraska Cooperative Fish and Wildlife Research Unit Managing pheasants is challenging
Chart Discussion: Fri-17-Aug-2018 (Harvey Stern) Combining Forecasts (Apr 13th to Aug 15th)
 Combining Forecasts (Apr 13th to Aug 15th)") Combining Forecasts (Apr 13th to Aug 15th) 1 Last Week s Rainfall 1 Chart Discussion: Fri-17Aug-2018 (Harvey Stern) Last Week s Surface Charts 3 Chart Discussion: Fri-17Aug-2018 (Harvey Stern) This Month
Combining Forecasts (Apr 13th to Aug 15th) 1 Last Week s Rainfall 1 Chart Discussion: Fri-17Aug-2018 (Harvey Stern) Last Week s Surface Charts 3 Chart Discussion: Fri-17Aug-2018 (Harvey Stern) This Month
USING A COLLISION RISK MODEL TO ASSESS BIRD COLLISION RISKS FOR OFFSHORE WINDFARMS WITH EXTENDED METHOD
 USING A COLLISION RISK MODEL TO ASSESS BIRD COLLISION RISKS FOR OFFSHORE WINDFARMS WITH EXTENDED METHOD WORKED EXAMPLE March 2012 INTRODUCTION 1. The Strategic Ornithological Support Services group (SOSS)
WIND DATA REPORT. Bishop and Clerks
 WIND DATA REPORT Bishop and Clerks March 1, 2004 May 31, 2004 Prepared for Massachusetts Technology Collaborative 75 North Drive Westborough, MA 01581 by James F. Manwell Anthony L. Rogers Anthony F. Ellis
3. EXCEL FORMULAS & TABLES
 Fall 2017 CS130 - Excel Formulas & Tables 1 3. EXCEL FORMULAS & TABLES Fall 2017 Fall 2017 CS130 - Excel Formulas & Tables 2 Cell References Absolute reference - refer to cells by their fixed position.
Inuvik Wind Monitoring Update 2016
 Inuvik Wind Monitoring Update 2016 Source: MACA Prepared for By Jean Paul Pinard, P. Eng., PhD. 703 Wheeler St., Whitehorse, Yukon Y1A 2P6 Tel. (867) 336 2977; Email jpp@northwestel.net March 31, 2016
Poland is one of the new countries, which seems to have the potential of being a large market for wind energy projects in the near future.
 Wind atlas for Midnorth POLAND. EMD/Per Nielsen 2001-10-31 Poland is one of the new countries, which seems to have the potential of being a large market for wind energy projects in the near future. EMD
CHAPTER 10 TOTAL RECREATIONAL FISHING DAMAGES AND CONCLUSIONS
 CHAPTER 10 TOTAL RECREATIONAL FISHING DAMAGES AND CONCLUSIONS 10.1 INTRODUCTION This chapter provides the computation of the total value of recreational fishing service flow losses (damages) through time
New Zealand Fisheries Assessment Research Document 98/21. Not to be cited without permission of the authork) Malcolm Clark
 Malcolm Clark") Not to be cited without permission of the authork) New Zealand Fisheries Assessment Research Document 98/21 A summary of commercial catch and effort information for orange roughy (Hoplostethus atlanticus)
Not to be cited without permission of the authork) New Zealand Fisheries Assessment Research Document 98/21 A summary of commercial catch and effort information for orange roughy (Hoplostethus atlanticus)
Wind Resource Assessment for DEADHORSE, ALASKA
 813 W. Northern Lights Blvd. Anchorage, AK 99503 Phone: 907-269-3000 Fax: 907-269-3044 www.akenergyauthority.org Wind Resource Assessment for DEADHORSE, ALASKA Date last modified: 4/18/2006 Compiled by:
LONG TERM SITE WIND DATA ANNUAL REPORT. Paxton, MA
 LONG TERM SITE WIND DATA ANNUAL REPORT Paxton, MA July 1, 2012 June 30, 2013 Prepared for Massachusetts Clean Energy Center Summer Street, 9th Floor Boston, MA 021 by Dylan D. Chase James F. Manwell Anthony
Wake effects at Horns Rev and their influence on energy production. Kraftværksvej 53 Frederiksborgvej 399. Ph.: Ph.
 Wake effects at Horns Rev and their influence on energy production Martin Méchali (1)(*), Rebecca Barthelmie (2), Sten Frandsen (2), Leo Jensen (1), Pierre-Elouan Réthoré (2) (1) Elsam Engineering (EE)
VISUAL AIDS FOR DENOTING OBSTACLES
 CHAPTER 6. VISUAL AIDS FOR DENOTING OBSTACLES 6.1 Objects to be marked and/or lighted Note.C The marking and/or lighting of obstacles is intended to reduce hazards to aircraft by indicating the presence
I certify that the information contained in the following pages is correct to the best of my knowledge.
 CERTIFICATION Specific dates of summary: July 1, 2017 June 30, 2018 I certify that the information contained in the following pages is correct to the best of my knowledge. PREPARED BY: DATE: August 15,
LONG TERM SITE WIND DATA ANNUAL REPORT. Mass Turnpike Authority Blandford, MA
 LONG TERM SITE WIND DATA ANNUAL REPORT Mass Turnpike Authority Blandford, MA July 1, 2012 June 30, 2013 Prepared for Massachusetts Clean Energy Center 55 Summer Street, 9th Floor Boston, MA 02110 by Dylan
Pedestrian Wind Impact Study for Atlantic Yard Area & Redevelopment Project NEWMERICAL TECHNOLOGIES INTERNATIONAL.
 Pedestrian Wind Impact Study for Atlantic Yard Area & Redevelopment Project by NEWMERICAL TECHNOLOGIES INTERNATIONAL November 15, 2006 Atlantic Yards Report Preliminary Draft. 3-2006, November 2006, page
7 th International Conference on Wind Turbine Noise Rotterdam 2 nd to 5 th May 2017
 7 th International Conference on Wind Turbine Noise Rotterdam 2 nd to 5 th May 2017 Sound power level measurements 3.0 ir. L.M. Eilders, Peutz bv: l.eilders@peutz.nl ing. E.H.A. de Beer, Peutz bv: e.debeer@peutz.nl
Pitka s Point, Alaska Wind Resource Report
 Pitka s Point, Alaska Wind Resource Report Pitka s Point met tower, photo by Doug Vaught April 25, 2012 Douglas Vaught, P.E. V3 Energy, LLC Eagle River, Alaska Page 2 Summary The wind resource measured
Lopez Community Land Trust. Final Wind Energy Report
 Lopez Community Land Trust Final Wind Energy Report July 20th, 2007 Prepared by: Terrance Meyer P.E. Rose Woofenden 1 Table of Contents 1.0 INTRODUCTION 4 FIGURE 1.1 VESTAS TURBINE AT HULL, MA PROJECT
Utility Debt Securitization Authority 2013 T/TE Billed Revenues Tracking Report
 Utility Debt Securitization Authority 2013 T/TE Billed Revenues Tracking Report Billing Budgeted Billed Dollar Percent Month Revenues Revenues Variance Variance Jan 2018 11,943,180.68 12,697,662.47 754,481.79
Wisconsin 511 Traveler Information Annual Usage Summary January 3, Wisconsin 511 Phone Usage ( )
") Wisconsin 511 Traveler Information 211 Annual Usage Summary January 3, 212 Overall to-date Summary 36 months of operation 1,16,63 total calls the 1 Million mark was passed on December 3, 212 3,627,527
Wisconsin 511 Traveler Information 211 Annual Usage Summary January 3, 212 Overall to-date Summary 36 months of operation 1,16,63 total calls the 1 Million mark was passed on December 3, 212 3,627,527
Wind Project Siting & Resource Assessment
 Wind Project Siting & Resource Assessment David DeLuca, Project Manager AWS Truewind, LLC 463 New Karner Road Albany, NY 12205 ddeluca@awstruewind.com www.awstruewind.com AWS Truewind - Overview Industry
First of all, you should know that weather and climate are not the same thing.
 First of all, you should know that weather and climate are not the same thing. WEATHER IS: Short term Limited area Can change rapidly Difficult to predict WEATHER is what s happening outside your window
NUMERICAL INVESTIGATION OF THE FLOW BEHAVIOUR IN A MODERN TRAFFIC TUNNEL IN CASE OF FIRE INCIDENT
 - 277 - NUMERICAL INVESTIGATION OF THE FLOW BEHAVIOUR IN A MODERN TRAFFIC TUNNEL IN CASE OF FIRE INCIDENT Iseler J., Heiser W. EAS GmbH, Karlsruhe, Germany ABSTRACT A numerical study of the flow behaviour
Chart Discussion: Fri-25-May-2018 Rainfall Last Week
 Chart Discussion: Fri-25-May-2018 Rainfall Last Week 1 Last Week s Charts 2 MSL Analysis / Sat Image (Thu) 3 MSL Analysis / Sat Image (Fri) 4 Last Week s Model Forecasts OBSERVED Chart Discussion: Fri-25-May-2018
REPORT ON RED-LIGHT MONITORING SYSTEMS
 REPORT ON RED-LIGHT TRAFFIC CONTROL SIGNAL MONITORING SYSTEMS Prepared by the New Jersey Department of Transportation November 2011 Executive Summary Public Law 2007, Chapter 348 (P.L. 2007, c.348), signed
Technical Brief - Wave Uprush Analysis Island Harbour Club, Gananoque, Ontario
 Technical Brief - Wave Uprush Analysis RIGGS ENGINEERING LTD. 1240 Commissioners Road West Suite 205 London, Ontario N6K 1C7 October 31, 2014 Table of Contents Section Page Table of Contents... i List
Snare Wind Monitoring Update 2016
 2016 Prepared for by Jean Paul Pinard, P. Eng., PhD. 703 Wheeler St., Whitehorse, Yukon Y1A 2P6 Tel. (867) 336 2977, jpp@northwestel.net March 31, 2016 Executive Summary This project is part of the assessment
TABLE OF CONTENTS. Executive Summary
 Executive Summary Background... ES-1 Pedestrian Network... ES-2 Bikeway Network... ES-2 Collision History... ES-2 Public Input... ES-4 Conclusions and Recommendations... ES-4 1. Introduction and Setting
2018 HR & PAYROLL Deadlines
 th (by payment date) EPAF 3rd PARTY FEEDS WTE Approval 2018 HR & PAYROLL s Normal Payroll day s 2017 B1-26 3 * 13-Dec-17 15-Dec-17 n/a n/a n/a 28-Dec-17 29-Dec-17 11:00 AM 16-Dec-2017 29-Dec-2017 JAN 2018
Draft Kivalina Wind Resource Report
 Draft Kivalina Wind Resource Report Kivalina aerial photo by Doug Vaught, July 2011 May 31, 2012 Douglas Vaught, P.E. dvaught@v3energy.com V3 Energy, LLC Eagle River, Alaska Draft Kivalina Wind Resource
Nordel GRID DISTURBANCE AND FAULT STATISTICS
 Nordel GRID DISTURBANCE AND FAULT STATISTICS Table contents Table contents Page 1 Introduction... 3 1.1 Contact persons... 4 1.2 Guidelines the statistics... 4 1.3 Voltage levels in the Nordel network...
Wind Resource Assessment Østerild National Test Centre for Large Wind Turbines
 Downloaded from orbit.dtu.dk on: Jan 21, 2018 Wind Resource Assessment Østerild National Test Centre for Large Wind Turbines Hansen, Brian Ohrbeck; Courtney, Michael; Mortensen, Niels Gylling Publication
 A Brief Analysis of the Impact of the El Niño Southern Oscillation (ENSO) Cycle In specific areas around East Timor In the Climate Change section of Seeds of Life, we believe it would be beneficial for
Kake, Alaska Wind Resource Report
 Kake, Alaska Wind Resource Report Kake met tower, photo provided by SEACC January 6, 2012 Douglas Vaught, P.E. V3 Energy, LLC Eagle River, Alaska Kake, Alaska Met Tower Wind Resource Report Page 2 Project
Computationally Efficient Determination of Long Term Extreme Out-of-Plane Loads for Offshore Turbines
 Computationally Efficient Determination of Long Term Extreme Out-of-Plane Loads for Offshore Turbines Anand Natarajan Senior Scientist Wind Energy Department, Risø DTU Denmark Introduction IEC 61400-1
APPENDIX R-2 VIBRATION AND OVERPRESSURE SOUND ASSESSMENT. RAINY RIVER PROJECT Final Environmental Assessment Report
 APPENDIX R-2 VIBRATION AND OVERPRESSURE SOUND ASSESSMENT RAINY RIVER PROJECT Final Environmental Assessment Report BLASTING VIBRATION AND OVERPRESSURE SOUND ASSESSMENT REPORT Submitted by: AMEC Environment
Chart Discussion: Fri-15-Jun-2018 Rainfall Last Week
 Chart Discussion: Fri-15-Jun-2018 Rainfall Last Week 1 Last Week s Charts 2 Last Week s Melbourne Wind Forecasts Forecast 3 PM WIND for 1,2,3,4,5,6,7,8,9,10 Days Ahead [ACCESS model] 1- Jun- 18 SSE SSE
Wake Effects from Wind Turbines
 Wake Effects from Wind Turbines Brian Wareing Brian Wareing.Tech Ltd Chester, UK Secretary WG28 Meteorology for overhead lines Wind power Over 70GW installed capacity of wind power world-wide Europe is
Scoping analysis of the potential yield of the Hollandse Kust (noord) wind farm and the influence on the existing wind farms in the proximity
 wind farm and the influence on the existing wind farms in the proximity") Scoping analysis of the potential yield of the Hollandse Kust (noord) wind farm and the influence on the existing wind farms in the proximity B.H. Bulder E.T.G. Bot G. Bedon April 2018 ECN-E--18-033 Executive
Scoping analysis of the potential yield of the Hollandse Kust (noord) wind farm and the influence on the existing wind farms in the proximity B.H. Bulder E.T.G. Bot G. Bedon April 2018 ECN-E--18-033 Executive
Prudhoe Bay Oil Production Optimization: Using Virtual Intelligence Techniques, Stage One: Neural Model Building
 Prudhoe Bay Oil Production Optimization: Using Virtual Intelligence Techniques, Stage One: Neural Model Building Shahab D. Mohaghegh, West Virginia University Lynda A. Hutchins, BP Exploration (Alaska),
The Wind Resource: Prospecting for Good Sites
 The Wind Resource: Prospecting for Good Sites Bruce Bailey, President AWS Truewind, LLC 255 Fuller Road Albany, NY 12203 bbailey@awstruewind.com Talk Topics Causes of Wind Resource Impacts on Project Viability
July Interim Report. National Institute of Wind Energy (NIWE) Wind Resource Assessment & Offshore Unit Chennai, India.
 Wind Resource Assessment & Offshore Unit Chennai, India.") Interim Report (First Offshore Lidar wind data analysis) July 2018 Prepared by National Institute of Wind Energy (NIWE) Wind Resource Assessment & Offshore Unit Chennai, India. W I N D R E S O U R C E
Interim Report (First Offshore Lidar wind data analysis) July 2018 Prepared by National Institute of Wind Energy (NIWE) Wind Resource Assessment & Offshore Unit Chennai, India. W I N D R E S O U R C E
NEVADA SLOT MACHINES: HISTORICAL HOLD PERCENTAGE VARIATIONS ANNUAL AND MONTHLY HOLD PERCENTAGES, CENTER FOR GAMING RESEARCH, NOVEMBER 2017
 NEVADA SLOT MACHINES: HISTORICAL HOLD PERCENTAGE VARIATIONS ANNUAL AND MONTHLY HOLD PERCENTAGES, 2004-2017 CENTER FOR GAMING RESEARCH, NOVEMBER 2017 Executive Summary Hold percentage the portion of money
Progress Report on the Design and Planning of an Infrastructure Improvement Project for the Sunnyside TIF District (Phase II)
") Presentation to the CNRC Board of Directors Regular Meeting March 11, 2015 1 Agenda Preferred Alternate Refinement for University Avenue, 3rd Street, and Beverly Avenue Intersection Improvements validate
Presentation to the CNRC Board of Directors Regular Meeting March 11, 2015 1 Agenda Preferred Alternate Refinement for University Avenue, 3rd Street, and Beverly Avenue Intersection Improvements validate
Producer Price Index - Agriculture (PPI-A) (January March 2001)
 (January March 2001)") Producer Price Index - Agriculture (PPI-A) (January March 2001) Introduction The Producer Price Index-Agriculture (PPI-A) gives a measure of the average change in the selling prices which producers receive
Producer Price Index - Agriculture (PPI-A) (January March 2001) Introduction The Producer Price Index-Agriculture (PPI-A) gives a measure of the average change in the selling prices which producers receive
Buckland Wind Resource Report
 Buckland Wind Resource Report By: Douglas Vaught, P.E., V3 Energy LLC, Eagle River, Alaska Date: September 17, 2010 Buckland met tower; D. Vaught photo Contents Summary... 2 Test Site Location... 2 Photographs...
WIND DATA REPORT. Swan s Island, ME
 WIND DATA REPORT Swan s Island, ME June 1, 2009 August 31, 2009 Prepared for US Department of Energy by Daniel T. Grip Utama Abdulwahid James F. Manwell Anthony F. Ellis September 17, 2009 Report template
Farm Energy IQ. Wind Energy on Farms. Objectives of this Module. How windy is it? How windy is it? How windy is it? 2/16/2015
 Farms Today Securing Our Energy Future Ed Johnstonbaugh, Penn State Extension Objectives of this Module At the conclusion of this module, you should: Understand wind requirements for power generation Be
For Information Only. Pedestrian Collisions (2011 to 2015) Resolution. Presented: Monday, Apr 18, Report Date Tuesday, Apr 05, 2016
 Resolution. Presented: Monday, Apr 18, Report Date Tuesday, Apr 05, 2016") Presented To: Operations Committee For Information Only Pedestrian Collisions (0 to 0) Presented: Monday, Apr 8, 06 Report Date Tuesday, Apr 0, 06 Type: Correspondence for Information Only Resolution For
Presented To: Operations Committee For Information Only Pedestrian Collisions (0 to 0) Presented: Monday, Apr 8, 06 Report Date Tuesday, Apr 0, 06 Type: Correspondence for Information Only Resolution For
WIND DATA REPORT. Bourne Water District
 WIND DATA REPORT Bourne Water District July to September 2010 Prepared for Massachusetts Clean Energy Center 55 Summer Street, 9th Floor Boston, MA 02110 by Dylan Chase James F. Manwell Utama Abdulwahid
Wind Resource Assessment for SAINT PAUL, ALASKA
 813 W. Northern Lights Blvd. Anchorage, AK 99503 Phone: 907-269-3000 Fax: 907-269-3044 www.akenergyauthority.org Wind Resource Assessment for SAINT PAUL, ALASKA Date last modified: 3/1/2006 Compiled by:
Truck Climbing Lane Traffic Justification Report
 ROUTE 7 (HARRY BYRD HIGHWAY) WESTBOUND FROM WEST MARKET STREET TO ROUTE 9 (CHARLES TOWN PIKE) Truck Climbing Lane Traffic Justification Report Project No. 6007-053-133, P 101 Ι UPC No. 58599 Prepared by: