M.Sc.THESIS. Dynamic Response Analysis of an Offshore Wind Turbine. Delivered: June 14th, Title: Availability: Open.
|
|
|
- Timothy Stevenson
- 5 years ago
- Views:
Transcription
1 NTNU Norwegian University of Science and Technology Department of Marine Technology M.Sc.THESIS Title: Student: Dynamic Response Analysis of an Offshore Wind Turbine Yu Li Delivered: June 14th, 2011 Availability: Open Number of pages: 90 Abstract: The offshore wind power is an attractive renewable energy resource. To improve the wind power generation capacity, there is a strong desire for offshore wind turbine to go to deep waters. For offshore fixed wind turbine, stronger foundation like jacket structure has a good applicability for deeper water depth. A 70-meters jacket substructure for offshore wind turbine is designed. This thesis focuses on the dynamic structural response analysis of this jacket substructure, with a particular focus on hot spot stress of critical points on tubular joints. Eigen value analysis is performed to check the validity of decoupled method for dynamic response analysis. The global modes, the blade modes and the modes related to jacket braces are identified. Hydrodynamic analysis is performed to compare wave loads with different regular wave theories, including: Extrapolated Airy theory, Stretched Wave theory, Stoke s 5 th order wave theory and Stream Function theory. Dynamic structural response analysis is performed in time domain with decoupled analysis method. The decoupled analysis can give quite accurate results when the jacket wind turbine is relatively stiff, so that the wave-induced responses are mainly quasi-static, while the wind loads can induce flexible eigen modes of the structure. The effect of misalignment of wind and wave on hot spot stress at joints is studied. The non-collinear wind and wave directions may cause larger variance to hot spot stress of jacket joints than collinear wind and waves, which indicate that the effect of wind-wave misalignment should be taken into consideration for fatigue design of jacket structures of offshore wind turbine. Keyword: Eigen value Wave theories Dynamic structural response Hot spot stress Advisor: Torgeir Moan Address: Location Tel NTNU Marinteknisk Senter Fax Department of Marine Technology O. Nielsens vei 10 N-7491 Trondheim
2 I Preface This thesis is based on my M.Sc. study in the Department of Marine Technology at Norwegian University of Science and Technology, with specialization in Marine Structures. This project with the topic of Dynamic Response Analysis of Offshore Jacket Wind Turbine is performed as a part of my Master degree in Marine Technology. The main objective of this thesis is to review and summarize what I learned during my studies. Included in this thesis are: wave theories, hydrodynamics and aerodynamics, structural responses, and fatigue analysis. Considerable time has been spent on running time domain simulations and post-processing, with a focus on dynamic responses of jacket substructure. I would like to thank Processor Torgeir Moan (NTNU) for leading me into this challenging but interesting field of offshore wind energy, providing me with a lot of valuable study resources. I would also thank Post-Doc. Zhen Gao (NTNU) for guiding me effectively through the whole process of Master thesis work, as well as PhD Wenbin Dong for affording matlab script for post-processing and answering my questions patiently. Li Yu Trondheim, June 2011
3 II Summary The offshore wind power is an attractive renewable energy resource. To improve the wind power generation capacity, there is a strong desire for offshore wind turbine to go to deep waters. For offshore fixed wind turbine, stronger foundation like jacket structure has a good applicability for deeper water depth. A 70-meters jacket substructure for offshore wind turbine is designed. This thesis focuses on the dynamic structural response analysis of this jacket substructure, with a particular focus on hot spot stress of critical points on tubular joints. Three types of models are applied for analyses in this thesis. For eigen-value analysis the entire modal including the wind turbine, tubular tower and jacket supporting structure is used in the program USFOS-VPOne. For hydrodynamic analysis the refined substructure model with complete jacket structure and tubular tower is applied in USFOS. The equivalent monopile model is constructed in HAWC2 to predict wind loads. Eigen value analysis is performed to check the validity of decoupled method for dynamic response analysis. The first eigen period is about 2.9s, far less than the main wave input periods, which implies the wave loads are mainly quasi-static, therefore the simplified decoupled analysis method can be applied. The global modes, the blade modes and the modes related to jacket braces are identified. Hydrodynamic analysis is performed to compare wave loads with different regular wave theories, including: Extrapolated Airy theory, Stretched Wave theory, Stoke s 5 th order wave theory and Stream Function theory. It is proved that for extreme wave conditions, higher order wave theories such as Stoke s 5 th order wave theory and Stream Function theory should be applied since linear wave theories will under-estimate the structural reactions. Dynamic structural response analysis is performed in time domain with decoupled analysis method. The effect of misalignment of wind and wave on hot spot stress at joints is studied. It is observed that wave propagation directions has more significant effects on structural response than wind directions, while wind force has more significant influence on dynamic structural response rather than wave forces no matter in which directions they are propagating.
4 III Content Preface... I Summary... II List of Figures... VII List of Tables... XI 1. Introduction Background Motivation and Objective for the Study Scope of Work Wave Theories and Morison Formula Regular Wave Theories Airy waves Extrapolated Airy theory Stretched Airy Theory Stoke s 5 th order wave Stream Function Wave Theory Irregular waves Force Model Model Description Jacket Model in USFOS... 16
5 IV Dimension Study Finite Element Model Materials Monopile Model in HAWC Eigen-value Analysis of Full-blade OJWT Objective Eigen-value analysis for OJWT Hydrodynamic Analysis Analysis Set-up Results and Discussion Regular wave analysis results for load case H=3m, T=10s Regular wave analysis results for load case H=5m, T=12s Regular wave analysis results for load case H=10m, T=14s Conclusion Dynamic Response Analysis of OJWT under Wind and Wave Loads General Environmental Conditions Load Cases Based on Previous Study for Fatigue Analysis Wind/Wave Directions Time-domain Simulations Joints in USFOS Model... 42
6 V Results of Element Forces Comparison of Wind and Wave Load Effects Stress Analysis of Jacket Joints Hot Spot Stress Calculation Selection of Critical Points Method and Procedures Short-term Hot Spot Stress Analysis for Separate Wave and Wind Simulations Results Wind Load Effect Study Wave Load Effect Study Discussion Short-term Hot Spot Stress Analysis for Combined Wind and Wave Simulations Discussion and Conclusion Recommendation for Future Work References Appendix Time series of hot spot stress for L1J2B1P1 (U w = 20, H s = 5, T p = 12, wind and wave directions of 90 degress, 10 simulations)... 73
7 VI
8 VII List of Figures Figure 1.1 Progression of Expected Wind Turbine Evolution to Deeper Water (Source: National Renewable Energy Laboratory)... 2 Figure 2.1 Definitions of wave propagating along x-axis (USFOS hydrodynamics)... 5 Figure 2.2 Illustration of extrapolated Airy theory (USFOS hydrodynamics)... 8 Figure 2.3 Hydrodynamic pressures in wave troughs and wave crests (USFOS hydrodynamics)... 8 Figure 2.4 Illustration of Stretched Airy theory (Wheeler modification) (USFOS hydrodynamics)... 9 Figure 2.5 Pierson-Moskowitz and JONSWAP wave spectra (USFOS hydrodynamics) Figure 2.6 Dominating wave forces on marine structures Figure 2.7 vertical cylinder strip Figure 3.1 3D perspective of the OFWT for 70 meter water depth Figure 3.2 Main dimensions of the Jacket-Tower Figure 3.3 Dimensions for legs and braces of Jacket-Tower Figure 3.4 Finite element models for Jacket-Tower Figure 3.5 Equivalent monopile model in HAWC Figure 4.1 JacketWT Model in USFOS Figure 4.2 The first, second and fifteenth eigen modes of JacketWT Figure 4.3 the 17 th, 18 th, and 19 th eigen mode of JacketWT... 24
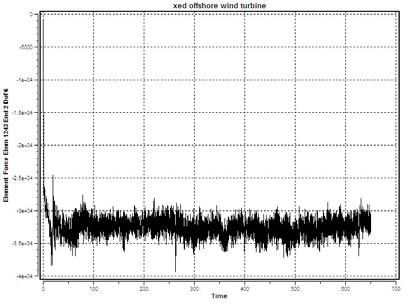
9 VIII Figure 4.4 the third and thirtieth eigen mode of JacketWT Figure 4.5 the fourth, sixth and seventh eigen mode of JacketWT Figure 5.1 Example of hydrodynamic analysis set-up Figure 5.2: H3T10 Surface elevation Figure 5.3: H3T10 Reaction Y-comp Figure 5.4: H3T10 Reaction X-moment Figure 5.5: H3T10 Element1254 Axial force Figure 5.6: H5T12 Surface Elevation Figure 5.7: H5T12 Reaction Y-comp Figure 5.8: H5T12 Reaction X-moment Figure 5.9: H5T12 Element1254-Axial force Figure 5.10: H10T14 Surface Elevation Figure 5.11: H10T14 Reaction Y-comp Figure 5.12: H10T14 Reaction X-moment Figure 5.13: H10T14 Element1254-Axial force Figure 6.1 Sketch of eight wave propagation directions Figure 6.2 Selected tubular joints with different types and locations Figure 6.3 Defined Element Forces in USFOS Analysis Control Files Figure 6.4 Element Forces of Element 1243 in 6-dofs under wave load of Hs=5, Tp=12 propagating in 90 degrees Figure 6.5 Figure 6.4 Element Forces of Element 1243 in 6-dofs under wind load of U w =12m/s propagating in 90 degrees... 46
10 IX Figure 6.6 Comparison for wind and wave load effects on Element Figure 7.1 Locations of hot-spot stress around the brace-chord intersection [2]. 49 Figure 7.2 Critical hot spot location for four tubular joints Figure 7.3 Definitions of and in Eq. (7.1) [2] Figure 7.4 Contributed components for Leg1-Joint Figure 7.5 Geometrical definitions of tubular joints (DNV RP-C203 (2010)) Figure 7.6 Standard deviation comparison for wave load effects on L1J2B1P1. 60 Figure 7.7 Standard deviation comparison for wave load effects on L1J3B2P4. 60 Figure 7.8 Standard deviation comparison for wave load effects on L2J2B1P1. 61 Figure 7.9 Standard deviation comparison for wave load effects on S12J1B1P Figure 7.10 Standard deviation comparison for load direction effects on L1J2B1P Figure 7.11 Standard deviation comparison for load direction effects on L1J3B2P Figure 7.12 Standard deviation comparison for load direction effects on L2J2B1P Figure 7.13 Standard deviation comparison for load direction effects on S12J1B1P Figure 7.14 Hot spot stress time series for L2J2B1P1, 10 th simulation st simulation nd simulation rd simulation... 74
11 X 4 th simulation th simulation th simulation th simulation th simulation th simulation th simulation... 78
12 XI List of Tables Table 3.1 Properties of NREL 5MW wind turbine Table 3.2 Element types and material properties Table 4.1 Eigen values of JacketWT model Table 5.1 Results and comparison for load case h=3m, t=10s Table 5.2 Results and comparison for load case h=5m, t=12s Table 5.3 Results and comparison for load case h=10m, t=14s Table 6.1 Defined environmental conditions for dynamic response analysis Table 7.1 Parameters for SCF calculation Table 7.2 Statistics for L1J2B1P1 (Hs=3;Tp=10) Table 7.3 Statistics for L1J2B1P1 (Hs=5;Tp=12) Table 7.4 Statistics for L1J2B1P1 (Only Wind) Table 7.5 Statistics for L1J3B2P4 (Hs=3;Tp=10) Table 7.6 Statistics for L1J3B2P4 (Hs=5;Tp=12) Table 7.7 Statistics for L1J3B2P4 (Only Wind) Table 7.8 Statistics for L2J2B1P1 (Hs=3;Tp=10) Table 7.9 Statistics for L2J2B1P1 (Hs=5;Tp=12) Table 7.10 Statistics for L2J2B1P1 (Only Wind) Table 7.11 Statistics for S12J1B1P2 (Hs=3;Tp=10)... 58
13 XII Table 7.12 Statistics for S12J1B1P2 (Hs=5;Tp=12) Table 7.13 Statistics for S12J1B1P2 (Only Wind) Table 7.14 Standard deviation comparison for wind load effects Table 7.15 Standard deviation results for load direction effects (H s =3, T p =10) 63 Table 7.16 Standard deviation results for load direction effects (H s =5, T p =12) 64
14 1 1. Introduction 1.1 Background Wind energy has been utilized for power generation for more than two thousand years. But wind technology develops slowly in the history, until the globe has been confronted with the pressure from both oil crisis and climate change since several decades ago. Sustainable energy resources need to be applied as soon as possible. Wind power, as an important source of renewable energy, has got a good application to generate electricity primarily through the use of wind turbines on land. Land-based wind energy will remain dominant in the immediate future, but installations at sea will become increasingly important. Compared to onshore wind, offshore wind is more complex and costly to install and maintain but also has a number of key advantages. Winds are typically stronger and more prevalent and stable at sea than on land, resulting in significantly higher production per unit installed. Besides, dimensions of wind turbines at sea can be larger than on land because of the logistical difficulties of transporting very large turbine components from the place of manufacturing by road to installation sites on land. What s more, wind farms at sea have less potential to cause concern among neighboring citizens and other stakeholders unless they interfere with competing maritime activities or important marine environmental interests. Therefore, a trend has been to move wind turbines offshore. Nowadays, offshore fixed wind turbines are all installed in shallow water depth (<30m) off the coast of Europe, with the typical gravity based supports of Monopile and Tripod structures. However, there is a strong demand that the application of offshore fixed wind turbine could be extended to deep water where winds are stronger and steadier. Some research work on going is for water depth like m. For this increasing depth, stronger support structures like jacket and gravity foundation are needed to replace the Monopile and Tripod structures. For even larger depth ( m), floating wind turbines might be the only choice, but a lot more researches still need to be done before this concept become commercially competitive. Therefore the growth of offshore wind energy may rely on fixed structure for many years. Due to applicability and economic efficiency requirements, wind turbines with larger

15 2 blade dimensions need to go to deeper water depth. As offshore fixed wind turbine will still domain in the growth of offshore wind energy in the near future, research work has been ongoing for offshore fixed wind turbine with larger working depth like m. In this thesis, a jacket structure designed by Aker Solutions is applied, with a 5MW NREL wind turbine, for the working depth of 70m. Figure 1.1 Progression of Expected Wind Turbine Evolution to Deeper Water (Source: National Renewable Energy Laboratory) 1.2 Motivation and Objective for the Study As water depth increases, dynamic responses of OWT support structures become an important issue. Firstly, the total height of jacket sub-structure increases due to deeper working depth. According to simple beam theory, the increase of beam length will cause more flexibility to the beam. This means, the global flexibility of OWT support structure increases, therefore dynamic stresses in jacket braces increases. Secondly, compared with offshore oil and gas platforms, a wind turbine will experience more wind forces due to its large blades. And these wind forces will have larger influence on supporting foundations than wave loads, which means higher dynamic stresses will
16 3 be generated due to wind loads. Summing up above two reasons, dynamic response analysis is an important aspect for design of offshore wind turbine substructures, and thus will be a main focus in this thesis. The objective of this thesis work is to study the dynamic behavior of the jacket wind turbine; to study the influence of wave-induced responses using linear and nonlinear wave theories; and to study the effect of wind-wave misalignment on jacket structural responses. 1.3 Scope of Work In this thesis, integrated analysis is carried out by using the time-domain software USFOS-VPOne. Firstly, eigen-value analysis is performed for the entire model of OJWT including jacket substructure designed by Aker Solution and full-blade wind turbine. Secondly, a refined model of 70-meter jacket structure with wind turbine substituted by a point mass sitting on top of the tubular tower is used for hydrodynamic analysis to compare four different wave theories applied in USFOS. Afterwards, extensive time-domain simulations are carried out to investigate the effects of misalignment of wind and wave on hot spot stress at tubular joints. The organization of this master thesis project work is established as follows: 1. Literature study: Regular wave theories, irregular waves, hydrodynamics and aerodynamics, fatigue analysis, USFOS user manual and theory description. 2. Eigen value analysis of the entire model including the wind turbine, tubular tower and jacket supporting structure, to identify the eigen modes, including the global modes, the blade modes and the modes related to jacket braces. 3. Perform the hydrodynamic analysis, to compare regular wave loads only with different wave theory, including linear wave theory (Airy theory), linear wave theory with Wheeler stretching, Stoke s 5 th order wave theory, and stream function wave theory. Extreme wave conditions will be considered herein. 4. Extensive time-domain simulations are carried out with separated and combined wind and wave loads considering non-collinear wind and wave directions, based on the refined node-mass model of jacket wind turbine. 5. Stress analysis of jacket joints is performed. Hot spot stress is calculated based on the time series of members forces, by summing up the member forces from separate wind and wave simulation results based on the linear superposition principle. Fatigue is also a focus, however, only the time series and variance of the hot spot stress is compared because there are many different load cases.
17 4 6. Discussions: - On the comparison of four regular wave theories; - On the comparison of structural response due to wind and wave loads; - On the effect of non-collinear wind and wave directions. 7. Reporting
18 5 2. Wave Theories and Morison Formula 2.1 Regular Wave Theories According to USFOS user manual, there are four types of wave theory available in USFOS: - Extrapolated Airy theory - Stretched Airy theory (Wheeler modification) - Stoke s 5 th order wave (Skjelbreia, Hendrickson, 1961) - Stream Function Theory (Dean, Dalrymple) The above four wave theories will be all introduced in this chapter, with a particular focus on their differences Airy waves Figure 2.1 Definitions of wave propagating along x-axis (USFOS hydrodynamics) Airy wave theory is often referred to as linear wave theory, which gives a linear description of the propagation of gravity waves on sea surfaces. To simplify the
19 6 expressions, a wave propagating along positive x-direction is considered herein, with the origin locating at the sea surface, and the global z-axis pointing upwards, as showed in Figure 2.1 above In Figure 2.1, a wave propagating along x-direction is defined, with wave amplitude of, wave length of l. The water depth is d. Here we only study the Airy theory for infinite water depth ( 0.5 : The free sea surface can be expressed as: cos (2.1) The corresponding wave potential is: Where, cos (2.2) is the gravity acceleration; is the circular wave frequency; is the wave number, defined as: (2.3) And the relationship between,, and can be expressed as: (2.4) Then the horizontal partical velocity and acceleration are expressed as: sin (2.5) cos (2.6) Similarly, the vertical partical velocity and acceleration are expressed:
20 7 cos (2.7) sin (2.8) And the hydrodynamic pressure can be got based on Bernouli equation (2 nd order non-linear dynamic part omitted): sin (2.9) Here we can observe that the total hydrodynamic pressure is composed of two parts: - The 1 st part is a static pressure of increases as water depth increases; - The 2 nd part is a linear dynamic part, and the dynamic pressure decreases with water depth at an exponential rate. Then the hydrodynamic pressure is integrated along the contact surface between structure and wave, to obtain the wave forces acting on structures: (2.10) From the above formula for hydrodynamic pressure calculation, Extrapolated Airy theory The Airy wave theory is limited to waves with infinitesimal amplitudes. For finite amplitude waves, assumptions must be made about wave kinematics. That is the reason why extrapolated and stretched Airy theory are introduced, in other words, these two theories introduce different assumptions regarding wave kinematics. For Extrapolated Airy theory, the Airy wave kinematics is used up to surface elevation in wave trough and wave forces calculation for structure members free from water are excluded. In wave crests, wave kinematics above mean sea level (z=0) is assumed constant, equal to the value at z=0, as illustrated in Figure 2.2:
21 8 Figure 2.2 Illustration of extrapolated Airy theory (USFOS hydrodynamics) In extrapolated Airy theory, when integrating the hydrodynamic pressure to true surface, the dynamic part of the hydrodynamic pressure is assumed to be constant above the mean surface level in wave crests, while in wave troughs the true dynamic contribution is used below mean surface level, as illustrated in Figure 2.3: Figure 2.3 Hydrodynamic pressures in wave troughs and wave crests (USFOS hydrodynamics)
22 Stretched Airy Theory By stretched Airy theory, for wave kinematics in both wave crests and wave troughs, the wave kinematics at the mean surface level are applied to the true surface. And then the distribution down to the sea bed is sketched correspondingly. This can be achieved by replacing the original vertical coordinate z, with a scaled parameter z, where: (2.11) Here is the surface elevation as expressed before in formula (2.1). The procedure can be easily understood with a sketch in Figure 2.4: Figure 2.4 Illustration of Stretched Airy theory (Wheeler modification) (USFOS hydrodynamics) The difference between Extrapolated Airy theory and Stretched Airy theory can be observed easily by comparing Figure 2.2 and Figure 2.4. And we can find that both of them use rough estimations of wave kinematics with different assumptions introduced
23 10 regarding wave crests/troughs Stoke s 5 th order wave By Stoke s 5 th order wave theory, the wave potential is given by a series expansion including five terms. The detailed expression will not be listed in this thesis. But with regarding to our interest in the accuracy of different wave theories, it is worth noting that the linear Airy theory is a 1 st order Stoke s theory. What s more, inherent in the method of Stoke s 5 th order wave is that all terms of order greater than 5 are omitted. Thus if the discarded terms are still significant, then this theory will give us poor results Stream Function Wave Theory The stream function wave theory was developed by Dean (J. Geophys. Res, 1965). It is a purely numerical procedure to examine fully nonlinear waves. A stream function wave solution has a general form of: Ψ, sinh cos (2.12) Where, is the wave celerity, is the order of this wave theory. The required order of the Stream function depends on the wave parameters steepness and the shallow water parameter. It is a measure of how nonlinear the wave is. Generally speaking, the order can be low in deep water, while in the shallow water more terms are required so as to give an accurate representation of the wave. On the other hand, the closer to the breaking wave height, the more terms are needed for accuracy consideration. Thus it can be observed that the Stream function theory has a broader range of applicability than the wave theories above. One method to decide which order to use is to choose an order and then increase or decrease it by one to get another solution. By comparing the results, if they don t change a lot, then it means the right order has been chosen. It is also worth mention
24 11 that the Stream function theory is reduced to linear wave theory for N=1. In USFOS the default order of Stream function is set to Irregular waves Previously we introduced regular waves. However this simplified model does not give a realistic description of the sea state because the wave shapes seem more or less random. Anyway this forms a basis for describing the real waves at sea, indicated by irregular waves. The description of sea surface is done statistically, based on random processes theory. The sea surface is assumed to be constructed by a series of long crested waves, with different amplitudes, frequencies and phase angles. Thus the surface elevation of the irregular sea is described as: Where,, cos (2.13) is the amplitude of harmonic wave component n; is the angular frequency of harmonic wave component n; is the wave number for harmonic component n; is the random phase angle for of harmonic component n. The amplitude of each harmonic component is determined by:, 2 (2.14), Where, and, are the lower and upper angular frequency limit for wave component n. For Fatigue Limit State analysis (FLS), the dynamic effects, buoyancy effects, hydrodynamic damping and other non-linear effects become significant. Thus the time domain simulation of irregular waves will give us a better prediction of the real sea state. For irregular wave simulations wave kinematics are usually generated based on
25 12 wave spectrum. In USFOS two types of standard wave spectra are provided: the Pierson-Moskowitz spectrum and the JONSWAP spectrum, as shown in Figure 2.5: Figure 2.5 Pierson-Moskowitz and JONSWAP wave spectra (USFOS hydrodynamics) The wave spectra is used to describe sea state, thus for the same sea state, the total energy will be the same. In other words, the area under the spectrum gragh will be the same even for different wave spectra. It can be found from Figure 2.5 that the difference between the P-M and JONSWAP wave spectra is how the energy is distributed along the period or frequency axis. More energy concentrated near the peak frequency and less energy on frequencies further away from the peak frequency in the JONSWAP spectrum than in the P-M spectrum. The experimental data for the JONSWAP spectrum is based on a location in the North Sea with relatively shallow water and close to the shore. And the JONSWAP spectrum is frequently used in calculations on offshore structures for fully developed sea states. In this thesis the JONSWAP spectrum is also selected for sea state simulations. 2.3 Force Model To determine the wave loads on offshore structures, both viscous effects and potential flow effects might be important. The potential flow includes the wave diffraction and
26 13 radiation around the structure. Figure 2.6 below is always used to help judge when viscous effects or different types of potential flow effects are important. The sketch is based on results for horizontal wave-induced forces on a vertical cylinder, which sits on the seafloor and penetrates the free sea surface. Figure 2.6 Dominating wave forces on marine structures Morison s equation (Eq(2.15)) is usually applied to calculate wave loads on circular cylindrical structural members of fixed offshore structures, especially when considering viscous forces. The horizontal wave force df acting on a strip with height dz of a vertical rigid circular cylinder (see Figure 2.6) is expressed as: Where, (2.15) is the mass density of water; is the cylinder diameter;
27 14 and are the water particle velocity and acceleration, which are evaluated at the midpoint of the strip; and are mass coefficient and drag coefficient respectively, which are empirically determined and depend on the parameters including Reynolds number, Roughness number, and so on. Figure 2.7 vertical cylinder strip For offshore jacket wind turbine (OWJT) the jacket braces are cylindrical elements, with the diameter D much smaller than wave length. In our project the jacket brace diameters are between 0.6 to 0.95 meters. Therefore, in most situations the dominating force will be inertia force, i.e the first term in Morison s equation. And for extreme load case with H=10m, the viscous forces will give more contribution.

28 15 3. Model Description An offshore jacket wind turbine model designed by Aker Solutions for a working water depth of 70m is applied in this thesis. A general sketch of the 3D perspective of the OFWT is showed in Figure 3.1 below: Figure 3.1 3D perspective of the OFWT for 70 meter water depth As showed above, the complete OFWT model includes wind turbine, tubular tower, middle section, and jacket foundation. Sitting on top of the tower is a NREL 5MW wind turbine, with major properties listed in Table 3.1. Wind turbine might confront with a lot of changes during its life, including extreme wind loads, fatigue damage of blades, etc. And these effects are mainly related to aerodynamics. For offshore structure designers, our focus is the supporting structure of offshore wind turbine. Therefore, no further detailed studies will be carried out for turbine technology. Wind load is also one of our concern, thus the wind loads will be simulated in Aerodynamic software and then imported to USFOS. The wind turbine is simplified as a point mass, on which the wind forces can be acting.

29 16 Table 3.1 Properties of NREL 5MW wind turbine Rating Rotor orientation Upwind Cut-In Wind Speed Rated Wind Speed Cut-Out Wind Speed Rotor / Hub diameter Concentrated Mass at Top-Nacelle Concentrated Mass at Top-Turbine Blade Diameter 5MW 3 blades 3m/s 11.4m/s 25m/s 126m / 3m 295 M kg 115 M kg 126m 3.1 Jacket Model in USFOS Dimension Study The dimension of the jacket sub-structure is decided during the design carried out by Aker solution. Since the size, shape and type of structure is of great importance when evaluating the wave loads, the dimensions of jacket model need to be studied. Figure 3.2 Main dimensions of the Jacket-Tower

30 17 The jacket structure is designed for a water depth of 70 meters, thus the jacket is designed to be 89.5 meters high, and the tubular tower sitting on top of the jacket substructure is designed with a height of 63.5 meters. In order to make the connections rigid in USFOS, some theoretically rigid beam elements are introduced between the jacket legs and the interface, as well as between the interface and tubular tower. Since the rigid beams dimensions are quite small, we will not cover their details herein. The main dimensions of the whole jacket with tower are showed in Figure 3.2 above. View from bottom at sea bed, the dimension of the jacket foundation on the sea bed is 32 meters square. Figure 3.3 Dimensions for legs and braces of Jacket-Tower In Figure 3.2, when viewing from the front or side, the jacket substructure is composed of five storeys of vertical braces and horizontal braces at the bottom of first

31 18 and third layers. The leg diameters vary from 1.8m with a thickness of 40mm at the bottom to 1.17m with a thickness of 30mm at the top layer. Besides, for each tubular joint, both the leg diameter and thickness are increased. All the joints have the thickness of 45mm, and the leg diameters at tubular joints are increased due to connection requirement. Figure 3.3 listed the dimensions for legs and braces. The vertical braces diameters vary from 0.8m to 0.6m, with the same thickness of 20mm for all vertical braces. And it is observed that the vertical braces at the bottom and top have the largest diameters. The reason for this design is that the mean sea level is on the fourth layer (refer to Figure 3.2), thus the top layer will experience more wave impact. The dimensions of vertical braces at each storey always keep the same. The horizontal braces at the bottom layer has the diameter of 0.9m with thickness of 25mm, while at the bottom of third layer it has a diameter of 0.75m with thickness of 20mm Finite Element Model Figure 3.4 Finite element models for Jacket-Tower USFOS is a finite element program based on updated Lagrangian formulation. The
32 19 whole substructure (including tower and jacket foundation) of this JacketTower is modeled by 1286 elements. The basic structural unit used is the two-node beam. For jacket foundation, 492 beam elements are used. The interface is modeled by shell elements, including quadrilateral and triangular shell elements. For fatigue analysis, tubular joints are of most interest. Thus, particular attention is paid to the connection parts of relevant braces. USFOS use a very coarse finite element mesh, but still can obtain reliable and accurate results. The major finite element meshes for the jacket and middle section is showed in Figure 3.4 above Materials A summary of element types and corresponding material properties defined in USFOS model control file are tabulated in Table 3.2. Table 3.2 Element types and material properties Place Element E-mod Poisson Yield N Density ThermX N/m² Kg/m3 Jacket Beam 2.10E E E E-05 Interface Shell 2.10E E E E-05 Tower Beam 2.10E E-01 Infinite E-05 The parameters in Table 3.2 are described as followed: - E-Mod: Modulus of elasticity - Poiss: Poisson ration - Yield: Yield stress - Density: Material Density - ThermX: Thermal Expansion Coefficient

33 Monopile Model in HAWC2 Figure 3.5 Equivalent monopile model in HAWC2 Since wind load effect will be considered later in this thesis, the wind loads need to be simulated and imported into USFOS as external loads. The aerodynamic software of HAWC2 is used for simulating blade aerodynamics of wind turbine. The HAWC2 program is capable of doing aeroelastic analysis, however, this software is only suitable for modeling simpler support structures like monopile rather than jacket. Therefore a simplified equivalent monopile model is used in HAWC2 to predict the aerodynamic loads with a detailed rotor blade model, as showed in Figure 3.5 above. For the equivalent monopile model, the five layers of jacket structure are substituted by five equivalent pipe structures. The interface structure is also modeled by a pipe with quite high stiffness. In order to make sure that the mass and bending stiffness match the original jacket model, the external diameter and thickness of pipes are calculated. According to previous work of Zhen Gao (2010), a verification of the equivalent model in terms of mass, stiffness, and hydrodynamic load distribution has been carried out [1]. And by comparing the hydrodynamic loads calculated with HAWC2 with those with USFOS in his paper, it has been proved that the equivalent monopile model can be used for predicting the global response of jacket structure. Therefore, the monopile model is used in HAWC2 to estimate the wind force acting on the nacelle.

34 21 4. Eigen-value Analysis of Full-blade OJWT 4.1 Objective An important feature of offshore structure is its natural periods and the corresponding eigen-modes. When eigen-periods of a structure are close to environmental periods, it s most easy to cause resonance, which will make the structure oscillate significantly. This will bring great damage to structures, especially in long term operations. For an offshore jacket wind turbine structure, some of the eigen-modes have strong effect on bottom of the substructure, which will cause damage to foundations, and some others may cause local damage to jacket braces or wind turbine blades. Eigen mode/period is an inherent character of a structure, only determined by the mass distribution and equivalent stiffness of this structure. Therefore, to avoid maximum dynamic responses, designers should ensure the model eigen-periods come far from those environmental periods. 4.2 Eigen-value analysis for OJWT Figure 4.1 JacketWT Model in USFOS Figure 4.2 Displayed natural periods As described previously, the jacket substructure with tubular tower neglecting wind turbine will be applied for further analysis. Thus the wind turbine sitting on top of the
35 22 tower is modeled as a point mass in USFOS. However, in order to identify the eigenmodes of both the jacket sub-structure and the blades of wind turbine, eigen-value analysis is performed for the entire model including full-blade wind turbine, tubular tower, and jacket sub-structure, as showed in Figure 4.1. The program USFOS-VPOne is used for eigen-value analysis of full-blade jacket wind turbine. The number of eigen-modes for identification can be defined in input files according to our needs. A list of natural periods of this JacketWT model is shown in Figure 4.2. For our entire OJWT model including five-layer jacket substructure, tubular tower and full-blade wind turbine, 30 eigen-modes are calculated to include the global modes, the blade modes and the modes related to jacket braces. The eigen-periods of 70 meters water depth OJWT are tabulated as below: Table 4.1 Eigen values of JacketWT model Eigen-mode Eigen-period Eigen-mode Eigen-period Eigen-mode Eigen-period 1 st th st nd th nd rd th rd th th th th th th th th th th th th th th th th th th th th th From Table 4.1 we observe that the first eigen-period is seconds. It is far from typical wave periods. This means for normal wave loads, the structure resonance seldom happens. However, it is still necessary to consider the eigen-modes to understand possible structure vibrations. All the eigen-periods calculated above are animated in USFOS to identify the global modes, the blade modes, the modes related to jacket braces, and the higher order modes as well. Some representative eigen-mode movements of OJWT are showed below.
36 23 Figure 4.2 The first, second and fifteenth eigen modes of JacketWT Figure 4.3 shows the movements of jacket wind turbine in the first, second, and fifteenth eigen modes. The same displacement scaling factor of 20 is used to amplify the movements. The JacketWT is oscillating globally in the first eigen period, with the wind turbine and tubular tower move together in x-direction, while the jacket substructure keeps stationary. The second eigen mode is also a global mode, the same as the first one but oscillate in y-direction. The first eigen mode is fore-aft bending mode of the whole structure, while the second one is side-to-side bending mode of the whole structure. The fifteenth eigen mode is global bending of JacketWT about x-axis. And in this mode the jacket substructure oscillates together with the bending of the tubular tower and wind turbine instead of keeping stationary in the first and second eigen mode. Figure 4.4 shows the movements of JacketWT in the 17 th, 18 th, and 19 th eigen period, with a same displacement scaling factor of 10. For these three modes, all the oscillationgs are located locally on jacket braces. The horizontal braces at the bottom layer oscillate in z-direction in the 17 th eigen period, vibrating up and down while the other components of the jacket structure keep stationary. For the 18 th eigen-mode, the
37 24 vertical braces at the bottom layer oscillate in x-direction, and the movements of opposite braces are symmetrical with opposite direction. The braces in the second storey are also oscillating, but that is passive motions due to movements of first layer braces, instead of active vibration from themselves. For the 19 th eigen-mode, the vertical braces at the bottom layer oscillate with the same direction of motion in y-direction. Figure 4.3 the 17 th, 18 th, and 19 th eigen mode of JacketWT Moreover, some more modes with blade motions are showed in the following figures. In figure 4.5 the third and thirtieth eigen mode of JacketWT is showed. The displacements are amplified by using the same scaling factor of 20. It is observed that these two are blade modes with the left and right blades of wind turbine oscillating in x-direction while the tubular tower and jacket substructure keep stationary. The left and right blades are vibrating in opposite directions in both modes. The difference between the third and thirtieth eigen mode is that the later one is a second order mode since a entire wave shape is generated on the blade. It is worth noting that the third mode is a torsion mode, with torsion moment about Z-axis.
38 25 Figure 4.4 the third and thirtieth eigen mode of JacketWT What s more, another three modes with blade motions are figured below in Figure 4.6. We find that both the fourth and the sixth eigen modes are flap-wise modes. The difference between these two modes is for the later one, all the three blades are oscillating in the same direction, while for the fourth mode, the top blade is oscillating in the direction opposite to the other two. On the contrary, the seventh eigen mode is a edge-wise mode. The difference between flap-wise and edge-wise modes can be easily observed in Figure 4.6. All the displacements in Figure 4.6 are amplified with the same scaling factor of 20.
39 26 Figure 4.5 the fourth, sixth and seventh eigen mode of JacketWT

40 27 5. Hydrodynamic Analysis By hydrodynamic analysis, the regular wave loads with different wave theories are compared, including: linear wave theory, linear wave theory with Wheeler stretching, Stoke s 5 th order wave theory and stream function wave theory. Since only wave loads are considered in this chapter, the simplified node-mass model with complete jacket substructure will be applied for analysis. 5.1 Analysis Set-up As introduced in Chapter 2, four types of wave theories are applied in USFOS. The wave type and regular wave parameters are specified in USFOS Analysis Control files, as shown in Figure 5.1: Figure 5.1 Example of hydrodynamic analysis set-up In USFOS, the wave types are defined as following: - Wave Type 1: Extrapolated Airy theory; - Wave Type 1.1: Stretched Airy theory; - Wave Type 2: Stoke s 5 th order wave theory - Wave Type 4: Stream Function theory For comparison we define three load cases in this chapter: H =3m, T =10s; H=5m, T =12s; and an extreme wave condition with H =10m, T =14s will also be considered herein. For all the cases the waves are propagating in positive y-direction. To compare the results for different wave theories, we will focus on the surface elevation and structural reaction forces for each case. Thus we specify global
41 28 quantities including wave elevation and reaction forces to be saved every time step during the dynamic analysis, as showed also in Figure Results and Discussion The analysis results are stored in DYN files, and by creating dynamic plot in USFOS, the time-series wave elevation, global reaction forces in global X, Y, Z direction, the reaction moments about global X, Y axis, and local element forces can all be plotted. The plots can be saved as TXT files, and then imported to Matlab to process. For each load case, the maximum and minimum values of surface elevations, reaction forces in global Y-direction, reaction moments about global X axis, and the axial forces for a selected brace (Element 1254) are compared for four wave theories, as tabulated in Table The time-series curves are plotted, see the following figures. To make the figures more clear, the results within only 30 seconds time period is extracted from the whole time series Regular wave analysis results for load case H=3m, T=10s Figure 5.2: H3T10 Surface elevation
42 29 Figure 5.3: H3T10 Reaction Y-comp Figure 5.4: H3T10 Reaction X-moment
43 30 Figure 5.5: H3T10 Element1254 Axial force Table 5.1 Results and comparison for load case h=3m, t=10s Surface Elevation Reaction Y-component Reaction X-moment Element Force Element 1254 Dof 1 Wave theory Maximum Value Percentage Minimum Value Percentage Airy-Extr % % Airy-Stret % % Stoke s 5 th % % Stream Func % % Airy-Extr E % E % Airy-Stret E % E % Stoke s 5 th E % E % Stream Func E % E % Airy-Extr E % E % Airy-Stret E % E % Stoke s 5 th E % E % Stream Func E % E % Airy-Extr E % E % Airy-Stret E % E % Stoke s 5 th E % E % Stream Func E % E %
44 31 From Figure 5.2 we observe that for load case H=3, T=10, the wave heights of four wave theories are all around 3m, and the wave periods are 10s, which can be used to judge if the input parameters in analysis set up are correct or not. By comparison, the Extrapolated Airy theory and the Stretched Airy theory almost give the same results for surface elevation, while the Stream Function theory and Stoke s 5 th order wave theory almost give the same results. The difference between the first two and last two theories is not quite large, but can be distinguished. The higher order wave theories give larger give wave crests which are larger than wave troughs, while linear wave theories give the same wave crests as wave troughs. The global reaction forces and moments, axial forces in element member are cannot be distinguished in Figure due to tiny difference. But the differences can be observed when referring to the results in Table 5.1. The results of Stream Function theory are selected to be references, since it has a broader validity and might be more accurate. The results of other theories are compared with Stream Function theory. For global reactions, except the Stretched Airy theory gives relatively small peak values, the other two wave theories give slightly larger results than Stream Function theory. For axial force in Element 1254, all the other three wave theories give larger peak values and smaller valley values than Stream Function theory Regular wave analysis results for load case H=5m, T=12s
45 32 Figure 5.6: H5T12 Surface Elevation Figure 5.7: H5T12 Reaction Y-comp Figure 5.8: H5T12 Reaction X-moment
46 33 Figure 5.9: H5T12 Element1254-Axial force Table 5.2 Results and comparison for load case h=5m, t=12s Surface Elevation Reaction Y-component Reaction X-moment Element Force Element 1254 Dof 1 Wave theory Maximum Value Percentage Minimum Value Percentage Airy-Extr % % Airy-Stret % % Stoke s 5 th % % Stream Func % % Airy-Extr 3.98E % -4.02E % Airy-Stret 4.03E % -3.97E % Stoke s 5 th 4.04E % -4.09E % Stream Func. 4.03E % -4.07E % Airy-Extr 1.59E % -1.52E % Airy-Stret 1.54E % -1.55E % Stoke s 5 th 1.61E % -1.53E % Stream Func. 1.60E % -1.53E % Airy-Extr -3.01E % -1.61E % Airy-Stret -3.48E % -1.61E % Stoke s 5 th -1.76E % -1.61E % Stream Func E % -1.61E %
47 34 From Figure 5.6 we observe that for load case H=5, T=12, the wave heights of four wave theories are all 5m, and the wave periods are around 12s, which proves that the input parameters in analysis set up are correct. The same as results for last load case, the Extrapolated Airy theory and the Stretched Airy theory almost give the same results for surface elevation, while the Stream Function theory and Stoke s 5 th order wave theory almost give the same results. But the difference between the first two and last two theories is larger when compared with the load case of H=3, T=10. The higher order wave theories give larger give wave crests which are larger than wave troughs, while linear wave theories give the same wave crests as wave troughs. It can be observed from Figure that the differences between global reaction forces and moments, axial forces in element member are larger compared to those of last load case. Refer to the results in Table 5.2, Stoke s 5 th order wave theory gives larger global reaction forces and moments than Stream Function theory. Both Extrapolated and Stretched Airy theory give smaller peak values for global reactions Regular wave analysis results for load case H=10m, T=14s Figure 5.10: H10T14 Surface Elevation
48 35 Figure 5.11: H10T14 Reaction Y-comp Figure 5.12: H10T14 Reaction X-moment
49 36 Figure 5.13: H10T14 Element1254-Axial force Table 5.3 Results and comparison for load case h=10m, t=14s Surface Elevation Reaction Y-component Reaction X-moment Element Force Element 1254 Dof 1 Wave theory Maximum Value Percentage Minimum Value Percentage Airy-Extr % % Airy-Stret % % Stoke s 5 th % % Stream Func % % Airy-Extr 8.72E % -9.33E % Airy-Stret 9.13E % -8.91E % Stoke s 5 th 8.76E % -9.97E % Stream Func. 8.77E % -9.72E % Airy-Extr 3.77E % -3.27E % Airy-Stret 3.50E % -3.48E % Stoke s 5 th 4.04E % -3.24E % Stream Func. 3.95E % -3.24E % Airy-Extr 1.08E % -2.62E % Airy-Stret 1.08E % -2.62E % Stoke s 5 th 1.33E % -2.52E % Stream Func. 1.31E % -2.52E %
50 37 This load case with wave height of 10m, wave period of 14s is quite an extreme wave condition. Obviously the difference between results for four wave theories are significant larger than previous load cases. Thus it s much easier for us to compare and summarize some disciplines from the results in this extreme wave condition. From Figure 5.11 we observe that the wave heights of four wave theories are all 10m, and the wave periods are around 14s, which gives us an indication that the input parameters in analysis set up are correct. The same as results for previous two load cases, the Extrapolated Airy theory and Stretched Airy theory give exactly the same results for surface elevation, while the Stream Function theory and Stoke s 5 th order wave theory almost give the same results. The difference between results of the first two and last two theories is much larger than previous load cases. The higher order wave theories give larger give wave crests which are larger than wave troughs, while linear wave theories give the same wave crests as wave troughs. According to Figure 5.12 and Figure 5.13, the differences between global reactions are more significant. The results for peak values of global reaction moments (see Figure 5.13) and the valley values of global reaction forces (see Figure 5.14) follow the same disciplines between four wave theories, which is, Stoke s 5 th order wave theory gives larger reactions than Stream Function theory, while Airy theories give smaller ones, and reactions for Stretched Airy waves are smaller than for Extrapolated Airy waves. 5.3 Conclusion In this chapter three load cases are selected to compare the wave loads with four different wave theories, among which the extreme wave condition gives the most significant differences. Extrapolated Airy theory and Stretched Airy theory give exactly the same surface elevations, with wave crests and wave troughs values being equal. Stream Function theory and Stoke s 5 th order wave almost give the same surface elevations, with wave crests larger than wave troughs. The global reactions for four wave theories follow this discipline: Stoke s 5 th order wave theory > Stream Function theory > Extrapolated Airy theory > Stretched Wave theory. Therefore, for extreme wave conditions the linear wave theories are not recommended since they will under-estimate the structural reactions. In this case, the higher order wave theories are recommended.
51 38 6. Dynamic Response Analysis of OJWT under Wind and Wave Loads 6.1 General Dynamic response analysis of offshore structures needs to consider environmental loads induced by wind, waves and currents. Compared with offshore oil and gas platforms, the wind load effects are more significant than waves for OWT due to its large dimension blades. Thus, it s necessary to estimate both aerodynamic and hydrodynamic loads accurately for structural response analysis of OWT. There are some academic and commercial computer programs used for blade aerodynamics, such as HAWC2, FAST and BLADED [1]. For hydrodynamic analysis of offshore jacket structures, there are more computer codes applicable, such as USFOS. However, it seems that up till now there isn t any efficient analysis tool for complex sub-structures like jacket when considering combined wind and wave loads. Therefore, aerodynamic software and hydrodynamic one are combined to obtain the structural responses. The combination of aerodynamic and hydrodynamic analysis can be done in a coupled analysis, by communicating two computer programs at each time step. But for time domain simulations, especially for long term fatigue analysis, this method is really time-consuming. In contract, decoupled analysis method cost much less time, meanwhile it has been proved to give very accurate responses under the condition if the natural period of the structure is far smaller than wave input period. This has been validated by the work of Seidel et al. (2004, 2009), Gao et al. (2010) [1]. According to the results of eigen value analysis in Chapter 4, the first eigen period is seconds, far less than the typical wave period. Thus, the decoupled analysis method is applicable for further analysis in this thesis. In decoupled analysis, the wind forces acting on the nacelle are estimated in HAWC2, by using a simplified equivalent beam model, as described in Chapter 3. Then these forces are imported to USFOS. Since this thesis mainly focus on the jacket substructure, the model in USFOS is also simplified, only including the complete jacket structure with tower, as described in
52 39 Chapter 3, and the wind turbine sitting on top of the tower is modeled by a point mass. The results of aerodynamic forces from HAWC2 are imported to USFOS and acting on this point mass as external forces, to estimate the structural responses together with wave loads. First of all, extensive time-domain simulations will be carried out in USFOS to get the forces and moments of jacket braces under wind and wave loads. Then we need to perform post-processing, to read the time series from.dyn files with separate wind and wave result, sum up the members forces from these two analyses and calculate the stress using a linear combination of member forces. Fatigue is also a focus for this thesis, and hot spot stress is calculated. However, only the time series and statistics of the hot spot stress are compared, since there are many different load cases, meanwhile, both the simulations and the post-processing are quite time consuming. 6.1 Environmental Conditions Load Cases Based on Previous Study for Fatigue Analysis Wind Conditions: According to Dong s previous study, the fatigue damage of the wind turbine in operational condition is mainly considered, the range of 1-hour mean wind speed U w is 6m/s-24m/s with an increment of 2m/s; the range of significant wave height H s is 2m-9m, with an increment of 1m; the range of spectral peak period T p is 8s-16s with an increment of 2s [2]. For wind loads, a turbulence intensity of wind is taken as Here the turbulence intensity, I, is defined as Where, is the mean wind speed within 10 minutes;
53 40 is the standard deviation of the wind speed within the 10 minute time series Combined Wind and Wave Conditions In our thesis, fatigue is also a focus and hot spot stress will be calculated. Thus, we will choose the extreme environmental condition corresponding to the maximum contribution to fatigue damage according to Dong s work, which is a combination of wind load with U w =20m/s, I =0.15, and wave load with H s =5m, T p = 20s, as one of our load cases. To be compared, another representative environmental condition with a combination of wind speed U w =12m/s, significant wave height H s =3m, T p =10s is also to be investigated. Therefore, there are totally different combinations of U w, H s, and T p considered in his work. And results show that maximum contribution to fatigue damage is identified to have a wind speed of 20m/s, a significant wave height of 5m, and spectral peak period of 12s Wind/Wave Directions In addition, environmental conditions with wind and wave loads come from different directions will be mainly considered in this thesis. This is based on the requirement from NORSK standard N-004, 2004 [6], which mentions that for offshore oil and gas platforms, the deterministic fatigue analysis should be based on minimum eight wave propagation directions in the detailed design phase, as showed in Figure 6.1. The necessity of this requirement due to the possibility that different combinations of load directions might result in quite different effects on spaced frame structures like jackets with beams having different orientations.
54 41 Figure 6.1 Sketch of eight wave propagation directions The above eight wave propagation directions are firstly combined with the same wind propagation direction of 90 degree (in y-direction). Besides, an extra wind direction of 135 degree will also be considered, and in this case the corresponding combined wave direction will be 135 (with wind and wave coming from the same direction), 165,180 and 225 degree. The purpose is to investigate the effect of hydrodynamic loads on side-to-side vibration of the whole structure where aero dynamic damping is very small. All the environmental conditions including turbulent wind and irregular waves are summarized and listed in Table 6.1 below: Table 6.1 Defined environmental conditions for dynamic response analysis Wind Wave U w I Direction H s T p Direction , 120, 135, , 120, 135, , 165, 180, , 165, 180, Time-domain Simulations In this thesis, the dynamic response analysis for OWT is performed in time domain, using decoupled analysis method as introduced previously in Section 6.1. For turbulent wind loads, the blade momentum theory (BEM) is used. For wave loads, the
55 42 Morison equation is applied. The structural response due to wave and wind loading is calculated separately for each simulation. The time step for each simulation is set to be 650s, with 50s cut-in. And totally 10 simulations are carried out for each load case to obtain the statistics Joints in USFOS Model For an offshore jacket structure, the number of brace elements is quite large. However, not every element needs to be concerned. To over concern about the not necessary elements will waste a lot of computing time as well as occupy too much saving space in a computer, especially for time domain simulations. Therefore, we only focus on those element members connected with particular tubular joints which are main focuses in further analysis. Figure 6.2 Selected tubular joints with different types and locations As showed in Figure 6.2, four typical joints of the 70-meter jacket substructure are selected for analysis, representing different characteristics regarding configuration,

56 43 geometry and location. They are named as Leg1-Joint2, Leg1-Joint3, Leg2-Joint2, Sur12-Joint1, respectively. As we can see they totally include three types of tubular joints: both Leg1-Joint2 and Leg 1-Joint3 are DK joints, symmetrical about the XZ-plane; Leg1-Joint3 is DKT joint, and Sur12-Joint1 is X joint. The element members connected with these joints are specified in USFOS analysis control files, as showed in Figure 6.3. The element forces for these concerned members will be calculated and saved every time step during the simulations. Figure 6.3 Defined Element Forces in USFOS Analysis Control Files In decoupled analysis, wind and wave simulations will be carried out separately. For only wave simulations, the wind speed is set to be equal to zero in analysis control files, the JONSWAP spectrum is applied for irregular waves, with six different wave propagating directions (90, 120, 135, 165, 180, and 225 degrees) for two sea states (H s =3s, T p =10m; H s =5s, T p =12m) specified in USFOS analysis control files. For only wind simulations, the wave parameters are set to 0. The aerodynamic forces and moments at the nacelle shaft are simulated in HAWC2 in time series. Then these time-series forces are imported to USFOS and taken as external loads acting on point mass with six degrees of freedom on top of the tubular tower. And different wind propagating directions (90 and 135 degrees) will be considered with two different mean wind speed of 12m/s and 20 m/s, respectively. For each simulation, the simulating time is taken as 650 seconds, of which the first 50 seconds will be discarded due to unstable condition at the beginning of simulation, and the rest 10 minutes will be used to represent a 3-hour steady sea state, as required by DNV OS-J101, 2010 [14]. For each load case, 10 simulations are run to reduce the statistical uncertainties.

57 Results of Element Forces There are totally 16 load cases (12 load cases for only wave simulation and 4 wind load cases), and for each case 10 simulations are carried out. Therefore we will not present all the results here because the hot spot stress will be out main concern, and the final results after post-processing will be given out in Section 6.3. Here we only take one example to show the force results of Element 1243 in the first simulation. Both the results under wave loading with a H s =5, T p =12 propagating in 90 degrees, and wind load with speed of 12m/s propagating in 90 degrees will be showed for elementary comparison. Figure 6.3 Highlighted Element 1243 in USFOS Xact The specified element 1243 is highlighted in USFOS XACT, as showed above in Figure 6.3. By creating a dynamic plot, all the element forces defined in analysis control files can be showed in either time domain or frequency domain. The results of Element Force Element 1243 are plotted as time series and showed in the following figures, in 6 degrees of freedom (Units: Time [s], Element Forces [N]).


58 45 Figure 6.4 Element Forces of Element 1243 in 6-dofs under wave load of Hs=5, Tp=12 propagating in 90 degrees


59 46 Figure 6.5 Figure 6.4 Element Forces of Element 1243 in 6-dofs under wind load of U w =12m/s propagating in 90 degrees

60 Comparison of Wind and Wave Load Effects To compare the wind load effect with wave, these plots of time series forces can be saved as.txt file, which could be read by Matlab code and then plotted in Matlab. Take the element force of the first d.o.f. for Element 1243 in the first simulation as an example, as showed below in Figure 6.6: Figure 6.6 Comparison for wind and wave load effects on Element 1243 In Figure 6.6, the wave load effect is due to a sea state of H s =5, T p =12 propagating in 90 degrees, which is an extreme wave loading condition according to previous study. In contract, the wind load effect is caused by a wind condition with mean wind speed of 12m/s, which is a relatively moderate wind loading condition. However, we observe that the element force due to moderate wind load is nearly two times of those due to extreme wave load. This means that the wind load effect on jacket foundation of OJWT is much stronger than wave loads. What s more, we can also find that the variance of the response due to wind is much larger than that due to wave. This means wind load will have more contribution to structure fatigue damage than wave loads.
61 48 7. Stress Analysis of Jacket Joints In Chapter 6, totally 160 simulations are done for 16 different load cases in USFOS. The results of element forces for specified element members connected with typical tubular joints are saved in DYN-files. However, it s not easy to compare the results with DYN-files in USFOS, especially when there are a lot of different load cases with a large amount of defined brace elements in each case. Therefore, to perform post-processing for previous results of dynamic response analyses is quite necessary. We use a Matlab-code to read those time series from DYN-files, and rewrite them into DAT-files, which could be easily read and dealt with for further analysis. What s more, besides reading the time series from DYN-files with separate wind and wave results, this Matlab-code will also sum up the members forces from these two analyses and calculate the hot spot stress using a linear combination of member forces. On one hand, through calculating hot spot stress, some critical points which will suffer the most cumulative fatigue damage can be chosen among all the saddle/crown points on tubular joints for comparison. These points are limited, but representative. And compared with the brace forces in all the elements connected with tubular joints, to analyze the results for critical points will reduce the workload to a great extent. On the other hand, the results for hot spot stress of critical points could also be applied to long-term fatigue damage analysis for future work. Therefore, the hot spot stress for critical points under different environmental conditions will be calculated and analyzed statistically in this chapter. It is noteworthy that fatigue is also a focus for this thesis, and hot spot stresses are calculated, however, only the time series and statistics of the hot spot stresses are compared since there are many different load cases, meanwhile, for each load case both the simulations and the post-processing are quite time consuming. 7.1 Hot Spot Stress Calculation The hot spot stress analysis method is one of the approaches for fatigue analysis of welded joints. Based on previous experience from offshore oil and gas industry, in a jacket support structure, most cumulative fatigue damage happens at weld toes at tubular intersections. That is the reason why 4 tubular joints (refer to Figure 6.2) are selected for dynamic response analysis or further analysis for fatigue, as previously described in Section
 for each tubular joint are calculated to obtain the cumulative fatigue damage at these points.")
62 Selection of Critical Points In previous study, hot spot stresses at the brace toe and brace saddle locations of each brace-chord intersection (see Figure 7.1) for each tubular joint are calculated to obtain the cumulative fatigue damage at these points. Then the results of cumulative fatigue damage are compared for all points in each joint, to get the critical one with most cumulative damage. Figure 7.1 Locations of hot-spot stress around the brace-chord intersection [2] Figure 7.2 Critical hot spot location for four tubular joints In this thesis, the critical points for hot spot stress calculation will be selected according to previous work carried out by Dong, However, in his paper only the
63 50 load cases with wind and wave directions both along the positive direction of y axis are considered (i.e. wind 90 degrees, wave 90 degrees corresponding to our definition of load cases as showed in Table 6.1). In this thesis the wind and wave loads coming from different direction will be a focus. Therefore, the location of critical points might change because of the effect of load direction on spaced jacket braces. We will discuss about the direction effects with more detailed results later in this chapter. The selected critical points are showed in Figure Method and Procedures Hot spot stresses at the four selected points L1J2B1P1, L1J3B2P4, Sur12J1B1P2, and L2J2B1P1 (refer to Figure 7.2) are calculated based on linear superposition principle, to sum up contributions from all the member forces of braces connected with each tubular joint. The general expressions for linear combination of brace stresses are got from the work of Efthymiou, 1988, as expressed below []: n1 i C1 SCFAC SCFMIP my IFP AC i= 1 σ = σ + σ n 2 + IFNP AC σ j Aj cosφj sinθ j j= 1 i x (7.1) n1 n1 i i i i S 2 = SCFAS x SCFMOP mz + IFP AS x + IFP MOP σmz i= 1 i= 1 σ σ σ σ n 2 + IFNP AS σ j Aj cos 2φj sinθ j j= 1 (7.2) n1 i C3 = SCFAC x SCFMIP my + IFP AC i= 1 σ σ σ σ n 2 + IFNP AC σ j Aj cosφj sinθ j j= 1 (7.3) i x
64 51 n1 n1 i i i i S 4 = SCFAS x + SCFMOP mz + IFP AS x + IFP MOP σmz i= 1 i= 1 σ σ σ σ n 2 + IFNP AS σ j Aj cos 2φj sinθ j j= 1 (7.4) A mong which,, and are the maximum nominal stresses due to axial load and in-plane or out-of-plane bending at the brace end; is the stress concentration factor at the saddle for axial load; is the stress concentration factor at the crown; is the stress concentration factor for in plane moment; is the stress concentration factor for out of plane moment; and are nominal stresses due to axial load and bending out-of-plane at the i th planar brace end respectively; is the nominal stress due to axial load at the j th non-planar brace end. n 1 is the total number of other planar braces for the reference brace in each joint; n 2 is the total number of other non-planar braces for the reference brace in each joint; is the influence function at the saddle of the reference brace arising from a nominal stress of unit magnitude due to axial load acting on the ith planar brace of the joint; is the influence function at the crown; is the influence function at the saddle of the reference brace arising from a nominal stress of unit magnitude due to bending out-of-plane acting on the i th planar brace of the joint; is the influence function at the saddle of the reference brace arising from an
65 52 axial load of unit magnitude acting on all non-planar braces of the joint; is the influence function at the crown; is the cross section area of the j th non-planar brace. The definition of and is shown in Figure 7.3. Figure 7.3 Definitions of and in Eq. (7.1) [2] In these expressions, the calculation of all contributed stress components from braces is based on results of brace forces we got from dynamic response analysis in USFOS in Chapter 6, as showed in Figure Here we take Leg1-Joint2 as an example, see Figure 7.4. All the elements contributed to hot spot stress are highlighted. For each brace member, the results of brace forces in six degrees of freedom have been saved in DYN files and converted to DAT files by Matlab. So the nominal stress due to axial load and bending moment components are calculated as following basic formulas: σ F A (7.5) σ M W (7.6)


 (7.")
, with basic parameters tabulated")

66 53 Where, both F and M are time-series member forces we got from Chapter 6. A and W are the section properties defined in post-processing Matlab code for each brace. Figure 7.4 Contributed components for Leg1-Joint2 Table 7.1 Parameters for SCF calculation The stress concentration factors in Formula (7.1) (7.4) are determined by parametric formulas given by Efthymiou (1988), with basic parameters tabulated in Table 7.1. These parametric formulas for stress concentration factor calculation are also adopted by DNV-RP-C203 (2010), with the definition of relevant parameters is showed in Figure 7.5.
Offshore Wind Turbine monopile in 50 year storm conditions
 TMR7 Experimental methods in marine hydrodynamics - lab exercise 3 2017 Offshore Wind Turbine monopile in 50 year storm conditions Trygve Kristiansen and Erin Bachynski, Trondheim, 20.09.2017 Background
Computationally Efficient Determination of Long Term Extreme Out-of-Plane Loads for Offshore Turbines
 Computationally Efficient Determination of Long Term Extreme Out-of-Plane Loads for Offshore Turbines Anand Natarajan Senior Scientist Wind Energy Department, Risø DTU Denmark Introduction IEC 61400-1
EXPERIMENTAL INVESTIGATIONS OF BARGE FLOATER WITH MOONPOOL FOR 5 MW WIND TURBINE
 EXPERIMENTAL INVESTIGATIONS OF BARGE FLOATER WITH MOONPOOL FOR 5 MW WIND TURBINE 1 MR. G.VIJAYA KUMAR, 2 DR. R. PANNEER SELVAM 1 M.S. Research Scholar, Department of Ocean Engineering, IIT Madras, Chennai,
EXPERIMENTAL STUDY ON THE HYDRODYNAMIC BEHAVIORS OF TWO CONCENTRIC CYLINDERS
 EXPERIMENTAL STUDY ON THE HYDRODYNAMIC BEHAVIORS OF TWO CONCENTRIC CYLINDERS *Jeong-Rok Kim 1), Hyeok-Jun Koh ), Won-Sun Ruy 3) and Il-Hyoung Cho ) 1), 3), ) Department of Ocean System Engineering, Jeju
U S F O S B u o y a n c y And Hydrodynamic M a s s
 1 U S F O S B u o y a n c y And Hydrodynamic M a s s 2 CONTENTS: 1 INTRODUCTION... 3 2 ACCURACY LEVELS... 3 2.1 LEVEL-0... 3 2.2 LEVEL-1... 3 2.3 PANEL MODEL... 3 3 EX 1. SINGLE PIPE. NON FLOODED... 4
Feasibility study of a semi floating spar buoy wind turbine anchored with a spherical joint to the sea floor
 Feasibility study of a semi floating spar buoy wind turbine anchored with a spherical joint to the sea floor María Sanz Martínez DTU Wind Energy DK-4000 Roskilde, Denmark msma@dtu.dk Anand Natarajan DTU
RELATIVE CONTRIBUTION FROM WIND AND WAVES TO LOADS ON OFFSHORE WIND TURBINES
 RELATIVE CONTRIBUTION FROM WIND AND WAVES TO LOADS ON OFFSHORE WIND TURBINES Science Meets Industry Stavanger By Jørgen R. Krokstad WITH FOCUS ON SUPPORT STRUCTURES (with contributions from Loup Suja Thauvin
Catenary Mooring Chain Eigen Modes and the Effects on Fatigue Life
 Catenary Mooring Chain Eigen Modes and the Effects on Fatigue Life Tor Anders Nygaard and Jacobus de Vaal, IFE Morten Hviid Madsen and Håkon Andersen, Dr.techn Olav Olsen AS Jorge Altuzarra, Vicinay Marine
Tension-Leg-Buoy (TLB) Platforms for Offshore Wind Turbines
 Platforms for Offshore Wind Turbines") Tension-Leg-Buoy (TLB) Platforms for Offshore Wind Turbines EERA DeepWind'2014 Deep Sea Offshore Wind R&D Conference, Trondheim, 22-24 January 2014 Tor Anders Nygaard, Institute for Energy Technology (IFE),
Tension-Leg-Buoy (TLB) Platforms for Offshore Wind Turbines EERA DeepWind'2014 Deep Sea Offshore Wind R&D Conference, Trondheim, 22-24 January 2014 Tor Anders Nygaard, Institute for Energy Technology (IFE),
RELIABILITY ASSESSMENT, STATIC AND DYNAMIC RESPONSE OF TRANSMISSION LINE TOWER: A COMPARATIVE STUDY
 RELIABILITY ASSESSMENT, STATIC AND DYNAMIC RESPONSE OF TRANSMISSION LINE TOWER: A COMPARATIVE STUDY Yusuf Mansur Hashim M. Tech (Structural Engineering) Student, Sharda University, Greater Noida, (India)
A NOVEL FLOATING OFFSHORE WIND TURBINE CONCEPT: NEW DEVELOPMENTS
 A NOVEL FLOATING OFFSHORE WIND TURBINE CONCEPT: NEW DEVELOPMENTS L. Vita, U.S.Paulsen, T.F.Pedersen Risø-DTU Technical University of Denmark, Roskilde, Denmark luca.vita@risoe.dk Abstract: A novel concept
Wave Forces on a Moored Vessel from Numerical Wave Model Results
 Wave Forces on a Moored Vessel from Numerical Wave Model Results ABSTRACT P W O BRIEN OMC International Pty Ltd, Melbourne, Australia O WEILER WL Delft Hydraulics, Delft, The Netherlands M BORSBOOM WL
Aidin Kazemi Daliri, Sepanta Naimi*
 JER Manuscript Template 1 The fixed marine risers dynamic analysis with 1 st and 5 th order rogue wave Aidin Kazemi Daliri, Sepanta Naimi* Department of Civil Engineering, Specialty of Coastal Engineering,
Chapter 11 Waves. Waves transport energy without transporting matter. The intensity is the average power per unit area. It is measured in W/m 2.
 Energy can be transported by particles or waves: Chapter 11 Waves A wave is characterized as some sort of disturbance that travels away from a source. The key difference between particles and waves is
Comparison of coupled aero-hydro-servo-elastic simulations for floating wind turbines with model tests
 Comparison of coupled aero-hydro-servo-elastic for floating wind turbines with Georgios Chrysagis Delft University of Technology, The Netherlands Email: georgechrysagis@hotmail.com September 2016 Key words:
University of Bristol - Explore Bristol Research. Peer reviewed version. Link to published version (if available): /we.1812
: /we.1812") Arany, L., Bhattacharya, S., Macdonald, J. H. G., & Hogan, S. J. (2015). Simplified critical mudline bending moment spectra of offshore wind turbine support structures. Wind Energy, 18(12), 2171-2197.
Arany, L., Bhattacharya, S., Macdonald, J. H. G., & Hogan, S. J. (2015). Simplified critical mudline bending moment spectra of offshore wind turbine support structures. Wind Energy, 18(12), 2171-2197.
Wave Load Pattern Definition
 COMPUTERS AND STRUCTURES, INC., AUGUST 2010 AUTOMATIC WAVE LOADS TECHNICAL NOTE DEFINING WAVE LOADS This section describes how to define automatic wave loads. The automatic wave load is a special type
Wave Motion. interference destructive interferecne constructive interference in phase. out of phase standing wave antinodes resonant frequencies
 Wave Motion Vocabulary mechanical waves pulse continuous periodic wave amplitude period wavelength period wave velocity phase transverse wave longitudinal wave intensity displacement amplitude phase velocity
Application of pushover analysis in estimating seismic demands for large-span spatial structure
 28 September 2 October 2009, Universidad Politecnica de Valencia, Spain Alberto DOMINGO and Carlos LAZARO (eds.) Application of pushover analysis in estimating seismic demands for large-span spatial structure
Quantification of the Effects of Turbulence in Wind on the Flutter Stability of Suspension Bridges
 Quantification of the Effects of Turbulence in Wind on the Flutter Stability of Suspension Bridges T. Abbas 1 and G. Morgenthal 2 1 PhD candidate, Graduate College 1462, Department of Civil Engineering,
WAVE MECHANICS FOR OCEAN ENGINEERING
 Elsevier Oceanography Series, 64 WAVE MECHANICS FOR OCEAN ENGINEERING P. Boccotti Faculty of Engineering University of Reggio-Calabria Feo di Vito 1-89060 Reggio-Calabria Italy 2000 ELSEVIER Amsterdam
CFD development for wind energy aerodynamics
 CFD development for wind energy aerodynamics Hamid Rahimi, Bastian Dose, Bernhard Stoevesandt Fraunhofer IWES, Germany IEA Task 40 Kick-off Meeting 12.11.2017 Tokyo Agenda BEM vs. CFD for wind turbine
THEORETICAL FORMULAE FOR WAVE SLAMMING LOADS ON SLENDER CIRCULAR CYLINDERS AND APPLICATION FOR SUPPORT STRUCTURES OF WIND TURBINES
 THEORETICAL FORMULAE FOR WAVE SLAMMING LOADS ON SLENDER CIRCULAR CYLINDERS AND APPLICATION FOR SUPPORT STRUCTURES OF WIND TURBINES JAN WIENKE jwie@gl-group.com, Germanischer Lloyd, Vorsetzen 35 20459 Hamburg,
A comprehensive method for the structural design and verification of the INNWIND 10MW tri-spar floater
 NATIONAL TECHNICAL UNIVERSITY of ATHENS (NTUA) A comprehensive method for the structural design and verification of the INNWIND 10MW tri-spar floater DI Manolas, CG Karvelas, IA Kapogiannis, VA Riziotis,
Chapter # 08 Waves. [WAVES] Chapter # 08
![Chapter # 08 Waves. [WAVES] Chapter # 08](/thumbs/94/121079132.jpg "Chapter # 08 Waves. [WAVES] Chapter # 08") Chapter # 08 Waves Q2) Write short answers of the following questions. i) What is the difference between progressive and stationary waves? Answer: Progressive Waves 1 Progressive waves are the result of
Chapter # 08 Waves Q2) Write short answers of the following questions. i) What is the difference between progressive and stationary waves? Answer: Progressive Waves 1 Progressive waves are the result of
INSTRUMENT INSTRUMENTAL ERROR (of full scale) INSTRUMENTAL RESOLUTION. Tutorial simulation. Tutorial simulation
 INSTRUMENTAL RESOLUTION. Tutorial simulation. Tutorial simulation") Lab 1 Standing Waves on a String Learning Goals: To distinguish between traveling and standing waves To recognize how the wavelength of a standing wave is measured To recognize the necessary conditions
Lab 1 Standing Waves on a String Learning Goals: To distinguish between traveling and standing waves To recognize how the wavelength of a standing wave is measured To recognize the necessary conditions
Numerical Simulation of Wave Loads on Static Offshore Structures
 Numerical Simulation of Wave Loads on Static Offshore Structures Hrvoje Jasak, Inno Gatin, Vuko Vukčević Wikki Ltd, United Kingdom Faculty of Mechanical Engineering and Naval Architecture University of
RESOURCE DECREASE BY LARGE SCALE WIND FARMING
 ECN-RX--4-14 RESOURCE DECREASE BY LARGE SCALE WIND FARMING G.P. Corten A.J. Brand This paper has been presented at the European Wind Energy Conference, London, -5 November, 4 NOVEMBER 4 Resource Decrease
Waves. harmonic wave wave equation one dimensional wave equation principle of wave fronts plane waves law of reflection
 Waves Vocabulary mechanical wave pulse continuous periodic wave amplitude wavelength period frequency wave velocity phase transverse wave longitudinal wave intensity displacement wave number phase velocity
Study of Passing Ship Effects along a Bank by Delft3D-FLOW and XBeach1
 Study of Passing Ship Effects along a Bank by Delft3D-FLOW and XBeach1 Minggui Zhou 1, Dano Roelvink 2,4, Henk Verheij 3,4 and Han Ligteringen 2,3 1 School of Naval Architecture, Ocean and Civil Engineering,
Modelling and Simulation of Environmental Disturbances
 Modelling and Simulation of Environmental Disturbances (Module 5) Dr Tristan Perez Centre for Complex Dynamic Systems and Control (CDSC) Prof. Thor I Fossen Department of Engineering Cybernetics 18/09/2007
Lesson 14: Simple harmonic motion, Waves (Sections )
") Circular Motion and Simple Harmonic Motion The projection of uniform circular motion along any ais (the -ais here) is the same as simple harmonic motion. We use our understanding of uniform circular motion
Circular Motion and Simple Harmonic Motion The projection of uniform circular motion along any ais (the -ais here) is the same as simple harmonic motion. We use our understanding of uniform circular motion
Aalborg Universitet. Published in: Proceedings of Offshore Wind 2007 Conference & Exhibition. Publication date: 2007
 Aalborg Universitet Design Loads on Platforms on Offshore wind Turbine Foundations with Respect to Vertical Wave Run-up Damsgaard, Mathilde L.; Gravesen, Helge; Andersen, Thomas Lykke Published in: Proceedings
Evaluation of aerodynamic criteria in the design of a small wind turbine with the lifting line model
 Evaluation of aerodynamic criteria in the design of a small wind turbine with the lifting line model Nicolas BRUMIOUL Abstract This thesis deals with the optimization of the aerodynamic design of a small
COUPLED DYNAMIC ANALYSIS OF MOORING LINES FOR DEEP WATER FLOATING SYSTEMS
 Proceedings of International Conference in Ocean Engineering, ICOE Proceedings 2009 of ICOE 2009 Coupled Dynamic Analysis IIT Madras, of Chennai, Mooring India. Lines for Deep Water Floating Systems 1-5
The Influence of Ocean Surface Waves on Offshore Wind Turbine Aerodynamics. Ali Al Sam
 The Influence of Ocean Surface Waves on Offshore Wind Turbine Aerodynamics Ali Al Sam What I m going to wear today? Do I need to leave early to get to work? Taking buss or riding bike? Where will we drink
SuperGen UK Centre for Marine Energy Research Progress Meeting 2018
 SuperGen UK Centre for Marine Energy Research Progress Meeting 2018 Extreme loads and survivability Cameron Johnstone, Stephanie Ordonez-Sanchez, Song Fu and Rodrigo Martinez Energy Systems Research Unit,
Control of surge and pitch motions of a rectangular floating body using internal sloshing phenomena. Minho Ha and *Cheolung Cheong 1)
") Control of surge and pitch motions of a rectangular floating body using internal sloshing phenomena Minho Ha and *Cheolung Cheong 1) School of Mechanical Engineering, PNU, Busan 609-735, Korea 1) ccheong@pusan.ac.kr
Control of surge and pitch motions of a rectangular floating body using internal sloshing phenomena Minho Ha and *Cheolung Cheong 1) School of Mechanical Engineering, PNU, Busan 609-735, Korea 1) ccheong@pusan.ac.kr
INTERNATIONAL JOURNAL OF CIVIL AND STRUCTURAL ENGINEERING Volume 1, No 4, 2010
 Effect of geometric dimensions on the transmission coefficient of floating breakwaters Mohammad Hosein Tadayon, Khosro Bargi 2, Hesam Sharifian, S. Reza Hoseini - Ph.D student, Department of Civil Engineering,
SUBPART C - STRUCTURE
 SUBPART C - STRUCTURE GENERAL CS 23.301 Loads (a) Strength requirements are specified in terms of limit loads (the maximum loads to be expected in service) and ultimate loads (limit loads multiplied by
REVISITING GLOBAL RESPONSE OF FPSOS IN SHALLOW WATER AND THE RISER ANALYSIS REQUIREMENTS
 REVISITING GLOBAL RESPONSE OF FPSOS IN SHALLOW WATER AND THE RISER ANALYSIS REQUIREMENTS AMIR H. IZADPARAST SENIOR RESEARCH ENGINEER, HYDRODYNAMICS AND MOORING TECHNOLOGY, SOFEC JIAXING CHEN RESEARCH ENGINEER,
INSIGHT INTO THE UNSTEADY AERODYNAMICS OF FLOATING WIND TURBINES WITH TENSION LEG PLATFORMS (TLP) USING A BLADE ELEMENT MOMENTUM (BEM) BASED MODEL
 USING A BLADE ELEMENT MOMENTUM (BEM) BASED MODEL") HEFAT212 9 th International Conference on Heat Transfer, Fluid Mechanics and Thermodynamics 16 18 July 212 Malta INSIGHT INTO THE UNSTEADY AERODYNAMICS OF FLOATING WIND TURBINES WITH TENSION LEG PLATFORMS
HEFAT212 9 th International Conference on Heat Transfer, Fluid Mechanics and Thermodynamics 16 18 July 212 Malta INSIGHT INTO THE UNSTEADY AERODYNAMICS OF FLOATING WIND TURBINES WITH TENSION LEG PLATFORMS
APPLICATION OF PUSHOVER ANALYSIS ON EARTHQUAKE RESPONSE PREDICATION OF COMPLEX LARGE-SPAN STEEL STRUCTURES
 APPLICATION OF PUSHOVER ANALYSIS ON EARTHQUAKE RESPONSE PREDICATION OF COMPLEX LARGE-SPAN STEEL STRUCTURES J.R. Qian 1 W.J. Zhang 2 and X.D. Ji 3 1 Professor, 3 Postgraduate Student, Key Laboratory for
International Journal of Scientific & Engineering Research, Volume 7, Issue 10, October ISSN
 International Journal of Scientific & Engineering Research, Volume 7, Issue 10, October-2016 172 DYNAMIC ANALYSIS OF MINI TENSION LEG PLATFORMS UNDER RANDOM WAVES Shibin P Shaji, Dr. Jayalekshmi R. Abstract
Analysis and Research of Mooring System. Jiahui Fan*
 nd International Conference on Computer Engineering, Information Science & Application Technology (ICCIA 07) Analysis and Research of Mooring System Jiahui Fan* School of environment, North China Electric
Parametric Investigation of Dynamic Characteristics of Mooring Cable of Floating-type Offshore Wind Turbine
 The 0 World Congress on Advances in Civil, Environmental, and Materials Research (ACEM ) Seoul, Korea, August 6-30, 0 Parametric Investigation of Dynamic Characteristics of Mooring Cable of Floating-type
Finite Element Modal Analysis of Twin Ball Screw Driving Linear Guide Feed Unit Table
 2016 3 rd International Conference on Mechanical, Industrial, and Manufacturing Engineering (MIME 2016) ISBN: 978-1-60595-313-7 Finite Element Modal Analysis of Twin Ball Screw Driving Linear Guide Feed
DETRMINATION OF A PLUNGER TYPE WAVE MAKER CHARACTERISTICE IN A TOWING TANK
 The 9 th International Conference on Coasts, Ports and Marine Structures (ICOPMAS 2010) 29 Nov.-1 Dec. 2010 (Tehran) DETRMINATION OF A PLUNGER TYPE WAVE MAKER CHARACTERISTICE IN A TOWING TANK sayed mohammad
Airy Wave Theory 2: Wave Orbitals and Energy. Compilation of Airy Equations
 Airy Wave Theory 2: Wave Orbitals and Energy Compilation of Airy Equations 1 Orbital Motion of Water Particles Airy Wave Theory also predicts water particle orbital path trajectories. Orbital path divided
Physics Mechanics
 1 Physics 170 - Mechanics Lecture 33 Waves Wave notion 2 A wave pulse is a disturbance that propagates through a medium. It transfers energy without transferring matter; the energy is a combination of
Available online at ScienceDirect. Energy Procedia 80 (2015 )
") Available online at www.sciencedirect.com ScienceDirect Energy Procedia ( ) 6 th Deep Sea Offshore Wind R&D Conference, EERA DeepWind' Coupled mooring systems for floating wind farms Marek Goldschmidt*,
Available online at www.sciencedirect.com ScienceDirect Energy Procedia ( ) 6 th Deep Sea Offshore Wind R&D Conference, EERA DeepWind' Coupled mooring systems for floating wind farms Marek Goldschmidt*,
PRESSURE DISTRIBUTION OF SMALL WIND TURBINE BLADE WITH WINGLETS ON ROTATING CONDITION USING WIND TUNNEL
 International Journal of Mechanical and Production Engineering Research and Development (IJMPERD ) ISSN 2249-6890 Vol.2, Issue 2 June 2012 1-10 TJPRC Pvt. Ltd., PRESSURE DISTRIBUTION OF SMALL WIND TURBINE
The Usage of Propeller Tunnels For Higher Efficiency and Lower Vibration. M. Burak Şamşul
 The Usage of Propeller Tunnels For Higher Efficiency and Lower Vibration M. Burak Şamşul ITU AYOC 2014 - Milper Pervane Teknolojileri Company Profile MILPER is established in 2011 as a Research and Development
Dynamic response of composite caissonpiles
 Dynamic response of composite caissonpiles foundations Maosong Huang Department of Geotechnical Engineering Tongji University, Shanghai, China Outline of talk 1 Introduction 2 Lateral response 3 Seismic
ITTC Recommended Procedures and Guidelines
 Page 1 of 6 Table of Contents 1. PURPOSE...2 2. PARAMETERS...2 2.1 General Considerations...2 3 DESCRIPTION OF PROCEDURE...2 3.1 Model Design and Construction...2 3.2 Measurements...3 3.5 Execution of
TLP Minimum tendon tension design and tendon down-stroke investigation
 Published by International Association of Ocean Engineers Journal of Offshore Engineering and Technology Available online at www.iaoejoet.org TLP Minimum tendon tension design and tendon down-stroke investigation
Dynamic Response of Jacket Structures to Breaking and Nonbreaking Waves: Yesterday, Today, Tomorrow
 Leichtweiß-Institute for Hydraulic Engineering and Water Resources Department of Hydromechanics and Coastal Engineering Dynamic Response of Jacket Structures to Breaking and Nonbreaking Waves: Yesterday,
GEA FOR ADVANCED STRUCTURAL DYNAMIC ANALYSIS
 SMART SOLUTIONS FOR VIBRATION MONITORING GEA FOR ADVANCED STRUCTURAL DYNAMIC ANALYSIS ANALYSIS OF CIVIL STRUCTURES - EXPO MERLATA PEDESTRIAN BRIDGE ABSTRACT Civil structures and in particular bridges and
Dynamic analysis of offshore floating wind turbines
 Dynamic analysis of offshore floating wind turbines Hasan Bagbanci Centre for Marine Technology and Engineering (CENTEC), Instituto Superior Técnico Technical University of Lisbon, Lisboa, Portugal ABSTRACT:
Comparison of Phatas versions and the Wind Turbine module C. Lindenburg
 ECN-E--11-66 Comparison of Phatas versions and the Wind Turbine module C. Lindenburg December 211 Preface The program Phatas is developed at ECN wind energy for the design and analysis of horizontal axis
JAR-23 Normal, Utility, Aerobatic, and Commuter Category Aeroplanes \ Issued 11 March 1994 \ Section 1- Requirements \ Subpart C - Structure \ General
 JAR 23.301 Loads \ JAR 23.301 Loads (a) Strength requirements are specified in terms of limit loads (the maximum loads to be expected in service) and ultimate loads (limit loads multiplied by prescribed
COURSE NUMBER: ME 321 Fluid Mechanics I Fluid statics. Course teacher Dr. M. Mahbubur Razzaque Professor Department of Mechanical Engineering BUET
 COURSE NUMBER: ME 321 Fluid Mechanics I Fluid statics Course teacher Dr. M. Mahbubur Razzaque Professor Department of Mechanical Engineering BUET 1 Fluid statics Fluid statics is the study of fluids in
Hydrodynamic Analysis of a Heavy Lift Vessel during Offshore Installation Operations
 Presentation for Defense of Master Thesis Hydrodynamic Analysis of a Heavy Lift Vessel during Offshore Installation Operations Speaker: Bin Wang Supervisor: Prof. Robert Bronsart 23 rd Feb, 2015 Nantes
Rogue Wave Statistics and Dynamics Using Large-Scale Direct Simulations
 Rogue Wave Statistics and Dynamics Using Large-Scale Direct Simulations Dick K.P. Yue Center for Ocean Engineering Department of Mechanical Engineering Massachusetts Institute of Technology Cambridge,
Critical Gust Pressures on Tall Building Frames-Review of Codal Provisions
 Dr. B.Dean Kumar Dept. of Civil Engineering JNTUH College of Engineering Hyderabad, INDIA bdeankumar@gmail.com Dr. B.L.P Swami Dept. of Civil Engineering Vasavi College of Engineering Hyderabad, INDIA
Pre AP Physics: Unit 7 Vibrations, Waves, and Sound. Clear Creek High School
 Pre AP Physics: Unit 7 Vibrations, Waves, and Sound Clear Creek High School Simple Harmonic Motion Simple Harmonic Motion Constant periodic motion of an object. An object oscillates back and forth along
Wave phenomena in a ripple tank
 Wave phenomena in a ripple tank LEP Related topics Generation of surface waves, propagation of surface waves, reflection of waves, refraction of waves, Doppler Effect. Principle Water waves are generated
Offshore engineering science
 Offshore engineering science In this research stream theoretical models advanced geotechnical models and new numerical techniques were used in applied offshore engineering topics such as loading, design
Computational Analysis of Oil Spill in Shallow Water due to Wave and Tidal Motion Madhu Agrawal Durai Dakshinamoorthy
 Computational Analysis of Oil Spill in Shallow Water due to Wave and Tidal Motion Madhu Agrawal Durai Dakshinamoorthy 1 OUTLINE Overview of Oil Spill & its Impact Technical Challenges for Modeling Review
Preview. Vibrations and Waves Section 1. Section 1 Simple Harmonic Motion. Section 2 Measuring Simple Harmonic Motion. Section 3 Properties of Waves
 Vibrations and Waves Section 1 Preview Section 1 Simple Harmonic Motion Section 2 Measuring Simple Harmonic Motion Section 3 Properties of Waves Section 4 Wave Interactions Vibrations and Waves Section
9 Mixing. I Fundamental relations and definitions. Milan Jahoda revision Radim Petříček, Lukáš Valenz
 9 ixing ilan Jahoda revision 14-7-017 Radim Petříček, Lukáš Valenz I Fundamental relations and definitions ixing is a hydrodynamic process, in which different methods are used to bring about motion of
Vibration of floors and footfall analysis
 Webinar Autodesk Robot Structural Analysis Professional 20/04/2016 Vibration of floors and footfall analysis Artur Kosakowski Rafał Gawęda Webinar summary In this webinar we will focus on the theoretical
Conventional Ship Testing
 Conventional Ship Testing Experimental Methods in Marine Hydrodynamics Lecture in week 34 Chapter 6 in the lecture notes 1 Conventional Ship Testing - Topics: Resistance tests Propeller open water tests
Model Tests for a Floating Wind Turbine on Three Different Floaters
 Bonjun J. Koo 1 Technip USA, Inc., 11700 Katy Freeway, Suite 150, Houston, TX 77079 e-mail: bkoo@technip.com Andrew J. Goupee Advanced Structures and Composites Center, University of Maine, 35 Flagstaff
SUPERGEN Wind Wind Energy Technology
 SUPERGEN Wind Wind Energy Technology Wave Loading on Wind Turbine Sub-Structures Jamie Luxmoore Lancaster University SUPERGEN Wind Energy Technologies Consortium Phase 2 3 rd Training Seminar, Loughborough
A STUDY OF THE LOSSES AND INTERACTIONS BETWEEN ONE OR MORE BOW THRUSTERS AND A CATAMARAN HULL
 A STUDY OF THE LOSSES AND INTERACTIONS BETWEEN ONE OR MORE BOW THRUSTERS AND A CATAMARAN HULL L Boddy and T Clarke, Austal Ships, Australia SUMMARY CFD analysis has been conducted on a 100m catamaran hull
Numerical Simulations of a Train of Air Bubbles Rising Through Stagnant Water
 Numerical Simulations of a Train of Air Bubbles Rising Through Stagnant Water Hong Xu, Chokri Guetari ANSYS INC. Abstract Transient numerical simulations of the rise of a train of gas bubbles in a liquid
The Adequacy of Pushover Analysis to Evaluate Vulnerability of Masonry Infilled Steel Frames Subjected to Bi-Directional Earthquake Loading
 The Adequacy of Pushover Analysis to Evaluate Vulnerability of Masonry Infilled Steel Frames Subjected to Bi-Directional Earthquake Loading B.Beheshti Aval & M. Mohammadzadeh K.N.Toosi University of Technology,
EFFECT OF DIFFERENT MOORING SYSTEMS ON HYDRODYNAMIC ANALYSIS OF AN OFFSHORE WIND TURBINE
 EFFECT OF DIFFERENT MOORING SYSTEMS ON HYDRODYNAMIC ANALYSIS OF AN OFFSHORE WIND TURBINE Sabri ALKAN 1, Ayhan Mentes 2, Ismail H. Helvacioglu 2, Nagihan Turkoglu 2 1 Department of Mechanical Engineering,
SUPERGEN Wind Wind Energy Technology Rogue Waves and their effects on Offshore Wind Foundations
 SUPERGEN Wind Wind Energy Technology Rogue Waves and their effects on Offshore Wind Foundations Jamie Luxmoore PhD student, Lancaster University SUPERGEN Wind II - 7 th training seminar 3 rd - 4 th September
2MW baseline wind turbine: model development and verification (WP1) The University of Tokyo & Hitachi, Ltd.
 The University of Tokyo & Hitachi, Ltd.") 2MW baseline wind turbine: model development and verification (WP1) The University of Tokyo & Hitachi, Ltd. Downwind turbine technology, IEA Wind Task 40 First Progress Meeting, Tokyo, Japan 11 Dec, 2017
2MW baseline wind turbine: model development and verification (WP1) The University of Tokyo & Hitachi, Ltd. Downwind turbine technology, IEA Wind Task 40 First Progress Meeting, Tokyo, Japan 11 Dec, 2017
A.J.C. Crespo, J.M. Domínguez, C. Altomare, A. Barreiro, M. Gómez-Gesteira
 A.J.C. Crespo, J.M. Domínguez, C. Altomare, A. Barreiro, M. Gómez-Gesteira OUTLINE Oscillating Water Column - What OWC is? - Numerical modelling of OWC SPH functionalities - Wave generation (1 st order
Ameliorating the Negative Damping in the Dynamic Responses of a Tension Leg Spar-Type Support Structure with a Downwind Turbine
 1 Ameliorating the Negative Damping in the Dynamic Responses of a Tension Leg Spar-Type Support Structure with a Downwind Turbine Madjid Karimirad Torgeir Moan Author CeSOS Centre Centre for Ships for
Airy Wave Theory 1: Wave Length and Celerity
 Airy Wave Theory 1: Wave Length and Celerity Wave Theories Mathematical relationships to describe: (1) the wave form, (2) the water motion (throughout the fluid column) and pressure in waves, and (3) how
Control Strategies for operation of pitch regulated turbines above cut-out wind speeds
 Control Strategies for operation of pitch regulated turbines above cut-out wind speeds Helen Markou 1 Denmark and Torben J. Larsen, Risø-DTU, P.O.box 49, DK-4000 Roskilde, Abstract The importance of continuing
High-Energy Ship Collision with Jacket Legs
 High-Energy Ship Collision with Jacket Legs Jørgen Amdahl Department of Marine Structures, NTNU, Trondheim, Norway Atle Johansen MARINTEK, Trondheim, Norway ABSTRACT Risk analysis of planned jacket installations
Edit this text for your title
 Edit this text for your title MEK 4450 Marine Operations Edit this text for your sub-title Presenter name, location, date etc. Kværner ASA / DNV, Fall 2013 Lesson 2/3 Lift phases Load out Transportation
Modal Analysis of Barrels for Assault Rifles
 PROBLEMS OF MECHATRONICS ARMAMENT, AVIATION, SAFETY ENGINEERING ISSN 2081-5891 2 (8), 2012, 7-16 Modal Analysis of Barrels for Assault Rifles Peter LISÝ, Mário ŠTIAVNICKÝ Academy of the Armed Forces of
The Seventh International Colloquium on Bluff Body Aerodynamics and Applications (BBAA7) Shanghai, China; September 2-6, 2012 Wind tunnel measurements
 Shanghai, China; September 2-6, 2012 Wind tunnel measurements") The Seventh International Colloquium on Bluff Body Aerodynamics and Applications (BBAA7) Shanghai, China; September 2-6, 2012 Wind tunnel measurements of aeroelastic guyed mast models a, Tomasz Lipecki
The Seventh International Colloquium on Bluff Body Aerodynamics and Applications (BBAA7) Shanghai, China; September 2-6, 2012 Wind tunnel measurements of aeroelastic guyed mast models a, Tomasz Lipecki
Modelling of Extreme Waves Related to Stability Research
 Modelling of Extreme Waves Related to Stability Research Janou Hennig 1 and Frans van Walree 1 1. Maritime Research Institute Netherlands,(MARIN), Wageningen, the Netherlands Abstract: The paper deals
INTRODUCTION TO WAVES. Dr. Watchara Liewrian
 INTRODUCTION TO WAVES Dr. Watchara Liewrian What are Waves? Rhythmic disturbances that carry energy without carrying matter Types of Waves Mechanical Waves need matter (or medium) to transfer energy A
EXPERIMENTAL RESEARCH ON COEFFICIENT OF WAVE TRANSMISSION THROUGH IMMERSED VERTICAL BARRIER OF OPEN-TYPE BREAKWATER
 EXPERIMENTAL RESEARCH ON COEFFICIENT OF WAVE TRANSMISSION THROUGH IMMERSED VERTICAL BARRIER OF OPEN-TYPE BREAKWATER Liehong Ju 1, Peng Li,Ji hua Yang 3 Extensive researches have been done for the interaction
Waves. G. Cowles. General Physical Oceanography MAR 555. School for Marine Sciences and Technology Umass-Dartmouth
 Waves G. Cowles General Physical Oceanography MAR 555 School for Marine Sciences and Technology Umass-Dartmouth Waves Sound Waves Light Waves Surface Waves Radio Waves Tidal Waves Instrument Strings How
In memory of Dr. Kevin P. Granata, my graduate advisor, who was killed protecting others on the morning of April 16, 2007.
 Acknowledgement In memory of Dr. Kevin P. Granata, my graduate advisor, who was killed protecting others on the morning of April 16, 2007. There are many others without whom I could not have completed
Offshore Oil and Gas Platforms for Deep Waters
 Offshore Oil and Gas Platforms for Deep Waters Atilla Incecik Department of Naval Architecture, Ocean and Marine Engineering University of Strathclyde, Glasgow, UK (atilla.incecik@strath.ac.uk) Summary
IMO REVISION OF THE INTACT STABILITY CODE. Proposal of methodology of direct assessment for stability under dead ship condition. Submitted by Japan
 INTERNATIONAL MARITIME ORGANIZATION E IMO SUB-COMMITTEE ON STABILITY AND LOAD LINES AND ON FISHING VESSELS SAFETY 49th session Agenda item 5 SLF 49/5/5 19 May 2006 Original: ENGLISH REVISION OF THE INTACT
PUV Wave Directional Spectra How PUV Wave Analysis Works
 PUV Wave Directional Spectra How PUV Wave Analysis Works Introduction The PUV method works by comparing velocity and pressure time series. Figure 1 shows that pressure and velocity (in the direction of
Wind effects on tall building frames-influence of dynamic parameters
 Indian Journal of Science and Technology Vol. 3 No. 5 (May 21) ISSN: 974-6846 583 Wind effects on tall building frames-influence of dynamic parameters B. Dean Kumar 1 and B.L.P. Swami 2 1 Department of
Chapter 11 Waves. Waves transport energy without transporting matter. The intensity is the average power per unit area. It is measured in W/m 2.
 Chapter 11 Waves Energy can be transported by particles or waves A wave is characterized as some sort of disturbance that travels away from a source. The key difference between particles and waves is a
Sea State Analysis. Topics. Module 7 Sea State Analysis 2/22/2016. CE A676 Coastal Engineering Orson P. Smith, PE, Ph.D.
 Sea State Analysis Module 7 Orson P. Smith, PE, Ph.D. Professor Emeritus Module 7 Sea State Analysis Topics Wave height distribution Wave energy spectra Wind wave generation Directional spectra Hindcasting