Copyright Warning & Restrictions
|
|
|
- Roderick Lester
- 5 years ago
- Views:
Transcription
1 Copyright Warning & Restrictions The copyright law of the United States (Title 17, United States Code) governs the making of photocopies or other reproductions of copyrighted material. Under certain conditions specified in the law, libraries and archives are authorized to furnish a photocopy or other reproduction. One of these specified conditions is that the photocopy or reproduction is not to be used for any purpose other than private study, scholarship, or research. If a, user makes a request for, or later uses, a photocopy or reproduction for purposes in excess of fair use that user may be liable for copyright infringement, This institution reserves the right to refuse to accept a copying order if, in its judgment, fulfillment of the order would involve violation of copyright law. Please Note: The author retains the copyright while the New Jersey Institute of Technology reserves the right to distribute this thesis or dissertation Printing note: If you do not wish to print this page, then select Pages from: first page # to: last page # on the print dialog screen
2 The Van Houten library has removed some of the personal information and all signatures from the approval page and biographical sketches of theses and dissertations in order to protect the identity of NJIT graduates and faculty.
3 ABSTRACT STUDY OF VAPOR/GAS PERMEATION USING THIN IMMOBILIZED LIQUID MEMBRANE by Gordana Obuskovic To improve liquid membrane selectivity and stability for removal of vapor and gases from a gas stream, a thin immobilized liquid membrane (ILM) has been studied. Low vapor pressure liquid solvent/solutions were immobilized in part of the micropores of a hydrophilic, hydrophobic or ceramic hollow fiber substrate. To prepare such thin ILMs, three approaches were used: evaporation of the a volatile solvent; acrylic acid-grafted hollow fibers providing a thin hydrophilic layer; pressurization technique. For removal of volatile organic compound (VOC), a thin ILM of silicone oil incorporated in the micropores of a hydrophobic hollow fiber with a silicone rubber coating yielded a highly VOC-enriched permeate and increased separation factor. The same ILM was stable over an extended period (6 months - 2 years) demonstrating the potential utility of such an ILM-based hollow fiber device for VOC-N 2/air separation. A mathematical model was successfully developed to describe the VOC-N 2 permeation-separation in a hollow fiber permeator having this special type of membrane containing a thin ILM. Grafting method used for the preparation of a thinner 1LM resulted in various hollow fibers having different hydrophilic layer thickness. These fibers were used to study the effect of various glycerol-based and aqueous liquid
4 membranes immobilized in the thin hydrophilized part of the fiber. Glycerol-based ILMs resulted in low CO 2 permeances in the range of 1"10-6 cm3/cm2*sl 'ccmrig- for enclosed atmosphere application; aqueous based ILMs has much better performance. A pressurization technique was used to prepare a thin ILM in porous hydrophilic and ceramic substrates. It was shown that when appropriate asymmetric hollow fibers substrates were used, increase in CO2 permeance was achieved.
5 STUDY OF VAPOR/GAS PERMEATION USING THIN IMMOBILIZED LIQUID MEMBRANE by Gordana Obuskovic A Dissertation Submitted to the Faculty of New Jersey Institute of Technology In Partial Fulfillment of the Requirements for the Degree of Doctor of Philosophy in Chemical Engineering Otto H. York Department of Chemical Engineering January 2003
6 Copyright by Gordana Obuskovic ALL RIGHTS RESERVED
7 STUDY OF VAPOR/GAS PERMEATION USING THIN IMMOBILIZED LIQUID MEMBRANE Gordana Obuskovic Dr. Kamalesh K. Sirkar, Dissertation Advisor Date Distinguished Professor of Chemical Engineering, NJIT Dr. Piero Armenante, Committee Member Date Distinguished Professor of Chemical Engineering, NJIT Dr. Dana Knox, Committee Member Associate Professor of Chemical Engineering, NJIT Date Dr. Gordcin Lewdndowski, Committee Member Distinguished Professor of Chemical Engineering, NJIT Date Dr. Chao Zhu, Committee Member Assistant Professor of Mechanical Engineering, NJIT Date
8 BIOGRAPHICAL SKETCH Author: Gordana Obuskovic Degree: Doctor of Philosophy Date: January, 2003 Undergraduate and Graduate Education: Doctor of Philosophy in Chemical Engineering, New Jersey Institute of Technology, Newark, NJ, 2003 Master of Science in Chemical Engineering, New Jersey Institute of Technology, Newark, NJ, 1996 Bachelor of Science in Chemical Engineering, Belgrade University, Belgrade, Serbia, Yugoslavia, 1992 Major: Chemical Engineering Publications and Presentations: Obuskovic G., T.K. Poddar and K.K. Sirkar, Flow swing membrane-absorption permeation, Ind. Eng. Chem. Res., 37 (1998) 212. Chen H., G. Obuskovic, S. Majumdar and K.K. Sirkar, Immobilized glycerol-based liquid membranes in hollow fibers for selective CO 2 separation from CO2- N2 mixtures, J. Membr. So., 183 (2001) Obuskovic G., S. Majumdar and K.K. Sirkar, Highly VOC-selective hollow fiber membranes for separation by vapor permeation, J. Membr. Sci., In press. Iv
9 I dedicate this thesis to my sister Nina who inspired me to start and finish my Ph.D. To my nephew and niece, Shon and Nicole and most of all to my parents. v
10 ACKNOWLEDGMENT I would like to express my deepest appreciation to Dr. Kamalesh Sirkar, for his support, guidance, giving valuable suggestions and comments throughout this research. Special thanks to Dr. Piero Armenante, Dr. Dana Knox, Dr. Gordon Lewandowski and Dr. Chao Zhu for participating as members of my committee. I would like to thank Dr. Majumdar not only for his friendship but also for giving his expertise regarding the experimental and mathematical modeling part of this work. Thanks to Dr. Kovvali for his friendship and criticism. I truly enjoyed and I am still missing his "caustic tongue". Thanks are due to all members of the Membrane Separation and Biotechnology group for their friendship and help whenever was needed. Special thanks to my sister Nina, who gave me not only moral but also the financial support throughout my graduate studies. Also, to my brother-in-law Joey, for his endless help whenever needed. Thanks to my Chuchi, for his patience, belief and love he had for me. Also to my parents for their support, understanding and encouragement. Tanks to the rest of my family and anyone else who helped and participated in any way during my Ph.D. studies. VI
11 TABLE OF CONTENTS Chapter Page 1 INTRODUCTION Preparation of a Thin Film 4 2 VOC REMOVAL FROM GASEOUS STREAM WITH OR WITHOUT AN IMMOBILIZED LIQUID MEMBRANE IN STEADY STATE OR CYCLIC MODE OF OPERATION Introduction Experimental Types of Experiments Chemicals, Gases, Membranes and Modules Experimental Setup for the Separation of VOCs from VOC/N 2 Mixtures in the Steady State Mode of Operation with or without an ILM Preparation of the Thin ILM GC Calibration for VOCs Experimental Setup for Cyclic Mode of Operation for the VOC Removal Calculation of Nitrogen Permeance (Q/6) and determination of the ILM Thickness Needed to Simulate Results from the Mathematical Model Gas Permeation Model for Silicone Coated Hollow Fiber Module Containing a Thin ILM Estimation of the Parameters for the Mathematical Model Governing Differential Equations for the Hollow Fiber Permeator 55 VH
12 TABLE OF CONTENTS (Continued) Chapter Page 2.4 Results and Discussion Experimental Results for Steady State Removal of VOCs with or without a Thin ILM Experimental Results for Steady State Removal of Methanol Containing Water Vapor using Thin ILM Experimental results for Cyclic Mode of Operation for Removal of VOCs Conclusions SELECTIVE REMOVAL OF CARBON DIOXIDE FROM NITROGEN GAS STREAM USING IMMOBILIZED LIQUID MEMBRANE (ILMS) Introduction Experimental Types of Experiments Chemical, Gases, Membranes and Modules Experimental setup for ILM Based separation of CO 2 from CO 2/N 2 Gas Mixtures Preparation of the ILMs Preparation of the ILMs with Grafted Hollow Fibers membranes and Modules Preparation of the ILMs with PVDF Hollow Fiber Membranes an Modules Preparation of the Thin ILMs with PVDF Hollow Fibers and Ceramic Membrane Modules using Pressurization Technique 126 VIII
13 TABLE OF CONTENTS (Continued) Chapter Page Preparation of the Modules GC Calibration for C0 2 and N Calculation for C0 2 and N2 Effective Permeance (0../8)eff and the Separation Factor ac02-n Results and discussion Experimental Results for C02 Removal Based on ILM Using Grafted Hollow Fibers Scanning Electron Micrographs ILM Based on Minimal Plasma/Minimal Vapor Time Grafted Fibers: Batch ILM Based on Minimal Plasma/Max Vapor Time Grafted Fibers: Batch ILM Based on Modest Graft Exposure Time Grafted Fibers: Batch ILM Based on High Graft Exposure Time Grafted Fibers: Batch ILM Based on Low Graft Concentration/Solution Grafted Fibers: Batch ILM Based on High Graft Concentration/Solution Grafted Fibers: Batch ILM Based on ATM Stainless Steel Module ILM Based on ATM Stainless Steel Module ILM Based on ATM Stainless Steel Module IX
14 TABLE OF CONTENTS (Continued) Chapter Page Experimental Results for Full and Thin ILM Based Removal of CO2 Using PVDF Hollow Fibers Experimental Results Using PVDF Hollow Fibers with Thin Glycerol Carbonate ILMs Prepared Using the Pressurization Technique Experimental Results Using PVDF Hollow Fibers with Thin Glycerol-Na-Glycinate ILM Prepared Using the Pressurization Technique Experimental Results for Full and Thin ILM Based Removal of CO2 Using Ceramic Membrane Modules Conclusions Conclusions Based on AA-Grafted Hollow Fibers Experiments Conclusions Based on PVDF Hollow Fibers Experiments Conclusions Based on Ceramic Membrane Module Experiments CONCLUSIONS 181 APPENDIX A DETERMINATION OF THIN ILM THICKNESS 183 APPENDIX B ESTIMATION OF PARAMETERS 186 APPENDIX C SAMPLE CALCULATION FOR WATER VAPOR TRANSPORT 194 APPENDIX D SAMPLE CALCULATION FOR THE ILM-BASED C02/N2 SEPARATION 198 APPENDIX E DETAILS ON PLASMA POLYMERIZATION CONDITIONS FOR HOLLOW FIBERS AND PLASMA GRAFT PROCEDURE 200
15 TABLE OF CONTENTS (Continued) Chapter Page APPENDIX F PROGRAM F0R M0DELING 0F THE V0C PERMEATI0N THR0UGH THE HOLLOW FIBER M0DULE 202 REFERENCES 217
16 LIST OF TABLES Table Page 2.1 Properties of Silicone oil used for the preparation of ILM Geometrical characteristics of different hollow fiber modules used Gas permeance measurements for hollow fiber module containing no ILM, with thin and full FILM Flux and percent removal of V0Cs from Nitrogen at different feed flow rates and V0C concentrations Flux and percent removal of V0Cs from Nitrogen at different feed flow rates and V0C concentrations with ILM Flux and percent removal for low concentrations of Methanol from Nitrogen at different flow rates Flux and percent removal of various low inlet concentration of Methanol from Nitrogen at different flow rates for the membrane containing thin ILM Flux and percent removal of low concentration of Toluene from Nitrogen at different flow rates for the membrane containing thin ILM Flux and percent removal of Methanol from Nitrogen at different gas flow rates for various high inlet Methanol concentrations using the membrane containing thin ILM Stability of thin ILM immobilized in Module 1 periodically used over period of 2 years Description and values of parameters used in simulation of V0C permeation with thin FILM of Silicone oil Experimental results for V0C removal using Module 2 for determination of V0C permeance through the Silicone oil Flux and percent removal of V0Cs from nitrogen at different feed flow rates and VOC concentrations for Module Water vapor flux in Module 5 without a thin ILM 87 XII
17 LIST OF TABLES (Continued) Table Page 2.15 Water vapor flux using Module 2 with full FILM without Silicone skin Experimental results for constant cycle time and variable inlet gas flow rate for removal of V0C using Module 1 with an ILM Experimental results for different cyclic times and constant inlet gas flow rate for removal of Acetone and Methanol using Module 1 with thin ILM Experimental results for steady state runs and various inlet gas flow rates for removal of Acetone, Toluene and Methanol using Module 1 with thin ILM Experimental results for steady state runs at different inlet gas flow rates for removal of Acetone and Methanol using Modules 3 and Comparison of the steady state and cyclic process using Modules 3 and 4 in series or parallel for removal of Acetone Grafted hollow fiber membrane substrates and modules used for ILM preparation Geometrical characteristics of PVDF hollow fiber modules used Geometrical characteristics of ceramic membrane modules used Summary of the permeation results for feed gas mixture of 0.5% and 0.495% C0 2/N 2 for AMT grafted fibers Batch 1: Minimal Plasma/Minimal Vapor Time Summary of the permeation results for feed gas mixture of 0.5% and 0.495% C0 2/N 2for AMT grafted fibers Batch 2: Minimal Plasma/Max Vapor Time Summary of the permeation results for feed gas mixture of 0.495% C0 2/N 2 for AMT grafted fibers Batch 3: Modest Graft Exposure Time Summary of the permeation results for feed gas mixture of 0.495% C0 2/N 2 for AMT grafted fibers Batch 4: High Graft Exposure Time 148 XIII
18 LIST OF TABLES (Continued) Table Page 3.8 Summary of the permeation results for feed gas mixture of 0.495% C 02/N 2 for AMT grafted fibers Batch 5: Low Graft Concentration/Solution Summary of the permeation results for feed gas mixture of 0.495% C0 2/N 2 for AMT grafted fibers Batch 6: High Concentration/Solution Summary of the permeation results for feed gas mixture 0.5% C02/N2 for AMT stainless steel Module Summary of the permeation results for feed gas mixture 0.5% CO2/N2 for AMT stainless steel Module Summary of the permeation results for feed gas mixture 0.495% C02/N2 for AMT stainless steel Module Summary of the permeation results for CO 2/N 2 gas mixture using PVDF hollow fiber Module 1 immobilized with Glycerol Carbonate and subjected to pressurization Summary of the permeation results for CO 2/N 2 gas mixture using PVDF hollow fiber Module 2 immobilized with 1M Na-glycinate solution and subjected to pressurization Summary of the permeation results for CO 2/N 2 gas mixture using PVDF hollow fiber Module 3 and subjected to pressurization Summary of permeation results for different inlet geed gas mixtures of CO 2/N 2 for 1LMs in PVDF hollow fiber Module Summary of permeation results for CO 2/N 2 gas mixture for ceramic Module 1 immobilized with Glycerol Carbonate due to pressurization Summary of permeation results for C0 2/N 2 gas mixture for ceramic Module 2 immobilized with Glycerol Carbonate and subjected to stepwise pressurization 174 DIV
19 LIST OF FIGURES Figure Page 1.1 Different methods for preparation of the thin ILM Principle of FSMP process Experimental setup for VOC removal with or without ILM in steady state mode of operation Experimental setup for VOC removal from humidified gas stream in steady state mode of operation GC calibration for low concentration of Methanol in N GC calibration for intermediate range of concentrations of Methanol in N GC calibration for very high concentrations of Methanol in N Experimental setup for VOC removal using FSMP process Cross section of a hollow fiber pore having a thin 1LM Schematic of a hollow fiber permeator for modeling vacuum mode of operation Dependence of percent removal of VOCs and VOC flux on feed gas flow rate for the membrane without 1LM Effect of Silicone oil immobilization on the variation of Nitrogen flux and separation factor Effect of Silicone oil immobilization on the permeate side composition (Module 1) Dependence of percent removal and outlet concentration of Methanol and Toluene on flow rate with thin ILM (Module 1) An extended duration run to determine membrane stability 76 Dv
20 LIST OF FIGURES (Continued) Figure Page 2.15 Variation of Acetone outlet concentration with feed inlet flow rate and comparison of experimental and simulation results Variation of Methanol outlet concentration with feed inlet flow rate and comparison of experimental and simulation results Variation of Toluene outlet concentration with feed inlet flow rate and comparison of experimental and simulation results Facilitated transport of Carbon Dioxide through an immobilized liquid membrane Preparation of a thin ILM in an asymmetric membrane by pressurization technique Setup for evaluating ILMs for Carbon Dioxide removal in a hollow fiber module Gas chromatograph calibration curve for Carbon Dioxide Gas chromatograph calibration curve for Nitrogen Cross-sectional and surface view of the A-grafted fiber from Batch 1: Minimal Plasma/Minimal Vapor Time Cross-sectional views of the AA-grafted fiber from Batch 1: Minimal Plasma/Minimal Vapor Time treated with liquid Nitrogen Cross-sectional views of the bare Mitsubishi hollow fiber and Mitsubishi AA-grafted fiber from Batch 1: Minimal Plasma/Minimal Vapor Time Cross-sectional view of the AA-grafted hollow fiber form Batch 3: Modest Graft Exposure Time Cross-sectional view of the AA-grafted hollow fiber form Batch 4: High Graft Exposure Time 137 DEVI
21 LIST OF FIGURES (Continued) Figure Page 3.11 Cross-sectional view of the AA-grafted hollow fiber form Batch 2: Minimal Plasma/Minimal Vapor Time PVDF hollow fiber Module 1 stability run using Glycerol-Na-Glycinate based 1LM 169 DVII
22 CHAPTER 1 INTRODUCTION Volatile organic compounds (VOCs) are quite harmful to the environment and they can be toxic at the same time. It is well known that VOCs have important roles in the tropospheric chemistry of ozone and aerosols and the creation of smog. On the other hand, greenhouse gases, notably carbon dioxide (CO 2), have been linked to global warming. Carbon dioxide emission has been increasing remarkably, mostly because of the combustion of fossil fuels such as coal, petroleum and natural gas. Therefore, the environmental protection agency (EPA) has made more stringent emission standards for major VOCs; C0 2 emissions control is also being considered. Hence, many applications need innovative, reliable and cost effective technologies that can fulfill such requirements. Also, removal of CO 2 from the enclosed atmospheres has an important function in a life support system, not only for space applications (e.g. extravehicular activities, space suit application) but also for earth applications in enclosed spaces (e.g. submarines, control rooms). Membranes appear as an attractive alternative solution to conventional separation processes. They are drawing more and more attention, their market is growing rapidly and their application has expanded to a variety of industries as new membrane materials are produced. Gas separation membranes have emerged as a viable alternative to commercial gas separation technologies (e.g. absorption, adsorption, condensation, distillation etc). 1
23 2 Like any other chemical engineering process, they have their advantages and disadvantages. Membrane devices are modular in nature and a large membrane area can be packed in a small volume. Therefore, they have a smaller footprint than conventional processes. An added advantage is the simplicity of the system and the absence of the moving parts. Still, membranes are sometimes expensive, can be easily fouled and stability can be a problem. Membranes are thin films which separate the feed gas stream into a permeate stream and a retentate stream. The quality of the separation is determined by the selectivity. A common definition for membrane selectivity is called the separation factor a u between species i and j and it is given by where the single prime and the double prime denote the retentate and the permeate phases respectively (Ho and Sirkar, 1992). Usually the achieved selectivities of the membranes are insufficient to achieve the desired purities. Consequently, there is constant need for membranes that can give higher selectivities without drastic flux reduction. Since the species flux is affected by the membrane thickness, a very thin membrane will result in a significant increase in the transport of the preferentially permeating component across the membrane. The usefulness of a given membrane system is also very much dependent on the membrane stability. For instance, the instability of a liquid membrane is due to evaporation of the solvent/solution. Therefore, less volatile solvents are needed to overcome the instability problem. On the other hand, some chemicals
24 3 can have a very harmful effect and can permanently damage the polymeric membrane materials. Gas separation membranes are based on solution-diffusion mechanism. The penetrant first dissolves in the polymer surface and then, diffuses through the polymer material. Therefore, membrane permeability of a species is defined as a product of the species solubility and diffusivity in the membrane. Highly selective and permeable gas separation membranes are needed in order for the membrane to be commercialized. One way of improving the membrane selectivity is to incorporate certain solvents that might contain a reactive species in addition, in which a species of interest preferentially dissolves or reacts with the reactive species, the carrier. If the transport mechanism in addition to solution-diffusion includes the reversible reaction with the species of interest, it is called the facilitated transport mechanism and such a membrane is called a facilitated transport membrane (FTM). This study will focus on existing membrane materials and possible modifications of the same in order to improve the membrane selectivity and stability for environmental and/or specific gas separation applications. In particular, removal of VOCs and C0 2 from nitrogen or air streams based on thin immobilized liquid membranes and the effect of the incorporated thin layer of solvent/solution into the porous polymeric or ceramic matrix on VOC/C0 2 separations are investigated. Most commonly used membranes for the VOC separation are composite membranes, e.g., membrane which has a thin layer of silicone rubber
25 4 superimposed onto the porous polymeric support. In order to enhance the VOC separation using a composite membrane, a thin layer of a solvent, such as silicone oil, which has a high solubility for the VOCs and virtually no solubility for N2 or air is incorporated in a porous polymeric support. In this way, N2 flux will be drastically reduced compared to the VOC flux across a thin composite membrane enhancing the membrane selectivity. Furthermore, due to the extremely low vapor pressure of silicone oil, liquid membrane stability is improved as well. Solvent evaporation technique will be used for the preparation of such a thin FILM. Carbon dioxide separation membranes are an environmentally friendly alternative to traditional amine treatment processes. This study will focus on facilitated transport membranes for specific applications where a highly selective and stable CO 2 liquid membrane is needed. When low volatility solvent and/or carriers are used, membrane stability is drastically improved (Chen et al, 1999, 2000, 2001). An added advantage will be the reduced thickness of the ILM for further C0 2 flux enhancement. A novel approach to reduce the immobilized liquid membrane (ILM) thickness (Kovvali, 2000) will be explored on different hollow fiber membrane substrates using a low volatility solvent/solution in the form of an I LM. 1.1 Preparation of a Thin FILM In order to obtain the desirable fluxes of the reacting and non-reacting species for various applications, thin ILM were prepared instead of fully immobilized liquid membrane. Various approaches of thin liquid membrane formation will be
26 5 mentioned here. Figure 1.1 illustrates the basic concepts of thin liquid membrane formation used in this study: partial evaporation of mixed or pure solvents plasma graft method pressurization technique. The partial evaporation technique was used to prepare the thin siliconebased liquid membrane in a hollow fiber having a thin layer of silicone rubber plasma polymerized on the outer surface of the fiber. This thin 1LM was used to study the removal of VOCs from the nitrogen streams. The ILM thickness was reduced by evaporation of hexane from the hexane-silicone oil mixture incorporated in the porous structure of the hollow fiber. This thinner ILM gave an increased selectivity by drastically reducing the nitrogen flux and marginally reducing the VOC flux. The substrate was microporous polypropylene hollow fiber. This fiber has a thin layer of plasmapolymerized silicone rubber placed on the outside diameter (OD) of the fiber. The partial evaporation approach and the technique of thin 1LM preparation is considered in Chapter 2. This silicone oilbased ILM was also tested for stability and water vapor permeation. In addition, a mathematical model was developed to predict the hollow fiber permeator behavior for VOC removal containing the thin ILM in the pores (Chapter 2 and Appendix F). For carbon dioxide removal two different approaches were used to create thin glycerol-based or glycerol carbonate-based liquid membranes:
27 c) Pressurization technique for expulsion of the liquid from the pores of an asymmetric membrane. Figure 1.1 Different methods for preparation of the thin ILMs.
28 7 plasma grafted hollow fiber membrane having glycerol-na-glycinate based FILM immobilized in a thin hydrophilic (e.g. acrylic acid grafted) part pressurization technique for the expulsion of the liquid from the pores of an asymmetric hollow fiber membrane using glycerol-na- glycinate and glycerol carbonate based ILM. Preparation of the thin glycerol-na-glycinate based ILM in a grafted hollow fibers is described in the first part of Chapter 3. A thin hydrophilic film is crated by the plasma graft technique and it is placed on the 0.D. of the fiber. Grafted layer thicknesses varied based on the grafting conditions. The thickness of the ILM is expected to be the same as the thickness of the grafted layer, which is much smaller than if the ILM were formed throughout the substrate, the full ILM. By changing the grafting conditions, six different batches of fibers having various thickness of the AA grafting were formed (Appendix E). The second part of Chapter 3 describes the preparation of the thinner ILM by the pressurization technique in asymmetric hollow fibers. Two types of asymmetric structures were used: polymeric asymmetric hollow fiber having an integrated skin on the inner surface diameter (l.d.) ceramic tube having a skin layer placed on the inner diameter. By gradually increasing the pressure across the membrane, more and more solvent or solution is displaced form the pore resulting in a thinner ILM. If sufficiently high transmembrane pressure is applied, an ILM with the thickness equal to thickness of the skin of the asymmetric hollow fiber is likely to be produced.
29 8 The organization of this thesis will be as follows. Chapter 2 will focus on VOC separation using the thin FILM prepared by solvent evaporation technique. Chapter 3 deals with CO 2 separation using thin and stable FILM prepared using AA-grafted hollow fibers, asymmetric and ceramic membranes. The literature review, experimental details, results and discussion sections and conclusions on VOC and CO 2 separations are provided in each chapter accordingly. The experimental sections summarize the preparation of thin FILM using various techniques along with the equipment and procedure for experimental measurements. To predict the VOC outlet concentrations a mathematical model is developed. Derivation of the mathematical equations along with the determination of the parameters is provided in Chapter 2. Finally, conclusions and recommendations for future investigation are provided in Chapter 4.
30 CHAPTER 2 VOC REMOVAL FROM A GASEOUS STREAM WITH OR WITHOUT AN IMMOBILIZED LIQUID MEMBRANE IN STEADY STATE OR CYCLIC MODE OF OPERATION 2.1 Introduction Separation processes are essential to a variety of industries for purification of raw materials, recovery and purification of the products or removal of contaminants from their gaseous or liquid waste streams. The control of volatile organic compounds (VOCs) in waste gas streams from manufacturing industries is becoming very important due to environmental concerns. Volatile organic compounds are carbon-based substances, with certain properties, such as the tendency to react with nitrogen oxides in the presence of sunlight to create ozone as the primary component of the smog. This can occur after the VOC evaporates into the ambient atmosphere. More stringent emission standards for specific emission sources (e.g. combustion plant, pharmaceutical and chemical industries, dry cleaning etc.) require best available techniques to be used to reduce or eliminate discharges and to keep emissions down. The complexity of the task has allowed the progress to take place at a slow pace. Removal of VOCs from gaseous industrial and waste streams is necessary either to meet these stringent emission standards or to recover and/or reuse valuable organics. 9
31 10 Volatile organic compound emission control techniques are basically classified into two groups: (1) process and equipment modifications to control VOC emission; (2) add-on control techniques for recovery and/or destruction of VOCs. Vapor emission control is generally achieved by carbon adsorption, absorption, condensation and incineration. Selection criteria depend on nature and concentration of the organic pollutant in the gas stream to be removed, flow rate of the stream, need for recovery of the contaminants, specific site characteristics and the value of the organic pollutant. Adsorption processes are used in situations where high purification of a gas mixture is needed. Carbon adsorption is suitable when dealing with dilute mixtures of VOCs in air (5000 ppmv or less) (Simmons et al., 1994), gases with humidity less than 50% and gas flow rates ranging from medium to high. Regeneration of the adsorbed material from the carbon is guided by economics. The energy demand for adsorption process is high and there is a risk of selfignition because the adsorption process is exothermic. Absorption is suitable for high to medium gas flow rates and pollutant concentrations. This system is also bulky and flooding and loading can be a problem due to changes in gas flow rates. Condensation is a process with very high energy demand because oversaturation of the VOCs is achieved by chilling of the large volume of the waste gas stream. Usually this process requires concentrations above 5% and low to medium flow rates. The amount of VOC that can be recovered from the waste stream depends on the inlet VOC
32 11 concentration, the boiling point of the VOC and the temperature and pressure of the waste stream. Incineration is also used as one of VOC emission control techniques; it can treat wide ranges of concentrations and gas flow rates but VOCs cannot be recovered. This process is rather expensive and it can produce more toxic air emissions and not easily disposable wastes. Most of the existing techniques for VOCs-emission control and recovery have proved to be unsatisfactory in terms of safety, performance, operating costs and facility space. A review of the available options to control VOC emission (destruction based and recovery based) with their advantages and limitations is given in Khan and Choshal (2000). Therefore, it would be useful if a membrane device could be economically used to purify the feed gas mixture to the same extent achieved using commercialized processes. None of the membrane separation processes on its own can alter or break down the pollutants, but they have the ability to separate, fractionate and concentrate contaminants. In some cases membrane processes combined with traditional separation techniques allows the reduction of VOC emissions to satisfy most rigorous emissions standards. In the last ten years, membrane technology is becoming a viable VOC pollution abatement technique due to improved quality of synthetic membrane materials, simplicity of the process and compactness of the devices; further membrane capital costs are generally lower. However, membrane separation processes operated
33 12 conventionally in a steady-state fashion are known to be efficient for bulk gas separation only (Beaver et al., 1988). Polymeric membranes used for recovery and removal of organic solvents from the gaseous streams have to be chemically and mechanically stable and their selectivity and permeability will determine the efficiency of the gas separation process. Based on the flux and selectivity, membranes can be classified broadly into four classes: (1) porous, (2) nonporous, (3) asymmetric and (4) composite. Porous membranes separate gases based on the relative sizes of the molecules and exhibit high fluxes but low selectivity. Different mechanisms are involved in the transport of gases across porous membrane e.g. convective flow, Knudsen diffusion. Which mechanism is going to take place depends on the ratio of the pore radius, r, to the mean free path, A, of the molecules. Transport through a nonporous membrane is governed by the solutiondiffusion mechanism achieving high selectivities but low fluxes. Solution-diffusion mechanism depends on both solubility and diffusion of the components through the membrane material. The permeability, P. of a species "i" can be expressed as the product of the diffusion coefficient, D i, and the solubility coefficient, S i. The diffusion coefficient reflects the capability of the molecules to pass through the membrane material and the solubility coefficient relates to the ability of a solute to dissolve into the membrane material. In polymeric materials, diffusivity decreases as the molecular size increases since larger molecules interact much more with the polymer chains than smaller molecules do; solubility increases as the condensability of the solute increases. Therefore, the selectivity, aid, of the
34 13 membrane material depends on the balance between these two coefficients for any pair (i,j) of gases. A membrane will separate the components based on their relative permeation rates through the membrane material. In glassy polymers (e.g. polysulfone or polyimide) diffusion coefficient is most important. On the other hand for rubbery membranes e.g. polydimethylsiloxane (PDMS), the solubility coefficient is most important. Classy polymers are usually prepared as asymmetric (skinned) membranes by solution precipitation procedure developed by Loeb and Sourirajan (1964). These membranes are composed of two distinctive regions made of the same material, a thin dense semipermeable skin, and a much less dense non-selective layer. Separation is accomplished in the thin dense skin whereas the less dense layer provides a mechanical and physical support to the skin. A limited number of polymers that can be used to make anisotropic membranes with useful gas fluxes and selectivities are known. Surface modifications are sometimes employed to increase the gas separation capabilities. These methods include UV treatment, plasma treatment, plasmapolymerization, fluorination and fluorooxidation. Silicone rubber membranes have been found to have the unusual ability to separate certain gases from mixtures as it is described in Kammermeyer's patent (1960). As mentioned earlier, rubbery membranes also have a high solubility for organic compounds and therefore, they are more desirable for VOC removal from gas streams. The amount of gas that can permeate through a membrane of a given area is inversely dependent upon the membrane thickness in addition to being
35 14 directly proportional to the gas partial pressure drop across the membrane (e.g. driving force); therefore, Robb (1967) tried to prepare ultrathin defect-free organosiloxane films. Since a rubbery material made in the form of an asymmetric membrane would collapse under high pressures used in gas separations, silicone membranes are fabricated as a composite membrane where a thin selective layer of silicone rubber is placed on a strong rnicroporous support by a variety of techniques including plasma polymerization. Another approach to develop gas separation membrane involves preparing a composite membrane having a superimposed membrane supported on an anisotropic porous support wherein the superimposed membrane provides the desirable separation. These porous supports provide low resistance to gas passage and yet have a pore size small enough to prevent the rupture of the superimposed membrane. Many studies have been done with dense membranes superimposed on a microporous support (Klass and Landau, 1971; Yasuda, 1973). On the other hand, Henis and Tripodi (1980) prepared a composite membrane using different porous supports (e.g. polysulfone, polyetherimide, polyimide, polypropylene etc.), where separation properties were essentially determined by the properties of the dense region of the microporous layer as opposed to the membrane coating material which penetrates the micropores (Henis and Tripodi, 1981). Based on previous experiences with multicomponent or composite membranes, a commercialized VOC separation membrane has been developed Henis and Tripodi, 1981); it has a thin nonporous skin on the porous substrate. If
36 15 the membrane is in a form of a hollow fiber, tus nonporous thin silicone coating is placed on the outer side of a porous polymeric support. One of the techniques which is recognized as a unique method of preparing uniform, ultrathin (-1 Jim), defect-free silicone containing polymeric films is plasma polymerization technique. Cenerally tun film composite membranes of PDMS exhibit high selectivity for VOC/N 2 separation. Plasma-based polymers can be made from different types organosi I icon monomers like: diethoxydimethylsilane (DEDMS), hexamethyldisiloxane (HMDS), octamethyltrisiloxane (OMTS) or poly(dimethylsiloxane) (PDMS) (Yamamoto et al. 1983). Most of the membrane-based VOC researches have used PDMS membranes (Cha et al., 1997; Bhaumik et al., 2000; Cales et al., 2002). A disadvantage of these composite membranes is that it is hard to produce ultrathin, defect-free PDMS films since the material is very sticky. Also, certain organic solvents, when present in high concentration in the feed gas, may cause the silicone rubber to swell giving ugher nitrogen flux through the coating. This may result in lower selectivity and less concentrated permeate side composition. Recently, an attempt was made to overcome the problem of PDMS composite membranes by preparing hexamethyldisiloxane (HMDS) composite membrane by plasma polymerization technique (Sohn et al., 2000). Although they were successful in preparing very stable and more resistant films to many different solvents, the selectivities of new HMDS plasma polymerized films were lower than the PDMS membranes for the same pair of gases.
37 16 Most VOC separation studies were carried out using a composite silicone rubber PDMS coated membrane on different porous polymeric supports, e.g., PDMS/polysutfone (Kimmerle et al., 1988; Paul et al., 1988), PDMS/potyetherimide (Fouda et al. 1993; Leeman et al., 1996; Cales et al., 2002), PDMS/polypropytene (Cha et al., 1997; Bhaumik et al., 2000; Poddar et al., 1996b). Separation takes place in the thin permsetective layer by the solutiondiffusion mechanism; the porous support provides mechanical strength and should not offer considerable transport resistance. PDMS membranes have not only high permeability coefficients for vapors but also high selectivity for VOCs over air/n2. Evaluated selectivities for composite PDMS membranes with microporous polypropylene hollow fiber substrate were in the range of for certain VOCs (like methanol or toluene) for relatively low inlet feed gas composition and moderate flow rates (Cha et al., 1997). There are many potential membrane applications to fulfill specific industrial needs where conventional methods can not meet the standards. For instance, very good separation of gases is required in petrochemical and refinery operations. It is not sufficient to recover 90-95% of the organic, but the vapor must be recovered as a pure product with less than 5-10% or less of other component. There are many applications where membranes selectively remove water vapor from the VOC-Iaden gas streams either for dehydration of air or natural gas, to control humidity or to recover moisture for drinking purposes. For the purpose of water recovery, it was demonstrated that Cuprophan membrane made
38 17 of regenerated cellulose could efficiently remove water vapor wule blocking air and VOCs (Cha et al., 1996). There are some applications where VOCs should be preferentially removed over water vapors due to various needs. For instance, if VOCs are condensed for recovery purposes, presence of water in a condenser is undesirable due to development of ice, which can block the device. Another example is in the paper industry where methanol is an unwanted byproduct of Kraft pulping and is released in low concentrations along with water vapor. Commercially used PDMS membranes will not be very efficient in this case, since thin PDMS coating is higuy water permeable (Watson and Baron, 1996) and therefore, methanol/water selectivity of such a material will be low. Therefore, a new process was developed in which methanol was selectively removed from the feed stream with minimal transport of water using water vapor as a purge stream (Kluge et al., 2001). The ability to increase membrane selectivity, produce more concentrated permeate side stream and develop a system that can deal with water vapor if present in a feed gas stream will be an added advantage. One possibility is to incorporate an appropriate solvent in the porous membrane substrate, which will act as an immobilized liquid membrane (ALM) having a high solubility for VOCs, virtually no solubility for N2 and a low vapor pressure and very low solubility for water vapor. Therefore, uguy VOC-selective essentially nonvolatile solvents, e.g., silicone oil or Paratherm oil, are solvents of choice since they have all the desired properties mentioned above.
39 18 When silicone oil is immobilized in part of the pore thickness (thin ALM), the membrane selectivity for VOC removal is likely to be enhanced by a substantial reduction of the N2 flux and only a marginal reduction in the VOC flux thereby yielding a more concentrated permeate side composition. Pressure difference between the feed and the vacuum sides create the partial pressure driving force needed for the removal of the VOCs. In this case, the ILM functions as a supplementary selective membrane in addition to the silicone coating on the outer side of the hollow fiber which also prevents liquid membrane expulsion. Water practically has no solubility in these oils, thus they can be utilized for water vapornoc separation as well. Suitable applications of silicone oil and Paratherm oil for VOC removal have already been demonstrated in membranebased regenerative absorption process (Poddar, 1995; Poddar et al., 1996a; Poddar et al., 1996b; Xia et al., 1999; Majumdar et al., 2001). Such a process requires two membrane devices, one for stripping and the other for the absorption of VOCs. An attempt was made to apply hollow fiber contained liquid membrane (HFCLM) configuration (Majumdar et al., 1988) to VOC separation. A hollow fiber membrane module for VOC removal was prepared with two sets of fibers (Obuskovic et al., 1998) where one set of fibers is used for absorption and another set for the desorption process with the silicone oil in between these two fiber sets. This contained liquid membrane (CLM) configuration combined with two sets of fibers provides an opportunity for both processes (absorption/desorption) to take
40 19 place in a single membrane device. Needless to say that pumping of the viscous absorbent liquid through the system is eliminated in this configuration. The idea of incorporating a liquid membrane in the pore structure of the membrane substrate will substantially decrease the liquid membrane thickness, enhance the VOC selectivity by reducing N2 flux substantially and VOC flux marginally, simplify the membrane device and make the desorption process easier. In addition, cyclic membrane processes of different types have been studied previously for a variety of applications in order to improve gas purification. Existing cyclically-operated membrane-based separation processes are operated either by cyclic pulsing of the gas pressure on the upstream side of the membrane (Paul, 1971) or by cyclically introducing a feed gas flow into microporous hollow fiber membranes having adsorbent particles (Cilleskie et al., 1995) or an aqueous absorbent liquid (Bhaumik et al., 1996) on the shell side. The adsorbent particle or the absorbent liquid adsorbs/absorbs specific species from the feed gas mixture. Regeneration of the adsorbent/absorbent media is achieved by a variety of demanding multistep procedures borrowed from pressure swing adsorption (PSA) processes. Since a membrane for selective removal of organic vapors from the air acts as an absorbent for species which is preferentially removed (e.g. VOCs), incorporating the operational principle of (PSA) processes into a membrane device can possibly produce two higuy purified streams. Therefore, a cyclic process will be applied to the hollow fiber permeators which are constructed somewhat like a shell-and-tube heat exchanger. The principle of this cyclic membrane process is as
41 20 follows: a VOC-containing gas stream is cyclically introduced into the bores of the hollow fibers wule vacuum is constantly maintained on the shell side of the module to insure a continuous driving force for the VOC removal and regeneration of the membrane. Since only feed gas flow is cyclically introduced, this process will be named Flow Swing Membrane Permeation (FSMP) process. In this process, the feed gas mixture is cyclically introduced into the feed channel inlet of the membrane module, while, on the permeate side, conditions were maintained for the permeation of the feed gas species (e.g. VOCs) from the feed side to the permeate side by applying a vacuum. For a short period of time, say 10 or 20 seconds, which is called the absorption or adsorption time tabs, the feed gas flows through the feed gas channel (e.g. bore of the hollow fiber). Figure 2.1 illustrates the principle of FSMP process where a VOC present is removed by selective permeation through the silicone coated fiber from the nitrogen feed gas stream. During the short period of time, the front end of the feed gas is uguy purified since the membrane acts as the absorber for the VOC species. During that time, permeate side is maintained under vacuum so that the VOC species is passed over to the permeate side. After the absorption part of the cycle is over, the feed flow into the feed channel is stopped for a short period of time (e.g. 10 or 20 seconds) which is called the regeneration time, t ree. During the regeneration time, the membrane feed channel end is closed and no retentate stream is withdrawn. However, the VOC present in the remaining feed gas in the feed channel will be preferentially removed by permeation through the membrane. The gas remaining
 I.")

42 Purified Gas Stream (Product) Vacuum on Shell Side Product End Closed VOC-Rich Stream (Permeate) I. Stagnant Contaminated Gas VOC/N 2 Feed Stream At Time t abs >t>0 Feed End Closed At Time cyc i e = tabs + tdes > t > tabs Figure 2.1 Principle of FSMP process.
43 22 in the feed channel will be higuy purified in nitrogen or air. The pressure on the feed side will be marginally reduced from the feed gas pressure due to selective permeation. When the feed gas is reintroduced into the membrane feed channel after the regeneration time is over, the gas that is pushed out first as the retentate stream at the exit is higuy purified in nitrogen, and the absorption part of the new cycle starts again. To obtain a steady output, two membrane device in parallel are used, where absorption and regeneration of the feed gas mixture and retentate is alternatively taking place between these two modules. The sum of the absorption time and the regeneration time for each membrane device should equal the cycle This process will assure that the membrane does not get saturated and it will prevent breakthrough of the VOC into the product end. Unlike the pressure swing adsorption process, this system will operate at nearly constant pressures on both sides. If the membrane is higuy selective, the permeate stream can be uguy purified too. Such a system can replace activated carbon beds effectively for gas purification. The distinct advantages of this cyclic membrane process will be: 1. no drastic changes of pressure on either side of the membrane (unlike PSA processes); 2. simplified regeneration of the absorbent and/or membrane. To improve the membrane selectivity for VOCs and achieve better purification, two strategies are pursued here:
44 23 1. immobilize a non-volatile solvent in part of the thickness or the full thickness of the membrane pores; 2. cyclic mode of operation. In this study, the use of hollow fiber membrane modules with or without an appropriate immobilized liquid membrane (ILM) in steady state, as well as in cyclic mode of operation, is studied for effective removal of volatile organic compounds (VOCs) from gas streams possibly containing water vapor. 2.2 Experimental Types of Experiments 1. For the determination of the thin ALM thickness and the nitrogen permeance across the thin ALM, Modules 1 and 2 were used where the tube side was pressurized with pure nitrogen and the permeation flow rate was measured on the shell side with one end closed. 2. For the determination of the VOC permeance across the thin ALM, Module 2 was used to measure the extent of removal of each of the VOCs, e.g. toluene, methanol and acetone, individually. Feed VOC/N 2 mixture was passed through the tube side while a vacuum was applied on the shell side.
45 24 3. The extent of removal of each of VOCs, e.g. toluene, methanol and acetone, was studied individually with various feed flow rates using Module 1 with or without a thin ILM incorporated in the porous structure; feed VOC concentration was varied in different experiments. The feed gas containing a VOC was introduced through the tube side of the hollow fiber membrane module. 4. For determination of water vapor permeance, Module 2 was used with a full 1LM. The extent of removal of methanol from the feed gas stream containing water vapor using Module 2 with a full ALM incorporated in the porous structure was studied; feed inlet methanol concentration was 292 ppmv and the humidity level was varied in different experiments. 5. The extent of the removal of a VOC was studied in FSMP with different concentrations, feed flow rates and cycle times. The experiments were carried out using Module 1 having a tun ILM incorporated in the porous structure. Feed gas stream was cyclically introduced into the bore of the hollow fiber module. 6. The extent of the removal of VOCs was studied in FSMP with different concentrations, feed flow rates and cycle times. The experiments were carried out using two identical modules where the feed gas stream was alternately introduced into the bore of one of the hollow fiber modules.
46 Chemicals, Gases, Membranes and Modules Different volatile organic compounds (VOCs) (e.g. methanol, acetone and toluene) were used to study the basic performance of the hollow fiber membrane module. Initial experiments were done using the bare membrane without any ILM, followed by experiments where a uguy VOC-selective essentially nonvolatile solvent, e.g., Silicone oil (Kramer Chemicals, Inc., Paterson, NJ) was immobilized in part of the pore thickness creating a thin immobilized liquid membrane (ILM). Some properties of the Silicone oil are given in Table 2.1. These experiments were carried out to develop a better understanding of the effect and benefit of the thin ILM for removal and recovery of the VOC. Also a set of experiments were done with another membrane module containing uncoated microporous polypropylene hollow fibers using the same VOC gas mixtures and pure nitrogen in order to estimate the VOC permeances and the thin ILM thickness. The VOC/N 2 gas mixture and pure gases used in this study are listed below (Matheson, E. Rutherford, NJ: 1. Certified gas mixture containing a VOC/nitrogen balance: Acetone 11, 000 ppmv; Methanol 10, 000 ppmv; Methanol 9, 200 ppmv; Methanol 292 ppmv; Toluene 1, 953 ppmv; Toluene 215 ppmv. 2. Pure gases: nitrogen zero, helium zero, hydrogen zero, air zero. Module 1 used for these experiments, had one set of 300 microporous hydrophobic polypropylene hollow fibers having a thin nonporous
47 Table 2.1 Properties of Silicone Oil Used for the Preparation of ALCM 26
48 27 plasmapolymerized silicone coating on the outside surface of the hollow fibers Module 1 was obtained from Applied Membrane Technology, Inc., (AMT, Minnetonka, MN). Detailed characteristics of the module are given in Table 2.2. This module was used and studied for the separation of organic vapors from dry air streams with or without the ILM configuration. In the case where an ILM configuration was studied, the microporous support was impregnated with the suitable nonvolatile liquid absorbent (e.g. Silicone oil) in order to increase the membrane selectivity for VOC removal. Module 2 was prepared in the laboratory from the same type of the Celgard fibers as in Module 1. This module has 120 microporous hydrophobic polypropylene hollow without a silicone coating (Celgard X-10, ID/OD: 240 pm/290 pm). The fibers were obtained from Hoechst Celanese (Charlotte, NC). Characteristics of the Module 2 are given in Table 2.2. This module was used to determine VOC and nitrogen permeances through the ALM and thereby the thin ALM thickness needed to simulate membrane performance in Module 1 via the mathematical model. Module 2 was also used to determine the water vapor permeance through the fully immobilized liquid membrane. The same module was used to study the extent of methanol removal from a humid nitrogen stream with full ILM configuration.
49 Table 2.2 Ceometrical Characteristics of Different Hollow Fiber Modules Used Module Type of Fiber Fiber Effective No. of Mass No. fiber ID OD length fibers transfer (cm) (cm) (cm) area (cm 2)* 1 Celgard X-10 with a silicone skin Celgard X-10** without silicone skin Celgard X-10 with a silicone skin Celgard X-10"*" with a silicone skin Celgard X-10*"" with a silicone skin * Calculation based on outer diameter of the fiber * Hoechst Celanese, Charlotte, NC *** AMT Inc., Minnetonka, MN
50 Experimental Setup for the Separation of VOCs from VOC/N 2 Mixtures in the Steady State Mode of Operation with or without an ILM The experimental setup used to study the removal of VOCs from VOC/N 2 mixtures using PDMS coated hollow fiber membrane module in steady state mode of operation with or without the 1LM configuration is shown in Figure 2.2. The same setup was also used when VOC permeances through the thin ILM were determined. For ali cases, different feed gas mixtures were passed through the tube side of the membrane module while vacuum was constantly applied on the sheli side to create the driving force for VOC removal. The inlet VOC concentration in the feed gas mixture was varied from very low to very high. Different concentrations of VOCs in VOC/N 2 mixtures were acueved either by directly purchasing a gas cylinder containing a mixture of the desired concentration from Matheson Cas Products (Matheson, E. Rutherford, NJ), or by mixing pure nitrogen with such a VOC/nitrogen mixture to decrease the VOC concentration or by bubbling nitrogen through the liquid VOC to produce very high VOC concentrations. The flow rate of each gas stream was controlled by an electronic mass control flow meter (Matheson, E. Rutherford, NJ). The purified feed gas exiting the membrane module was sent to a gas chromatograph (CC) (HP 5890 series II, Hewlett-Packard, Paramus, NJ) for analysis. The same connection existed for the permeate side analyses in the case where an oil-less vacuum pump (KNF Neuberger Inc., Trenton, NJ) was used. In this case the composition of the permeate side was determined by direct GC analysis. If an oillubricated vacuum pump (HyVac Products, Inc., Norristown, PA) was used, the
51 Figure 2.2 Experimental setup for VOC removal with or without 1LM in steady state mode of operation.
52 31 permeate side composition was calculated based on material balance since it was suspected that the lubricant could absorb some VOCs from the permeate stream and direct CC analysis would not be very accurate.. The CC (HP 5890 series II), had a flame ionization detector (FIDE) for VOC analysis. The CC conditions used are listed below: Some experiments were done to study selective removal of VOCs from humid nitrogen streams. To humidify the incoming VOC-containing gas stream, pure nitrogen was passed through a bubbler filled with pure water. This humidified nitrogen stream was then blended with a dry VOC-N 2 mixture prior to contacting the membrane. In order to determine if any water was permeating through the membrane, two humidity probes (model MP 32 UT, Vaisala, Woburn, MA) were used to measure the humidity levels at the inlet and at the outlet of the membrane module. The humidity and temperature indicator (model HMI 32, Vaisala, Woburn, MA) was used to monitor the temperature and humidity level of the gas streams. Inlet and outlet VOC concentrations of a gas mixture were determined by CC (HP 5890 series II, Hewlett-Packard, Paramus,
53 32 NJ) analysis. The setup using a humidified feed gas mixture is shown in Figure 2.3. All connecting lines used for this experiment were 1/8-inch soft copper tubing (McMaster Carr, New Brunswick, NJ). The inlet feed pressure and the permeate vacuum level were measured with pressure gauges (Matheson, E.Rutherford, NJ) Preparation of the Thin ILM The nonvolatile liquid absorbent Silicone oil (viscosity 50 cst, Kramer Chemicals, Inc., Paterson, NJ) was immobilized in part of the length of the pores of a microporous hollow fiber substrate. As mentioned earlier, these fiber have a thin silicone coating (-1 um) on the outer side of the hollow fiber; therefore, the immobilized liquid membrane (FILM) was incorporated in the hollow fiber support pores using the lumen side coating procedure. In order to prepare a thin 1LM, a mixture of 30% Silicone oil and 70% hexane was pumped through the bore of the hollow fiber module for 1 hour using a Micropump (model , Cole-Palmer, Cucago, 1L). Subsequently, the module was drained and any residual liquid present on the lumen side was removed by purging with a dry gas stream (e.g., nitrogen) for 1 2 hr. To assure complete evaporation of the solvent, vacuum was applied on the sheli side of the module overnight. The ILM was then ready for testing.
54 Figure 2.3 Experimental setup for VOC removal from humidified gas stream in steady state mode of operation.
55 GC Calibration for VOCs Calibration curves for acetone, methanol and toluene were prepared for the desired ranges of VOC concentrations. Different concentrations of a VOC containing gas (N 2) stream were prepared by diluting a VOC/N 2 gas stream of known concentration with a pure N2 gas stream. For each calibration range, at least 4 to 5 different concentrations were utilized. When preparing calibration for the lower range of VOC concentrations (e.g. 0.1 A0-1%) a certified mixture of VOC/N 2 gas mixture was purchased from Matheson Cas Products (Matheson, E.Rutherford, NJ). The highest available concentration of a VOC (N 2 balance) in a cylinder from Matheson was 1%. Sample CC calibration curves for low and higher ranges of concentrations are shown in Figures 2.4 and 2.5 for methanol in N2. To prepare calibrations in a much higher concentration range (Figure 2.6), liquid VOC (e.g. methanol HPLC grade) (Fisher Scientific, Springfield, NJ) was placed in a surge drum vessel (bubbler) and pure N2 stream was bubbled through the liquid VOC at a low flow rate. This unknown highest methanol concentration was determined by CC (HP 5890 series II, Hewlett-Packard, Paramus, NJ) analysis. In order to determine this high concentration, the VOC containing gas stream was diluted with pure N2 till the composition of the mixed gas stream came in the range of the calibration curve made for methanol concentration of upto 1% shown in Figure 2.5. This known VOC concentration (e.g. 1%) was purchased from Matheson Cas Products (Matheson, E.Rutherford, NJ) as a
56 Figure 2.4 CC calibration for low concentration of Methanol in N2. 35
57 Figure 2.5 CC calibration for intermediate range of concentrations of Methanol in N2. 36
58 Figure 2.6 CC Calibration for very high concentrations of Methanol in N2. 37
59 38 certified standard mixture and then diluted with nitrogen stream in appropriate ratio to obtained different calibration points. Other concentrations of the methanol diluted gas streams were recalculated knowing the gas flow rates of pure N2 and the high concentration methanol gas stream from the bubbler Experimental Setup for Cyclic Mode of Operation for the VOC Removal For the FSMP process, two membrane modules were employed. As shown in Table 2.2, Modules 3 and 4 have a set of 150 fibers each; these microporous polypropylene hollow fibers (Hoechst Celanese, SPD Charlotte, NC; X-10 (0.03 pm pore size)) have a thin plasmapolymerized nonporous silicone coating on the outside diameter (prepared by AMT Inc., Minnetonka, MN). The experimental setup for the unsteady state (e.g. cyclic) mode of operation is shown in Figure 2.7. The mixture of VOC and nitrogen (Matheson, E.Rutherford, NJ was fed through the fiber bores of one of the hollow fiber modules for a short period of time; then the feed gas flow was stopped by a three-way solenoid valve (3-WSV) (Components and Control, CarIstad, NJ) at the inlet and the outlet of the first module. At the same time, the feed flow was redirected into the bores of the fibers of the second module for a short period of time (e.g. absorption time) after which the settings of the three-way solenoid valves (3-WSV) will be switched so that the inlet and the outlet of the second module were closed for a desorption period of cycle.
60 Figure 2.7 Experimental setup for VOC removal using FSMP process.
61 40 Both three-way solenoid valves at the inlet and at the outlet of these two modules connected in parallel were controlled by a single timer so they can work in perfect synchronization. The feed inlet gas flow rate was controlled by an electronic mass flow-metering valve (Matheson, E. Rutherford, NJ). On the sheli side of both hollow fiber modules, vacuum was applied. During the part of the cycle meant for the absorption from the flowing feed stream, the VOC permeated through the silicone coating of the hollow fibers selectively over N 2/air into the sheli side where a continuous vacuum was applied in both hollow fiber modules to create a driving force for the VOC removal. The purified gas was collected at the outlet of both modules where a small surge vessel was placed in order to avoid any pulsation of the product flow due to the cyclic process; the purified gas mixture was analyzed with a gas chromatograph (HP 5890 series II, Hewlett- Packard, Paramus, NJ). All connecting lines used for the experiment were 1/8-inch soft copper tubing (McMaster Carr, New Brunswick, NJ). Any fluctuation of the feed inlet gas pressure was measured with pressure gauges (Matheson, E. Rutherford, NJ). All gas mixtures used for these experiments were obtained from Matheson (E. Rutherford, NJ). The VOC concentration in the permeate was calculated from a material balance.
62 Calculation of Nitrogen Permeance (Q/8) and Determination of the ILM Thickness Needed to Simulate Results from the Mathematical Model In order to model mathematically the steady state system containing a thin ALM in the pores of the hollow fibers, certain parameters (e.g. thickness of the oil, nitrogen gas permeance through the oil etc.) have to be determined earlier. To estimate the thickness of oil in the pores, the following three quantities, namely, the N2 permeance through the coated membrane (Q/6), containing no oil in the pores, N2 permeance through the composite membrane (Q/O), (e.g. silicone oil and PDMS coating) and the N2 permeance through the oil (Q/8) 1 were determined. In order to find out the N2 permeance through the oil, (Q/8) 1, a new module (Module 2) was prepared using Ceigard X-10 hollow fibers without any PDMS coating. The pores in the fibers of this module were filled completely with Silicone oil by pumping the oil through the bore of the hollow fiber module for some time using a Micropump (model , Cole-Palmer, Chicago, IL) in order to prepare a full ILM in the pores of the hollow fibers. Afterward, the module was drained and any residual liquid present in the module was removed by using a dry purge gas stream (e.g., nitrogen) for 1 2 hr through the sheli and tube side of the hollow fiber module. The nitrogen permeation rate was measured for all cases in the same manner described below. One end of the tube side of the hollow fiber module was connected to the N2 cylinder and the other end was closed. Nitrogen in the bore side was pressurized to various pressures monitored with a pressure
63 42 gauge (Matheson, E.Rutherford, NJ). On the other side of the membrane, one end of the sheli side of the hollow fiber was closed; at the other end, the N2 permeation rate was measured using a bubble flow meter. To determine the thin FILM thickness, nitrogen permeances for ali three cases were calculated in a manner given below. Detailed sample calculations are given in Appendix A. Effective surface area (A) based on the logarithmic mean diameter (d im)of the fiber is given by Where the logarithmic mean diameter is Knowing the nitrogen permeate flow rate (B p ) measured according to the technique described above, nitrogen permeate molar flow rate (F r ) is calculated:
64 43 liquid membrane. We can estimate the liquid membrane thickness (6 1) knowing ali parameters for the overall permeation equation: In order to estimate the thin ALCM thickness, the above equation was solved knowing ali the parameters except (Q/8) 1. Now this (Q/6), is really equal to
65 Gas Permeation Model for a Silicone Coated Hollow Fiber Module Containing a Thin ILM A mathematical model for binary gas separation in a conventional permeation mode in a hollow fiber module containing silicone coated fibers is available in Cha et al. (1997). This modeling analysis considered a strong dependence of the VOC permeance (i.e. Q ;/b) of the silicone coating on the partial pressure of VOC. In the present thesis, a mathematical model has been developed to simulate the experimental results for the silicone-coated hollow fiber containing permeator having a thin layer of silicone oil incorporated in the porous structure (thin ALM) under the operational conditions. The model incorporates the type of dependence of the VOC permeance of the silicone coating on the VOC partial pressure employed by Cha et al. (1997). The polymeric membrane consists of a thin layer of around 11..tm of PDMS coating developed on the outer side of the microporous polypropylene hollow fiber by a plasma polymerization technique. The manufacturer (AMT Inc., Minnetonka, MN) provided an approximate estimate of the thickness of the PDMS coating. In addition, this membrane has a thin layer of silicone oil immobilized in the porous structure whose thickness was estimated in a manner described earlier for the purpose of obtaining results from the mathematical model.
66 45 The following assumptions were employed while developing the model for the separation of the VOC/N 2 mixtures using this composite hollow fiber permeator: 1. The permeability coefficient of a VOC through the silicone (PDMS) coating depends on the feed side VOC partial pressure. 2. The pressure on the permeate side is constant along the module. 3. Hagen-Poiseuille law governs the gas pressure drop in flow through the fiber lumen. 4. Axial diffusion is insignificant compared to bulk gas convection. 5. The end effects inside the permeator are negligible. 6. The deformation of the hollow fiber under pressure is negligible Estimation of the Parameters for the Mathematical Model To model this system, the permeances (i.e. WO) of the VOC and N2 through the thin ALM have to be determined. Figure 2.8 shows the cross section of a pore of the hollow fiber having a thin ALM immobilized within the pore along with a silicone coating on the outer surface. In order to find the VOC permeance, the condition at the interface of the ALM and the silicone coating (e.g. P'x'), has to be determined first. Permeation rate equations of the VOC and N2 through the skin and ILM are given below for a length dl of a single hollow fiber of outside diameter do:
67 Figure 2.8 Cross section of a hollow fiber pore having a thin ALM.
68 47
69 48
70 permeance through the silicone coating on the feed side partial pressure of VOC is given as An expression for P'x' can be derived from equation (2.9) as Substituting the expression for P'x' given by equation (2.20) into equation (2.19),
71 50 If the expression for VOC permeance through the silicone coating given by equation (2.21) is introduced into equation (2.18), one obtains If equation (2.22) is solved for W voc, than from equation (2.20) one can determine Pax'. To solve the above equation (2.22), the unknown parameters like "a" and "b" which are constants for the VOC permeance through the silicone skin and the VOC permeance through the thin layer of silicone oil be estimated based on the experimental results. Therefore, the first step was to determine parameters "a" and "b" in the expression used to described the VOC permeance through the silicone coating (Q/6 c) for ali three VOCs (e.g. methanol, toluene and acetone). Tus was done by simulating the experimental results obtained using the bare membrane having a thin silicone skin on the outer diameter of the fiber using the mathematical model developed and verified by Cha et al. (1997). These two parameters for each VOC
72 51 were adjusted in such a way that the experimental and simulated data were at their closest proximity. Estimated values of "a" and "b" for ali three VOCs for this silicone coated membrane (Module 1) are tabulated in a table in section 2.4 and compared with the "a" and 'V values obtained by Cha et al. (1997). VOC permeance for each of the three organic vapors (e.g. toluene, methanol and acetone) individually studied here was estimated based on the extent of removal of each VOC with various feed flow rates using Module 2 whose fibers were without a PDMS coating and whose pores were fully immobilized with the silicone oil. From this set of experiments, an effective where the true permeability VOCs was estimated knowing the full ALM thickness (6 1 = 2511m). The feed gas containing a VOC was introduced through the tube side of the membrane Module 2 while vacuum was applied to the sheli side. These experimental results were used to calculate all three VOC permeances. The procedure for parameter estimation is given below and detailed calculations can be found in Appendix B. Experimental results acquired after immobilization of the thin ALM can also be used to estimate the overali permeance and permeance through the thin ILM for ali three VOCs used following the same procedure as mentioned in Appendix B. Note that through the ALM:
73 52 Based on the experimental results, the VOC permeate flux can be calculated from the permeate flow rate and the permeate composition using the following equation To analyze the performance of the module, the percent removal of VOC (%), the module average permeances and the separation factor a were calculated follows:
74 53 The above equation uses the logarithmic mean partial pressure driving force (AP 1m) where the permeate side partial pressure ID. Doc and the feed side partial pressure The partial pressures of VOC were calculated based on the VOC composition on both sides at the inlet ("fa) and the outlet ("w") of the module. Since the permeate side VOC composition is unknown at the closed end of the module ("w"), as a first estimate, this composition (yvoci is considered to be zero. Using this approximation, one can estimate the module average permeances and determine the separation factor (a) between the VOC and N2 from Once the average module VOC permeance across the fully immobilized is estimated, knowing the full liquid membrane thickness,
75 54 VOCs studied here. Knowing the thin ILM thickness that was determined the permeance across the thin ALM thickness e.g. ( MICR, m 6 was estimated. Knowing the VOC permeance through the silicone coating (Q/8) c and the permeance across the thin silicone layer (Q/O), one can easily calculate the overall permeance (Q/8).v (e.g. silicone coating and thin ILM), using equation (2.6). Using these values of the VOC permeances, the experimental data were simulated using the mathematical model developed and described below. In the case where there was a significant difference between the simulated and experimental results, VOC permeances (e.g. (QM), and (Q/6),,v) were reevaluated in the following manner. Using the cross flow condition equation, one can recalculate the VOC permeate composition at the closed end (yvocw ) and correct the logarithmic mean partial pressure driving force (AP im) using the equation below (Sengupta and Sirkar, 1986). where y denotes the pressure ratio between the permeate and the feed side, and a is the separation factor defined previously via equation (2.33). To estimate the VOC composition at the closed end, one uses the a value calculated at the first step using the assumption (e.g. yvocw=0). Once the new value of the VOC in the
76 55 permeate composition at the closed end was obtained, logarithmic mean partial pressure driving force and the VOC permeance were recalculated. The same procedure of reevaluation of the parameters was followed tili the simulated and experimental results came to the closest proximity. Another approach to estimating the needed parameters is based on the experimental results acquired after immobilization of the thin ILMT used to calculate overali permeance for all VOCs used. Knowing the VOC permeance through the silicone coating (Q/8) c and the overall permeance (Q/8). (e.g. silicone coating and thin ALM), one could easily calculate the VOC permeance through the liquid layer (Q/6), using equation (2.6). Procedure for parameter estimation and for the correction of the driving force given in detail in Appendix B can be used for both parameter estimation approaches mentioned before. A summary of the parameters used for the mathematical model is provided in the results section and detailed calculations can be found in Appendix B. Experimental results for the VOC runs using Module 2 used to determine VOC permeances are also given in the results section Governing Differential Equations for the Hollow Fiber Permeator A schematic diagram where the VOC/N 2 feed stream and the permeate stream flow countercurrently is shown in Figure 2.9. The overali material balance between the feed inlet end and any location at a distance 1 from the closed end of the permeate side leads to
77 Figure 2.9 Schematic of a hollow fiber permeator for modeling vacuum mode of operation.
78 Note that equations (2.14) and (2.15) give the overali permeance expressions for VOC and N2 at any location I of the hollow fiber. The equation governing the pressure drop in the bore of the fiber is Rearranging the above equations, one can develop the following set of differential equations to represent mathematically the permeation behavior of the permeator
79 Equations (2.41) to (2.44) have to be solved simultaneously along with the boundary conditions When vacuum is applied to the permeate side in countercurrent flow, at the location 1=0, the permeate flow V W = 0. The permeate side VOC mole fraction, Kw, at this location cannot be specified explicitly and it has to be determined from equations (2.38) and (2.39) by using the boundary conditions at 1=0. The VOC mole fraction Kw in the vacuum mode has been shown to be (Guha et al., 1992):
80 59 The IMSL subroutine BVPFD was used to solve numerically the set of nonlinear ordinary differential equations (2.41) to (2.44) using boundary conditions (2.45). Initial estimate for each dependant variable at the selected grid point was generated by solving the set of differential equations as an initial value problem, assuming cocurrent flow using the IMSL subroutine IVPRK (Majumdar, 1986; Cuha, 1989). 2.4 Results and Discussion Experimental Results for Steady State Removal of VOCs with or without a Thin ILM The results for removal of volatile organic compounds (VOCs) via steady state vapor permeation with or without a thin silicone oil-based immobilized liquid membrane (ALM) are presented and discussed here. Module 1 obtained from
81 60 Applied Membrane Technology (AMT Inc., Minnetonka, MN) was used for ali steady state type of experiments. For this set of experiments, the nitrogen gas stream containing the VOC was passed through the tube side of the hollow fiber module while a high or medium vacuum (-1-30 torr) was applied to the shell side. The feed gas flow rate was varied in the range of cc/min; the acetone and toluene concentrations used ranged from 20 ppmv to 1% and for methanol from Measurements of nitrogen permeate flow rate in order to determine the permeance of nitrogen through the silicone skin (Q/b) c, the overali N2 permeance (Q/b)ov across the silicone skin and the thin ALM and nitrogen permeance through the oil (Q/b)c in this composite membrane were carried out with Module 1 and Module 2. Table 2.3 shows the results of the nitrogen permeate flow rate measurements for different feed pressures. When Module 2 was used with fully immobilized liquid membrane in the pores of the hollow fiber, no permeate flow was observed for pressures below 20 psig. Based on these measurements, the thickness of the thin ALM immobilized in the hollow fiber Module 1 was determined. The thin ALM thickness was found to be m, which is about 25% of the thickness. A sample calculation is provided in Appendix A. Table 2.4 illustrates the flux and percent removal of different VOCs for changing feed flow rates in Module 1 without any ILM incorporated in the porous structure. As one can see, the percent removal varied along with a change of the
82 61
83 Table 2.4 Flux and Percent Removal* of VOCs from Nitrogen at Different Feed Flow Rates** and VOC Concentrations VOC Feed Composition (ppmv) Feed Flow Rate (cc/min) Product Flow Rate (cc/min) Product Composition (ppmv) Permeate Composition (ppmv) Permeate Pressure (torr) VOC Flux (gmol/ s cm2) VOC Percent Removal (%) Methanol E Methanol E Methanol E Toluene E Toluene E Acetone E Acetone E Acetone E Acetone E Acetone E * Feed pressure in all experiments was atmospheric ** Module 1 without any ILM
84 63 feed flow rate and the type of VOC used. As expected, the percent removal decreases as the feed gas flow rate increases (Figure 2.10). The permeate fluxes for acetone and methanol were almost in the same range; however, toluene permeate fluxes were much lower since toluene inlet concentration was only 2000 ppmv compared to the inlet concentrations (-1.0%) of the other two VOCs (Figure 2.10). On the other hand, the nitrogen flux is basically independent of the gas flow rate, but the VOC fluxes increase as the flow rate is increased giving higher selectivities (Table 2.4). As one can see, the purification of the gas stream depends on the feed inlet flow rate and the type of the VOC to be removed. For this set of steady state experiments, ugh percent removal (96-99 %) was accomplished for all VOCs regardless of the flow rate. Even at a flow rate of 250 cc/min, around 97% of toluene was removed. This corresponds to a flow rate of 0.84 cc/min/fiber. The permeate side vacuum was between 32 and 33 torr. In this case where a bare membrane was used, it appears that the silicone skin on the outer side of the hollow fibers was rather thin and therefore, ugher vacuum levels could not be achieved. The same module (Module 1) was used to study the effect of immobilizing silicone oil in part of the pores of the hollow fiber in order to marginally reduce the VOC fluxes and improve the separation factor considerably. The thin ALM preparation was previously described and it can be found in section (2.2.4). The nitrogen permeate flow rate was cut down from 37 cc/min to 3-4 cc/min. In order to study the benefit of the thin ILM, experimental conditions used were the same as in the experiments with bare membrane (Module 1). Table 2.5 shows the
85 Figure 2.10 Dependence of percent removal of VOCs and VOC flux on feed gas flow rate for the membrane without ILM. 64
86 Table 2.5 Flux and Percent Removal of VOCs from Nitrogen at Different Flow Rates and VOC Concentrations with ALM VOC Feed Composition (ppmv) Feed Flow Rate (cc/min) Product Flow Rate (cc/min) Product Composition (ppmv) Permeate Composition (ppmv) Permeate Pressure (torr) VOC Flux (gmol/ s cm2) VOC Percent Removal (%) Methanol E Methanol E Methanol E Toluene E Toluene E Toluene E Acetone E Acetone * 10.2 E Acetone E Acetone E Acetone E
87 66 flux and the percent removal for the hollow fiber module (Module 1) after immobilization of the silicone oil. The change in nitrogen flux and the separation factor before and after immobilization of silicone oil in the porous structure are shown in Figure As one can see, the nitrogen flux was reduced 7-8 times whereas the VOC flux was marginally reduced. The separation factor, which is defined as a ratio of VOC permeance to the permeance of nitrogen is plotted as a function of the feed gas flow rate. As one can see, the separation factor increased 5 to 20 times depending on the type of the VOC and the feed gas flow rate. The highest increase in separation factor was obtained for toluene, whose separation factor increased approximately 19 times. Another benefit of having the ILM incorporated in the porous structure is, that 2-5 times more concentrated permeate side stream is produced since the nitrogen flux was reduced (Figure 2.12). The permeate side composition for the case of methanol, acetone and toluene is plotted versus the gas flow rate; as the gas flow rate increases, the permeate side composition increased too, since the feed composition increased throughout the permeator length. It is known that for the silicone membrane, the VOC permeability will increase as the VOC concentration increases. The separation performance of the thin ALM was studied also using low concentrations of methanol or toluene by varying the feed gas flow rates and the inlet concentrations. Table 2.6 provides a summary of how the methanol flux and the percent removal varies with the flow rate when the inlet feed concentration was 292 ppmv. As one can see, high percent removal (-99.9 %)
88 Figure 2.11 Effect of silicone oil immobilization on the variation of Nitrogen flux and separation factor (Module 1). 67
89 Figure 2.12 Effect of silicone oil immobilization on the permeate side composition (Module 1). 68
90 Table 2.6 Flux and Percent Removal of Low Concentration of Methanol from Nitrogen at Different Flow Rates" VOC Feed Composition (ppmv) Feed Flow Rate (cc/min) Product Flow Rate (cc/min) Product Composition (ppmv) Permeate Composition (ppmv) Permeate Pressure (torr) VOC Flux (gmol/ s cm2) VOC Percent Removal (%) Methanol E Methanol E Methanol Ell 83.0 Methanol E Methanol E Methanol E Methanol E Methanol Ell 20.0 * Module 1 with ILM
91 70 can be achieved when the flow rate was around 50 cc/min. It is observed that at the given inlet methanol concentration, percent removal of methanol decreased with an increase in feed flow rate, e.g. for 600 cc/min it came down to 20% (Figure 2.13). This module was also tested for the performance and percent removal of methanol in the case where high to moderate flow rates ( cc/min) and lower inlet concentrations (from 180 to 68 ppmv) were used (Table 2.7). Highest percent removal (-99.99%) was achieved when the inlet gas flow rate was reduced to 100 cc/min and the inlet methanol concentration of 68 ppmv. Cenerally, it can be concluded, that the percent removal of VOC decreases as the feed inlet gas flow rate increases (Table 2.7). Table 2.8 summarizes the results of low inlet concentrations of toluene at different gas flow rates. For a feed composition of 215 ppmv, the percent removal decreases as the feed gas flow rate increases from 100 to 300 cc/min (Figure 2.13). Even though lower inlet concentrations and higher gas flow rates were used, toluene percent removal still stayed quite high ( 86%). If one compares the methanol and toluene results for the inlet feed gas composition of the approximately same level (-200 ppmv), it is obvious that better purification and removal was obtained for toluene since toluene has a much higher solubility in silicone oil than the other VOCs used in this study (Poddar et al., 1996; Xia et al., 1999). For the case of the higher inlet methanol concentration in a feed gas, the latter was varied from 13.7% to 8.9%, depending on the pure nitrogen gas flow rate and the blending ratio. As mentioned earlier, a high concentration of
92 Table 2.7 Flux and Percent Removal of Various Low Inlet Concentration of Methanol from Nitrogen at Different Flow Rates for the Membrane Containing Thin 1LM DOC Feed Composition (ppmv) Feed Flow Rate (cc/min) Product Flow Rate (cc/min) Product Composition (ppmv) Permeate Composition (ppmv) Permeate Pressure (torr) VOC Flux (gmol/ s cm2) DOC Percent Removal (%) Methanol E Methanol Ell 45.0 Methanol E Methanol E Methanol E * Module 1 with ILM
93 Table 2.8 Flux and Percent Removal of Low Concentration of Toluene from Nitrogen at Different Flow Rates for the Membrane Containing Thin 1LM* VOC Feed Composition (ppmv) Feed Flow Rate (cc/min) Product Flow Rate (cc/min) Product Composition (ppmv) Permeate Composition (ppmv) Permeate Pressure (torr) VOC Flux (gmol/ s cm2) VOC Percent Removal (%) Toluene E Toluene E Toluene E Toluene Ell 86.4 Toluene E " Module 1 with ILM
94 Figure 2.13 Dependence of percent removal and outlet concentration of Methanol and Toluene on flow rate with thin ALM (Module 1). 73
95 74 methanol was obtained by passing pure nitrogen at a certain flow rate through the liquid methanol. Lower inlet VOC concentrations in the same range of feed gas flow rate were obtained by blending the VOC-containing nitrogen gas stream with pure nitrogen gas stream in a certain ratio. The experimental results for high inlet concentration of methanol are presented in Table 2.9. It can be seen that at the flow rate of around 50 cc/min, 98% removal was achieved for the inlet feed composition of 8.9% and 10.9%. Percent removal of methanol was reduced to 77% at a higher nitrogen flow rate, although it had a somewhat higher inlet feed gas concentration (-12.9%). So far, ALMs were found unstable for the commercial application usually due to evaporation of the immobilized liquid or due to the inability of the ILMs to withstand the transmembrane pressure difference. Therefore, in order to show the stability of this system, an extended time stability run (upto six months) was performed with the Module 1 having a thin ALM. The shell side of this module was constantly exposed to the vacuum. The vacuum level was varied from 33 torr to 1.0 torr depending on whether an oilless or an oil lubricated vacuum pump was used. Nitrogen flow rate was first set at 50 cc/min and later reduced to 20 cc/min. The nitrogen permeate flow rate was estimated occasionally to ensure ALM stability by measuring the product flow rate. Once a week, an acetone-containing feed gas mixture having a composition of around 1% acetone/n 2 balance mixture was used in the experiment to determine the module performance for VOC removal. Results of this longterm stability run are plotted in Figure The results summarized in Table 2.10 are for Module 1 that was periodically used for
96 Table 2.9 Flux and Percent Removal of Methanol from Nitrogen at Different Cas Flow Rates for Various High Inlet Methanol Concentrations Using the Membrane Containing Thin ALM* DOCK Feed Composition Feed Flow Rate Product Flow Rate Product Composition Permeate Composition Permeate Pressure DOC Flux (gmol/ s VOC Percent (ppmv) (cc/min) (cc/min) (ppmv) (ppmv) (torr) cm) Removal (%) Methanol N.A E Methanol N.A E Methanol N.A E Methanol N.A E * Module 1 with ILM
97 E 16 8 (+6cep 22 HI 20 H 18 HI 14 O Q) (45 10 E CL 8 6H 4 H 2H Vacuum Level 33.0 torr v v V V 17 V Acetone Outlet Concentration (ppmv) Feed Flow Rate: 100 cc/min Inlet Acetone Concentration: 9500 ppmv Permeate flow rate (cc/min) \ -Vacuum Level 1.0 torr V V 7 V %V? % Ova..... % as v.:44.41w E aa 7500 O cc 5000 Du L t C(1) 0 se I L Elapse Time (Days) Figure 2.14 An extended duration run to determine membrane stability.
98 Table 2.10 Stability of Thin ILM Immobilized in Module 1 Periodically Used over Period of 2 Years Feed Feed Flow Product Permeate Permeate Date VOC Composition Rate Composition Flow Rate Pressure (ppmv) (cc/min) (ppmv) (cc/min) (torr) Acetone /29/99 Acetone /16/00 Acetone /26/01 * Module 1 with ILM
99 78 the VOC removal over a period of 2.0 years. Beside the extended run, a stable performance of the thin ALM was confirmed once more. As one can see, the nitrogen permeate flow rate was always around 3 cc/min and it stayed at that level throughout the whole duration of the experiment which indicates that this thin ILM was not deteriorating. In the same figure, the VOC outlet concentration was plotted versus the elapsed time. The level of VOC purification for a given module, the inlet concentration and the flow rate was always the same. A higher purification of the VOC was accomplished only when the oil lubricated vacuum pump was used since a much higher vacuum level was achieved ( 1 torr) which created a higher driving force for the VOC removal. Experimental results were also used to compare the results of these runs with those obtained by numerically simulating the mathematical model of the permeator. The procedure adopted to determine all parameters needed for the simulation have been described previously. The values of various parameters used for the simulations of VOC separation are given in Table Experimental results for determination of VOC permeance through the oil are summarized in Table Results for the medium and low ranges of VOC inlet gas concentrations from experimental data obtained with Module 1 with and without the ALM (Tables 2.4, permeance and in both cases the VOC outlet concentrations were well anticipated. The results of numerical simulations are plotted along with the
100 Table 2.11 Description and Values of Parameters used in Simulation of VOC Permeation with Thin ALCM of Silicone Oil Description of the parameter, unit Value Feed: Toluene/N2, Me0H/N2, Acetone/N2 Length of the fibers, cm 20.5 Experimental Temperature, C 25.0 "a" of (Q.,c)=a*exp(b*pv.c), gmol/cm 2cmHg s E-10 Toluene; 80.0 E-10 Me0H; E-10 Acetone "b" of the above equation, 1/atm 50.0 Toluene; 25.0 Me0H; 22.0 Acetone "a(n2)" of (QN2)=a(N 2)*exp(b*pN2), gmol/cm 2cmHg s 6.0 E-10 "b(n 2)" of the above equation, 1/atm 0.0 Toluene 4.3E-8 DOC permeance through fuli ILM 8IFuli no coating, Methanol 1.0E-9 gmol/cm 2cmHg s Acetone 1.5E-9 N2 permeance through full ILM 8IFull no coating, gmol/cm 2cmHg s 1.3 E-11 Toluene 2.0 E-7 VOC permeance through thin ALM 45 1 no coating, Methanol 5.3E-9 gmol/cm2cmhg s Acetone 7.7E-9 N2 permeance through thin ILM 8 1 no coating, gmol/cm2cmhg s 9.0 E-11 Pressure of the feed inlet, cmhg Atmospheric Pressure on the vacuum side, cmhg Experimental value Viscosity of the N2 at 25 C, poise (g/cm s) E-7 Flow rate of the gas, cm 3/min Experimental value Mol fraction of VOC at the feed inlet Experimental value i.d. of the fiber, cm E-4 o.d. of the fiber, cm E-4 *Number of fibers 300 Module 1
101 Table 2.12 Experimental Results for VOC Removal using Module 2 for Determination of VOC Permeance through the Silicone Oil DOC Feed Composition (ppmv) Feed Flow Rate (cc/min) Product Composition (ppmv) Product Flow Rate (cc/min) Permeate Pressure (torr) Percent Removal (%) Methanol Toluene Acetone
102 81 experimental values in Figures 2.15 to The results from the model are shown as dashed lines in the same figures. It is clear that the experimental results are described reasonably weli by the simulated results from the mathematical model. The same holds true also for the results of Figure Experimental Results for Steady State Removal of Methanol Containing Water Vapor using Thin ILM The results for water vapor permeation measurements with or without a silicone oil-based immobilized liquid membrane (ILM) are presented and discussed here. Removal of methanol (MeOH) from the humidified nitrogen stream via steady state vapor permeation through the full ILM was also tested. Module 5 (Table 2.2) prepared in the laboratory from plasmapolymerized silicone coated fibers obtained from Applied Membrane Technology (AMT Inc., Minnetonka, MN) was used to determine the water permeance through the silicone skin. Also, the same module was used to determine the MeOH and acetone permeances. To characterize the membrane, N2 and CO2 permeation flow rates across the bare membrane having only a silicone skin on the OD were measured to determine their permeances through the silicone skin (Q/5)c, and the CO2 / N2 separation factor (Table 2.3). The extents of VOC removal from the MeOH/N 2 gas mixture and acetone/n 2 gas mixture were studied using the bare membrane (Module 5). The feed gas flow rate was varied in the range of cc/min; the
103 Figure 2.15 Variation of Acetone outlet concentration with feed inlet flow rate and comparison of experimental and simulation results. 82
104 Figure 2.16 Variation of Methanol outlet concentration with feed inlet flow rate and comparison of experimental and simulation results. 83
105 Figure 2.17 Variation of Toluene outlet concentration with feed inlet flow rate and comparison of experimental and simulation results. 84
106 85 acetone and methanol inlet concentrations used were 5900 ppmv and 292 ppmv respectively. Based on these measurements, it appears that the fibers in Module 5 have a somewhat thicker silicone skin than those in the Module 1 without the thin ALM. These results are summarized in Table Water vapor permeance through the silicone skin was measured using Module 5 (Table 2.14). Water vapor transport measurements were conducted using either the vacuum pump on the shell side or passing dry N2 as a sweep gas. Water vapor permeances through the silicone skin under the vacuum condition were in the range of cm 3/cm2 s cmhg. When the sweep gas technique was used, under the constant feed flow rate and different feed gas pressures water permeance values varied between cm 3/cm2 s cmhg. In order to determine any benefit of the silicone oil for MeOH removal from the humid N2 stream, water vapor transport across the fully immobilized ILM of silicone oil was determined using Module 2. Humidified N2 gas was passed through the bore of the hollow fibers while vacuum or dry N2 gas on the shell side was passed as a sweep gas. Water vapor effective permeance through the fully immobilized silicone-oil membrane values varied from 6.7"10-5 to cm 3/cm 2 s cmhg depending on the feed pressure and experimental conditions. For similar experimental conditions, e.g. shell side exposed to vacuum and feed gas is under atmospheric conditions, water vapor permeance through the silicone skin is much higher than that through the full 1LM. When a dry sweep gas was used along with the similar experimental conditions, water vapor effective
107 Table 2.13 Flux and Percent Removal" of VOCs from Nitrogen at Different Feed Flow Rates and VOC Concentrations for Module 5 DOC Feed Composition (ppmv) Feed Flow Rate (cc/min) Product Flow Rate (cc/min) Product Composition (ppmv) Permeate Composition (ppmv) Permeate Pressure (torr) DOC Flux (gmol/ s cm) DOC Percent Removal (%) Methanol E Methanol E Methanol E Acetone E Acetone E Acetone E * Feed pressure in all experiments was atmospheric ** Module 5 without any ILM
108 Table 2.14 Water Vapor Flux in Module 5 without a Thin ALCM Experimental Conditions Shell side: vacuum 29 in Hg Feed side: atmospheric Product flow rate: 303 cc/min t= 21.3 C Shell side: vacuum 28.9 in Hg Feed side: atmospheric Product flow rate: 149 cc/min t= 20.5 C RHin (0/0) Rout (To Feed Flow Rate (cc/min) Water Vapor Flux (cc/cm 2 sec) Water Vapor Permeance (cc/cm2' sec cmhg) E E E E-4 Shell side: dry N2 sweep gas Sweep flow rate: 40 cc/min Feed side: atmospheric E E-5 Product flow rate: 58 cc/min t= 25.1 C Shell side: dry N2 sweep gas Sweep flow rate: 42.8 cc/min Feed side: 5 psig E E-5 Product flow rate: 55 cc/min t= 23.8 C
109 Table 2.14 Water Vapor Flux in Module 5 without a Thin ILM (Continued) Experimental Conditions RH, n (%) Rout (%) Feed Flow Rate (cc/min) Water Vapor Flux (cc/cm sec) Water Vapor Permeance (cc/cm sec cmhg) ShelI side: dry N2 sweep gas Sweep flow rate: 47.0 cc/min Feed side: 10 psig E E-5 Product flow rate: 51.3 cc/min t= 22.3 C ShelI side: dry N2 sweep gas Sweep flow rate: 48.6 cc/min Feed side: 13 psig E E-5 Product flow rate: 49.7 cc/min t= 23.2 C
110 89 permeances determined are not far apart, e.g. silicone skin crn3/cm2 s cmhg and for full ALM is cm 3/cm 2 s cmhg. The extent of MeOH removal along with the water vapor transport across the composite membrane was measured through the fuli ALM. For this experiment, humidified nitrogen gas stream was mixed with the dry MeOH/N 2 feed gas mixture. The MeOH/N 2 humidified gas mixture was analyzed with the CC in order to determine the inlet gas composition. The feed gas mixture was passed through the tube side of the hollow fiber module while vacuum was applied to the sheli side. Inlet and outlet relative humidities were measured to determine water vapor permeance. The product stream was analyzed with the CC to determine the MeOH permeance and percent removal. Water vapor and MeOH permeances were cm 3/cm 2 s cmhg and cm 3/cm 2 s cmhg respectively. The experimental results are provided in Table Water vapor flux was calculated based on the temperature and the relative humidities of the inlet and outlet feed gas streams. The saturation vapor pressure (psat) for water vapor was obtained from Perry (1984) at a given temperature. The mole fraction of water vapor at saturation is given as
111 Table 2.15 Water Vapor Flux Using Module 2 with FulI ALM without Silicone Skin Experimental Condition ShelI side: vacuum 29.5 in Hg Feed side: atmospheric Product flow rate: 10.4 cc/min t= 18.1 C Rain Lk) Rout (%) Feed Flow Rate (cc/min) Water Vapor Flux (cc/cm2 sec) Water Vapor Permeance (cc/cm 2 sec cmhg) 1.7 E E-5 ShelI side: vacuum 29.4 in Hg Feed side: 1.0 psig Product flow rate: 20.7 cc/min t= 21.0 C ShelI side: vacuum 29.4 in Hg Feed side: 2.5 psig Product flow rate: 42.6 cc/min t= 21.0 C E E E E-4 Shell side: vacuum 29.3 in Hg Feed side: 4.0 psig Product flow rate: 82.7 cc/min t= 23.3 C E E-4
112 Table 2.15 Water Vapor Flux Using Module 2 with FulI FILM without Silicone Skin (Continued) Experimental Condition Rain (%) Ragout (%) Feed Flow Rate (cc/min) Water Vapor Flux (cc/cm2 sec) Water Vapor Permeance (cc/cm sec cmag) Shell side: dry N2 sweep gas Sweep flow rate: 30.0 cc/min Ra(%)sweer_: 30.9, t= 16.2 C Feed side: 2.0 psig E E-5 Product flow rate: 41.5 cc/min tin = 17.8 C, t in = 17.1 C ShelI side: dry N2 sweep gas Sweep flow rate: 30.0 cc/min Ra(%)s weer : 18.6, t= 17.5 C Feed side: atmospheric Product flow rate: 11.0 cc/min tin = 17.4 C, t in = 17.4 C E E-5 ShelI side: vacuum 29.4 inag RH( /0) sweer: 30.9, t= 16.2 C Feed side: 2.0 psig Product flow rate: 36.0 cc/min t in = 16.8 C, tin = 16.4 C E E-5 % Removal MeOa: 38 Chin: 214 ppmv, Li,: 141ppmv MeOH:2.2E-5 cc/cm2 cmag
113 92 Finally, water flux can be calculated using following expression In calculating the driving force when the shell side was exposed to the relatively high vacuum, the permeate pressure was assumed to be close to zero. Therefore, the driving force is calculated based on the feed side conditions only. When the sweep gas technique was used, the driving force was calculated based on the feed side and/or sweep side measurements. A sample calculation is provided in Appendix C Experimental Results for Cyclic Mode of Operation for Removal of VOCs The experimental results for the cyclic process are presented here. After Module 1 was immobilized with a thin layer of silicone oil in the porous structure, the hollow fiber module was used to study the effect of the cyclic mode of separation. The cycle time, T cyce, was varied from 1.6 to 20 seconds. A number of experiments were carried out using Module 1 in the steady state mode of operation to investigate the benefit of the cyclic process. The product flow rate, which fluctuates due to the cyclic mode of operation, was calculated based on the
114 93 average value of all flow rates measured at the product surge drum outlet. Due to the change in the cycle times, it was quite difficult to maintain constant inlet feed gas flow rate or atmospheric condition on the bore side. Therefore, the feed side pressure was changing from to 4.0 psig. In order to avoid problems due to unsteady operations, later, two apparently identical hollow fiber modules were prepared and studied. Table 2.16 illustrates the results obtained from a cyclic mode of separation of methanol, toluene and acetone from the feed N2 stream. Initially, the separation performance was studied with Tcycle=20 seconds, e.g. tabs/reg =- 1 0 seconds. The VOC inlet feed gas mixture flow rate was varied from 100 cc/min to 250 cc/min. As the feed gas flow rate was decreased, the VOC concentration in the treated surge drum was reduced also to different concentrations depending on the type of the VOC and inlet feed gas concentration. In all cases, the feed gas flow rate was set to various values ( cc/min), whereas the actual inlet gas flow rate was more then 50% lower than the set value. This discrepancy occurred due to a difference in pressures on the feed side and the bypass line. During the absorption part of the cycle, the feed gas was under a certain pressure ( psig). Once the regeneration part of the cycle was started, feed flow was directed to the bypass line, which was open to the atmosphere. Therefore, once the feed gas was sent again through the bore of the fiber for the absorption part of the cycle, the surge drum acted as a backpressure regulator. Consequently, the feed gas was repressurized to the initial set value maintained by the surge drum. As a result, more gas was going through the bypass line than
115 Table 2.16 Experimental Results for Constant Cycle Time and Variable Inlet Cas Flow Rate for Removal of VOC Using Module 1 with an ALM DOC Cycle Time abs/reg (sec) Feed Composition (ppmv) Product Composition (ppmv) Set Feed Flow Rate (cc/min) Product Flow Rate (cc/min) Feed Pressure (psig) Permeate Pressure (torr) Methanol 10/ Methanol 10/ Methanol 10/ Toluene 10/ Toluene 10/ Acetone 10/ Acetone 10/ Acetone 10/
116 95 through the lumen of the fiber module. In the case where one hollow fiber module was used, it was not feasible to measure the actual inlet gas flow rate. The estimate of the actual feed flow rate would be the sum of the measured product flow rate and permeate flow rate. This discrepancy is due to the surge drum pressure, which was maintained in order to draw a constant product flow for the CC analysis. Methanol product concentration increased from 444 ppmv to 2210 ppmv as the set inlet feed gas flow rate was increased from 100 to 200 cc/min maintaining the same cycle time (r cycle =20 seconds). As the set gas flow rate was increased, the surge drum pressure was also increased from psig. The same was observed for toluene, where the gas flow rate was set at 150 cc/min and 250 cc/min and accordingly the product concentration changed from 16 ppmv to 83 ppmv. For 1.1% acetone inlet concentration, the product composition changed from 490 ppmv to 2560 ppmv as the gas flow rate was increased from cc/min. Experimental results for acetone and methanol where the cycle time was varied for a constant feed gas flow rate are presented in Table This table illustrates that an increase in tabs from 0.8 seconds to 1.6 seconds (correspondingly _a s Tcycle from 1.6 seconds to 3.2 seconds) increases the acetone concentration from 260 ppmv to 445 ppmv in the treated gas while the surge drum pressure was close to atmospheric. When the surge drum pressure was around 2 psig and t abs was changed from 2.0 seconds to 10 seconds the product concentration increased from 140 ppmv to 490 ppmv. One can notice that the increased surge drum pressure and tabs =2 seconds improved the acetone removal despite the fact that at
117 Table 2.17 Experimental Results for Different Cycle Times and a Constant Inlet Cas Flow Rate for Removal of Acetone and Methanol Using Module 1 with Thin ALM DOC Cycle Time a abs/reg (sec) Feed Composition (ppmv) Product Composition (ppmv) Set Feed Flow Rate (cc/min) Product Flow Rate (cc/min) Feed Pressure (psig) Permeate Pressure (torr) Acetone 0.8/ Atmospheric 17.9 Acetone 1.6/ Atmospheric 17.6 Acetone 2/ Acetone 10/ Methanol 1.6/ Atmospheric 17.4 Methanol 2.0/ Atmospheric 17.4
118 97 atmospheric conditions the absorption cycle time was lower (t k =0.8 seconds) which corresponds to the product composition of 140 ppmv and 260 ppmv. This is because the partial pressure driving force for VOC removal was higher for the elevated surge drum pressures. In the case of methanol, the feed pressure was maintained close to atmospheric, t abs cycle times of 1.6 and 2.0 seconds gave the product composition of 410 to 425 ppmv respectively for a gas flow rate of 100 cc/min. In order to study the benefit of the cyclic process, a set of steady state experiments was also performed with Module 1 and the results are given in Table As one can see, the feed gas pressure for different inlet gas flow rates was atmospheric whereas in the cyclic process it was varied from 1.0 to 4.0 psig. Therefore, one experiment under steady state conditions was done at a feed gas pressure of 3.5 psig. The benefit of the increased partial pressure driving force was apparent as better purification of the product stream was achieved. Difficulties of measuring and matching the actual feed gas flow rates and maintaining the feed pressure at the same level in both modes of operations, made comparison of the potential advantage of a cyclic over a steady state process in terms of the product purification much harder (comparing Table 2.17 and Table 2.18). Therefore, to overcome these problems, two identical modules (Modules 3 and 4) were prepared for the cyclic mode experiments and their characteristics are given in Table 2.2. Initially both modules were tested in a steady state mode of operation in order to get a base line of their performances. These results are presented in Table Nitrogen permeation rate for Module 3 was around 10
119 Table 2.18 Experimental Results for Steady State Runs and Various Inlet Cas Flow Rates for Removal of Acetone, Toluene and Methanol Using Module 1 with Thin ILM DOC Cycle Time abs/reg (sec) Feed Composition (ppmv) Product Composition (ppmv) Set Feed Flow Rate (cc/min) Product Flow Rate (cc/min) Feed Pressure (psig) Permeate Pressure (torr) Acetone none Atmospheric 17.9 Acetone none Atmospheric 17.4 Acetone none Atmospheric 18.0 Acetone none Atmospheric 18.0 Acetone none Atmospheric 19.1 Acetone none
120 Table 2.18 Experimental Results for Steady State Runs and Various Inlet Cas Flow Rates for Removal of Acetone, Toluene and Methanol Using Module 1 with Thin ILM (Continued) VOC Cycle Time a bs/reg (sec) Feed Composition (ppmv) Product Composition (ppmv) Set Feed Flow Rate (cc/min) Product Flow Rate (cc/min) Feed Pressure (psig) Permeate Pressure (torr) Toluene none Atmospheric 17.9 Toluene none Atmospheric Toluene none Atmospheric 17.9 Toluene none Atmospheric 17.4 Methanol none Atmospheric 17.5 Methanol none Atmospheric 19.1
121 Table 2.19 Experimental Results for Steady State Runs at Different Inlet Cas Flow Rates for Removal of Acetone and Methanol Using Modules 3 and 4 DOC/Module Number Feed Composition (ppmv) Product Composition (ppmv) Feed Flow Rate (cc/min) Product Flow Rate (cc/min) DOC Permeate Flux (gmol/cm2s) Permeate Pressure (torr) Percent Removal (%) Acetone E Acetone E Acetone E Acetone E Acetone E Methanol E Methanol E Methanol E
122 101 cc/min and for Module 4 around 15 cc/min. This indicated thicker silicone skin on the outer diameter of the hollow fibers in the case of Modules 3 and 4 than in Module 1. In addition, lower acetone permeate flux was observed for Modules 3 and 4 than it was for Module 1. In order to demonstrate the potential benefit of the cyclic process, Modules 3 and 4 were studied in parallel and in series during the steady state operation. For the same inlet acetone containing gas flow rate of 100 cc/min. product compositions of 1060 ppmv and 1030 ppmv were achieved in the two cases of parallel and series connections. In addition to the two different connections of Modules 3 and 4, the effect of the different cycle time was studied. Results obtained under steady state and cyclic mode of operation after a considerable number of cycles (after 2-3 hours) are reported in Table For the same gas flow rate of 50 cc/min, as cycle time was changed from 2 to 4 seconds, product concentration increased from 350 ppmv to 410 ppmv. Similarly, as cycle time was increased from 4 to 10 seconds while gas flow rate was set at 100 cc/min, acetone concentration increased from 1100 ppmv to 1160 ppmv at the outlet. As one can see, lower cycle time offer lower product concentration, but the obvious benefit of cyclic process over the steady state was hard to conclude since product concentrations differ only by 40 ppmv.
123 Table 2.20 Comparison of the Steady State and Cyclic Process Using Modules 3 and 4 in Series or Parallel for Removal of Acetone VOC/Module Number Cycle Time abs/reg (sec) Feed Composition (ppmv) Product Composition (ppmv) Feed Flow Rate (cc/min) Product Flow Rate (cc/min) Permeate Pressure (torr) Acetone (in parallel) none Acetone (in series) Acetone (in series) Acetone (in parallel) none none Acetone (in parallel) Acetone (in parallel) Acetone (in parallel)
124 Conclusions The following conclusions were drawn from this study on the effect of immobilizing silicone oil in part of the porous substrate of the hollow fibers for VOC separation from N2, water permeation and a cyclic process configuration: The separation factor of each VOC over nitrogen was increased 5-20 times depending on the VOC and the feed gas flow rate. Nitrogen flux was reduced 7-12 times whereas the VOC flux was marginally reduced resulting in more VOC-enriched permeate stream. The thin ALM based hollow fiber can remove 99.9% of methanol and toluene for moderate flow rates ( cc/min) and low inlet concentrations ( ppmv). aigh percent removal (98.9%) was also achieved for very high inlet methanol concentrations and a gas flow rate of 50 cc/min. This gas flow rate corresponds to cc/min/fiber. The thin I1LM based hollow fiber membrane showed an extraordinary stability over an extended period of time (6 months - 2 years); this provides a basis for its potential larger-scale application in VOC-N 2/air separation. A numerical model for VOC separation describes the VOC removal from a N2 stream satisfactorily when using experimentally determined parameters e.g. effective permeances through thin silicone oil, PDMS coating and overall permeance for N2 and VOC for low and moderate VOC levels in the feed gas stream.
125 104 Under similar experimental conditions, the effective water vapor permanence of silicone skin and full ALM are quite close. Although the thickness of the fuli ILM is much higher than the plasmapolymerized skin, silicone oil appeared quite permeable to the water vapor. This is considered possible due to the larger diffusion coefficient though the oil. The effect of the cyclic time on the product purity was studied. Lower cyclic times offer better product purification. The limited data did not allow any conclusion to be drawn regarding the benefit of cyclic process over steady state vapor permeation.
126 CHAPTER 3 SELECTIVE REMOVAL OF CARBON DIOXIDE FROM NITROGEN GAS STREAM USING IMMOBILIZED LIQUID MEMBRANES (ILMs) 3.1 Introduction Large amounts of carbon dioxide (C0 2) are generated when fossil fuels/natural gases are burnt or used in chemical processes. Emissions from these sources are potential cause for global warming. Therefore, one of the main objectives of environmental control is the elimination and/or control of C0 2 emissions into the atmosphere. Besides the environmental concerns, higuy CO 2- selective membrane is also needed for space applications where C0 2 has to be selectively removed from the crew compartments in order to regenerate the breathing air. For the space application, it is especially important to develop new membranes with higher CO 2 permeances which however must possess very high C02-02, C02-02 selectivities. The most common device to remove CO 2 from such gas streams is the conventional absorption column using reactive liquids in order to increase the absorption rate and capacity. An aqueous solution of say, sodium hydroxide, sodium carbonate, monoethnolamine (MEA) or diethanolamine (DEA) (Danckwerts, 1970) is typically used in contacting columns for absorption and removal of C02. These conventional processes are energy intensive; in addition, they often have numerous operational problems (e.g. foaming, flooding etc.). 105
127 106 One of the alternatives to the conventional absorption process is a hydrophobic microporous membrane based gas-liquid contacting device where the absorption liquid flows on one side of the membrane and the gas flows on the other. Membrane-based contactors have several advantages over conventional packed columns: very larger interfacial area per unit volume (as much as times larger) and independent control of liquid and gas flow rates without flooding, foaming etc.. They have been studied extensively by several authors for absorption of various gases in different applications (Qi and Cussler, 1985; Karoor and Sirkar, 1993; Rangwala, 1996). Traditionally thin nonporous membranes are used for gas separations by permeation where the transport mechanism through such a membrane is based on solution-diffusion. A gas species dissolves in a membrane and diffuses across due to the concentration gradient. In the case of a synthetic polymeric membrane, selectivity and permeability are in general inversely related. Ideally, the membrane should not only be higuy permeable to the species of interest, but it should maintain a high selectivity to be economically competitive. The gas species mass flux and permeability can be increased if a liquid solvent is immobilized in a microporous membrane substrate. This immobilized liquid membrane (ALM) may have an added advantage since gaseous species have higher diffusivities through a liquid than through a solid. Further, an increase of mass flux and selectivity can be achieved if the liquid reversibly reacts with the species to be removed. This phenomenon in membranes is known as the facilitated transport mechanism and the membranes are called facilitated transport
128 107 membrane (FTM). The complexation reaction is another transport mechanism in addition to the solution-diffusion mechanism. The basic reaction mechanism between the carrier and the permeating species (e.g. CO 2) can be written as The equilibrium of the complexation reaction must provide a balance between the complexation and the reverse reaction to recover the permeate and the carrier. The FTMs can offer high carbon dioxide (CO2) permeances along with high selectivities. Therefore they have a good potential for industrial and space applications if one can overcome the liquid membrane stability problem. Facilitated transport membranes (FTM) have few basic configurations: emulsion liquid membranes (ELM) ion - exchange membrane (I EM) immobilized liquid membrane (ILM) fixed-site carrier membranes. Among these basic configurations of FTMs, immobilized liquid membrane (ILM) is the least stable form. Since, the advantage of ILM is that of a simple process design, increasing the membrane stability is of considerable interest. The standard way of preparing a facilitated transport membrane in the form of an ILM is to impregnate the porous membrane matrix with the liquid solution containing the carrier of interest. Microporous supports are selected based on pore size, porosity, thickness and surface properties. It is desirable that the liquid membrane solution easily wet the membrane to prevent gas leakage. The tortuosity of the membrane,
129 108 the membrane porosity and the membrane support thickness will strongly influence the permeant flux. Facilitated transport of carbon dioxide across the ALM containing a primary amine as the carrier is shown in Figure 3.1. The C0 2, which is dissolved on the feed side boundary reacts with the carrier and diffuses across the ALM as a carbamate ion along with the dissolved CO 2 due to their concentration gradients. Once both species reach the sweep side boundary, the complexation reaction is reversed and free C0 2 is released from the liquid membrane. The amine diffuses back to the feed side boundary to form a complex again. One of the earliest studies on facilitated transport started with a biological system and it was conducted by Scholander (1960) for selective separation of oxygen (0 2)/air gas mixture using a hemoglobin solution. In the beginning, removal of CO 2 across an aqueous bicarbonate film was studied by Langmuir et al. (1966). Many more studies on facilitated CO 2 transport using aqueous based IILMs containing various carriers were conducted e.g. bicarbonate (Ward and Robb, 1967; Otto and Quinn, 1971), diethanolamine (DEA) (Cuha et al., 1990; Teramoto et al., 1996) and ethylenediamine (EDA) (Matsuyama et al., 1994). An earlier review paper is by Melon et al. (1982). aowever, for industrial applications, these membranes lack stability due to evaporation of the carrier and/or the solvent. In addition, allowable transmembrane pressure difference is limited since the liquid is held only by capillary forces in the pores of the porous substrate.
130 Feed Cas Side Liquid Membrane Sweep Cas Side PCO2 CO C CO RNa 2-2R0H C0 2 CO2 L RH0CO2 -- RH0CO2 + + RHNI Ra0 a2 + N2 N2 PIP' N2 X = 0 X = tm Figure 3.1 Facilitated transport of Carbon Dioxide through an immobilized liquid membrane.
131 110 Many efforts were made to overcome the stability problem of the ILM membranes for CO 2 removal. In order to increase the ILM stability, different low volatility and hygroscopic liquids were investigated. Polyethylene glycol (PEC) (Meldon et al., 1986; Saha and Chakma, 1995; Kim et al., 2001) and in the most recent studies, glycerol (Chen et al. 1999, 2000, 2001), glycerol carbonate (Kovvali and Sicker, 2002) were tested as the ALM solvent. In addition, molten salt hydrates were studied to improve the ILM stability (Quinn et al., 1995). Use of nonvolatile carriers like sodium bicarbonate (Otto et al., 1971), sodium carbonate (Chen et al., 1999), sodium glycinate (Chen et al., 2000, 2001) instead of volatile carriers e.g. (EDA, MEA etc.) increased ALM stability. Kovvali et al. (2000) studied the possible application of generation zero polyamidoamine (PAMAM) dendrimer as a carrier or pure liquid membrane in order to further increase the ALM stability and C0 2 permeance. The study showed that when pure PAMAM dendrimer is used as the liquid membrane, an % inlet relative humidity (Ra) feed gas is needed for a stable ALM. On the other hand, PAMAM-glycerol based FILM overcomes the higher inlet Ra requirements. Clycerol as an ALM solvent showed very good performance in terms of stability and high C0 2 permeance for different inlet relative humidities. This solvent is higuy viscous, has a vanishingly low vapor pressure and it is hygroscopic. This highly viscous liquid has advantages and disadvantages. The advantage is that the non-reacting species, (e.g. nitrogen and oxygen), have a low solubility and quite low permeability through this ALM. Therefore, this ILM can give a high selectivity if CO 2 transport is augmented by reversible reactions.
132 111 aowever, due to the high viscosity, the transport rate of the carrier through the ALM membrane is reduced, giving lower CO 2 permeability. Clycerol-based ALMs were studied with different carriers e.g. sodium carbonate or Na-glycinate (Na 2Ca 2COONa) immobilized in a variety of the hydrophilic microporous substrates in the form of flat sheet or hollow fibers. These membranes showed good stability under various humidity levels and C0 2 partial pressures. The glycerol based IALMs were initially studied as a potential application for removal of CO 2 from a breathing gas mixture. For the space suit application, the required C0 2 permeance has to be of the order of cc/cm 2 s cmag and has to have a C selectivity of The glycerol-based ALM study using sodiumglycinate as a carrier by Chen et al. (2001) achieved, however, an effective CO2 permeance value of cc/cm 2 s cmag. The selectivity required was easily exceeded. There are many variables that affect the C0 2 facilitated transport e.g. carrier concentration, feed gas relative humidity and ALM thickness. As the carrier concentration increases, initially C0 2 transport increases due to higher concentration of complexation agent available to move CO2 across the ILM. Initially the C0 2 permeance reaches a maximum and then it starts to decrease as the increased carrier concentration inhibits the complex mobility due to higher solution viscosity and decreased free C0 2 solubility. Chen et al. (1999, 2000) studied the effect of the initial Na 2CO 3 and Na-glycinate concentration in the ALM on C0 2 and N2 permeabilities and selectivity. Their study showed that sodium glycinate has higher solubility in glycerol than sodium carbonate. Clycerol-based
133 112 solution with high Na-glycinate concentration (up to 5M) could be easily prepared. Therefore, most of the facilitatied transport experiments in this study will be done using glycerol-based ALM containing Na-glycinate salt as a carrier. Sodium glycinate is very soluble in glycerol and reacts rapidly with CO 2, which is very important for rapid C0 2 transport across the ALM. The reaction mechanism between sodium-glycinate and C0 2 is given below. Dissociation of sodium-glycinate in the presence of water can be written as Like other primary amines (e.g ethanolamine) glycinate reacts with CO 2 to form carbamate The overall reaction is given as Feed relative humidity (Ra) influences the water content needed for the CO 2 reaction mechanism (Chen et al. (1999, 2000)). The permeances of CO 2 and N2 increase with increasing Ra and with decreasing membrane thickness. In order to increase the CO 2 permeability, ugher carrier concentrations are used or thinner liquid membranes are prepared. An effort to prepare a thinner ALM in a flat sheet membrane was made by Chen et al. (2000) by controlled coating method. Efforts
134 113 to reduce the thickness of ALM in the same substrate in order to increase C0 2 permeance succeeded; however, the selectivities were affected. A recent study (Matsuyama and Teramoto, 1996), has indicated that new types of cation-exchange membranes prepared by grafting acrylic acid to microporous polypropylene (PE), polytetrafluoroethylene (PTFE) or poly[1- (trimethylsily1)-1-propyne] (PTMSP) microporous substrates by plasma graft polymerization technique showed considerable increase of C0 2 permeance when immobilized with water-amine solutions. This improved performance and stability is most probably due to high ion-exchange capacity since the cationic carrier was immobilized in a cation-exchange membrane by strong electrostatic forces. These membranes were stable only when both feed and sweep gases were completely humidified, since the liquid membrane was a water/eda solution. In terms of carbon dioxide permeance (1*10 4 cc/cm 2 s cmhg) and 4700 selectivity, the requirements for the space vehicle application are met; however, EDA will be lost with time since it is a volatile compound and it is not an environmentally friendly carrier. These two aspects are still to be resolved. The focus of tus study is to enhance the CO 2 permeance in hollow fiber membrane modules by reducing the ILM thickness either by immobilization of the liquid membrane into thin acrylic acid (AA) grafted layers on top of the porous hollow fibers or by pressurization technique. In the first approach, immobilization of the solvent/solution on the AA grafted part of the porous hollow fibers will produce the thinner ALCM. In this manner, the thickness of the ALM will be equal to the thickness of the grafted part
135 114 of the hollow fiber, which is much smaller than the thickness of a fully immobilized liquid membrane. Another way to create a tun film was explored by Kovvali (2001) using the pressurization technique on ceramic tubes. A purely physical solvent e.g. glycerol carbonate was used. The solvent previously showed a good C0 2/N2 selectivity (90-130); the selectivity was not dependent on the inlet relative humidity and CO 2 concentration. The same study showed that the true CO 2 permeability is essentially independent on the substrate thickness and the C0 2-N2 selectivity can be easily retained. Therefore, if the ILM thickness can be drastically reduced to say, less than 10 an, it would increase the effective CO2 permeance. The pressurization technique will be tested here with asymmetric polymeric hollow fiber membranes and membrane formed from ceramic materials. Most asymmetric membranes consist of an open structural support at the bottom, which provides mechanical stability and a dense film layer at the top where separation is taking place. The thickness of the separating layer is only 1-10% of the total membrane wall thickness. aowever, alumina-based ceramic membranes were made using two kinds of particles. The support layer was made by deposition of larger a-alumina particles and the surface or separating layer was made by deposition of smaller y-alumina particles. Therefore, once the membrane is fully immobilized with the solvent/solution, a progressively increasing applied pressure AP= (P I-P2) across the membrane will correspondingly expel parts of the solvent/solution from the pore. Figure 3.2 describes the principle of making the

136 P2 P1 Ali < API < API PI lirp4 l/rp2 1/rp3 lirp4 P 1 >P2 AP=(P 1 -P 2) Figure 3.2 Preparation of a thin ALCM in an asymmetric membrane by pressurization technique.
137 116 thin ILM by progressively increasing the applied AP = (P1-P2) in an asymmetric polymeric/ceramic membrane. In the first step of pressurization, the liquid from the largest pore region wili be expelled first. As AP=(PI-P2) is gradually increasing, liquid from the smaller pore regions will be displaced subsequently. The excess liquid that is displaced from the pores has to be removed from the membrane surface. If the applied AP pressure across the membrane is large enough, a tun ILM with a thickness equal of close to the thickness of the separation layer can be made. aence, ceramic membrane tubes are inherently a better choice for a pressurization technique, since they are able to withstand very high transmembrane pressures imposed. As a result, a very thin ILM could be prepared if an appropriate ceramic support is available. In this study, the focus of the facilitated transport ILM will be on making thinner films either by using the AA-grafted fiber or by the pressurization technique. Preparation of thinner ALMs is studied in order to increase the C02 permeance to the desirable levels for the space application, while preserving the stability of the liquid membrane and creating a nontoxic and environmentally friendly ILM. 3.2 Experimental Types of Experiments 1. For determination of C0 2/N 2 permeances across the full/thin ALM, hydrophilized and hydrophilic polymeric hollow fiber membrane substrates
138 117 were used. Feed CO2/N2 mixture having an appropriate relative humidity was passed either through the bore side or the shell side, while dry He as a sweep gas was passed on the opposite side. The separation factor between C0 2 and N2 was estimated based on the permeance measurements of both species. 2. To study the change of the CO2/N2 permeances due to reduced thickness ALMA, hollow fibers of hydrophilic polymeric membranes and ceramic substrates were used. 3. To study the effect of different CO2/N2 inlet composition on C0 2 permeance and facilitated transport, hydrophilic hollow fiber membranes were used Chemicals, Gases, Membranes and Modules Most experiments using hydrophilized hollow fiber membranes were conducted using 0.5% C02/N2 balance mixtures. To study the effect of the different feed gas CO2 concentration on the facilitated transport of C0 2 across the membrane, inlet C0 2 concentration was varied between 0.5% -25% balance nitrogen. Hydrophilized polymeric hollow fiber membrane substrates were immobilized with glycerol based ALCM containing Na-glycinate as a carrier, water based ILM containing Na-glycinate or EDA as a carrier or a glycerol-water based I LM containing Na-glycinate as a carrier. Hydrophilized polymeric hollow fiber membrane and ceramic substrates were used to study the thinning of the ALM via
139 118 pressurization when glycerol carbonate was used as a physical solvent for a liquid membrane. 2. Pure gases: nitrogen zero; helium zero; air zero. Solvents used for ILM preparation were glycerol CC 99% (Sigma Chemical Co., St. Louis, MO); and glycerol carbonate (auntsman, Austin, TX). Carriers studied: Na-glycinate (Sigma Chemical Co., St. Louis, MO); EDA was purchased from Fisher Scientific (Somerville, NJ). Deionized water used for the humidifier and for the preparation of the 1LMs was obtained from Barnstead E-Pure system (Model D4641, Dubuque, 1A). Plastic PTFE 1/4" and 3/8" tubing and fittings for module making were obtained from Cole-Palmer (Vernon ailis, IL). Two types of hydrophilized hollow fiber membranes were studied: polyacrylic acid grafted microporous polypropylene membranes and asymmetric poly(vinylidene flouride) (PVDF) hollow fibers. Six different batches of loose hollow fibers as well as fibers already potted in modules with stainless steel casing of the polyacrylic acid grafted microporous polypropylene membranes were obtained from Applied Membrane Technology,
140 119 Inc. (AMT) (Minnetonka, MN). These membranes were prepared by grafting acrylic acid onto the outside surface of hydrophobic polypropylene hollow fiber substrate (Mitsubishi Rayon Co., Tokyo, Japan) by plasma graft polymerization technique under different conditions and grafting solution concentrations. Table 3.1 summarizes the types and sources of such hollow fiber membranes and modules used. Asymmetric PVDF hollow fibers having the integrated skin on the inner diameter (l.d.) of the fiber were obtained from Koch Membrane Systems, Inc. (Wilmington, MA). Detailed characteristics of the PVDF hollow fiber membrane modules are given in Table 3.2. Ceramic tubes were obtained from Media and Process Technology Inc. (Pittsburgh, PA); the module characteristics are given in Table 3.3. The ceramic tube 1 structure is substrate/support (a Al 20 3) with the substrate pore size being 500 A. The skin/coating (7 Al 203) thickness is 3-5 µm placed on the inner diameter of the ceramic tube having a pore size of 100 A. The ceramic tube 2 has a more porous substrate, while the skin/coating pore size and thickness are the same Experimental Setup for ILM Based Separation of CO 2 from CO2/N2 Gas Mixtures The experimental setup used for the permeation studies of C0 2 from CO2/N2 mixtures using hollow fiber membrane modules is shown in Figure 3.3. aollow fiber membrane modules immobilized with glycerol-based, water-based or
141 120
142 Table 3.2 Ceometrical Characteristics of PVDF aollow Filbert Modules Used Module No. Type of fiber Fiber ID (cm) Fiber OD (cm) Effective length (cm) No. of fibers Mass transfer area (cm 2)* 1 PVDF* PVDF** PVDF* t Skin molecular weight cutoff 100,000; ultrafiltration membrane with the skin on the l.d. * Calculation based on inner diameter of the fiber "* Koch Membrane Systems, Wilmington, MA Table 3.3 Ceometrical Characteristics of Ceramic Membranes Modules Used Module No. Type of fiber Fiber Fiber Effective ID OD length (cm) (cm) (cm) No. of fibers Mass transfer area (cm2)* 1 Ceramic** N.A Ceramic** t y A1203 skin placed on the l.d.; has 100 A pore size * Calculation based on inner diameter of the fiber * Media and Process Technology Inc., Pittsburgh, PA N.A. 26.0
143 Figure 3.3 Setup for evaluating ILMs for Carbon Dioxide removal in a hollow fiber module.
144 123 glycerol-carbonate based solutions/solvents were connected to the system for testing. The humidified feed gas mixture was flowing either through the tube side or through the shell side; dry or humidified sweep gas was passed on the opposite side. The total exposed membrane area varied between 16 cm 2 and 30 cm 2 depending on the number of fibers used for module preparation. Inlet feed gas streams were completly humidified by passing the gas stream through a water bubbler. Inlet and outlet relative humidities were measured using humidity probes (amp 31UT; Vaisala, Woburn, MA). The level of humidity was not monitored on the sweep side, although in a few cases, humidified sweep gas was required. Evaluation of the performance (CO2/N2 selectivity and C0 2 permeance) of hollow fiber membrane modules was done using the flow cell technique (Bhave and Sirkar, 1986; Chen et al., 1999; Chen et al., 2001). In this technique, the small amounts of gases which diffused through the membrane were carried away by the sweep gas (e.g. helium) which flowed on the permeate side of the membrane. The flow rate and composition of the permeate side (e.g. sweep gas) were constantly monitored and measured. The gas flow rates on the feed and the sweep side were controlled using mass flow controllers and Matheson Digital Control Box (Matheson, aorsham, PA). Feed gas pressure was maintained using a pressure regulator (Fairchild Model BP, Towaco, NJ). The feed pressure was measured with a pressure gage (Matheson, E. Rutherford, NJ). The sweep gas was sampled and analyzed with a aewlett-packard Model 5890 series I1 Cas Chromatograph (CC) having a thermal
145 3.2.4 Preparation of the ALMs The general method of preparing the ALMA is to impregnate the membrane matrix with the pure liquid solvent or liquid solution containing the carrier of interest. In most cases, the prepared ILMs using the hydrophilized hollow fiber membrane substrates had a thickness equal to the thickness of the fully or partially hydrophilized substrates. The time required for immobilization varied and depended on the membrane structure, the membrane thickness and the liquid solvent/solution properties. After full immobilization, the polymeric membrane support was removed from the liquid solution and the excess fluid was wiped from the membrane surface Preparation of the ILMs with Grafted Hollow Fibers Membranes and Modules. The liquid was immobilized onto the grafted layer, placed on the outer diameter (0.D.) of the fiber, by the immersion technique. The hollow fiber membrane was immersed into the solution for an extended period of time to
146 125 ensure proper immobilization of the liquid membrane. The hollow fiber membrane was then removed from the glycerol-based liquid solution and the excess fluid was wiped from the surface with the paper napkin. In some cases, the membrane was prewetted with water first and then wetted with Na-glycinateglycerol or EDA-glycerol solution following the technique previously described. Water-EDA solution or water- Na-glycinate solution was immobilized in the fibers that were already potted in a module. The sheli side was filled with an aqueous solution and after the membrane was wetted, the aqueous solution was drained from the shell side of the hollow fiber module and the module was ready for testing. The thickness of such prepared ILMs will be equal to the thickness of the acrylic acid grafted section, which varies from batch to batch and depends on the grafting conditions and exposure time Preparation of the ILMs with PVDF Hollow Fiber Membranes and Modules. Experiments using hydrophilic PVDF asymmetric hollow fiber membrane substrate and preparation of the ILMs with such fibers will be described here. Initially, the ILMs were immobilized in already potted modules. Since the PVDF integrated skin is located on the ID of the hollow fiber, the immobilization takes place from the shell side. The shell side was filled with a solution and after the membrane was completely wetted, the shell side was drained. When glycerolbased or glycerol carbonate solution/solvent were immobilized in already potted modules, in order to remove the excess liquid from the fibers, the following procedure was applied. Either high flow rate of N2 gas was passed over the fibers
147 126 or vacuum was applied on the shell side usually overnight in order to remove excess solution from the fibers. In some cases, both steps were implemented following each other to ensure complete removal of liquid from the outside surface of the fibers and casing walls. When PVDF loose fibers were used, the same procedure of immobilization was followed as described above for the loose grafted hollow fibers case. Thickness of such prepared liquid membranes wili be equal to the thickness of the substrate and it is referred to as a fuli ILM Preparation of thin 11-Ms with PVDF Hollow Fibers and Ceramic Membrane Modules using Pressurization Technique. In order to prepare thinner, glycerol carbonate-based or glycerol-based ILM, pressurization technique was applied in the following manner. One end of the sheli side casing was connected to the N2 gas and the other end was kept closed. The applied shell side pressure will expel a certain amount of the liquid from the asymmetric pore corresponding to the applied pressure difference across the membrane. Maximum applied pressure will be close to the maximum operational membrane pressure. This value is provided by the manufacturer and it is characteristic of a given membrane material, the porous structure and the pore and the tube diameter Preparation of the Modules The first step in module making was matting of the fibers. Each fiber either prewetted with the glycerol- based solution or used as a bare membrane was attached to a vinyl sheet using scotch tape at the ends. Hollow fiber modules
148 127 prepared out of the grafted fibers had either 15 or 20 fibers; PVDF modules had only 4 fibers. After placing the fibers on the sheet, one end of the fiber bundle was tied with a cotton thread, which was removed later. The fibers were inserted inside the bore of a 1/4" or 3/8" inch plastic PTFE tubing and end run cross fittings (Cole-Palmer, Vernon aills, IL). Once the ends of the fibers were placed through the fittings, they were potted first with a silicone rubber adhesive RTV11 (Ceneral Electric, Waterford, NY). After curing for one day, an epoxy resin mixture with 4:1 ratio of C-4 resin to activator D (Beacon Chemical Co., Mt. Vernon, NY) was used to seal the module. After the potting of both sides of the module was finished and the epoxy layer was completely cured, the module was ready for testing. To prepare a module with the ceramic tubes, stainless steel casing (McMaster Carr, New Brunswick, NJ) and fittings (RS. Crum, Mountainside, NJ) were used. Ceramic tubes modules were potted with only one layer of epoxy resin GC calibration for CO 2 and N2 Calibration curves for carbon dioxide and nitrogen were prepared for the lower ranges of concentrations since only a small amount of CO 2 and N2 wili permeate across the FILM. Different concentrations of a C0 2 containing gas (N 2) stream were prepared by diluting a standard 0.5% C0 2/N 2 gas mixture with a pure ae or N2 gas stream. For preparing the low N2 concentration calibration curve, a standrad
149 ppmv N 2/ae gas mixture was diluted with a pure He gas stream. For each calibration range and curve, at least 4 to 5 different concentrations were utilized. Certified CO 2/N 2 and N 2/ae gas mixture were purchased from Matheson Cas Products (Matheson, E.Rutherford, NJ). Sample CC calibration curves for low ranges of concentrations of C0 2 and N2 are shown in Figures 3.4 and Calculation of CO 2 and N2 Effective Permeance (Q/S)eff and the Separation Factor aco The effective permeances (Qiitm)eff for C02 and N2 were measured and subsequently the selectivity a cc, 2 2 was determined. For a membrane of thickness t m, the effective permeance of a permeating species i, (Qiitm)eff, is calculated as follows: aere Vi is the volumetric permeation rate of the gas species i, A and AID, are the membrane area and the partial pressure difference of species i across the membrane, respectively. The membrane area A in a hollow fiber module containing N fibers of length L and outside radius rob is obtained from
150 Figure 3.4 Cas chromatograph calibration curve for Carbon Dioxide. 129
151 Peak Area Figure 3.5 Cas chromatograph calibration curve for Nitrogen.
152 3.3 Results and Discussion Experimental Results for CO2 Removal Based on ILMs Using Grafted Hollow Fibers Scanning Electron Micrographs. Six different batches of grafted fibers prepared under different conditions were studied. The membrane structure was checked using a scanning electron microscope (SEM) and the differences between the grafted layers in some batches were compared. Initially fiber samples were simply cut with the razor blade; therefore, in some cases the
153 132 difference between the grafted layer and the membrane substrate was not that obvious (Figure 3.6a). Some SEM pictures taken with samples cut with the razor blade (Figure 3.9) show a much clearer image of the AA-grafted layer of approximate thickness of 5-6 pm. In order to remove the uncertainties of a grafted layer thickness and existence of the same, the new fiber samples were prepared by first immersing them in the liquid nitrogen. Subsequently, fibers were cut and samples were analyzed by a SEM. Figure 3.7 illustrates the cross-sectional views of the AAgrafted fiber from Batch 1 pretreated with liquid nitrogen. Comparing the cross sectional views of the AA-grafted fibers (Batch 1) in Figures 3.6a and 3.7, it appears that treatment with the liquid N2 affects the grafted layer in such a way that the two different layers are more distinct. The cross-sectional views of the bare Mitsubishi hollow fiber, and AAgrafted Mitsubishi fiber have been compared (Figure 3.8) in order to assure the presence and the thickness of the AA-grafted layer pretreated with liquid nitrogen. It is clear that the thin (2-3pm) AA-grafted layer is placed on the outside diameter of the hollow fiber. The SEM picture of the fiber surface indicated whether the fiber surface was properly coated without any defects; the surface of the grafted layer looks quite dense (Figure 3.6b). In order to distinguish and compare the difference in grafting thickness generated by different experimental conditions the SEM pictures from different batches were taken. The cross - sectional views of the Minimal


154 133

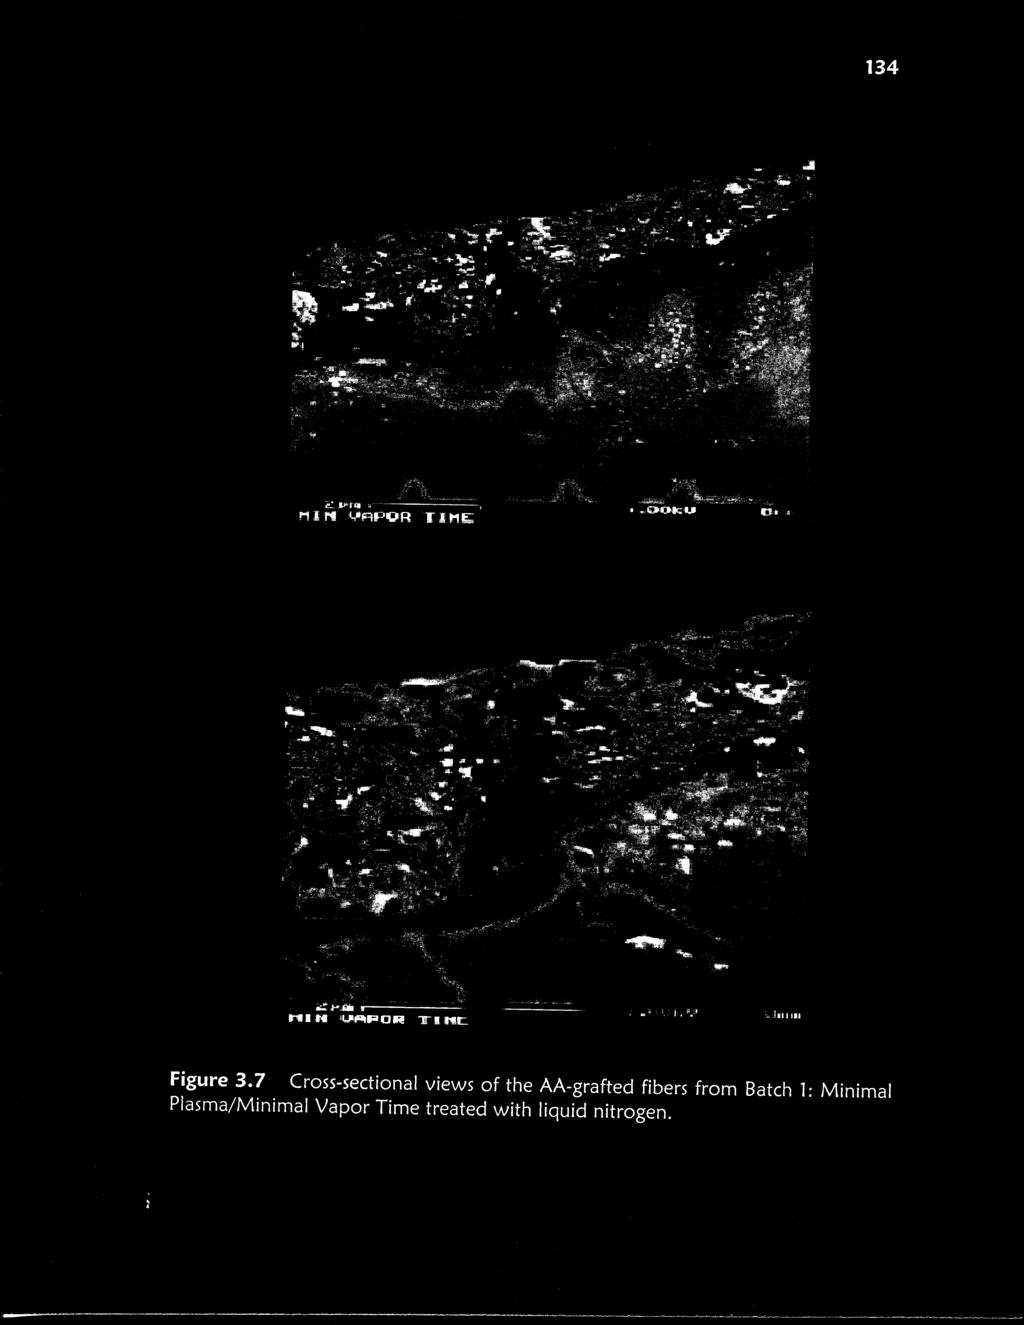
155 134
 cross-sectional view of the grafted Mitsubishi hollow fiber")

156 135 a) cross-sectional view of the bare Mitsubishi hollow fiber x1000 # b) cross-sectional view of the grafted Mitsubishi hollow fiber Figure 3.8 Cross-sectional views of the bare Mitsubishi hollow fiber and Mitsubishi AA-grafted hollow fiber from Batch 1: Minimal Plasma/Minimal Vapor Time.
157 136 Plasma/Minimal Vapor Time, Modest Craft Exposure Time and aigh Craft Exposure Time batches are provided in Figures 3.9, 3.10 and It appears that the grafted thickness of the hollow fiber from the minimal plasma/minimal vapor time batch is very small. Details on plasma polymerization conditions and preparation of AA-grafted hollow fibers are provided in Appendix E ILMs Based on Minimal Plasma/Minimal Vapor Time Grafted Fibers: Batch 1. Table 3.4 lists all results obtained with 3 different modules prepared from Batch 1 fibers. Module 1-1 was prewetted with 3M 0a-glycinateglycerol and was tested with humidified feed gas mixture and dry helium as a sweep gas. After immobilization and potting of the fibers, the module was determined not to be leaking. Experiments in two modes using 0.5% CO 2/N2 feed gas mixture were done; for shell-side feed and tube-side sweep flow the selectivity was 61; for tube-side feed flow and shell-side sweep flow the selectivity was 94. Low CO2 effective permeances in the order of 10-6 scc/cm 2*s*cmag were obtained in both cases. This may indicate that the glycerol solution did not penetrate into the grafted part of the membrane. The membrane may have been too dense. Therefore, Module 2-1 was first prewetted with water and then with 3M Na-glycinate-glycerol solution to make the wetting of the grafted parts easier. This approach reduced both nitrogen as well as CO 2 permeances, but yielded a marginal increase in selectivity since the nitrogen permeance was reduced slightly more than C02 permeance. Even in this approach of immobilization, the C02 effective permeance remained around s cc/cm2*s*cmag. A possible explanation for this situation is that grafted acrylic acid tends to swell with water.


158 137 x vm # MIN VAPOR TI 512 x kV 6mm GRAFTED FIBER 4-5K1.TIF Figure 3.9. Cross-sectional view of the AA-grafted hollow fiber from Batch 3: Modest Craft Exposure Time. x5000 5vm 3.00kV 6mm # MAX VAPOR TIME GRAFTED FIBER 512 x K1.TIF Figure Cross-sectional view of the AA-grafted hollow fiber from Batch 4: High Craft Exposure Time.

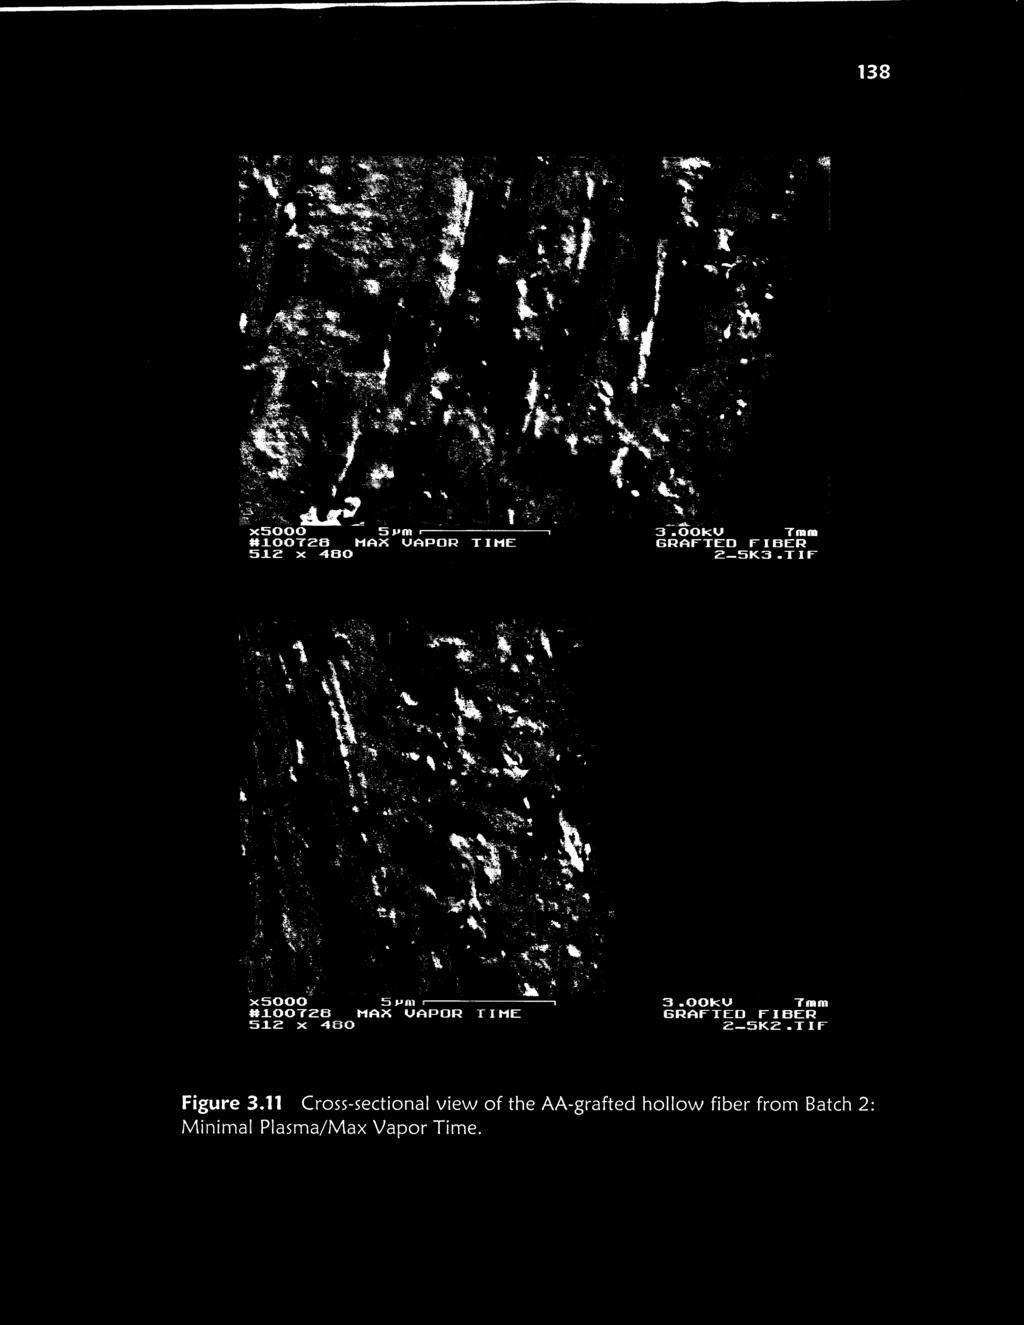
159 138
maintaining storage tank dissolved oxygen levels utilizing gas transfer membranes
 Water Technologies & Solutions technical paper maintaining storage tank dissolved oxygen levels utilizing gas transfer membranes Authors: W.E. Haas, SUEZ, J. Helmrich, Florida Power and Light and J.E.
FlashCO2, CO2 at 23 $/ton
 FlashCO2, CO2 at 23 $/ton A cost effective solution of capturing CO2 from Steam Methane Reforming (SMR) Hydrogen production plants by the FlashCO2 process Introduction to a cost effective solution Driven
Title: Choosing the right nitrogen rejection scheme
 Title: Choosing the right nitrogen rejection scheme Authors: Nicolas Chantant, Paul Terrien, Sylvain Gérard (Air Liquide Global E&C Solutions) Abstract: Nitrogen Rejection Units (NRU) are used to extract
Generating Calibration Gas Standards
 Technical Note 1001 Metronics Inc. Generating Calibration Gas Standards with Dynacal Permeation Devices Permeation devices provide an excellent method of producing known gas concentrations in the PPM and
Recovery of helium from rejected gas streams in Natural gas processing [1, 2, 3].
![Recovery of helium from rejected gas streams in Natural gas processing [1, 2, 3].](/thumbs/89/97531732.jpg "Recovery of helium from rejected gas streams in Natural gas processing [1, 2, 3].") Gas Separation by Membranes Membrane technology in gas separation and purification has grown exponentially since they were first introduced about 30 years ago. Compared to other conventional gas separation
Gas Separation by Membranes Membrane technology in gas separation and purification has grown exponentially since they were first introduced about 30 years ago. Compared to other conventional gas separation
Chapter 8: Reservoir Mechanics
 PTRT 1472: Petroleum Data Management II Chapter 8: Reservoir Mechanics - Reservoir drives Types of Natural Gas Reservoir Fluids Natural gas is petroleum in a gaseous state, so it is always accompanied
Applied Compression s nitrogen generator packages offer users a cost-effective alternative to costly bottled nitrogen.
 APPLICATIONS: Autoclaves Modified Packaging Atmospheres Coffee Packaging Oxidation Control Coil Tubing Units Pharmaceutical Manufacturing Electronic Parts Manufacturing Reflow Ovens Enhanced Oil Recovery
 www.ompressedairsystems.com ultra-high purity nitrogen generators nitrogen purity: 95% to 99.999% www.ompressedairsystems.com ultra-high purity nitrogen generators nitrogen purity: 95% to 99.999% Leading
NITROGEN GENERATION FOR INDUSTRIAL APPLICATIONS
 TRIDENT NOTES: NUMBER 5 DECEMBER 2017 NITROGEN GENERATION FOR INDUSTRIAL APPLICATIONS Industry requires nitrogen Dozens of gases are used by industry. First among these in terms of quantity consumed is
Instructor: Dr. Istadi (http://tekim.undip.ac.id/staf/istadi )
") Instructor: Dr. Istadi (http://tekim.undip.ac.id/staf/istadi ) Email: istadi@undip.ac.id Course Syllabus: (Part 1) 1. Definitions of Natural Gas, Gas Reservoir, Gas Drilling and Gas production (Pengertian
Instructor: Dr. Istadi (http://tekim.undip.ac.id/staf/istadi ) Email: istadi@undip.ac.id Course Syllabus: (Part 1) 1. Definitions of Natural Gas, Gas Reservoir, Gas Drilling and Gas production (Pengertian
Inprocess Operator Training Programme
 2016 Inprocess Operator Training Programme ABSORPTION COLUMN These exercises are intended to provide an understanding of absorption columns and the fundamental principles they use to eliminate pollutants
Potter Nitrogen Generators
 Potter Nitrogen Generators What is nitrogen? Nitrogen the inert gas Earth s atmosphere the air we breathe is composed of nitrogen, oxygen, and water vapor. While this atmosphere is great for life, it is
APPLICATION NOTE. GC Integrated Permeation Device
 GC Integrated Permeation Device GC-integrated Design PPB to PPM Level Calibration No Cylinders or Regulators Required Option for Dual Ovens Cost Effective, Safe, Clean, Flexible, NIST Traceable Keywords:
Ball Beating Lubrication in Refrigetation Compressors
 Purdue University Purdue e-pubs International Compressor Engineering Conference School of Mechanical Engineering 1996 Ball Beating Lubrication in Refrigetation Compressors B. Jacobson SKF Engineering &
Preparation and Gas Separation Properties of Asymmetric Polysulfone Membranes by a Dual Bath Method
 Korean J. Chem. Eng., 17(2), 143-148 (2000) Preparation and Gas Separation Properties of Asymmetric Polysulfone Membranes by a Dual Bath Method Wan-Jin Lee, Deuk-San Kim and Jin-Hwan Kim* Faculty of Applied
how to meet today s dissolved oxygen specifications with degasification membranes
 Water Technologies & Solutions technical paper how to meet today s dissolved oxygen specifications with degasification membranes Author: Fred Wiesler, Membrana Charlotte, Ionics Note: SUEZ purchased Ionics
THE GUIDE TO MEMBRANE NITROGEN GENERATORS
 THE GUIDE TO MEMBRANE NITROGEN GENERATORS MEMBRANE NITROGEN GENERATORS The membrane nitrogen generator utilizes a hollow porous fiber to separate the N 2 molecules from other molecules, including O 2.
Membrane modules for nitrogen and oxygen generator systems. Technology Overview ENGINEERING YOUR SUCCESS.
 Membrane modules for nitrogen and oxygen generator systems Technology Overview ENGINEERING YOUR SUCCESS. Parker modules the heart of OEM tailor-made nitrogen generators OEM (Original Equipment Manufacturer)
Kinetic-Molecular Theory
 GASES Chapter Eleven Kinetic-Molecular Theory! Recall that our only previous description of gases stated that gases completely fill and take the shape of their containers.! The Kinetic-Molecular Theory
Operating Guidelines for PermSelect Modules Liquid Contacting
 Operating Guidelines for PermSelect Modules Liquid Contacting PermSelect PDMSXA-2500 (0.25m 2 ) PermSelect PDMSXA-7500 (0.75m 2 ) PermSelect PDMSXA-1.0 (1m 2 ) PermSelect PDMSXA-2.1 (2.1m 2 ) PermSelect
CLOSED LOOP SOLVENT EMISSIONS CONTROL. David C.H. Grant
 CLOSED LOOP SOLVENT EMISSIONS CONTROL David C.H. Grant Abstract: An approach to closed loop solvent emissions control systems, useful for all conventional solvent processes and solvents is presented. The
DISTILLATION POINTS TO REMEMBER
 DISTILLATION POINTS TO REMEMBER 1. Distillation columns carry out physical separation of liquid chemical components from a mixture by a. A combination of transfer of heat energy (to vaporize lighter components)
How To Use Getters and Getter Pumps
 A Journal of Practical and Useful Vacuum Technology From By Phil Danielson How To Use Getters and Getter Pumps Gettering is a vacuum pumping technology that has been with us, in many forms, for almost
Micro Channel Recuperator for a Reverse Brayton Cycle Cryocooler
 Micro Channel Recuperator for a Reverse Brayton Cycle Cryocooler C. Becnel, J. Lagrone, and K. Kelly Mezzo Technologies Baton Rouge, LA USA 70806 ABSTRACT The Missile Defense Agency has supported a research
Focus on VOC Emissions Reduction Using an Oxygen Based Inerting Control System For Inert Gas Blanketing of Chemical Process Vessels
 Inerting Control Systems by NTRON PROCESS ANALYZER DIVISION of NEUTRONICS INC. EXTON. PA. 19341 RJN Rev. A June 2001 Focus on VOC Emissions Reduction Using an Oxygen Based Inerting Control System For Inert
Improvements in the Reliability, Costs and Processing of WLP/RDL Circuits
 Improvements in the Reliability, Costs and Processing of WLP/RDL Circuits Bill Moffat, Chief Executive Officer John Das, Ph.D., Process Engineer Wesley Lau, Senior Sales Engineer Kenneth Sautter, Senior
Multifunctional Screw Compressor Rotors
 Multifunctional Screw Compressor Rotors Nikola Stosic, Ian K. Smith and Ahmed Kovacevic Centre for Positive Displacement Compressor Technology, City University, London EC1V OHB, U.K. N.Stosic@city.ac.uk
System REITHER A Patented Venturi Scrubber
 System REITHER A Patented Venturi Scrubber Demonstrated efficiencies with fine particles, aerosols, mists and gases. ALTECH Technology Systems Inc. 12 Banigan Drive, Toronto, Ontario, Canada M4H 1E9 Tel:
DEVICES FOR FIELD DETERMINATION OF WATER VAPOR IN NATURAL GAS Betsy Murphy MNM Enterprises 801 N. Riverside Drive Fort Worth, Texas 76111
 INTRODUCTION Water vapor in natural gas has more than a substantial effect on the quality of the gas stream. Without quality measurement of water vapor the gas is basically not saleable. Contracts are
Plasma Sources and Feedback Control in Pretreatment Web Coating Applications
 Plasma Sources and Feedback Control in Pretreatment Web Coating Applications Joseph Brindley, Benoit Daniel, Victor Bellido-Gonzalez, Dermot Monaghan Gencoa Ltd., Physics Rd, L24 9HP Liverpool, UK (+44)
METHOD 25A - DETERMINATION OF TOTAL GASEOUS ORGANIC CONCENTRATION USING A FLAME IONIZATION ANALYZER
 1250 METHOD 25A - DETERMINATION OF TOTAL GASEOUS ORGANIC CONCENTRATION USING A FLAME IONIZATION ANALYZER 1.0 Scope and Application. 1.1 Analytes. Analyte CAS No. Sensitivity Total Organic Compounds N/A
METHOD 3C - DETERMINATION OF CARBON DIOXIDE, METHANE, NITROGEN, AND OXYGEN FROM STATIONARY SOURCES
 METHOD 3C - DETERMINATION OF CARBON DIOXIDE, METHANE, NITROGEN, AND OXYGEN FROM STATIONARY SOURCES 1. Applicability and Principle 1.1 Applicability. This method applies to the analysis of carbon dioxide
HiQ laboratory gas generators.
 Product information HiQ laboratory gas generators. The convenient alternative for laboratory environments. 02 HiQ laboratory gas generators HiQ laboratory gas generators. Designed with safety and convenience
Materials Performance November Nitrogen generator inhibits corrosion within fire protection systems
 Materials Performance November 2014 Nitrogen generator inhibits corrosion within fire protection systems When dry and pre-action fire protection systems experience internal corrosion in their piping network,
A high level of consistency and control.
 Membrane Contactors A high level of consistency and control. 3M Liqui-Cel Membrane Contactors Gas transfer membrane technology that removes, adds or controls dissolved gases in liquids. Dissolved gas control
Ch. 11 Mass transfer principles
 Transport of chemical species in solid, liquid, or gas mixture Transport driven by composition gradient, similar to temperature gradients driving heat transport We will look at two mass transport mechanisms,
Both physical and chemical effects come into play either separately or in combination.
 A Journal of Practical and Useful Vacuum Technology By Phil Danielson WHY CREATE A VACUUM? From Creating a vacuum has become a fairly common and often routine undertaking, but the commonness of the activity
Experiment 18 Properties of Gases
 Experiment 18 Properties of Gases E18-1 E18-2 The Task In this experiment you will investigate some of the properties of gases, i.e. how gases flow, their phase changes and chemical reactivity. Skills
PURE SUBSTANCE. Nitrogen and gaseous air are pure substances.
 CLASS Third Units PURE SUBSTANCE Pure substance: A substance that has a fixed chemical composition throughout. Air is a mixture of several gases, but it is considered to be a pure substance. Nitrogen and
Introduction of Vacuum Science & Technology. Diffusion pumps used on the Calutron mass spectrometers during the Manhattan Project.
 Introduction of Vacuum Science & Technology Diffusion pumps used on the Calutron mass spectrometers during the Manhattan Project. 1 What is a vacuum? 760 mm Hg Vacuum ATM A vacuum is defined as less than
Dissolved Oxygen Guide
 Educat i onser i es Di ssol vedoxygengui de Dissolved Oxygen Guide Introduction Dissolved oxygen probes provide a convenient approach to essentially direct measurement of molecular oxygen. The membrane
FAST EVAPORATION AT NORMAL PRESSURE
 FAST EVAPORATION AT NORMAL PRESSURE FAST EVAPORATION BY BLOWING-DOWN... The VAPORNADO Plus blow-down system is an innovative and efficient instrument for the evaporation of samples and fractions at normal
Chapter 3 Atmospheric Thermodynamics
 Chapter 3 Atmospheric Thermodynamics Spring 2017 Partial Pressure and Dalton Dalton's law of partial pressure: total pressure exerted by a mixture of gases which do not interact chemically is equal to
Fig. 2. M.I. Yaroslavtsev, 2002
 SPECIAL FEATURES OF USING N O FOR HEATING OF THE TEST GAS IN A HOT-SHOT WIND TUNNEL M.I. Yaroslavtsev Institute of Theoretical and Applied Mechanics SB RAS, 630090 Novosibirsk Russia 1. The study of heat
Diagnosing EVAP systems By: Bernie Thompson
 Diagnosing EVAP systems By: Bernie Thompson Perhaps one of the toughest jobs in the automotive field is diagnosing small leaks, especially A/C and Fuel Vapor (EVAP) leaks. Finding these leaks can be time
Investigation of Thermal Effects of CO 2 on Earth-Atmosphere System
 Investigation of Thermal Effects of CO 2 on Earth-Atmosphere System Design Team Michel Beguin, Tim Bevins Dan Jakiela, Frank Kuchinski Design Advisor Prof. Yiannis Levendis Abstract This Capstone Project
CRYSTALLIZATION FOULING IN PACKED COLUMNS
 CRYSTALLIZATION FOULING IN PACKED COLUMNS D. Großerichter and J. Stichlmair Lehrstuhl für Fluidverfahrenstechnik, Technische Universität München, Munich, Germany ABSTRACT Fouling due to crystallization
Water Treatment: Fundamentals and Practical Implications of Bubble Formation
 Water Treatment: Fundamentals and Practical Implications of Bubble Formation Paolo Scardina Thesis submitted to the Faculty of the Virginia Polytechnic Institute and State University In partial fulfillment
Automatic Permeability Testing: The Challenges and Solutions Author: Alyce Hartvigsen, PBI-Dansensor A/S, Ringsted, Denmark
 Automatic Permeability Testing: The Challenges and Solutions Author: Alyce Hartvigsen, PBI-Dansensor A/S, Ringsted, Denmark In recent years, numerous product developments and major changes in the distribution
ON-SITE INDUSTRIAL GASES. Nitrogen & Oxygen Generators
 ON-SITE INDUSTRIAL GASES Nitrogen & Oxygen Generators A SECURE SUPPLY OF NITROGEN AND OXYGEN Whether your company is specialized in chemical manufacturing, electronics, laser cutting or food and beverage,
Fast. Efficient. Precise control. 3M Liqui-Cel Membrane Contactors. Dissolved gas control solutions for the beverage industry
 2 3M Liqui-Cel Membrane Contactors for the beverage industry Membrane Contactors Fast. Efficient. Precise control. 3M Liqui-Cel Membrane Contactors Dissolved gas control solutions for the beverage industry
World of Chemistry Notes for Students [Chapter 13, page 1] Chapter 13 Gases
![World of Chemistry Notes for Students [Chapter 13, page 1] Chapter 13 Gases](/thumbs/96/127526823.jpg "World of Chemistry Notes for Students [Chapter 13, page 1] Chapter 13 Gases") World of Chemistry Notes for Students [Chapter 3, page ] Chapter 3 Gases ) Sec 3.8 Kinetic Theory of Gases and the Nature of Gases The Kinetic Theory of Matter says that the tiny particles in all forms
World of Chemistry Notes for Students [Chapter 3, page ] Chapter 3 Gases ) Sec 3.8 Kinetic Theory of Gases and the Nature of Gases The Kinetic Theory of Matter says that the tiny particles in all forms
Improving Conventional Flotation Methods to Treat EOR Polymer Rich Produced Water
 Improving Conventional Flotation Methods to Treat EOR Polymer Rich Produced Water Authors: Frank A. Richerand, Frank Richerand II Yoosef Peymani www.envirotechsystems.com OBJECTIVES Compare IGF and DGF
Gas Pressure. Pressure is the force exerted per unit area by gas molecules as they strike the surfaces around them.
 Chapter 5 Gases Gas Gases are composed of particles that are moving around very fast in their container(s). These particles moves in straight lines until they collides with either the container wall or
High Efficiency SO2 Scrubber Design to Reduce Caustic Consumption
 High Efficiency SO2 Scrubber Design to Reduce Caustic Consumption Paper # 35 Andrew C. Bartocci Envitech, Inc. 2924 Emerson Street- Suite 320 San Diego, CA 92106 Ph: 619-223-9925, ext. 203 ABSTRACT An
Usage Policies Notebook for Xenon Difluoride (XeF 2 ) Isotropic Si Etch
 Isotropic Si Etch") Usage Policies Notebook for Xenon Difluoride (XeF 2 ) Isotropic Si Etch Revision date September 2014 2 Emergency Plan for XeF 2 Si Etcher Standard Operating Procedures for Emergencies Contact information
Usage Policies Notebook for Xenon Difluoride (XeF 2 ) Isotropic Si Etch Revision date September 2014 2 Emergency Plan for XeF 2 Si Etcher Standard Operating Procedures for Emergencies Contact information
You should be able to: Describe Equipment Barometer Manometer. 5.1 Pressure Read and outline 5.1 Define Barometer
 A P CHEMISTRY - Unit 5: Gases Unit 5: Gases Gases are distinguished from other forms of matter, not only by their power of indefinite expansion so as to fill any vessel, however large, and by the great
Simplicity in VRU by using a Beam Gas Compressor
 Simplicity in VRU by using a Beam Gas Compressor By Charlie D. McCoy and Mark Lancaster Abstract: Vapor Recovery Units are often expensive, complicated to operate and unable to deal with High H2S and liquids.
Honors Chemistry - Problem Set Chapter 13 Classify each of these statements as always true, AT; sometimes true, ST; or never true, NT.
 Honors Chemistry - Problem Set Chapter 13 Classify each of these statements as always true, AT; sometimes true, ST; or never true, NT. 1. Atmospheric pressure is 760 mm Hg. 2. The SI unit of pressure is
LOW PRESSURE EFFUSION OF GASES revised by Igor Bolotin 03/05/12
 LOW PRESSURE EFFUSION OF GASES revised by Igor Bolotin 03/05/ This experiment will introduce you to the kinetic properties of low-pressure gases. You will make observations on the rates with which selected
acrolein, acetaldehyde and acetone( cm -1 ); methanol (1306 cm -1 ); ethylene (949 cm -1 ); and isoprene (893 cm -1 ).
; methanol (1306 cm -1 ); ethylene (949 cm -1 ); and isoprene (893 cm -1 ).") acrolein, acetaldehyde and acetone(1550 1800 cm -1 ); methanol (1306 cm -1 ); ethylene (949 cm -1 ); and isoprene (893 cm -1 ). 5 Figure 4a 6 Figure 4b Figure 4c 7 Figure 5 Questions in Student Handout
acrolein, acetaldehyde and acetone(1550 1800 cm -1 ); methanol (1306 cm -1 ); ethylene (949 cm -1 ); and isoprene (893 cm -1 ). 5 Figure 4a 6 Figure 4b Figure 4c 7 Figure 5 Questions in Student Handout
4/26/16. Section 1 Understanding Solutions. Solutions and Suspensions. Solutions and Suspensions. Solutions and Suspensions. Solvents and Solutes
 Section 1 Understanding Solutions On a hot day, you may think that a cool glass of plain water would be refreshing. However, if the glass were actually filled with plain water, it would taste stale. This
Dynamic Simulation and Control of Vapor Recompression Column
 The 7 th International Chemical Engineering Congress & Exhibition (IChEC 2011) Kish, Iran, 21-24 November, 2011 Dynamic Simulation and Control of Vapor Recompression Column Hojjat Dehghani, Mohammad Ali
ZUERCHER TANK REGULATORS PRINCIPLES OF TANK VENTILATION
 Why Inertisation (blanketing) of Tanks? General Tank inertisation or blanketing is required in many applications where products or liquids stored in the tank are processed and/or filled into and emptied
Concentration and diafiltration of viral antigens with SmartFlow TFF
 The SmartFlow filter Concentration and diafiltration of viral antigens WORKS from NCSRT is intended for concentrating viral antigens from both clarified and non-clarified sources. The subsequent diafiltration
Design. Pompetravaini-NSB API SB Liquid Ring Compressor for Gas Processing. Working Principle
 SB Pompetravaini-NSB API SB Liquid Ring Compressor for Gas Processing A family of API liquid ring compressors has been developed and has been in the market for nearly a decade, they are specifically made
MATERIAL SAFETY. St. Paul, Minnesota or (651) (24 hours)
 (24 hours)") MATERIAL SAFETY DATA SHEET 3M 3M Center St. Paul, Minnesota 55144-1000 1-800-364-3577 or (651) 737-6501 (24 hours) Copyright, 2002, Minnesota Mining and Manufacturing Company. All rights reserved. Copying
MATERIAL SAFETY DATA SHEET 3M 3M Center St. Paul, Minnesota 55144-1000 1-800-364-3577 or (651) 737-6501 (24 hours) Copyright, 2002, Minnesota Mining and Manufacturing Company. All rights reserved. Copying
UNITY 2 TM. Air Server Series 2 Operators Manual. Version 1.0. February 2008
 UNITY 2 TM Air Server Series 2 Operators Manual Version 1.0 February 2008 1. Introduction to the Air Server Accessory for UNITY 2...2 1.1. Summary of Operation...2 2. Developing a UNITY 2-Air Server method
This portion of the piping tutorial covers control valve sizing, control valves, and the use of nodes.
 Piping Tutorial A piping network represents the flow of fluids through several pieces of equipment. If sufficient variables (flow rate and pressure) are specified on the piping network, CHEMCAD calculates
Transient Analyses In Relief Systems
 Transient Analyses In Relief Systems Dirk Deboer, Brady Haneman and Quoc-Khanh Tran Kaiser Engineers Pty Ltd ABSTRACT Analyses of pressure relief systems are concerned with transient process disturbances
Air-duster / Gas White-Paper Written by Keith Carruthers
 Air-duster / Gas White-Paper Written by Keith Carruthers Air-dusters are widely used in the electronics manufacturing industry and are designed to safely remove dust and other types of particulate contamination
MMS Mercury Monitoring System for Natural Gas
 MMS Mercury Monitoring System for Natural Gas Natural gas often contains mercury at concentrations that vary from below 1 to above 10000 µg/m 3. Mercury is both toxic and potentially damaging: it can corrode
NSPS SUBPART Ka Check-off Form JULY 11, LAFAYETTE ROAD NO., ST. PAUL, MN
 520 LAFAYETTE ROAD NO., ST. PAUL, MN 55155-4194 NSPS FORM NSPS-Ka NSPS SUBPART Ka Check-off Form JULY 11, 2005 I. Introduction An owner or operator may fill in this form in replacement of a highlighted
Gerald D. Anderson. Education Technical Specialist
 Gerald D. Anderson Education Technical Specialist The factors which influence selection of equipment for a liquid level control loop interact significantly. Analyses of these factors and their interactions
Measurement of Representative Landfill Gas Migration Samples at Landfill Perimeters: A Case Study
 Measurement of Representative Landfill Migration Samples at Landfill Perimeters: A Case Study Breda M. Kiernan, PhD. National Centre for Sensor Research, Dublin City University Glasnevin Dublin 9 Ireland
CHAPTER 5: VACUUM TEST WITH VERTICAL DRAINS
 CHAPTER 5: VACUUM TEST WITH VERTICAL DRAINS 5.1 Introduction Using surcharging as the sole soil consolidation mean can take a long time to reach the desired soil settlement. Soil consolidation using prefabricated
Fundamentals of Compressed Air Systems. Pre-Workshop Assignment
 Page 1 In order to ensure that the Compressed Air Challenge Fundamentals of Compressed Air Systems Training is most useful to you, it will be important for you to bring information about your plant s compressed
White Paper. Chemical Sensor vs NDIR - Overview: NDIR Technology:
 Title: Comparison of Chemical Sensor and NDIR Technologies TSN Number: 25 File:\\MII- SRV1\Metron\Bridge_Analyzers\Customer_Service_Documentation\White_Papers\25_G en EGA NDIR vs Chemical Sensor.docx Created
Oil-Lubricated Compressors for Regenerative Cryocoolers Using an Elastic Membrane
 Oil-Lubricated Compressors for Regenerative Cryocoolers Using an Elastic Membrane E.C. Luo, Z.H. Wu, G.Y. Yu, J.Y. Hu, and W. Dai Technical Institute of Physics and Chemistry Chinese Academy of Sciences
Instructor s t Background
 Teknologi Pemrosesan Gas (TKK 564) Instructor: Dr. Istadi (http://tekim.undip.ac.id/staf/istadi ) Email: il iistadi@undip.ac.id di di id Instructor s t Background BEng. (1995): Universitas Diponegoro Meng.
Composition of Exhaled Breath
 Composition of Exhaled Breath Exhaled Breath (~37 C) is mainly composed by gaseous substances: Water Vapor, CO 2, O 2, N 2, NO, CO, etc. Several volatile, low-volatile and non-volatile compounds of endogenous
Safety devices for overpressure protection. Rupture discs: applications, sizing, and types
 Safety devices for overpressure protection. Rupture discs: applications, sizing, and types Milano, 18 Aprile 2018 Auditorio TECNIMONT Cristian Barbi and Mario Modena DonadonSDD Summary Devices for overpressure
Applications Note: Use of "pentane equivalent" calibration gas mixtures
 Introduction The gas that is used to verify accuracy is every bit as important as the detector itself when it comes to worker safety. Choosing (and using) the right mixture is critical to the success of
Optimizing Gas Supply for Industrial Lasers
 Optimizing Gas Supply for Industrial Lasers Laser cutting of metals and other materials has grown rapidly due to developments in laser power, advancements in CNC automation, and decreasing costs. The industrial
Gases&Technology. Measurement of Impurities in Helium Using the Dielectric Barrier Discharge Helium Ionization Detector. FEATURE.
 Gases&Technology FEATURE Measurement of Impurities in Helium Using the Dielectric Barrier Discharge Helium Ionization Detector. B Y M A T T H E W M O N A G L E Abstract Bulk gases are often delivered to
Advanced Management of Compressed Air Systems Pre-Workshop Assignment
 Advanced Management of Compressed Air Systems Page 1 In order to ensure that the Compressed Air Challenge Level II Training is most useful to you, it will be important for you to bring information about
EVOLUTION OF RUPTURE DISC MANUFACTURING TECHNOLOGY AND PERFORMANCE
 EVOLUTION OF RUPTURE DISC MANUFACTURING TECHNOLOGY AND PERFORMANCE Mario Modena, Antonio Donadon, Cristian Barbi Summary Rupture disc properties and application parameters Evolution of rupture disc models
Safety Data Sheet. SECTION 1: Identification. SECTION 2: Hazard identification
 Safety Data Sheet Copyright,2014,3M Company. All rights reserved. Copying and/or downloading of this information for the purpose of properly utilizing 3M products is allowed provided that: (1) the information
HOW TO MANAGE VAPORIZATION IN AN ANALYTICAL SYSTEM By Dean Slejko and Tony Waters
 HOW TO MANAGE VAPORIZATION IN AN ANALYTICAL SYSTEM By Dean Slejko and Tony Waters If the analyzer in your analytical system requires gas but your sample is liquid, the only option is to convert the liquid
Separation of N 2 /SF 6 binary mixtures using polyethersulfone (PESf) hollow fiber membrane
 hollow fiber membrane") Korean J. Chem. Eng., 9(8), 1081-1085 (01) DOI: 10.1007/s11814-011-094-z INVITED REVIEW PAPER Separation of binary mixtures using polyethersulfone (PESf) hollow fiber membrane Dae-Hoon Kim*, Yong-Hae Ko**,
Korean J. Chem. Eng., 9(8), 1081-1085 (01) DOI: 10.1007/s11814-011-094-z INVITED REVIEW PAPER Separation of binary mixtures using polyethersulfone (PESf) hollow fiber membrane Dae-Hoon Kim*, Yong-Hae Ko**,
A NEW PROCESS FOR IMPROVED LIQUEFACTION EFFICIENCY
 WHITE PAPER A NEW PROCESS FOR IMPROVED LIQUEFACTION EFFICIENCY Author(s): Adam Jones and Grant Johnson, Costain Natural Resources First published: GPAE, September 2014 www.costain.com A New Process for
Fall 2004 Homework Problem Set 9 Due Wednesday, November 24, at start of class
 0.30 Fall 004 Homework Problem Set 9 Due Wednesday, November 4, at start of class Part A. Consider an iron surface which serves as a catalyst for the production of ammonia from nitrogen and hydrogen. The
Experimental Research on Oxygen-enriched Air Supply System for Gasoline Engine
 Sensors & Transducers 013 by IFSA http://www.sensorsportal.com Experimental Research on Oxygen-enriched Air Supply System for Gasoline Engine 1, Yahong Li, 3 Lixi Zhang, 1 Zelu Sun 1 School of Chemistry
A07 Surfactant Induced Solubilization and Transfer Resistance in Gas-Water and Gas-Oil Systems
 A07 Surfactant Induced Solubilization and Transfer Resistance in Gas-Water and Gas-Oil Systems R Farajzadeh* (TU Delft), A. Banaei (TU Delft), J. Kinkela (TU Delft), T. deloos (TU Delft), S. Rudolph (TU
Laboratory Hardware. Custom Gas Chromatography Solutions WASSON - ECE INSTRUMENTATION. Engineered Solutions, Guaranteed Results.
 Laboratory Hardware Custom Gas Chromatography Solutions Engineered Solutions, Guaranteed Results. WASSON - ECE INSTRUMENTATION Laboratory Hardware Wasson-ECE Instrumentation offers hardware-only solutions
UV Curing in an Inerted Atmosphere Equipment Update
 UV Curing in an Inerted Atmosphere Equipment Update Jim Borsuk Senior Application Engineer Nordson UV Systems Group 09Apr14 Abstract Quality is never an accident. It is the result of intelligent effort
Earlier Lecture. In the earlier lecture, we have seen Kapitza & Heylandt systems which are the modifications of the Claude System.
 17 1 Earlier Lecture In the earlier lecture, we have seen Kapitza & Heylandt systems which are the modifications of the Claude System. Collins system is an extension of the Claude system to reach lower
PHASE EQUILIBRIA: HOW TO CALCULATE OXYGEN SOLUBILITY IN CELL CULTURE MEDIUM
 BE.360J/10.449J SUPPLEMENTARY HANDOUT FALL 2002 PHASE EQUILIBRIA: HOW TO CALCULATE OXYGEN SOLUBILITY IN CELL CULTURE MEDIUM 1. Phase Equilibria Introduction A collection of molecules is in equilibrium
A NOVEL SENSOR USING REMOTE PLASMA EMISSION SPECTROSCOPY FOR MONITORING AND CONTROL OF VACUUM WEB COATING PROCESSES
 A NOVEL SENSOR USING REMOTE PLASMA EMISSION SPECTROSCOPY FOR MONITORING AND CONTROL OF VACUUM WEB COATING PROCESSES F. Papa 1, J. Brindley 2, T. Williams 2, B. Daniel 2, V. Bellido-Gonzalez 2, Dermot Monaghan
B14 gas exchange note, reading and questions.notebook April 13, 2011
 Review All organisms (plants and animals) need energy to carry out their life processes. The chemi reaction which provides this energy is called. In larger animals it is sometimes called respiration because