SUBJECT: John Day (JDA) North Fish Ladder - Trip Report for field water velocity measurements October 18 and 19, 2012.
|
|
|
- Noreen Roberts
- 6 years ago
- Views:
Transcription

 well.")
1 REPLY TO ATTENTION OF DEPARTMENT OF THE ARMY CORPS OF ENGINEERS, PORTLAND DISTRICT PO BOX 2946 PORTLAND OR CENWP-EC-HD (1110a) 28 October 2012 MEMORANDUM FOR RECORD SUBJECT: John Day (JDA) North Fish Ladder - Trip Report for field water velocity measurements October 18 and 19, Participants: Field Trip Objectives: Schlenker, Steve EC-HD Hansen, Martin, EC-HD Henrie, Gary, EC-HD 1. The objective of this trip was to conduct water velocity measurements in the JDA North Fish Ladder. Total entrance discharge was determined for rating curve data at low tailwater, and average channel velocity was measured near Weir 155 and in the Auxiliary Water Supply (AWS) well. The general vicinity is noted in Appendix A. The USACE team consisted of Steve Schlenker, Martin Hansen and Gary Henrie. The USACE Price meter equipment was used to obtain water velocities in the various locations. Access for the work was coordinated with Miroslaw A Zyndol resident JDA fish biologist. Background: 2. Concern over problems of adult salmon migrating upstream through the North Fish Ladder has been noted by Miro Zyndol. Such delay at Columbia and Snake River dams is unacceptable to fishery agencies and has prompted the U.S. Army Corps of Engineers to gather field data to address the situation recently noted. An additional purpose of the site visit was to calibrate the 1-D Model for low tailwater conditions including entrance head; AWS head losses, channel velocities, and pump curves. A summary is provided in Appendix B. 3. After Miro alerted FPOM on the poor fish passage numbers in September, discussion between him and EC-HD lead to a diagnosis of probable low velocities in the fish way channel between the approximate middle of Diffuser 2 and the base of the ladder, Weir 155. EC-HD provided to FPOM results from Printed on Recycled Paper
2 their numerical 1-D model indicating varying degrees of low velocities under different operations and also future operations after the Season 2 construction is completed this spring. In early October, Miro & other Project Biologists collected surface velocities that were significantly higher than the 1-D Model results. 4. In past years, the adult fish ladder on the north side of JDA has struggled to meet current fish passage criteria for fish ladders, and past problems have been reviewed. The current situation has relatively slow velocities in the lower channel (Diffuser 2) just downstream of the last weir. Miro (with EC-HD concurrence) suggested the low velocities could be improved by an interim operation that increased the Auxiliary Water Supply (AWS) flow (using the three pumps in manual mode) to a level so that the entrance head would exceed NMFS criteria (> 2.0 feet). Also the flow from the Exit section could be increased by raising depth over the control ladder weir, from 1.0 to 1.3 feet. The excessively high entrance head operation was later moderated to between feet in early October, as request by NMFS due to concerns for Lamprey passage. All three operations were tested during the EC-HD site visit. 5. The low velocity problems should be largely or entirely mitigated by the Season 2 construction improvements (lowing Stover Pipe weir crests for the ladder diffusers 3-15 and sluices gates that can limit the discharge from diffuser 2). Data Collection: 6. The members of the data collection team arrived at the project on Oct. 18 th and organized at the JDSFL (185 deck) at approximately 15:12. Per the staff personnel in the Smolt Building, The forebay elevation at that time was recorded as feet with the N. shore tailwater being feet. The Exit Control Section Weir was observed to be overtopped by 1.3 feet (i.e. Ladder head). This did not change during the site visit. On AM, the forebay was feet and south & north tailwater were and feet respectively. 7. Data was collected at two locations in the ladder: total AWS discharge from the AWS conduit vent, (east of Weir 174) and channel velocities at a location some six feet downstream of the former Weir 155 and nine feet downstream of the monolith joint. Appendix A shows the areas where data was taken. Appendix C contains copies of the field data sheets. Appendix D shows photographs of the collection points and associated equipment. The data collection took place under generally fixed forebay and tailrace conditions. Water levels in the Tailwater stillwell were recorded by an OnSet data logger, to supplement water levels 2
3 taken using the Solinst water level meter e-tape. The measurements of the e- tape are good to about 0.1 foot or so. The data logger confirmed well water levels did not change much during testing. Flow Conditions in the Ladder and Lower Ladder Auxiliary Water System (AWS) and Fish Ladder Entrance: 8. Ladder Flow: The total flow in the Entrance was computed by the summation of the measured AWS discharge and the upper ladder flow from the Exit and Ladder Control Section. The Auxiliary Water Supply (AWS) conduit feeds the downstream end and entrance section from the afterbay NavLock exit channel by pumping, to provide the majority of the entrance flow. The flow at the counting station was 113 cfs, based on previous model measurements for a ladder head of 1.3 feet. Depending on the ladder and entrance heads, the fish ladder exit provides cfs and the AWS provides cfs. Auxiliary Water System: The water to the lower section AWS is supplied by recently replaced pumps (driven by electrical power from the turbines). Direct measurement of the flow through the pumps would be impractical, but can be calculated from a rating curve using tailrace elevation and rating curves. For this field trip, AWS flow is estimated by integrating q grid of velocity measurements over the width and depth of the AWS conduit, using the Price meter equipment. Entrances: The approximate tailwater elevation was recorded from the staff gage on the concrete wall downstream of the fish ladder entrance. The head differential between the tailwater and water level just upstream of the entrance was determined by measuring upstream water levels from the Elev. 185 deck. The average tailwater elevations and entrance heads for Tests 11, 12, and 13 were the following: Ladder Head = 1.3 feet (113 cfs ladder flow) in all test cases below. Pump Test 11: Conditions under operation on initial day of site visit: Tailwater Elevation = feet Entrance head = 1.71 feet Pump Test 12: Conditions changed on 2 nd day of site visit: Tailwater Elevation = feet 3
4 Entrance head = 1.51 feet Pump Test 13: Conditions changed on 2 nd day of site visit: Tailwater Elevation = feet Entrance head = 2.19 feet Discharge Computations: 9. The measurements were recorded on data sheets in Appendix C. Three sets of data were taken, designated as Pump Tests 11, 12, 13; and consisted of: A. Pumping parameters recorded in the pump house, e-tape water levels in the discharge channel well, AWS diffuser stove pipe water levels and other water levels. Changes in pumping were affected by Stephanie Lesko CENWP-OD-J. B. AWS conduit discharge measurements in the air vent, using Price meter reading to determine average flow and velocities C. Fish Ladder Channel velocity measurements three sections were used, each with recordings at three different depths. The total flow through the various sampling transects is determined by first calculating an integrated average velocity across the channel at each depth and then integrating the resultant averages again over all depths. The edge of the flow field was extrapolated from the two outermost measurements at a given depth. The total integrated average velocity was then multiplied by the total cross-sectional area to get a total flow rate. 4
5 Table 1 - Summary of Flow Rates, Pump Data, Entrance Head, and Channel Velocities John Day North Fishladder Low Tailwater Pump Tests Measurement Data Summary Table Data Collected: Ladder head = 1.3 feet (for shad) October 18-19, 2012 Ladder Flow = 113 cfs Pump Operations Max Pump RPM = 229 Max Sustained Amperage = 510 Pump Test No Aver. TW Elev. (ft) AWS Flow (cfs) No. of Pumps % max RPM Max VFD HP Ave Static Lift (ft) Average Unit Pump Discharge (cfs) Pump Max Date RPM Amps 11 10/ % / % / , % Entrance Operations Pump Test No Ave. TW Elev. (ft) Δ TW in test (ft) Entrance Flow (cfs) Channel Velocities Ave. Entrance Head Readings Location 2**, near Weir 155 (1) (2) Meas. Future Control Diff Flow Average Surface Location* (1) - Rate Velocity Velocity Panel (2) cfs ft/s ft/s Date 11 10/ , / / , Average 0.2 Ratio Surf /Ave = 170% * Future location for u/s stillwell is on right side of channel 50' feet u/s of entrance structure ** 6 ft d/s of u/s end of Diffuser 2 & 9 ft east of Monolith joint Comparison of Measured Pump Performance with Pump Curves Pump Test No No. of Pump Ave Static Lift (ft) Average Pump Discharge % *** difference Pump Horsepower based on Curves Recorded VFD HP % Max RPM Meas. (cfs) Curves (cfs) Meas. to curves Curves HP % % % % % % Ave.: % *** Average of previous percent differences in Tests 1-4, 10 were 8% 5
6 Observations: 10. The measurement of the discharge and channel velocities at different AWS pump settings at the low tailwater generally indicates overall compliance with the previously developed ladder model. This mathematical hydraulic model has been utilized to develop this season s information, the PLC logic, and will be used to develop the PLC logic after the Season 2 Construction upgrades. The velocity measurements taken were to verify/calibrate the ladder model at low tailwater levels and to provide experience for future operations. This data provides important channel velocity verification, to allow proper judgments to be made on how to best operate the fish ladder, in similar circumstances. The low velocity data confirms and helps document the reason why fish did not proceed up the ladder earlier this fall. The data is attached within Appendix B. 11. The two of the key improvements planned for Season 2 ( FY 13 In-water work period) are designed to improve channel velocities in the lower ladder: Lower Stove Pipe Weirs for Ladder Diffusers 3 15 o This will direct more flow in the ladder diffusers which will in turn raise velocities at the base of the ladder Install eight (8) new sluice gates for diffuser two (2) portals o This will limit flow into large Diffuser 2 and raise AWS hydraulic gradeline to help direct more flow into the ladder diffusers Conclusions: 12. Water velocities in the vicinity of the former weir 155 and base of ladder Weir 158 were confirmed to be too low for acceptable salmon passage in the ladder. This out-of-criteria channel velocity condition will be addressed with the Season 2 construction. While not optimum, the interim operations with the increases in AWS flow and ladder head provided the best interim corrections for Season Also with calibration of the entrance head coefficient (0.694), the 1-D model simulated the field data with an average difference of 0.05 ft/s (higher in the field than model). The only aberration was with Pump Test 12, where the difference was +0.2 ft/s in the field. This shows that the model is a viable tool for simulating Season 2 Operations and PLC refinements. 6
7 Recommendations: 14. CENWP-EC-HD will provide a brief memo to FPOM on the Low Tailwater velocities experienced this year (Season 1) and the expected improvements with operations in Season Additionally, the Price meter equipment is in need of attention. Items needing consideration, given limited financial resources, are: -replacement of the Aquacount output reader -purchase of a second Sounding Reel crank arm -replacement of one of the threaded rods which guides the cable guide-wheel -installation of the geared sprocket near the handle to make the catch functional -replace/refurbish Price meter that do not pass the two minute spin test Encl. Martin Hansen Hydraulic Engineer CF: CENWP-EC-H (Buchholz, Robert) CENWP-EC-HD (Phillips, Marie) CENWP-OD-J (Mackintosh, David) CENWP-OD-J (Zyndol, Miro) CENWP-EC-TG CEN/FILES CENWP-EC-H CAPLEY CENWP-EC-H BUCHHOLZ CENWP-EC-HD PHILLIPS CENWP-EC-HD SCHLENKER CENWP-EC-HD HANSEN WAC/ OCT

8 APPENDIX A - Vicinity Map sheets with schematic outline of North Fish Ladder Note: water velocity measurement locations are shown in red on the subsequent, more detailed pages, in red. See the photo collage for a visual depiction of the Price meter water velocity measurement locations. 8
9 Channel Velocity Measurements Near Wr 155 (Location 2) AWS Discharge Measurements (Air Vent east of Weir 174) Figure A-1 : Plan View of John Day North Fishladder with Measurment Locations 9
10 Cha Velocity Measurements Near Wr 155 AWS Discharge Measurements Figure A-1 : Elevation View of John Day North Fishladder with Measurment Locations 10
11 APPENDIX B - Outline of Events and Data for JDA Fish Ladder non-performance. On September 10, 2012, Miro Zyndol, (JDA Project Biologist) reported that the count of adult migrants was unusually low after spill ceased on August 31. Also concurrently plotted is the fish ladder flow, weir elevation (ft above weir crest at North Count Station, the total AWS pump flow, and the entrance head (differential in feet as measured from water surface in the ladder about feet upstream of the Fish Ladder Entrance minus the Columbia River tailwater elevation). This incident was noticed when fish were holding, that is milling about in the lower North Fish Ladder at the same time that the fish count plummeted. John Day fish biologists responded by increasing flow by two methods: 1. Increase Diffuser 16 grating flow at the North Count Station. The diffusor grating is below the Control Section. This resulted in an increase in water overtopping the weir from 1 ft (for salmon passage) to about 1.3 ft (for shad passage). 2. Pump flow from three units was increased by increasing the RPM s. This resulted in the head differential increasing from 1 foot ( normal, typical condition) to 2.2 to 2.3 feet, starting On September 19, This was subsequently reduced to about 1.8 feet per request from NMFS. This is within NMFS criteria (but higher than the normal optimum 1.5 feet entrance head) and eases lamprey passage from the excessive head applied earlier. 3. Detailed Pump Operation Log From Miro Zyndol: -prior to 9/19 AWS pump[s operated to maintain 1.5 foot entrance criteria and ladder head at 1.0 feet -9/19 we increased the AWS output to max (pumps in manual setting) at approximately 1400 hrs. -9/26 Due to NOAA concerns for violating flow criteria, we scaled down to below 2.0' differential, at approximately noon. Additionally: -9/27 one AWS pump tripped AM, and JDN entrance was temporarily at 1.5 'differential -9/28 returned to all three AWS pumps operation, at approximately noon The following figure shows a plot of the percent of total daily adult Chinook salmon passed by the North Fishladder in 2012 versus the average daily percent in compiled by Miro Zyndol. The data record goes from Aug 06 Oct 31 for each year. The red solid line represents 2012; the blue dashed line represents The light green line represents the total daily adult salmon passed in 2012 graphed against the secondary axis over the same time period. The graph shows the poor, post-spill performance of JDAN in 2012 in comparison to previous years, and partial improvement with the interim operations after Sept
12 80% 70% 60% 50% 40% 30% 20% 10% 0% John Day North Fishladder Percent of Total Daily Adult Fish Passed at JDA North % of Total 2012 North % of Total Average Total Daily Adult Chinook Percent of Total JDA Adult Chinnok passed JDA North Fishladder Total Daily Adult Chinook Passage Spill ceased 9/1/12 Interim OP#1 2' < DH < 2.4' Started 9/19/12 Interim OP#2 1.7' < DH < 2.0' Started 9/26/12 7/30 8/9 8/19 8/29 9/8 9/18 9/28 10/8 10/18 10/28 11/7 Date Figure B-1: Percent of Total Adult Chinook Salmon passed at North Fishladder and Total Daily Adult Chinook Count 12
13 REPLY TO ATTENTION OF DEPARTMENT OF THE ARMY CORPS OF ENGINEERS, PORTLAND DISTRICT PO BOX 2946 PORTLAND OR APPENDIX C - Detailed field data Fish Ladder Velocity Data sheets with reductions Flow Conditions Measured (numbering started from initial tests in spring): Ladder Head = 1.3 feet (113 cfs ladder flow) in all test cases below. Pump Test 11: Conditions under operation on initial day of site visit: Tailwater Elevation = feet Entrance head = 1.7 feet Pump Test 12: Conditions changed on 2 nd day of site visit: Tailwater Elevation = feet Pump Test 13: Conditions changed on 2 nd day of site visit: Tailwater Elevation = feet Entrance head = 1.5 feet Entrance head = 2.2 feet The data for each Pump Test is arranged in the following order: Pump Data Sheet 1 includes pumps used, pumps speeds, pump amperage and VFD horsepower Pump Data sheet 2 includes static lift of pumps (based on difference between water level elevations in pump discharge channel and Navlock Tailwater), hydraulic gradeline in AWS conduit, tailwater and entrance head data from both control panel readouts in electrical building and physical measurements using sounding tapes. (Note that entrance heads reported at the control panel report values 0.1 feet higher than physically measured on average. However, the physical measurements in the approach channel 50 feet upstream of the entrance are not precise due to the high channel velocities that cause difficulty with sounding tapes. The water sensor is located about 3 inches above the above of the bottom of the weighted metal sensor housing that is launched downstream and into a pendulum motion when immersed into fast moving flow.) AWS Flow Measurements through air vent east of Weir 174 Includes depth in conduit and velocities measured over a grid of 5 columns (across the channel) with 5 depths of measurement is each column. The data is numerically integrated for each depth across the width of the channel. The velocities along sidewalls of the channels are estimated by means of modified projection from the outermost two measurements in proximity to the wall. The integrated average velocities for each depth are then integrated over the vertical depth of flow in the same manner. The flow rate is the total integrated velocity x depth x width. Channel Velocity Measurements at Location 2 (near former Weir 155) Includes flow depths and velocities measured over a grid of 3 to 5 columns (across the channel) with 3 depths of measurement is each column. The average velocities and flow rates are computed in the same manner as described in the previous paragraph. Printed on Recycled Paper

14 Test 11 sheets, dated
15 ETAPE MEASUREMENTS IN DISCHARGE CHANNEL: meas. elev. WS ELEV. LOCK CHANNEL (etape) TIME: 16: TIME: 18:44 DISCHARGE CHANNEL (etape) Deck elev.= 185 ft CHANNEL ENDS: U/S END ft D/S END CHANNEL ENDS: U/S END ft D/S END AVERAGE PUMP STATIC LIFT: CHANNEL ENDS: U/S END 4.1 ft D/S END 4.0 CHANNEL ENDS: U/S END 3.9 ft D/S END 3.8 AWS DIFFUSER STOVE PIPES (ETAPE W/REF TO EL. 185 DECK) meas. elev. # TIME: 16:35 Note: if no overflow in diffuser slot, measure only the downstream slot without overflow in list below; then measure all openings with overflow (downstream of that slot). meas. elev. meas. elev. meas. elev. # 10 # 9 # 8 # 7 # 6 # # 4 # U/S most Diffuser with Flow over weir: # 5 (lapping over at #6) READOUTS (Elec Building) TIME: 16:16 18:38 CHANNEL (u/s of Entrance) ft ft ENTRANCE = ft ft Entrance head = 1.80 ft 1.81 ft E-Tape Readings Distance to Water: WATER LEVEL ELEV: start end start end Time: 16:45 Ref EL 16:45 Tailrace Level : ENTRANCE HEAD: start end start end start end Existing Stillwell : Future Stillwell Location (left side 50' u/s of entrance) STAFF GAGE READINGS elev. Tailwater (+/- 1.0 ft) ft Fish Ladder over Diffuser 2 (+/1 0.2 ft) ft 15
16 JOHN DAY NORTH FISHLADDER VELOCITY DATA AWS CONDUIT MEASUREMENTS Data Collectors: MPH GSH SJS (Air Vent Slot East of Weir 174) start end Date: 10/18/2012 Time: 16:00 17:30 Pump Test number 11 Staff Gages Distance to Water: WATER LEVEL ELEV: Datum = NGVD 29/47 location start end start end Time: 16:45 0:00 Ref EL 16:45 0:00 TW Tailrace Level : Diff CONTROL PANEL READOUTS: Entrance Head start end Ref EL start end start end Exist U/s Stillwell: Future US Stillwell CONTROL PANEL READOUTS: POINT VELOCITY AND FLOW MEASUREMENTS IN AWS: 3 No. of Pumps Operating Z 15 = Meas. Distance to WS ft (from 185 deck) B = Channel Width = 24.0 ft RPM WS = Water Surface Elev (185 - Z 15) Deck elev = ft % Max 76% Y = Measured Depth = ft (=WS - 2) Zi = INVERT = ft Max RPM 229 Aprrox internal dimension = 3.5 Div est TW 26 X1 = Side Edge width inc= 3 No of Internal X Incr = 5 10 internal Y -124 Y1 = Vertical edge height in 2 No of Internal Y Incr. = (X' if YES) HP AWS CONDUIT MEASUREMENTS: (Air Vent Slot East of Weir 174) Pump 1 Vert. Sect. No. : Pump 2 X 238 Horiz. No.: Formula for Depth from surface (pm) Depth from Surface (ft) 1 0.5*Y1/2 1.0 Est Dist. from Left Edge (ft) (ft) from Fft side Ave Vel Pump Pump 4 Counts angle Pump 5 Pump 6 X 234 X 244 VELOCITY Depth 1 + (Y-Y1)/4 3.7 Counts angle VELOCITY Depth 2 + (Y-Y1)/4 6.4 Counts angle VELOCITY Price Meter X 4 Depth 3 + (Y-Y1)/4 9.1 Counts angle Price Meter Rotations per Count: 1 VELOCITY V = * (rotations/time) 5 Depth 4 + Counts (Y-Y1)/ angle should = Y - 0.5*Y1/2 VELOCITY Total Average Integrated Velocity = 3.02 Total Computed AWS FLOW RATE = 927 ( = B * Y * V)

17 17
18 Test 12 sheets, dated

19 19
20 JOHN DAY NORTH FISHLADDER VELOCITY DATA AWS CONDUIT MEASUREMENTS Data Collectors: MPH GSH SJS (Air Vent Slot East of Weir 174) start end Date: 10/19/2012 Time: 9:30 10:40 Pump Test number 12 Staff Gages Distance to Water: WATER LEVEL ELEV: Datum = NGVD 29/47 location start end start end Time: 10:00 11:04 Ref EL 10:00 11:04 TW? Tailrace Level : Diff CONTROL PANEL READOUTS: Entrance Head start end Ref EL start end start end Exist U/s Stillwell: Future US Stillwell CONTROL PANEL READOUTS: POINT VELOCITY AND FLOW MEASUREMENTS IN AWS: 2 No. of Pumps Operating Z 15 = Meas. Distance to WS ft (from 185 deck) B = Channel Width = 24.0 ft RPM WS = Water Surface Elev (185 - Z 15 ) Deck elev = ft % Max 98% Y = Measured Depth = ft (=WS - 2) Zi = INVERT = ft Max RPM 229 Aprrox internal dimension = 3.5 Div est TW 26 X1 = Side Edge width inc= 3 No of Internal X Incr = 5 10 internal Y -124 Y1 = Vertical edge height in 2 No of Internal Y Incr. = (X' if YES) HP AWS CONDUIT MEASUREMENTS: (Air Vent Slot East of Weir 174) Pump 1 Vert. Sect. No. : Pump 2 Horiz. No.: Formula for Depth from surface (pm) Depth from Surface (ft) 1 0.5*Y1/2 1.0 Est Dist. from Left Edge (ft) (ft) from Fft side Ave Vel Pump Pump 4 Counts angle Pump 5 Pump 6 X 364 X 379 VELOCITY Depth 1 + (Y-Y1)/4 3.7 Counts angle VELOCITY Depth 2 + (Y-Y1)/4 6.4 Counts angle VELOCITY Price Meter X 4 Depth 3 + (Y-Y1)/4 9.1 Counts angle Price Meter Rotations per Count: 1 VELOCITY V = * (rotations/time) 5 Depth 4 + Counts (Y-Y1)/ should = angle Y - 0.5*Y1/2 VELOCITY Total Average Integrated Velocity = 2.85 Total Computed AWS FLOW RATE = 841 ( = B * Y * V)
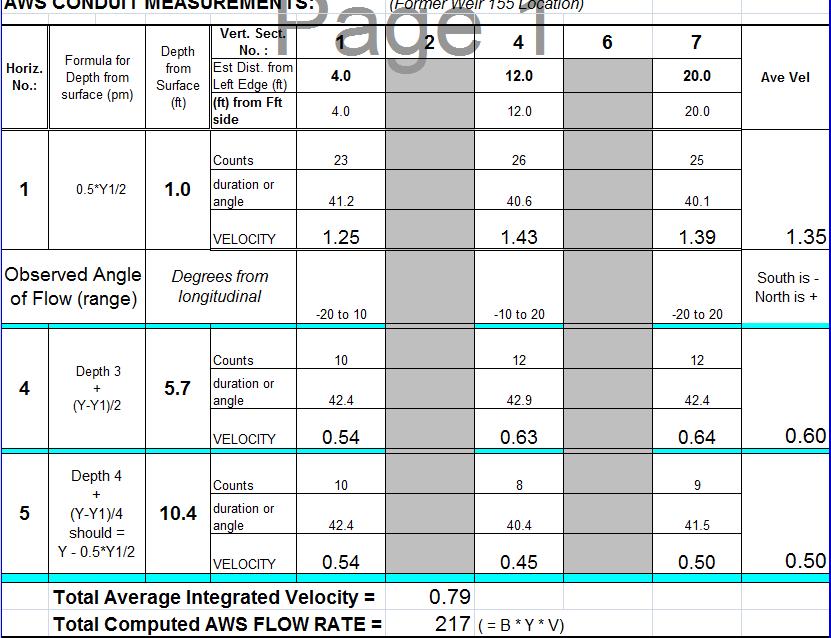
21 JOHN DAY NORTH FISHLADDER VELOCITY DATA LADDER CHANNEL MEASUREMENTS Data Collectors: MPH GSH SJS LOCATION: 2 9 feet east of MonolithJoint Sections 1 and 2 (Approx Former WEIR 155 Location) Pump Test number start end 12 Date: 10/19/2012 Time: 11:10 11:49 Tailwater Entrance Head start end start end CONTROL PANEL READOUTS: Time of Readings: 10:00 10:48 Price Meter X No. of Pumps Operating: 2 Price Meter Rotations per Count = 1 V = * (rotations/time) POINT VELOCITY AND FLOW MEASUREMENTS IN AWS: Z 15 = Meas. Distance to WS ft (from 185 deck) B = Channel Width = 24.0 ft WS = Water Surface Elev (185 - Z 15 ) Deck elev = ft Y = Measured Depth = ft (=WS - 2) Zi = INVERT = ft Aprrox internal dimension = 5.0 Div est TW 26.0 X1 = Side Edge width inc= 4 No. of Internal X Incr. = 3 6 internal Y Y1 = Vertical edge height in 2 No.of Internal Y Incr. = AWS CONDUIT MEASUREMENTS: (Former Weir 155 Location) Horiz. No.: Formula for Depth from surface (pm) Depth from Surface (ft) Vert. Sect. No. : Est Dist. from Left Edge (ft) (ft) from Fft side Ave Vel 1 0.5*Y1/2 1.0 Counts angle Observed Angle of Flow (range) VELOCITY Degrees from longitudinal -20 to to to to to South is - North is + 4 Depth 3 + (Y-Y1)/2 5.6 Counts angle VELOCITY Depth 4 + (Y-Y1)/4 should = Y - 0.5*Y1/ Counts angle VELOCITY Total Average Integrated Velocity = 0.88 Total Computed AWS FLOW RATE = 235 ( = B * Y * V)
22 Test 13 sheets, dated JOHN DAY NORTH FISH LADDER HEAD DATA Date: 10/19/2012 Time: 13:20 14:10 15:15 Name: MPH GSH SJS PUMP TEST NUMBER: 13 ENTRANCE DATA READOUT: 13:20 TW App Cha NUMBER OF PUMPS OPERATING: 3 14:10 TW App Cha RPM OF PUMPS OPERATING: :15 TW App Cha % Max RPM 90% ENTRANCE DATA READOUT: Pump No PUMPS IN OPERATION: X X X PRESSURE AND WATER SURFACE ELEVATIONS: meas. COUNTING STATION STAFF GAGE = 1.3 ft TIME: PUMP & AWS HEAD MEASUREMENTS: (Deck Elev. = 185 ft) (datum = NGVD 29/47 ) PUMPS FROM U/S END: CONTROL ROOM READINGS: PUMP # 1 TIME: 13:20 14:10 15:15 PUMP # 4 PUMP AMPERAGE AMPS HORSE POWER HP VOLTAGE to PUMPS VOLTS PUMP # 2 3 PUMP # 5 PUMP AMPERAGE AMPS HORSE POWER HP VOLTAGE to PUMPS VOLTS PUMP # 3 2 PUMP # 6 PUMP AMPERAGE AMPS HORSE POWER HP VOLTAGE to PUMPS VOLTS VOLTAGE TO VFDS VFD Frequency Hz 22
23 ETAPE MEASUREMENTS IN DISCHARGE CHANNEL: meas. elev. WS ELEV. LOCK CHANNEL (etape) TIME: 13: TIME: 14:15 DISCHARGE CHANNEL (etape) Deck elev.= 185 ft CHANNEL ENDS: U/S END ft D/S END CHANNEL ENDS: U/S END ft D/S END AVERAGE PUMP STATIC LIFT: CHANNEL ENDS: U/S END 5.3 ft D/S END 5.3 CHANNEL ENDS: U/S END 5.1 ft D/S END 5.0 AWS DIFFUSER STOVE PIPES (ETAPE W/REF TO EL. 185 DECK) meas. elev. # TIME: 13:45 Note: if no overflow in diffuser slot, measure only the downstream slot without overflow in list below; then measure all openings with overflow (downstream of that slot). meas. elev. meas. elev. meas. elev. # 10 # 9 # 8 # # # # # U/S most Diffuser with Flow over weir: # 6 READOUTS (Elec Building) TIME: 13:20 14:10 15:13 CHANNEL (u/s of Entrance) ft ft ft ENTRANCE = ft ft ft Entrance head = 2.29 ft 2.29 ft 2.27 ft E-Tape Readings Distance to Water: WATER LEVEL ELEV: start end start end Time: 13:39 14:28 Ref EL 13:39 14:28 Tailrace Level : ENTRANCE HEAD: start end start end start end Existing Stillwell : Future Stillwell Location (left side 50' u/s of entrance) (right side) STAFF GAGE READINGS elev. Tailwater (+/- 1.0 ft)? ft Fish Ladder over Diffuser 2 (+/1 0.2 ft) ft 23
24 JOHN DAY NORTH FISHLADDER VELOCITY DATA AWS CONDUIT MEASUREMENTS Data Collectors: MPH GSH SJS (Air Vent Slot East of Weir 174) start end Date: 10/19/2012 Time: 13:10 14:07 Pump Test number 13 Staff Gages Distance to Water: WATER LEVEL ELEV: Datum = NGVD 29/47 location start end start end Time: 13:39 14:28 Ref EL 13:39 14:28 TW? Tailrace Level : Diff CONTROL PANEL READOUTS: Entrance Head start end Ref EL start end start end Exist U/s Stillwell: Future US Stillwell CONTROL PANEL READOUTS: POINT VELOCITY AND FLOW MEASUREMENTS IN AWS: 3 No. of Pumps Operating Z 15 = Meas. Distance to WS ft (from 185 deck) B = Channel Width = 24.0 ft RPM WS = Water Surface Elev (185 - Z 15) Deck elev = ft % Max 90% Y = Measured Depth = ft (=WS - 2) Zi = INVERT = ft Max RPM 229 Aprrox internal dimension = 3.5 Div est TW 26 X1 = Side Edge width inc= 3 No of Internal X Incr = 5 10 internal Y -124 Y1 = Vertical edge height in 2 No of Internal Y Incr. = (X' if YES) HP AWS CONDUIT MEASUREMENTS: (Air Vent Slot East of Weir 174) Pump 1 Vert. Sect. No. : Pump 2 X 355 Horiz. No.: Formula for Depth from surface (pm) Depth from Surface (ft) 1 0.5*Y1/2 1.0 Est Dist. from Left Edge (ft) (ft) from Fft side Ave Vel Pump Pump 4 Counts angle Pump 5 Pump 6 X 361 X 371 VELOCITY Depth 1 + (Y-Y1)/4 3.5 Counts angle VELOCITY Depth 2 + (Y-Y1)/4 6.4 Counts angle VELOCITY Price Meter X 4 Depth 3 + (Y-Y1)/ Counts angle Price Meter Rotations per Count: 1 VELOCITY V = * (rotations/time) 5 Depth 4 + (Y-Y1)/4 should = Y - 0.5*Y1/ Counts angle VELOCITY Total Average Integrated Velocity = 3.33 Total Computed AWS FLOW RATE = 1112 ( = B * Y * V)
25 JOHN DAY NORTH FISHLADDER VELOCITY DATA LADDER CHANNEL MEASUREMENTS Data Collectors: MPH GSH SJS LOCATION: 2 9 feet east of MonolithJoint Sections 1 and 2 (Approx Former WEIR 155 Location) Pump Test number start end 13 Date: 10/19/2012 Time: 14:35 17:05 Tailwater Entrance Head start end start end CONTROL PANEL READOUTS: Time of Readings: 14:10 15:13 Price Meter X No. of Pumps Operating: 3 Price Meter Rotations per Count = 1 V = * (rotations/time) POINT VELOCITY AND FLOW MEASUREMENTS IN AWS: Z 15 = Meas. Distance to WS ft (from 185 deck) B = Channel Width = 24.0 ft WS = Water Surface Elev (185 - Z 15 ) - staff gage Deck elev = ft Y = Measured Depth = ft (=WS - 2) Zi = INVERT = ft Aprrox internal dimension = 5.0 Div est TW 26.0 X1 = Side Edge width inc= 4 No. of Internal X Incr. = 3 6 internal Y Y1 = Vertical edge height in 2 No.of Internal Y Incr. = AWS CONDUIT MEASUREMENTS: (Former Weir 155 Location) Horiz. No.: Formula for Depth from surface (pm) Depth from Surface (ft) Vert. Sect. No. : Est Dist. from Left Edge (ft) (ft) from Fft side Ave Vel 1 0.5*Y1/2 1.0 Counts angle Observed Angle of Flow (range) VELOCITY Degrees from longitudinal -10 to to to to 20-5 to South is - North is + 4 Depth 3 + (Y-Y1)/2 6.0 Counts angle VELOCITY Depth 4 + (Y-Y1)/4 should = Y - 0.5*Y1/ Counts angle VELOCITY Total Average Integrated Velocity = 1.05 Total Computed AWS FLOW RATE = 304 ( = B * Y * V)
26 APPENDIX D - Photo collage of field data gathering showing equipment. (See following pages.) 26

27 Photo-stream of John Day Dam N. Fish Ladder, Oct. 18 & 19, 2012 data collection and associated equipment: (Overall Images Nos. 1 to 9, on pages 1 to 4:) Photo 1. Aerial View of North Fish Ladder from NavLock gate lifting tower looking upstream towards dam, with Navlock on the left. The Fish Counting Station is in center of upper-most level of the fish ladder. 27

28 Photo 2. End view of North Fish Ladder the AWS vent-well is shown in the lower right corner, as a projection from the end turn of the fish ladder channel, per the arrow. Three struts are at the base of the AWS vent-well wall. 28

29 Photo 3. N. Fish Ladder looking downstream from AWS vent-well towards dam and former Weir 155, the other transect location where the fish ladder channel cross-sectional velocities were measured. 29

30 Photo 4. Elevation view of N Fish Ladder the fish channel transect is located just right of the closely spaced dual concrete columns in line-sight with the entrance end of the fish ladder. The monolith joint runs between the two closely-spaced columns. The fish channel transect is nine feet to the right of the monolith joint, lying just to the right of right column as noted by the red arrow. The blue arrow pointing to the Elev. 185 deck is where e- tape water-surface level indicators are used to determine the water surface, just within the fish ladder entrance. 30

31 Photo 5. Water velocity measurement system sounding reel on folding frame, plus 30# lead fish-weight, with Price meter. Price meter is lowered by stainless steel cable down into the AWS vent-well from the end pulley, via a hand-operated crank-arm mounted on the sounding reel. 31

32 Photo 6. Close-up of water velocity measurement system sounding reel on folding frame, showing hand crank and electrical leads for measuring Price meter cup rotations, and hence water velocity. An adjustable cable-payout dial indicator is on the left upper end of the sounding reel chassis, directly above the reel axle. 32
 is normally used, not the lower wire connection lead as shown ( five-count ).")
33 Photo 7. Close-up of Price meter setup next to the AWS vent-well with 30# fish weight to maintain stability in turbulent flow. The upper wire connection lead ( one-count ) is normally used, not the lower wire connection lead as shown ( five-count ). The cups of the Price meter are given a two minute spin test before immersion to insure proper functioning. Concurrently the spin reading on the Aquacount output reader (not shown) is also checked. 33


34 Photo 8. Close-up of Price meter setup next to the fish channel, near the former Weir 155. The fish weight and Price meter are drawn across the channel into position by the ropes attached to the metal links and metal cable-pulley. The position was checked using a marked-up light-weight white two inch plastic pipe. Note the connected blue and yellow Aquacount output reader placed temporarily on the Elev. 185 deck. The operator normally stands on the folding frame where it rests on the deck, instead of the steel tubing sections shown. 34

35 Photo 9. Close-up of Price meter setup next to the fish channel with the metal pulley positioning system. The cups of the Price meter are given a two minute spin test before immersion to insure proper functioning. This test consists of seeing if the cups, once manually spun, remain in motion for at least two minutes. Concurrently the spin reading on the Aquacount output reader is also checked. 35
36 References: JD reference drawings JDF-1-3-4/5 N. Shore Fish Ladder - Pumphouse JDF-1-3-4/8 N. Shore Fish Facilities - Section of Pump & Pump Discharge Chute (Shows under-sized radius of interior concrete corner, leading to discharge duct) JDF-1-4-2/1 N. Shore Fish Ladder Concrete Outline (Shows diffusers and stove-pipe wells & fish ladder entrance X-Section) JDF-1-4-2/17 N. Shore Fish Ladder Section Views No. 2 (shows stove-pipe shaft & overflow weir) JDF-1-4-2/18 N. Shore Fish Ladder Section Views No. 3 JDF-1-4-2/52 N. Shore Fish Ladder Weir 155 to 263 JDF-1-4-2/57 N. Shore Fish Ladder Staff Gage Locations (incl. inside & outside of fish ladder entrance), (shows water supply conduit from pumps) JDF-1-4-2/58 N. Shore Fish Ladder Elevation View (shows orifice covers and Stove-pipe shafts leading to diffusers. Also vent well in auxiliary water supply (AWS) conduit where velocities are taken to compute AWS discharge rates. JDF-1-4-2/104 N. Shore Fish Ladder Temporary Fish Ladder JDF-1-5-2/1 N. Shore Fish Ladder Fish Entrance JDF-1-5-2/12 N. Shore Fish Ladder Existing General Layout (shows water Supply conduit, observation well, and NavLock discharge conduits routed Beneath water supply conduit) JDF-1-5-2/19 N. Shore Fish Ladder Modified Sections at Counting Station JD misc. ref correspondence on North Fish Ladder evaluations S. Schlenker, Cy Cook, Karen Kuhn, et al. 36
MEMORANDUM. DATE: June 15, RE: Fishway Inspections May 2001
 FISH PASSAGE CENTER 2501 SW First Avenue, Suite 230, Portland, OR 97201-4752 Phone: (503) 230-4099 Fax: (503) 230-7559 http://www.fpc.org/ e-mail us at fpcstaff@fpc.org MEMORANDUM TO: FROM: Salmon Managers
ADULT FISHWAY INSPECTIONS ON THE COLUMBIA AND SNAKE RIVERS 2012 ANNUAL REPORT
 ADULT FISHWAY INSPECTIONS ON THE COLUMBIA AND SNAKE RIVERS 2012 ANNUAL REPORT David A. Benner, Field Operations Coordinator Fish Passage Center A Collaborative Program of United States Fish and Wildlife
STRUCTURE S-65 PURPOSE SPILLWAY OPERATION
 STRUCTURE S-65 This structure is a reinforced concrete, gated spillway with discharge controlled by three cable operated, vertical lift gates, and a reinforced concrete lock structure with two pairs of
STRUCTURE 65-B PURPOSE SPILLWAY OPERATION
 STRUCTURE 65-B This structure is a reinforced concrete, gated spillway with discharge controlled by three cable operated vertical lift gates and a reinforced concrete lock structure with two pairs of sector
APPENDIX A STRUCTURE DESCRIPTIONS AND RATING CURVES
 3 4 5 6 7 8 9 0 3 APPENDIX A STRUCTURE DESCRIPTIONS AND RATING CURVES Kissimmee River Vol December 005 Version Draft 4 3 4 5 6 7 8 9 0 3 4 5 6 7 8 9 0 3 4 5 6 7 8 9 30 3 3 33 34 35 36 37 38 39 40 4 4 43
Annex C Temporary Fish Passage Plan
 Annex C Temporary Fish Passage Plan Table C1 Figure C1 Figure C2 Figure C3 Figure C4 Figure C5 Figure C6 Figure C7 Figure C8 Figure C9 Figure C10 Figure C11 Figure C12 Figure C13 Options Considered in
ADULT FISHWAY INSPECTIONS ON THE COLUMBIA AND SNAKE RIVERS 2000 ANNUAL REPORT. Larry R. Basham, Field Operations Coordinator
 ADULT FISHWAY INSPECTIONS ON THE COLUMBIA AND SNAKE RIVERS 2000 ANNUAL REPORT Larry R. Basham, Field Operations Coordinator FISH PASSAGE CENTER 2501 SW First Ave., Suite 230 Portland, OR 97201-4752 of
ADULT FISHWAY INSPECTIONS ON THE COLUMBIA AND SNAKE RIVERS 2016 ANNUAL REPORT
 ADULT FISHWAY INSPECTIONS ON THE COLUMBIA AND SNAKE RIVERS 2016 ANNUAL REPORT David A. Benner, Field Operations Coordinator FISH PASSAGE CENTER A Collaborative Program of United States Fish and Wildlife
ADULT FISHWAY INSPECTIONS 2001 ANNUAL REPORT
 ADULT FISHWAY INSPECTIONS 2001 ANNUAL REPORT By LARRY R. BASHAM FISH PASSAGE CENTER of the COLUMBIA BASIN FISH & WILDLIFE AUTHORITY Bonneville: WA Shore Powerhouse Bonneville: WA Shore Fish Ladder Exit
ADULT FISHWAY INSPECTIONS ON THE COLUMBIA AND SNAKE RIVERS 2013 ANNUAL REPORT
 ADULT FISHWAY INSPECTIONS ON THE COLUMBIA AND SNAKE RIVERS 2013 ANNUAL REPORT David A. Benner, Field Operations Coordinator Fish Passage Center A Collaborative Program of United States Fish and Wildlife
Plan B Dam Breach Assessment
 Plan B Dam Breach Assessment Introduction In support of the Local Sponsor permit applications to the states of Minnesota and North Dakota, a dam breach analysis for the Plan B alignment of the Fargo-Moorhead
Session C9: Priest Rapids Fish Bypass: A Case Study from Start to Finish
 University of Massachusetts - Amherst ScholarWorks@UMass Amherst International Conference on Engineering and Ecohydrology for Fish Passage International Conference on Engineering and Ecohydrology for Fish
Smart Water Application Technologies (SWAT)
") Smart Water Application Technologies (SWAT) Turf and Landscape Irrigation Equipment PRESSURE REGULATING SPRAY HEAD SPRINKLERS Equipment Functionality Test Testing Protocol Version 3.0 (May 2012) Developed
Smart Water Application Technologies (SWAT) Turf and Landscape Irrigation Equipment PRESSURE REGULATING SPRAY HEAD SPRINKLERS Equipment Functionality Test Testing Protocol Version 3.0 (May 2012) Developed
Upstream Passage Assessment of American Shad Using 3D Acoustic Telemetry
 Upstream Passage Assessment of American Shad Using 3D Acoustic Telemetry Timothy Hogan, Alden Research Laboratory Corey Wright, Blue Leaf Environmental Skip Medford, Enel Green Power North America Abstract
Exercise (3): Open Channel Flow Rapidly Varied Flow
: Open Channel Flow Rapidly Varied Flow") Exercise (3): Open Channel Flow Rapidly Varied Flow 1) A hydraulic jump exists in a trapezoidal channel having a bed width of 7 m and side slope of 1:1. The flowing discharge is 25 m 3 /sec. Construct
Exercise (3): Open Channel Flow Rapidly Varied Flow 1) A hydraulic jump exists in a trapezoidal channel having a bed width of 7 m and side slope of 1:1. The flowing discharge is 25 m 3 /sec. Construct
Section 5: Pond Outlets
 Section : Pond Outlets Defining and calculating pond outlet devices 8 Minutes Press Space, PageDown, or Click to advance. Press PageUp to reverse. Esc to exit. Right-Click for other options. Outlets Introduction
Packwood Hydroelectric Project Barrier Analysis December 12, 2006
 Packwood Hydroelectric Project Barrier Analysis December 12, 2006 Study Area Natural barriers to upstream fish passage on Lake Creek at RM 1.03 and RM 1.95 Snyder Creek culvert under the Project tailrace
Aquavar SOLO 2 Frequently Asked Questions
 Aquavar SOLO 2 Frequently Asked Questions How do I size the Aquavar SOLO 2 for the appropriate pump/motor combination? Can I use a 208 Volt motor? Can I run the Aquavar SOLO 2 up to 80HZ? What are the
Dave Clugston U.S. Army, Corps of Engineers, Portland District. Tami Clabough, Eric Johnson, Dan Joosten, and Chris Peery
 College of Natural Resources Department of Fish and Wildlife Resources P.O. Box 443141 Moscow, Idaho 83844-3141 Phone: 8-885-64 Fax: 8-885-98 To: From: RE: Dave Clugston U.S. Army, Corps of Engineers,
Work Standard CABLE PULLING OPERATIONS
 Page 1 of 19 ****This document supercedes BECo WMS 2.9-1.1**** 1.0 Purpose CABLE PULLING OPERATIONS 1.1 This Work Method Standard prescribes the preferred methods of removing and installing cables between
Packwood Lake Intake Screen Velocity Test Report for Energy Northwest's Packwood Lake Hydroelectric Project FERC No Lewis County, Washington
 for Energy Northwest's Packwood Lake Hydroelectric Project FERC No. 2244 Lewis County, Washington Submitted to P.O. Box 968 Richland, Washington 99352-0968 Submitted by EES Consulting 1155 North State
WMS 8.4 Tutorial Hydraulics and Floodplain Modeling HY-8 Modeling Wizard Learn how to model a culvert using HY-8 and WMS
 v. 8.4 WMS 8.4 Tutorial Hydraulics and Floodplain Modeling HY-8 Modeling Wizard Learn how to model a culvert using HY-8 and WMS Objectives Define a conceptual schematic of the roadway, invert, and downstream
6. EXPERIMENTAL METHOD. A primary result of the current research effort is the design of an experimental
 6. EXPERIMENTAL METHOD 6.1 Introduction A primary result of the current research effort is the design of an experimental setup that can simulate the interaction of a windmill with a vortex wake and record
Indiana LTAP Road Scholar Core Course #10 Culvert Drainage. Presented by Thomas T. Burke, Jr., PhD, PE Christopher B. Burke Engineering, Ltd.
 Indiana LTAP Road Scholar Core Course #10 Culvert Drainage Presented by Thomas T. Burke, Jr., PhD, PE Christopher B. Burke Engineering, Ltd. Objectives Review culvert shapes, end sections, and materials
Preliminary survival estimates for the passage of spring-migrating juvenile salmonids through Snake and Columbia River dams and reservoirs, 2016
 UNITED STATES DEPARTMENT OF COMMERCE National Oceanic and Atmospheric Administration NATIONAL MARINE FISHERIES SERVICE Northwest Fisheries Science Center Fish Ecology Division 2725 Montlake Boulevard East
CHAPTER 4 SPALDING COUNTY, GEORGIA 4.0 CULVERT DESIGN
 SPALDING COUNTY, GEORGIA CHAPTER 4 4.0 CULVERT DESIGN... 4-1 4.1 INTRODUCTION... 4-1 4.2 SYMBOLS AND DEFINITIONS... 4-1 4.3 ENGINEERING DESIGN CRITERIA... 4-2 4.3.1 FREQUENCY FLOOD... 4-2 4.3.2 VELOCITY
Date: 25 September Introduction
 To: David Clugston, USACE Portland District From: Matt Keefer, Eric Johnson, Tami Clabough, Mike Jepson, Chris Caudill, Mary Moser RE: Preliminary evaluation of radiotelemetry and half-duplex PIT tag data
Preliminary survival estimates for the passage of spring-migrating juvenile salmonids through Snake and Columbia River dams and reservoirs, 2017
 UNITED STATES DEPARTMENT OF COMMERCE National Oceanic and Atmospheric Administration NATIONAL MARINE FISHERIES SERVICE Northwest Fisheries Science Center Fish Ecology Division 2725 Montlake Boulevard East
Technical Report Culvert A Hydraulic Analysis
 DATE: November 3, 2011 Technical Report Culvert A Hydraulic Analysis TO: FROM: RE: Jim Reiser, P.E. Project Manager Parsons Brinckerhoff, Inc. Kurt Killian, P.E., CFM Parsons Brinckerhoff, Inc. Design
Cover Page for Lab Report Group Portion. Head Losses in Pipes
 Cover Page for Lab Report Group Portion Head Losses in Pipes Prepared by Professor J. M. Cimbala, Penn State University Latest revision: 02 February 2012 Name 1: Name 2: Name 3: [Name 4: ] Date: Section
EFFECTS ON CUTTER SUCTION DREDGE PRODUCTION WHILE DREDGING SIMULATED DEBRIS IN THE LABORATORY
 EFFECTS ON CUTTER SUCTION DREDGE PRODUCTION WHILE DREDGING SIMULATED DEBRIS IN THE LABORATORY R. Randall 1, M. Warwick 2, J. Henriksen 3, D. Young 4, and A. Manikantan 5 ABSTRACT The cutter suction dredge
APPENDIX J HYDROLOGY AND WATER QUALITY
 APPENDIX J HYDROLOGY AND WATER QUALITY J-1 Technical Report on Airport Drainage, Northern Sector Airport and Ordinance Creek Watershed / Preliminary Creek Constructed Natural Channel Culvert J-2 Preliminary
Technical Report 99-4 EFFECTS OF A SHAD FISHERY ON PASSAGE OF ADULT CHINOOK SALMON THROUGH THE OREGON-SHORE FISHWAY LADDER AT THE DALLES DAM
 Technical Report 99-4 EFFECTS OF A SHAD FISHERY ON PASSAGE OF ADULT CHINOOK SALMON THROUGH THE OREGON-SHORE FISHWAY LADDER AT THE DALLES DAM - 1996 A report for Project MPE-P-95-1 by C.A. Peery, T.C. Bjornn,
Preliminary survival estimates for the passage of spring-migrating juvenile salmonids through Snake and Columbia River dams and reservoirs, 2018
 UNITED STATES DEPARTMENT OF COMMERCE National Oceanic and Atmospheric Administration NATIONAL MARINE FISHERIES SERVICE Northwest Fisheries Science Center Fish Ecology Division 2725 Montlake Boulevard East
Broadly speaking, there are four different types of structures, each with its own particular function:
 3 The selection of structures 3.1 Introduction In selecting a suitable structure to measure or regulate the flow rate in open channels, all demands that will be made upon the structure should be listed.
Technical Report
 Technical Report 26-9 ADULT CHINOOK SALMON AND STEELHEAD PASSAGE TIMES AND BEHAVIORS IN THE SOUTH-SHORE LADDER AT JOHN DAY DAM, WITH SPECIAL REFERENCE TO LADDER MODIFICATIONS: 1996-1998 and 2- by M.L.
CLAIBORNE LOCK AND DAM PERTINENT DATA
 CLAIBORNE LOCK AND DAM PERTINENT DATA GENERAL Location Clarke, Monroe, & Wilcox Counties, Alabama; Alabama River, river mile 72.5 Drainage area Millers Ferry to Claiborne sq. mi. 836 Total drainage area
HURRICANE SANDY LIMITED REEVALUATION REPORT UNION BEACH, NEW JERSEY DRAFT ENGINEERING APPENDIX SUB APPENDIX D SBEACH MODELING
 HURRICANE SANDY LIMITED REEVALUATION REPORT UNION BEACH, NEW JERSEY DRAFT ENGINEERING APPENDIX SUB APPENDIX D SBEACH MODELING Rev. 18 Feb 2015 1 SBEACH Modeling 1.0 Introduction Following the methodology
Dave Clugston U.S. Army, Corps of Engineers, Portland District. Tami Clabough, Eric Johnson, Dan Joosten, and Chris Peery
 College of Natural Resources Department of Fish and Wildlife Resources P.O. Box 443141 Moscow, Idaho 83844-3141 Phone: 28-885-64 Fax: 28-885-98 To: From: Dave Clugston U.S. Army, Corps of Engineers, Portland
SUBMERGED VENTURI FLUME. Tom Gill 1 Robert Einhellig 2 ABSTRACT
 SUBMERGED VENTURI FLUME Tom Gill 1 Robert Einhellig 2 ABSTRACT Improvement in canal operating efficiency begins with establishing the ability to measure flow at key points in the delivery system. The lack
CHAPTER 5 CULVERT DESIGN
 CHAPTER 5 CULVERT DESIGN HYDRAULICS OF CULVERTS There are two major types of culvert flow: 1) flow with inlet control, and 2) flow with outlet control. For each type, different factors and formulas are
WASHINGTON CONSERVATION DISTRICT STANDARD OPERATING PROCEDURE (S.O.P.)
") Page 1 of 18 Water Monitoring Program WASHINGTON CONSERVATION DISTRICT STANDARD OPERATING PROCEDURE (S.O.P.) No. 1 FLOW MONITORING Page 2 of 18 Water Monitoring Program Standard Operating Procedure No.
Page 1 of 18 Water Monitoring Program WASHINGTON CONSERVATION DISTRICT STANDARD OPERATING PROCEDURE (S.O.P.) No. 1 FLOW MONITORING Page 2 of 18 Water Monitoring Program Standard Operating Procedure No.
847 NE 19 th Avenue, #250, Portland, OR Phone: (503) Fax: (503) us at
 Fax: (503) us at") FISH PASSAGE CENTER 847 NE 19 th Avenue, #250, Portland, OR 97232 Phone: (503) 833-3900 Fax: (503) 232-1259 www.fpc.org/ e-mail us at fpcstaff@fpc.org MEMORANDUM TO: Charlie Morrill (WDFW) FROM: Michele
FISH PASSAGE CENTER 847 NE 19 th Avenue, #250, Portland, OR 97232 Phone: (503) 833-3900 Fax: (503) 232-1259 www.fpc.org/ e-mail us at fpcstaff@fpc.org MEMORANDUM TO: Charlie Morrill (WDFW) FROM: Michele
ENTRANCES USED AND PASSAGE THROUGH FISHWAYS FOR ADULT CHINOOK SALMON AND STEELHEAD
 ENTRANCES USED AND PASSAGE THROUGH FISHWAYS FOR ADULT CHINOOK SALMON AND STEELHEAD Part III of Final Report for MIGRATION OF ADULT CHINOOK SALMON AND STEELHEAD PAST DAMS AND THROUGH RESERVOIRS IN THE LOWER
Little Spokane River Stream Gage Report: Deadman Creek, Dragoon Creek, and the West Branch of the Little Spokane River
 Little Spokane River Stream Gage Report: Deadman Creek, Dragoon Creek, and the West Branch of the Little Spokane River June 2010 Spokane County Conservation District N. 210 Havana St. Spokane, WA 99202
GEOL 106: Earthquake Country Activity 08: Discharge Measurements. Name: Date:
 Name: Date: Discharge Calculation Discharge = Velocity X Area or Q = VA Calculate the Discharge for the measurements shown at the right. Q = Discharge Measurement Do not collect water samples in the area
Interim Guidance Fish Presence Absence
 Interim Guidance Fish Presence Absence Source: Forest Practices Act Guidance for Division 635 of the forest practices act dealing with stream classification when no fish surveys have been done (referenced
APPENDIX A STRUCTURE DESCRIPTIONS AND RATING CURVES. Lake Okeechobee & EAA Vol 3 A-i December 2005 Version 1 Draft 4
 1 1 1 1 1 1 1 1 0 1 0 1 0 APPENDIX A STRUCTURE DESCRIPTIONS AND RATING CURVES Lake Okeechobee & EAA Vol A-i December 00 1 1 1 1 1 1 1 1 0 1 from the drainage area served, under a design head of. feet pool
Cover Page for Lab Report Group Portion. Pump Performance
 Cover Page for Lab Report Group Portion Pump Performance Prepared by Professor J. M. Cimbala, Penn State University Latest revision: 02 March 2012 Name 1: Name 2: Name 3: [Name 4: ] Date: Section number:
Experiment (13): Flow channel
: Flow channel") Experiment (13): Flow channel Introduction: An open channel is a duct in which the liquid flows with a free surface exposed to atmospheric pressure. Along the length of the duct, the pressure at the surface
Experiment (13): Flow channel Introduction: An open channel is a duct in which the liquid flows with a free surface exposed to atmospheric pressure. Along the length of the duct, the pressure at the surface
IDAHO COOPERATIVE FISH AND WILDLIFE RESEARCH UNIT
 Technical Report 211-2 IDAHO COOPERATIVE FISH AND WILDLIFE RESEARCH UNIT BEHAVIOR OF RADIO-TAGGED ADULT SPRING-SUMMER CHINOOK SALMON AT THE DALLES DAM IN RELATION TO SPILL VOLUME AND THE PRESENCE OF THE
February Lower Granite Dam
 Lower Granite Dam 1. Fish Passage Information. The locations of fish passage facilities at Lower Granite Lock and Dam are shown in Figure LWG-1. Dates of project operations for fish purposes and special
EVALUATION OF FISHWAY MODIFICATIONS TO IMPROVE PASSAGE OF ADULT CHINOOK SALMON AND STEELHEAD THROUGH THE TRANSITION POOL AT LOWER GRANITE DAM, 2008
 Technical Report 2009-3 EVALUATION OF FISHWAY MODIFICATIONS TO IMPROVE PASSAGE OF ADULT CHINOOK SALMON AND STEELHEAD THROUGH THE TRANSITION POOL AT LOWER GRANITE DAM, 2008 by T.S. Clabough, G.P. Naughton,
The Hydraulic Design of an Arced Labyrinth Weir at Isabella Dam
 Utah State University DigitalCommons@USU International Symposium on Hydraulic Structures Jun 28th, 1:30 PM The Hydraulic Design of an Arced Labyrinth Weir at Isabella Dam E. A. Thompson Sacramento District
From: Michael A. Jepson, Tami C. Clabough, and Christopher C. Caudill
 To: Derek Fryer, USACE Walla Walla District From: Michael A. Jepson, Tami C. Clabough, and Christopher C. Caudill RE: Evaluation of Radio-tagged Adult Chinook Salmon Behavior in Response to Nighttime Flow
HY-8 Version 7.2 Build Date January 17, Federal Highway Administration.
 HY-8 Version 7.2 Build Date January 17, 2012 Federal Highway Administration http://www.fhwa.dot.gov/engineering/hydraulics/software/hy8/index.cfm SIMPLE Simple to use Use for simple culverts and bridges
USING A LABYRINTH WEIR TO INCREASE HYDRAULIC CAPACITY. Dustin Mortensen, P.E. 1 Jake Eckersley, P.E. 1
 USING A LABYRINTH WEIR TO INCREASE HYDRAULIC CAPACITY Dustin Mortensen, P.E. 1 Jake Eckersley, P.E. 1 Plum Creek Floodwater Retarding Structure No. 6 is located in an area of Kyle, Texas, that is currently
Physical Model Study of the San Antonio River Lock System
 ST. ANTHONY FALLS LABORATORY Engineering, Environmental and Geophysical Fluid Dynamics PROJECT REPORT 471 Physical Model Study of the San Antonio River Lock System By Omid Mohseni, Richard Christopher,
A report for Project ADS M.L. Keefer and C.A. Peery Idaho Cooperative Fish and Wildlife Research Unit University of Idaho, Moscow, ID
 Technical Report - IDAHO COOPERATIVE FISH AND WILDLIFE RESEARCH UNIT PASSAGE OF RADIO-TAGGED ADULT SALMON AND STEELHEAD AT JOHN DAY DAM WITH EMPHASIS ON FISHWAY TEMPERATURES: 997-998 A report for Project
Total Dissolved Gas Properties and Processes. by Mike Schneider US Army Corps of Engineers Engineer Research and Development Center
 Total Dissolved Gas Properties and Processes by Mike Schneider US Army Corps of Engineers Engineer Research and Development Center TDG Properties and Processes Scope of Discussion Physical Properties of
Note to Shipbuilders, shipowners, ship Managers and Masters. Summary
 MARINE GUIDANCE NOTE MGN 301 (M+F) Manoeuvring Information on Board Ships Note to Shipbuilders, shipowners, ship Managers and Masters This note supersedes Marine Guidance Note MGN 201 (M+F) Summary The
AUTOMATIC DREDGING PROFILE AND CONTOUR CONTROL
 AUTOMATIC DREDGING PROFILE AND CONTOUR CONTROL Jay Wise 1 ABSTRACT Phillips and Jordan, a leading excavating and disaster recovery contractor, was faced with the challenge to manage a civil contract involving
Technical Report 99-6 EVALUATION OF RUNNING TURBINE 1 AT MAXIMUM CAPACITY ON PASSAGE OF ADULT SALMON AND STEELHEAD AT JOHN DAY DAM
 Technical Report 99-6 EVALUATION OF RUNNING TURBINE 1 AT MAXIMUM CAPACITY ON PASSAGE OF ADULT SALMON AND STEELHEAD AT JOHN DAY DAM - 1997 A report for Project MPE-P-95-1 by T.C. Bjornn, C.A. Peery, K.R.
PROFILE OF SACRAMENTO RIVER, FREEPORT TO VERONA, CALIFORNIA,
 PROFILE OF SACRAMENTO RIVER, FREEPORT TO VERONA, CALIFORNIA, FLOOD OF FEBRUARY 1986 By J.C. Blodgett and J.B. Lucas U.S. GEOLOGICAL SURVEY Open-File Report 88-82 CO CM I m r-h CM Sacramento, California
Designing Wave Energy Converting Device. Jaimie Minseo Lee. The Academy of Science and Technology The Woodlands College Park High School, Texas
 Designing Wave Energy Converting Device Jaimie Minseo Lee The Academy of Science and Technology The Woodlands College Park High School, Texas Table of Contents Abstract... i 1.0 Introduction... 1 2.0 Test
ANSWERS TO QUESTIONS IN THE NOTES AUTUMN 2018
 ANSWERS TO QUESTIONS IN THE NOTES AUTUMN 2018 Section 1.2 Example. The discharge in a channel with bottom width 3 m is 12 m 3 s 1. If Manning s n is 0.013 m -1/3 s and the streamwise slope is 1 in 200,
Comparative Survival Study
 Agenda Item C.1.a Supplemental PPT Presentation June 2012 Comparative Survival Study Habitat Committee meeting Pacific Fishery Management Council June 12, 2012 Comparative Survival Study Initiated in 1996
Building a Wind Tunnel
 Technical Report TR-5 Building a Wind Tunnel Estes Industries 1963 These reports are published as a service to its customers by Estes Industries, Inc., Box 227, Penrose, Colorado 81240 Building a Wind
Greenup Lock Filling and Emptying System Study
 Fourth LACCEI International Latin American and Caribbean Conference for Engineering and Technology (LACCET 2006) Breaking Frontiers and Barriers in Engineering: Education, Research and Practice 21-23 June
BoatWasher Swede, , MS Float
 BoatWasher Swede, 400-600, MS Float Cleans the hull from algea, barnacles and other fouling. Cleans both motor- and sailing yachts. Three sizes of washers fits most boat types, up to approximate 25-meter
DESIGN OF BELL-MOUTH SPILLWAY AT BARVI DAM
 DESIGN OF BELL-MOUTH SPILLWAY AT BARVI DAM Akshay Haldankar 1, Mahesh Bhadra 2, Rahul Harad 3, Darpan Kapre 4, Dipali Patil 5 1,2,3,4 Under graduate,dept. of Civil Engineering, DRIEMS Neral. 5Assistant
Course Teacher: Prof. Dr. M. R. Kabir SPILLWAY & IRRIGATION PUMPS. Spillway:
 Spillway: CHAPTER 10 The spillways are openings provided at the body of the dam to discharge safely the excess water or flood water when the water level rises above the normal pool level. Necessity of
IDAHO COOPERATIVE FISH AND WILDLIFE RESEARCH UNIT
 Technical Report 2011-3 IDAHO COOPERATIVE FISH AND WILDLIFE RESEARCH UNIT EVALUATION OF ADULT PACIFIC LAMPREY PASSAGE AT THE CASCADES ISLAND FISHWAY AFTER ENTRANCE MODIFICATIONS, 2010 Report for Project
FISH PASSAGE CENTER 847 NE 19 th Avenue, #250, Portland, OR Phone: (503) Fax: (503) us at
 Fax: (503) us at") FISH PASSAGE CENTER 847 NE 19 th Avenue, #250, Portland, OR 97232 Phone: (503) 833-3900 Fax: (503) 232-1259 www.fpc.org/ e-mail us at fpcstaff@fpc.org MEMORANDUM TO: FROM: FPAC David A. Benner DATE: October
FISH PASSAGE CENTER 847 NE 19 th Avenue, #250, Portland, OR 97232 Phone: (503) 833-3900 Fax: (503) 232-1259 www.fpc.org/ e-mail us at fpcstaff@fpc.org MEMORANDUM TO: FROM: FPAC David A. Benner DATE: October
Juvenile salmon survivals in 2017 and river conditions
 FISH PASSAGE CENTER 847 NE 19 th Ave., Suite 250, Portland, OR 97213 Phone: (503) 833-3900 Fax: (503) 232-1259 http://www.fpc.org/ e-mail us at fpcstaff@fpc.org MEMORANDUM TO: FROM: Ed Bowles (ODFW) FPC
APPENDIX B HYDRAULIC DESIGN DATA FOR CULVERTS
 TM 5-820-4/AFM 88-5, Chap 4 APPENDIX B HYDRAULIC DESIGN DATA FOR CULVERTS B-1. General. a. This appendix presents diagrams, charts, coefficients and related information useful in design of culverts. The
UBEC 1AT. AUTO TANK Fill System Installation, Operation, & Setup Instructions
 Document Number: XE-ATA5PM-R1A UBEC 1AT AUTO TANK Fill System 08899155 Installation, Operation, & Setup Instructions Rev170906-EB-FRC PHYSICAL: 1302 WEST BEARDSLEY AVE ELKHART, IN 46514 WWW.ELKHARTBRASS.COM
Dean Pump Self-Priming Chemical Process Pumps
 Bulletin C 1.2.34.7 Dean Pump Self-Priming Chemical Process Pumps php Series HEAD CAPACITY RANGE CHARTS php Self Primer - 2 Pole 3500 RPM 500 CAPACITY M 3 /HR 2900 RPM 50 HERTZ 25 50 75 125 150 400 TOTAL
FISH PASSAGE CENTER 847 NE 19 th Avenue, #250, Portland, OR Phone: (503) Fax: (503) us at
 Fax: (503) us at") FISH PASSAGE CENTER 847 NE 19 th Avenue, #250, Portland, OR 97232 Phone: (503) 833-3900 Fax: (503) 232-1259 www.fpc.org/ e-mail us at fpcstaff@fpc.org MEMORANDUM TO: FROM: FPAC David A. Benner DATE: June
FISH PASSAGE CENTER 847 NE 19 th Avenue, #250, Portland, OR 97232 Phone: (503) 833-3900 Fax: (503) 232-1259 www.fpc.org/ e-mail us at fpcstaff@fpc.org MEMORANDUM TO: FROM: FPAC David A. Benner DATE: June
Design and Analysis of Rotary Lawn Mower
 Design and Analysis of Rotary Lawn Mower Vivek P Revi Vishnu N V Akhil K A Rohith P Kevin Rozario Abstract- KAMCO Industries, Athani, India is a reputed industry undertaken by Kerala state government producing
INSTRUCTION MANUAL. process. Ultrasonic Flowmeter Range
 INSTRUCTION MANUAL process TM Ultrasonic Flowmeter Range process TM CONTENTS Page No 1 General 4 2 Order Codes 4 3 Installation 5 & 6 4 Specifications 7 & 8 1 General 3 Installation The Process Atrato
Technical Report
 Technical Report 2003-04 Effects of the Shad Fishery on Passage of Adult Chinook Salmon through the Oregon-shore Fishway Ladder at The Dalles Dam 2002 M. A. Jepson, C.L. Williams, and C.A. Peery Idaho
VIRGINIA SOIL AND WATER CONSERVATION BOARD GUIDANCE DOCUMENT ON DAM BREAK INUNDATION ZONE AND INCREMENTAL DAMAGE ANALYSIS AND MAPPING PROCEDURES
 (Approved XXXXX, 2010) Working Draft Version January 14, 2010 VIRGINIA SOIL AND WATER CONSERVATION BOARD GUIDANCE DOCUMENT ON DAM BREAK INUNDATION ZONE AND INCREMENTAL DAMAGE ANALYSIS AND MAPPING PROCEDURES
TECHNICAL MEMORANDUM 002 EMORANNO. 001
 TECHNICAL MEMORANDUM 002 EMORANNO. 001 To: Jack Synder, P.E. EES Consulting From: Mort McMillen, P.E. Paul Larson, SE Date: October 13, 2010 Project: Cc: Taylor Bowen Subject: Technical Memorandum (TM)
CSO/STORMWATER MANAGEMENT. HYDROVEX HHV-E Vortex Driven Regulator
 CSO/STORMWATER MANAGEMENT HYDROVEX HHV-E Vortex Driven Regulator HYDROVEX HHV-E VORTEX DRIVEN REGULATOR APPLICATION The hydro electronic HYDROVEX HHV driven regulator, type E is specially designed for
FLOW CONSIDERATIONS IN INDUSTRIAL SILENCER DESIGN
 FLOW CONSIDERATIONS IN INDUSTRIAL SILENCER DESIGN George Feng, Kinetics Noise Control, Inc., 3570 Nashua Drive, Mississauga, Ontario Vadim Akishin, Kinetics Noise Control, Inc., 3570 Nashua Drive, Mississauga,
BENDING CONDUIT / TUBING USING HAND BENDERS
 www.learnnec.net 408-866 - 7890 Electrical Code training and consultation based on NEC 2008 BENDING CONDUIT / TUBING USING HAND BENDERS The ability to bend conduit and tubing is a requirement for all electricians.
Hydraulic Modeling to Aid TDG Abatement at Boundary and Cabinet Gorge Dams
 Hydraulic Modeling to Aid TDG Abatement at Boundary and Cabinet Gorge Dams Joe Orlins, P.E., Ph.D. NWHA Technical Seminar May 15, 2014 Boundary and Cabinet Gorge Dams The Problem: Too Much Gas Boundary
Instruction Manual. Pipe Friction Training Panel
 Instruction Manual HL 102 Pipe Friction Training Panel 100 90 80 70 60 50 40 30 20 10 HL 102 Instruction Manual This manual must be kept by the unit. Before operating the unit: - Read this manual. - All
OFFICE OF STRUCTURES MANUAL FOR HYDROLOGIC AND HYDRAULIC DESIGN CHAPTER 11 APPENDIX B TIDEROUT 2 USERS MANUAL
 OFFICE OF STRUCTURES MANUAL FOR HYDROLOGIC AND HYDRAULIC DESIGN CHAPTER 11 APPENDIX B TIDEROUT 2 USERS MANUAL APRIL 2011 APRIL 2011 Page 1 Preface TIDEROUT 2, Build 1.22 dated June 29, 2006 is the current
Components of a Barrage
 Components of a Barrage Definition The only difference between a weir and a barrage is of gates, that is the flow in barrage is regulated by gates and that in weirs, by its crest height. Barrages are costlier
Installation, Operation and Maintenance Instructions for Electronically Controlled Pressurisation Units
 Installation, Operation and Maintenance Instructions for Electronically Controlled Pressurisation Units Models: EPS Single Pump EPT Twin Pump EPS-HP EPT-HP Single Pump High Pressure Twin Pump High Pressure
FSOC Upstream Fish Passage Guidance Document
 FSOC Upstream Fish Passage Guidance Document STEP 1: Identify species and life stages in need of fish passage STEP 2: Identify fishway options and species applicability STEP 3 Fish passage criteria review
Statesville, NC. Results of AM ASHRAE 110 Laboratory Fume Hood Performance Evaluations Venturi Hood
 Statesville, NC Results of AM ASHRAE 11 Laboratory Fume Hood Performance Evaluations Venturi Hood January, 217 Prepared By: Exposure Control Technologies Inc. 231-C East Johnson Street Cary, NC 27513 Phone:
IDAHO COOPERATIVE FISH AND WILDLIFE RESEARCH UNIT
 Technical Report 2007-1 IDAHO COOPERATIVE FISH AND WILDLIFE RESEARCH UNIT EVALUATION OF FISHWAY MODIFICATIONS TO IMPROVE PASSAGE OF ADULT CHINOOK SALMON AND STEELHEAD THROUGH THE TRANSITION POOL AT LOWER
Model 130M Pneumatic Controller
 Instruction MI 017-450 May 1978 Model 130M Pneumatic Controller Installation and Operation Manual Control Unit Controller Model 130M Controller is a pneumatic, shelf-mounted instrument with a separate
IMPACT OF MAKING THE CREST OF WEIR MULTIFACETED ON DISCHARGE COEFFICIENT OF MORNING GLORY SPILLWAY
 IMPACT OF MAKING THE CREST OF WEIR MULTIFACETED ON DISCHARGE COEFFICIENT OF MORNING GLORY SPILLWAY Ali Bagheri 1 and *Ebrahim Nohani 2 1 Department of Water Engineering, Qaemshahr Branch, Islamic Azad
Evaluating Surge Potential in CSO Tunnels
 14 Evaluating Surge Potential in CSO Tunnels Karen E. Ridgway Tunnels are being proposed to control combined sewer overflow (CSO) in numerous cities in the United States and Canada. The tunnels are intended
Bubble Tube Installations
 Instruction MI 020-328 September 2013 Bubble Tube Installations For Liquid Level, Density, and Interface Level Measurements 2 Contents Introduction... 5 Abbreviations... 5 Principle of Operation... 5 Alternative
The Physical Model Study of the Folsom Dam Auxiliary Spillway System
 ST. ANTHONY FALLS LABORATORY Engineering, Environmental and Geophysical Fluid Dynamics PROJECT REPORT 511 The Physical Model Study of the Folsom Dam Auxiliary Spillway System By Matthew L. Lueker, Omid