Physical Model Study of the San Antonio River Lock System
|
|
|
- Logan Kelley
- 5 years ago
- Views:
Transcription
1 ST. ANTHONY FALLS LABORATORY Engineering, Environmental and Geophysical Fluid Dynamics PROJECT REPORT 471 Physical Model Study of the San Antonio River Lock System By Omid Mohseni, Richard Christopher, Todd Barnacle and Heinz Stefan Prepared for HDR Engineering and the San Antonio River Authority October 25 Minneapolis, Minnesota
2 i
3 The University of Minnesota is committed to the policy that all persons shall have equal access to its programs, facilities, and employment without regard to race, religion, color, sex, national origin, handicap, age or veteran status. i
4 Abstract The San Antonio River Authority (SARA) initiated a project to extend tour boat navigation approximately 7, feet upstream on the San Antonio River. To make this section of the river navigable, a small dam and parallel lock system will be built to transfer vessels between lower pool elevation of feet and upper pool elevation of 64. ft. The hydraulic locks must transfer tour boats quickly, efficiently, comfortably and safely using available river flow. A physical model study was required to verify and refine the operational suitability of the proposed side-port lock system. The model was constructed and studied at St. Anthony Falls Laboratory. The scope of the study was to build a physical model of one lock and its associated filling and emptying system and to test its operation on a scale model of the design vessel. The model was built at a scale of 1:8 and included a single lock chamber, a side-port gallery to convey water into and out of the lock chamber, and the upstream and downstream sluice gates. Two series of tests were conducted and at least one of the following parameters was modified during each test: The gate opening height, the gate opening duration, the gate opening as a function of time, the lock chamber floor level, and the loading of the vessel. For each test, headwater, tailwater, water surface level in the lock chamber and the opening rate of the sluice gate were recorded. The performance of the lock chamber was determined qualitatively by inspection of the vessel reaction and the flow patterns inside the gallery and the lock chamber. The second and more extensive series of tests were videotaped. The first test series was conducted to provide an initial assessment of the lock performance. During the second test series, 14 tests were conducted, of which only one did not provide acceptable results. In the remaining 13 tests no significant surface turbulence was observed during filling and emptying of the lock chamber. In addition, no vortex was detected in the lock chamber. The chamber filling time of all tests was shorter than the design target of 5 minutes. The only anomaly observed was the slow lateral drift of the front hull of the vessel towards the gallery wall. This gentle drifting only occurred during the filling cycle and could be prevented by utilizing the floating mooring bits. ii
5 Acknowledgements The work reported herein was supported by HDR Engineering and the San Antonio River Authority. Mr. George Waldow was the project officer. We would like to thank Luke Carlson, Mike Plante, Ben Erickson, Matthew Lueker, Chris Ellis and Alex Ding of St. Anthony Falls Laboratory for their contribution to the model construction, instrumentation and videotaping of the experiments. iii
6 Table of Contents Abstract... ii Acknowledgements...iii List of Figures... v List of Tables...viii List of Tables...viii 1. Introduction Model Construction General Features of the Physical Model Navigation Vessel Instrumentation Model Runs and Results First Test Series Second Test Series Summary Appendix A. Filling and Emptying Cycles of the Final Test Series Appendix B. Estimated Time Variant Discharge of the Final Test Series iv
7 List of Figures Figure 1. Plan view of the proposed San Antonio River lock and dam... 2 Figure 2. The model layout plan view. The model comprises of a single lock chamber, a gallery to supply water, a head tank and a tail tank... 6 Figure 3. A longitudinal profile of the model gallery and the head and tail tanks Figure 4. The side weir in the head tank to control the headwater Figure 5. The leaf drop gate in the tail tank to control the tailwater... 8 Figure 6. View of the model structure under construction Figure 7. A Velmex slide system was utilized to automate the sluice gate opening Figure 8. The 26-ft Fiesta touring boat Figure 9. The 26-ft Fiesta and its draft under different loading conditions... 1 Figure 1. Model vessel in the lock chamber Figure 11. Steel wires and the floatable devices to which the mooring lines of the model vessel were attached Figure 12. Headwater, tailwater, water surface level in the lock chamber and the gate opening during the filling cycle. The sluice gate opened as a cotangent function of time. The gate opening duration was 4.25 minutes, and the lock floor elevation was at 624 ft Figure 13. Headwater, tailwater, water surface level in the lock chamber and the gate opening during the emptying cycle. The sluice gate opened as a cotangent function of time. The gate opening duration was 4.25 minutes, and the lock floor elevation was at 624 ft Figure 14. Headwater, tailwater, water surface level in the lock chamber and the gate opening during the filling cycle. The sluice gate opened as a linear function of time. The gate opening duration was one minute, and the lock floor elevation was at 624 ft.. 16 Figure 15. Headwater, tailwater, water surface level in the lock chamber and the gate opening during the emptying cycle. The sluice gate opened as a linear function of time. The gate opening duration was one minute, and the lock floor elevation was at 624 ft Figure 16. Discharge into the lock chamber during the filling cycle. The sluice gate opened as a cotangent function of time. The gate opening duration was 4.25 minutes, and the lock floor elevation was at 624 ft Figure 17. Discharge out of the lock chamber during the emptying cycle. The sluice gate opened as a cotangent function of time. The gate opening duration was 4.25 minutes, and the lock floor elevation was at 624 ft Figure 18. Discharge into the lock chamber during the filling cycle. The sluice gate opened as a linear function of time. The gate opening duration was one minute, and the lock floor elevation was at 624 ft Figure 19. Discharge out of the lock chamber during the emptying cycle. The sluice gate opened as a linear function of time. The gate opening duration was one minute, and the lock floor elevation was at 624 ft Figure 2. Discharge into the lock chamber during the filling cycle. The sluice gate opened as a tangent function of time (see Figure A.8). The gate opening duration was 3 minutes, the gate opening height was 3 ft, and the lock floor elevation was at 624 ft (Test #8) v
8 Figure 21. Discharge into the lock chamber during the filling cycle. The sluice gate opened as a linear function of time (see Figure A.1). The gate opening duration was 3 minutes, the gate opening height was 2 ft, and the lock floor elevation was at 624 ft (Test #1) Figure 22. Discharge out of the lock chamber during the emptying cycle. The sluice gate opened as a linear function of time (see Figure A.2). The gate opening duration was 3 minutes, the gate opening height was 2 ft, and the lock floor elevation was at 624 ft (Test #2) Figure 23. Discharge into the lock chamber during the filling cycle. The sluice gate opened as a linear function of time (see Figure A.9). The gate opening duration was 2 minutes, the gate opening height was 2 ft, and the lock floor elevation was at 624 ft (Test #9) Figure A.1. Headwater, tailwater, water surface level in the lock chamber and the gate opening during the filling cycle. The sluice gate opened as a linear function of time. The gate opening duration was 3 minutes, the gate opening height was 2 ft, and the lock floor elevation was at 624 ft (Test #1) Figure A.2. Headwater, tailwater, water surface level in the lock chamber and the gate opening during the emptying cycle. The sluice gate opened as a linear function of time. The gate opening duration was 3 minutes, the gate opening height was 2 ft, and the lock floor elevation was at 624 ft (Test #2) Figure A.3. Headwater, tailwater, water surface level in the lock chamber and the gate opening during the filling cycle. The sluice gate opened as a linear function of time. The gate opening duration was 3 minutes, the gate opening height was 3 ft, and the lock floor elevation was at 624 ft (Test #3) Figure A.4. Headwater, tailwater, water surface level in the lock chamber and the gate opening during the filling cycle. The sluice gate opened as a linear function of time. The gate opening duration was.5 minutes, the gate opening height was 3 ft, and the lock floor elevation was at 624 ft (Test #4) Figure A.5. Headwater, tailwater, water surface level in the lock chamber and the gate opening during the emptying cycle. The sluice gate opened as a linear function of time. The gate opening duration was.5 minutes, the gate opening height was 3 ft, and the lock floor elevation was at 624 ft (Test #5) Figure A.6. Headwater, tailwater, water surface level in the lock chamber and the gate opening during the filling cycle. The sluice gate opened as a linear function of time. The gate opening duration was.5 minutes, the gate opening height was 3 ft, and the lock floor elevation was at 622 ft (Test #6) Figure A.7. Headwater, tailwater, water surface level in the lock chamber and the gate opening during the filling cycle. The sluice gate opened as a linear function of time. The gate opening duration was.5 minutes, the gate opening height was 3 ft, and the lock floor elevation was at 624 ft (Test #7)... 3 Figure A.8. Headwater, tailwater, water surface level in the lock chamber and the gate opening during the filling cycle. The sluice gate opened as a tangent function of time. The gate opening duration was 2 minutes, the gate opening height was 3 ft, and the lock floor elevation was at 624 ft (Test #8) Figure A.9. Headwater, tailwater, water surface level in the lock chamber and the gate opening during the filling cycle. The sluice gate opened as a linear function of time. The vi
9 gate opening duration was 2 minutes, the gate opening height was 2 ft, and the lock floor elevation was at 624 ft (Test #9) Figure A.1. Headwater, tailwater, water surface level in the lock chamber and the gate opening during the filling cycle. The sluice gate opened as a linear function of time. The gate opening duration was 2 minutes, the gate opening height was 3 ft, and the lock floor elevation was at 622 ft (Test #1) Figure A.11. Headwater, tailwater, water surface level in the lock chamber and the gate opening during the filling cycle. The sluice gate opened as a linear function of time. The gate opening duration was 2 minutes, the gate opening height was 3 ft, and the lock floor elevation was at 622 ft. This was a repeatability test (Test #11) Figure A.12. Headwater, tailwater, water surface level in the lock chamber and the gate opening during the filling cycle. The sluice gate opened as a linear function of time. The gate opening duration was 2 minutes, the gate opening height was 3 ft, and the lock floor elevation was at 622 ft (Test #12) Figure A.13. Headwater, tailwater, water surface level in the lock chamber and the gate opening during the filling cycle. The sluice gate opened as a linear function of time. The gate opening duration was 2 minutes, the gate opening height was 3 ft, and the lock floor elevation was at 622 ft (Test #13) Figure B.1. Discharge into the lock chamber during the filling cycle. The sluice gate opened as a linear function of time. The gate opening duration was 3 minutes, the gate opening height was 3 ft, and the lock floor elevation was at 624 ft. (Test #3) Figure B.2. Discharge into the lock chamber during the emptying cycle. The sluice gate opened as a linear function of time. The gate opening duration was.5 minutes, the gate opening height was 3 ft, and the lock floor elevation was at 624 ft. (Test # 4) Figure B.3. Discharge into the lock chamber during the filling cycle. The sluice gate opened as a linear function of time. The gate opening duration was.5 minutes, the gate opening height was 3 ft, and the lock floor elevation was at 624 ft. (Test # 5) Figure B.4. Discharge into the lock chamber during the filling cycle. The sluice gate opened as a linear function of time. The gate opening duration was.5 minutes, the gate opening height was 3 ft, and the lock floor elevation was at 622 ft. (Test # 6)... 4 Figure B.5. Discharge into the lock chamber during the filling cycle. The sluice gate opened as a linear function of time. The gate opening duration was.5 minutes, the gate opening height was 3 ft, and the lock floor elevation was at 624 ft. (Test # 7) Figure B.6. Discharge into the lock chamber during the filling cycle. The sluice gate opened as a linear function of time. The gate opening duration was 2 minutes, the gate opening height was 3 ft, and the lock floor elevation was at 622 ft. (Test # 1) Figure B.7. Discharge into the lock chamber during the filling cycle. The sluice gate opened as a linear function of time. The gate opening duration was 2 minutes, the gate opening height was 3 ft, and the lock floor elevation was at 622 ft. (Test # 11) Figure B.8. Discharge into the lock chamber during the filling cycle. The sluice gate opened as a linear function of time. The gate opening duration was 2 minutes, the gate opening height was 3 ft, and the lock floor elevation was at 622 ft. (Test # 12) Figure B.9. Discharge into the lock chamber during the filling cycle. The sluice gate opened as a linear function of time. The gate opening duration was 2 minutes, the gate opening height was 3 ft, and the lock floor elevation was at 622 ft. (Test # 13) vii
10 List of Tables Table 1. Results of the first test series Table 2. Results of the second test series viii
11 1. Introduction The San Antonio River Authority (SARA) initiated a series of improvements projects along the San Antonio River. One of these projects is to extend tour boat navigation approximately 7, feet upstream of the current head of navigation. A small dam and twin parallel lock system will be built near Brooklyn Avenue to transfer vessels between a lower pool elevation of feet and an upper pool elevation of 64. ft. The entire lock and dam complex is expected to fit within a total width of less than 1 ft. Design of the dam and lock was commissioned to HDR Engineering, Inc. Since the lock system is significantly smaller than the commercial navigation locks typically designed by the US Army Corps of Engineers, and there is also a constraint on the overall width of the complex, HDR commissioned a physical model study of the proposed lock chamber and standard vessel at the St. Anthony Falls Laboratory. The objective was to verify and refine the operational suitability of the proposed side-port lock system and to optimize certain design parameters, such as the chamber bed elevation, the gate opening height and duration, and the water conveyance system into and out of the chamber. The lock system will consist of a gravityfed and drained dual-chamber system (Figure 1). The lock system comprises two pairs of hydraulically actuated miter gates and four hydraulically actuated slide gates for filling and emptying operations. Each lock chamber will be 12 ft. wide and 43 ft. long (pintle to pintle) Average base flow of the San Antonio River at the lock location is approximately 2 cfs. The scope of this study was to build a physical model of the proposed lock chamber, the standard vessel, the water supply gallery and its sluice gates. The model was to serve as a design aid to verify necessary assumptions, optimize certain parameters, and demonstrate that efficient operation can be obtained without objectionable discomfort for tour boat passengers. 1
12 Gallery Miter Gates Flow Lock Chamber Dam Sluice Gates Figure 1. Plan view of the proposed San Antonio River lock and dam. 2
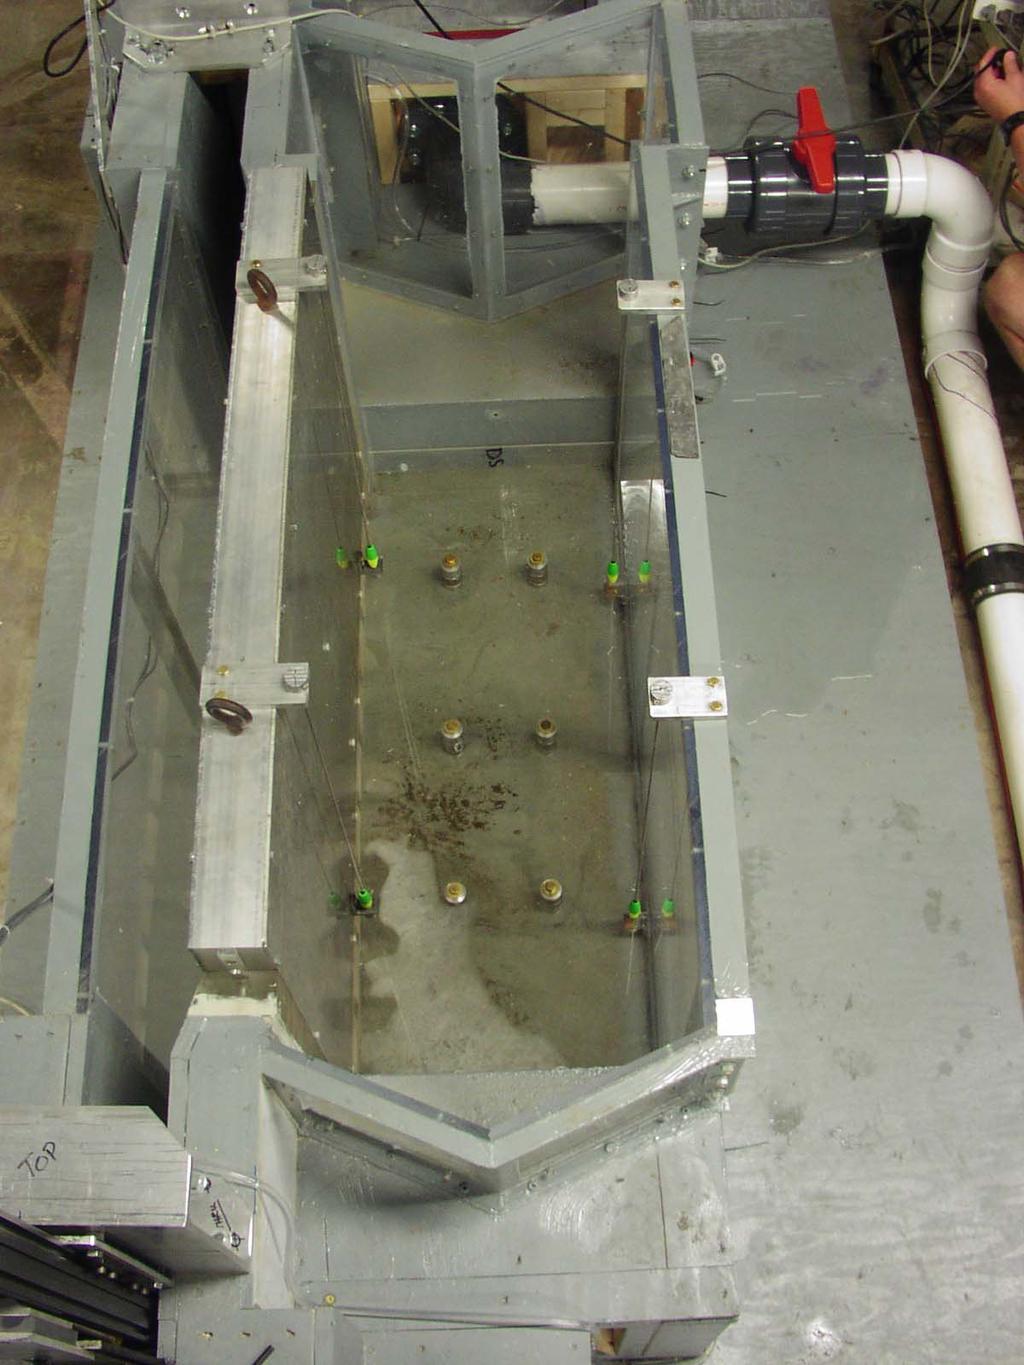
13 2. Model Construction The goal of this model study was to accurately simulate the flow patterns, including potential vortices inside the lock chamber and the gallery. To do so, Froude similarity was adequate to simulate the prototype flow conditions in the model. The model was built at St. Anthony Falls Laboratory at a scale of 1:8. Using a 1:8 scale Froude similarity, model parameters were scaled as follows: Length 1:8 Area 1:64 Volume 1:512 Flow rate 1:181 Velocity 1:2.83 Time 1: General Features of the Physical Model The lock model consisted of a single chamber and a side-port gallery, plus a head and a tail tank to maintain constant headwater and tailwater levels throughout each experiment. For this model study, only the internal geometry of the chamber, gallery and the sluice gates were of interest. Therefore, the miter gates were stationary. Figures 2 and 3 show the plan view of the entire model layout and a longitudinal profile along the gallery, respectively. The lock chamber and gallery floors were made to move up and down (Figure 3) and stay sealed. Thus, the model floor level could vary from to ft elevation above the datum. The wall between the side-port gallery and the lock chamber was removable for future modifications of the inflow system if needed. A head tank was constructed to simulate the ponded water upstream of the dam. To maintain the upstream water level at a constant elevation a side weir equipped with an adjustable weir was installed (Figure 4). Since the volume of the head tank was significantly smaller than the scaled ponded water upstream of the dam, the side weir elevation had to be controlled manually during the test runs to maintain the water elevation at 64 ft elevation. Mississippi River water was discharged into a cell upstream of the head tank using a multi-port diffuser. 3
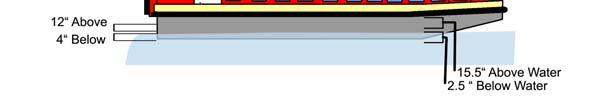
14 To control tailwater conditions, a leaf drop gate was built and installed at the downstream end of the model in the tail tank (Figure 5). The head and tail tanks were built from plywood and lumber. The lock chamber outside walls and the gallery outside wall were made from Plexiglas for visualization purposes and placed in a metal frame to withstand the hydrostatic pressure (Figure 6). The wall between the lock chamber and gallery was opaque. The gates were made from aluminum and controlled by a Velmex slide system to automate the opening of the gates (Figure 7). Any opening sequence could be described as a series of step functions using computer software (Microsoft Excel), and applied to the Velmex slide operating system. The physical model construction accuracy was maintained at.5 feet (one sixteenth of an inch), which corresponds to.4 feet in the prototype Navigation Vessel The standard navigation vessel in the San Antonio River is a 26-ft Fiesta tour boat. The vessel is 26 ft long and 9 ft wide (Figure 8). The draft under minimum loading was reported to be 4 inches at the stern and 2.5 inches at the front where the hull bottom curves up. Under maximum loading, the front hull sinks 13.5 inches into water while the stern is 6.5 inches below water (Figure 9). The model vessel was built from light materials, i.e. Styrofoam, while maintaining geometrical similarity (Figure 1). The weight distribution of the prototype vessel was not incorporated in the construction of the model vessel. However, the desired draft under minimum and maximum loads was modeled by placing sheet metal pieces on the vessel floor. To secure the vessel in the lock chamber during filling and emptying cycles, four vertical steel wires equipped with floatable devices were installed in the chamber to simulate floating mooring bits (Figure 11). The floatable devices were to facilitate the vertical movement of the vessel while the mooring lines were attached to them. The steel wires were located to coincide with the mooring points on the vessel. Since the vessel crew cannot conveniently access the forward mooring lines when the vessel is fully loaded, i.e. when passengers occupy all the seats (see Figure 8), only the rear mooring lines were used during the tests. 4
15 2.3. Instrumentation To measure water surface elevation in the lock chamber, the headwater and tailwater, two pressure taps were mounted in the lock chamber, and one each in the head tank and the tail tank. The pressure taps were connected to a pressure transducer via 1/4 -inch plastic tubes, recording the instantaneous water level at the three locations and sending it to the computer. The two water levels recorded in the lock chamber were averaged. Since the geometry of the lock chamber was known, the instantaneous flow could be estimated from the water level data. Flow patterns inside the lock chamber and the gallery were documented using digital video cameras mounted on the ceiling above the model, and on the sides of the model. 5
16 Lock Chamber Tail Tank Head Tank Figure 2. The model layout plan view. The model comprises of a single lock chamber, a gallery to supply water, a head tank and a tail tank. 6
17 Figure 3. A longitudinal profile of the model gallery and the head and tail tanks. 7


18 Figure 4. The side weir in the head tank to control the headwater. Figure 5. The leaf drop gate in the tail tank to control the tailwater. 8


19 Figure 6. View of the model structure under construction. Figure 7. A Velmex slide system was utilized to automate the sluice gate opening. 9


20 Figure 8. The 26-ft Fiesta touring boat. Figure 9. The 26-ft Fiesta and its draft under different loading conditions. 1


21 Figure 1. Model vessel in the lock chamber. Figure 11. Steel wires and the floatable devices to which the mooring lines of the model vessel were attached. 11
22 3. Model Runs and Results The goals of the lock system design were to fill or empty the lock chamber in less than five minutes (about 1 seconds in the model), and (2) to eliminate any erratic movement of the vessel during filling and emptying to make it safe and comfortable for the passengers. Two series of model tests were conducted to establish that the design goals were met. A first test series was conducted to obtain an initial assessment of the lock operation and its effects on the vessel during filling and emptying cycles. Initially, the draft provided by the barge manufacturer was not accurate. Therefore, the draft during the first test series was incorrect. The impacts of filling and emptying on the model vessel were evaluated qualitatively. Had the impacts been severe, then the hawser forces on the mooring lines and the tilt of the vessel would have been measured First Test Series In the first test series, two gate-opening functions with 1 minute and 4.25 minute opening periods were used. The floor elevation was set at 624 ft, and only the loaded vessel, which was about 2 tons lighter than under the maximum load, was tested. A total of four tests were conducted. The first gate opening function was a cotangent function of time (Figures 12 and 13). The gate opening time was set at 4.25 minutes, which was approximately the same as the filling or emptying duration of the chamber. The second gate opening function was a linear function of time with a duration of one minute (Figures 14 and 15). Table 1. Results of the first test series. Test Cycle Function Maximum Gate Opening Lock Filling or Gate Performance Duration Emptying Opening of the lock (min) Duration (min) (ft) 1 Fill Cotangent ~ 4.5 Acceptable 2 Empty Cotangent ~ 4.5 Acceptable 3 Fill Linear 2 1 ~ 4 Acceptable 4 Empty Linear 2 1 ~ 3.5 Acceptable 12
23 The results of the initial test series are summarized in Table 1. All tests showed no abrupt changes in water surface level of the chamber and provided acceptable results. No vortex was observed in the chamber. The gallery, however, exhibited a hydraulic jump when the sluice gate started opening. The hydraulic jump was immediately submerged as the gate continued opening. The gallery acted as a buffer and prevented any abrupt flow into the chamber. As is evident in Figures 12 to 15, water level in the chamber changed quite steadily. The only anomaly observed was the slow drifting motion of the front hull of the vessel towards the gallery wall. The motion occurred during the filling cycle. Two factors caused this motion: (1) The front mooring lines were never attached during the tests as was mentioned in section 2.2, which would allow the front hull to move freely towards the side walls, and (2) the jets leaving the gallery hit the outer wall of the lock, causing an upwelling near the wall which translated to a horizontal flow from the outer wall towards the gallery wall at the surface. This lateral flow impacted the metal fin or skeg which projects downward from the keel near the front of the vessel. No measurement to quantify the turbulence intensity in the lock chamber was made. Discharge into and out of the lock chamber was estimated and plotted versus time using water level records. Infrequent abrupt changes in the estimated discharge into and out of the chamber were evident in the plots. Water levels in the lock chamber are the average of two locations (two pressure taps were connected through a T-junction to one pressure transducer). They should therefore reflect an average water level in the lock chamber, excluding any standing waves (seiches) in the chamber. The transducer had an accuracy/resolution that would translate into a flow rate of ±4 cfs in the prototype. The abrupt changes in the estimated discharge into and out of the lock chamber were not apparent while observing the test runs. A closer examination revealed a discrepancy in the data recording program. The recorded time intervals were rounded off to the nearest second, therefore, occasionally a recorded time interval was half of the preceding and subsequent time steps, thus doubling the estimated discharge. To verify the source of discrepancy three tests were repeated, and the time intervals were recorded at a higher precision. The infrequent abrupt changes reduced significantly. In order to provide a more representative discharge time variant 13
24 plots from the data collected, the time intervals were modified using a 5-step moving average. The results were plotted in Figures 16 to 19. The remaining spikes evident in Figures 16 and 17 are most likely due to water levels in the head tank and tail tank, which were controlled manually during the test runs. 14
25 642 Filling Cycle (4.25-Min Opening of a 3-ft Gate; Lock Floor Elevation at 624 ft) Elevation (ft) Gate Opening (inches) Time (seconds) Headwater Elevation Tailwater Elevation Lock Elevation Gate Opening Figure 12. Headwater, tailwater, water surface level in the lock chamber and the gate opening during the filling cycle. The sluice gate opened as a cotangent function of time. The gate opening duration was 4.25 minutes, and the lock floor elevation was at 624 ft. 642 Emptying Cycle (4.25-Min Opening of a 3-ft Gate, Lock Floor Elevation at 624 ft) Elevation (ft) Gate Opening (inches) Time (sec) Lock Elevation Headwater Elevation Tailwater Elevation Gate Opening Figure 13. Headwater, tailwater, water surface level in the lock chamber and the gate opening during the emptying cycle. The sluice gate opened as a cotangent function of time. The gate opening duration was 4.25 minutes, and the lock floor elevation was at 624 ft. 15
26 642 Filling Cycle (1-Min Opening of a 2-ft Gate; Lock Floor Elevation at 624 ft) 28 Elevation (ft) Gate Opening (inches) Time (seconds) Headwater Elevation Tailwater Elevation Lock Elevation Gate Opening Figure 14. Headwater, tailwater, water surface level in the lock chamber and the gate opening during the filling cycle. The sluice gate opened as a linear function of time. The gate opening duration was one minute, and the lock floor elevation was at 624 ft. 642 Emptying Cycle (1-Min Opening of a 2-ft Gate; Lock Floor Elevation at 624 ft) 28 Elevation (ft) Gate Opening (inches) Time (seconds) Headwater Elevation Tailwater Elevation Lock Elevation Gate Opening Figure 15. Headwater, tailwater, water surface level in the lock chamber and the gate opening during the emptying cycle. The sluice gate opened as a linear function of time. The gate opening duration was one minute, and the lock floor elevation was at 624 ft. 16
27 12 Filling Cycle (4.25-Min Opening, 3-ft Gate; Lock Floor Elevation at 624 ft) 1 Discharge (cfs) Time (sec) Figure 16. Discharge into the lock chamber during the filling cycle. The sluice gate opened as a cotangent function of time. The gate opening duration was 4.25 minutes, and the lock floor elevation was at 624 ft. 12 Emptying Cycle (4.25-Min Opening, 3-ft Gate; Lock Floor Elevation at 624 ft) 1 Discharge (cfs) Time (sec) Figure 17. Discharge out of the lock chamber during the emptying cycle. The sluice gate opened as a cotangent function of time. The gate opening duration was 4.25 minutes, and the lock floor elevation was at 624 ft. 17
28 12 Filling Cycle (1-Min Opening, 2-ft Gate; Lock Floor Elevation at 624 ft) 1 Discharge (cfs) Time (sec) Figure 18. Discharge into the lock chamber during the filling cycle. The sluice gate opened as a linear function of time. The gate opening duration was one minute, and the lock floor elevation was at 624 ft. 12 Emptying Cycle (1-Min Opening, 2-ft Gate; Lock Floor Elevation at 624 ft) 1 Discharge (cfs) Time (sec) Figure 19. Discharge out of the lock chamber during the emptying cycle. The sluice gate opened as a linear function of time. The gate opening duration was one minute, and the lock floor elevation was at 624 ft. 18
29 3.2. Second Test Series In the second test series, 14 tests were conducted, out of which one test (Test # 11) was a repeatability test. Thirteen tests were conducted using a linear function for the gate opening and one using a tangent function. Three tests were conducted with a gate opening duration of 3 minutes, four tests with a duration of.5 minutes, and six tests with a duration of 2 minutes. In addition, the floor level was lowered to elevation 622 ft for five tests, which did not show any significant changes in the lock operation. The tests specifications and results are summarized in Table 2. The headwater, tailwater, water level in the lock chamber and the gate opening of all tests are plotted versus time in Appendix A (Figures A.1 to A.13). Table 2. Results of the second test series. Test Function Maximum Gate Filling or Floor Gate Opening Emptying Performance Elevation Opening Duration Duration of the lock (ft) height (ft) (min) (min) 1 F Max Linear ~ 5 Acceptable 2 E Min Linear ~ 4 Acceptable 3 F Max Linear ~ 3.5 Acceptable 4 F Max Linear ~ 2.5 Acceptable 5 E Max Linear ~ 2.5 Acceptable 6 F Max Linear ~ 3 Acceptable 7 F Min Linear ~ 2.5 Acceptable 8 F Max Tangent ~ 4 Not Acceptable 9 F Max Linear ~ 4 Acceptable 1 F Max Linear ~ 3.5 Acceptable 11* F Max Linear ~ 3.5 Acceptable 12 F Min Linear ~ 3.5 Acceptable 13 F None Linear ~ 3.5 Acceptable 14 F None Linear ~ 3.5 Acceptable F stands for filling cycle. E stands for emptying cycle * This was a repetition of test 1. Cycle Load All tests, except the test with a tangent function for the gate opening (Test #8), showed no abrupt changes in the water surface level of the lock chamber and provided acceptable results. No vortex was formed in the lock chamber, either. In all filling cycles, the vessel moved towards the gallery wall as was seen in the initial test series. The time variant discharge of Test # 8 is displayed in Figure 2. There was an oscillatory flow into the chamber. The maximum discharge was slightly below 8 cfs, which could have been 19
30 affected by the computational time step. Nevertheless, unacceptable turbulence was evident when observing the standard vessel in the chamber. For three tests, the gate opening was set at two feet (Tests # 1, # 2 and # 9). In those three tests, the filling/emptying times were the longest, i.e. longer than 4 minutes. Discharge versus time is plotted in Figures 21 to 23. The maximum discharge was estimated to be 3 cfs for Tests # 1 and # 2. For Test # 9 with a gate opening duration of 2 minutes, the maximum discharge was estimated to be slightly less than 4 cfs. Discharge versus time for the remaining eight tests is plotted in Figures B.1 to B.8 (Appendix B). As is evident in Appendix B, Tests # 3, # 4 and # 6 with.5-minute gate opening exhibited large spikes in the estimated time variant discharge plots. Since the gate opening duration was very short (11 seconds at the model scale), it was very difficult to maintain the water levels in the head tank and tail tank at 64 and ft, respectively (Figures A.3, A.4 and A.6). Therefore, the spikes evident in Figures B.2, B.3 and B.5 are partially due to unsteady levels of headwater and tailwater. It is noteworthy, that abrupt changes in the estimated discharge were not evident while observing those tests runs. Tests # 13 and # 14 were conducted for a filling cycle with no vessel in the lock chamber. The gate opening height was set at 3 ft with a gate opening duration of 2 minutes. Confetti was placed in the gallery and the lock chamber to better visualize the flow patterns. In the gallery, the confetti was re-circulating due to the presence of rollers. In the lock chamber, most confetti was collected at the downstream end of the chamber between the miter gate and the gallery wall. All tests of the second test series were videotaped. 2
31 12 Filling Cycle, Loaded Boat (2-Min Opening of a 3-ft Gate; Lock Floor Elevation at 624 ft) 1 Discharge (cfs) Time (sec) Figure 2. Discharge into the lock chamber during the filling cycle. The sluice gate opened as a tangent function of time (see Figure A.8). The gate opening duration was 3 minutes, the gate opening height was 3 ft, and the lock floor elevation was at 624 ft (Test #8). 12 Filling Cycle, Loaded Boat (3-Min Opening of a 2-ft Gate; Lock Floor Elevation at 624 ft) 1 Discharge (cfs) Time (sec) Figure 21. Discharge into the lock chamber during the filling cycle. The sluice gate opened as a linear function of time (see Figure A.1). The gate opening duration was 3 minutes, the gate opening height was 2 ft, and the lock floor elevation was at 624 ft (Test #1). 21
32 12 Emptying Cycle, Unloaded Boat (3-Min Opening of a 2-ft Gate; Lock Floor Elevation at 624 ft) 1 Discharge (cfs) Time (sec) Figure 22. Discharge out of the lock chamber during the emptying cycle. The sluice gate opened as a linear function of time (see Figure A.2). The gate opening duration was 3 minutes, the gate opening height was 2 ft, and the lock floor elevation was at 624 ft (Test #2). 12 Filling Cycle, Loaded Boat (2-Min Opening of a 2-ft Gate; Lock Floor Elevation at 624 ft) 1 Discharge (cfs) Time (sec) Figure 23. Discharge into the lock chamber during the filling cycle. The sluice gate opened as a linear function of time (see Figure A.9). The gate opening duration was 2 minutes, the gate opening height was 2 ft, and the lock floor elevation was at 624 ft (Test #9). 22
33 4. Summary To help with the design of a dual-chamber lock system on the San Antonio River, a physical model study was conducted at St. Anthony Falls Laboratory. The model was built at a scale of 1:8 and included a single lock chamber, a gallery to convey water into and out of the lock chamber, and the upstream and downstream sluice gates. The chamber and gallery floors and the wall between the gallery and chamber were made removable for future modifications Two series of tests were conducted during the model study. For each test, headwater, tailwater, water surface level in the lock chamber and the opening of the sluice were recorded. The performance of the lock chamber was determined qualitatively; vessel behavior and flow patterns inside the gallery and the lock chamber were videotaped. The first test series was conducted to provide an initial assessment of the lock performance. For the second test series, 14 tests were conducted, of which only one did not provide acceptable chamber stability results. In the remaining 13 tests no adverse surface turbulence in the lock chamber was observed. In addition, no vortex was detected in the lock chamber. The filling and emptying time of all tests was shorter than the design target of 5 minutes. The only anomaly observed in the lock chamber was the slow drifting motion of the front hull of the vessel towards the gallery wall. The motion occurred only during the filling cycle. The motion of the front hull was due to the upwelling caused by the jets entering the lock chamber, and the absence of mooring lines on the front end of the vessel. 23
34 Appendix A. Filling and Emptying Cycles of the Final Test Series Filling Cycle, Loaded Boat (3-Min Opening of a 2-ft Gate; Lock Floor Elevation at 624 ft) Elevation (ft) Gate Opening (inches) Time (seconds) Headwater Elevation Tailwater Elevation Lock Elevation Gate Opening Figure A.1. Headwater, tailwater, water surface level in the lock chamber and the gate opening during the filling cycle. The sluice gate opened as a linear function of time. The gate opening duration was 3 minutes, the gate opening height was 2 ft, and the lock floor elevation was at 624 ft (Test #1). 24
35 Emptying Cycle, Unloaded Boat (3-Min Opening of a 2-ft Gate; Lock Floor Elevation at 624 ft) Elevation (ft) Gate Opening (inches) Time (seconds) Headwater Elevation Tailwater Elevation Lock Elevation Gate Opening Figure A.2. Headwater, tailwater, water surface level in the lock chamber and the gate opening during the emptying cycle. The sluice gate opened as a linear function of time. The gate opening duration was 3 minutes, the gate opening height was 2 ft, and the lock floor elevation was at 624 ft (Test #2). 25
36 Filling Cycle, Loaded Boat (3-Min Opening of a 3-ft Gate; Lock Floor Elevation at 624 ft) Elevation (ft) Gate Opening (inches) Time (seconds) Headwater Elevation Tailwater Elevation Lock Elevation Gate Opening Figure A.3. Headwater, tailwater, water surface level in the lock chamber and the gate opening during the filling cycle. The sluice gate opened as a linear function of time. The gate opening duration was 3 minutes, the gate opening height was 3 ft, and the lock floor elevation was at 624 ft (Test #3). 26
37 Filling Cycle, Loaded Boat (31-Second Opening of a 3-ft Gate; Lock Floor Elevation at 624 ft) Elevation (ft) Gate Opening (inches) Time (seconds) Headwater Elevation Tailwater Elevation Lock Elevation Gate Opening Figure A.4. Headwater, tailwater, water surface level in the lock chamber and the gate opening during the filling cycle. The sluice gate opened as a linear function of time. The gate opening duration was.5 minutes, the gate opening height was 3 ft, and the lock floor elevation was at 624 ft (Test #4). 27
38 Emptying Cycle, Loaded Boat (31-Second Opening of a 3-ft Gate; Lock Floor Elevation at 624 ft) Elevation (ft) Gate Opening (inches) Time (seconds) Headwater Elevation Tailwater Elevation Lock Elevation Gate Opening Figure A.5. Headwater, tailwater, water surface level in the lock chamber and the gate opening during the emptying cycle. The sluice gate opened as a linear function of time. The gate opening duration was.5 minutes, the gate opening height was 3 ft, and the lock floor elevation was at 624 ft (Test #5). 28
39 Filling Cycle, Loaded Boat (31-Second Opening of a 3-ft Gate; Lock Floor Elevation at 622 ft) Elevation (ft) Gate Opening (inches) Time (seconds) Headwater Elevation Tailwater Elevation Lock Elevation Gate Opening Figure A.6. Headwater, tailwater, water surface level in the lock chamber and the gate opening during the filling cycle. The sluice gate opened as a linear function of time. The gate opening duration was.5 minutes, the gate opening height was 3 ft, and the lock floor elevation was at 622 ft (Test #6). 29
40 Filling Cycle, Unloaded Boat (31-Second Opening of a 3-ft Gate; Lock Floor Elevation at 624 ft) Elevation (ft) Gate Opening (inches) Time (seconds) Lock Elevation Headwater Elevation Tailwater Elevation Gate Opening Figure A.7. Headwater, tailwater, water surface level in the lock chamber and the gate opening during the filling cycle. The sluice gate opened as a linear function of time. The gate opening duration was.5 minutes, the gate opening height was 3 ft, and the lock floor elevation was at 624 ft (Test #7). 3
41 Filling Cycle, Loaded Boat (2-Min Opening of a 3-ft Gate; Lock Floor Elevation at 624 ft) Elevation (ft) Gate Opening (inches) Time (seconds) Lock Elevation Headwater Elevation Tailwater Elevation Gate Opening Figure A.8. Headwater, tailwater, water surface level in the lock chamber and the gate opening during the filling cycle. The sluice gate opened as a tangent function of time. The gate opening duration was 2 minutes, the gate opening height was 3 ft, and the lock floor elevation was at 624 ft (Test #8). 31
42 Filling Cycle, Loaded Boat (2-Min Opening of a 2-ft Gate; Lock Floor Elevation at 624 ft) Elevation (ft) Gate Opening (inches) Time (seconds) Headwater Elevation Tailwater Elevation Lock Elevation Gate Opening Figure A.9. Headwater, tailwater, water surface level in the lock chamber and the gate opening during the filling cycle. The sluice gate opened as a linear function of time. The gate opening duration was 2 minutes, the gate opening height was 2 ft, and the lock floor elevation was at 624 ft (Test #9). 32
43 Filling Cycle, Loaded Boat (2-Min Opening of a 3-ft Gate; Lock Floor Elevation at 622 ft) Elevation (ft) Gate Opening (inches) Time (seconds) Headwater Elevation Tailwater Elevation Lock Elevation Gate Opening Figure A.1. Headwater, tailwater, water surface level in the lock chamber and the gate opening during the filling cycle. The sluice gate opened as a linear function of time. The gate opening duration was 2 minutes, the gate opening height was 3 ft, and the lock floor elevation was at 622 ft (Test #1). 33
44 Filling Cycle, Loaded Boat (2-Min Opening of a 3-ft Gate; Lock Floor Elevation at 622 ft) Elevation (ft) Gate Opening (inches) Time (seconds) Headwater Elevation Tailwater Elevation Lock Elevation Gate Opening Figure A.11. Headwater, tailwater, water surface level in the lock chamber and the gate opening during the filling cycle. The sluice gate opened as a linear function of time. The gate opening duration was 2 minutes, the gate opening height was 3 ft, and the lock floor elevation was at 622 ft. This was a repeatability test (Test #11). 34
45 Filling Cycle, Unloaded Boat (2-Min Opening of a 3-ft Gate; Lock Floor Elevation at 622 ft) Elevation (ft) Gate Opening (inches) Time (seconds) Headwater Elevation Tailwater Elevation Lock Elevation Gate Opening Figure A.12. Headwater, tailwater, water surface level in the lock chamber and the gate opening during the filling cycle. The sluice gate opened as a linear function of time. The gate opening duration was 2 minutes, the gate opening height was 3 ft, and the lock floor elevation was at 622 ft (Test #12). 35
46 Filling Cycle, No Boat (2-Min Opening of a 3-ft Gate; Lock Floor Elevation at 622 ft) Elevation (ft) Time (seconds) Lock Elevation Headwater Elevation Tailwater Elevation Gate Opening Figure A.13. Headwater, tailwater, water surface level in the lock chamber and the gate opening during the filling cycle. The sluice gate opened as a linear function of time. The gate opening duration was 2 minutes, the gate opening height was 3 ft, and the lock floor elevation was at 622 ft (Test #13). 36
47 Appendix B. Estimated Time Variant Discharge of the Final Test Series 12 Filling Cycle, Loaded Boat (3-Min Opening of a 3-ft Gate; Lock Floor Elevation at 624 ft) 1 Discharge (cfs) Time (sec) Figure B.1. Discharge into the lock chamber during the filling cycle. The sluice gate opened as a linear function of time. The gate opening duration was 3 minutes, the gate opening height was 3 ft, and the lock floor elevation was at 624 ft. (Test #3) 37
48 12 Filling Cycle, Loaded Boat (31-Second Opening of a 3-ft Gate; Lock Floor Elevation at 624 ft) 1 Discharge (cfs) Time (sec) Figure B.2. Discharge into the lock chamber during the emptying cycle. The sluice gate opened as a linear function of time. The gate opening duration was.5 minutes, the gate opening height was 3 ft, and the lock floor elevation was at 624 ft. (Test # 4) 38
49 12 Emptying Cycle, Loaded Boat (31-Second Opening of a 3-ft Gate; Lock Floor Elevation at 624 ft) 1 Discharge (cfs) Time (sec) Figure B.3. Discharge into the lock chamber during the filling cycle. The sluice gate opened as a linear function of time. The gate opening duration was.5 minutes, the gate opening height was 3 ft, and the lock floor elevation was at 624 ft. (Test # 5) 39
50 12 Filling Cycle, Loaded Boat (31-Second Opening of a 3-ft Gate; Lock Floor Elevation at 622 ft) 1 Discharge (cfs) Time (sec) Figure B.4. Discharge into the lock chamber during the filling cycle. The sluice gate opened as a linear function of time. The gate opening duration was.5 minutes, the gate opening height was 3 ft, and the lock floor elevation was at 622 ft. (Test # 6) 4
51 12 Filling Cycle, Unloaded Boat (31-Second Opening of a 3-ft Gate; Lock Floor Elevation at 624 ft) 1 Discharge (cfs) Time (sec) Figure B.5. Discharge into the lock chamber during the filling cycle. The sluice gate opened as a linear function of time. The gate opening duration was.5 minutes, the gate opening height was 3 ft, and the lock floor elevation was at 624 ft. (Test # 7) 41
52 12 Filling Cycle, Loaded Boat (2-Min Opening of a 3-ft Gate; Lock Floor Elevation at 622 ft) 1 Discharge (cfs) Time (sec) Figure B.6. Discharge into the lock chamber during the filling cycle. The sluice gate opened as a linear function of time. The gate opening duration was 2 minutes, the gate opening height was 3 ft, and the lock floor elevation was at 622 ft. (Test # 1) 42
53 12 Filling Cycle, Loaded Boat (2-Min Opening of a 3-ft Gate; Lock Floor Elevation at 622 ft) 1 Discharge (cfs) Time (sec) Figure B.7. Discharge into the lock chamber during the filling cycle. The sluice gate opened as a linear function of time. The gate opening duration was 2 minutes, the gate opening height was 3 ft, and the lock floor elevation was at 622 ft. (Test # 11) 43
54 12 Filling Cycle, Unloaded Boat (2-Min Opening of a 3-ft Gate; Lock Floor Elevation at 622 ft) 1 Discharge (cfs) Time (sec) Figure B.8. Discharge into the lock chamber during the filling cycle. The sluice gate opened as a linear function of time. The gate opening duration was 2 minutes, the gate opening height was 3 ft, and the lock floor elevation was at 622 ft. (Test # 12) 44
55 12 Filling Cycle, No Boat (2-Min Opening of a 3-ft Gate; Lock Floor Elevation at 622 ft) 1 Discharge (cfs) Time (sec) Figure B.9. Discharge into the lock chamber during the filling cycle. The sluice gate opened as a linear function of time. The gate opening duration was 2 minutes, the gate opening height was 3 ft, and the lock floor elevation was at 622 ft. (Test # 13) 45
Greenup Lock Filling and Emptying System Study
 Fourth LACCEI International Latin American and Caribbean Conference for Engineering and Technology (LACCET 2006) Breaking Frontiers and Barriers in Engineering: Education, Research and Practice 21-23 June
CHAPTER 5 CULVERT DESIGN
 CHAPTER 5 CULVERT DESIGN HYDRAULICS OF CULVERTS There are two major types of culvert flow: 1) flow with inlet control, and 2) flow with outlet control. For each type, different factors and formulas are
The Physical Model Study of the Folsom Dam Auxiliary Spillway System
 ST. ANTHONY FALLS LABORATORY Engineering, Environmental and Geophysical Fluid Dynamics PROJECT REPORT 511 The Physical Model Study of the Folsom Dam Auxiliary Spillway System By Matthew L. Lueker, Omid
Ermenek Dam and HEPP: Spillway Test & 3D Numeric-Hydraulic Analysis of Jet Collision
 Ermenek Dam and HEPP: Spillway Test & 3D Numeric-Hydraulic Analysis of Jet Collision J.Linortner & R.Faber Pöyry Energy GmbH, Turkey-Austria E.Üzücek & T.Dinçergök General Directorate of State Hydraulic
Numerical and Experimental Investigation of the Possibility of Forming the Wake Flow of Large Ships by Using the Vortex Generators
 Second International Symposium on Marine Propulsors smp 11, Hamburg, Germany, June 2011 Numerical and Experimental Investigation of the Possibility of Forming the Wake Flow of Large Ships by Using the
Physical Model for the Filling and Emptying System of the Third Set of Panama locks
 Physical Model for the Filling and Emptying System of the Third Set of Panama locks Roumieu P. CNR - Consorcio Pos Panamax France p.roumieu@cnr.tm.fr De Regge J Technum Consorcio Pos Panamax Belgium jdr@technum.be
CLAIBORNE LOCK AND DAM PERTINENT DATA
 CLAIBORNE LOCK AND DAM PERTINENT DATA GENERAL Location Clarke, Monroe, & Wilcox Counties, Alabama; Alabama River, river mile 72.5 Drainage area Millers Ferry to Claiborne sq. mi. 836 Total drainage area
Plan B Dam Breach Assessment
 Plan B Dam Breach Assessment Introduction In support of the Local Sponsor permit applications to the states of Minnesota and North Dakota, a dam breach analysis for the Plan B alignment of the Fargo-Moorhead
STRUCTURE S-65 PURPOSE SPILLWAY OPERATION
 STRUCTURE S-65 This structure is a reinforced concrete, gated spillway with discharge controlled by three cable operated, vertical lift gates, and a reinforced concrete lock structure with two pairs of
CONTROL VALVE TESTING
 The optimal functioning of the Control valve not only exists of sufficient body & seat tightness, but more important, the total "performance" of the valve and its controls! For an accurate and reliable
Statesville, NC. Results of AM ASHRAE 110 Laboratory Fume Hood Performance Evaluations Venturi Hood
 Statesville, NC Results of AM ASHRAE 11 Laboratory Fume Hood Performance Evaluations Venturi Hood January, 217 Prepared By: Exposure Control Technologies Inc. 231-C East Johnson Street Cary, NC 27513 Phone:
Irrigation &Hydraulics Department lb / ft to kg/lit.
 CAIRO UNIVERSITY FLUID MECHANICS Faculty of Engineering nd Year CIVIL ENG. Irrigation &Hydraulics Department 010-011 1. FLUID PROPERTIES 1. Identify the dimensions and units for the following engineering
Development of Technology to Estimate the Flow Field around Ship Hull Considering Wave Making and Propeller Rotating Effects
 Development of Technology to Estimate the Flow Field around Ship Hull Considering Wave Making and Propeller Rotating Effects 53 MAKOTO KAWABUCHI *1 MASAYA KUBOTA *1 SATORU ISHIKAWA *2 As can be seen from
Study of Passing Ship Effects along a Bank by Delft3D-FLOW and XBeach1
 Study of Passing Ship Effects along a Bank by Delft3D-FLOW and XBeach1 Minggui Zhou 1, Dano Roelvink 2,4, Henk Verheij 3,4 and Han Ligteringen 2,3 1 School of Naval Architecture, Ocean and Civil Engineering,
APPENDIX A STRUCTURE DESCRIPTIONS AND RATING CURVES
 3 4 5 6 7 8 9 0 3 APPENDIX A STRUCTURE DESCRIPTIONS AND RATING CURVES Kissimmee River Vol December 005 Version Draft 4 3 4 5 6 7 8 9 0 3 4 5 6 7 8 9 0 3 4 5 6 7 8 9 30 3 3 33 34 35 36 37 38 39 40 4 4 43
Large-scale Field Test
 Vaskinn 1 Large-scale Field Test Kjetil Arne Vaskinn kav@trh.statkraftgroner.no Statkraft Grøner AS SUMMARY The objective the controlled failure of large-scale embankment is to monitor and record the failure
STUDY REPORT W&AR-03 RESERVOIR TEMPERATURE MODEL ATTACHMENT B DON PEDRO RESERVOIR BATHYMETRIC STUDY REPORT
 STUDY REPORT W&AR-03 RESERVOIR TEMPERATURE MODEL ATTACHMENT B DON PEDRO RESERVOIR BATHYMETRIC STUDY REPORT DON PEDRO RESERVOIR BATHYMETRIC STUDY REPORT Prepared for: TURLOCK IRRIGATION DISTRICT MODESTO
PHASE 1 WIND STUDIES REPORT
 PHASE 1 WIND STUDIES REPORT ENVIRONMENTAL STUDIES AND PRELIMINARY DESIGN FOR A SUICIDE DETERRENT SYSTEM Contract 2006-B-17 24 MAY 2007 Golden Gate Bridge Highway and Transportation District Introduction
Designing Labyrinth Spillways for Less than Ideal Conditions Real World Application of Laboratory Design Methods
 Designing Labyrinth Spillways for Less than Ideal Conditions Real World Application of Laboratory Design Methods Gregory Richards, P.E., CFM, Gannett Fleming, Inc. Blake Tullis, Ph.D., Utah Water Research
Coastal and Hydraulics Laboratory
 ERDC/CHL TR-15-2 Monitoring Completed Navigation Projects (MCNP) Program Hydraulic Evaluation of Marmet Lock Filling and Emptying System, Kanawha River, West Virginia Richard L. Stockstill April 2015 Coastal
Cover Page for Lab Report Group Portion. Pump Performance
 Cover Page for Lab Report Group Portion Pump Performance Prepared by Professor J. M. Cimbala, Penn State University Latest revision: 02 March 2012 Name 1: Name 2: Name 3: [Name 4: ] Date: Section number:
The Hydraulic Design of an Arced Labyrinth Weir at Isabella Dam
 Utah State University DigitalCommons@USU International Symposium on Hydraulic Structures Jun 28th, 1:30 PM The Hydraulic Design of an Arced Labyrinth Weir at Isabella Dam E. A. Thompson Sacramento District
D emonstration of Possible F low Conditions in a Culvert
 D emonstration of Possible F low Conditions in a Culvert M. R. CARSTENS, Associate Professor, Georgia Institute of Technology and A. R. HOLT, Lt. U.S. Army Corps of Engineers, Fort Belvoir, Virginia e
Free Surface Flow Simulation with ACUSIM in the Water Industry
 Free Surface Flow Simulation with ACUSIM in the Water Industry Tuan Ta Research Scientist, Innovation, Thames Water Kempton Water Treatment Works, Innovation, Feltham Hill Road, Hanworth, TW13 6XH, UK.
Coastal and Hydraulics Laboratory
 ERDC/CHL TR-12-1 New Lock for Soo Locks and Dam, Model nvestigations during 26 21, Sault Ste. Marie, Michigan, St. Mary s River Hydraulic Model nvestigation John E. Hite, Jr. and Carlos Bislip-Morales
NUMERICAL AND PHYSICAL MODELING
 POINTE DU BOIS GENERATING STATION SPILLWAY REPLACEMENT PROJECT NUMERICAL AND PHYSICAL MODELING Kara Hurtig, Northwest Hydraulic Consultants, North Vancouver, BC, Canada David S. Brown, KGS Group, Winnipeg,
ANSWERS TO QUESTIONS IN THE NOTES AUTUMN 2018
 ANSWERS TO QUESTIONS IN THE NOTES AUTUMN 2018 Section 1.2 Example. The discharge in a channel with bottom width 3 m is 12 m 3 s 1. If Manning s n is 0.013 m -1/3 s and the streamwise slope is 1 in 200,
Developments in Netherlands. Example of old levelling system 1. Lock levelling in The Netherlands. Example of old levelling system 2
 PIANC Workshop 13-14th 14th September 2011 Part 5: Mooring Forces & Vessel behaviour (in locks) Experience in The Netherlands By J.J. (Hans) Veldman Alkyon HC&R/Arcadis (per Aug 11 at BMT ARGOSS) The Netherlands
Laboratory studies of water column separation
 IOP Conference Series: Materials Science and Engineering OPEN ACCESS Laboratory studies of water column separation To cite this article: R Autrique and E Rodal 2013 IOP Conf. Ser.: Mater. Sci. Eng. 52
STRUCTURE 65-B PURPOSE SPILLWAY OPERATION
 STRUCTURE 65-B This structure is a reinforced concrete, gated spillway with discharge controlled by three cable operated vertical lift gates and a reinforced concrete lock structure with two pairs of sector
The below identified patent application is available for licensing. Requests for information should be addressed to:
 DEPARTMENT OF THE NAVY OFFICE OF COUNSEL NAVAL UNDERSEA WARFARE CENTER DIVISION 1176 HOWELL STREET NEWPORT Rl 02841-1708 IN REPLY REFER TO Attorney Docket No. 300170 20 March 2018 The below identified
PAK BENG HYDROPOWER PROJECT
 PAK BENG HYDROPOWER PROJECT Hydraulic Physical Model Investigation of Filling and Emptying System September 2015 CONTENTS Page 1 PREFACE... - 1-2 DESIGN FEATURES... - 1-2.1 NAVIGABLE WATER LEVEL...- 1-2.2
3. GRADUALLY-VARIED FLOW (GVF) AUTUMN 2018
 AUTUMN 2018") 3. GRADUALLY-VARIED FLOW (GVF) AUTUMN 2018 3.1 Normal Flow vs Gradually-Varied Flow V 2 /2g EGL (energy grade line) Friction slope S f h Geometric slope S 0 In flow the downslope component of weight balances
3. GRADUALLY-VARIED FLOW (GVF) AUTUMN 2018 3.1 Normal Flow vs Gradually-Varied Flow V 2 /2g EGL (energy grade line) Friction slope S f h Geometric slope S 0 In flow the downslope component of weight balances
Cover Page for Lab Report Group Portion. Head Losses in Pipes
 Cover Page for Lab Report Group Portion Head Losses in Pipes Prepared by Professor J. M. Cimbala, Penn State University Latest revision: 02 February 2012 Name 1: Name 2: Name 3: [Name 4: ] Date: Section
ZIN Technologies PHi Engineering Support. PHi-RPT CFD Analysis of Large Bubble Mixing. June 26, 2006
 ZIN Technologies PHi Engineering Support PHi-RPT-0002 CFD Analysis of Large Bubble Mixing Proprietary ZIN Technologies, Inc. For nearly five decades, ZIN Technologies has provided integrated products and
U S F O S B u o y a n c y And Hydrodynamic M a s s
 1 U S F O S B u o y a n c y And Hydrodynamic M a s s 2 CONTENTS: 1 INTRODUCTION... 3 2 ACCURACY LEVELS... 3 2.1 LEVEL-0... 3 2.2 LEVEL-1... 3 2.3 PANEL MODEL... 3 3 EX 1. SINGLE PIPE. NON FLOODED... 4
OFFICE OF STRUCTURES MANUAL FOR HYDROLOGIC AND HYDRAULIC DESIGN CHAPTER 11 APPENDIX B TIDEROUT 2 USERS MANUAL
 OFFICE OF STRUCTURES MANUAL FOR HYDROLOGIC AND HYDRAULIC DESIGN CHAPTER 11 APPENDIX B TIDEROUT 2 USERS MANUAL APRIL 2011 APRIL 2011 Page 1 Preface TIDEROUT 2, Build 1.22 dated June 29, 2006 is the current
Computer Simulation Helps Improve Vertical Column Induced Gas Flotation (IGF) System
 System") JOURNAL ARTICLES BY FLUENT SOFTWARE USERS JA187 Computer Simulation Helps Improve Vertical Column Induced Gas Flotation (IGF) System Computer simulation has helped NATCO engineers make dramatic improvements
JOURNAL ARTICLES BY FLUENT SOFTWARE USERS JA187 Computer Simulation Helps Improve Vertical Column Induced Gas Flotation (IGF) System Computer simulation has helped NATCO engineers make dramatic improvements
SUBMERGED VENTURI FLUME. Tom Gill 1 Robert Einhellig 2 ABSTRACT
 SUBMERGED VENTURI FLUME Tom Gill 1 Robert Einhellig 2 ABSTRACT Improvement in canal operating efficiency begins with establishing the ability to measure flow at key points in the delivery system. The lack
Experiment (13): Flow channel
: Flow channel") Experiment (13): Flow channel Introduction: An open channel is a duct in which the liquid flows with a free surface exposed to atmospheric pressure. Along the length of the duct, the pressure at the surface
Experiment (13): Flow channel Introduction: An open channel is a duct in which the liquid flows with a free surface exposed to atmospheric pressure. Along the length of the duct, the pressure at the surface
23 RD INTERNATIONAL SYMPOSIUM ON BALLISTICS TARRAGONA, SPAIN APRIL 2007
 23 RD INTERNATIONAL SYMPOSIUM ON BALLISTICS TARRAGONA, SPAIN 16-20 APRIL 2007 AN INVESTIGATION INTO THE INTERRELATION BETWEEN THE INTERNAL AND EXTERNAL BALLISTICS OF FIRING A TP-T TANK AMMUNITION M. H.
Application of Computational Fluid Dynamics to Compressor Efficiency Improvement
 Purdue University Purdue e-pubs International Compressor Engineering Conference School of Mechanical Engineering 1994 Application of Computational Fluid Dynamics to Compressor Efficiency Improvement J.
EFFECTIVE DESIGN OF CONVERTER HOODS. 111 Ferguson Ct. Suite 103 Irving, Texas U.S.A. 400 Carlingview Dr. Toronto, ON M9W 5X9 Canada.
 EFFECTIVE DESIGN OF CONVERTER HOODS Paykan Safe 1, Sam Matson 1, and John Deakin 2 1 Gas Cleaning Technologies 111 Ferguson Ct. Suite 103 Irving, Texas 75062 U.S.A. 2 H.G. Engineering, Ltd. 400 Carlingview
Aalborg Universitet. Published in: Proceedings of Offshore Wind 2007 Conference & Exhibition. Publication date: 2007
 Aalborg Universitet Design Loads on Platforms on Offshore wind Turbine Foundations with Respect to Vertical Wave Run-up Damsgaard, Mathilde L.; Gravesen, Helge; Andersen, Thomas Lykke Published in: Proceedings
Indiana LTAP Road Scholar Core Course #10 Culvert Drainage. Presented by Thomas T. Burke, Jr., PhD, PE Christopher B. Burke Engineering, Ltd.
 Indiana LTAP Road Scholar Core Course #10 Culvert Drainage Presented by Thomas T. Burke, Jr., PhD, PE Christopher B. Burke Engineering, Ltd. Objectives Review culvert shapes, end sections, and materials
Technical Report Culvert A Hydraulic Analysis
 DATE: November 3, 2011 Technical Report Culvert A Hydraulic Analysis TO: FROM: RE: Jim Reiser, P.E. Project Manager Parsons Brinckerhoff, Inc. Kurt Killian, P.E., CFM Parsons Brinckerhoff, Inc. Design
2O-2 Open Channel Flow
 Iowa Stormwater Management Manual O- O- Open Channel Flow A. Introduction The beginning of any channel design or modification is to understand the hydraulics of the stream. The procedures for performing
Preparation and Installation of the Sanitary BDI-FLX Sensor and Connection to the BDI-FLX Interface Cable
 GEP-6075 Rev. B 101574 Ref. I.D.: 16973 Preparation and Installation of the Sanitary BDI-FLX Sensor and Connection to the BDI-FLX Interface Cable WARNING USER SHOULD READ AND THOROUGHLY UNDERSTAND THESE
Packwood Lake Intake Screen Velocity Test Report for Energy Northwest's Packwood Lake Hydroelectric Project FERC No Lewis County, Washington
 for Energy Northwest's Packwood Lake Hydroelectric Project FERC No. 2244 Lewis County, Washington Submitted to P.O. Box 968 Richland, Washington 99352-0968 Submitted by EES Consulting 1155 North State
Implementing Provisions for Art. 411 of the ICR Ski Jumping
 JUMPING HILLS CONSTRUCTION NORM 2018 Implementing Provisions for Art. 411 of the ICR Ski Jumping Author: Hans-Heini Gasser (SUI) EDITION NOVEMBER 2018 Table of Contents Page 1. Preliminary Remarks 3 2.
HYDRAULICS. H89.8D - Hydraulic Bench
 HYDRAULICS H89.8D - Hydraulic Bench 1. General The H89.8D and ancillary equipment have been developed to provide a comprehensive range of experiments in fluid mechanics. The bench is of robust construction
Project to Refine a Prototype Unmanned, Tethered ADCP Platform for Measuring Streamflow
 Pagina 1 di 5 Project to Refine a Prototype Unmanned, Tethered ADCP Platform for Measuring Streamflow The use of trade, firm, or product names is for descriptive purposes only and does not imply endorsement
Broadly speaking, there are four different types of structures, each with its own particular function:
 3 The selection of structures 3.1 Introduction In selecting a suitable structure to measure or regulate the flow rate in open channels, all demands that will be made upon the structure should be listed.
Investigation of Suction Process of Scroll Compressors
 Purdue University Purdue e-pubs International Compressor Engineering Conference School of Mechanical Engineering 2006 Investigation of Suction Process of Scroll Compressors Michael M. Cui Trane Jack Sauls
Modeling Case Study: Surge Tanks, Valves, Level sensors, and modeling
 Modeling Case Study: Surge Tanks, Valves, Level sensors, and modeling By Peter Woolf (pwoolf@umich.edu) University of Michigan Michigan Chemical Process Dynamics and Controls Open Textbook version 1.0
DAIVÕES DAM SPILLWAY: A NOVEL SOLUTION FOR THE STILLING BASIN
 DAIVÕES DAM SPILLWAY: A NOVEL SOLUTION FOR THE STILLING BASIN Elsa Alves *, Felix Hernando and Rafael Chacón * Laboratório Nacional de Engenharia Civil (LNEC) Av. do Brasil, 101, 1700-066 Lisboa, Portugal
A New Test Setup for Testing Polyethylene Tubes under Constant and Cyclic Internal Pressures
 A New Test Setup for Testing Polyethylene Tubes under Constant and Cyclic Internal Pressures S. Vahidi, E. Schruba, Y. Sun, M. McCarthy, and Y. G. Hsuan Drexel University, Philadelphia, PA, USA Abstract
CFD for Ballast Water & Bio-fouling Management
 CFD for Ballast Water & Bio-fouling Management Vivek V. Ranade Catalysis, Reactors & Separation Unit (CReST) Chemical Engineering Division National Chemical Laboratory Pune 411008 vv.ranade@ncl.res.in
Evaluating Surge Potential in CSO Tunnels
 14 Evaluating Surge Potential in CSO Tunnels Karen E. Ridgway Tunnels are being proposed to control combined sewer overflow (CSO) in numerous cities in the United States and Canada. The tunnels are intended
IN-SERVICE HULL STABILITY VERIFICATION
 Guidance Notes on In-service Hull Stability Verification GUIDANCE NOTES ON IN-SERVICE HULL STABILITY VERIFICATION OCTOBER 2017 (Updated 1 July 2018 see next page) American Bureau of Shipping Incorporated
USING A LABYRINTH WEIR TO INCREASE HYDRAULIC CAPACITY. Dustin Mortensen, P.E. 1 Jake Eckersley, P.E. 1
 USING A LABYRINTH WEIR TO INCREASE HYDRAULIC CAPACITY Dustin Mortensen, P.E. 1 Jake Eckersley, P.E. 1 Plum Creek Floodwater Retarding Structure No. 6 is located in an area of Kyle, Texas, that is currently
Journal of Applied Fluid Transients, Vol 1-1, April 2014 (3-1)
") Modeling and Field Verification Study of Air Slam Conditions on kalanit Pipeline System By Yiftach Brunner & Sathish Kumar ir valves are integral part of long water transmission mains and are essential
Modeling and Field Verification Study of Air Slam Conditions on kalanit Pipeline System By Yiftach Brunner & Sathish Kumar ir valves are integral part of long water transmission mains and are essential
APPENDIX B HYDRAULIC DESIGN DATA FOR CULVERTS
 TM 5-820-4/AFM 88-5, Chap 4 APPENDIX B HYDRAULIC DESIGN DATA FOR CULVERTS B-1. General. a. This appendix presents diagrams, charts, coefficients and related information useful in design of culverts. The
Installation Operation Maintenance
 682 Seal Cooler New generation seal cooler to meet and exceed the seal cooler requirements stated in the 4th Edition of API Standard 682 Installation Operation Maintenance Experience In Motion Description
Autodesk Moldflow Communicator Process settings
 Autodesk Moldflow Communicator 212 Process settings Revision 1, 3 March 211. Contents Chapter 1 Process settings....................................... 1 Profiles.................................................
Module 3 Developing Timing Plans for Efficient Intersection Operations During Moderate Traffic Volume Conditions
 Module 3 Developing Timing Plans for Efficient Intersection Operations During Moderate Traffic Volume Conditions CONTENTS (MODULE 3) Introduction...1 Purpose...1 Goals and Learning Outcomes...1 Organization
Information for File # SEW
 Information for File #2014-02744-SEW Applicant: Minnesota Department of Transportation (MnDOT), District 3; c/o Mr. Robert Nibbe Corps Contact: Sarah Wingert, U.S. Army Corps of Engineers, 180 5 th Street
Dillon Thorse Flow Visualization MCEN 4047 Team Poject 1 March 14th, 2013
 Dillon Thorse Flow Visualization MCEN 4047 Team Poject 1 March 14 th, 2013 1 Introduction I have always been entranced by flight. Recently I have been taking flying lessons, and I have been learning the
APPENDIX J HYDROLOGY AND WATER QUALITY
 APPENDIX J HYDROLOGY AND WATER QUALITY J-1 Technical Report on Airport Drainage, Northern Sector Airport and Ordinance Creek Watershed / Preliminary Creek Constructed Natural Channel Culvert J-2 Preliminary
A STUDY OF THE LOSSES AND INTERACTIONS BETWEEN ONE OR MORE BOW THRUSTERS AND A CATAMARAN HULL
 A STUDY OF THE LOSSES AND INTERACTIONS BETWEEN ONE OR MORE BOW THRUSTERS AND A CATAMARAN HULL L Boddy and T Clarke, Austal Ships, Australia SUMMARY CFD analysis has been conducted on a 100m catamaran hull
Influence of rounding corners on unsteady flow and heat transfer around a square cylinder
 Influence of rounding corners on unsteady flow and heat transfer around a square cylinder S. K. Singh Deptt. of Mech. Engg., M. B. M. Engg. College / J. N. V. University, Jodhpur, Rajasthan, India Abstract
UNIT 15 WATER HAMMER AND SURGE TANKS
 UNT 15 WATER HAMMER AND SURGE TANKS Structure 15.1 ntroduction Objectives 15.2 Water Hammer 15.2.1 Expression for Rise in Pressure 15.3 Rapid Acceleration of Flow 15.4 Surge Tanks 15.5 Summary 15.6 Keywords
INCLINOMETER DEVICE FOR SHIP STABILITY EVALUATION
 Proceedings of COBEM 2009 Copyright 2009 by ABCM 20th International Congress of Mechanical Engineering November 15-20, 2009, Gramado, RS, Brazil INCLINOMETER DEVICE FOR SHIP STABILITY EVALUATION Helena
Effects of Submergence in Montana Flumes
 Utah State University DigitalCommons@USU All Graduate Theses and Dissertations Graduate Studies 5-2010 Effects of Submergence in Montana Flumes Ryan P. Willeitner Utah State University Follow this and
DETRMINATION OF A PLUNGER TYPE WAVE MAKER CHARACTERISTICE IN A TOWING TANK
 The 9 th International Conference on Coasts, Ports and Marine Structures (ICOPMAS 2010) 29 Nov.-1 Dec. 2010 (Tehran) DETRMINATION OF A PLUNGER TYPE WAVE MAKER CHARACTERISTICE IN A TOWING TANK sayed mohammad
CSO/STORMWATER MANAGEMENT. HYDROVEX VHV / SVHV Vertical Vortex Flow Regulator
 CSO/STORMWATER MANAGEMENT HYDROVEX VHV / SVHV Vertical Vortex Flow Regulator HYDROVEX VHV / SVHV VERTICAL VORTEX FLOW REGULATOR APPLICATIONS One of the major problems of urban wet weather flow management
Development of Biomimicry Wind Louver Surface Design
 International Proceedings of Chemical, Biological and Environmental Engineering, V0l. 93 (2016) DOI: 10.7763/IPCBEE. 2016. V93. 6 Development of Biomimicry Wind Louver Surface Design Jaepil Choi 1, Donghwa
Advanced Hydraulics Prof. Dr. Suresh A. Kartha Department of Civil Engineering Indian Institute of Technology, Guwahati
 Advanced Hydraulics Prof. Dr. Suresh A. Kartha Department of Civil Engineering Indian Institute of Technology, Guwahati Module - 4 Hydraulics Jumps Lecture - 4 Features of Hydraulic Jumps (Refer Slide
CVEN 311 Fluid Dynamics Fall Semester 2011 Dr. Kelly Brumbelow, Texas A&M University. Final Exam
 CVEN 311 Fluid Dynamics Fall Semester 2011 Dr. Kelly Brumbelow, Texas A&M University Final Exam 8 pages, front & back, not including reference sheets; 21 questions An excerpt from the NCEES Fundamentals
Advanced Hydraulics Prof. Dr. Suresh A. Kartha Department of Civil Engineering Indian Institute of Technology, Guwahati
 Advanced Hydraulics Prof. Dr. Suresh A. Kartha Department of Civil Engineering Indian Institute of Technology, Guwahati Module - 4 Hydraulic Jumps Lecture - 1 Rapidly Varied Flow- Introduction Welcome
2 Available: 1390/08/02 Date of returning: 1390/08/17 1. A suction cup is used to support a plate of weight as shown in below Figure. For the conditio
 1. A suction cup is used to support a plate of weight as shown in below Figure. For the conditions shown, determine. 2. A tanker truck carries water, and the cross section of the truck s tank is shown
Pressure coefficient on flat roofs of rectangular buildings
 Pressure coefficient on flat roofs of rectangular buildings T. Lipecki 1 1 Faculty of Civil Engineering and Architecture, Lublin University of Technology, Poland. t.lipecki@pollub.pl Abstract The paper
SECTION 2 HYDROLOGY AND FLOW REGIMES
 SECTION 2 HYDROLOGY AND FLOW REGIMES In this section historical streamflow data from permanent USGS gaging stations will be presented and discussed to document long-term flow regime trends within the Cache-Bayou
Scott Dam Spillway Comparing Physical Model Study Results
 Scott Dam Spillway Comparing Physical Model Study Results Darren Hinton, P.E., Ph.D., Seattle Laboratory Manager, Northwest Hydraulic Consultants, USA Brian Hughes, M.A.Sc., P.E., Principal, Northwest
EXAMPLES (OPEN-CHANNEL FLOW) AUTUMN 2018
 AUTUMN 2018") EXAMPLES (OPEN-CHANNEL FLOW) AUTUMN 2018 Normal and Critical Depths Q1. If the discharge in a channel of width 5 m is 20 m 3 s 1 and Manning s n is 0.02 m 1/3 s, find: (a) the normal depth and Froude number
EXAMPLES (OPEN-CHANNEL FLOW) AUTUMN 2018 Normal and Critical Depths Q1. If the discharge in a channel of width 5 m is 20 m 3 s 1 and Manning s n is 0.02 m 1/3 s, find: (a) the normal depth and Froude number
Outlet Structures T-12
 Description This section provides guidance and details for outlet structures for use primarily with BMPs utilizing sedimentation, (i.e., extended detention basins (EDBs), retention ponds, and constructed
EXPERIMENTAL STUDY OF WIND PRESSURES ON IRREGULAR- PLAN SHAPE BUILDINGS
 BBAA VI International Colloquium on: Bluff Bodies Aerodynamics & Applications Milano, Italy, July, 2-24 8 EXPERIMENTAL STUDY OF WIND PRESSURES ON IRREGULAR- PLAN SHAPE BUILDINGS J. A. Amin and A. K. Ahuja
Water Hammer In Irrigation Systems 1
 CIR828 1 G. A. Clark and D. Z. Haman 2 Irrigation system design includes pump sizing and selection, valve sizing and selection, and pipe sizing as well as the proper selection and placement of many other
Follow this and additional works at:
 Lehigh University Lehigh Preserve Fritz Laboratory Reports Civil and Environmental Engineering 1987 Model study. Of a culvert safety grating - south 4th and brookdale streets, ALLENTOWN, PA for the Allentown
ITTC Recommended Procedures Testing and Extrapolation Methods Loads and Responses, Seakeeping Experiments on Rarely Occurring Events
 Loads and Responses, Seakeeping Page 1 of 5 CONTENTS 1. PURPOSE OF PROCEDURE 2. STANDARDS FOR EXPERIMENTS ON RARELY OCCURRING EVENTS 2.1 Previous Recommendations of ITTC 2.2 Model Design and Construction
The Use of a Process Simulator to Model Aeration Control Valve Position and System Pressure
 The Use of a Process Simulator to Model Aeration Control Valve Position and System Pressure Matthew Gray 1 * and Steve Kestel 1 1 BioChem Technology, King of Prussia, PA *Email: mgray@biochemtech.com ABSTRACT
Wind Tunnel Testing of Crossgrip Roof Walkway Matting
 School of Aerospace, Automotive & Design Engineering Consultancy Report No: 03/00015 Wind Tunnel Testing of Crossgrip Roof Walkway Matting Consultant: Dr. K.J. Hart June 2004 For: Plastic Extruders Ltd
Experiment 8: Minor Losses
 Experiment 8: Minor Losses Purpose: To determine the loss factors for flow through a range of pipe fittings including bends, a contraction, an enlargement and a gate-valve. Introduction: Energy losses
THREE DIMENSIONAL STRUCTURES OF FLOW BEHIND A
 The Seventh Asia-Pacific Conference on Wind Engineering, November 8-12, 29, Taipei, Taiwan THREE DIMENSIONAL STRUCTURES OF FLOW BEHIND A SQUARE PRISM Hiromasa Kawai 1, Yasuo Okuda 2 and Masamiki Ohashi
G.L.M. : the on-board stability calculator... DEMONSTRATION OPERATOR S MANUAL
 General Load Monitor G.L.M. : the on-board stability calculator... DEMONSTRATION OPERATOR S MANUAL Distributed by: DESIGN SYSTEMS & TECHNOLOGIES 150 Rue de Goa, 06600 Antibes, France tel +33.4.92 91 13
Effect of channel slope on flow characteristics of undular hydraulic jumps
 River Basin Management III 33 Effect of channel slope on flow characteristics of undular hydraulic jumps H. Gotoh, Y. Yasuda & I. Ohtsu Department of Civil Engineering, College of Science and Technology,
Effect of Argon Gas Distribution on Fluid Flow in the Mold Using Time-Averaged k-ε Models
 Effect of Argon Gas Distribution on Fluid Flow in the Mold Using Time-Averaged k-ε Models B. G. Thomas, T. Shi and L. Zhang Department of Materials Science &. Engineering University of Illinois at Urbana-Champaign
Project Number: P17453
 Multidisciplinary Senior Design Conference Kate Gleason College of Engineering Rochester Institute of Technology Rochester, New York 14623 Project Number: P17453 DRESSER-RAND RECIPROCATING COMPRESSOR TEST
PH01 Perfusion Cannula Manual
 PH01 Perfusion Cannula Manual Information in this document is subject to change without notice. No part of this document may be reproduced or transmitted without the express written permission of Multi
Questions. theonlinephysicstutor.com. facebook.com/theonlinephysicstutor. Name: Edexcel Drag Viscosity. Questions. Date: Time: Total marks available:
 Name: Edexcel Drag Viscosity Questions Date: Time: Total marks available: Total marks achieved: Questions Q1. A small helium balloon is released into the air. The balloon initially accelerates upwards.