Workpackage 3: Development of Alternative Overtopping-Resistant Sea Defences
|
|
|
- Elwin Wilkinson
- 5 years ago
- Views:
Transcription


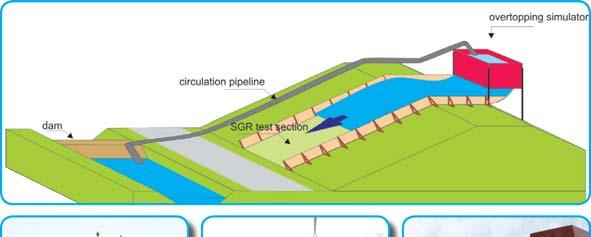
1 Workpackage : Development of Alternative Overtopping-Resistant Sea Defences Phase : Design, construction and calibration of wave overtopping simulator
2 DeveWorkpackage : Development of Alternative Overtopping-Resistant Sea Defences Phase : Design, construction and calibration of wave overtopping simulator This report has been prepared by a consortium of Royal Haskoning and Infram The ComCoast project is carried out in co-operation with ten partners: Rijkswaterstaat (NL - leading partner) Province of Zeeland (NL) Province of Groningen (NL) University of Oldenburg (D) Environmental Agency (UK) Ministry of the Flemish Community (B) Danish Coastal Authority (DK) Municipality of Hulst (NL) Waterboard Zeeuwse Eilanden (NL) Waterboard Zeeuws Vlaanderen (NL) This report is an initiative of the ComCoast project, co-financed by the EU-Interreg IIIb North Sea Programme.
3 Workpackage : Development of Alternative Overtopping-Resistant Sea Defences Phase : Design, construction and calibration of wave overtopping simulator Final Report Acknowledgement: This report is a deliverable of WP " Smart Grass Reinforcement " The work is performed by a consortium of Royal Haskoning and Infram The report is written by dr J.W. van der Meer. Page - ComCoast WP, Wave overtopping simulator, November
4 PREFACE Mission Statement of ComCoast MISSION OF COMCOAST (= COMbined functions in COASTal defence zones) ComCoast is a European project which develops and demonstrates innovative solutions for flood protection in coastal areas. ComCoast creates and applies new methodologies to evaluate multifunctional flood defence zones from an economical and social point of view. A more gradual transition from sea to land creates benefits for a wider coastal community and environment whilst offering economically and socially sound options. The aim of ComCoast is to explore the spatial potentials for coastal defence strategies for current and future sites in the North Sea Interreg IIIb region. ComCoast Goals: developing innovative technical flood defence solutions to incorporate the environment and the people and to guarantee the required safety level; improving and applying stakeholder engagement strategies with emphasis on public participation; applying best practice multifunctional flood management solutions to the ComCoast pilot sites; sharing knowledge across the Interreg IIIb North Sea region. ComCoast Solutions: Depending on the regional demands, ComCoast develops tailor-made solutions: to cope with the future increase of wave overtopping of the embankments; to improve the wave breaking effect of the fore shore e.g. by using recharge schemes; to create salty wetland conditions with tidal exchange in the primary sea defence using culvert constructions or by realigning the coastal defence system; to cope with the increasing salt intrusion to influence policy, planning and people to gain public support of multifunctional zones. ComCoast runs from April, to December,. The European Union Community Initiative Programme Interreg IIIB North Sea Region and the project partners jointly finance the project costs of, million. Information Information on the ComCoast project can be obtained through the Project Management, located at the Rijkswaterstaat in the Netherlands. Address Rijkswaterstaat DWW Postbus GA Delft The Netherlands info@comcoast.org Project leader Frans Hamer Tel + Project Communication Marjolein Lippe, CUR Tel + Page - ComCoast WP, Wave overtopping simulator, November
5 Project Data Title: Design, construction and calibration of wave overtopping simulator Version: Final v. Client: ComCoast Project number: i Partners: Royal Haskoning (partner in the consortium) Noordelijke Hogeschool Leeuwarden G. van der Meer (mechanical engineer) Nijholt Staal & Machinebouw Summary project: The wave overtopping simulator is a device which will be able to simulate overtopping waves at the crest of a dike and at the inner slope. The device will be used in the ComCoast project to test a traditional dike section with grass and the SGR, the Smart Grass Reinforcement, placed in May. This report describes the design, construction and calibration of the wave overtopping simulator. Performed by: Dr J.W. van der Meer
6 Contents Introduction Boundary conditions and theory. Wave conditions. Wave overtopping discharge and volumes. Velocities and flow depth at the crest Design of wave overtopping simulator Construction of prototype Set-up of calibration Calibration. Description of test series. Measurements with the instrumentation. Analysis of calibration tests. Simulation of wave overtopping in real time. Conclusions and recommendations References Appendix. Tables with individual measurements Appendix. Figures with composed velocity measurements i
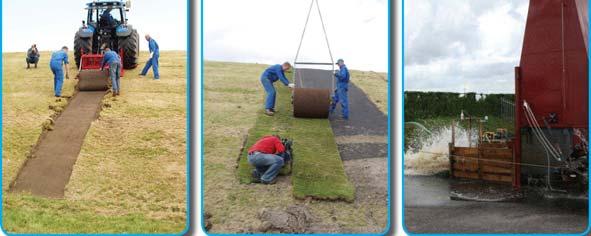
7 Introduction Workpackage of the European project ComCoast deals amongst others with overtopping resistant dikes. A contest has been launched to market parties to come up with overtopping resistant solutions for dikes without increasing the size or geometry of these dikes. The consortium Royal Haskoning and Infram submitted one of the three winning solutions: the Smart Grass Reinforcement, SGR. The next stage in the process was to install a test dike section with this SGR (May ). In summer the grass can recover and the section will be tested in March. This testing will be performed by the so-called wave overtopping simulator. The idea of an overtopping simulator has been proposed on other occasions and the copy rights have been declared by Infram through the minutes of the TAW Techniek meeting of March. The classical way of testing dikes is to test a section in a wave flume. As grass and clay can not be scaled, only large scale facilities, like the Delfta flume or GWK, can be used. With the GWK in Germany it might be well possible that extra funds can be found in the European Programme Hydrolab. This is not further explored here. With respect to the cases of Hondsbossche Zeewering and Kapelle it should be noted that even here the scale will not be :, but more : as the wave heights in reality are in the order of - m, where the facilities are limited to a significant wave height of around. m. So, the actual situation cannot be tested on full scale! Moreover, the constructed solution has to be transferred from its original location to the flume. This has been done before for existing grass dikes, but it is a very costly operation. Finally, only the failure mechanism of erosion of crest and inner slope can be tested, not the geotechnical failure mechanism of water infiltration and sliding of the inner slope. The flume is simply not wide enough to model this mechanism. The possible failure mechanism of infiltration and sliding can only be tested on the actual dike and for a sufficient width, for example around m. As velocities of overtopping waves are not the predominant load, but simply infiltration of water, the classical way of overflow may be a good test method here. Tests on overflow have been performed at various locations over the past years. The dike in Flevoland has been the most recent example of this. This method can be used if this mechanism has to be tested. For the failure mechanism of erosion of crest and inner slope, however, the wave overtopping simulator will be the ideal instrument. For this reason ComCoast has chosen to develop the overtopping simulator and to use it for testing in March. This report describes the design, construction and calibration of the prototype of the simulator. The idea of the overtopping simulator is that: everything on wave breaking on slopes and generating overtopping waves is known (TAW : Wave run-up and wave overtopping at dikes with the programme PC-Overslag) everything on individual overtopping waves is known as volumes, distributions, velocities and flow depth of overtopping water on the crest (work of Van Gent and Schüttrumph) actual waves are not really required to simulate wave overtopping it is best to test a dike in situ
8 Boundary conditions and theory. Wave conditions The wave boundary conditions (wave height, period and direction, water level) in front of the dike and the geometry of the dike determine whether there will be wave overtopping and how much. With scientific research these conditions are schematised, but should be close to reality. Tests with the overtopping simulator can be performed to assess the actual safety of a dike or it can be used to determine the behaviour of various kinds of inner slopes under wave overtopping (influence of grass maintenance, clay quality, overtopping resistant systems, etc.). In the first situation the boundary conditions for the actual dike should be taken, like the in, years storm or higher and also the geometry of the actual dike. In the second situation the boundary conditions for the actual are not important as the testing is more general of nature. Boundary conditions should be chosen more or less in agreement with the representative boundary conditions for a safety assessment in a large area. In the Netherlands this would be the boundary conditions for the -yearly safety assessment along the Dutch dikes. These dikes are mainly situated in the north (Groningen, Friesland up to Noord-Holland) and in the south west in Zeeland. A global analysis is given here. For the dike in Delfzijl, where the ComCoast test will be performed (dike ring, sections - ) a wave height of. m is given, without a wave period. For the design of the new flood defence in Harlingen a wave height of. m was used with a peak period of. s. This gives a wave steepness of.. The conditions were including a year sea level rise. At the Westerschelde (dike ring Zuid-Beveland) wave heights are given in the order of m with a period of. s. Wave heights up to. m give mainly perpendicular wave attack on the dikes, larger wave heights give more oblique attack. In Zeeuws Vlaanderen wave heights are given around m, sometimes above m. The following combinations of wave heights and periods are given: H s =. m; T =. s H s =. m; T =. s H s =. m; T =. s What kind of period (peak, mean, etc.) is not given. Wave steepnesses are s =.,. and.. These values are too high for a peak period. Maximum wave steepness for a peak period is about. and.-. for a mean period. Overall, wave heights around m are often found as conditions for the safety assessments. A wave steepness of s op =. with peak period is found in the Waddensea. Assuming T p =. T m, the wave steepness with the mean period becomes s om =.. This is similar to conditions in Zeeuws Vlaanderen. Of course larger and lower wave heights than m are found, but for testing with the overtopping simulator a wave height of m is accurate enough. In summary, analysing wave boundary conditions along the Dutch coasts, as used for the - yearly safety assessment, gives the following average values which will be used to design the wave overtopping simulator and testing of dike sections Wave height: H s =. m Peak period T p =. s (wave steepness s op =.) Mean period T m =. s (T p =. T m )
9 . Wave overtopping discharge and volumes The seaward slope of the dike is taken at :. For further calculations a storm duration of hours is assumed. With these values and the wave conditions from section. wave overtopping can calculated for a given crest freeboard. Overtopping equations are given in TAW (). They will not be repeated here. The mean overtopping discharges mainly considered during the safety assessments or design of dikes are., and l/s per m width. For ComCoast also larger overtopping discharges are of interest, such as and l/s per m and maybe even l/s per m. TAW () gives the possibility to calculate for each given mean overtopping discharge: the percentage of overtopping waves and the distribution of overtopping volumes per wave, including the maximum volume of overtopping. With above chosen wave boundary conditions the %-run-up is. m above still water level. If the crest level is equal to this %-run-up level, the overtopping discharge becomes. l/s per m. This is certainly more than the lowest limit of. l/s per m, but still below the value of l/s per m. As only % of the waves reach the crest, only waves in a period of hours will overtop the crest. This means in average waves per hour or an overtopping event every minutes. With the chosen wave height of m the following values can be calculated: H s = m; T p =. s; T m =. s q =, l/s per m q = l/s per m q = l/s per m Percentage overtopping... Number of waves in hours Number of overtopping waves Maximum overtopping volume l/m l/m l/m The main difference is the number of overtopping waves. With. l/s per m only waves will overtop in hours (one every minutes). For l/s per m this is almost (in average every s an overtopping event). In order to get an idea of the variation if other boundary conditions would have been chosen, above table has also been produced for a higher and lower wave height than m. H s = m; T p =. s; T m =. s q =, l/s per m q = l/s per m q = l/s per m Percentage overtopping,.. Number of waves in hours Number of overtopping waves Maximum overtopping volume l/m l/m l/m H s = m; T p =. s; T m =. s q =, l/s per m q = l/s per m q = l/s per m Percentage overtopping,.. Number of waves in hours Number of overtopping waves - Maximum overtopping volume - l/m l/m l/m
10 It is clear that a lower wave height of m gives far more overtopping waves to produce the same mean overtopping discharge, but with much lower volumes. The opposite is true for a much larger wave height of m. For. l/s per m only one or two waves will overtop. Above tables only give the maximum overtopping volume in a storm. But overtopping volumes in overtopping waves follow a certain distribution. It is this distribution which should be generated by the simulator and preferably schematized to a fixed number of overtopping volumes as it will be difficult, and also not required, to generate exactly each volume individually. An example is given in Figure. for l/s per m. during hours and for a wave height of m. Around waves will overtop in these hours, which means around per hour. The overtopping volumes could be simulated as follows: waves with l per m waves with l per m waves with l per m waves with l per m waves with l per m overtopping volume per wave (liters per m width) calculation simulation waves with l per m waves with l per m waves with l per m waves with l per m waves with l per m l/s per m Number of overtopping waves in ascending amount Figure.. Calculated distribution of overtopping volumes and proposal for simulation. Mean discharge q = l/s per m Of course the volumes should be generated in arbitrary order. Similar graphs can be made for each prescribed overtopping condition. Figure. gives the small overtopping discharge of. l/s per m. Actually here every individual volume could be simulated instead of schematised. Figures.. give and l/s per m, with both a detailed graph for the large volumes.
11 overtopping volume per wave (liters per m width) calculation simulation waves with l per m waves with l per m waves with l per m wave with l per m. l/s per m Number of overtopping waves in ascending amount Figure.. Calculated distribution of overtopping volumes and proposal for simulation. Mean discharge q =. l/s per m overtopping volume per wave (liters per m width) calculation simulation waves with l per m waves with l per m gwaves with l per m waves with l per m waves with l per m waves with l per m l/s per m Number of overtopping waves in ascending amount Figure.. Calculated distribution of overtopping volumes and proposal for simulation. Mean discharge q = l/s per m, full distribution
12 overtopping volume per wave (liters per m width) calculation simulation waves with l per m waves with l per m waves with l per m waves with l per m waves with l per m waves with l per m l/s per m Number of overtopping waves in ascending amount Figure.. Calculated distribution of overtopping volumes and proposal for simulation. Mean discharge q = l/s per m, full distribution of largest volumes overtopping volume per wave (liters per m width) calculation simulatie waves with l per m waves with l per m waves with l per m waves with l per m waves with l per m waves with l per m l/s per m Number of overtopping waves in ascending amount Figure.. Calculated distribution of overtopping volumes and proposal for simulation. Mean discharge q = l/s per m, full distribution
13 overtopping volume per wave (liters per m width) calculation simulation waves with l per m waves with l per m waves with l per m waves with l per m waves with l per m waves with l per m l/s per m Number of overtopping waves in ascending amount Figure.. Calculated distribution of overtopping volumes and proposal for simulation. Mean discharge q = l/s per m, distribution of largest volumes. The size of the box of the overtopping simulator determines the maximum overtopping volume which can be generated. Based on the maximum volumes for l/s per m and a transportable size of the simulator, the cross-section has been designed to a surface of. m, giving a maximum overtopping volume of. m per m with. It is, however, well possible that a larger mean discharge than l/s per m can be generated, may be up to l/s per m, but the maximum overtopping volume exceeding the size of the box can then not be generated. But instead more volumes with the maximum contents of the box could be simulated.. Velocities and flow depth at the crest The distribution of overtopping volumes, as described in section., gives for the overtopping simulator how often it should be filled with a certain volume. These volumes will then be released onto the crest and should give a behaviour close to reality. But what is this reality? The volume of overtopping water flows fast and in a limited time over the crest and inner side of the dike. For the overtopping simulator only the behaviour at the crest is important, as the behaviour on the inner slope will follow automatically. Recent information is available on velocities and flow depth at the crest of a dike. Schüttrumpf and Van Gent,, give formulae for the maximum velocity and maximum flow depth on a location on the crest. h h c,% A,%( Rc ) * xc = exp( cc, k ) (.) B
14 u u c,% A,%( Rc ) * xc. f = exp( cc, u ) (.) h c,% where: h c,% h A,%(Rc) c * c,h x c B u c,% u A,%(Rc) c * c,u = flow depth at the crest exceeded by % of the incident waves = flow depth at outer slope, reached by % of the incident waves = empirical coefficient = location on the crest from the edge of the outer slope = crest width = velocity at the crest exceeded by % of the incident waves = velocity at the outer slope exceeded by % of the incident waves = empirical coefficient f = friction coefficient (smooth slope f =.) The empirical coefficient c * c,h was different for Schüttrumpf () than for Van Gent () and amounted to c * c,h =. and., respectively. For the velocity the same value of c * c,u =. was found. The flow depth and velocity at the outer slope (and transition to the crest) are related to the %- run-up level and can be calculated by: h A,% * u % = c A, h H s R H R R u A,% * u % = c A, u gh s s H c R s c (.) (.) where: R u% R c = %-run-up level = crest freeboard The empirical coefficients c * A,h and c * A,v were established in two separate investigations: Schüttrumpf () and Van Gent (). The coefficients found were c * A,h =. and. and c * A,u =. and., respectively. The coefficients for the maximum velocity are similar, but for the flow depth a factor more than is present. For the time being both values for this coefficient will be used. For the maximum velocity an average value of c * A,u =. will be used. Above equations are only valid for %-values. It is possible to find maximum flow depths and velocities for each percentage, and therefore also for each overtopping volume, if the Rayleigh distribution is assumed for wave run-up. The %-run-up values can be calculated by TAW () or PC-Overtopping. PC-Overtopping was used here, including the safety margin in the programme (the option compare with measurements was not used). Assuming the Rayleigh distribution for run-up, the following equation gives the run-up level for each exceedance percentage, based on the %-run-up level.
15 ln( Povx ) R u, x = Ru,% (.) ln(.) where: R u,x = run-up level exceeded by probability x (between and ) = probability of exceedance x P ovx With the distribution of overtopping volumes (Section.) each overtopping volume for a specific overtopping discharge can be related to its corresponding run-up level R u,x with equation.. This level R u,x should replace R u% in equations. and. in order to calculate the maximum flow depth and velocity at the outer crest line, ie the transition from outer slope to the crest. Equations. and. can then be used to calculate flow depth and velocity at another location on the crest. For example, a volume of l/m in an overtopping discharge of l/s per m, gives a probability of exceedance of P ov =. (it is the -th largest overtopping wave during hours = waves). This gives with equation. a run-up level of. m. The velocity at the outer crest line becomes. m/s (equation.) and the flow depth according to Schüttrumpf (), equation.,. m. The velocity and flow depth. m from the crest (equations. and.) become. m/s and. m. It can be concluded that the maximum velocity decreases only a little over the crest, but the flow depth decreases drastically. Similar calculations were performed for other overtopping volumes and other mean discharges. Figures.. give the results. Figure. shows the maximum velocities for overtopping discharges of ; and l/s per m at the outer crest line. All three mean overtopping discharges give similar velocities for the same volumes per wave overtopping. Also from theoretical reasoning one would expect this, as the same overtopping volume itself is more or less independent from the mean overtopping discharge. An overtopping event with l/m in a l/s per m discharge should behave similar as a l/m event in a l/s per m discharge. The difference is of course that the larger discharge will have more of these events, but the event itself should not be too different. velocity u at crest (m/s) u ( l/s) u ( l/s) u ( l/s) overtopping volume V per wave (liters/m) Figure.. Maximum velocities at the outer crest line as a function of the overtopping volume per wave; H s = m, T p =. s, tanα =.
16 Maximum velocities are about -. m/s for small volumes of l/m and they increase to velocities of about. m/s for l/m and up to a maximum of -. m/s for an overtopping volume of l/m. Figure. gives the flow depth at the outer crest line, both for Schüttrumpf () and Van Gent (). The S and V in the Figure give both authors. As mentioned earlier, the differences are more than a factor, which indicates somewhere an error in measurement or analysis. Finally, Figure. shows the difference in flow depth at the outer crest line and. m from this line on the crest, using the Van Gent () coefficients. flow depth at crest (m).... h-s (/s) h-s (/s) h-s (/s) h-v (/s) h-v (/s) h-v (/s). overtopping volume V per wave (liters/m) Figure.. Maximum flow depths at outer crest line according to Schüttrumpf () and Van Gent (), and applied for H s = m, T p =. s, tanα =. and various overtopping discharges flow depth at crest and. m (m) h-v (/s) h-v (/s) h-v (/s) h-v at. m (/s) h-v at. m (/s) h-v at. m (/s) overtopping volume V per wave (liters/m) Figure.. Maximum flow depth at the crest and at. m from the crest, according to Van Gent, ; applied for H s = m, T p =. s, tanα =. and various overtopping discharges
17 It is clear that the maximum flow depth is not a very reliable parameter. The only reason why the flow depth at the crest line is so much higher than a few meters further on the crest is probably that the velocity on the outer slope has an upward component, where the velocity further on the crest becomes horizontal. The wave jumps over the outer crest line. Based on Figure. the following relationship between overtopping volume and maximum flow velocity can be assumed: Overtopping volume (l/m) max. flow velocity (m/s)
18 Design of wave overtopping simulator Overtopping waves are random in time and give different overtopping volumes/m per overtopping event. Given such an overtopping volume, the water flows with a certain velocity over the crest and inner slope of the dike, with a certain flow depth and in a certain time. The overtopping simulator should simulate the right velocity and flow depth in time at the crest of the dike, for a given overtopping volume. Overtopping volumes will vary between l/m and l/m. Roughly the velocities will vary between m/s up to around m/s. The simulator should be designed in such a way that it will simulate indeed the prescribed velocities and flow depths in time for a given overtopping volume. The following aspects have been considered for the technical design of the device: maximum volume:. m /m ( m wide). shape of the box: as high and slender as possible, in order to reach the large velocities for large volumes opening of the valve: maximum. m, to be adjusted during calibration. possibility to place the device at different heights with respect to the crest: legs of m length. shape of transition slope; to be adjusted during calibration The pressure height above the valve determines the flow velocity at the valve (Bernoulli). As first approximation of the velocity at the valve the following equation can be used: u = gx (.) where x = the pressure height. Given the overtopping volumes and required velocities at the crest from Chapter, the required pressure height and corresponding average width of the box can be calculated. Overtopping maximum pressure average volume (l/m) flow velocity (m/s) height (m) width (m) The average shape for each overtopping volume is given in Figure. by thin lines. Small overtopping volumes need small pressure heights and small widths. The large overtopping volumes need a fairly large height and still a fairly small width. These theoretical considerations give a slender type of box. The velocities have been calculated directly at the crest. In reality space is required for a transition slope in order to change the direction of the velocity from vertical to horizontal. For this reason the valve will be a certain distance above the crest of the dike. In order to have the small volumes as close as possible to the crest and still have enough pressure height for the large
19 volumes, the shape in Figure. has been chosen for the design. The box can vary in height by adjustable legs, Figure. gives two examples at heights of. m and. m. Figure. gives the measures of the box of the overtopping simulator. A butterfly valve of. m width has been designed in the lowest horizontal part of the box. The box has been designed on four legs and is adjustable in height from. m to. above the crest. The transition box was made of steel and had dimensions of m long, m wide and. m high. The rear side had the shape of a quarter circle with a radius of. m. During the calibration the bottom was enlarged from to. m, see the analysis of the tests.. l. l l. l l. m. l l. m Figure.. Theoretical cross-sections of box of wave overtopping simulator for each overtopping volume and final choice at two heights
20 Figure.. Cross-section of the overtopping box
.")

21 Construction of prototype A prototype of the wave overtopping simulator has been constructed by Nijholt Staal- & Machinebouw at Heerenveen, See Figure.. The mechanical design has been made by G. van der Meer. The prototype is a full cross-section of the wave overtopping simulator, but only m wide (the actual wave overtopping simulator will be m wide). For calibration of the device this m is enough. The prototype has been designed in such a way that it is fairly easy to modify parts of the structure if required during calibration (for example modifying the opening of the valve, modifying the transition slope or changing the height above the crest). The calibration set-up was constructed by four students of the Noordelijke Hogeschool Leeuwarden with help of Nijholt. The location of the calibration was at a parking place of Nijholt, where water from a ditch is available and used water will disappear into a sewage system. See pictures.. and Figure. for an overall view of the construction of the prototype and setup of the calibration site. Picture.. Construction of prototype Picture.. Bottom of prototype with valve
22 Figure.. Working drawing for mechanical construction


23 Picture.. Construction of m long and m wide calibration flume Picture.. Available pumps ( and l/s)


24 Picture.. Set-up of calibration flume, surrounded by sand bags Picture.. Location of calibration site
25 Figure.. Set-up of calibration site.
26 Set-up of calibration In Chapter formulae are given for flow velocities and flow depths at the crest of a dike, given the overtopping volume in a wave. These are all maximum values. There is quite a difference in predicted flow depth between the investigations of Schüttrumpf and of Van Gent (). Predicted flow velocities are similar. This means that actually the only fairly well known parameter at the crest will be the maximum velocity. Besides maximum flow velocities and flow depths, there is also the variation in time. Till now published research has not been focussed on this item. A sea state with a peak period of seconds will give another time record of overtopping waves than a long period of s, both with the same wave height. The wave period (or actually the wave steepness) has influence on the time record of overtopping and this might well be the reason for the small differences in flow velocity in Figure.. The prototype of the wave overtopping simulator must actually simulate the expected time record of flow velocity and flow depth and not only the maximum values. For this reason a small elaboration was made on existing research. Dr Schüttrumpf was asked to supply the raw test data of a few tests he performed with regular waves. The reason to choose tests with regular waves was that it is easier to measure the actual overtopping volumes per waves for regular waves than for random waves. For regular waves each overtopping wave should give the same overtopping volume and it is easy to average the discharge over a number of waves than to measure the overtopping volume for one wave only. The data with software for processing was submitted by Dr Schüttrumpf. Four tests were selected from the available set, choosing tests with small to large overtopping and a wave period as close as possible to - s. Some of the tests, however, were only available with a longer period of. s. From each test the record for waves was chosen (in order to show the similarity of the regular waves) and the flow velocity and flow depth in time were elaborated. Figures.. show the records, starting with the largest overtopping. First of all the maxima as given by Schüttrumpf (see legend of figures) are not the true maxima. They are always a little lower. Further, the overtopping duration is longer for larger overtopping, but also longer for longer wave periods: Test wave period (s) mean discharge (l/s/m) overtopping duration (s) < Certainly for the largest overtopping the records have more or less a triangular shape. The flow velocity and flow depth in time give also a good idea of the overtopping volume, just by integration. A quick way is to assume a triangular shape and calculate the overtopping volume by: V = / v max d max t, where t = the total time water flows over the crest at a certain location. The four selected tests give the following figures:
27 Test v max (m/s) d mx (m) t (s) V calculated (l/m) V measured (l/m) Flow depth m on crest. Flow depth [m] Time [s].. velocity at m from crest Velocity [m/s] Time [s] Figure.. Time records of flow depth and flow velocity at the crest. Tests by Schüttrumpf. Regular waves. Test. H =. m, T =. s. Measured overtopping discharge was. l/s per m and maximum flow depth. m
28 The difference between calculation from the time record and directly measured overtopping is about a factor for the large overtopping and even much more for the smallest ones! This may be a reason for the large difference in flow depth (about a factor ) between Schüttrumpf and Van Gent. If flow depths in reality are only half of the flow depths measured by Schüttrumpf, then calculated and measured volumes come much closer. But what can have caused this difference?. Flow depth at m from crest. Flow depth [m].... Time [s]. velocity at m from crest. Velocity [m/s].... Time [s] Figure.. Time records of flow depth and flow velocity at the crest. Tests by Schüttrumpf. Regular waves. Test. H =.m, T =. s. Measured overtopping discharge was. l/s per m and flow depth. m
29 Only contact with Schüttrumph and with Van Gent and more elaboration on this matter can solve this question. The firm conclusion is that measured records of flow velocity and flow depth by Schüttrumpf do not match the direct measurements of overtopping volume or discharge. A tentative conclusion might be that maybe something was wrong with the measurements of flow depth and that the predictions of Van Gent are closer to reality. It is strongly suggested to spend more time on this issue and to solve it. A possible way might be to take the measurements of Van Gent () and elaborate a relationship for flow time and shape of the flow... Flow depth at m from crest Flow depth [m] Time [s].. velocity at m from crest Velocity [m/s] Time [s] Figure.. Time records of flow depth and flow velocity at the crest. Tests by Schüttrumpf. Regular waves. Test. H =. m, T =. s. Measured overtopping discharge was. l/s per m and flow depth. m
30 It is fairly essential for the calibration of the prototype of the wave overtopping simulator to solve the problem and to have correct predictions (but it is outside the scope of this project). For the time being the calibration will be based mainly on the flow velocity and only partly on flow depth (taking predictions by Van Gent) and assuming maximum flow times of about.. T p for larger overtopping volumes (around - s) and.. T p for smaller overtopping volumes (- s). Flow depth at m from crest.. Flow depth [m]..... Time [s] velocity at m from crest Velocity [m/s] Time [s] Figure.. Time records of flow depth and flow velocity at the crest. Tests by Schüttrumpf. Regular waves. Test. H =. m, T =. s. Measured overtopping discharge was. l/s per m and flow depth. m

31 Volumes to be simulated by the wave overtopping simulator will vary between about l per m and maximum l per m. Based on Figure. with the predicted overtopping flow velocities the following targets were set for the simulator to be met, where model uncertainty of the prediction has been taken into account: Overtopping volume (l/m) flow velocity (m/s) range (m/s) flow time t (s) The simulator was calibrated at Nijhof Staal- & Machinebouw. An empty part of the parking place was used which was situated along a ditch with clean water, see Figure.. The dike crest was simulated by a m long and m wide flume with a height of. m. After the m the water could flow freely to the sewage system. Two pumps were available, one of l/s and one of l/s. Both could be used at the same time to fill up the simulator to a required volume. See Pictures. and. for an overall view. Picture.. Overall view of calibration set-up

32 Picture.. Rear side of wave overtopping simulator
33 Calibration. Description of test series After construction of the prototype of the wave overtopping simulator and after set-up of the test site the prototype could be calibrated. The objective of the calibration was to modify the prototype, including the transition, in such a way that each volume would generate the right flow velocity and flow time, as given in Chapter. The set-up height (difference between bottom box and crest) started with. m. The first volume to be tested was V = l Then smaller volumes were tested with the same set-up height and subsequently larger volumes. The maximum set-up height of m was tested and subsequently the minimum height of. m. Possible modifications were the speed to open the valve, the final opening width of the valve, the size of the valve (maximum as constructed was. m), the shape of the transition slope, roughness on the transition slope and other set-up heights of the simulator. Figure. gives an overall view of the parameters that have been changed: the height of the valve above the crest, h, the angle α which the transition slope makes with the crest, the length l of the transition slope, and the width, w, to which the valve was opened (maximum. m). Figure.. Set-up of prototype with measures of parameters changed during calibration A series of tests consisted of various measurements with different volumes in the box, but with only one unique set-up as given in Figure.. Test series were named C K (test series A and B being trials which are not reported here). Each test in a series got the extension of the volume in liters in the box and a test number. For example test C- is a test in series C with l in the box and test number in the series. An overall view of each test series is given in Table.. Pictures.. give snapshots of a few tests, both for the very large volumes and the small volumes.


 Set-up")
 Opening")


34 Table.. Overall view of test series Test series Height of valve h w.r.t. crest (m) Angle α w.r.t. crest (º) Set-up of transition Length l transition (m) Opening valve w (m), with maximum, m C,,, D,,, E,,, G,,, H,,, I,,, J,,, K,,, Picture.. Front view of test with l

35 Picture.. Side view of test with l

 was rented from WL")
.")
 and.")


36 Picture.. Front view of test with l Picture.. Front view of test with l. Measurements with the instrumentation An electro magnetic velocity meter (EMS) was rented from WL Delft Hydraulics, together with an acoustic depth meter (LDM). The EMS was placed cm above the bottom of the flume (or dike crest) and. - m from the end of the transition slope of the simulator. The depth meter was placed about. m above the bottom of the flume at the same location. A meter scale was placed at the wall of the flume. See pictures.. for an impression. After some trials with the overtopping simulator and first measurements some doubts arose about the correctness of the measurements of the flow depth. Therefore the instruments were calibrated. A small flume was made. m wide and the largest pump was guided to this flume (about l/s). The flow depth was measured manually and amounted to. m. The EMS measured a velocity of. m/s +/-. m/s. This means a discharge of.*.*.* = l/s. This is very close to the discharge of the pump. It was concluded that the EMS worked well for this condition.


37 Picture.. Instruments, away from prototype Picture.. Instruments, towards prototype Picture.. Acoustic flow depth meter Picture.. Electromagnetic velocity meter EMS
38 The depth meter measures the surface with an acoustic signal which reflects back to the device. Knowing the distance to the bottom of the flume (a constant signal if no water was running), the flow depth was determined if the measured signal was subtracted from this constant distance. Both pumps were directly guided to the flume and the flume was made narrower at the location of the LDM. The flow was laminar with no air entrainment and amounted to.. cm measured manually. The measured flow depth by the LDM was.. cm. It was concluded that for small flow depths without air entrainment the flow depth was measured correctly. Then flow simulations were performed and both manually and digitally velocities and flow depth were measured. Tests C had water volumes of l and the simulations were repeated times. Figure. shows the records of velocity and flow depth of tests C-. The actual simulation takes place from about t = s to or s. After that flow depths are almost zero and the EMS gives spikes as it is not submerged anymore. The maximum velocity measured is. m/s. The maximum flow depth measured is at least. m and sometimes more than. m. The maximum flow depth was also recorded manually at the side wall of the flume at the location of the flow depth meter. In all tests with l the maximum flow depth was.. m. By no means flow depths of. or. m were seen. The flow is highly turbulent with a lot of air entrainment and the surface is not smooth. At the end of the simulation the flow has less air and is less turbulent. It was concluded that the flow depth meter can not measure correctly the flow depth when the flow is so turbulent. Probably the part after. s was measured correctly. velocity flow depth Flow depth (m) Figure.. Records for test C- After s the velocity drops suddenly from about m/s to zero. This is the time when the EMS is not longer submerged and the flow depth becomes smaller than about - cm. The front velocity of the flow was also measured manually. The time was recorded between the point where the water passed the end of the transition slope and a point. m further. Measured times were.-. s, giving velocities of this front of. m/s. The maximum velocity in Figure. is. m/s and this is well in the manually measured range. It was concluded again that the EMS was able to measure the velocities correctly. Another check was done on the measurements. For each of the six C tests the records of velocity and flow depth were multiplied and integrated over time. This was done only over the relevant time period, from start of the flow to the drop of the velocity where the flow depth becomes very small. In Figure. this was from t =.. s. This integration gives a calculation of the total volume. Calculated volumes for the six tests were:.,.,.,.,. and. m, where the actual volume in the simulator was m. This check shows that the
39 flow depth was measured at least times larger than the actual flow depth. It was concluded that the flow depth could not be measured correctly, but the signal was useful to determine the flow time t in combination with the velocity record. Another small disadvantage was that the frequency of the measurements was limited to Hz (four measurements per second). But it was concluded that within the total scatter of the measurements and repetition of tests this was acceptable. For the measurements on the dike, however, it is proposed to use a sampling frequency of at least Hz. A final check was made with help of Figure.. The shape of the records are more or less triangular, which means that the following equation can be applied: V = / v max d mas t (.) With V = m, v max =. m/s and t =. s the maximum flow depth becomes d max =. m. This is similar to the flow depth of.. m, which was measured manually. Required: velocity. - (.) -. m/s flow time t:. -. s C- C- C- C- C- C- Figure.. Velocity measurements for C (V = m ) The relevant parts of the velocity records of tests C were placed in one graph, starting at t = s. This graph is shown in Figure.. The records are quite similar, which means that the flow simulation can be repeated quite well. The required velocity and flow time (see Chapter ) are mentioned too. The recorded velocity of around. m/s is well in the required range of.. m/s. The flow time is between. and. s, which is slightly longer than the required flow times of.. s. It was concluded that with the height of the simulator of. m this volume gave more or less the flow simulation that was required, except that the flow time was a little too long. After this first successful series of calibration tests C it was concluded that: - The flow depth can not be measured correctly, but the signal is helpful to determine the flow time t in combination with the velocity record. - The maximum flow depth should be recorded manually. - The simulator height of. m gives indeed good simulations for a volume of m. - Flow times in general are too large or a little too large with this set-up C.
40 . Analysis of calibration tests An overall view of the test series was given in Table.. From the beginning of the testing it became clear that water under high pressure (certainly with the large volumes) will spread as soon as the valve opens. Side skirts were placed along the transition slope to keep the water within the limits of m wide. From the first measurements C it became also clear that the valve should open as quickly as possible in order to decrease the flow time. A manual system was invented with pulleys and ropes, which made it possible to close the valve quickly and well (in order to prevent leakage) and to open it very quickly. This system worked well, but the real simulator should of course have a hydraulic system to open and close the valve. Also various openings of the valve were tested, but at the end the conclusion was that the valve should always open to its full width of. m. All measurements performed have been tabled in Appendix and the composed velocity measurements have been given in Appendix. The maximum flow velocity and the flow time were taken from the measurements and given in Appendix. The flow depth in this appendix was measured manually. Finally, the volume calculated with equation. was given and this figure should be more or less close to the actual volume in the simulator. Appendix gives for each test series with similar volume also the average values. These average values have been accumulated in Table., which gives a good overall view of all the results of the calibration. The left half of Table. gives the set-up of the test series, see also Section.. Then the volume in the simulator is given with next the calculated volume from the records. The next columns give the measured maximum flow velocity with the required range. The maximum flow depth, measured manually, is given then and in the last columns the measured flow time compared with the estimated range. Based on Table. a few observations can be made, which were also noticed during calibration. Test series C gave too large flow times and also the velocities were too high for the small volumes. Test series D gave smaller flow times, but still the flow velocity was too high for l and for the large volumes of l and l the flow was very turbulent and more or less uncontrolled, which gave a deviation in actual and calculated volume in the simulator. Test series E gave too large flow times. Test series G and H were performed with a low set-up level of the box. Surprisingly the flow velocities for the small volumes were too high. For the larger volumes the flow was highly turbulent giving large differences between actual and calculated volumes. Test series I and J had a large set-up height. The height induced a steep and long transition slope and the simulation became less controlled. In test series I for example the volumes of l gave in average larger velocities, but still shorter flow times, than the larger volumes l. For the final test series it was decided to return to the set-up height of. m and to guide the flow leaving the valve as good as possible by a skirt in front of the valve. The transition slope was also a little longer than in the first series and the angle with the crest was degrees. This final test series will be described more in detail. Figures.. give all composed velocity measurements.
41 Test series Height of valve above crest h (m) Angle α of transitions slope (º) Length of transition slope (m) Maximum opening of valve w (m) Volume V in simulator [liter] Volume V (liter) according to /*v*d*t Max. velocity v [m/sec] Max. velocity v required [m/s] C D E G H I J K Max. flow depth [m] Flow time t [s] Flow time t;estimated [s] Table.. Overall view of test results. Values are averaged values of a certain number of tests, see for details Appendix and.
42 Required: velocity. - (.) -. m/s flow time t:. -. s K- K- K- K- Figure.. Flow velocities for test series K Required: velocity. - (.) -. m/s flow time t:.. s K- K- K- K- K- K- Figure.. Flow velocities for test series K Required: velocity. - (.) -. m/s flow time t:.. s K- K- K- K- Figure.. Flow velocities for test series K
43 Required: velocity. - (.) -. m/s flow time t:.. s K- K- K- K- K- Figure.. Flow velocities for test series K Required: velocity. - (.) -. m/s flow time t:. -. s K- K- K- K- K- Figure.. Flow velocities for test series K Required velocity. - (.) -. m/s flow time t:.. s K- K- K- K- K- Figure.. Flow velocities for test series K
44 Required: velocity. - (.) -. m/s flow time t:.. s K- K- K- K- K- K- K- Figure.. Flow velocities for test series K Required: velocity. - (.) -. m/s flow time t:.. s K- K- K- K- K- K- K- K- K- K- Figure.. Flow velocities for test series K Table.. Final results for test series K Test Volume V in simulator [liter] Volume V (liter) according to /*v*d*t Max. velocity v [m/sec] Max. velocity v required [m/s] K K K K K K K K Max. flow depth [m] Flow time t [s] Flow time t;estimated [s]
45 The comparison of required flow velocity and flow time for this test series K is given in Table.. Flow velocities are within the required range or close to it. Flow times are almost all within the estimated range they should be. This range is, however, only based on physical reasoning and not on research. Also calculated volumes are quite close to the actual volumes. The maximum flow depths, measured visually, show a constant increase with increasing volume. Overall it can be concluded that the set-up for test series K give the required performance of the wave overtopping simulator.. Simulation of wave overtopping in real time Till now the prototype of the wave overtopping simulator was calibrated with single volumes. Wave overtopping in reality is a certain time period where volumes of water come over the crest in a random way. Section. describes the distribution of overtopping volumes in a certain period and for a certain overtopping discharge. The volumes should be randomly distributed in a real time simulation. In reality waves come in wave groups and it is well possible that large overtopping waves are accompanied by other fairly large overtopping waves. This is different for the wave overtopping simulator. A mean discharge is pumped into the simulator and released when the required volume has been reached. It takes longer time to fill up to the large volumes than the small volumes. The mean discharge and the wanted volumes determine the actual time between consecutive overtopping events. The pumps available had a capacity of l/s and l/s, combined l/s. The water was pumped into the box a little above the valve. With large volumes the water gave a pressure when exceeding the level of the intake. This reduced the pump capacity. Therefore the filling of the box to certain volumes (or levels) was calibrated with time. This calibration was used to create a real time simulation of about minutes. The order of overtopping volumes is given in Table.. The measured record of the flow velocity is given in Figure. and shows a large number of unwanted spikes, due to bubbles touching the EMS when there is no or hardly water. With help of the time in Table. the record can be screened, which is given in Figure.. Flow velocity (m/s) Figure.. Record for minutes real time wave overtopping simulation
THE WAVE OVERTOPPING SIMULATOR IN ACTION
 THE WAVE OVERTOPPING SIMULATOR IN ACTION Jentsje W. van der Meer 1, Patrizia Bernardini 2, Gosse Jan Steendam 3, Gert Jan Akkerman 4 and Gijs Hoffmans 5 The wave overtopping simulator is a device which
WAVE OVERTOPPING AND RUBBLE MOUND STABILITY UNDER COMBINED LOADING OF WAVES AND CURRENT
 WAVE OVERTOPPING AND RUBBLE MOUND STABILITY UNDER COMBINED LOADING OF WAVES AND CURRENT Sepehr Eslami A. and Marcel R.A. van Gent Coastal structures such as breakwaters are usually studied under wave loading
Keywords: dikes, levees, overtopping, flow depth, flow velocity, wave overtopping simulator, erosional index
 FLOW DEPTHS AND VELOCITIES AT CREST AND LANDWARD SLOPE OF A DIKE, IN THEORY AND WITH THE WAVE OVERTOPPING SIMULATOR Jentsje W. van der Meer, Bianca Hardeman, Gosse-Jan Steendam, Holger Schüttrumpf and
THE EFFECT OF VARIOUS DIKE REINFORCEMENT ALTERNATIVES ON THE FLOOD SAFETY ASPECTS OF THE DELTADIKE CONCEPT
 THE EFFECT OF VARIOUS DIKE REINFORCEMENT ALTERNATIVES ON THE FLOOD SAFETY ASPECTS OF THE DELTADIKE CONCEPT Preliminary Final Report Master Thesis Written by Simon den Hengst Delft, 08 December 2012 Recent
Cross-shore sediment transports on a cut profile for large scale land reclamations
 Cross-shore sediment transports on a cut profile for large scale land reclamations Martijn Onderwater 1 Dano Roelvink Jan van de Graaff 3 Abstract When building a large scale land reclamation, the safest
DESTRUCTIVE WAVE OVERTOPPING TESTS ON FLEMISH DIKES
 DESTRUCTIVE WAVE OVERTOPPING TESTS ON FLEMISH DIKES Gosse Jan Steendam 1, Patrik Peeters 2, Jentsje van der Meer 3, Koen van Doorslaer 4 and Koen Trouw 5 Breaching of dikes induced by wave overtopping
2. Water levels and wave conditions. 2.1 Introduction
 18 2. Water levels and wave conditions 2.1 Introduction This Overtopping Manual has a focus on the aspects of wave run-up and wave overtopping only. It is not a design manual, giving the whole design process
CHAPTER 132. Roundhead Stability of Berm Breakwaters
 CHAPTER 132 Roundhead Stability of Berm Breakwaters Jergen Juhl 1, Amir Alikham, Peter Sloth, Renata Archetti Abstract Three-dimensional (3D) model tests were carried out for studying the stability of
WAVE OVERTOPPING OF RUBBLE MOUND BREAKWATERS
 WAVE OVERTOPPING OF RUBBLE MOUND BREAKWATERS Mogens Hebsgaard 1, Peter Sloth 1, and tegen Juhl 2 Abstract A general expression for the overtopping discharge of a rubble mound breakwater has been derived
WAVE OVERTOPPING SIMULATOR TESTS IN VIET NAM
 WAVE OVERTOPPING SIMULATOR TESTS IN VIET NAM Le Hai Trung 1, Jentsje van der Meer 2, Gerrit Jan Schiereck 3, Vu Minh Cat 4, Gerben van der Meer 5. Sea dikes in Viet Nam have been built up during a long
Free Surface Flow Simulation with ACUSIM in the Water Industry
 Free Surface Flow Simulation with ACUSIM in the Water Industry Tuan Ta Research Scientist, Innovation, Thames Water Kempton Water Treatment Works, Innovation, Feltham Hill Road, Hanworth, TW13 6XH, UK.
INVESTIGATION OF WAVE AGITATION INSIDE THE NEW FISHERY PORT (CASE STUDY: NEW MRZOUKA FISHERY PORT, LIBYA)
") INVESTIGATION OF WAVE AGITATION INSIDE THE NEW FISHERY PORT (CASE STUDY: NEW MRZOUKA FISHERY PORT, LIBYA) Abdelazim M. Ali Researcher, The Hydraulics Research Institute, National Water Research Center,
INVESTIGATION OF WAVE AGITATION INSIDE THE NEW FISHERY PORT (CASE STUDY: NEW MRZOUKA FISHERY PORT, LIBYA) Abdelazim M. Ali Researcher, The Hydraulics Research Institute, National Water Research Center,
ROUNDABOUT CAPACITY: THE UK EMPIRICAL METHODOLOGY
 ROUNDABOUT CAPACITY: THE UK EMPIRICAL METHODOLOGY 1 Introduction Roundabouts have been used as an effective means of traffic control for many years. This article is intended to outline the substantial
Advanced Hydraulics Prof. Dr. Suresh A. Kartha Department of Civil Engineering Indian Institute of Technology, Guwahati
 Advanced Hydraulics Prof. Dr. Suresh A. Kartha Department of Civil Engineering Indian Institute of Technology, Guwahati Module - 4 Hydraulics Jumps Lecture - 4 Features of Hydraulic Jumps (Refer Slide
LABORATORY EXPERIMENTS ON WAVE OVERTOPPING OVER SMOOTH AND STEPPED GENTLE SLOPE SEAWALLS
 Asian and Pacific Coasts 23 LABORATORY EXPERIMENTS ON WAVE OVERTOPPING OVER SMOOTH AND STEPPED GENTLE SLOPE SEAWALLS Takayuki Suzuki 1, Masashi Tanaka 2 and Akio Okayasu 3 Wave overtopping on gentle slope
E. Agu, M. Kasperski Ruhr-University Bochum Department of Civil and Environmental Engineering Sciences
 EACWE 5 Florence, Italy 19 th 23 rd July 29 Flying Sphere image Museo Ideale L. Da Vinci Chasing gust fronts - wind measurements at the airport Munich, Germany E. Agu, M. Kasperski Ruhr-University Bochum
THE REDUCTION OF WAVE OVERTOPPING BY MEANS OF A STORM WALL
 THE REDUCTION OF WAVE OVERTOPPING BY MEANS OF A STORM WALL Koen Van Doorslaer 1,2, Julien De Rouck 1, Jentsje van der Meer 3,4 A second edition of the EurOtop manual, a manual on wave overtopping of sea
Keywords: Wave overtopping; wave run-up, wave overtopping simulator; testing on real dikes
 DESTRUCTIVE WAVE OVERTOPPING AND WAVE RUN-UP TESTS ON GRASS COVERED SLOPES OF REAL DIKES Gosse Jan Steendam 1, Yvo Provoost 2 and Jentsje van der Meer 3 In March 2011 new wave overtopping tests have been
UPDATE OF THE EUROTOP MANUAL: NEW INSIGHTS ON WAVE OVERTOPPING
 UPDATE OF THE EUROTOP MANUAL: NEW INSIGHTS ON WAVE OVERTOPPING Jentsje van der Meer 1 William Allsop 2, Tom Bruce 3, Julien De Rouck 4, Tim Pullen 5, Holger Schüttrumpf 6, Peter Troch 7 and Barbara Zanuttigh
Plan B Dam Breach Assessment
 Plan B Dam Breach Assessment Introduction In support of the Local Sponsor permit applications to the states of Minnesota and North Dakota, a dam breach analysis for the Plan B alignment of the Fargo-Moorhead
Currents measurements in the coast of Montevideo, Uruguay
 Currents measurements in the coast of Montevideo, Uruguay M. Fossati, D. Bellón, E. Lorenzo & I. Piedra-Cueva Fluid Mechanics and Environmental Engineering Institute (IMFIA), School of Engineering, Research
THE WAY THE VENTURI AND ORIFICES WORK
 Manual M000 rev0 03/00 THE WAY THE VENTURI AND ORIFICES WORK CHAPTER All industrial combustion systems are made up of 3 main parts: ) The mixer which mixes fuel gas with combustion air in the correct ratio
ITTC Recommended Procedures and Guidelines
 Page 1 of 6 Table of Contents 1. PURPOSE...2 2. PARAMETERS...2 2.1 General Considerations...2 3 DESCRIPTION OF PROCEDURE...2 3.1 Model Design and Construction...2 3.2 Measurements...3 3.5 Execution of
Broadly speaking, there are four different types of structures, each with its own particular function:
 3 The selection of structures 3.1 Introduction In selecting a suitable structure to measure or regulate the flow rate in open channels, all demands that will be made upon the structure should be listed.
Revisions to the EurOtop manual version 2. Writing EurOtop 2 why?
 Revisions to the EurOtop manual version 2 Life at the seaside: the sunny view Contents 1. Admissible 2. Summary of the changes 3. Calculation tools 4. Smooth slopes: dikes to vertical walls; zero freeboard,
Aalborg Universitet. Published in: Proceedings of Offshore Wind 2007 Conference & Exhibition. Publication date: 2007
 Aalborg Universitet Design Loads on Platforms on Offshore wind Turbine Foundations with Respect to Vertical Wave Run-up Damsgaard, Mathilde L.; Gravesen, Helge; Andersen, Thomas Lykke Published in: Proceedings
Technical Brief - Wave Uprush Analysis Island Harbour Club, Gananoque, Ontario
 Technical Brief - Wave Uprush Analysis RIGGS ENGINEERING LTD. 1240 Commissioners Road West Suite 205 London, Ontario N6K 1C7 October 31, 2014 Table of Contents Section Page Table of Contents... i List
THE WAVE CLIMATE IN THE BELGIAN COASTAL ZONE
 THE WAVE CLIMATE IN THE BELGIAN COASTAL ZONE Toon Verwaest, Flanders Hydraulics Research, toon.verwaest@mow.vlaanderen.be Sarah Doorme, IMDC, sarah.doorme@imdc.be Kristof Verelst, Flanders Hydraulics Research,
MODELING OF CLIMATE CHANGE IMPACTS ON COASTAL STRUCTURES - CONTRIBUTION TO THEIR RE-DESIGN
 Proceedings of the 14 th International Conference on Environmental Science and Technology Rhodes, Greece, 3-5 September 2015 MODELING OF CLIMATE CHANGE IMPACTS ON COASTAL STRUCTURES - CONTRIBUTION TO THEIR
Ermenek Dam and HEPP: Spillway Test & 3D Numeric-Hydraulic Analysis of Jet Collision
 Ermenek Dam and HEPP: Spillway Test & 3D Numeric-Hydraulic Analysis of Jet Collision J.Linortner & R.Faber Pöyry Energy GmbH, Turkey-Austria E.Üzücek & T.Dinçergök General Directorate of State Hydraulic
WAVE PRESSURE DISTRIBUTION ON PERMEABLE VERTICAL WALLS
 Abstract WAVE PRESSURE DISTRIBUTION ON PERMEABLE VERTICAL WALLS Hendrik Bergmann, Hocine Oumeraci The pressure distribution at permeable vertical walls is investigated within a comprehensive large-scale
Experimental Investigation on Changes of Water Surface Profile with Gaussian Shaped Bottom and Side Roughness
 Experimental Investigation on Changes of Water Surface Profile with Gaussian Shaped Bottom and Side Md. Rafiue Islam a, Shariful Islam b*, Md. Abdul Qaiyum Talukder c, S. M. Rezwan Hossain d Abstract Bed
23 RD INTERNATIONAL SYMPOSIUM ON BALLISTICS TARRAGONA, SPAIN APRIL 2007
 23 RD INTERNATIONAL SYMPOSIUM ON BALLISTICS TARRAGONA, SPAIN 16-20 APRIL 2007 AN INVESTIGATION INTO THE INTERRELATION BETWEEN THE INTERNAL AND EXTERNAL BALLISTICS OF FIRING A TP-T TANK AMMUNITION M. H.
Yasuyuki Hirose 1. Abstract
 Study on Tsunami force for PC box girder Yasuyuki Hirose 1 Abstract In this study, a waterway experiment was performed in order to understand the influence of tsunami forms on tsunami forces acting on
Is lung capacity affected by smoking, sport, height or gender. Table of contents
 Sample project This Maths Studies project has been graded by a moderator. As you read through it, you will see comments from the moderator in boxes like this: At the end of the sample project is a summary
Implementing Provisions for Art. 411 of the ICR Ski Jumping
 JUMPING HILLS CONSTRUCTION NORM 2018 Implementing Provisions for Art. 411 of the ICR Ski Jumping Author: Hans-Heini Gasser (SUI) EDITION NOVEMBER 2018 Table of Contents Page 1. Preliminary Remarks 3 2.
Thomas Lykke Andersen, Morten Kramer, Peter Frigaard November 2003
 Thomas Lykke Andersen, Morten Kramer, Peter Frigaard November 2003 HYDRAULICS & COASTAL ENGINEERING LABORATORY AALBORG UNIVERSITY DEPARTMENT OF CIVIL ENGINEERING SOHNGAARDSHOLMSVEJ 57 DK-9000 AALBORG DENMARK
Pressure coefficient on flat roofs of rectangular buildings
 Pressure coefficient on flat roofs of rectangular buildings T. Lipecki 1 1 Faculty of Civil Engineering and Architecture, Lublin University of Technology, Poland. t.lipecki@pollub.pl Abstract The paper
ANSWERS TO QUESTIONS IN THE NOTES AUTUMN 2018
 ANSWERS TO QUESTIONS IN THE NOTES AUTUMN 2018 Section 1.2 Example. The discharge in a channel with bottom width 3 m is 12 m 3 s 1. If Manning s n is 0.013 m -1/3 s and the streamwise slope is 1 in 200,
Advanced Hydraulics Prof. Dr. Suresh A. Kartha Department of Civil Engineering Indian Institute of Technology, Guwahati
 Advanced Hydraulics Prof. Dr. Suresh A. Kartha Department of Civil Engineering Indian Institute of Technology, Guwahati Module - 4 Hydraulic Jumps Lecture - 1 Rapidly Varied Flow- Introduction Welcome
HYDRAULIC JUMP AND WEIR FLOW
 HYDRAULIC JUMP AND WEIR FLOW 1 Condition for formation of hydraulic jump When depth of flow is forced to change from a supercritical depth to a subcritical depth Or Froude number decreases from greater
Model Test Setup and Program for Experimental Estimation of Surface Loads of the SSG Kvitsøy Pilot Plant from Extreme Wave Conditions
 Model Test Setup and Program for Experimental Estimation of Surface Loads of the SSG Kvitsøy Pilot Plant from Extreme Wave Conditions according to Co-operation Agreement (phase 4) between WAVEenergy (Norway)
HURRICANE SANDY LIMITED REEVALUATION REPORT UNION BEACH, NEW JERSEY DRAFT ENGINEERING APPENDIX SUB APPENDIX D SBEACH MODELING
 HURRICANE SANDY LIMITED REEVALUATION REPORT UNION BEACH, NEW JERSEY DRAFT ENGINEERING APPENDIX SUB APPENDIX D SBEACH MODELING Rev. 18 Feb 2015 1 SBEACH Modeling 1.0 Introduction Following the methodology
Wave Dragon A slack moored wave energy converter
 Wave Dragon A slack moored wave energy converter J. P. KOFOED 1, P. FRIGAARD 1, H. C. SØRENSEN 2 and E. FRIIS-MADSEN 3 1 Hydraulics and Coastal Engineering Laboratory, Aalborg University, Aalborg, Denmark.
CHAPTER 135. Influence of the core configuration on the stability of berm breakwaters. Nikolay Lissev 1 AlfT0rum 2
 CHAPTER 135 Influence of the core configuration on the stability of berm breakwaters Nikolay Lissev 1 AlfT0rum 2 Abstract An experimental study has been carried out to investigate the concept of extending
Study of Passing Ship Effects along a Bank by Delft3D-FLOW and XBeach1
 Study of Passing Ship Effects along a Bank by Delft3D-FLOW and XBeach1 Minggui Zhou 1, Dano Roelvink 2,4, Henk Verheij 3,4 and Han Ligteringen 2,3 1 School of Naval Architecture, Ocean and Civil Engineering,
WAVE OVERTOPPING AT BERM BREAKWATERS IN LINE WITH EUROTOP
 WAVE OVERTOPPING AT BERM BREAKWATERS IN LINE WITH EUROTOP Sigurdur Sigurdarson 1 and Jentsje W. van der Meer 2 The paper presents the development of a new overtopping formula for berm breakwaters. Overtopping
Stability of Cubipod Armoured Roundheads in Short Crested Waves Burcharth, Hans Falk; Andersen, Thomas Lykke; Medina, Josep R.
 Aalborg Universitet Stability of Cubipod Armoured Roundheads in Short Crested Waves Burcharth, Hans Falk; Andersen, Thomas Lykke; Medina, Josep R. Published in: Coastal Engineering 2010 Publication date:
Chapter 6: Santander case
 6 Santander case 6.1 Introduction Port activity in Santander dates back more than 2,000 years ago. Throughout this period, the sea and the port have been the fundamental elements of a community which,
Julebæk Strand. Effect full beach nourishment
 Julebæk Strand Effect full beach nourishment Aim of Study This study is a part of the COADAPT funding and the aim of the study is to analyze the effect of beach nourishment. In order to investigate the
WAVE IMPACTS DUE TO STEEP FRONTED WAVES
 WAVE IMPACTS DUE TO STEEP FRONTED WAVES Bas Buchner and Arjan Voogt Maritime Research Institute Netherlands (MARIN) b.buchner@marin.nl, a.j.voogt@marin.nl INTRODUCTION It is the question whether Rogue
Transactions on Ecology and the Environment vol 12, 1996 WIT Press, ISSN
 Open boundary condition for unsteady open-channel flow K. Mizumura Civil Engineering Department, Kanazawa Institute of Technology, 7-1 Ogigaoka, Nonoichimachi, Ishikawa Pref. 921, Japan Abstract Initial
Section 1 Types of Waves. Distinguish between mechanical waves and electromagnetic waves.
 Section 1 Types of Waves Objectives Recognize that waves transfer energy. Distinguish between mechanical waves and electromagnetic waves. Explain the relationship between particle vibration and wave motion.
Energy capture performance
 Energy capture performance Cost of energy is a critical factor to the success of marine renewables, in order for marine renewables to compete with other forms of renewable and fossil-fuelled power generation.
BEACH EROSION COUNTERMEASURE USING NEW ARTIFICIAL REEF BLOCKS
 BEACH EROSION COUNTERMEASURE USING NEW ARTIFICIAL REEF BLOCKS Kyuhan Kim 1, Sungwon Shin 1, Chongkun Pyun 2, Hyundong Kim 3, and Nobuhisa Kobayashi 4 Two-dimensional and three-dimensional laboratory experiments
FLOW CONSIDERATIONS IN INDUSTRIAL SILENCER DESIGN
 FLOW CONSIDERATIONS IN INDUSTRIAL SILENCER DESIGN George Feng, Kinetics Noise Control, Inc., 3570 Nashua Drive, Mississauga, Ontario Vadim Akishin, Kinetics Noise Control, Inc., 3570 Nashua Drive, Mississauga,
3. GRADUALLY-VARIED FLOW (GVF) AUTUMN 2018
 AUTUMN 2018") 3. GRADUALLY-VARIED FLOW (GVF) AUTUMN 2018 3.1 Normal Flow vs Gradually-Varied Flow V 2 /2g EGL (energy grade line) Friction slope S f h Geometric slope S 0 In flow the downslope component of weight balances
3. GRADUALLY-VARIED FLOW (GVF) AUTUMN 2018 3.1 Normal Flow vs Gradually-Varied Flow V 2 /2g EGL (energy grade line) Friction slope S f h Geometric slope S 0 In flow the downslope component of weight balances
PARAMETRIZATION OF WAVE TRANSFORMATION ABOVE SUBMERGED BAR BASED ON PHYSICAL AND NUMERICAL TESTS
 Proceedings of the 6 th International Conference on the Application of Physical Modelling in Coastal and Port Engineering and Science (Coastlab16) Ottawa, Canada, May 10-13, 2016 Copyright : Creative Commons
PROPAGATION OF LONG-PERIOD WAVES INTO AN ESTUARY THROUGH A NARROW INLET
 PROPAGATION OF LONG-PERIOD WAVES INTO AN ESTUARY THROUGH A NARROW INLET Takumi Okabe, Shin-ichi Aoki and Shigeru Kato Department of Civil Engineering Toyohashi University of Technology Toyohashi, Aichi,
Update: UNSW s Research Program for Extreme Waves on Fringing Reefs. Matt Blacka,Kristen Splinter, Ron Cox
 Update: UNSW s Research Program for Extreme Waves on Fringing Reefs Matt Blacka,Kristen Splinter, Ron Cox Overview Research Area 1: Extreme wave and water level processes for fringing reef coastlines Research
Grade: 8. Author(s): Hope Phillips
: Hope Phillips") Title: Tying Knots: An Introductory Activity for Writing Equations in Slope-Intercept Form Prior Knowledge Needed: Grade: 8 Author(s): Hope Phillips BIG Idea: Linear Equations how to analyze data from
Title: Tying Knots: An Introductory Activity for Writing Equations in Slope-Intercept Form Prior Knowledge Needed: Grade: 8 Author(s): Hope Phillips BIG Idea: Linear Equations how to analyze data from
Lab #21 - ORR: Resonance Tube
 Chapter 21 Lab #21 - ORR: Resonance Tube Introduction The vertical resonance apparatus is a device for helping the Physics student understand the principle of waves and resonance. In particular the study
International Journal of Innovative Research in Advanced Engineering (IJIRAE) ISSN:
 ISSN:") RANSMISSION COEFFICIEN (K) AND REFLECION COEFFICIEN () ON BREAKWAER YPE CUBE Setiyawan Department of Civil Engineering, adulako University, Palu, Central Sulawesi, Indonesia setiyawanvip@yahoo.co.id; Manuscript
RANSMISSION COEFFICIEN (K) AND REFLECION COEFFICIEN () ON BREAKWAER YPE CUBE Setiyawan Department of Civil Engineering, adulako University, Palu, Central Sulawesi, Indonesia setiyawanvip@yahoo.co.id; Manuscript
HYDRODYNAMICS AND MORPHODYNAMICS IN THE SURF ZONE OF A DISSIPATIVE BEACH
 HYDRODYNAMICS AND MORPHODYNAMICS IN THE SURF ZONE OF A DISSIPATIVE BEACH Leo C. van Rijn, Dirk Jan R. Walstra, Bart T. Grasmeijer and Kees Kleinhout Abstract: Two profile models have been compared with
International Journal of Technical Research and Applications e-issn: , Volume 4, Issue 3 (May-June, 2016), PP.
, PP.") DESIGN AND ANALYSIS OF FEED CHECK VALVE AS CONTROL VALVE USING CFD SOFTWARE R.Nikhil M.Tech Student Industrial & Production Engineering National Institute of Engineering Mysuru, Karnataka, India -570008
DESIGN AND ANALYSIS OF FEED CHECK VALVE AS CONTROL VALVE USING CFD SOFTWARE R.Nikhil M.Tech Student Industrial & Production Engineering National Institute of Engineering Mysuru, Karnataka, India -570008
Influence of rounding corners on unsteady flow and heat transfer around a square cylinder
 Influence of rounding corners on unsteady flow and heat transfer around a square cylinder S. K. Singh Deptt. of Mech. Engg., M. B. M. Engg. College / J. N. V. University, Jodhpur, Rajasthan, India Abstract
Observed Roughness Lengths for Momentum and Temperature on a Melting Glacier Surface
 5 Observed Roughness Lengths for Momentum and Temperature on a Melting Glacier Surface The roughness lengths for momentum and temperature are calculated on a melting glacier surface. Data from a five level
DESIGN OPTIMIZATION FOR A PASSIVE MESH SCREEN WAVE ABSORBER FOR THE CCOB
 DESIGN OPTIMIZATION FOR A PASSIVE MESH SCREEN WAVE ABSORBER FOR THE CCOB Christian Klinghammer 1, Pedro Lomónaco Tonda 1 and Pablo Higuera Caubilla 1 A new passive wave absorber, consisting of multiple
End of Chapter Exercises
 End of Chapter Exercises Exercises 1 12 are conceptual questions that are designed to see if you have understood the main concepts of the chapter. 1. While on an airplane, you take a drink from your water
The Masterplan Coastal Safety: a wave of opportunities
 The Masterplan Coastal Safety: a wave of opportunities In depth coastal research and state of the art maritime technology SPINCAM WEEK FLANDERS: OSTEND EVENT FEBRUARY 16-18th 2016 elias.vanquickelborne@mow.vlaanderen.be
DAMAGE STABILITY TESTS OF MODELS REPRESENTING RO-RC) FERRIES PERFORMED AT DMI
 FERRIES PERFORMED AT DMI") TECHNISCHE UNIVERSITET laboratoriurn vow Scheepshydromechareba slechlef Meketweg 2, 2628 CD. Delft Tel.: 015-788873 - Fax 015-781838 DAMAGE STABILITY TESTS OF MODELS REPRESENTING RO-RC) FERRIES PERFORMED
TECHNISCHE UNIVERSITET laboratoriurn vow Scheepshydromechareba slechlef Meketweg 2, 2628 CD. Delft Tel.: 015-788873 - Fax 015-781838 DAMAGE STABILITY TESTS OF MODELS REPRESENTING RO-RC) FERRIES PERFORMED
Undertow - Zonation of Flow in Broken Wave Bores
 Lecture 22 Nearshore Circulation Undertow - Zonation of Flow in Broken Wave Bores In the wave breaking process, the landward transfer of water, associated with bore and surface roller decay within the
WMO LABORATORY INTERCOMPARISON OF RAIN INTENSITY GAUGES
 WMO LABORATORY INTERCOMPARISON OF RAIN INTENSITY GAUGES Christophe ALEXANDROPOULOS and Muriel LACOMBE Météo-France, Direction des Systèmes d Observation, BP 202-78195 Trappes France christophe.alexandropoulos@meteo.fr
Undertow - Zonation of Flow in Broken Wave Bores
 Nearshore Circulation Undertow and Rip Cells Undertow - Zonation of Flow in Broken Wave Bores In the wave breaking process, the landward transfer of water, associated with bore and surface roller decay
SAND BOTTOM EROSION AND CHANGES OF AN ACTIVE LAYER THICKNESS IN THE SURF ZONE OF THE NORDERNEY ISLAND
 SAND BOTTOM EROSION AND CHANGES OF AN ACTIVE LAYER THICKNESS IN THE SURF ZONE OF THE NORDERNEY ISLAND Kos'yan R. 1, Kunz H. 2, Podymov l. 3 1 Prof.Dr.,The Southern Branch of the P.P.Shirshov Institute
KINEMATIC ANALYSIS OF SHOT PUT IN ELITE ATHLETES A CASE STUDY
 KINEMATIC ANALYSIS OF SHOT PUT IN ELITE ATHLETES A CASE STUDY Weimin Liu and Mingxuan Wang Jiangsu Research Institute of Sports Science, Nanjing, People's Republic of China This paper presented the application
MODELLING OF FUME EXTRACTORS C. R.
 LD8 19th International Symposium of Ballistics, 7 11 May 21, Interlaken, Switzerland MODELLING OF FUME EXTRACTORS C. R. Woodley WS4 Guns and Warheads Department, Defence Evaluation and Research Agency,
LABORATORY EXPERIMENTS FOR WAVE RUN-UP ON THE TETRAPOD ARMOURED RUBBLE MOUND STRUCTURE WITH A STEEP FRONT SLOPE
 Proceedings of the 6 th International Conference on the Application of Physical Modelling in Coastal and Port Engineering and Science (Coastlab16) Ottawa, Canada, May 10-13, 2016 Copyright : Creative Commons
Volume and Shoreline Changes along Pinellas County Beaches during Tropical Storm Debby
 Volume and Shoreline Changes along Pinellas County Beaches during Tropical Storm Debby Ping Wang and Tiffany M. Roberts Coastal Research Laboratory University of South Florida July 24, 2012 Introduction
SPH applied to coastal engineering problems
 2 nd Iberian Workshop Ourense, 3 rd and 4 th December 2015 SPH applied to coastal engineering problems (validating the SPH concept) ALTOMARE, CRESPO, DOMINGUEZ, SUZUKI http://www.flandershydraulicsresearch.be/
Pier 8 Wave Overtopping Analysis (65 Guise Street East) Our File:
 Our File:") Shoreplan Engineering Limited 55 Eglinton Avenue E., Suite 800 Toronto, ON Canada M4P 1G8 T) 416.487.4756 F) 416.487.5129 E) mail@shoreplan.com March 31, 2016 Mr. Ed English Senior Project Manager Waterfront
Shoreplan Engineering Limited 55 Eglinton Avenue E., Suite 800 Toronto, ON Canada M4P 1G8 T) 416.487.4756 F) 416.487.5129 E) mail@shoreplan.com March 31, 2016 Mr. Ed English Senior Project Manager Waterfront
EXISTING AND PLANNED STRATEGIES AND ACTIONS CONNECTED WITH COASTAL PROTECTION IN ASPECT OF PREDICTED SEA LEVEL RISE
 EXISTING AND PLANNED STRATEGIES AND ACTIONS CONNECTED WITH COASTAL PROTECTION IN ASPECT OF PREDICTED SEA LEVEL RISE Andrzej Cieślak Long term coastal protection strategy In 2000 a new 1 Polish long term
Instruction Manual. Pipe Friction Training Panel
 Instruction Manual HL 102 Pipe Friction Training Panel 100 90 80 70 60 50 40 30 20 10 HL 102 Instruction Manual This manual must be kept by the unit. Before operating the unit: - Read this manual. - All
Exemplar for Internal Assessment Resource Geography Level 3. Resource title: The Coastal Environment Kaikoura
 Exemplar for internal assessment resource Geography 3.5A for Achievement Standard 91430 Exemplar for Internal Assessment Resource Geography Level 3 Resource title: The Coastal Environment Kaikoura This
CHAPTER ONE HUNDRED NINETY FIVE
 CHAPTER ONE HUNDRED NINETY FIVE Wave Forces and Impacts on a Circular and Square Caisson J.W. van der Meer and E. Benassal Abstract The existing breakwater at Civitavecchia Harbour, Italy, will be extended
Cover Page for Lab Report Group Portion. Head Losses in Pipes
 Cover Page for Lab Report Group Portion Head Losses in Pipes Prepared by Professor J. M. Cimbala, Penn State University Latest revision: 02 February 2012 Name 1: Name 2: Name 3: [Name 4: ] Date: Section
PHYSICAL AND NUMERICAL MODELLING OF WAVE FIELD IN FRONT OF THE CONTAINER TERMINAL PEAR - PORT OF RIJEKA (ADRIATIC SEA)
") PHYSICAL AND NUMERICAL MODELLING OF WAVE FIELD IN FRONT OF THE CONTAINER TERMINAL PEAR - PORT OF RIJEKA (ADRIATIC SEA) DALIBOR CAREVIĆ (1), GORAN LONČAR (1), VLADIMIR ANDROČEC (1) & MARIN PALADIN (1) 1.
PHYSICAL AND NUMERICAL MODELLING OF WAVE FIELD IN FRONT OF THE CONTAINER TERMINAL PEAR - PORT OF RIJEKA (ADRIATIC SEA) DALIBOR CAREVIĆ (1), GORAN LONČAR (1), VLADIMIR ANDROČEC (1) & MARIN PALADIN (1) 1.
METHOD FOR ARTIFICIAL BEACH NOURISHMENT Henk Jan Verhagen 1
 CHAPTER 190 METHOD FOR ARTIFICIAL BEACH NOURISHMENT Henk Jan Verhagen 1 Why beach nourishment For a good design, the purpose of the nourishment has to be clearly defined. In general, there are three reasons
ESTIMATION OF THE DESIGN WIND SPEED BASED ON
 The Seventh Asia-Pacific Conference on Wind Engineering, November 8-12, 2009, Taipei, Taiwan ESTIMATION OF THE DESIGN WIND SPEED BASED ON UNCERTAIN PARAMETERS OF THE WIND CLIMATE Michael Kasperski 1 1
4: PROPERTIES OF WAVES Definition of Wave: A wave is a disturbance traveling in a medium.
 4: PROPERTIES OF WAVES Definition of Wave: A wave is a disturbance traveling in a medium. A. SMALL GROUP ACTIVITIES WITH SLINKIES Several basic properties of wave behavior can be demonstrated with long
STUDY ON TSUNAMI PROPAGATION INTO RIVERS
 ABSTRACT STUDY ON TSUNAMI PROPAGATION INTO RIVERS Min Roh 1, Xuan Tinh Nguyen 2, Hitoshi Tanaka 3 When tsunami wave propagation from the narrow river mouth, water surface is raised and fluctuated by long
Agood tennis player knows instinctively how hard to hit a ball and at what angle to get the ball over the. Ball Trajectories
 42 Ball Trajectories Factors Influencing the Flight of the Ball Nathalie Tauziat, France By Rod Cross Introduction Agood tennis player knows instinctively how hard to hit a ball and at what angle to get
Verification and Validation Pathfinder
 403 Poyntz Avenue, Suite B Manhattan, KS 66502 USA +1.785.770.8511 www.thunderheadeng.com Verification and Validation Pathfinder 2015.1 Release 0504 x64 Disclaimer Thunderhead Engineering makes no warranty,
Taranaki Tsunami Inundation Analysis. Prepared for Taranaki Civil Defence Emergency Management Group. Final Version
 Taranaki Tsunami Inundation Analysis Prepared for Taranaki Civil Defence Emergency Management Group Final Version June 2012 AM 12/07 HBRC Plan Number 4362 Asset Management Group Technical Report Prepared
Paper 20 Economising mooring and guiding constructions at lock approaches in inland waterways the Dutch experience.
 Paper 20 Economising mooring and guiding constructions at lock approaches in inland waterways the Dutch experience. KOEDIJK, O. C.; MSc Rijkswaterstaat / TU Delft, Rijswijk, Netherlands Email (1 st author):
Incompressible Potential Flow. Panel Methods (3)
") Incompressible Potential Flow Panel Methods (3) Outline Some Potential Theory Derivation of the Integral Equation for the Potential Classic Panel Method Program PANEL Subsonic Airfoil Aerodynamics Issues
Incompressible Potential Flow Panel Methods (3) Outline Some Potential Theory Derivation of the Integral Equation for the Potential Classic Panel Method Program PANEL Subsonic Airfoil Aerodynamics Issues
IMO REVISION OF THE INTACT STABILITY CODE. Proposal of methodology of direct assessment for stability under dead ship condition. Submitted by Japan
 INTERNATIONAL MARITIME ORGANIZATION E IMO SUB-COMMITTEE ON STABILITY AND LOAD LINES AND ON FISHING VESSELS SAFETY 49th session Agenda item 5 SLF 49/5/5 19 May 2006 Original: ENGLISH REVISION OF THE INTACT
RBC flume. All it takes for environmental research. Contents. 1. Introduction. 2. The flumes of Eijkelkamp Agrisearch Equipment
 13.17.06 RBC flume operating instructions Contents 1. Introduction... 1 2. The flumes of Eijkelkamp Agrisearch Equipment... 1 3. Principles of discharge-measuring flumes... 2 4. Selection and location
PUV Wave Directional Spectra How PUV Wave Analysis Works
 PUV Wave Directional Spectra How PUV Wave Analysis Works Introduction The PUV method works by comparing velocity and pressure time series. Figure 1 shows that pressure and velocity (in the direction of
Experiment 8: Minor Losses
 Experiment 8: Minor Losses Purpose: To determine the loss factors for flow through a range of pipe fittings including bends, a contraction, an enlargement and a gate-valve. Introduction: Energy losses