Physical Oceanography Setting for the Hebron Nearshore and Offshore Project Areas
|
|
|
- Ilene Morgan
- 5 years ago
- Views:
Transcription
1 Physical Oceanography Setting for the Hebron Nearshore and Offshore Project Areas Prepared for Stantec Consulting Ltd. 607 Torbay Road St. John's, NL A1A 4Y6 Telephone: (709) Facsimile: (709) Prepared By AMEC Earth & Environmental a Division of AMEC Americas Limited 133 Crosbie Road P.O. Box St. John's, Newfoundland A1B 4A5 Telephone: (709) Facsimile: (709) April 2010 JWSL Job #: Phase A5204 AMEC Project: TN Prepared Reviewed Approved for D. Cardoso, J. McClintock, T. Alcinov for B. Batstone, S. Donnet J. McClintock
2 TABLE OF CONTENTS 1.0 NEARSHORE Bathymetry Waves Tsunamis Currents Tides and Storm Surges Physical and Chemical Properties OFFSHORE Bathymetry Waves Tides and Storm Surges Climate Change REFERENCES Appendix 1 Appendix 2 Appendix 3 Appendix 4 Appendix 5 LIST OF APPENDICES Temperature and Salinity Statistics, Bull Arm Significant Wave Height versus Peak Period, Bull Arm, MSC50 Climatology Grid Point M Significant Wave Height versus Direction, Bull Arm, MSC50 Climatology Grid Point M Temperature and Salinity Statistics, Hebron Region Seasonal Mean Current Speed and Direction, Grand Banks LIST OF FIGURES Figure 1-1 Bull Arm (A) and head of Trinity Bay (B), Newfoundland... 2 Figure 1-2 MSC50 Climatology Grid Point, M (47.7 N, 53.8 W) near Bull Arm, Newfoundland... 4 Figure 1-3 Monthly Frequency of Significant Wave Height Occurrence by Direction (to) for the MSC50 Grid Point M near Bull Arm... 5 Figure 1-4 Seasonal Frequency of Significant Wave Height Occurrence by Direction (to) for the MSC50 Grid Point M near Bull Arm... 6 Figure 1-5 Annual Frequency of Significant Wave Height Occurrence by Direction (to) for the MSC50 Grid Point M near Bull Arm... 7 Figure 1-6 Locations of All Recorded Coastal Flooding in Newfoundland and Labrador from 1755 to Figure 1-7 Observations at Long Cove (47.57 N, W at the southern end of Trinity Bay) for a Month Figure 1-8 Temperature and Salinity measurement locations for Bull Arm Figure 1-9 Contours of Temperature, Salinity and Density Figure 2-1 Offshore Project Area Bathymetry near Hebron (depths shown in metres) Figure 2-2 MSC50 Climatology Grid Point (M ) on the Grand Banks April 2010 i
3 Figure 2-3 Monthly Frequency of Significant Wave Height Occurrence by Direction (to) for the MSC50 Gridpoint M near Hebron Figure 2-4 Seasonal Frequency of Significant Wave Height Occurrence by Direction (to) for the MSC50 Gridpoint M near Hebron Figure 2-5 Annual Frequency of Significant Wave Height Occurrence by Direction (to) for the MSC50 Gridpoint M near Hebron Figure 2-6 Comparison of Significant Wave Height Statistics between MSC50 grid point M , White Rose, and Terra Nova Observations Figure 2-7 General Circulation in the Northwest Atlantic Showing Major Current Systems 32 Figure 2-8 Contours of Temperature and Salinity for North-Eastern Grand Banks Figure 2-9 Winter Surface and Bottom Temperature and Salinity Contour Plots for North- Eastern Grand Banks Figure 2-10 Spring Surface Temperature and Salinity Contour Plots for North-Eastern Grand Banks Figure 2-11 Summer Surface Temperature and Salinity Contour Plots for North-Eastern Grand Banks Figure 2-12 Fall Surface Temperature and Salinity Contour Plots for North-Eastern Grand Banks April 2010 ii
4 LIST OF TABLES Table 1-1 Monthly Significant Wave Height and Peak Period Statistics from MSC50 Grid Point M near Bull Arm... 8 Table 1-2 Annual Significant Wave Height versus Peak Period, from MSC50 Grid Point M near Bull Arm... 8 Table Year Extreme Wave Heights at the Deepwater Sites (Hibernia GBS construction site), Bull Arm... 9 Table 1-4 Currents for 5 to 75 m from February 9, 1991, to March 13, 1991, Near the Construction Site for the Hibernia Gravity-base Structure Table 1-5 Hibernia Development Project Environmental Specifications 100- and 120- Year Extreme Current Profiles for Deepwater Sites, Bull Arm Table 1-6 Mean and Extreme Tide and Surge Levels, Bull Arm Table 1-7 Temperature and Salinity Statistics Table 1-8 Temperature and Salinity Statistics (continued) Table 2-1 Monthly and Annual Significant Wave Height and Peak Wave Period Statistics, from MSC50 Grid Point M10834 near Hebron Table 2-2 Annual Significant Wave Height vs. Peak Wave Period, from MSC50 Grid Point M10834 near Hebron Table 2-3 Extreme Wave Statistics Table 2-4 Wave Height Directional Weighting Factors Table 2-5 Monthly and Annual Significant Wave Height and Peak Period Statistics at Terra Nova for 1999 to Table 2-6 Annual Significant Wave Height vs. Peak Wave Period, from Terra Nova Observations Table 2-7 Monthly and Annual Significant Wave Height and Peak Wave Period Statistics at White Rose for October 2003 to August Table 2-8 Grand Banks Mean Currents Table 2-9 Currents Measured at the Hebron Site from January 6 to April 23, Table 2-10 Extreme Current Speed Statistics Table 2-11 Extreme Current Speeds for 1 to 100 Year Return Periods for Hebron and Terra Nova35 Table 2-12 Extreme Storm Surge and Tide Levels at Terra Nova Table 2-13 Temperature and Salinity Statistics for North-Eastern Grand Banks Table 2-14 Temperature and Salinity Statistics for North-Eastern Grand Banks (continued) April 2010 i
5 1.0 NEARSHORE As related study for the Comprehensive Study Report, and oil production activities on the Grand Banks of Newfoundland, AMEC Earth & Environmental, a Division of AMEC Americas Limited (AMEC) has prepared a description of the physical oceanography settings for the Project Areas nearshore, in Bull Arm, Trinity Bay, Newfoundland, and offshore, at the Hebron Field on the Grand Banks. Additional details of the are presented in the Description (ExxonMobil Canada Properties, 2009). 1.1 Bathymetry Bull Arm is approximately 16 km in length, with an average width of 1.6 km, located at the northwest end of the head of Trinity Bay at the isthmus that connects the Avalon Peninsula with the main body of the Island of Newfoundland. Trinity Bay is a large bay on the northeastern coast of Newfoundland with a length of approximately 100 km, orientated towards the northeast. The Bull Arm Construction Site is located at Bull Arm; the Hibernia GBS was constructed at this site. This site was chosen due to its natural deep channel to Trinity Bay and its calm waters. This site has been proposed for construction of the Hebron GBS for similar reasons. The study area encompasses the entire arm and extends seaward to just past Chance Cove across to Tickle Harbour point and straight back to the mouth of the arm. The bathymetry within the Study Area (from Canadian Hydrographic Services Chart # (Canadian Hydrographic Services, 1997)) is illustrated in Figure 1-1. The range of depths within this area is from 1 to 2 m near shore to between 260 and 300 m at the head of Trinity Bay. Bull Arm has a deep centre channel reaching depths of over 200 m where it merges into Trinity Bay. April


")
, Newfoundland April")
6 A B Note: Depths are in metres, Scale 1:60,000. Source: Canadian Hydrographic Services, 1997, Chart # Figure 1-1 Bull Arm (A) and head of Trinity Bay (B), Newfoundland April
7 1.1.1 Waves Characterization of the wave climate in the offshore Newfoundland and Labrador area has been made using the long-standing Meteorological Service of Canada (MSC) 50-year Wind and Wave Climatology (MSC50) (an update of the Atmospheric Environment Service (AES) 40-year) of North Atlantic Wind and Wave Climatology (Swail et al., 1998; Swail et al., 2006; Meteorological Service of Canada, 1999; Meteorological Service of Canada, 2006; Oceanweather Inc., 2001). The hindcast was developed at Oceanweather with support from Climate Research Branch of Environment Canada (Oceanweather Inc., 2001). The hindcast involved the kinematic reanalysis of all significant tropical and extra-tropical storms in the North Atlantic for the continuous period 1958 to Oceanweather's 3rd generation wave model (OWI3G) was adopted onto a by degree grid. Wind and wave fields were archived at all active model Grid Points. The AES40 methodology and validation has been extensively documented and presented in peer-reviewed journals and conferences (Swail et al., 1998). In 2005, the AES40 hindcast in Canadian waters was improved by a shallowwater version of the OWI3G on a 0.1 degree grid covering much of the Canadian Maritimes. The North Atlantic basin model was similarly upgraded and run at a 0.5 degree resolution. The MSC50 also extended the time-series to include the 52 years 1954 to 2005 (Swail et al., 2006). The MSC50 Grid Point M (47.7 o N, 53.8 o W) located near the Bull Arm site at m water depth (Figure 1-2) is relevant for the Nearshore Project Area. Wave roses (representing direction to ) for MSC50 Grid Point M are presented in Figures 1-3 to 1-5. The wave height statistics are shown in Figures 1-3 to 1-5 and Tables 1-1 and 1-2. Wave parameters include significant wave height (Hs) and spectral peak wave period (Tp) 1. The Hs is derived as the average height of the one-third largest waves. The Tp is the period of the waves with the largest energy levels (which approximate the period of the one-third highest waves). The Hs ranges from approximately to 2.0 m, with maximum waves occurring in January and December. The greatest occurrence of Hs (38%) was between 0 and 0.3 m. During the summer months, waves propagate most frequently toward the north-northeast. By fall, the waves most frequently propagate eastward into the area. Peak wave period ranges from 0.1 to 25 s, with the greatest occurrence (81%) between 2 and 4 s. The Hibernia Development Project Environmental Specifications report presents the 100 year extreme waves for two deep water sites in Bull Arm, which were near the construction site for the Hibernia GBS (47 49'23"N, 53 52'37"W and 47 48'42"N, 53 52'37"W) (Topside Engineering, 1992). Results are shown in Table 1-3. The extreme wave conditions show a maximum Hs of 2.6 m, which compares reasonably well with the maximum from the MSC50 Grid Point near Bull Arm of 1.9 m. However, the extreme peak periods reported in Bull Arm are significantly lower (three to four times) than the maximum calculated from the Grid Point near Bull Arm. 1 MSC50 parameters include wind speed, wind direction, Hs, Tp (several estimates), wave direction, wave spread and spectral moments. April
8 Figure 1-2 MSC50 Climatology Grid Point, M (47.7 N, 53.8 W) near Bull Arm, Newfoundland April
9 Figure 1-3 Monthly Frequency of Significant Wave Height Occurrence by Direction (to) for the MSC50 Grid Point M near Bull Arm April
10 Figure 1-4 Seasonal Frequency of Significant Wave Height Occurrence by Direction (to) for the MSC50 Grid Point M near Bull Arm April
11 Figure 1-5 Annual Frequency of Significant Wave Height Occurrence by Direction (to) for the MSC50 Grid Point M near Bull Arm April
12 Table 1-1 Monthly Significant Wave Height and Peak Period Statistics from MSC50 Grid Point M near Bull Arm Significant Wave Height (m) Peak Period (s) Month Mean Maximum Most Frequent Direction Minimum Mean Maximum (to) Jan E Feb E Mar S Apr S May WSW Jun NNE Jul NNE Aug NNE Sep E Oct E Nov E Dec E Year E Table 1-2 Annual Significant Wave Height versus Peak Period, from MSC50 Grid Point M near Bull Arm Significant Wave Height (m) Peak Period (s) Total % Total Total % Exceed April
13 Table Year Extreme Wave Heights at the Deepwater Sites (Hibernia GBS construction site), Bull Arm Location: 47 49'23"N 53 52'37"W Location: 47 48'42"N 53 52'37"W October to March October to March February February Extreme Height (m) Associated Crest to Crest Period (s) Significant Height (m) Peak Period (s) Zero Crossing Period (s) Mean Period (s) Source: Topside Engineering Tsunamis Tsunamis are long-period gravity waves generated in a body of water by an impulsive disturbance that vertically displaces the water column. Earthquakes, landslides, volcanic eruptions and even explosions or the impact of cosmic bodies such as meteorites can generate tsunamis. The resulting wave energy spreads outwards across the ocean at high speed. Tsunami occurrences in Canada are rare, with the Pacific Coast at greatest risk due to the high occurrence of earthquake and landslide activity in the Pacific Ocean. Their occurrence can result in major damage and loss of life. Tsunamis generated by earthquakes generally originate from what is referred to as farfield sources; they are sometimes called teletsunamis. Tsunamis resulting from the deformation of the sea floor caused by an earthquake can travel far, while tsunamis generated by other mechanisms generally dissipate quickly, only affecting areas close to the source. Not all earthquakes generate tsunamis (Fisheries and Oceans Canada 2008). For Newfoundland and the Grand Banks, the most relevant far-field sources are the Azores-Gibraltar Ridge zone, the Mid-Atlantic Ridge and the north side of the Caribbean Arc. Tsunamis generated by other mechanisms generally originate from near-field sources such as the Laurentian Channel, origin of the 1929 Grand Banks tsunami. A potential near-field source for the construction site would be a significant landslide in Bull Arm or Trinity Bay. However, there is only one known report of a landslide in the area (Natural Resources, 2009), which occurred May 9, 2003, in Southport and did not generate a tsunami. There are four instances of probable or confirmed tsunamis in Newfoundland: Probable tsunami: November 1, Probable result of Lisbon earthquake. Emptied Bonavista harbour and 10 minutes later water returned and overflowed parts of the community. (Newfoundland and Labrador Heritage, 2000). April
14 Probable tsunami: September 24, Teletsunami from unknown source location. The tsunami was observed in southern Labrador from Fishing Ships Harbour to St. John's. No earthquake was recorded on that day, so it is likely that this was a landslide-induced tsunami, or possibly from an offshore earthquake, although none was recorded. (National Geophysical Data Center, 2009). Probable tsunami: June 27, An earthquake off the southwestern coast of the Avalon Peninsula caused a local tsunami at Saint Shotts. (National Geophysical Data Center, 2009). Confirmed tsunami: November 18, An earthquake of magnitude 7.2 occurred approximately 250 km south of Newfoundland along the southern edge of the Grand Banks, at 5:02 PM local time. "The earthquake triggered a large submarine slump (an estimated volume of 200 cubic km of material was moved on the Laurentian slope) which ruptured 12 transatlantic cables in multiple places, and generated a tsunami. The tsunami was recorded along the eastern seaboard as far south as South Carolina and across the Atlantic Ocean in Portugal." Approximately 2.5 hours after the earthquake, tsunami waves struck the Burin in three main pulses, causing the local sea level to rise between 2 and 7 m, with waters as high as 13 m in some bays on the Burin. The tsunami claimed 28 lives and destroyed or moved many buildings. Effects on Trinity Bay are not documented but: "The tsunami refracted counterclockwise around the Avalon Peninsula to arrive in the Bonavista area about 1:30 am N.S.T." on November 20. "It appears that the water in Bonavista Harbour drained out completely, and then overflowed part of the community upon its return." (Natural Resources Canada, 2008; National Geophysical Data Center, 2009). While the 1755 and 1929 tsunamis were observed to affect Bonavista and the 1848 event affected locations northwest and southeast of Trinity Bay, it is not clear that the construction site in Bull Arm is at risk. First, construction will take place over approximately four years, while the observed tsunamis seem to indicate a return period on the order of 50 to 100 years for Newfoundland, likely longer for Bull Arm and even longer for a destructive tsunami such as the 1929 event. Also, Bull Arm is very sheltered from the open ocean, although tsunami waves can in theory refract around shorelines. Given the complex shape and bathymetry of Bull Arm and Trinity Bay, numerical modelling would be required to evaluate the potential water elevation change and currents if a tsunami was to affect Eastern Newfoundland. The recorded coastal flooding events in Newfoundland and Labrador from 1755 to 1992 are shown in Figure 1-6 and show no flooding in Trinity Bay. April

15 Source: Newfoundland and Labrador Heritage, Figure 1-6 Locations of All Recorded Coastal Flooding in Newfoundland and Labrador from 1755 to Currents Ocean current studies and data are limited for Bull Arm. Data were collected in the late 1980s and early 1990s to support the Hibernia Development Project. Studies have also been conducted in Trinity Bay, mostly related to the commercial fisheries in the area. Both Seaconsult Marine Reseach Ltd. and Oceans Ltd. conducted oceanographic data collection programs in support of the Hibernia Development Project. The Seaconsult data report is reviewed herein; however, the data from Oceans Ltd. were not made available at this time. The study completed by Seaconsult (1991) reports current data for 5 to 75 m depths from February 9, 1991, to March 13, 1991, near the construction site for the Hibernia GBS (47 49 N, 53 53'W). Current data are presented in Table 1-4. The maximum mean current of m/s occurred at the surface; however, the overall maximum current of m/s was observed at 47 m. The most frequent direction is northwest at all depths except at the surface, where the flow can be moderated by local wind forcing. The report completed by Topside Engineering (1992) presents the environmental design criteria for the Hibernia Development Project. The 100-year extreme current profiles for deepwater sites in Bull Arm are shown in Table 1-5. As expected, the estimated extreme currents are all higher than the measured currents reported by Seaconsult (1991) (and range from 1 m/s for depths from 5 to 80 m to 0.4 m/s at the surface). April
16 Table 1-4 Currents for 5 to 75 m from February 9, 1991, to March 13, 1991, Near the Construction Site for the Hibernia Gravity-base Structure Depth (m) Mean (m/s) Maximum (m/s) St. Dev. Most Frequent Direction (to) S ( ) NW ( ) NW ( ) NW ( ) NW ( ) NW, N ( ) NW ( ) NW ( ) Source: Seaconsult Table 1-5 Hibernia Development Project Environmental Specifications 100- and 120-Year Extreme Current Profiles for Deepwater Sites, Bull Arm Probable Maximum Current in Downwind Direction (m/s) Location: 47 48'42"N 53 52'24"W Location: 47 49'23"N 53 52'37"W Depth (m) Surface Source: Topside Engineering The current studies for Trinity Bay are summarized by Dalley et al. (2002), wherein they cite several studies as follows. Bailey (1958) concluded that mean currents from the inshore branch of the Labrador Current entered the Bay on the northwest side and exited on the southeast side. Bailey s data also suggested the existence of two weak gyres within the Bay. Yao (1986) subsequently confirmed the direction of these mean currents and showed that predominant southwesterly winds caused displacement of the mixed surface layers, along the axis of the Bay, from southwest to northeast. Yao (1986) found that surface currents flowing out of the bay as a result of the predominant winds along the axis produced an upwelling of colder water along the bay s northwest side and downwelling along its southeast side. Yao (1986) also found that incoming currents in the northwest corner are at times stronger than outflowing surface currents, produced by the prevailing southwesterly winds blowing out of the Bay, so despite prolonged offshore wind events, a net current into the bay may prevail as a result of the Labrador Current. The numerical hydrodynamic model of Davidson et al. (2001) was applied to Trinity Bay and residence times of 50 to 60 days were estimated near the head of Trinity Bay. April
17 1.1.4 Tides and Storm Surges The tidal levels in Trinity Bay have been reported by several sources for different locations. Forecast tides for Heart s Content and Clarenville show a tidal range of about 1.2 m (Canadian Hydrographic Service, 2008). Observations at Long Cove (47.57 N, W at the southern end of Trinity Bay) for a month (recorded every 15 minutes from October 17 to November 17, 2005) showed a water level variation from 0.07 to 1.96 m (Figure 1-7). Two peaks on November 3 and 4, 2005, are not of tidal origin and were likely caused by storm surge. Without the peaks, the tidal range in Long Cove is approximately 1.6 m (Fisheries and Oceans Canada, 2009a). The DFO WebTide model (Dupont et al., 2002) was employed by AMEC (2009) at a location in the south end of Trinity Bay (47 42' 00"N, 53 48' 00"W) for the period , and the resulting tidal range was found to be approximately 1.26 m (variation from m to 1.33 m). Long Cove Water Level Water Level (m) Days from October at 00:00 UTC Note: Observations were made every 15 minutes from October 17 to November 17, Source: Fisheries and Oceans Canada, 2009a. Figure 1-7 Observations at Long Cove (47.57 N, W at the southern end of Trinity Bay) for a Month Marex (1992) conducted a study on water levels in Bull Arm using data collected from January to August The measurements were conducted using a tide gauge at April
18 location GULL, a site adjacent to the GULL survey monument located on a rocky headland on the southern shore of Great Mosquito Cove. This study identified the mean water level (MWL), the range of water levels associated with astronomical tides, as well as estimates of probable extreme surges (Table 1-6). Furthermore, this study provided estimates of the extreme maximum and extreme minimum still water levels in Bull Arm by combining the tide and estimated surge levels. The estimates of extreme water level for the 100 year condition in Table 1-6 include a contingency allowance to the 95% confidence limits. The estimated maximum extreme water level is m relative to the MWL, which includes the standard deviation of the MWL, the tide (including the mean higher high water and the mean lower low water levels), the 50 year surge and the standard deviation on the 50 year surge. The minimum extreme water level is -1.2 m relative to the MWL which includes the same parameter levels as the maximum. The best estimate for the tidal range (difference between highest and lowest astronomical tide levels) in Bull Arm was found to be 1.71 m. This range is relatively higher than those reported at other locations in Trinity Bay, but it is consistent with the constrained geometry of Bull Arm relative to the wider area of Trinity Bay. April
19 Table 1-6 Mean and Extreme Tide and Surge Levels, Bull Arm Level (m) Highest Astronomical Tide 0.80 Mean Water Level 0.00 Lowest Astronomical Tide Extreme Maximum Still Water Level 1.52 (100-Year Total Level) Extreme Minimum Still Water Level (100-Year Total Level) Mean Positive Surge Amplitude (100-Year Surge) Mean Negative Surge Amplitude (100-Year Surge) Note: GULL benchmark, Bull Arm, Trinity Bay is located 3.2 m above CHS chart datum and 2.24 m above mean water level Source: Marex, Physical and Chemical Properties Temperature and salinity data were extracted from the Fisheries and Oceans Canada (DFO) hydrographic database (Fisheries and Oceans Canada, 2009b). This database is a collection of temperature and salinity measurements for the area approximately defined by 35 N to 80 N and 42 W to 100 W. The data come from a variety of sources, including hydrographic bottles casts, CTD casts, spatially and temporally averaged Batfish tows and expendable digital or mechanical bathythermographs. Near real-time data are in the form of IGOSS (Integrated Global Ocean Services System) Bathy or Tesac messages (codes for oceanographic data). The database currently consists of approximately 782,000 profiles and 35 million individual observations from 1910 to the present. The geographic limits used for this study are 47.6 N, 48 N, W and 53.7 W. Approximately 4,074 measurements are available within this area from the DFO database. These were averaged by depth with bin depth of 2 m for 0 to 20 m every 5 m April

20 and bin depth 5 m from 30 to 100 m every 10 m and from 120 to 200 m every 20 m. The locations of the measurements are presented in Figure 1-8 and the results in Figure 1-9. The monthly statistics are presented in Appendix 1, while the summary of monthly statistics is provided in Table 1-7 and Table 1-8. There are no data for February, and data in March are sparse. In summer, the system becomes thermally stratified with the development of a distinct surface layer to about 60 m, with average temperatures reaching between 14 C and 15 C and average salinities between 31.3 and 32 psu. By November, the system returns to one nearly homogeneous layer, which is colder and saltier than the conditions in the summer. In fall, the average temperatures range from 5.3 C (November) for the surface layer to C (December) and the average salinities range from 31.4 psu at the surface to 32.7 psu near bottom. In the deeper layer, below 60 m, average temperatures range between C and 1 C and average salinities between 32 and 33 psu. Bathymetry Source: National Oceanic and Atmospheric Administration, Figure 1-8 Temperature and Salinity measurement locations for Bull Arm April


21 Source: Fisheries and Oceans Canada, Figure 1-9 Contours of Temperature, Salinity and Density Table 1-7 Temperature and Salinity Statistics April
22 Depth (m) Temperature ( o C) Std Min Max Mean Dev Salinity (psu) Total Count Min Max Mean January Std Dev Total Count February - No Data March April May June July April
23 Table 1-8 Temperature and Salinity Statistics (continued) Temperature ( o C) Salinity (psu) Depth (m) Min Max Avg Std Dev Total Count Min Max Avg August Std Dev Total Count September October November December Source: Fisheries and Oceans Canada, 2009b. April
24 2.0 OFFSHORE 2.1 Bathymetry The Grand Banks extends almost 500 km offshore and covers an area of approximately 270,000 km 2. The bank is relatively flat, with typical water depths of 100 m or less. East of the bank is the Flemish Pass, which separates the Grand Banks from the Flemish Cap. The Flemish Pass reaches depths of over 1000 m, while the Flemish Cap is of radius approximately 200 km and depths as shallow as about 140 m. East and south of the Flemish Pass is the slope of the Newfoundland Shelf and the Atlantic Basin at depths exceeding 3000 m. Hebron is located on the eastern section of the Grand Banks, 9 km north of the Terra Nova Site, in approximately 95 m of water. The Offshore Study Area encompasses the eastern portion of the Grand Banks from just north of the tail to the South at about 43 N, and north to 48 N, just south of the nose. The western portion extends in over the Grand Banks about 100 km to the west. The Offshore Project Area is situated between the Hibernia, White Rose, and Terra Nova development areas, and encompasses the Hebron, West Ben Nevis, and Ben Nevis SDL in a region approximately 30 km (east-west) by 15 km (north-south) on the eastern edge of the Grand Banks near the 100 m bathymetry contour (see Figure 2-1. In this area the depth ranges from about 88m in the west to 102 m in the east (ExxonMobil Canada Properties, 2009). April
25 Depths are in metres, scale 1:400,000. Source: Canadian Hydrographic Services, 1995, Chart # Approximate Hebron location has been annotated with a green square. Figure 2-1 Offshore Project Area Bathymetry near Hebron (depths shown in metres) April
26 2.1.1 Waves Characterizations of normal and extreme wave conditions are available from three primary sources: the multi-year MSC50 wave hindcast, design criteria prepared for the, and wave measurements from nearby Grand Banks oil production sites. The MSC50 Grid Point M10834 is located at 46.6 N, 48.5 W, at a water depth of 93.4 m, approximately 5.7 km north of the Hebron site (see Figure 2-2). MSC50 hindcast model data were extracted for this Grid Point from which to derive the wave climate summary plots and statistics presented below. Wave parameters in the MSC50 hindcast include significant wave height 2, Hs, and peak wave period 3, Tp. Monthly and annual wave height statistics are shown in Table 2-1. Table 2-2 presents a bivariate statistics table of annual wave height versus peak wave period. Mean Hs values range from 1.7 m in July to 3.9 m in December and January. The annual mean Hs is 2.8 m. Hs is greatest at 13.7 m in February and 13.5 m in December. During the summer the maximum Hs ranges from 6.2 m in July to 8.5 m in August and 10.8 m in September. In winter (December through February), Hs is less than 2 m for 7% of the time, is between 2 and 4 m for 55% of the time, and is greater than 6 m for 9% of the time. By contrast, in summer (June through August), Hs is less than 2 m for 71% of the time, is between 2 and 4 m for 27% of the time, and is greater than 6 m for 0.4% of the time. Annually, 49% of waves have a significant wave height between 2 and 4 m. Monthly, seasonal, and annual wave roses for MSC50 Grid Point M10834 are presented in Figure 2-3 to Figure 2-5. During the summer, waves propagate most frequently to the northeast, for 55% of the time. In the fall, winds switch around to the northwest, and by winter, waves are now travelling to the northeast 28% of the time and to the the east through south-southeast 36% of the time (15% in summer). In spring, the pattern reverses and while southwest winds are still the most frequent, there is no strongly predominant wind direction: each of the 16 wind directions occur from about 4 to 12% of the time. 2 wave height is the vertical distance from trough to crest of a wave. Significant wave height, commonly abbreviated as Hs, is a descriptive wave height measure defined as the average height of the highest one-third of the waves. Significant wave height can also be estimated from a measured or hindcast wave spectrum as 4 mo, where mo is the variance of the wave spectrum. The MSC50 employs this latter definition for Hs, 3 the period of waves with the most energy (i.e., 1/fp, where fp is the peak frequency of the wave spectrum) April
27 ' Hibernia White Rose M10834 Hebron 46 30' Terra Nova 100 m ' 48 30' 48 15' 48 Figure 2-2 MSC50 Climatology Grid Point (M ) on the Grand Banks April
28 Figure 2-3 Monthly Frequency of Significant Wave Height Occurrence by Direction (to) for the MSC50 Gridpoint M near Hebron April
29 Figure 2-4 Seasonal Frequency of Significant Wave Height Occurrence by Direction (to) for the MSC50 Gridpoint M near Hebron April
30 Figure 2-5 Annual Frequency of Significant Wave Height Occurrence by Direction (to) for the MSC50 Gridpoint M near Hebron Table 2-1 Monthly and Annual Significant Wave Height and Peak Wave Period Statistics, from MSC50 Grid Point M10834 near Hebron Significant Wave Height (m) Peak Wave Period (s) Month Most Minimum 1 Mean Maximum Frequent Minimum 1 Mean Maximum Direction (to) Jan ENE Feb ENE Mar ENE Apr NE May NE Jun NE Jul NE Aug NE Sep ENE Oct SSE Nov ENE Dec ENE Year NE Note: 1 historical minimum wave conditions in winter/spring are zero due to the possible presence of ice April
31 Table 2-2 Annual Significant Wave Height vs. Peak Wave Period, from MSC50 Grid Point M10834 near Hebron Peak Period Significant Wave Height (m) (s) Total % Total Total % Exceed ExxonMobil Upstream Research Company (URC) has prepared a Metocean Criteria for Hebron including operational 4 and extreme wave conditions based on the MSC50 hindcast at the same grid point M10834 (ExxonMobil Upstream Research Company 2009). In that work, the peaks-over-threshold approach was applied to fit storm peak wave values to a Weibull probability distribution from which long return value, or extreme, estimates could be made. The Hs values were first calibrated to Hibernia measurements. Table 2-3 reports 95% and 99% upper limit, or non-exceedance, values, together with 1 to 100 year return period estimates. In addition to Hs, the table reports peak wave period, Tp, the maximum individual wave height, Hmax, calculated as 1.88 times Hs, the wave period associated with Hmax, THmax, and the associated wind speed. Further details of the data and methods employed to derive these values are provided by URC (ExxonMobil Upstream Research Company 2009). From these statistics, one may estimate that 5% of waves at Hebron have a significant wave height of 5.3 m or above, and corresponding maximum wave heights of 10 m or greater. For a 50-year return period, a significant wave height of 14.3 m and corresponding maximum individual wave height of 26.9 m could be expected. 4 annual and monthly tables of wave height vs. wave direction, wave height vs. wave period, exceedance of wave height (monthly only), and wave roses April
32 Table 2-3 Extreme Wave Statistics Return Period Hs (m) Tp (s) (+ 10% range) Hmax (m) THmax (s) (+ 10% range) 1-h associated wind speed at 10 m (m/s) 95% upper limit % upper limit year year year year year year Source: ExxonMobil Upstream Research Company 2009 URC also provides directional scale factors for extreme waves. Due to the relatively shallow depths of the continental shelf and sloping bathymetry near Hebron long period waves feel the sea bottom with a resultant change in amplitude and direction. As a result, waves propagating to the south and west get reduced in amplitude whereas for other directions there is less effect. Table 2-4 presents directional factors: the extreme wave estimates may be scaled by the directional factor for consideration of waves propagating to a particular direction. Table 2-4 Wave Height Directional Weighting Factors Wave Direction (to) S SW W NW N NE E SE Wave Height Scale Factor Source: ExxonMobil Upstream Research Company 2009 Physical monitoring data from offshore production activities on the Jeanne d Arc Basin have been collected for more than 10 years. There are presently three oil-producing fields in the North Atlantic: Hibernia; Terra Nova; and White Rose (e.g., Figure 2-2). Water depths range from approximately 85 m at Hibernia to 95 m at Terra Nova to 120 m at White Rose. The Hebron Field is located in the Jeanne d Arc Basin, approximately 9 km north of Terra Nova and approximately 35 km southeast of Hibernia. Comparison of the monthly MSC50 hindcast statistics with the wave observations at Terra Nova (1999 to 2007) and White Rose (2003 to 2007) (AMEC Earth & Environmental 2003 to 2007; Fisheries and Oceans Canada 2009c) are presented in (Table 2-5, Table 2-6, Table 2-7, and Figure 2-6). April
33 Table 2-5 Monthly and Annual Significant Wave Height and Peak Period Statistics at Terra Nova for 1999 to 2007 Month Significant Wave Height (m) Peak Wave Period (s) Minimum Mean Maximum Minimum Mean Maximum Jan Feb Mar Apr May Jun Jul Aug Sep Oct Nov Dec Year Source: Fisheries and Oceans Canada 2009c Table 2-6 Annual Significant Wave Height vs. Peak Wave Period, from Terra Nova Observations Significant Wave Height (m) Peak Period (s) % Total Total Total % Exceed Source: Fisheries and Oceans Canada 2009c April
34 Table 2-7 Monthly and Annual Significant Wave Height and Peak Wave Period Statistics at White Rose for October 2003 to August 2007 Month Significant Wave Height (m) Peak Wave Period (s) 1 Minimum Mean Maximum Minimum Mean Maximum Jan Feb Mar Apr May Jun Jul Aug Sep Oct Nov Dec Year Source: AMEC Earth & Environmental 2003 to Tp5, TRIAXYS wave buoy peak period as computed by the Read method 16 Grand Banks Waves 14 Significant Wave Height (m) Jan Feb Mar Apr May Jun Jul Aug Sep Oct Nov Dec Figure 2-6 MSC50 M10834, Mean MSC50 M10834, Min MSC50 M10834, Max Terra Nova, Mean Terra Nova, Min Terra Nova, Max White Rose, Mean White Rose, Min White Rose, Max Source: AMEC Earth & Environmental 2003 to 2007 (White Rose); Meteorological Service of Canada 2006; Fisheries and Oceans Canada 2009c (Terra Nova) Comparison of Significant Wave Height Statistics between MSC50 grid point M , White Rose, and Terra Nova Observations April
35 2.1.2 Tsunamis As described in the nearshore Section, Tsunamis are long-period gravity waves generated in a body of water by an impulsive disturbance that vertically displaces the water column. The most relevant far field sources effecting Newfoundland and the Grand Banks are the Azores-Gibraltar Ridge zone, the Mid-Atlantic Ridge and the north side of the Caribbean Arc. Tsunamis generated by other mechanisms generally originate from near-field sources such as the Laurentian Channel, the origin of the 1929 Grand Banks tsunami. Over the open ocean, tsunamis generally have amplitudes below 1 m, wavelengths of 10 to 500 km and periods of five minutes to one hour. Being shallow water waves, tsunamis slow down when moving over shallower water such as the Grand Banks. As energy is conserved, shoaling leads to increased wave height; however, a rapid bathymetry change can lead to partial reflection of the wave energy and height (Fisheries and Oceans Canada, 2008). While an unlikely event, an estimation of tsunami effect for the Hebron location can be obtained from the Physical Environmental Data report for Production Systems at [nearby] Terra Nova (Seaconsult Ltd., 1988). This study estimated a maximum theoretical tsunami amplitude of 2 m for Terra Nova, with expected amplitude of 0.7 to 1.2 m over a 100- year return period. Tsunami waves induce currents of nearly uniform speed from bottom to surface. The expected current speed is 35 cm/s over a 100-year return period, with maximum velocity of 70 cm/s for a 2 m tsunami wave (Seaconsult Ltd., 1988) Currents The general circulation on the Grand Banks is well understood based on geostrophic calculations, drifter data, current modelling and measurements. The dominant currents in the Northwestern Atlantic Ocean are the West Greenland, Baffin, Labrador and Nova Scotia currents. There are also two major deep basin currents, the warm Gulf Stream and the North Atlantic Current (Figure 2-7). April
36 Source: adapted from Chapman and Beardsley, Figure 2-7 General Circulation in the Northwest Atlantic Showing Major Current Systems The Labrador Current is the major current that is closest to the eastern Grand Banks. The Labrador Current is divided into two streams: an inshore stream that flows along the coast and inside the Continental Slope; once it reaches the Grand Banks, it flows in the Avalon Channel along the coast or around the Banks, and may flow onto the Bank; and an offshore stream flows along the outer edge of the Banks, over the Continental Slope at water depths between 300 to 500 m and through the Flemish Pass. The flow in the offshore portion of the Labrador Current is stronger than the inshore portion. When it reaches Hamilton Bank, the inshore branch of the Labrador Current has average speeds of approximately 0.15 m/s, carrying approximately 15% of the total transport. The offshore Labrador Current (which remains bathymetrically trapped at the edge of the Continental Shelf) has average speeds of approximately 0.40 m/s, carrying approximately 85% of the total transport, mainly between the 400 and 1200 m isobaths (Lazier and Wright 1993). April
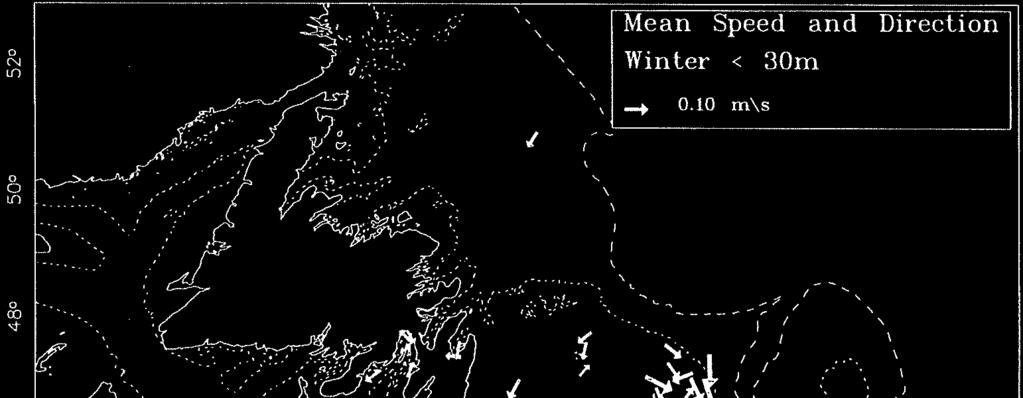
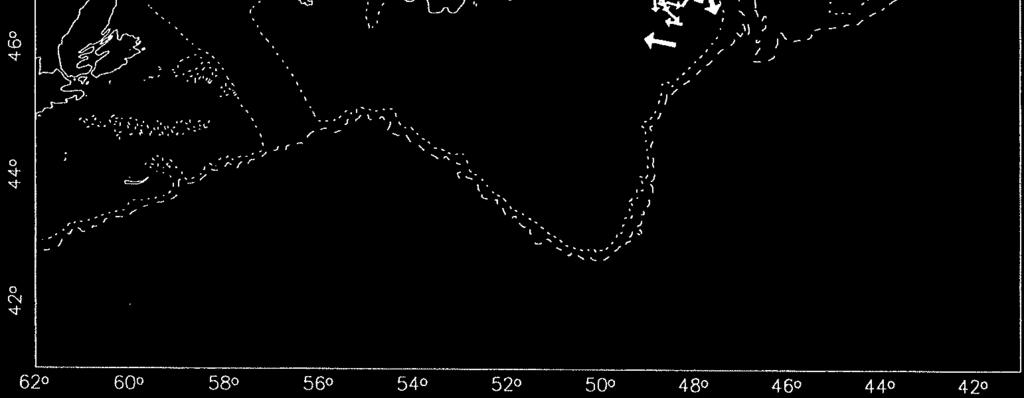
37 Mean currents are generally weak (< 10 cm/s) and flowing southward, dominated by wind-induced and tidal current variability over those areas of the Grand Banks with water depths less than 100 m (Seaconsult, Ltd. 1988). Specific characterizations of ocean current conditions are available from three primary sources: an archive database of Grand Banks current measurements which provides a regional picture, and for the Hebron location, current measurements from a Hebron exploration well drilled in 1999 and from the nearby Terra Nova location, and design criteria prepared for the. Current statistics for all current meter data on the Grand Banks from the Bedford Institute of Oceanography (BIO) prior to 1996 are presented in Gregory et al. (1996) and these provide a good representation of the regional current regime. The current measurements were grouped into three water depths ranges: near-surface (<30 m); mid-depth (30 to 80 m); and near-bottom (>80 m). Maps of the mean annual and seasonal averages of current speed and direction for the Grand Banks are provided in Appendix 5. A seasonal summary of mean current speed and directions is presented in Table 2-8. Table 2-8 Grand Banks Mean Currents Water Depth Winter Spring Summer Fall Surface 0 to 30 m Mid Depth 30 to 80 m Deep 80 to bottom ~0.10 m/s to the SE ~0.15 m/s to the SSW 0.05 to 0.10 m/s to the SE-SW <0.10 m/s to the SE or SW ~0.10 m/s to the SSW ~0.05 to the E Source: based on review of Gregory et al ~0.10 m/s to the SSE <0.10 m/s to the S ~0.05 to the S 0.10 to 0.20 m/s to the SE ~0.10 m/s to the S 0.05 to 0.10 m/s to the S Gregory et al. (1996) also present monthly mean and maximum statistics for all months and all depths. From a review of the region 46 N and 47 N and 48 W and 49 W, which encompasses Hibernia, White Rose, Terra Nova, and Hebron, the largest mean and maximum currents and associated depths could be determined. The largest near-surface current speeds reached 0.25 m/s, with an associated maximum speed of 0.96 m/s in September at a depth of 18 m. At mid-depth, the largest mean currents reached 0.15 m/s in February (at 45 m) and the maximum speed was 0.96 m/s in December (at 47 m). Near-bottom, the mean current speed reached a maximum of 0.06 m/s in May and October at 101 and 98 m, respectively, and a maximum speed of 0.70 m/s was observed in November at 98 m. The strongest surface and mid-depth currents occur in the fall to winter: the strongest currents near-bottom occur in the spring and fall. There are presently three oil-producing fields in the North Atlantic: Hibernia; Terra Nova; and White Rose (Figure 2-2). The Hebron Field is located in the Jeanne d Arc April
38 Basin, approximately 10 km north of Terra Nova and approximately 35 km southeast of Hibernia. Water depths range from approximately 85 m at Hibernia to 95 m at Terra Nova to 120 m at White Rose. Current statistics for current meter data collected at Hebron by Oceans Ltd. from January 6 to April 23, 1999, are presented in Table 2-9 (Oceans Ltd. 1999). The maximum currents speeds are lower than those from the BIO data report (Gregory et al. 1996); however, summer and fall are not included in the Oceans Ltd. data, which is when the maximum speeds were measured in the BIO data. The mean speeds at mid and bottom depths are high compared to the BIO data. Table 2-9 Currents Measured at the Hebron Site from January 6 to April 23, 1999 Instrument Depth 20 m 45 m 84 m Period of record (1999) Jan 6 to Feb 20 Jan 6 to Apr 23 Jan 6 to Apr 23 Location 46 o N 48 o N 46 o N 48 o N 46 o N 48 o N Water Depth (m) Mean Speed (m/s) Maximum Speed (m/s) Source: Oceans Ltd Extreme and operational 5 design criteria for currents for the are presented in the Hebron Metocean Criteria (ExxonMobil Upstream Research Company 2009). The data used to establish the criteria were taken from 10 years of current measurements at Terra Nova (July 1999 to October 2008). The measurements are 20-minute values and for three water depth bins near-surface (16-24 m); mid-depth (47-52 m); and near-bottom (84-89 m). Maximum values measured from the 10-year Terra Nova record are 0.94, 0.74, and 0.48 m/s for near-surface, mid-depth, and near-bottom respectively. Both annual and seasonal extremes were estimated. Table 2-10 presents annual nonexceedance levels or percent limits for current speeds at the three depths, e.g., nearsurface speeds are 0.19 cm/s or less for 75% of the time. Table 2-10 Extreme Current Speed Statistics Statistic Near-surface (m/s) Mid-depth (m/s) Near-bottom (m/s) 50% upper limit % upper limit % upper limit % upper limit % upper limit Source: ExxonMobil Upstream Research Company annual and monthly tables of current speed vs. direction (near-surface, mid-depth, and near-bottom) April
39 Annual and seasonal 1- to 100-year return period current speed estimates are presented in Table 2-11, together with Terra Nova current extreme estimates. Two seasons were selected by URC: a spring/summer season during which the ocean is stratified due to solar heating of the surface and storm activity is reduced; and a fall/winter season when due to the increased frequency and intensity of storms, the summer stratification is broken down and there is a much more uniform current response from the surface to the bottom. These seasons are considered to be from August to October (summer/spring) and from November to July (fall/winter) for the near-surface and correspondingly April to August, and September to March for mid-depth and near-bottom. The strongest nearsurface current is in summer, while the strongest mid-depth and bottom currents occur in winter. For a 50-year return period, annual extreme current speeds of 1.01, 0.73, and 0.63 m/s for near-surface, mid-depth, and near-bottom respectively could be expected. These values are generally comparable to the maximum current speeds reported by Gregory et al and noted above, although the mid-depth current there of 0.96 cm/s is larger than the 0.63 m/s 50-year estimate for Hebron. Table 2-11 Extreme Current Speeds for 1 to 100 Year Return Periods for Hebron and Terra Nova Depth (m) Surface (Annual and Aug-Oct) 20 Mid (Annual and Sep-Mar) 50 Bottom (Annual and Sep-Mar) 85 Current Speed (m/s) (and direction towards) Return Period (Years) HEBRON A (SW, W, NW) (SW) (S) Surface (Nov-Jul) 20 Mid (Apr-Aug) 50 Bottom (Apr-Aug) 85 Annual Depth (m) Surface 20 Mid 45 Bottom 70 Source: A ExxonMobil Upstream Research Company 2009 B Petro-Canada et al., Terra Nova EIS, Table 3.2-7, p (SE) (N, NW) (N,E,SW) TERRA NOVA B (W) (SW) (SE) April
40 An additional source of current information is the Canada-Newfoundland Operational Ocean Forecasting System (C-NOOFS), a pilot project operational ocean weather forecasting system for Canada (C-NOOFS, 2009). The ocean model runs on a daily basis, with wind forcing from the Environment Canada Canadian Meteorological Service GEM global wind prediction system that is run every 12 hours. The ocean model domain covers the Northwest Atlantic and Gulf of St. Lawrence at approximately 20 km resolution. Ocean surface current, wind, and sea temperature forecasts are available Tides and Storm Surges From time-series of hourly water level measurement at Hibernia Drill Site 1 from April 20 to June 1, at N; W and Hibernia Drill Site 2 from July 27 to October 5, 1980 at N; W, two locations near Hibernia, the highest water level measured from the zero mark were 1 and 1.04 m, respectively (Fisheries and Oceans Canada, 2009a). The report by Seaconsult, Ltd. (1988) summarizes tidal data from a study in December 1983 to April 1984 at 46 o 46.0 N and 48 o 50.9 W. The maximum tidal amplitude above the mean water level was 0.53 m and the minimum tidal amplitude below the mean water level was -0.51, resulting in a total range of 1.04 m. The report by Seaconsult, Ltd. (1988) also determined the storm surge for Terra Nova (Table 2-12). Table 2-12 Return Period (years) Extreme Storm Surge and Tide Levels at Terra Nova Surge Levels (cm) Expected Tide Levels (cm) Mean Water Level 95% Upper Limit above/below 1 above below above below above below above below above below Source: Seaconsult, Ltd The Hebron Design Criteria prepared by URC estimates a maximum storm surge of 0.8 m, spring and neap tidal amplitudes of 0.5 and 0.3 m respectively, and a tidal amplitude of 1 m (ExxonMobil Upstream Research Company 2009). These estimates are in keeping with the Terra Nova values Physical and Chemical Properties Sea temperature and salinity distributions are available from the Ocean and Ecosystem Science (OES) Branch (Fisheries and Oceans Canada, 2007). Hebron falls within the Hydrographic Database Subarea 46 for the Newfoundland Shelf. A monthly vertical April
41 section for temperature and salinity is shown Figure 2-8; temperature and salinity statistics are presented in Table Seasonal maps of surface and bottom temperature and salinity for the entire Hebron project area are shown in Figure 2-9 to Figure Records show a two-layer stratified system in summer and one homogeneous layer through fall and winter. The stratification degrades by October to one homogeneous layer, which is colder and saltier than the conditions in the summer. In summer, a surface layer develops down to approximately 50 m, with average temperatures reaching between 12 C and 14 C and average salinities between 32 and 32.5 psu. In fall, average temperatures range from 8.9 C at the surface to -0.6 C near the bottom and average salinities range from 32 psu at the surface to 33.4 psu at 50 m. In the lower layer, below 60 m, average temperatures range between C and 1 C and average salinities between and psu throughout the year. In winter, temperatures range from 0.57 C at the surface to C near bottom. This is consistent with the data presented in the Drill Cuttings Deposition, and Produced Water and Storage Displacement Water Dispersion Modelling Study (AMEC, 2010) which summarized temperature, salinity and density data obtained from the Fisheries and Oceans hydrographic database for the Hebron region. The results are reproduced here in Appendix 4. April
.")

42 Source: Fisheries and Oceans Canada, 2007 (Subarea 46). Figure 2-8 Contours of Temperature and Salinity for North-Eastern Grand Banks April
43 Table 2-13 Temperature and Salinity Statistics for North-Eastern Grand Banks Temperature ( o C) Salinity (psu) Depth (m) Mean Std Dev Total Count Mean Std Dev Total Count January February March April May June July Source: Fisheries and Oceans Canada, 2007 (Subarea 46). April
44 Table 2-14 Temperature and Salinity Statistics for North-Eastern Grand Banks (continued) Temperature ( o C) Salinity (psu) Depth (m) Mean Std Dev Total Count Mean Std Dev Total Count August September October November December Source: Fisheries and Oceans Canada, 2007 (Subarea 46). April
45 Source: Fisheries and Oceans Canada, Figure 2-9 Winter Surface and Bottom Temperature and Salinity Contour Plots for North-Eastern Grand Banks April
46 Source: Fisheries and Oceans Canada, Figure 2-10 Spring Surface Temperature and Salinity Contour Plots for North- Eastern Grand Banks April

47 Source: Fisheries and Oceans Canada, Figure 2-11 Summer Surface Temperature and Salinity Contour Plots for North- Eastern Grand Banks April
48 Source: Fisheries and Oceans Canada, Figure 2-12 Fall Surface Temperature and Salinity Contour Plots for North- Eastern Grand Banks Sea-Level Rise Climate Change It is generally accepted that global sea-level will rise in a warming world. This section discusses some of the literature on the subject and what effects there might be on the Grand Banks. Kolker and Hameed (2007) examined meteorological drivers of the long-term trends in global sea level rise. They found that atmospheric indices like the North Atlantic Oscillation (NAO) explain a major fraction of the variability and trend at five Atlantic Ocean tide gauges since They state that Debate has centered on the relative contribution of fresh water fluxes, thermal expansion and anomalies in Earth s rotation. They also note that variability in local mean sea level from year-to-year is one or two orders of magnitude greater than the long-term trend, with the cause of the variability April
49 unknown. When they subtracted out factors such as the NOA from their analysis of the long-term rise, they found that the residual sea level rise was between mm per year, and mm per year. This residual rise could be due to rising global temperatures. In 2007, the Intergovernmental Panel on Climate Control (IPCC) noted that [G]lobal average sea level rose at an average rate of 1.8 [1.3 to 2.3] mm per year over 1961 to The rate was faster over 1993 to 2003: about 3.1 [2.4 to 3.8] mm per year. Whether the faster rate for 1993 to 2003 reflects decadal variability or an increase in the longerterm trend is unclear. The IPCC is predicting a worldwide increase of 18 to 58 cm by A study by Aixue Hu from NCAR and Gerald Meehl in Geophysical Research Letters found that moderate to high rates of ice melt from Greenland could cause sea levels off the northeast coast of North America to rise by 30 to 51 cm more than other coastal areas. They also found that oceans will not rise uniformly as the world warms, since ocean dynamics would push water in different directions. Scientists are generally cautious about predictions, in part because ice sheet dynamics are complex and not well understood. In addition, some studies indicate that global warming is not the dominant signal, but that most of the inter-annual variability could be due to long-term atmospheric states like the NAO. From the studies above, estimates of the rise globally over the next 50 years due to global warming alone are from 2.5 cm to as much as 15 cm. There has been an underlying trend upward over the last century, and this is expected to continue. Waves Waves are perhaps the most significant marine variable of interest to look at when examining climate change effects on the Grand Banks. A study by Wang and Swail (2001) looked at trends in extreme significant wave heights based on a 40-year hindcast. They found statistically significant trends only in the winter months, and these were found to be connected with the NAO. If the period of study is extended back 100 years, no significant trends were found. A later study by Swail et al. (2004) extended their results to an examination of wave heights in the North Atlantic under accepted climate change scenarios. They found that very significant increases in wave height were expected in the northeast North Atlantic (closer to Europe), but that negligible or negative increases were found in the vicinity of the Grand Banks. Perrie et al. (2004) used high resolution modelling on a current data set of winter storms, and then produced simulations of storms based on a climate change scenario for the period 2041 to They found that while there were fewer total storms in the climate change scenario, there were more numerous strong storms with larger waves, and fewer weaker storms with associated lower wave heights (Perrie et al., 2004). Another study by Lambert (2004) had very similar findings. While it did not explicitly examine wave heights, it found that while there were fewer cyclones in a warmer world, there were an April
50 increased number of intense events. One could infer from this that there would also be associated higher significant wave heights. These results make sense, in that a warmer world would mean a decreased pole-equator temperature gradient, and less total energy available for storms. However, it is not clear what might be driving greater intensity of storms. One possibility would be more frequent tropical storms, since presumably there would be a larger pool of warm water available to support tropical systems. It should be noted that the Grand Banks would be more susceptible to tropical storms in a warmer climate. Typically storms die out when hitting colder ocean water south of Nova Scotia. In a warmer climate, they would be able to maintain intensity farther northward, and would likely be more intense on average as they track over the Grand Banks. This would suggest higher associated peak wave heights. Since the tropical cyclone season lasts from June until November, with a peak in August and September, one would expect to see an increase in peak wave heights during the summer months and also in late fall. Sea Surface Temperatures It is generally accepted that sea surface temperatures will increase by 1 C to 2 C over the next several decades if global warming continues. However, this could be negated to some extent over the Grand Banks, since the Labrador Current flows through the area. With increased glacial melt from Greenland, the Labrador Current would tend to maintain an abundant flow of cold water into the region. Summary In general, the science is inclusive about what marine effects will be felt over the Grand Banks due to global warming. Climate simulations for the next century show almost no change in peak significant wave heights for the western North Atlantic, consistent with recent trends in observed data. Other studies show fewer storms in general, but more numerous strong storms with attendant increased peak significant wave heights. In a warmer world, more tropical storms can be expected to survive farther north, bringing with them higher waves during the tropical storm season. For sea level rise, there is good agreement that sea levels will continue to rise, but disagreement as to how much. Estimates range from less than 5 cm over the next 50 years to as much as 15 cm. Finally, there is considerable uncertainly as to the question of warming sea surface temperatures, since glacial melt north of Newfoundland would exert a cooling influence on the offshore waters. April
51 3.0 REFERENCES Literature Cited AMEC Earth & Environmental. Drill Cuttings Deposition, and Produced Water and Storage Displacement Water Dispersion Modelling. Prepared for ExxonMobil Canada Properties, January AMEC Earth & Environmental. Oceanographic Report White Rose. Prepared for Husky Oil Operations Ltd. several reports between 2003 to Bailey, W. B. Trinity Bay, Newfoundland Survey September Fisheries Research Board of Canada Manuscript Report Series (Oceanographic and Limnological) 10, Canadian Hydrographic Service. Government of Canada. Fisheries and Oceans Canada. Nautical Chart #485101: Newfoundland, Southeast Coast, Trinity Bay Southern Portion, Scale 1:60,000. Quebec, Canadian Hydrographic Service, April, Canadian Hydrographic Service. Government of Canada. Fisheries and Oceans Canada. Nautical Chart #404901: Newfoundland, the Grand Banks, Grand Bank, Northern Portion, to Flemish Pass, Scale 1:400,000. Quebec, Canadian Hydrographic Service, May, Chapman, D.C., and Beardsley, R.C. On the origin of shelf water in the Middle Atlantic Bight. J. Phys. Oceanogr. 19: , Dalley, E. L., Anderson, J. T., and deyoung, B. Atmospheric forcing, larval drift, and recruitment of capelin (Mallotus villosus). ICES Journal of Marine Science 59: , Davidson, F. J. M., Greatbatch, R. J., and deyoung, B. Asymmetry in the response of a stratified coastal embayment to wind forcing. Journal of Geophysical Research 106: , Dupond F, Hannah C.G., Greenberg D.A., Cherniawsky, J.Y., and C.E. Naimie, Modelling System for Tides for the Northwest Atlantic Coastal Ocean. Canadian Technical Report of Hydrograph and Ocean Sciences 221, p.70. ExxonMobil Canada Properties. Description. March 2009 ExxonMobil Upstream Research Company. Hebron Metocean Criteria,. Memo dated 2 September 2009, 91 p April
52 Gregory, D.N., C. Bussard and S. Narayanan. Current Statistics for the Grand Banks and Labrador Shelf. Canadian Data Report of Hydrography and Ocean Sciences 145, p.143, Hu, A., G. A. Meehl, W. Han, and J. Yin. Transient response of the MOC and climate to potential melting of the Greenland Ice Sheet in the 21st century, Geophys. Res. Lett., Kolker, A. S., and S. Hameed. Meteorologically driven trends in sea level rise, Geophys. Res. Lett., 34, L23616, doi: /2007gl Lambert, S.J., Changes in Winter Cyclone Frequencies and Strengths in Transient Enhanced Greenhouse Warming Simulations Using Two Coupled Climate Models, Atmosphere-Ocean, 42(3), Lazier, J.R.N., and Wright, D.G. Annual velocity variations in the Labrador Current. J. Phys. Oceanogr. 23: , Marex. Summary Of Mean And Extreme Water Levels, Including Meteorological Effects, In Bull Arm. November Meteorological Service of Canada, Government of Canada, Environment Canada. Meteorological Service of Canada, 50-year (1954 to 2005) wind and wave hindcast of the North Atlantic. Meteorological Service of Canada, Meteorological Service of Canada (formerly Atmospheric Environment Service (AES)), Government of Canada, Environment Canada. Meteorological Service of Canada 40-year ( ) wind and wave hindcast of the North Atlantic. Meteorological Service of Canada, Oceans Ltd. Currents at Hebron D-94 January 06 April 23, Prepared for Jeanne d Arc Basin Operations. October Perrie, W., J. Jiang, Z. Long, B. Toulany, and W. Zhang, NW Atlantic Wave Estimates and Climate Change. 8 th International Workshop on Wave Hindcasting and Forecasting November 14-19, North Shore, Oahu, Hawaii, USA, Seaconsult Ltd. Data Report: Current, Tide and Weather Data Collected in Bull Arm Between January 10 and March 19, Prepared for Newfoundland Offshore Development Constructors (NODECO). May Seaconsult Ltd. Physical Environmental Data for Production Systems at Terra Nova. Prepared for Petro-Canada Inc April
53 Swail, V.R., V.J. Cardone, M. Ferguson, D.J. Gummer, E.L. Harris, E.A. Orelup and A.T. Cox. The MSC50 Wind and Wave Reanalysis. 9th International Wind and Wave Workshop, September 25-29, Victoria, B.C, Swail, V.R., V.J. Cardone and A.T. Cox. A Long Term North Atlantic Wave Hindcast. 5th International Workshop on Wave Hindcasting and Forecasting. January 26-30, Melbourne, Florida, Topside Engineering. Project Environmental Specifications: Hibernia Management and Development Co. Inc. June 1992 Wang, X. L., and V.R. Swail. Changes of Extreme Wave Heights in Northern Hemisphere Oceans and Related Atmospheric Regimes, Journal of Climate, Vol Yao, T. The response of currents in Trinity Bay, Newfoundland, to local wind forcing. Atmospheric Ocean 24: , Personnel Communications Internet Sites Canadian Hydrographic Service, Tides, Currents and Water Level Website. Ottawa, Ontario: Canadian Hydrographic Service Available at URL: Fisheries and Oceans Canada, Canadian Tides and Water Levels Data Archive Website. Ottawa, Ontario: Fisheries and Oceans Canada 2009a. Available at URL: Station 962 (Long Cove) Station (Hibernia Drill Site 1) Station (Hibernia Drill Site 2) Fisheries and Oceans Canada, Oceanographic Databases Website. Ottawa, Ontario: Fisheries and Oceans Canada 2009b. Available at URL: Fisheries and Oceans Canada, Ocean and Ecosystem Science, Scientific Data and Products: Wave Data for WEL411. Ottawa, Ontario: Fisheries and Oceans Canada 2009c. Available at URL: April
54 Fisheries and Oceans Canada, Tsunami Physics Website. Ottawa, Ontario: Fisheries and Oceans Canada Available at URL: Fisheries and Oceans Canada, Ocean and Ecosystem Science, the Newfoundland Shelf Climatology Website. Ottawa, Ontario: Fisheries and Oceans Canada Available at URL: National Oceanic and Atmospheric Administration (NOAA), National Geophysical Data Center Coastline Extractor Website. U.S.: National Oceanic and Atmospheric Administration, Available at URL: Natural Resources Canada, Earth Sciences Sector, Earthquakes Canada Website. Ottawa, Ontario: Natural Resources Canada Available at URL: Natural Resources Government of Newfoundland and Labrador Canada, Geological Survey, Geological Disasters in Newfoundland and Labrador, Landslides: Southport, Trinity Bay, May Website. Newfoundland and Labrador: Natural Resources Available at URL: Newfoundland and Labrador Heritage, Natural Environment, Landscape, Geological Hazards Website. Newfoundland and Labrador: Newfoundland and Labrador Heritage Available at URL: Oceanweather Inc and Environment Canada, Meteorological Service of Canada MSC50 Website. CT, U.S. and ON, Canada: Oceanweather Inc, Available at URL: U.S. National Geophysical Data Center, Natural Hazards Database Website. National Oceanic and Atmospheric Administration: National Geophysical Data Center Available at URL: Canada-Newfoundland Operational Ocean Forecasting System (C-NOOFS) Government of Canada Website. Ottawa, Ontario: C-NOOFS Available at URL: April
55 Appendix 1 Temperature and Salinity Statistics, Bull Arm
56
57 Depth (m) Temperature ( o C) Std Min Max Mean Dev Salinity (psu) Total Count Min Max Mean January February - No Data March Std Dev Total Count
58 Depth (m) Temperature ( o C) Std Min Max Mean Dev Salinity (psu) Total Count Min Max Mean April May June Std Dev Total Count
59 Depth (m) Temperature ( o C) Std Min Max Mean Dev Salinity (psu) Total Count Min Max Mean June (Cont.) July Std Dev Total Count August
60 Depth (m) Temperature ( o C) Std Min Max Mean Dev Salinity (psu) Total Count Min Max Mean August (Cont.) September October Std Dev Total Count
61 Depth (m) Temperature ( o C) Std Min Max Mean Dev Salinity (psu) Total Count Min Max Mean October (Cont.) November December Std Dev Total Count
62
63 Appendix 2 Significant Wave Height versus Peak Period, Bull Arm, MSC50 Climatology Grid Point M
64
65 Annual Hs (m) Tp (s) Total % Total Total % Exceed January Hs (m) Tp (s) Total % Total Total % Exceed February Hs (m) Tp (s) Total % Total Total % Exceed March Hs (m) Tp (s) Total % Total Total % Exceed April Hs (m) Tp (s) Total % Total Total
66 % Exceed May Hs (m) Tp (s) Total % Total Total % Exceed June Tp (s) Hs (m) Total % Total Total % Exceed July Hs (m) Tp (s) Total % Total Total % Exceed August Hs (m) Tp (s) Total % Total Total % Exceed September Hs (m) Tp (s) Total % Total
67 Total % Exceed October Hs (m) Tp (s) Total % Total Total % Exceed November Hs (m) Tp (s) Total % Total Total % Exceed December Hs (m) Tp (s) Total % Total Total % Exceed
68
69 Appendix 3 Significant Wave Height versus Direction, Bull Arm, MSC50 Climatology Grid Point M
70
71 Note: Wave direction for these Appendix 3 Tables are presented as Direction From YEARLY STATISTICS Height m Direction Total % Total from N NNE NE ENE E ESE SE SSE S SSW SW WSW W WNW NW NNW Total % Exceed MONTHLY STATISTICS January Height m Direction Total % Total from N NNE NE ENE E ESE SE SSE S SSW SW WSW W WNW NW NNW Total % Exceed February Height m Direction Total % Total from N NNE NE ENE E ESE
72 SE SSE S SSW SW WSW W WNW NW NNW Total % Exceed March Height m Direction Total % Total from N NNE NE ENE E ESE SE SSE S SSW SW WSW W WNW NW NNW Total % Exceed April Height m Direction Total % Total from N NNE NE ENE E ESE SE SSE S SSW SW WSW W WNW NW NNW
73 Total % Exceed May Height m Direction Total % Total from N NNE NE ENE E ESE SE SSE S SSW SW WSW W WNW NW NNW Total % Exceed
74 June Height m Direction Total % Total from N NNE NE ENE E ESE SE SSE S SSW SW WSW W WNW NW NNW Total % Exceed July Height m Direction Total % Total from N NNE NE ENE E ESE SE SSE S SSW SW WSW W WNW NW NNW Total % Exceed
75 August Height m Direction Total % Total from N NNE NE ENE E ESE SE SSE S SSW SW WSW W WNW NW NNW Total % Exceed September Height m Direction Total % Total from N NNE NE ENE E ESE SE SSE S SSW SW WSW W WNW NW NNW Total % Exceed
76 October Height m Direction Total % Total from N NNE NE ENE E ESE SE SSE S SSW SW WSW W WNW NW NNW Total % Exceed November Height m Direction Total % Total from N NNE NE ENE E ESE SE SSE S SSW SW WSW W WNW NW NNW Total % Exceed
77 December Height m Direction Total % Total from N NNE NE ENE E ESE SE SSE S SSW SW WSW W WNW NW NNW Total % Exceed
78
79 Appendix 4 Temperature and Salinity Statistics, Hebron Region
80
81
82
83
84
85 Appendix 5 Seasonal Mean Current Speed and Direction, Grand Banks Seasons are defined as: Winter: January to March, Spring: April to June, Summer: July September Fall: October to December The 200 and 1000 m bathymetric contours are shown. Source: Gregory et al
86
87
Currents measurements in the coast of Montevideo, Uruguay
 Currents measurements in the coast of Montevideo, Uruguay M. Fossati, D. Bellón, E. Lorenzo & I. Piedra-Cueva Fluid Mechanics and Environmental Engineering Institute (IMFIA), School of Engineering, Research
COMPARISON OF CONTEMPORANEOUS WAVE MEASUREMENTS WITH A SAAB WAVERADAR REX AND A DATAWELL DIRECTIONAL WAVERIDER BUOY
 COMPARISON OF CONTEMPORANEOUS WAVE MEASUREMENTS WITH A SAAB WAVERADAR REX AND A DATAWELL DIRECTIONAL WAVERIDER BUOY Scott Noreika, Mark Beardsley, Lulu Lodder, Sarah Brown and David Duncalf rpsmetocean.com
Figure 4, Photo mosaic taken on February 14 about an hour before sunset near low tide.
 The Impact on Great South Bay of the Breach at Old Inlet Charles N. Flagg and Roger Flood School of Marine and Atmospheric Sciences, Stony Brook University Since the last report was issued on January 31
SURFACE CURRENTS AND TIDES
 NAME SURFACE CURRENTS AND TIDES I. Origin of surface currents Surface currents arise due to the interaction of the prevailing wis a the ocean surface. Hence the surface wi pattern (Figure 1) plays a key
The impact of ocean bottom morphology on the modelling of long gravity waves from tides and tsunami to climate
 The impact of ocean bottom morphology on the modelling of long gravity waves from tides and tsunami to climate Christian Le Provost and Florent Lyard Laboratoire d Etudes en Géophysique et Océanographie
APPENDIX G WEATHER DATA SELECTED EXTRACTS FROM ENVIRONMENTAL DATA FOR BCFS VESSEL REPLACEMENT PROGRAM DRAFT REPORT
 APPENDIX G WEATHER DATA SELECTED EXTRACTS FROM ENVIRONMENTAL DATA FOR BCFS VESSEL REPLACEMENT PROGRAM DRAFT REPORT Prepared for: B.C. Ferries Services Inc. Prepared by: George Roddan, P.Eng. Roddan Engineering
Directed Reading. Section: Ocean Currents. a(n). FACTORS THAT AFFECT SURFACE CURRENTS
. FACTORS THAT AFFECT SURFACE CURRENTS") Skills Worksheet Directed Reading Section: Ocean Currents 1. A horizontal movement of water in a well-defined pattern is called a(n). 2. What are two ways that oceanographers identify ocean currents? 3.
Skills Worksheet Directed Reading Section: Ocean Currents 1. A horizontal movement of water in a well-defined pattern is called a(n). 2. What are two ways that oceanographers identify ocean currents? 3.
Technical Brief - Wave Uprush Analysis Island Harbour Club, Gananoque, Ontario
 Technical Brief - Wave Uprush Analysis RIGGS ENGINEERING LTD. 1240 Commissioners Road West Suite 205 London, Ontario N6K 1C7 October 31, 2014 Table of Contents Section Page Table of Contents... i List
An Atlas of Oceanic Internal Solitary Waves (February 2004) by Global Ocean Associates Prepared for Office of Naval Research Code 322 PO
 by Global Ocean Associates Prepared for Office of Naval Research Code 322 PO") Overview The is located in the North Atlantic Ocean between southern Ireland and southwest England (Figure 1). The Sea s western edge covers a continental shelf region characterized by rough and irregular
Overview The is located in the North Atlantic Ocean between southern Ireland and southwest England (Figure 1). The Sea s western edge covers a continental shelf region characterized by rough and irregular
OCEANOGRAPHY STUDY GUIDE
 OCEANOGRAPHY STUDY GUIDE Chapter 2 Section 1 1. Most abundant salt in ocean. Sodium chloride; NaCl 2. Amount of Earth covered by Water 71% 3. Four oceans: What are they? Atlantic, Pacific, Arctic, Indian
Appendix 5: Currents in Minas Basin. (Oceans Ltd. 2009)
") Appendix 5: Currents in Minas Basin (Oceans Ltd. 29) Current in Minas Basin May 1, 28 March 29, 29 Submitted To: Minas Basin Pulp and Power P.O. Box 41 53 Prince Street Hansport, NS, BP 1P by 22, Purdy
Appendix 5: Currents in Minas Basin (Oceans Ltd. 29) Current in Minas Basin May 1, 28 March 29, 29 Submitted To: Minas Basin Pulp and Power P.O. Box 41 53 Prince Street Hansport, NS, BP 1P by 22, Purdy
The events associated with the Great Tsunami of 26 December 2004 Sea Level Variation and Impact on Coastal Region of India
 The events associated with the Great Tsunami of 26 December 2004 Sea Level Variation and Impact on Coastal Region of India Satish R. Shetye National Institute of Oceanography, Goa Tsunamis are shallow-water
BILLY BISHOP TORONTO CITY AIRPORT PRELIMINARY RUNWAY DESIGN COASTAL ENGINEERING STUDY
 Bâtiment Infrastructures municipales Transport Industriel Énergie Environnement BILLY BISHOP TORONTO CITY AIRPORT PRELIMINARY RUNWAY DESIGN COASTAL ENGINEERING STUDY N. Guillemette 1, C. Glodowski 1, P.
COMPARISON OF DEEP-WATER ADCP AND NDBC BUOY MEASUREMENTS TO HINDCAST PARAMETERS. William R. Dally and Daniel A. Osiecki
 COMPARISON OF DEEP-WATER ADCP AND NDBC BUOY MEASUREMENTS TO HINDCAST PARAMETERS William R. Dally and Daniel A. Osiecki Surfbreak Engineering Sciences, Inc. 207 Surf Road Melbourne Beach, Florida, 32951
Yellow Sea with contributions by John R. Apel
 with contributions by John R. Apel Overview The is a shallow inland sea lying between northeastern China and the Korean Peninsula, with depths in its central north-south trough in excess of 60 to 80 m
Chapter 22, Section 1 - Ocean Currents. Section Objectives
 Chapter 22, Section 1 - Ocean Currents Section Objectives Intro Surface Currents Factors Affecting Ocean Currents Global Wind Belts (you should draw and label a diagram of the global wind belts) The Coriolis
OCN 201 Tides. Tsunamis, Tides and other long waves
 OCN 201 Tides Tsunamis, Tides and other long waves Storm surges Caused by winds and low atmospheric pressure associated with large storms Can raise sea surface by up to 25 ft, bottom contours magnify effect
Waves. G. Cowles. General Physical Oceanography MAR 555. School for Marine Sciences and Technology Umass-Dartmouth
 Waves G. Cowles General Physical Oceanography MAR 555 School for Marine Sciences and Technology Umass-Dartmouth Waves Sound Waves Light Waves Surface Waves Radio Waves Tidal Waves Instrument Strings How
Influence of oceanographic processes on coastal erosion, morphology and inundation
 FACULTY OF ENGINEERING, COMPUTING AND MATHEMATICS Influence of oceanographic processes on coastal erosion, morphology and inundation Charitha Pattiaratchi School of Civil, Environmental and Mining Engineering
Compiled by Uwe Dornbusch. Edited by Cherith Moses
 REPORT ON WAVE AND TIDE MEASUREMENTS Compiled by Uwe Dornbusch. Edited by Cherith Moses 1 Aims...1 2 Summary...1 3 Introduction...1 4 Site selection...1 5 Wave recorder settings...2 6 Results...2 6.1 Water
Technical Brief - Wave Uprush Analysis 129 South Street, Gananoque
 Technical Brief - Wave Uprush Analysis 129 South Street, Gananoque RIGGS ENGINEERING LTD. 1240 Commissioners Road West Suite 205 London, Ontario N6K 1C7 June 12, 2013 Table of Contents Section Page Table
DUXBURY WAVE MODELING STUDY
 DUXBURY WAVE MODELING STUDY 2008 Status Report Duncan M. FitzGerald Peter S. Rosen Boston University Northeaster University Boston, MA 02215 Boston, MA 02115 Submitted to: DUXBURY BEACH RESERVATION November
Taranaki Tsunami Inundation Analysis. Prepared for Taranaki Civil Defence Emergency Management Group. Final Version
 Taranaki Tsunami Inundation Analysis Prepared for Taranaki Civil Defence Emergency Management Group Final Version June 2012 AM 12/07 HBRC Plan Number 4362 Asset Management Group Technical Report Prepared
FIELD MEASUREMENTS OF SURFACE SUSPENDED SEDIMENT CONCENTRATION IN THE YANGTZE ESTUARY, CHINA
 International Conference on Estuaries and Coasts November 9-11, 2003, Hangzhou, China FIELD MEASUREMENTS OF SURFACE SUSPENDED SEDIMENT CONCENTRATION IN THE YANGTZE ESTUARY, CHINA Qing HE, Zhiying YU, Yuanye
Available online at ScienceDirect. Procedia Engineering 116 (2015 )
") Available online at www.sciencedirect.com ScienceDirect Procedia Engineering 116 (2015 ) 320 325 8th International Conference on Asian and Pacific Coasts (APAC 2015) Department of Ocean Engineering, IIT
Available online at www.sciencedirect.com ScienceDirect Procedia Engineering 116 (2015 ) 320 325 8th International Conference on Asian and Pacific Coasts (APAC 2015) Department of Ocean Engineering, IIT
Wind Resource Assessment for NOME (ANVIL MOUNTAIN), ALASKA Date last modified: 5/22/06 Compiled by: Cliff Dolchok
, ALASKA Date last modified: 5/22/06 Compiled by: Cliff Dolchok") 813 W. Northern Lights Blvd. Anchorage, AK 99503 Phone: 907-269-3000 Fax: 907-269-3044 www.akenergyauthority.org SITE SUMMARY Wind Resource Assessment for NOME (ANVIL MOUNTAIN), ALASKA Date last modified:
813 W. Northern Lights Blvd. Anchorage, AK 99503 Phone: 907-269-3000 Fax: 907-269-3044 www.akenergyauthority.org SITE SUMMARY Wind Resource Assessment for NOME (ANVIL MOUNTAIN), ALASKA Date last modified:
Oceans - Laboratory 12
 Oceans - Laboratory 12 (Name) How do ocean waves form? All waves are disturbances of a fluid medium through which energy is moved (Davis, 1997). Ocean waves travel on the interface between oceans and the
THE WAVE CLIMATE IN THE BELGIAN COASTAL ZONE
 THE WAVE CLIMATE IN THE BELGIAN COASTAL ZONE Toon Verwaest, Flanders Hydraulics Research, toon.verwaest@mow.vlaanderen.be Sarah Doorme, IMDC, sarah.doorme@imdc.be Kristof Verelst, Flanders Hydraulics Research,
Mango Bay_Resort. Fiji nearshore wave hindcast ' ' 19 00'
 Mango Bay_Resort Fiji nearshore wave hindcast 1 00' 1 30' 1 00' 177 00' 177 30' 17 00' 17 30' Figure 1. Location maps of the site. The map on the left shows the region. The map on the right shows the island
Coastal Wave Studies FY13 Summary Report
 DISTRIBUTION STATEMENT A. Approved for public release; distribution is unlimited. Coastal Wave Studies FY13 Summary Report Jeffrey L. Hanson US Army Corps of Engineers, Field Research Facility 1261 Duck
Metocean criteria for fatigue assessment. Rafael V. Schiller 5th COPEDI Seminar, Oct 8th 2014.
 Metocean criteria for fatigue assessment Rafael V. Schiller 5th COPEDI Seminar, Oct 8th 2014. Metocean requirements along the lifecycle of a project Metocean criteria for fatigue Analysis techniques and
Wave Energy Atlas in Vietnam
 Wave Energy Atlas in Vietnam Nguyen Manh Hung, Duong Cong Dien 1 1 Institute of Mechanics, 264 Doi Can Str. Hanoi, Vietnam nmhungim@gmail.com; duongdienim@gmail.com Abstract Vietnam has achieved remarkable
Impact of the tides, wind and shelf circulation on the Gironde river plume dynamics
 Impact of the tides, wind and shelf circulation on the Gironde river plume dynamics F. Toublanc 1, N. Ayoub 2, P. Marsaleix 3, P. De Mey 2 1 CNES/LEGOS 2 CNRS/LEGOS 3 CNRS/LA, Toulouse, France 5th GODAE
CROSS-SHORE SEDIMENT PROCESSES
 The University of the West Indies Organization of American States PROFESSIONAL DEVELOPMENT PROGRAMME: COASTAL INFRASTRUCTURE DESIGN, CONSTRUCTION AND MAINTENANCE A COURSE IN COASTAL DEFENSE SYSTEMS I CHAPTER
Sand Bank Passage. Fiji nearshore wave hindcast ' ' 19 00'
 Sand Bank Passage Fiji nearshore wave hindcast 1 00' 1 00' 1 30' 1 00' 177 00' 177 30' 17 00' 17 30' 17 30' Figure 1. Location maps of the site. The map on the left shows the region. The map on the right
Kavala Bay. Fiji nearshore wave hindcast ' ' 19 00'
 Kavala Bay Fiji nearshore wave hindcast 1 00' 19 00' 1 30' 19 00' 1 00' 1 30' 1 00' 1 30' 1 30' Figure 1. Location maps of the site. The map on the left shows the region. The map on the right shows the
Properties. terc.ucdavis.edu 8
 Physical Properties 8 Lake surface level Daily since 1900 The lowest lake level on record was 6,220.26 feet on Nov. 30, 1992. Since 1900, lake level has varied by more than 10 feet. Lake level typically
Cacouna Energy Gros-Cacouna, Quebec. LNG Receiving Terminal. Metocean Summary
 Cacouna Energy Gros-Cacouna, Quebec LNG Receiving Terminal Metocean Summary April 2006 142829 Prepared by: Stephen Ramsay Ph.D., P. Eng. Reviewed by: Charlie Birt P. Eng NOTICE This document is for the
CHAPTER 134 INTRODUCTION
 CHAPTER 134 NEW JETTIES FOR TUNG-KANG FISHING HARBOR, TAIWAN Chi-Fu Su Manager Engineering Department Taiwan Fisheries Consultants, Inc. Taipei, Taiwan INTRODUCTION Tung-Kang Fishing Harbor, which is about
Volume and Shoreline Changes along Pinellas County Beaches during Tropical Storm Debby
 Volume and Shoreline Changes along Pinellas County Beaches during Tropical Storm Debby Ping Wang and Tiffany M. Roberts Coastal Research Laboratory University of South Florida July 24, 2012 Introduction
COMPARISON OF CONTEMPORANEOUS WAVE MEASUREMENTS WITH A SAAB WAVERADAR REX AND A DATAWELL DIRECTIONAL WAVERIDER BUOY
 31 Bishop Street, Jolimont Western Australia 6014 T +61 8 9387 7955 F +61 8 9387 6686 E info@rpsmetocean.com W rpsmetocean.com & rpsgroup.com.au COMPARISON OF CONTEMPORANEOUS WAVE MEASUREMENTS WITH A SAAB
WIND SPEED LENGTH OF TIME WIND BLOWS (Duration) DISTANCE OVER WHICH IT BLOWS (Fetch)
 DISTANCE OVER WHICH IT BLOWS (Fetch)") WAVES Up and down movement of ocean surface Transportation of energy across the water over vast distances If not stopped by anything, waves can travel entire oceans Size and speed depend upon: WIND SPEED
WAVES Up and down movement of ocean surface Transportation of energy across the water over vast distances If not stopped by anything, waves can travel entire oceans Size and speed depend upon: WIND SPEED
Chapter 10 Lecture Outline. The Restless Oceans
 Chapter 10 Lecture Outline The Restless Oceans Focus Question 10.1 How does the Coriolis effect influence ocean currents? The Ocean s Surface Circulation Ocean currents Masses of water that flow from one
page - Laboratory Exercise #5 Shoreline Processes
 page - Laboratory Exercise #5 Shoreline Processes Section A Shoreline Processes: Overview of Waves The ocean s surface is influenced by three types of motion (waves, tides and surface currents). Shorelines
Nortek Technical Note No.: TN-021. Chesapeake Bay AWAC Evaluation
 Nortek Technical Note No.: TN-021 Title: Chesapeake Bay AWAC Evaluation Last Edited: October 5, 2004 Authors: Eric Siegel-NortekUSA, Chris Malzone-NortekUSA, Torstein Pedersen- Number of Pages: 12 Chesapeake
Appendix E Cat Island Borrow Area Analysis
 Appendix E Cat Island Borrow Area Analysis ERDC/CHL Letter Report 1 Cat Island Borrow Area Analysis Multiple borrow area configurations were considered for Cat Island restoration. Borrow area CI1 is located
Geostrophic and Tidal Currents in the South China Sea, Area III: West Philippines
 Southeast Asian Fisheries Development Center Geostrophic and Tidal Currents in the South China Sea, Area III: West Philippines Anond Snidvongs Department od Marine Science, Chulalongkorn University, Bangkok
Structure and discharge test cases
 Chapter 28 Structure and discharge test cases 28.1 Introduction Three test case have been implemented to test the performance and applicability of the structures and discharges modules. drythin Simulates
Earth s oceans covers 71 % _ of the planet s surface. In reality, Earth s ocean waters are all. interconnected as part of a single large global ocean.
 Ocean Motion Met 101: Introduction to the World's Oceans Produced by The COMET Program Geography: Name Pd. Earth s oceans covers 71 % _ of the planet s surface. In reality, Earth s ocean waters are all
Sea State Analysis. Topics. Module 7 Sea State Analysis 2/22/2016. CE A676 Coastal Engineering Orson P. Smith, PE, Ph.D.
 Sea State Analysis Module 7 Orson P. Smith, PE, Ph.D. Professor Emeritus Module 7 Sea State Analysis Topics Wave height distribution Wave energy spectra Wind wave generation Directional spectra Hindcasting
IMPACTS OF COASTAL PROTECTION STRATEGIES ON THE COASTS OF CRETE: NUMERICAL EXPERIMENTS
 IMPACTS OF COASTAL PROTECTION STRATEGIES ON THE COASTS OF CRETE: NUMERICAL EXPERIMENTS Tsanis, I.K., Saied, U.M., Valavanis V. Department of Environmental Engineering, Technical University of Crete, Chania,
Examples of Carter Corrected DBDB-V Applied to Acoustic Propagation Modeling
 Naval Research Laboratory Stennis Space Center, MS 39529-5004 NRL/MR/7182--08-9100 Examples of Carter Corrected DBDB-V Applied to Acoustic Propagation Modeling J. Paquin Fabre Acoustic Simulation, Measurements,
Appendix D: SWAN Wave Modelling
 Appendix D: SWAN Wave Modelling D.1 Preamble The Eurobodalla Shire Council area is subject to extreme waves originating from offshore storms. When swell waves approach the coast, they are modified by the
THE RESPONSE OF THE GULF OF MAINE COASTAL CURRENT SYSTEM TO LATE-SPRING
 THE RESPONSE OF THE GULF OF MAINE COASTAL CURRENT SYSTEM TO LATE-SPRING NORTHEASTERLY WIND FORCING Neal R Pettigrew and Huijie Xue School of Marine Sciences University of Maine, Orono ME 04469 The Gulf
April 7, Prepared for: The Caribbean Disaster Emergency Response Agency Prepared by: CEAC Solutions Co. Ltd.
 April 7, 2006 Prepared for: The Caribbean Disaster Emergency Response Agency Prepared by: Introduction CEAC Solutions Co. Ltd was commissioned in May 2005 to prepare coastal beach erosion hazard maps for
Water circulation in Dabob Bay, Washington: Focus on the exchange flows during the diurnal tide transitions
 Water circulation in Dabob Bay, Washington: Focus on the exchange flows during the diurnal tide transitions Jeong-in Kang School of Oceanography University of Washington (206) 349-7319 nortiumz@u.washington.edu
Lesson: Ocean Circulation
 Lesson: Ocean Circulation By Keith Meldahl Corresponding to Chapter 9: Ocean Circulation As this figure shows, there is a connection between the prevailing easterly and westerly winds (discussed in Chapter
Training program on Modelling: A Case study Hydro-dynamic Model of Zanzibar channel
 Training program on Modelling: A Case study Hydro-dynamic Model of Zanzibar channel Mayorga-Adame,C.G., Sanga,I.P.L., Majuto, C., Makame, M.A., Garu,M. INTRODUCTION Hydrodynamic Modeling In understanding
Kodiak, Alaska Site 1 Wind Resource Report
 Kodiak, Alaska Site 1 Wind Resource Report Report written by: Douglas Vaught, P.E., V3 Energy LLC, Eagle River, AK Date of report: March 16, 2007 Photo by Doug Vaught, V3 Energy LLC Summary Information
Prediction of Nearshore Waves and Currents: Model Sensitivity, Confidence and Assimilation
 Prediction of Nearshore Waves and Currents: Model Sensitivity, Confidence and Assimilation H. Tuba Özkan-Haller College of Oceanic and Atmospheric Sciences Oregon State University, 104 Ocean Admin Bldg
Map Showing NAFO Management Units
 Map Showing NAFO Management Units Biology Are 6 species of seals in Atlantic Canadian waters, all of which occur in Newfoundland Two Arctic Species (Ringed, Bearded) Two temperate (Grey, Harbour) Two migratory
The Impact on Great South Bay of the Breach at Old Inlet Charles N. Flagg School of Marine and Atmospheric Sciences, Stony Brook University
 The Impact on Great South Bay of the Breach at Old Inlet Charles N. Flagg School of Marine and Atmospheric Sciences, Stony Brook University The previous report provided a detailed look at the conditions
HARBOUR SEDIMENTATION - COMPARISON WITH MODEL
 HARBOUR SEDIMENTATION - COMPARISON WITH MODEL ABSTRACT A mobile-bed model study of Pointe Sapin Harbour, in the Gulf of St. Lawrence, resulted in construction of a detached breakwater and sand trap to
Draft Kivalina Wind Resource Report
 Draft Kivalina Wind Resource Report Kivalina aerial photo by Doug Vaught, July 2011 May 31, 2012 Douglas Vaught, P.E. dvaught@v3energy.com V3 Energy, LLC Eagle River, Alaska Draft Kivalina Wind Resource
Name Class Date. Use the terms from the following list to complete the sentences below. Each term may be used only once. Some terms may not be used.
 Assessment Chapter Test B The Movement of Ocean Water USING KEY TERMS Use the terms from the following list to complete the sentences below. Each term may be used only once. Some terms may not be used.
Buckland Wind Resource Report
 Buckland Wind Resource Report By: Douglas Vaught, P.E., V3 Energy LLC, Eagle River, Alaska Date: September 17, 2010 Buckland met tower; D. Vaught photo Contents Summary... 2 Test Site Location... 2 Photographs...
Avaavaroa passage. Rarotonga nearshore wave hindcast 21 09' 21 12' 21 15' 21 18' ' ' ' '
 Avaavaroa passage Rarotonga nearshore wave hindcast 21 09' 21 ' Fuel Pipeline Avatiu Passage Black Rock Avarua Passage Pue Tupapa Papua Passage Avaavaroa Passage 21 15' Ngatangiia Passage onga Wave Hotspot
windnavigator Site Analyst Report
 windnavigator Site Analyst Report for Central NY Created for Stephen Meister April 27, 2010 ID NUMBER: N2-128 AWS Truepower, LLC Albany - Barcelona - Bangalore p: +1.518.21.00 e: info@awstruepower.com
Kodiak, Alaska Site 1 Wind Resource Report for Kodiak Electric Association
 Kodiak, Alaska Site 1 Wind Resource Report for Kodiak Electric Association Report written by: Douglas Vaught, V3 Energy LLC, Eagle River, AK Date of report: August 23, 2006 Photo Doug Vaught General Site
Understanding the Tsunami Wave
 The First Tsunami attack on Sri Lanka Krakatoa Island 27 th August 1883 Understanding the Tsunami Wave Generation Propagation Nearshore Transformation Shoreline Entry Inland Dissipation 1 Generation and
Lecture Outlines PowerPoint. Chapter 15 Earth Science, 12e Tarbuck/Lutgens
 Lecture Outlines PowerPoint Chapter 15 Earth Science, 12e Tarbuck/Lutgens 2009 Pearson Prentice Hall This work is protected by United States copyright laws and is provided solely for the use of instructors
WOODFIBRE LNG VESSEL WAKE ASSESSMENT
 Woodfibre LNG Limited WOODFIBRE LNG VESSEL WAKE ASSESSMENT Introduction Woodfibre LNG Limited (WLNG) intends to build a new LNG export terminal at Woodfibre, Howe Sound, British Columbia. WLNG has engaged
Southern Gulf of St. Lawrence Sea Scallop
 DFO Science Stock Status Report C3-16 (1998) 21 22 23 24 Southern Gulf of St. Lawrence Sea Scallop Background The sea scallop (Placopecten magellanicus), is a bivalve mollusc found only in the north-western
The Setting - Climatology of the Hawaiian Archipelago. Link to Video of Maui Waves
 The Setting - Climatology of the Hawaiian Archipelago Link to Video of Maui Waves What caused this week s weather? What caused this weekend s weather? Today s Objective: Provide overview and description
2 Wave storm characterization
 Wave storm characterization Wave storm characterization.1 The region of study The Southern Catalan coast is located on the NW Mediterranean Sea (Figure -1).The area is characterized by a complex coastal
Australian Northwest Shelf
 Overview The Australian Northwest shelf extends roughly 2000 km along the coast of Western Australia (Figure 1). The region is influenced by part of the South Equatorial Current that runs southwest out
THE CIRCULATION IN THE NORTERN PART OF THE DENMARK STRAIT AND ITS VARIABILITY ABSTRACT
 ICES em 19991L:06 THE CIRCULATION IN THE NORTERN PART OF THE DENMARK STRAIT AND ITS VARIABILITY Steingrimur J6nsson Marine Research Institute and University of Akureyri, Glenirgata 36, 600 Akureyri, Iceland,
SIO 210 Introduction to Physical Oceanography Mid-term examination November 4, 2013; 50 minutes
 SIO 210 Introduction to Physical Oceanography Mid-term examination November 4, 2013; 50 minutes Closed book; one sheet of your own notes is allowed. A calculator is allowed. (100 total points.) Possibly
ASL Environmental Sciences inc.
 A Member of the SNC LAVALIN Group ASL Environmental Sciences inc. Gros Cacouna LNG Terminal Final report Drifter tracking study 501728 December 2004 Rev. 02 ENVIRONMENT Drifter tracking study Procean
Sea State Report. Chapel Point wave buoy, RP037/L/2013 December Title here in 8pt Arial (change text colour to black) i
 i") Sea State Report Chapel Point wave buoy, 2012-2013 RP037/L/2013 December 2013 Title here in 8pt Arial (change text colour to black) i We are the Environment Agency. We protect and improve the environment
Sea State Report Chapel Point wave buoy, 2012-2013 RP037/L/2013 December 2013 Title here in 8pt Arial (change text colour to black) i We are the Environment Agency. We protect and improve the environment
SIO 210 Problem Set 3 November 4, 2011 Due Nov. 14, 2011
 SIO 210 Problem Set 3 November 4, 2011 Due Nov. 14, 2011 1. At 20 N, both the ocean and the atmosphere carry approximately 2 PW of heat poleward, for a total of about 4 PW (see figure). If (at this latitude)
STATUS REPORT FOR THE SUBMERGED REEF BALL TM ARTIFICIAL REEF SUBMERGED BREAKWATER BEACH STABILIZATION PROJECT FOR THE GRAND CAYMAN MARRIOTT HOTEL
 August 23 STATUS REPORT FOR THE SUBMERGED REEF BALL TM ARTIFICIAL REEF SUBMERGED BREAKWATER BEACH STABILIZATION PROJECT FOR THE GRAND CAYMAN MARRIOTT HOTEL performed by Lee E. Harris, Ph.D., P.E. Consulting
Wave climate in the Baltic Sea 2010
 Wave climate in the Baltic Sea 2010 Authors: Heidi Pettersson, Marine Research, Finnish Meteorological Institute Helma Lindow, Swedish Meteorological and Hydrological Institute Dieter Schrader, Bundesamt
Variability in the tropical oceans - Monitoring and prediction of El Niño and La Niña -
 Variability in the tropical oceans - Monitoring and prediction of El Niño and La Niña - Jun ichi HIROSAWA Climate Prediction Division Japan Meteorological Agency SST anomaly in Nov. 1997 1 ( ) Outline
Low-crested offshore breakwaters: a functional tool for beach management
 Environmental Problems in Coastal Regions VI 237 Low-crested offshore breakwaters: a functional tool for beach management K. Spyropoulos & E. Andrianis TRITON Consulting Engineers, Greece Abstract Beach
Eastern Equatorial Pacific
 Overview The is the region of open ocean directly south of Mexico and Central America (between approximately 4 o to 16 o N, and 85 o to 105 o W) (Figure 1). Major bathymetric features include Guatemala
Atqasuk Wind Resource Report
 Atqasuk Wind Resource Report Report by: Douglas Vaught, P.E., V3 Energy LLC, Eagle River, Alaska Date of Report: August 26, 2010 Atqasuk met tower; D. Vaught photo Contents Summary... 2 Test Site Location...
OCEAN WAVES NAME. I. Introduction
 NAME OCEAN WAVES I. Introduction The physical definition of a wave is a disturbance that transmits energy from one place to another. In the open ocean waves are formed when wis blowing across the water
An Atlas of Oceanic Internal Solitary Waves (February 2004) by Global Ocean Associates Prepared for Office of Naval Research Code 322 PO
 by Global Ocean Associates Prepared for Office of Naval Research Code 322 PO") Overview The is located in the western Pacific Ocean north of the Indonesian Island of Celebes and south of the Sulu Sea and the Philippines (Figure 1). It is a deep-water sea, roughly circular with several
Overview The is located in the western Pacific Ocean north of the Indonesian Island of Celebes and south of the Sulu Sea and the Philippines (Figure 1). It is a deep-water sea, roughly circular with several
The ocean water is dynamic. Its physical
 CHAPTER MOVEMENTS OF OCEAN WATER The ocean water is dynamic. Its physical characteristics like temperature, salinity, density and the external forces like of the sun, moon and the winds influence the movement
Suva. Fiji. A copy of this report is available at ' ' 18 30' 19 00' ' ' ' '
 Suva Fiji 16 17 30' 17 1 00' 1 1 30' 1 20 1 00' 177 17 17 10 17 17 177 30' 17 00' 17 30' 17 00' Figure 1. Location maps of the site. The map on the left shows the region. The map on the right shows the
Nature Of Marine winds, Waves and Swells over West African Coasts Case study of Victoria Island beach in Lagos, Nigeria
 Nature Of Marine winds, Waves and Swells over West African Coasts Case study of Victoria Island beach in Lagos, Nigeria By S. O. Gbuyiro and E. Olaniyan Marine Unit, Nigeria Meteorological Agency, Lagos
3 The monsoon currents in an OGCM
 3 The monsoon currents in an OGCM The observations show that both Ekman drift and geostrophy contribute to the surface circulation in the north Indian Ocean. The former decays rapidly with depth, but the
Imprints of Coastal Mountains on Ocean Circulation and Variability
 Imprints of Coastal Mountains on Ocean Circulation and Variability Shang-Ping Xie 1 with C.-H. Chang 1, W. Zhuang 2, N. Schneider 1, J. Small 3, B. Taguchi 4, and H. Sasaki 4 1 IPRC, University of Hawaii
CHAPTER 7 Ocean Circulation
 1 2 3 4 5 6 7 8 9 10 11 12 13 14 CHAPTER 7 Ocean Circulation Words Ocean currents Moving seawater Surface ocean currents Transfer heat from warmer to cooler areas Similar to pattern of major wind belts
The Movement of Ocean Water. Currents
 The Movement of Ocean Water Currents Ocean Current movement of ocean water that follows a regular pattern influenced by: weather Earth s rotation position of continents Surface current horizontal movement
CVEN Computer Applications in Engineering and Construction. Programming Assignment #4 Analysis of Wave Data Using Root-Finding Methods
 CVEN 30-501 Computer Applications in Engineering and Construction Programming Assignment #4 Analysis of Wave Data Using Root-Finding Methods Date distributed: 9/30/016 Date due: 10/14/016 at 3:00 PM (electronic
Tidal regime along Vietnam coast under impacts of sea level rise
 VNU Journal of Science, Earth Sciences 28 (2012) 133-139 Tidal regime along Vietnam coast under impacts of sea level rise Tran Thuc, Duong Hong Son* Vietnam Institute of Meteorology, Hydrology and Environment
TAC Reported Landings * - By-catch only
 DFO Atlantic Fisheries Stock Status Report 96/68E 4Vn 3Ps 4W 4Vs EASTERN SCOTIAN SHELF HADDOCK Background Haddock on the eastern Scotian Shelf and southern Gulf of St. Lawrence are considered as a single
Ngatangiia passage. Rarotonga nearshore wave hindcast 21 09' 21 12' 21 15' 21 15' 21 18' ' ' ' '
 Ngatangiia passage Rarotonga nearshore wave hindcast 21 0' 21 ' Fuel Pipeline Avatiu Passage Black Rock Avarua Passage Pue Tupapa Ngatangiia Passage 21 15' Ngatangiia Passage onga Wave Hotspot Rutaki Passage