Cardiff School of Sport DISSERTATION ASSESSMENT PROFORMA: Empirical 1
|
|
|
- Derek Gordon
- 5 years ago
- Views:
Transcription
1 Cardiff School of Sport DISSERTATION ASSESSMENT PROFORMA: Empirical 1 Student name: Joshua Francis Hacker Student ID: St Programme: SES Dissertation title: Supervisor: Comparative analysis of patterns of attacking play in elite International football Dr Stephen-Mark Cooper Comments Section Title and Abstract (5%) Title to include: A concise indication of the research question/problem. Abstract to include: A concise summary of the empirical study undertaken. Introduction and literature review (25%) To include: outline of context (theoretical/conceptual/applied) for the question; analysis of findings of previous related research including gaps in the literature and relevant contributions; logical flow to, and clear presentation of the research problem/ question; an indication of any research expectations, (i.e., hypotheses if applicable). Methods and Research Design (15%) To include: details of the research design and justification for the methods applied; participant details; comprehensive replicable protocol. Results and Analysis (15%) 2 To include: description and justification of data treatment/ data analysis procedures; appropriate presentation of analysed data within text and in tables or figures; description of critical findings. Discussion and Conclusions (30%) 2 To include: collation of information and ideas and evaluation of those ideas relative to the extant literature/concept/theory and research question/problem; adoption of a personal position on the study by linking and combining different elements of the data reported; discussion of the real-life impact of your research findings for coaches and/or practitioners (i.e. practical implications); discussion of the limitations and a critical reflection of the approach/process adopted; and indication of potential improvements and future developments building on the study; and a conclusion which summarises the relationship between the research question and the major findings. Presentation (10%) To include: academic writing style; depth, scope and accuracy of referencing in the text and final reference list; clarity in organisation, formatting and visual presentation 1 This form should be used for both quantitative and qualitative dissertations. The descriptors associated with both quantitative and qualitative dissertations should be referred to by both students and markers. 2 There is scope within qualitative dissertations for the RESULTS and DISCUSSION sections to be presented as a combined section followed by an appropriate CONCLUSION. The mark distribution and criteria across these two sections should be aggregated in those circumstances.
2 CARDIFF METROPOLITAN UNIVERSITY Prifysgol Fetropolitan Caerdydd CARDIFF SCHOOL OF SPORT DEGREE OF BACHELOR OF SCIENCE (HONOURS) SPORT AND EXERCISE SCIENCE Comparative analysis of patterns of attacking play in elite International football (Dissertation submitted under the discipline of Performance analysis) JOSHUA FRANCIS HACKER ST
3 COMPARATIVE ANALYSIS OF PATTERNS OF ATTACKING PLAY IN ELITE INTERNATIONAL FOOTBALL
4 Cardiff Metropolitan University Prifysgol Fetropolitan Caerdydd Certificate of student By submitting this document, I certify that the whole of this work is the result of my individual effort, that all quotations from books and journals have been acknowledged, and that the word count given below is a true and accurate record of the words contained (omitting contents pages, acknowledgements, indices, tables, figures, plates, reference list and appendices). Word count: Name: Joshua Francis Hacker Date: 21/03/2014 Certificate of Dissertation Supervisor responsible I am satisfied that this work is the result of the student s own effort. I have received dissertation verification information from this student Name: Date: Notes: The University owns the right to reprint all or part of this document.
5 Table of Contents Page No: Acknowledgements ABSTRACT i ii CHAPTER ONE: Introduction 1.1 Football Principles of Play Match Analysis Why is Match Analysis Undertaken? The World Cup Direction of the present study Hypotheses Definition of terms 4 CHAPTER TWO: Literature Review 2.1 Performance Analysis in Sport Feedback Notational Analysis Match Analysis Hand Notation Vs Computerisation Operational Definitions Validity and Reliability Performance Indicators Aim of the present study Sportscode 15
6 CHAPTER THREE: Methodology 3.1 Introduction Equipment Data Research Design Operational Definitions Procedures Pilot Study Reliability Testing Data Processing Mann-Whitney U test 24 CHAPTER FOUR: Results 4.1 Reliability results Reliability of outcomes of possession Time based reliability Passing sequence Negative outcome of possession Positive outcomes of possessions Shot at goal Possession 36 CHAPTER FIVE: Discussion 5.1 Introduction Reliability Discussion of Findings Passing sequences Negative outcomes of possession 40
7 5.3.3 Positive outcomes of possession Possession Implications of findings Sample issues Delimitations 45 CHAPTER SIX: Conclusion 6.1 Conclusions of the study Limitations of the study Sample size Data collection Television footage Strengths of the present study Sample Post event computerised analysis Outcomes of possession Passing sequences Recommendations for future research 50 REFERENCES AND BIBLIOGRAPHY 51
8 List of Tables Table Title Page No 1. Matches analysed General operational definitions Operational definitions of negative outcomes Operational definitions of positive outcomes Strength of agreement Level of Significance Time based reliability Statistical Analysis: passing sequences Statistical Analysis: negative outcomes of possession Statistical Analysis: positive outcomes of possession Statistical Analysis: shots at goal Average shot accuracy Statistical Analysis: shot accuracy Average team match possession Statistical Analysis: Possession 37
9 List of Figures Figure Title Page No 1. Principles of Play 1 2. The coaching cycle 3 3. Text label Code buttons Possession buttons Kappa scores Passing sequences for unsuccessful teams Passing sequences for successful teams Average passes per possession Negative outcomes of possession Positive outcomes of possession for both groups of teams Average shots at goal for both groups of teams Shot accuracy Average team match possession 36
10 APPENDICES Appendix A: Appendix B: Appendix C: Appendix D: Appendix E: Ethics status Reliability tests System design Statistical analysis results Raw data
11 Acknowledgements I would like to thank the following people for their help throughout the production of this study: Dr Stephen-Mark Cooper for his continued assistance and guidance throughout the year Adam Cullinane for his assistance with various issues My parents for their continued help and support throughout the process i
12 ABSTRACT The aim of this study was to provide a direct comparison between teams deemed to be 'successful' and 'unsuccessful' based on finishing positions at the 2010 World Cup finals tournament. The aim was to compare several key performance indicators to highlight specific differences between these team categories. A lot of match analysis in professional football has focussed on team possession and playing patterns. However, a limited amount of research has been conducted into the differences in attacking playing patterns between teams who are successful and unsuccessful, based on finishing positions, at international tournaments. Performance indicators were selected in order to analyse the result of individual possessions. Post event analysis took place of 20 matches from the group stages of the 2010 World Cup finals. Three matches involving each team were analysed and Sportscode was used to record every on the ball action performed by the teams. Intra-observer reliability procedures were conducted on the system, with results from the kappa statistic indicating a very good strength of agreement. Upon analysis it was found that the successful teams had a greater percentage of match possession (58%) compared to the unsuccessful teams (49%). The 0-3 passing sequence category was predominant for both sets of teams; however, the unsuccessful teams registered a greater frequency in this category. Successful teams registered more occurrences in passing sequences of greater duration. Non-parametric statistical measures (Mann-Whitney U tests) reported non-significant differences in median match possession (P > 0.05). For passing sequences non-statistical differences were found for the passing sequence categories (P > 0.05). For positive outcomes of possession statistical differences were not found in any performance indicator (P > 0.05) except for goals scored (P < 0.05). The negative outcomes of possession showed significant differences for pass misplaced and negative clearance (P < 0.05) but for no other performance indicator (P > 0.05) In conclusion, from the selected sample, successful teams registered higher match possession than the unsuccessful teams with the exception of Uruguay. However, no significant difference was determined for passing sequences or outcomes of possession between the two groups of teams. ii
13 CHAPTER I INTRODUCTION
14 CHAPTER ONE: Introduction 1.1 Football Association Football, or soccer as it is also known, is one of the world's most popular sports. Organised football was formalised with the establishment of the Football Association in 1863 (thefa.com, 2013). Regulations similar to that of the Football Association's were adopted across Europe and across the world as the game evolved, leading to the formalisation of the international governing body, FIFA (Fédération Internationale de Football Association) in 1904 (Carling et al., 2005). The game developed into a global competition following the First World War with the inaugural World Cup tournament taking place in The level of performance in soccer is determined by a number of factors and abilities that are significantly correlated; technique and tactics are two such factors (Yiannakos and Armatas, 2004). In football tactics can define the outcome of the game and ultimately the final result. Kotzmananidis (1999) stated that the use of tactics is the contexture of familiar techniques and normal movements, to which the opposition must try to solve during the game. 1.2 Principles of play It had been proposed that in order to achieve success in football, a number of both attacking and defensive principles of play must be employed (Wade, 1996). When used effectively and in combinations these principles, shown in Figure 1, enable teams to overcome and defeat the opposition. Attack Defence Width Delay Improvisation Balance Mobility Control Penetration Concentration Support Depth (both in attack and defence) Figure 1. Principles of play (Wade, 1996) 1
15 In order to develop these principles of play and to achieve success, coaches need the ability to analyse match performance in order to detect areas of strength and of possible weakness; they can then plan future coaching sessions based on the findings. The way in which this is achieved is through performance analysis and in particular, match analysis. 1.3 Match analysis Carling et al. (2005) stated that or match analysis is a means of recording events to produce an accurate and objective record of what took place; it is an important tool that can be used to inform the coaching process. The ultimate aim of performance analysis in soccer is to enhance player and team performance within the specific context of competition or training (Tenga, 2013). Reep and Benjamin (1986) stated that soccer is one of the most analysed sports in the world and has a relatively long history of performance analysis. Many studies have evaluated different aspects of football performance, concentrating on several different aspects; time motion analysis, possession and goal scoring strategies being a few of the predominant focuses. Jones et al. (2004) and Hughes and Franks, (2005) have studied the patterns of play in professional soccer over the past decade building on the previous work of Reep and Benjamin (1986). 1.4 Why is match analysis undertaken? The predominant focus of match analysis is observing one's own team to identify strengths which can be further built upon and weaknesses which need improvement (Carling et al., 2005). Hughes and Bartlett (2008) argue that coaches need to provide feedback to athletes in order to assist with the improvement of performance as no change of any kind will take place without it. Coaches cannot accurately observe and recall all of the detailed information that is required for a complete understanding or interpretation of performance (Franks and Miller, 1986). Armatas et al. (2007) stated that the coaching process is enhanced by the provision of additional information that describes sport performance in detail beyond that which coaches can provide through recall of personal observations. Performance analysis has established itself as a cornerstone in the coaching process due to its ability to provide coaches with more precise and more detailed augmented information (Carling et al., 2005; Groom et al., 2011; Hodges and Franks, 2002; Lyle, 2002). 2
16 The coaching process comprises a number of steps, with the process of match analysis situated as one of the latter stages, shown in Figure 2. Within this step, evaluation of performance is undertaken and feedback is subsequently given. Figure 2. The coaching cycle, highlights the importance of observation and analysis (Carling et al., 2005) 1.5 The World Cup The FIFA World Cup finals tournament take place every four years and is the pinnacle of international football. Worldwide teams compete in a variety of geographical groups with the most successful progressing to the final tournament. Only thirteen teams took part in the inaugural tournament. The number of participants was increased to 24 teams in In the 1998 tournament held in France the tournament was expanded to involve 32 teams; this format has continued until the modern day. 1.6 Direction of the present study Taking direction from Hughes and Franks (2005), the intention of the current study is to complete a comprehensive comparison of key performance indicators between successful and unsuccessful teams based on their finishing positions at the 2010 World Cup finals tournament. 3
17 1.7 Hypotheses The null hypothesis (H 0 ) states that there is no significant difference between the playing styles, based on key performance indicators, of 'successful' and 'unsuccessful' teams at the 2010 World Cup. The following hypotheses were tested: The average passing sequence will be greater in higher ranked teams than in lower The successful teams will have significantly more shots at goal The successful teams will have a higher proportion of shots on target The successful teams will have more positive outcomes of possession compared to the unsuccessful teams. The unsuccessful teams' will have more negative outcomes of possession compared to the successful teams The successful teams will have more possession of the ball per match 1.8 Definition of Terms Post event analysis - Data is collected from recordings of events, where the footage can be paused, rewound and viewed several times. 4
18 CHAPTER II LITERATURE REVIEW
19 CHAPTER TWO: Literature Review 2.1 Performance analysis in sport Sports performance analysis is interdisciplinary in nature and defies accurate definition. However, the aim of performance analysis is twofold: 1) to advance scientific understanding; and, 2) to assist sports practice by providing the coaching process with augmented information (Sampiao et al., 2013). O'Donoghue (2010) stated that performance analysis of sport is the investigation of actual sports performance or performance in training; the use of performance analysis is now firmly positioned as an integral part of the coaching process (Carling et al., 2005; Groom et al., 2011; Hodges & Franks, 2002; Lyle, 2002). O'Donoghue (2010) stated that performance analysis is an area within sport science that does not require the use of laboratory experimentation unlike other disciplines such as biomechanics and physiology. Sport performance analysis techniques help coaches, athletes and sport scientists develop an objective understanding of actual sports performance, as opposed to self-report, fitness tests or lab based experiments (Sampiao et al., 2013). There are two main branches within performance analysis as a discipline: biomechanical analysis and notational analysis. Both of these sub branches involve the analysis and improvement of sports performance. They both make extensive use of video analysis and technology and require careful management for good feedback to coaches and performers. They also have theoretical models - based on performance indicators - amenable to artificial intelligence (AI) developments and strong theoretical links with other sport science and information technology (IT) disciplines (Hughes & Bartlett, 2008). If the investigated technique is an important skill within the sport of interest then detailed biomechanical analysis of the technique is utilised (O'Donoghue, 2010). An example of this would be the swing of a golf shot, as the skill is of vital importance for improvement. On the other hand, notational analysis is the study of gross movements or movement patterns in team sports primarily concerned with strategy and tactics. The rationale for using performance analysis is to overcome the limitations of subjective observation alone and to provide objective information to achieve a greater understanding of performance (O Donoghue, 2010; Hughes & Bartlett, 2008; Sampaio et al., 2013). 5
20 The role of performance analysis within the coaching process is not only to assess areas of strength, but also to determine faults within performance and produce qualitative information allowing these areas requiring attention to be quickly identified and remedied (Mayes & O'Donoghue, 2013). Through interactive use of video analysis systems, coaches and players can engage in detailed analysis of performance, identifying how and why performance can improve and to make decisions to influence future training sessions. Contemporary performance analysis enables elite athletes and coaches to obtain live feedback of match statistics and video sequences using flexible internet systems; systems that have been indispensable tools for all those involved in high performance sport (Sampiao et al., 2013). Within the coaching context, the objective information is often produced by a professional performance analyst who liaises with the coach to provide feedback beneficial to the athletes (O'Donoghue, 2010). This process enables key areas of performance to be analysed in much greater detail than would otherwise not be available. From the information obtained through the use of performance analysis, coaches can plan future sessions tailored to meet the demands of the findings, with the ultimate aim of improving performance. The information provided to players and coaches through performance analysis support can be both qualitative and quantitative. The quantitative information provided in game sports includes match statistics which assist in the identification of areas of performance where improvement is required (Mayes & O'Donoghue, 2013). For example, if the number of points won on serve in tennis, differs depending on the type of serve used, then any serve that leads to a relatively low proportion of points won indicates an aspect of the athletes performance that can be targeted for future improvement. 2.2 Feedback Feedback is an essential component within the coaching process (Maslovat & Franks, 2008); no change in performance of any kind will take place without feedback (Hughes & Bartlett, 2008). Franks (1997) stated that performance improvement is a consequence of task-relevant feedback; information that is available to the athlete before, during and after a skilled performance can take many forms and is the product of a multi-level feedback 6
21 mechanism. This was reinforced by Liebermann et al. (2002) who stated that feedback is a major factor in the improvement of sport skills. Such feedback takes two forms, intrinsic and augmented; a combination of both of these forms is expected to improve performance levels. Intrinsic feedback is from the athlete's own sensory channels, for example, sight, hearing and touch (Maslovat & Franks, 2008). However, more detailed information concerning a skill performed requires external feedback; Mayes and O'Donoghue (2013) stated that augmented (external) feedback is additional information provided by a coach who observes and analyses performances of athletes; it is a powerful learning tool if administered in a way that promotes cognitive effort on the part of the learner (Hendry & Hodges, 2013). Feedback provides both a motivational and informational role. That is, feedback can help to encourage repeated performance and also to reduce the discrepancy between a desired and an actual outcome. Hodges and Franks (2008) argued that it is not only the type of information that is delivered, but how this information is administered which is most important in eliciting specific changes in performance. Traditional coaching intervention, and in turn augmented feedback provision, has often involved biased, subjective conclusions based on the coach's perception of previous events. However, a number of studies have found that conclusions based on subjective perceptions are potentially unreliable and inaccurate due to the limitations of the human memory system (Maslovat & Franks, 2008). Franks and Miller (1986), found that international level soccer coaches could only recall 30% of the key factors that determined successful soccer performance. This was further reinforced by Franks (1997) who found that experienced gymnastic coaches were not able to detect differences in two sequentially presented performances; additionally, experienced coaches produced far more 'false positives' (i.e. they created differences where none existed) than the novice coaches. Laird and Waters (2008) repeated the study of Franks and Miller (1986) on UEFA qualified coaches. They found that 59% of the critical events within a 45 minute period of play were accurately recalled. While this is an improvement, there is still approximately 40% of critical events that are not accurately being recalled by coaches. Although coaches are the main facilitators of feedback in daily training conditions, technologies aid this process by not only in enhancing the augmented feedback provided by the coach but also its administration (Liebermann and Franks, 2008). Advances in both computer and video technology can make the observation process more efficient and also 7
22 provide the coach with audio-visual feedback about their interactions with athletes (Hughes & Bartlett, 2008). More recently sport scientists have been using notational analysis systems to answer fundamental questions about game play and performance in sport (Hughes & Bartlett, 2008) 2.3 Notation analysis To provide meaningful feedback the coach must somehow observe and evaluate performance (Maslovat & Franks, 2008). However, due to the inaccuracy and limitation of the human memory system this is a difficult task if solely relying on human information processing. A better data capture method is therefore essential, especially given the rapid evolution of sport. To enable success at higher levels of difficulty and complexity coaches seek any tool that can assist with the development of athletes. One such tool is notational analysis. It is a field of performance analysis which can provide highly insightful and effective feedback that coaches require to enable athletes to enhance performance to a level which might not otherwise be feasible. The inability of coaches to correctly recall key events within performance is well documented, yet notational analysis allows coaches to effectively "make notes" on such performances (Franks, 1986; Franks & Miller, 1997; Laird & Waters, 2008). The main focus of notational analysis is the analysis of movement, technical and tactical evaluation with a statistical component. It is a process of labelling and recording the identified action variables within sport so that critical events in that performance can be quantified in a consistent and reliable manner, allowing feedback that is accurate and objective (Hughes & Franks, 2004; Hughes & Bartlett, 2008; Sampiao et al. 2013). (Hughes and Bartlett, 2008). The coaching process is the initial raison d'être of notational analysis; Carling et al. (2005) explained that the use of such is of vast benefit to coaches because it enables analysis and evaluation of completed actions and movements to take place whilst giving feedback on said actions. By providing coaches with relevant and accurate details of a player s previous performance, feedback (both positive and negative) can be administered to 8
23 athletes, enabling the athlete to further their progress within the sport. The data obtained from using notational analysis also enables coaches to plan future sessions using weaknesses in performance, identified by the process of notational analysis, as the main focus. Hughes (1996) postulated four major purposes of notation: 1. Analysis of movement measurement of velocities, time spent in different activities and individual work rates 2. Tactical evaluation quantification and assessment of technical skills 3. Technical evaluation assessment of and qualification of tactical skills in a particular game 4. Statistical compilation - combination of both technical and tactical information for quantitative evaluation. The match analysis system employed should provide information about how a team or individual has performed such that it aids the coaching process and helps facilitate performance (Carling et al., 2005). 2.4 Match analysis Match analysis is now extensively used in soccer and has increased dramatically due to the development of more affordable technology, extensive previous research and its use by well-respected individuals within the sport (James, 2006). It is a method designed to create a permanent record of on the ball actions of players within a game through analysis systems (Lemmink & Frencken, 2013). The extent to which performance analysis is used in association football was documented by Olsen and Larsen (1997) who reported that nearly all premier league soccer teams in Norway used match analysis. In soccer it is important to understand how elite soccer teams play in order to identify patterns, and to build up groups of indicators that could be used as references for training (Garganta et al., 1997). 9
24 Jones et al. (2004) stated that in soccer, the creation of goal scoring chances and ultimately scoring goals is the determinant of success and therefore has received noticeable attention in notational analysis. Modern soccer, however, produces a relatively low number of goals per game; recent studies have found possession, along with shots at goal, to be a significant offensive factor that predicted winning (Lago & Martin, 2007; Collet, 2012). Significant possession differences have been found between 'successful' and 'unsuccessful' teams indicating that a team having the majority of possession in a match is more likely to be successful, i.e. win the match (Jones et al., 2004). Bate (1988) found that the higher number of possessions a team had, the greater the chance of entering the attacking third, and consequently the more goal scoring opportunities created. Charles Reep (1950s), was the primary advocate for the "long ball game" or direct play. In 1971 Reep et al. found that approximately 80% of goals resulted from a sequence of three passes or less, potentially indicating that the most effective style of attacking play is more direct, using limited players and moving the ball forward as quickly as possible. Several teams have been found to achieve success using this strategy particularly progressing from the lower divisions of English football; lower ranked nations of the Republic of Ireland and Norway have also seen success using low passing sequences per possession (Hughes and Franks, 2005). This is further reinforced by Hughes (1990) who reported that in top level matches the percentage of goals scored after a long pass is 25%. Whilst working for the Norwegian FA, Egil Olsen led the Norwegian national team in the direction of a more penetrative style of attacking play, involving fewer touches of the ball before attempting a shot at goal; in other words the aforementioned "long ball game" advocated by Charles Reep (1971). Olsen and Larsen (1997) argue that although many members of the soccer family dislike this direct attacking style of play and consider it to be primitive; the overall aim is to win matches and therefore are willing to sacrifice aesthetically pleasing football. However few teams have succeeded at the very highest level using direct play and many researchers have stated that consistent success cannot be achieved using this methodology or pattern of play. Yiannakos and Armatas (2004) discovered that 88% of the goals in the 1990 World Cup tournament came from a team utilising an indirect attacking 10
25 style of play. Indirect play involves moving the ball forward at a slower pace using numerous passing movements between players (Tenga & Larsen, 2003). Collet (2012) stated that successful modern teams (teams playing within the last 15 years), such as league champions, World and European champions tend to favour a possession based style of football; they have significantly more touches of the ball per possession. This was further reinforced by Hughes and Franks (2005) who stated that the fact that successful (league champions, World champions, European champions) teams did not use direct play would indicate that there are further dimensions of these types of data to be explored. With the recent ascendency of sides such as Barcelona, Spain and Manchester United, this style of possession football is in vogue. Further research has revealed that the longer pass sequence lengths (four or more) accounted for more goals per possession compared to shorter sequences (Hughes & Franks, 2005). Hughes et al. (1988) examined patterns of play for successful (semi-finalists) and unsuccessful (eliminated at end of first round) teams in the 1986 World Cup finals. These authors found that successful teams played significantly more touches of the ball per possession than unsuccessful teams. Hughes and Franks (2005) stated that if teams have the skill to sustain possession, they stand a far greater chance of creating a goal scoring opportunity. This indicates that many modern teams have found success at the highest level utilising a shorter passing game involving more frequent touches of the ball, and a less direct approach to creating goal scoring chances. The debate between researchers as to which pattern is the more successful has been continuing for many decades and there are teams still practising both styles in the modern game. 2.5 Hand notation vs. computerisation It is essential that coaches spend sufficient time considering what information is needed from an analysis system and why; the information should be of sufficient value that there is a clear link between the analysis undertaken and the coaching process (Carling et al., 2005). It is also important to understand that there is a wide range of performance actions and outcomes in soccer and they tend to follow a logical path. This means that when a coach or analyst is collecting statistical data the process must be structured to cater for the many different possibilities. For example, a pass in football can be classed as being 11
26 successful or unsuccessful; then broken down into long/medium/short, direction of pass, forward/backward etc and whether it was an aerial or ground pass. Mayes and O'Donoghue (2013) stated that regardless of the type of analysis technique being used, the system should be designed and developed in a user-friendly way to ease the task of data collection and ultimately feedback provision. Reilly et al. (1993) suggested that coaches and scouts source data, primarily, using hand notation systems due to the simplistic nature of their design and their ability to produce instant yet limited data. In addition to this, it is difficult to record several different aspects of performance within an instance. With the rapid advancement of technology over the past two decades, match analysis has changed considerably. Most analysis now favours computerised systems due to the vast amount of information it is able to provide (Mayes and O'Donoghue, 2013). Computers aid in the match analysis process at two significant levels: data input and output. The former involves the actual method employed for inputting data such as passes or shots, whilst the latter involves the processing and presentation of the data (Carling et al., 2005). Team sports have the potential to benefit immensely from the development of computerised notation due to the sophistication of data manipulation procedures made available for the coach (Hughes & Franks, 2004). Yiannakos and Armatas (2004) stated that computerised analysis systems have been used by coaches and sports scientists to analyse performance of athletes in team sporting contexts. The major advantage of using computerised systems to collect data is that the game is represented in its entirety and can be stored in ROM or on disk. A database is therefore initiated and is a powerful tool once manipulated (Hughes & Franks, 2004). Modern systems enable statistics to be combined with the match video, allowing immediate access and visualisation of any particular instance during a game. This leads to quicker and better evaluation and understanding of match performance and therefore enhances notational analysis. Systems can automatically provide useful indications of individual and team strengths and weaknesses and can help propose specifically adapted training methods. Video provides a permanent record of performance and also provides valuable information that might have initially been missed or forgotten by players or coaches (Liebermann & Franks, 2008). The ability to code match footage and then compile data for the use of coaches, clearly demonstrates the versatility of computerised match analysis. 12
27 2.6 Operational definitions One of the most important aspects in recording match data is having clear and unambiguous definitions of each action; these are known as operational definitions. A scientific approach ensures the correct identification and definition of performance behaviours before undertaking match analysis and is crucial to guaranteeing that the data gathered is both valid and reliable (Williams, 2012). Hughes (2004) stated that if the operational definitions are not clear an analyst might code instances differently, therefore compromising the reliability and usefulness of the data. 2.7 Validity and reliability When a new analysis system is developed for data collection, the primary concern is that the data produced is reliable (Cooper et al., 2007). Wilson and Batterham (1999) define reliability as the consistency of the measurements over time. James et al. (2007) explains that reliability in performance analysis pertains to the extent to which the event codes (notated by the analyst) reflect what happened in the game i.e. an estimate of the accuracy (validity). Errors will inevitably occur when notating events, therefore every measure must be taken to reduce the amount of errors that occur (Johnson and Franks, 1991). James et al. (2002) suggested three sources of error: 1. Operational errors: the observer presses the wrong button to label an event, 2. Observational error: the observer fails to code an event 3. Definitional errors: the observer codes the event inappropriately. Most performance analysis methods do not involve fully automated data capture techniques. Therefore, human error during data gathering can limit the reliability of the methods used. Even where fully automated data gathering is possible, there may be algorithmic, optical or other limitations in data gathering techniques that limit the reliability of data collected. Therefore, reliability evaluation is essential so that the information produced by performance analysis can be interpreted with a full understanding of measurement error involved. This is not just the case in scientific research, but also where 13
28 the information is being used in coaching, media or judging contexts to make important decisions (O'Donoghue, 2007) Hughes et al. (2004) stated that it is vital that the reliability of a system is demonstrated clearly and in a way that is compatible with the intended analysis of the data; the data must be tested in the same way and to the same depth as it would within the intended study. 2.8 Performance indicators Sports organisations use performance analysis to develop short, medium and long term strategic objectives; in pursuit of this aim there is a clear need to implement the use of adequate performance measures (Sampiao & Leite, 2013). Vast amounts of data are collected using performance analysis and there is therefore a need for the data collected to be reliable. This issue demonstrates the need for valid indicators of sports performance. Performance indicators are a selection or combination of action variables that aim to describe some or all aspects of sports performance (Hughes & Bartlett, 2002). Performance indicators may be single or combined variables adequately normalized within sports contests to ensure comparison can take place; this is of particular importance in game sports, where the complex, non-linear aspects of performance need to be captured (Sampiao & Leite, 2013). McGarry (2009) stated performance indicators are associated with sports performance and not necessarily with regard to overall outcome. For example, ball possession in territory games such as rugby and football is deemed to be an important factor in sports performance, but its correspondence to match outcome remains unclear. From an applied and theoretical context, a performance indicator should explain the game outcome and therefore advance understanding, providing meaningful understanding of game behaviour (Sampiao & Leite, 2013). The development of performance indicators allows for player and team profiles to be constructed ready for subsequent analysis. 14
29 2.9 Aim of the present study There is an abundance of literature concerning aspects of match analysis in all areas of football. However, there is limited research in the area of comparisons between successful and unsuccessful football teams. Therefore based on previous research conducted by Hughes and Franks (2005), it is evident that openings for further study should be explored. The aim of this study is to analyse the patterns of play during the attacking phase of competitive matches for both successful and unsuccessful teams (based on finishing positions) at the 2010 World Cup finals held in South Africa. Technical differences between the teams will be investigated and parameters set to show the style of play. Passing sequences, possession and outcomes of possession (positive and negative) will be recorded and subsequently analysed. The analysis will take place using computerised software in the form of Sportscode Sportscode The system selected for this study was the computerised analysis software Sportscode; a digital video analysis system created by Sportstec International. One of the major advantages of using Sportscode is that it can be tailored to meet the specific demands of the individual coaches (Carling et al., 2005). The interface allows for changes to be made easily and quickly to cater for separate demands. For example, if the coach wants to concentrate on attacking play, specific buttons can be created to code the instances when they occur. 15
30 CHAPTER III METHODOLOGY
31 CHAPTER THREE: Methodology 3.1 Introduction The data collection methods consisted of a post event computerised notational analysis system devised by the principal researcher and then used in order to collect data from (n = 20) matches from four World Cup 2010 group matches. The system was developed after repeated experimentation with operational definitions and was constructed to enable the observer to record a detailed breakdown of the data required. The method used in this study was approved by the Cardiff Metropolitan School of sport ethics committee and is shows in appendix A. 3.2 Equipment Matches were recorded from satellite television onto DVD then converted and placed on an external hard drive. This data was then opened with Sportscode Elite V8 (Sportstec, Australia) and a unique coding system was designed to record key performance variables. The equipment needed to gather data included: Apple imac with Sportscode Elite V8 (Sportstec, Australia). Laptop with Microsoft Word, Microsoft Excel and IBM SPSS 20.0 SanDisk Cruzer Edge 8gb Flash Drive Buffalo ministation 500gb External Hard Drive 3.3 Data Twenty matches, shown in Table 1, from the group stages of the 2010 World Cup finals in South Africa were selected. These matches consisted of four successful and four unsuccessful teams that were selected due to their finishing positions in the tournament; successful teams were deemed to be the teams that reached the semi-finals whereas unsuccessful teams were the teams that finished bottom of the semi-finalists respective groups. For this study the researcher analysed all the matches in which the aforementioned teams were involved in, including the match between the highest and lowest ranked team; this game was viewed twice, in order to capture data for both teams. 16
32 Table 1. Matches analysed. Successful teams in bold, unsuccessful in italics Group A Group D Group E Group H France 0-2 Mexico Germany 4-0 Holland 2-0 Honduras 0-1 Chile Australia Denmark Uruguay 0-0 France Serbia 0-1 Ghana Holland 1-0 Japan Spain 2-0 Honduras Mexico 0-1 Uruguay Ghana 0-1 Germany Japan 1-0 Cameroon Spain 0-1 Switzerland South Africa 0-3 Uruguay Australia 2-1 Serbia Cameroon 1-2 Denmark Switzerland 0-0 Honduras France 1-2 South Africa Germany 0-1 Serbia Cameroon 1-2 Holland Chile 1-2 Spain 3.4 Research design In order for data collection to take place a template, described as a code window, was devised using Sportscode elite. The development of the code window allowed performance indicators to be recorded in an efficient, reliable way. The data collected within Sportscode was then exported into Microsoft Excel and SPSS enabling extensive analysis. Within the code window several buttons were created to allow for the recording of multiple performance indicators at one time: Figure 3. Text label button with blue circle identifier Figure 3 shows text label buttons had a blue circle identifier in the top right corner; these buttons recorded the specific action every time it occurred in the match. The text labels used in the code window were: from where the possession started, the outcome (positive or negative), the length of successive passes and the zone outcome. 17
33 Figure 4. Code buttons with a red diamond identifier Figure 4 demonstrates code buttons. These buttons had a red diamond identifier in the top left hand corner. Once a code button was selected it stayed active and coding until another button was selected which terminated the original button. The only code buttons used within this template, were those recording the area of possession and overall possession. This is because the use of a code button allowed for temporal data to be collected because it continued to record until another code button was activated. For example, if the Def 1/4 possession button was activated, shown in Figure 5, it continued recording data until either the Def Mid 1/4, Att Mid 1/4 or Att 1/4 button was selected. Figure 5. Possession buttons The use of code buttons to record overall team possession, enables team possession to blanket all text labelled buttons, meaning that when viewing the timeline, the observer can see every instance for that specific possession. This is shown in Appendix A. The selection of another code button, such as the aforementioned possession buttons, instantly terminated the original button due to the link between the buttons. The link between said buttons is called an exclusive link. Exclusive links were used between the possession in pitch areas, causing the recording of data within a selected area to be stopped when possession moved into a different area of the pitch. Exclusive links between the 'Out of Possession' button and the team possession buttons were also created. 18
34 Activation links were used throughout the code window to gather and collate information from several buttons or when actions recorded are linked. The use of activation links enables the researcher to select several actions at once and code them within the same piece of possession. However, due to the nature of the code window created, activation links were not used in abundance, lending to a more organised looking template. The only activation links within the template were those connecting the start of possession buttons to the possession buttons. 3.5 Operational definitions Table 2. General operational definitions Technique Operational Definition PS= Passing Sequence Number of consecutive passes before loss of possession (Hughes and Franks, 2005) P = Possession Overall team ball retention for more than 3 seconds (Pollard and Reep, 1997) ZO = Zone Outcome The zone of the pitch in which the possession ends. PO = Possession Origin The area of the pitch in which the possession started OP = Out of possession Neither team has the ball, due to it being out of play or an injury. Also used for when television coverage is showing replays/irrelevant footage. 19
35 Table 3. Operational definitions of negative outcomes Technique Operational Definition PI = Intercepted pass The opposition player intentionally intercepts a pass by moving into the line of the intended ball (OPTA.com, 2013) D = Dispossessed Opposition player gains possession by taking the ball off attacking player POP= Pass out of play Intended pass goes out of play PM = Pass Misplaced Intended pass is made directly to the opposition PI = Intercepted pass The opposition player intentionally intercepts a pass by moving into the line of the intended ball (OPTA.com, 2013) NC = Negative clearance This is a defensive action where a player kicks the ball away from his own goal with no intended recipient of the ball PE = Player Error Player in possession loses the ball through poor touch or bad control O = Offside A player is offside if he is nearer to his opponents' goal line than both the ball and the second-last opponent when the ball is passed. (FA.com, 2013) 20
36 Table 4. Operational definition of positive outcomes Technique Operational definition S = Shot A player s attempt to score ON = Shot on target G = Goal A players attempt to score that is saved or hits the frame of the goal (OPTA.com, 2013) A goal attempt that goals into the net SS= Saved Shot Attempt at goal that would have gone into the net but for the Goalkeeper preventing it BS = Blocked Shot Attempt at goal that is stopped by a defensive player OFF = Shot off target An attempt at goal that misses. FK = Free Kick Any free kick taken by a player PEN = Penalty A penalty kick taken at the goal THR = Throw In Returning the ball to the field of play by throwing the ball above their head on to the pitch BO = Box Entry Any time an attacking player enters the opposition 18 yard box 21
37 3.6 Procedures All the matches were provided in QuickTime format from the Centre for Performance Analysis (CPA) UWIC. Each match was then opened using Sportscode in order for analysis to take place. Prior to the notation of each match, the names of the teams being analysed were changed, along with the colour of the team possession buttons. Additionally the position of the buttons were altered depending on which way the team being analysed were shooting to make for more accurate coding. Following this the match was analysed using the operational definitions previously mentioned in Tables 2,3 and 4. When a phase of possession began, the zone in which possession started was recorded. Throughout the possession the movement of the ball around the pitch was also recorded; every time the ball changed zone, the corresponding zone was selected. Once a period of possession ended the footage was paused; the outcome, whether positive or negative, the zone outcome and the passing sequence were all recorded. The sequence for recording actions remained the same throughout the process: 1. Outcome of possession (positive or negative) 2. Number of passes within the sequence of possession 3. Zone in which possession terminated Depending on the outcome of the possession, the next step had two possible forms: if the ball was gained by the opposition then the same process of coding was continued for the opposition, however, this process only included the possession of the ball and nothing more; if the ball was lost out of play, or neither team were deemed to have possession of the ball, the 'Out of Possession' button was selected to terminate the instance. The data recorded was then displayed on a timeline which enabled the researcher to view all the information from that match. A matrix was then used to view a detailed breakdown of each individual possession and could then be used to count individual instances of each action. 22
38 3.7 Pilot study A pilot study was conducted to allow the researcher to familiarise themselves with the system and procedure for the analysis. The first half of the match between Germany and England in the round of 16 was chosen for the pilot study. During this pilot study it was noticed that outcomes of performance such as offside, player error and clearances were not being recorded. It was also decided that the zones of the pitch used would be quarters rather than thirds to provide an accurate representation of the pitch. A second pilot study was undertaken analysing the match between Portugal and North Korea in the second round of matches in Group F. Within this study the zones of the pitch had been split into quarters and were labelled accordingly. As well as this, the outcomes recognised in the initial pilot study were added; offside, player error and clearances (both positive and negative). 3.8 Reliability testing The system was tested for intra-observer reliability on the match between Argentina and South Korea in Group B of the 2010 World Cup (Franks & Hughes, 1996). Hughes et al. (2004) stated that it is vital that the reliability of a system is demonstrated clearly and in a way that is compatible with the intended analyses of the data. To test for the reliability of this system, a kappa test was used. Kappa was used because it evaluates the reliability of performance indicators measured using computerised notational analysis systems (Robinson & O Donoghue, 2007). Viera and Garrett (2005) stated that Kappa is intended to give the observer a quantitative measure of the magnitude of agreement between observers. The kappa statistic analyses the agreement between observers, and the value produced indicates the strength of agreement. Altman's (1991) definition of kappa scores are shown in Table 5. Research in sports science has become more concerned with accuracy of methodology over the past decade (Atkinson and Nevill, 1998) and this has been mirrored in performance analysis. 23
39 Table 5. Altmann's (1991) strengths of agreement Value of Kappa Strength of agreement <0.20 Poor Fair Moderate Good Very good 3.9 Data processing Once the data has been collected, it will be exported from Sportscode Elite into Microsoft Excel and then transferred into SPSS for statistical analysis to take place. Cooper et al. (2007) stated that when using a sport performance analysis system and treating each performance indicator as a separate variable, the agreement between test and retest scores can be quantified by simply calculating the differences between scores; because these differences will be discrete and categorical they will not have a normal distribution. Therefore the test that will be used on the data will be a Mann-Whitney U measure Mann-Whitney U test The Mann Whitney U test is a non-parametric test of the null hypothesis that two populations are the same against an alternative hypothesis. It is used to compare differences between two independent groups when the dependent variable is either ordinal or continuous, but not normally distributed. It is used to determine the significance of the difference between rankings of two groups of subjects who have been ranked on the same variable. The level of significance for this study was set at P < This indicates that the probability that the null hypothesis is true is less than 5%. Vincent (1999) states that for an identified difference to be significant, the reported p value must be 0.05 or lower (P < 0.05) in order to equate to the 95% level of confidence. 24
40 CHAPTER IV RESULTS

41 Kappa Scores CHAPTER FOUR: Results In order to explore the hypotheses identified in the introduction, the data collected is presented in graphical format and subsequently analysed statistically using SPSS The use of the Mann Whitney U test allow for significant differences between outcomes to be detected. Significance was determined at a level of P < 0.05 and is indicated in Table 6. This was due to the concern surround the possibility of error of the first kind occurring. A type I error is committed when the null hypothesis is true but is erroneously rejected (Vincent, 1999). All raw data collected for this section is displayed in Appendix D. Table 6. Level of significance P < 0.05 * 4.1 Reliability results Reliability of outcomes of possession After conducting an intra-observer reliability test the results suggest that the notation system was adequately reliable to fulfil its purpose. Figure 6 shows the calculated kappa scores for the reliability test carried out Zone Outcome Positive Outcomes Negative Outcomes Kappa Scores Figure 5. Kappa scored for positive, negative and zone outcomes of possession. The results show a strong level of intra-observer agreement when compared with Altmans (1991) definition of kappa scores shown in Table 5. All three scores are above 0.8, which show a very good level of intra-observer agreement. 25
42 4.1.2 Time based reliability After the conclusion of the reliability study the time based statistics were calculated. These results are presented in Table 7. It demonstrates the absolute mean difference between the two recorded possession times for each zone of the pitch, as well as overall possession. The possession count difference is the calculated difference between the first and second data collection. Table 7. Time based reliability Possession Absolute mean difference (s) Possession count difference Overall Possession Opposition possession Argentina defensive 1/ Argentina defensive midfield 1/4 Argentina attacking midfield 1/4 Argentina attacking 1/ Opposition defensive 1/ Opposition defensive midfield 1/4 Opposition attacking midfield 1/4 Opposition attacking 1/ Passing sequences The passing sequences within team possession was analysed in order to show differences in lengths of passing strings from one match to another. The details of the matches presented are shown in Appendix E. 26
43 Number of Passing strings Passing Strings Matches Figure 7. Passing sequences per game for unsuccessful teams Figures 7 and 8 show the number of occurrences of each passing string, per match, for both the successful and unsuccessful teams. They clearly identify that regardless of team stature the predominant passing string used is the 0-3 pass category Matches Figure 8. Passing sequences per game for successful teams 27
44 Number of occurences Figure 7 and 8 demonstrate how the passing sequences for all teams follow a similar pattern, with Figure 9 highlighting the mean passes per possession for the successful and unsuccessful teams. This reinforces the dominance of the use of the 0-3 passing category within both groups of teams. Figure 9 indicates that as the passing sequences increase in length, the successful teams register a greater number of occurrences in comparison to the unsuccessful teams Successful Unsuccessful Mean passes per possesion Figure 9. Average passes per possession 28
45 Table 8 highlights the results of the Mann Whitney test between the passing string lengths of the successful and unsuccessful teams. Upon comparison of Table 8 and the significance value set at P < 0.05 it is clear that no significant difference was determined between the successful and unsuccessful teams in any of the passing categories. Table 8. Statistical analysis: significant differences of passing sequences Passing sequence length Results of Mann-Whitney U tests between (passes) successful and unsuccessful teams > Total
46 Number of occurences 4.3 Negative outcomes of possession Figure 10 summarises the mean negative outcomes for the successful and unsuccessful teams. It shows a comparison between the two groups of teams Successful Unsuccessful Dispossessed Dribbled out of play Negative Clearance Offside Pass Intercepted Pass misplaced Pass out of play Player Error Negative Outcomes Figure 10. Average negative outcomes of possession. 30
47 Figure 9 indicates the most common form of negative outcome of possession for both groups of teams is a pass being misplaced. The registered number of occurrences for passes misplaced is much larger than for any of the other negative outcomes of possession. The successful teams record a higher number of occurrences of this outcome compared to the unsuccessful teams. The second most common negative outcome is a player being dispossessed. This too occurs much more frequently than the remainder of the negative outcomes of possession, however, it occurs much less often than the pass misplaced outcome. The remainder of the negative outcomes occur at a similar frequency with the exception being negative clearances. Table 9. Statistical analysis: significant differences between negative outcomes of possession Negative outcomes of possession Results of Mann-Whitney U test between successful and unsuccessful teams Dispossessed.110 Dribbled out of play.661 Negative clearance.044* Offside.663 Pass intercepted.663 Pass misplaced.020* Pass out of play.146 Player error.770 Total.773 Table 9 summarises the statistical values determined after completion of Mann-Whitney U test for negative outcomes of possession. It indicates that significant differences (P <0.05) were found with the pass misplaced and negative clearance categories. 31
48 Number of occurences 4.4 Positive outcomes of possession Figure 11 identifies the average frequency of positive outcomes of possession and shows a comparison between successful and unsuccessful teams Successful Unsuccessful Box Entry Positive Clearance Corner Free Kick Goal Shot Blocked Shot off target Shot on target Throw in Positive Outcomes Figure 11. Positive outcomes of possession for both successful and unsuccessful teams 32
49 This demonstrates that for five positive outcomes of possession the successful teams register more occurrences than the unsuccessful teams. It is also clear to see that free kicks and box entries are the most common form of positive outcome. The successful teams register a much higher frequency of box entries compared to the unsuccessful teams. Table 10. Statistical analysis: significant differences between positive outcomes of possession Positive outcomes of possession Results of Mann-Whitney U test between successful and unsuccessful teams Box entry.248 Positive clearance.243 Corner.468 Free kick.663 Goal.019* Shot blocked.661 Shot off target Shot on target.149 Throw in.659 Total.564 Table 10 summarises the statistical values recorded upon completion of the Mann-Whitney U test. It indicates that the only significant difference (P < 0.05) found was for the goals scored between the successful and unsuccessful teams. No statistical differences were determined for any other positive outcome of possession category. 33
50 Frequency of occurences Shots at goal Figure 12 shows the shots at goal for both groups of team for every match played. It indicates clarly that the successful teams have more shots on target than their unsuccessful counterparts. However, the number of occurrences for both shots blocked and shots off target are very similar when comparing the groups of teams Successful Unsuccessful 5 0 Shot Blocked Shot off target Shot on target Shot type Figure 12. Average shots at goal for both successful and unsuccessful teams Table 11 demonstrates no significant difference detected between the shots at goal taken by both the successful and unsuccessful teams. Table 11. Statistical analysis: shots at goal Shots at goal Results of Mann-Whitney U test between successful and unsuccessful teams Shot blocked.661 Shot off target Shot on target.149 Total Figure 13 indicates the proportion of shots on target of the total shots taken as a percentage. It shows that Holland have the highest shot accuracy at 40.48%. This means that for every ten shots Holland muster, four are on target. On the contrary, Honduras' shot accuracy is 12.5%. 34
51 Team Honduras 12.5 Cameroon Serbia France Uruguay Germany Holland Spain Proportion of Shots on Target to total shots (%) Figure 13. Shot accuracy Table 12 summarises the findings of Figure 13 by comparing the shot accuracy of the successful and unsuccessful teams. It shows the successful teams have a shot accuracy that is 10% better than the unsuccessful teams. Table 12. Average shot accuracy as a percentage for the successful and unsuccessful teams. Teams Shot accuracy (%) Successful Unsuccessful Table 13 shows no significant difference (P < 0.05) was detected between the shot accuracies of the successful and unsuccessful teams. Although Table 12 indiactes a clear difference between the shot accuracy for both groups of teams the statistical value of indicates otherwise. Table 13. Statistical analysis: statistical value for shot accuracy Shot accuracy Results of Mann-Whitney U Tests between successful and unsuccessful teams Shot accuracy
52 Nation 4.5 Possession Figure 14 shows the possession statistics were calculated from the three matches each team played. Spain and Holland, the two most successful teams at the tournament registered the highest average match posssesion. Honduras, one of the least successful teams at the tournament, recorded the lowest average a match possession of 37.9%. Three quarters of the teams analysed in this study registered an average match possession above 51%. Honduras Cameroon Serbia France Uruguay Germany Holland Spain Average match possession (%) Figure 14. Average team match possession Table 14 summarises the information presented in Figure 14 and shows the average match possession for both the successful and unsuccessful teams. This indicates that the successful teams have higher average match possession by 7.2%. Table 14. Average team match possession Teams Average match possession (%) Successful Unsuccessful
53 Table 15 demonstrates the statistical difference in team possession between the successful and unsuccessful teams. It shows no significant difference between possession had by the successful and unsuccessful teams even though the raw data indicates a difference. Table 15. Statistical analysis: Possession Performance indicator Results of Mann-Whitney U test between successful and unsuccessful teams Possession
54 CHAPTER V DISCUSSION
55 CHAPTER FIVE: Discussion 5.1 Introduction James et al. (2002) stated that since the beginnings of both hand and computerised systems, through to the development of contemporary software packages, soccer is a sport that has received considerable focus from researchers in the notational analysis literature. Notational analysis uses numerical data to study and assess the quality of on the ball actions during a match (Grehaigne et al., 2001; Lemmink & Frencken, 2013). The results obtained from the current study have provided a detailed insight into the comparison between teams deemed to be 'successful' and 'unsuccessful' based on finishing positions at the 2010 World Cup tournament finals. With a lack of research in the particular area comparing relative success, the results gained can only be related to a limited number of studies 5.2 Reliability James (2007) discussed the varying types of data collected within performance analysis; for example, the duration of a run is measure in seconds (scale) whereas categorising a soccer pass as successful or unsuccessful uses a nominal scale. He subsequently highlights that the chance of one-solution fits all approach to assessing reliability seems highly unlikely. Cooper et al. (2007) state that the repeatability, synonymous with reliability and accuracy of equipment is a key factor in any research. A review conducted by Hughes et al. (2002) found that 70 per cent of 67 papers, presented at world conferences between 1988 and 1998, that were experimental studies with notation systems did not mention reliability studies. Ibid et al. (2002) also comment on analytical procedures concerning non-parametric data, emphasising the need for clear demonstration of a system s reliability in a way that is compatible with its intended use in the study. The current study used intra-observer reliability, which demonstrates the reliability of the system (Figure 7 and Table 7). It has been suggested that when using a computerised notation system that it should be tested for both intra- and inter-observer reliability (Franks & Hughes, 1996). However, due to the context of the research in this study, it was deemed irrelevant to train more than one observer. 38
56 5.3 Discussion of findings Passing Sequences Figures 7 and 8 display the total frequency of each passing sequence for the matches analysed. It is clear from the aforementioned figures that the most commonly used passing sequence for both the successful and unsuccessful teams was the 0-3 category. This is reinforced by Figure 9 which indicates that the highest mean passing sequence occurrences for both groups of teams is 0-3 passes. This is concurrent with the study of Hughes and Franks (2005) who found that the predominant sequence length of passing in the 1990 and 1994 World Cups, for both successful and unsuccessful teams, was between 0 and 3. Upon closer analysis of Figure 9 a clear correlation emerges; as the length of the passing sequence increases above the 0-3 category, the successful teams register a higher number of occurrences within each category than the unsuccessful teams. It could therefore be suggested that, from this data, teams are more successful because of their comparative ability to retain possession of the ball for longer sequences. However, Figure 9 demonstrates that whilst the successful teams register a higher number of occurrences as the passing sequence length increase, the frequency of the occurrences within each category decrease for both groups of teams. Passing sequence lengths of and 16+ occur very infrequently in comparison with the shorter passing sequence length categories. This is concurrent with previous literature as Hughes and Franks (2005) found that the frequency of each sequence length decreases as the passing sequence length increases. After completion of the Mann-Whitney U test it was deemed that there was no significant difference between the successful and unsuccessful teams. This is highlighted in Table 8. The statistical value was found to be (P > 0.05) for the 0-3 passing sequence category indicating non-significant difference. However, when comparing Table 8 and Figure 9 it can be interpreted that the difference between the frequencies of occurrences is due to the ability of the teams, rather than just chance. A similar case can also be made for the passing sequence categories of and >16 as after statistical analysis it was the significance value was determined at and (P > 0.05) respectively. It has also been found that there is non-significant difference between the groups of teams when considering total passing sequences made; a statistical value of.773 (P > 0.05) demonstrates this. 39
57 5.3.2 Negative outcomes of possession From analysing Figure 10 it is clear to see that the most common form of negative outcome of possession, for both groups of teams, is a pass being misplaced. A misplaced pass occurs approximately 15 times more often than the next most frequent form of negative outcome; dispossessed. It would be prudent to expect that the unsuccessful teams would register a higher number of occurrences for all of the indicators of negative outcomes compared to the successful teams (Collet, 2013). However, the findings of this study are contrary to Collet's (2013) suggestion; the successful teams have misplace more passes and make more passes out of play than the unsuccessful teams. This is reinforced by the findings reported in Table 9. It shows that a significance value of (P < 0.05) was found for the pass misplaced category. The cause of this might be due to the successful teams having a higher percentage of match possession than the unsuccessful teams (Table 14), therefore the chance of pass inaccuracy is increased because of the increased passes. For the negative outcomes of possession: dispossessed, negative clearance, offside and pass intercepted, unsuccessful teams register a higher frequency of occurrences. However, when viewing Figure 10, it is apparent that there is no marked difference between the frequency of occurrences for these negative outcomes of possession between the two groups of teams. Both the successful and unsuccessful teams register an identical frequency of occurrences for the negative outcomes dribbled out of play and player error. Table 9 shows that after statistical analysis was completed significant differences in negative outcomes of possession were only found within negative clearances and passes misplaced. When comparing Table 9 and Figure 10 it is apparent that the successful teams have significantly more passes misplaced; the significance value given was (P < 0.05). However, this is the opposite for the negative clearance category; negative clearances occurred very infrequently in comparison with other negative outcomes of possession. However, the statistical value of (P < 0.05) indicates the unsuccessful teams have significantly more negative clearances than the successful teams. The significance value of (P < 0.05) given for the median number of times the unsuccessful teams were dispossessed compared to the successful teams indicates that there is no. This is reinforced by Figure 11 which shows the unsuccessful group was dispossessed 18 times, compared to 15 times for the successful group of teams. The 40
58 statistical difference given for the total occurrences of negative outcomes of possession was recorded at (P < 0.05); this indicates that there is no significant difference between the total negative outcomes of possession. This is contrary to previous perceptions of the difference between successful and unsuccessful teams, which had been suggested that there would be a significant difference between the negative outcomes of possession (Hughes and Franks; Collet, 2013) Positive outcomes of possession Figure 12 displays a comparison between the frequency of positive outcomes of possession of the successful and unsuccessful teams. It is clear that free kicks and box entries occur most often per match for both sets of teams with over 10 instances occurring each. However, the free kick category is not as important as the box entries as the free kicks occurred all over the pitch. Jones et al. (2004) stated that gaining access to the opponents penalty area gives a higher chance of a shot at goal being created and therefore is of importance in attacking patterns of play. The box entries recorded for the successful teams were greater than those recorded for the unsuccessful teams. However, on completion of statistical analysis, Table 5 shows that a statistical value of (P > 0.05) was determined indicating a non-significant difference between the two groups of teams. The successful and unsuccessful teams both registered similar occurrences for the corners category indicated by a non-significant difference of (P > 0.05). Corners are not good predictors of success as there is a large element of chance in winning a corner. However, if a corner count is relatively high in comparison with the opposition it demonstrates that one team is spending a large amount of time near to the opponents goal and therefore is creating a lot of chances from which to score. Positive clearances are recorded far less frequently than any other positive outcome of possession except for goals scored; Figure 11 shows that fewer than two instances of positive clearances occur per match and also indicates that the unsuccessful teams make more positive clearances than the successful teams. This might be due to a combination of the pressure they sustain throughout a match and the lower ability of the players within the team. Therefore they have to resort to attempted clearances, rather than passing their way out of defensive areas. 41
59 Shots at goal have been recognised in the literature as a key determinant in attacking success (Reep & Benjamin, 1968; Reep et al., 1971; Jones et al., 2004; Hughes and Franks, 2005). Figure 12 indicates that the successful teams have a much greater frequency of shots on target compared to the unsuccessful teams. In comparison, both the shots off target and shots blocked categories are very similar between both groups of teams. However, the Mann-Whitney U test indicated non-significant difference for any of the shots at goal categories: shot on target (0.149), shot blocked (0.661) and shots off target (1.000) (P > 0.05). When viewing Figure 13 and Table 12, it is clear that the shot accuracy is much larger in the successful teams. Figure 13 shows that over 40% of Germany and Holland's shots at goal are on target. Table 12 shows that the successful teams shots are on target more often than the unsuccessful teams; 36.6% on the shots taken by successful teams are on target compared to 25.4% for the unsuccessful teams. However, after completion of the Mann-Whitney U test, a statistical value was reported of (P < 0.05) indicating nonsignificant difference between the shot accuracy of the successful and unsuccessful teams. Having shots at goal has already been identified as a key area of match performance. However, the ability to have shots that are on target is of more importance that just shots at goal. Although non-significant difference was reported between the shot accuracy of the successful and unsuccessful teams, the percentage of shots on target in larger in successful teams. This indicates that coaches need to allocate time within training, with the specific aim of shooting on target. Interestingly, the only significant difference found for positive outcomes of possession was in the goals scored between the two groups of teams, (P < 0.05). This indicates that successful teams score more goals than unsuccessful teams; a finding that is concurrent with the previous research (Bate 1988; Jones et al., 2004; Carling et al., 2005; Hughes & Franks, 2005; Armatas et al., 2007). In this World Cup tournament Spain, the eventual champions, scored only 8 goals in their 7 matches; a record low for World champions. Therefore, this study alludes to the suggestion that goal scoring is not as important in predicting success as other attacking performance indicators, such as possession (Lago & Martin, 2007; Collet, 2012). 42
60 5.3.4 Possession The relative success of teams that play 'possession football' has been subject to much debate. Initially, many researchers believed direct play or the 'long ball game' was the most successful method of possession football (Reep and Benjamin, 1968; Reep, 1971; Olsen and Larsen, 1997). However, researchers have found possession to be a significant offensive factor that predicted winning (Lago & Martin, 2007; Collet, 2013). It has been argued that indirect play, has in recent years become a more successful form of possession football (Jones et al. 2004; Yiannakos and Armatas, 2004; Hughes and Franks, 2005; Collet, 2013). On closer inspection of Figure 14 it becomes apparent that three quarters of all of the teams average match possession was above 50%. However, one team in both categories (successful and unsuccessful) recorded an average match possession below 40%. This decreases the match possession for both sets of teams, especially in the case of the more successful teams. The three nations who finished 1st, 2nd and 3rd in the tournament all recorded average match possession statistics above 60%. Table 14 indicates the average match possession for both groups of teams. It shows that the successful teams have an average match possession 7.2% higher than the unsuccessful teams. The statistical value resulting from completion of the Mann-Whitney U test was found to be (P < 0.05), shown in Table 15. This indicates non-significant difference was found within the overall possession between the successful teams and unsuccessful teams; even though the raw data indicates there is a marked difference. This is made clear in Table 14 as it shows that the successful teams match possession is 57.1% compared to the unsuccessful teams' 50.0% It could be postulated that the reason non-significant differences in median were found between overall match possession was due to Uruguay's relatively low possession statistics. In the present study Uruguay were classed as a successful team, however, at the time of the tournament they were ranked by FIFA as the 16th best team in the world; the other three teams classed as successful, Spain, Holland and Germany were ranked 2,4 and 6 respectively (FIFA.com). These match possession results suggest that Uruguay achieved a relatively high level of success by employing 'direct play'; a style of play previously associated with teams of a lower rank containing lower ability players (Reep 1971; Hughes 1990; Olsen & Larsen, 1997 Hughes & Franks, 2005). 43
61 Collett (2013) previously suggested that World and European champions have found success by having a higher percentage of overall possession. The present study alludes to this suggestion as both Spain and Holland, the eventual finalists of this tournament, had the two highest average match possessions; exemplified in Figure 14. Spain, the champions of the tournament, recorded an average match possession of 68.8%. On the other hand, Honduras, who finished the tournament having not scored a goal and only registering one point, recorded an average match possession of 37.9%. This is indicative of possession being a key performance indicator in predicting the relative success of elite international football teams. This finding concurs with previous research, which has stated that successful teams typically had longer possessions than unsuccessful teams (Jones et al. 2004; Lago & Martin, 2007; Collet, 2013). It seems therefore, that at least in this World Cup tournament, the duration of possession was strongly related to successful performance. However, this is not a definitive conclusion as Uruguay were the 4th most successful team at the tournament despite only having an average match possession of 39.8%, the second lowest of the eight teams analysed. This poses a question as to whether possession is the key determinant in success or whether other factors are more important. 5.4 Implications of findings It is clear that the use of an accurate team match analysis system can be significantly influential in aiding the coach with tactical selections and decisions. The findings of the present study highlight an association between the successful teams and the ability to hold the ball for long pass sequences; concurrent with previous research (Jones et al., 2004; Hughes & Franks, 2005; Mahony et al., 2012). This shows the need for coaches to allocate time within the training programme for activities encouraging ball retention. However, this study has also shown that relative success can be achieved utilising primarily a direct style of play; demonstrated by Uruguay's possession and passing sequence statistics. This indicates that directness of play should not be entirely discounted as relative success is also linked to individual player ability (Jones et al., 2004). 44
62 5.5 Sample issues One pertinent issue regarding notational analysis studies is the sample selected for analysis. Usually data collection takes place on the basis of a common theme, for example, in an International tournament, domestic league competition or on one particular team. This is common due to the aim of providing summary statistics and assessing trends for a team or teams (James, 2006). However, care should be taken to not make assumptions that the findings are relevant for future matches. Taylor et al. (2004) stated that due to the finite nature of competitions and the small number of matches played by each team it is questionable whether the data collected is sufficient to produce meaningful representations of performance. 5.6 Delimitations Due to the dynamic nature of team sports, match analysis is a complex area as any small changes can alter the outcome. These changes can be in relation to events within the matches i.e. weather, playing surface and climate, or could be due to external factors unrelated to the match itself i.e. player personal circumstances. Scientific research is difficult in performance analysis because some variables cannot be quantified with summary statistics. There are many variables that influence a match that are out of the direct control of the researchers. Some examples of issues the present researcher encountered are listed below: Opposition strength - the strength of the opposing team influences the style of play used and performance indicators achieved. Red cards - A sending off can significantly alter the match outcome. Being reduced to 10 player s influences tactics of both teams and the possession had by the team with all 11 players usually increases. Therefore this alters match statistics. Injuries - Key player injuries, or injuries to players in specialist positions influence match outcomes. Losing the best player in the team can reduce the confidence of the team as a whole, whilst losing players in specialist positions means other players have to fill gaps, potentially weakening the team. 45
63 Team morale - Team morale is not a quantifiable measure in terms of performance analysis even though it has the potential to play a key role in success. Several external factors, completely unrelated to the match, can play a role in team morale. 46
64 CHAPTER VI CONCLUSION
65 CHAPTER SIX: Conclusion 6.1 Conclusions of the study The aim of this study was to analyse and compare the patterns of play during the attacking phases of competitive matches for teams deemed to be 'successful' and 'unsuccessful' based on finishing positions at the 2010 World Cup finals tournament in South Africa. The study was loosely based on the suggestion made by Hughes and Franks (2005), who claimed there was a clear difference in converting possessions into shots at goal between successful and unsuccessful teams. In an attempt to verify the validity of the conclusions drawn following the analysis of the data, a series of Mann-Whitney U tests were conducted. The findings concluded that: There were non-significant differences (P > 0.05) found between possession had by the successful and unsuccessful teams There were non-significant differences (P > 0.05) found between passing lengths had by the successful and unsuccessful teams. There were non-significant differences (P > 0.05) found between the shots at goal attempted by the successful and unsuccessful teams There were significant differences (P < 0.05) between the total goals scored between the successful and unsuccessful teams. However, as previously discussed, the results gave clear indications that a key factor in relative success in tournament football is the maintenance of longer passing sequences. The successful teams at this tournament registered a higher number of occurrences of passing sequences above the 0-3 category; therefore indicating that teams are more successful because they retain possession of the ball for longer sequences of possession than their relative 'unsuccessful' counterparts. The data collected revealed similarities in differences in the patterns of play of the teams. For example, it was evident that Spain, Holland and Germany would keep possession of the ball for considerably longer; utilising indirect play. Uruguay, however, seemed to predominantly adopt a 'direct approach. The results provided no clear overall differences in whether the result of possession was positive or negative between the successful and unsuccessful teams. However, statistically significant differences (P < 0.05) were found in the negative outcomes of play for negative clearance and pass misplaced. 47
66 6.2 Limitations of the study Sample size The current study used a total of 20 matches in the group stages of the 2010 World Cup. It might be questioned therefore whether 20 matches was a large enough sample to develop a normative profile (James et al., 2002). However (Hughes et al., 2001) suggest that there is no optimum sample size, but that the appropriate number of matches is dependent on the level of match analysis. Therefore, the results of this study are only representative of the group stages 2010 World Cup tournament and although the findings are similar as to those of previous World Cup tournaments, caution must be taken to avoid presumptions when applying this to future tournaments (Hughes & Franks, 2005) Data collection The data collected was subjective according to the primary researcher and therefore differences might have occurred within the coding of certain instances. Although steps were put in place to combat this issue, including the detail of the operational definitions, error might have occurred when identifying performance outcomes Television footage All games used were previously recorded using television coverage; inevitably this led to some of the footage being missed due to television replays and other non-relevant footage whilst the ball was in play (Winkler, 1996). Therefore these periods could not be analysed and key pieces of possession could have been missed. This could be remedied by having the researcher record the matches themselves, therefore eliminating television replays and irrelevant footage. 48
67 6.3Strengthsof the present study Sample This study was the first of its kind to analyse the most recent World Cup footage. This provided a current elite platform for which extensive team match analysis could take place. The use of the group stages of this tournament allowed for direct comparison between teams deemed to be 'successful' and 'unsuccessful' in matches played against the same opposition. In addition, the presence of other teams in the group effectively creates a control group against which successful and unsuccessful teams can be compared Post event computerised analysis Analysing the footage after the event minimised the chance of error in coding. Using post event computer analysis, the footage could be paused, rewound, and stopped to allow the primary researcher to code instances correctly. Therefore, the data collected was as accurate as is possible using the current system Outcomes of possession The recording of outcomes of possession, positive and negative, was the first of its kind to break down every possession had by the team being analysed. By analysing the outcomes of possession, it could be determined whether there was a significant difference between the 'successful' and 'unsuccessful' teams Passing sequences The design of the template allowed for passing sequences to be measured in categories up to 16+. This meant that rather than only measuring up to 8+ passing sequences as previous studies have (Hughes & Franks, 2005); comparisons could be made between the groups of teams within extended passing sequences. Therefore providing a greater understanding and possible reasoning for the difference between 'successful' and 'unsuccessful' teams. 49
68 6.4 Recommendations for future research The current study has highlighted the importance of possession football and the ability to maintain longer passing sequences in international football. However, these findings can only be applied to this one international tournament. In order to further future research a few areas need to be addressed. These include: Using a larger sample based on several international tournaments, to detect relative success (Hughes & Franks, 2005). Use the current method within the European Champions League. The findings would enable managers who's teams are entering the competition for the first time to adapt patterns of play with ones already recognised as successful Analyse the types of passes that led to goal scoring chances. The ratio of long to short passes within attacking build up play would provide an insight into the way goals are scored. Assessing the tactics employed by managers and the influence on match result. This would show managers the formations and tactics that are most likely to provide success. 50
69 REFERENCES
70 REFERENCES Anon. (2013). The History of The FA. Available: Last accessed 15/01/2014. Anon. (2013). LAW 11: OFFSIDE. Available: Last accessed 19/01/2014. Altmann, D.G. (1991). Practical Statistics for Medical Research. London: Chapman & Hall. Armatas, V., Yiannakos, A., Sileloglou, P. (2007). Relationship between time and goal scoring in soccer games: Analysis of three World Cups. International Journal of Performance Analysis in Sport. 7(2), p. 48. Atkinson, G., Nevill, A. (1998) Statistical methods for assessing measurement error (reliability) in variables relevant to sports medicine. Sports Medicine. 26, p Bate, R. (1988). Football chance: Tactics and strategy. In Reilly, T., Lees, A., Davids, K., Murphy, W. Science and Football. E. & F.N. Spon, London, p Bateman, R. (2013). BLOG Opta's Event Definitions. Available: Last accessed 19/01/2014. Carling, C., Williams, A., Reilly, T. (2005). The handbook of soccer match analysis. Abingdon: Routledge. Castellano, J., Blanco-Villaseñor, A., Álvarez, D. (2011). Contextual Variables and Time- Motion Analysis in Soccer. International Journal of Sports Medicine. 32(6), p Collett, C. (2013). The possession game? A comparative analysis of ball retention and team success in European and international football, Journal of sports sciences, 31 (2), p
71 Cooper, S., Hughes, M., O'Donoghue, P., Nevill, A. (2007). A simple statistical method for assessing the reliability of data entered into sport performance analysis systems. International Journal of Performance Analysis in Sport. (7)1, p. 87. Drust, B. (2010). Performance analysis research: Meeting the challenge. Journal of Sports Science. 28(9), p Franks, I. (1997). Use of feedback by coaches and players. In: Reilly, T., Bangsbo, J., Hughes, M., Science and football 3. London: E & FN Spon. p Franks, I., Miller, G. (1986). Eyewitness testimony in sport. Journal of Sport Behaviour. 9, Fullerton, H. (1912). The inside game: the science of baseball. The American Magazine. LXX, Garganta, J., Maia, J., Basto, F., (1997). Analysis of goal-scoring patterns in European top level soccer teams, In Reilly, T., Bangsbo, J and Hughes M. Science and Football 3. E&FN SPON. London. p Grehaigne, J. F., Mahut, B., Fernadez, A. (2001). Qualitative observation tools to analyse soccer. International Journal of Performance Analysis of Sport. 1(3), p Groom, R., Cushion, C., Nelson, L. (2011). The delivery of video-based performance analysis by England youth soccer coaches: Towards a grounded theory. Journal of Applied Psychology. 23(1), p Hendry, D., Hodges, N. (2013). Getting on the right track. In: McGarry, T., O'Donoghue, P., Sampiao, J Routledge handbook of sports performance analysis. London and New York: Routledge. p Hodges, N., Franks, I. (2002). Modelling coaching practice: The role of instruction and demonstration. Journal of Sport Sciences. 20(10), p
72 Hughes, C. (1990). The winning formula. Collins London. Hughes, M. (1996). Notational Analysis. In Science and Soccer (edited by T. Reilly.), p London: E&FN Spon. Hughes, M., Bartlett, R. (2002). The use of performance indicators in performance analysis. Journal of sports sciences, 20(10), pp Hughes, M., Bartlett, R. (2008). What is performance analysis?. In: Hughes, M., Franks, I The essentials of performance analysis. Abingdon: Routledge. p Hughes, M.D., Cooper, S. and Nevill, A. (2002). Analysis procedures for non-parametric data from performance analysis. International Journal of Performance Analysis in Sport. 2(4), p Hughes, M., Cooper, S., Nevill, A. (2004). Analysis of notation data: reliability. In: Hughes, M., Franks, I Notational Analysis of Sport. 2nd ed. London: Routledge. p Hughes, M.D., Evans, S. and Wells, J. (2001). Establishing normative profiles in performance analysis. International Journal of Performance Analysis of Sport. 1(5) p Hughes, M., Franks, I. (2004). Literature review. In: Hughes, M., Franks, I Notational Analysis of Sport. 2nd ed. London: Routledge. p Hughes, M., Franks, I. (2004) How to develop a notation system. In Hughes, M., Franks, I. Notational analysis of sport second edition: Systems for better coaching and performance in sport. Routledge: London, p Hughes, M., Franks, I. (2005). Analysis of passing sequences, shots and goals in soccer. Journal of sports sciences, 23(5), p Hughes, M., Robertson, K., Nicholson, A. (1988). An analysis of the 1984 World Cup of Association Football. In: Reilly, T., Lees, A., Davids, K., Murphy, W. Science and Football. London: E & FN Spon. p
73 James, N., Mellalieu, S., Hollely, C. (2002). Analysis of strategies in soccer as a function of European and domestic competition. International Journal of Performance Analysis in Sport. 2(1), p. 85 James, N., Jones, P., Mellalieu, S. (2004). Possession as a performance indicator in soccer as a function of successful and unsuccessful teams. Journal of Sports Sciences. 22(4), p James, N., (2006). Notational analysis in soccer: past, present and future. International Journal of Performance Analysis in Sport. 6(2) p. 67 James, N., Jones, N., Hollely, C. (2002). Reliability of selected performance analysis systems in football and rugby. In Proceedings of the 4th International Conference on Methods and Techniques in Behavioural Research. Amsterdam, The Netherlands, p James, N., Taylor, J. and Stanley, S. (2007). Reliability procedures for categorical data in Performance Analysis. International Journal of Performance Analysis in Sport. 7(1), p Johnson, R., Franks, I. (1991). Measuring the reliability of a computer-aided systematic observation instrument. Canadian Journal of Sports Science, 16, Jones, P., James, N., Mellalieu, S. (2004). Possession as a Performance Indicator in Soccer. International Journal of Performance Analysis in Sport, 4 (1), Kotzmanidis, C. (1999). Athletic training in handball. Theory and methods. Lago, C., Martin, R. (2007). Determinants of possession of the ball in soccer. Journal of Sports Sciences. 25(3), p Laird, P., Waters, L. (2008). 'Eye-witness recollection of sports coaches'. International Journal of Performance Analysis of Sport, 8(1), p
74 Lemmink, K., Frencken, W. (2013). Tactical performance analysis in invasion games: Perspectives from a dynamic system approach with examples from soccer. In: McGarry, T., O'Donoghue, P., Sampiao, J Routledge handbook of sports performance analysis. London and New York: Routledge. p Liebermann, D., Katz, L., Hughes, M., Bartlett, R., Franks, I. (2002). Advances in the application of information technology to sport performance. Journal of Sport Sciences. 20(3), p Lyle, J. (2002). Sports coaching concepts: a framework for coaches' behaviour. London and New York: Routledge. p Maslovat, D., Franks, I. (2008). The need for feedback. In: Hughes, M., Franks, I. The essentials of performance analysis. London and New York: Routledge. p.1-7. Mahony, L., Wheeler, K., Lyons, K. (2012). Analysis of Factors Determining Invasion into Attacking Areas and the Creation of Goal-Scoring Opportunities in the Asian Cup Football Competition. Asian Journal of Exercise & Sports Science. 9(1), p Messersmith, L., Bucher, C. (1939). The Distance Travelled by Big Ten Basketball Players. Research Quarterly. 10(1), p O'Donoghue, P. (2010). Research methods for sports performance. London: Routledge. O'Donoghue, P., Mayes, A., (2013). Performance analysis, feedback and communication. In: McGarry, T., O'Donoghue, P., Sampiao, J Routledge handbook of sports performance analysis. London and New York: Routledge. p O Donoghue, P. and Parker, D. (2001). Time motion analysis of FA Premier League soccer competition. In Pass.com: Fifth World Congress of Performance Analysis of Sport (edited by M.D. Hughes and I. Franks), p Cardiff, UK: Centre for Performance Analysis, University of Wales Institute, Cardiff. 55
75 Olsen, E., Larsen, O. (1997). Use of match analysis by coaches. in Reilly, T., Bangsbo, J., Hughes, M, Science and Football. London: E and FN Spon. p Pollard, R., Reep, C. (1997). Measuring the effectiveness of playing strategies at soccer. Journal of the Royal Statistical Society: Series D (The Statistician), 46, p Reep, C., Benjamin, B. (1968). Skill and chance in association football. Journal of the Royal Statistical Society. A(131), p Reep, C., Pollard, R., Benjamin, B. (1971). Skill and chance in ball games. Journal of the Royal Statistical Society, 134, p Reilly, T., Hughes, M. and Lees, A. (eds). (1993). Science & Racket Sports I, London: E. & F. Spon Robinson, G., O'Donoghue, P. (2007). A weighted kappa statistic for reliability testing in performance analysis of sport. International Journal of Performance Analysis in Sport. (7)1, p.12 Sampaio, J., Leite, N. (2013). Performance indicators in game sports In: McGarry, T., O'Donoghue, P., Sampiao, J Routledge handbook of sports performance analysis. London and New York: Routledge. Sampaio, J., McGarry, T., O'Donoghue, P. (2013). Introduction In: McGarry, T., O'Donoghue, P., Sampiao, J Routledge handbook of sports performance analysis. London and New York: Routledge. Tenga, A., 8c Larsen, O. (2003). Testing the validity of match analysis to describe playing styles in football. International Journal of Performance Analysis in Sport, 3(2), p
76 Viera, A., Garrett, J. (2005). Understanding interobserver agreement: the kappa statistic. Family medicine. 37(5), p Vincent, W. (1999). Statistics in Kinesiology (2nd edition). Human Kinetics: USA Wade, A. (1996). Principles of team play. Spring City: Reedswain Inc. Williams, J. (2012). Operational definitions in performance analysis and the need for consensus. International Journal of Performance Analysis in Sport. 12(1), p Wilson, K., Batterham A. (1999). Stability of questionnaire items in sport and exercise psychology: Bootstrap limits of agreement. Journal of Sports Sciences, 17, Winkler, W. (1996). Qualitative and quantitative match analysis in soccer. In Hughes, M. Notational Analysis of Sport III p CPA: UWIC: Cardiff. Yiannakos, A., and Armatas, V. (2004). Evaluation of the goal scoring patterns in European Championship in Portugal International Journal of Performance Analysis in Sport, 6 (1), p
77 APPENDICES
78 APPENDIX A ETHICS STATUS
79
80 APPENDIX B RELIABILITY RESULTS
81 Appendix B - Reliability (kappa scores) Zone outcome Count of R2 Zone Outcome Column Labels Row Labels ARG Att 1/4 ARG Att Med 1/4 ARG Def 1/4 ARG Def Med 1/4 Grand Total ARG Att 1/ ARG Att Med 1/ ARG Def 1/4 3 3 ARG Def Med 1/ Grand Total x4 A B C D Total A B C 3 3 D Total P PC 0.45 Kappa
82 Negative outcome Count of R2 Negative Column Labels Row Labels Dispossessed Negative Clearance Offside Pass Intercepted Pass misplaced Pass out of play Player Error Player Error Dribbled out of play (blank) Grand Total Dispossessed Negative Clearance 1 1 Offside 2 2 Pass Intercepted Pass misplaced Pass out of play 2 2 Player Error 2 2 Player Error Dribbled out of play 1 1 (blank) Grand Total x8 A B C D E F G H Total A B 1 1 C 2 2 D E F 2 2 G 2 2 H 1 1 Total P PC 0.26 Kappa
83 Positive outcome Count of R2 Positive Column Labels Row Labels Box Entry Box Entry Shot off target Corner Free Kick Goal Shot on target Shot Blocked Throw In Shot off target Shot Saved Shot on target Shot Saved Shot on target Corner Throw In (blank) Grand Total Box Entry 1 1 Box Entry Shot off target 2 2 Corner 1 1 Free Kick Goal Shot on target 2 2 Shot Blocked Throw In 1 1 Shot off target 2 2 Shot Saved Shot on target 1 1 Shot Saved Shot on target Corner 1 1 Throw In 4 4 (blank) Grand Total
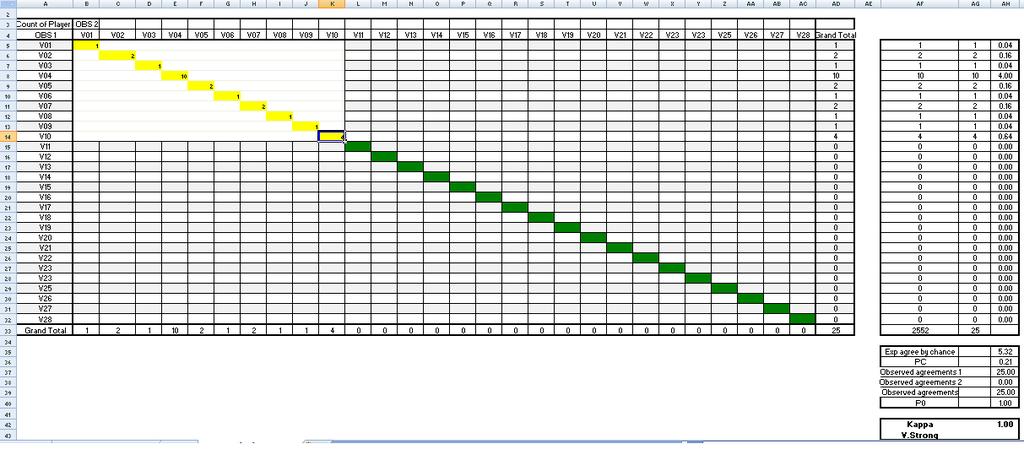
84 4
85 APPENDIX C SYSTEM DESIGN

86 Appendix C - System design Pilot study code window:

87 Code window used for study:

88 Screen set up consisting of footage, code window and timeline:
A comparison between men s and women s elite football
 Cardiff School of Sport DISSERTATION ASSESSMENT PROFORMA: Empirical 1 Student name: Programme: Sophie Scherschel Student ID: 20001479 SPE Dissertation title: Supervisor: A comparison between men s and
Introduction. Level 1
 Introduction Game Analysis is the second teaching and learning resource in the Science Through Sport series. The series is designed to reinforce scientific and mathematical principles using sport science
CARDIFF METROPOLITAN UNIVERSITY Prifysgol Fetropolitan Caerdydd CARDIFF SCHOOL OF SPORT DEGREE OF BACHELOR OF SCIENCE (HONOURS)
") CARDIFF METROPOLITAN UNIVERSITY Prifysgol Fetropolitan Caerdydd CARDIFF SCHOOL OF SPORT DEGREE OF BACHELOR OF SCIENCE (HONOURS) SPORT PERFORMANCE ANALYSIS 2015-6 A tactical comparison of attacking build-up
CARDIFF METROPOLITAN UNIVERSITY Prifysgol Fetropolitan Caerdydd CARDIFF SCHOOL OF SPORT DEGREE OF BACHELOR OF SCIENCE (HONOURS) SPORT PERFORMANCE ANALYSIS 2015-6 A tactical comparison of attacking build-up
An examination of try scoring in rugby union: a review of international rugby statistics.
 An examination of try scoring in rugby union: a review of international rugby statistics. Peter Laird* and Ross Lorimer**. *4 Seton Place, Edinburgh, EH9 2JT. **66/5 Longstone Street, Edinburgh, EH14 2DA.
Penalty Corners in Field Hockey: A guide to success. Peter Laird* & Polly Sutherland**
 Penalty Corners in Field Hockey: A guide to success Peter Laird* & Polly Sutherland** *4 Seton Place, Edinburgh, EH9 2JT **39/5 West Bryson Road, Edinburgh, EH11 1BQ. Abstract The purpose of this study
Cardiff School of Sport DISSERTATION ASSESSMENT PROFORMA: Empirical 1
 Cardiff School of Sport DISSERTATION ASSESSMENT PROFORMA: Empirical 1 Student name: Gregory Adlam Student ID: ST20000164 Programme: SES Dissertation title: Defensive performance variables and their effect
CARDIFF METROPOLITAN UNIVERSITY Prifysgol Fetropolitan Caerdydd CARDIFF SCHOOL OF SPORT DEGREE OF BACHELOR OF SCIENCE (HONOURS)
") CARDIFF METROPOLITAN UNIVERSITY Prifysgol Fetropolitan Caerdydd CARDIFF SCHOOL OF SPORT DEGREE OF BACHELOR OF SCIENCE (HONOURS) SPORT PERFORMANCE ANALYSIS 2015-6 A comparative assessment of elite level
CARDIFF METROPOLITAN UNIVERSITY Prifysgol Fetropolitan Caerdydd CARDIFF SCHOOL OF SPORT DEGREE OF BACHELOR OF SCIENCE (HONOURS) SPORT PERFORMANCE ANALYSIS 2015-6 A comparative assessment of elite level
TECHNICAL STUDY 2 with ProZone
 A comparative performance analysis of games played on artificial (Football Turf) and grass from the evaluation of UEFA Champions League and UEFA Cup. Introduction Following on from our initial technical
Introduction Definition of decision-making: the capacity of the player to execute an action following some conscious tactical or strategical choice.
 Decision Making in Rugby Here is a paper by Pierre Villepreux. He presented it at the 1993 Asian Pacific Congress in Calgary. Eleven years have passed, but this remains one of the benchmark papers on this
Football Intermediate Unit
 Football Intermediate Unit Date: Teacher: Class: Student Name Tut Grp SEN Start Working above (+) Working below (- ) Comments Assessment Initial Assessment LEVEL Below Average Above Expectations Some children
Analysis of performance at the 2007 Cricket World Cup
 Analysis of performance at the 2007 Cricket World Cup Petersen, C., Pyne, D.B., Portus, M.R., Cordy, J. and Dawson, B Cricket Australia, Department of Physiology, Australian Institute of Sport, Human Movement,
steps to designing effective practice
 22 23 steps to designing effective practice How do you decide what coaching practices to deliver? And what process do you follow when designing the practice? Here, FA Youth Coach Educator, Ben Bartlett,
EXPLORING MOTIVATION AND TOURIST TYPOLOGY: THE CASE OF KOREAN GOLF TOURISTS TRAVELLING IN THE ASIA PACIFIC. Jae Hak Kim
 EXPLORING MOTIVATION AND TOURIST TYPOLOGY: THE CASE OF KOREAN GOLF TOURISTS TRAVELLING IN THE ASIA PACIFIC Jae Hak Kim Thesis submitted for the degree of Doctor of Philosophy at the University of Canberra
CARDIFF METROPOLITAN UNIVERSITY Prifysgol Fetropolitan Caerdydd CARDIFF SCHOOL OF SPORT DEGREE OF BACHELOR OF SCIENCE (HONOURS)
") CARDIFF METROPOLITAN UNIVERSITY Prifysgol Fetropolitan Caerdydd CARDIFF SCHOOL OF SPORT DEGREE OF BACHELOR OF SCIENCE (HONOURS) SPORT PERFORMANCE ANALYSIS 2015-6 A COMPARISON OF CORNER KICKS BETWEEN THE
CARDIFF METROPOLITAN UNIVERSITY Prifysgol Fetropolitan Caerdydd CARDIFF SCHOOL OF SPORT DEGREE OF BACHELOR OF SCIENCE (HONOURS) SPORT PERFORMANCE ANALYSIS 2015-6 A COMPARISON OF CORNER KICKS BETWEEN THE
Football Development Unit
 Football Development Unit Date: Teacher: Class: Student Name Tut Grp SEN Start Working above (+) Working below ( ) Comments Assessment Initial Assessment Some children will not have made so much progress.
ORGANISING TRAINING SESSIONS
 3 ORGANISING TRAINING SESSIONS Jose María Buceta 3.1. MAIN CHARACTERISTICS OF THE TRAINING SESSIONS Stages of a Training Session Goals of the Training Session Contents and Drills Working Routines 3.2.
ELITE PLAYERS PERCEPTION OF FOOTBALL PLAYING SURFACES
 ELITE PLAYERS PERCEPTION OF FOOTBALL PLAYING SURFACES study background this article summarises the outcome of an 18 month study commissioned by fifa and supported by fifpro aimed at determining elite players
The Effect of Some Variables Offensive and Defensive Play on the Order of Participating teams Ranked in the World Cup Football 2010
 The Effect of Some Variables Offensive and Defensive Play on the Order of Participating teams Ranked in the World Cup Football 2010 Article Info Received: August 18, 2013 Accepted: October 20, 2013 Published
The development and testing of a manual notation system for identifying successful and unsuccessful shooting ratio in football / soccer
 The development and testing of a manual notation system for identifying successful and unsuccessful shooting ratio in football / soccer Hughes (1973) stated that shooting is not only the most exciting
Introduction to Match Officiating (L1)
") Introduction to Match Officiating (L1) Section 1 Online Learning Module Copyright World Rugby Limited 2016. All rights reserved. Contents Introduction and Aims... 3 Principles of Rugby... 4 Conduct...
Introduction to Match Officiating (L1) Section 1 Online Learning Module Copyright World Rugby Limited 2016. All rights reserved. Contents Introduction and Aims... 3 Principles of Rugby... 4 Conduct...
Michael Haines. Performance Analyst
 Michael Haines Performance Analyst Mike has shown over a number of seasons, an ability to manage various work-loads and produce an output of high quality. He is capable of working alone under high pressure
National Unit Specification: General Information
 National Unit Specification: General Information UNIT Sporting Activity Association Football (Intermediate 1) NUMBER D712 10 COURSE This is a free-standing unit that may be used as part of Scottish Group
DESIGNING PERCEPTUAL MOTOR SKILL DEVELOPMENT PROGRAMS FOR SQUASH
 DESIGNING PERCEPTUAL MOTOR SKILL DEVELOPMENT PROGRAMS FOR SQUASH by Roger Flynn (Grad. Dip. Elite Sports Coaching) Designing Perceptual Motor Skill Development Programs for Squash Introduction by Roger
HIGHER PE (National 6) TACTICS Pupil Workbook
 TACTICS Pupil Workbook") STRATHAVEN ACADEMY HIGHER PE (National 6) TACTICS Pupil Workbook PHYSICAL FACTORS (Tactics) and MENTAL FACTORS Impacting on Performance Name: Class: Teacher s Name: 1 What is a Tactic? SECTION 1 A tactic
STRATHAVEN ACADEMY HIGHER PE (National 6) TACTICS Pupil Workbook PHYSICAL FACTORS (Tactics) and MENTAL FACTORS Impacting on Performance Name: Class: Teacher s Name: 1 What is a Tactic? SECTION 1 A tactic
Opleiding Informatica
 Opleiding Informatica Determining Good Tactics for a Football Game using Raw Positional Data Davey Verhoef Supervisors: Arno Knobbe Rens Meerhoff BACHELOR THESIS Leiden Institute of Advanced Computer Science
National5/6 PE TACTICS Pupil Workbook
 STRATHAVEN ACADEMY National5/6 PE TACTICS Pupil Workbook PHYSICAL FACTORS (Tactics) and MENTAL FACTORS Impacting on Performance Name: Class: Teacher s Name: What is a Tactic? A tactic is a plan of action
IMPLICATIONS FOR PHYSICAL PREPARATION OF CADET MALE TABLE TENNIS PLAYERS: ANALYSIS OF THE 2013 ASIAN CHAMPIONSHIP SINGLES FINAL
 IMPLICATIONS FOR PHYSICAL PREPARATION OF CADET MALE TABLE TENNIS PLAYERS: ANALYSIS OF THE 2013 ASIAN CHAMPIONSHIP SINGLES FINAL Jonathan Glynn 1, Tom Rusga 2, Jake Hartley 3, Francis Mulloy 2, Joseph Moore
Anxiety and attentional control in football penalty kicks: A mechanistic account of performance failure under pressure
 Anxiety and attentional control in football penalty kicks: A mechanistic account of performance failure under pressure Submitted by Greg Wood to the University of Exeter as a thesis for the degree of Doctor
The RCM Analyst - Beyond RCM
 The RCM Analyst - Beyond RCM darylm@strategic-advantages.com About the Author: Daryl Mather was originally trained in RCM in 1991, after which he was involved in the application of the method through a
Module 3 Developing Timing Plans for Efficient Intersection Operations During Moderate Traffic Volume Conditions
 Module 3 Developing Timing Plans for Efficient Intersection Operations During Moderate Traffic Volume Conditions CONTENTS (MODULE 3) Introduction...1 Purpose...1 Goals and Learning Outcomes...1 Organization
Building the Playing Style Concepts
 Building the Playing Style Concepts Style Of Play - Specific Players 1, 2 or 3 touch maximum - minimizing the number of touches improves the speed of play. Keep the game simple - do not force situations,
Notational Analysis - Performance Indicators. Mike Hughes, Centre for Performance Analysis, University of Wales Institute Cardiff.
 Notational Analysis - Performance Indicators Mike Hughes, Centre for Performance Analysis, University of Wales Institute Cardiff. This presentation is based upon:- Hughes, M. and Bartlett, R.(2002). The
Rio 2016 Olympic Games Men s Rugby Sevens Game Analysis Report
 Rio 2016 Olympic Games Men s Rugby Sevens Game Analysis Report World Rugby Game Analysis COMMENTARY The Rio 2016 Olympic Games, which saw the reintroduction of rugby to the Games after a gap of 92 years,
The Effect of a Seven Week Exercise Program on Golf Swing Performance and Musculoskeletal Screening Scores
 The Effect of a Seven Week Exercise Program on Golf Swing Performance and Musculoskeletal Screening Scores 2017 Mico Hannes Olivier Bachelor of Sport Science Faculty of Health Sciences and Medicine Bond
TECHNICAL NOTE THROUGH KERBSIDE LANE UTILISATION AT SIGNALISED INTERSECTIONS
 TECHNICAL NOTE THROUGH KERBSIDE LANE UTILISATION AT SIGNALISED INTERSECTIONS Authors: Randhir Karma NDip: Eng (Civil) B. Tech Eng (Civil) M Eng (Hons) (Transportation) Auckland Traffic Service Group Manager
Fatigue in soccer: NEW APPROACHES AND CONCEPTS. SPAIN PERSPECTIVE. Carlos Lago-Peñas University of Vigo, SPAIN
 Fatigue in soccer: NEW APPROACHES AND CONCEPTS. SPAIN PERSPECTIVE Carlos Lago-Peñas University of Vigo, SPAIN Today s talk Fatigue in soccer. Traditional concepts and approaches The influence of situational
MATCH OFFICIAL DEVELOPER AND PERFORMANCE REVIEWER
 MATCH OFFICIAL DEVELOPER AND PERFORMANCE REVIEWER REVIEW GUIDANCE 2018/19 Rugby Football Union AIM To implement a nationally standardised approach to supporting the development of match officials, which
Getting over the advantage line : how to manipulate space.
 Stuart Woodhouse Task Written Assignment Getting over the advantage line : how to manipulate space. Rugby Union as a sport is categorised as an invasion game of two teams. One team attacking with the ball,
Pass Appearance Time and pass attempts by teams qualifying for the second stage of FIFA World Cup 2010 in South Africa
 Technical Report : Game Analysis Pass Appearance Time and passes attempts in FIFA South African World Cup Pass Appearance Time and pass attempts by teams qualifying for the second stage of FIFA World Cup
Global Certifying Authority for Scrum and Agile Professionals
 Global Certifying Authority for Scrum and Agile Professionals SCRUM is an iterative and incremental agile framework for managing complex projects. A scrum (short for scrummage) is a method of restarting
Licensed Coaches Event The England DNA: In the Grassroots game
 Licensed Coaches Event The England DNA: In the Grassroots game The England DNA: In The Grassroots Game Following its launch in December 2014, this FA Licensed Coaches Club Event is designed to introduce
Technical and tactical analysis of the Olympic tournament London November AEFCA Symposium in Split Dany Ryser
 Technical and tactical analysis of the Olympic tournament London 2012 19 November AEFCA Symposium in Split Dany Ryser In the service of football The FIFA Technical Study Group is integrated in all major
WHAT CAN WE LEARN FROM COMPETITION ANALYSIS AT THE 1999 PAN PACIFIC SWIMMING CHAMPIONSHIPS?
 WHAT CAN WE LEARN FROM COMPETITION ANALYSIS AT THE 1999 PAN PACIFIC SWIMMING CHAMPIONSHIPS? Bruce Mason and Jodi Cossor Biomechanics Department, Australian Institute of Sport, Canberra, Australia An analysis
NCCP Swimming 301 Course Summary
 1 INTRODUCTION 3:30 This module provides coaches with an overview of the 301 course, what is expected of the coaches and most importantly what coaches can expect to get out of attending the 301 course.
Purpose. Scope. Process flow OPERATING PROCEDURE 07: HAZARD LOG MANAGEMENT
 SYDNEY TRAINS SAFETY MANAGEMENT SYSTEM OPERATING PROCEDURE 07: HAZARD LOG MANAGEMENT Purpose Scope Process flow This operating procedure supports SMS-07-SP-3067 Manage Safety Change and establishes the
SOCCER TRAINING POTENTIONAL OR REAL INFORMATION
 SOCCER TRAINING POTENTIONAL OR REAL INFORMATION onetouchsoccerl@b The training in its essence has only potential information in itself, a good coach is the one who transforms this into real information.
6 NATIONS 2004 STATISTICAL REVIEW AND MATCH ANALYSIS
 6 NATIONS 2004 STATISTICAL REVIEW AND MATCH ANALYSIS IRB Game Analysis 6 Nations 2004 April 2004 6 NATIONS 2004 STATISTICAL REVIEW AND MATCH ANALYSIS contents pages: COMMENTARY 1-2 SUMMARY 3 CHAMPIONSHIP
251 engaging and releasing club. 625 only releasing club. 236 all sides. 9,757 only player. 12,604 transfers
 1 This report offers a summary of the involvement of intermediaries in international 1 transfers completed in FIFA s International Transfer Matching System (ITMS) since 1 January 2013. Typically, three
HAWK-EYE INNOVATIONS LTD THE HAWK-EYE TENNIS COACHING SYSTEM
 HAWK-EYE INNOVATIONS LTD THE HAWK-EYE TENNIS COACHING SYSTEM 1 INTRODUCTION The Hawk-Eye Tennis Coaching System described in this document is the most technologically advanced tennis coaching system in
Global Certifying Authority for Scrum and Agile Professionals. Authorized Training Partner
 Global Certifying Authority for Scrum and Agile Professionals Authorized Training Partner SCRUM is an iterative and incremental agile framework for managing complex projects. A scrum (short for scrummage)
MEMORANDUM OF UNDERSTANDING
 MEMORANDUM OF UNDERSTANDING Recognising the position of the Fédération Internationale de Football Association as the governing body of world football and also recognising the Fédération Internationale
Netball Australia Bench Officials Accreditation Framework. Updated 2018
 Netball Australia Bench Officials Accreditation Framework Updated 2018 Contents 1.1 Introduction... 3 1.2 Licensing/Franchise Arrangements... 3 1.3 Insurance... 3 1.4 Bench Officials Code of Behaviour...
ACHPERConference 2010 NET/WALL GAMES
 Level 1 Level 2 Level 3 Level 4 ACHPERConference 2010 Students perform basic motor skills and movement patterns They regularly engage in periods of moderate to vigorous physical activity They use simple
Strategic Plan for Sevens Rugby. September 2006
 Strategic Plan for Sevens Rugby September 2006 Introduction The promotion of Sevens has been instrumental in taking Rugby to new territories and regions. The continued growth of Sevens would help achieve
D.O.I: Assistant Prof., University of Guilan, Rasht, Iran
 X OPHΓIA Sport Management CHOREGIA Scientific Forum in International Journal Sport Management SMIJ VOL. 10, Number 2, 2014 Analyzing Factor of Time of Scoring Goal in Success of Football (Case Study: South
MAPPING OF RISKS ON THE MAIN ROAD NETWORK OF SERBIA
 MAPPING OF RISKS ON THE MAIN ROAD NETWORK OF SERBIA Krsto LIPOVAC 1, Dragan JOVANOVIĆ 2, Svetlana BAŠIĆ 2 1 Academy of Criminalistic and Police Studies, Belgrade, SERBIA 2 Faculty of Technical Sciences,
Netball Australia Bench Officials Accreditation Framework. Updated 2015
 Netball Australia Bench Officials Accreditation Framework Updated 2015 Contents 1.1 Introduction... 3 1.2 Licensing/Franchise Arrangements... 3 1.3 Insurance... 3 1.4 Bench Officials Code of Behaviour...
DIFFERENTIATED ANALYSIS OF OFFENSIVE ACTIONS BY FOOTBALL PLAYERS IN SELECTED MATCHES FROM THE EURO 2008
 Pol. J. Sport Tourism 2013, 20, 188-193 DOI: 10.248/pjst-2013-001 188 DIFFERENTIATED ANALYSIS OF OFFENSIVE ACTIONS BY FOOTBALL PLAYERS IN SELECTED MATCHES FROM THE EURO 2008 1 1 TOMASZ BURACZEWSKI, LESZEK
Golf. By Matthew Cooke. Game Like Training
 Game Like Training for Golf By Matthew Cooke Game Like Training @gltgolf @gltraininggolf Introduction In this quick start guide we dive a little deeper into what it means to train in a Game Like way. Game
The International Match Calendar in football
 The International Match Calendar in football Report on male players Dr. Vincent Gouttebarge, Mr. Jonas Baer-Hoffmann 1 Background Professional footballers (male and female) can only perform at their full
DETERMINATION OF SAFETY REQUIREMENTS FOR SAFETY- RELATED PROTECTION AND CONTROL SYSTEMS - IEC 61508
 DETERMINATION OF SAFETY REQUIREMENTS FOR SAFETY- RELATED PROTECTION AND CONTROL SYSTEMS - IEC 61508 Simon J Brown Technology Division, Health & Safety Executive, Bootle, Merseyside L20 3QZ, UK Crown Copyright
Dear Coaches, Yours boxing, Ching-Kuo Wu AIBA President COACHES MANUAL - 3
 COACHES MANUAL Dear Coaches, It is a great pleasure for me to introduce the AIBA Coaches Manual. This document is the culmination of many hours of work by our Coaches Commission members and it represents
Playing the game. The singles game
 Playing the game Before it is possible to know what is involved in playing a game it is perhaps necessary to have some idea of what is meant by the word game. A simple explanation is that a badminton game
195 engaging and releasing club. 479 only releasing club. 166 all sides. 8,025 only player 10,282
 1 Introduction This report offers an extensive overview of the involvement of intermediaries in all international transfers 1 completed in FIFA s International Transfer Matching System (ITMS) since 1 January
Benefits in effective scouting:
 Why Scout? This scouting information will prepare the coach to create a realistic training environment that specifically is designed to compete against the opponent. Professional scouting is a very meticulous
RETREATING LINE INTRODUCTION
 INTRODUCTION This guide has been developed to help all clubs, coaches, club based referees, parents and players, who are participating in football games utilising the. You will find the rules and regulations
The Football Trophy Challenge
 The Football Trophy Challenge Element (GCSE 1 2)/KS3 3 (GCSE 3 4)/KS3 4 (GCSE 5 6)/KS3 5 (GCSE 7 8)/KS3 6 (GCSE 9 10)/KS3 7+ Comments DRIBBLING Ball is not under control. No variation in dribbling style.
ASeasonofCoachingSessions ForYouthSoccer. A24weekcoachingprogram DARRENLAVER&GARETHLONG
 ASeasonofCoachingSessions ForYouthSoccer A24weekcoachingprogram DARRENLAVER&GARETHLONG A season of coaching sessions for youth soccer A 24 week coaching program By Darren Laver & Gareth Long 1 INTRODUCTION
Preamble to the AFF Selection Policy
 Preamble to the AFF Selection Policy This preamble to the AFF Selection Policy outlines the philosophy on which the Selection Policy is based. This preamble is provided by way of background only, does
CAVING REGISTRATION LEVELS AND ASSESSMENT REQUIREMENTS
 CAVING REGISTRATION LEVELS AND ASSESSMENT REQUIREMENTS NOLRS VERSION 2.2 October 2009 Outdoor Council of Australia Ph: (08) 9248 6677 1800 660 540 Fax: (08) 9248 5799 Email: nolrs@outdoorcouncil.asn.au
Performance in Team Sports: Identifying the Keys to Success in Soccer
 Journal of Human Kinetics volume 25 2010, 85 91 Section III 85 Performance in Team Sports: Identifying the Keys to Success in Soccer by Joaquin Lago Ballesteros 1, Carlos Lago Peñas 1 The aim of this study
Goodyear Safety Research Project 2008 Presentation by Competitive Measure at the FEI Eventing Safety Forum. Presented by Tim Deans and Martin Herbert
 Goodyear Safety Research Project 2008 Presentation by Competitive Measure at the FEI Eventing Safety Forum Presented by Tim Deans and Martin Herbert The presentation discusses the Goodyear Safety Research
DOCKYARD PORT OF PLYMOUTH HARBOUR SAFETY PLAN. Issue 2 Jun 13
 DOCKYARD PORT OF PLYMOUTH HARBOUR SAFETY PLAN 1 CONTENTS Para Page 1. Introduction 3 2. Safety Management System 3 3 Reduce Risks 4 4. Identification of the Hazards and Risks... 4 5. Conformance with the
CHAPTER THREE METHODOLOGY
 CHAPTER THREE METHODOLOGY Subjects A total of twelve, male, students, and studying sport at the University of Wales, Institute Cardiff (UWIC), and members of the university cricket squad participated in
RUGBY is a dynamic, evasive, and highly possessionoriented
 VISUALIZING RUGBY GAME STYLES USING SOMS 1 Visualizing Rugby Game Styles Using Self-Organizing Maps Peter Lamb, Hayden Croft Abstract Rugby coaches and analysts often use notational data describing match
Tennis Victoria Club Guide Coach Relationship
 Tennis Victoria Club Guide Coach Relationship Background Tennis is in a unique position as the sport has a large workforce of qualified & skilled development officers at its disposal the professional tennis
A Guide to SCRUMstudy Certifications and Courses SDC SMC SPOC AEC ESM.
 A Guide to SCRUMstudy Certifications and Courses SDC SMC SPOC AEC ESM www.com Table of Contents Introduction 3 About SCRUMstudy 3 Why should I pursue SCRUMstudy Certification? 3 SCRUMstudy Certifications
A Guide to SCRUMstudy Certifications and Courses SDC SMC SPOC AEC ESM.
 A Guide to SCRUMstudy Certifications and Courses SDC SMC SPOC AEC ESM www.com Table of Contents Introduction 3 About SCRUMstudy 3 Why should I pursue SCRUMstudy Certification? 3 SCRUMstudy Certifications
The effect of court location and available time on the tactical shot selection of elite squash players
 Journal of Sports Science and Medicine (2013) 12, 66-73 http://www.jssm.org Research article The effect of court location and available time on the tactical shot selection of elite squash players Goran
Monitoring beach usage on Gold Coast beaches: Is it beneficial?
 Monitoring beach usage on Gold Coast beaches: Is it beneficial? Peta Williams 1, Gervase Tuxworth 2 and Chris Lane 2 1 Griffith Centre for Coastal Management (GCCM) Gold Coast Campus, Griffith University
EUROPASS SUPPLEMENT TO THE DIPLOMA OF
 EUROPASS SUPPLEMENT TO THE DIPLOMA OF NAME OF THE DIPLOMA Técnico Deportivo en Fútbol (Sports Instructor in Football) ------------------------------------------------------------------------------------------------------------------------------------------------------------------------------------------------------------------------------------
STUDENT EXCHANGE PROGRAMME The Coach and the GK Coach
 STUDENT EXCHANGE PROGRAMME The Coach and the GK Coach What has changed for the GK of today? Rules Pass- back - Average 80% of actions of the GK in a Game is with the ball at his feet 6 seconds Offside
ROUNDABOUT CAPACITY: THE UK EMPIRICAL METHODOLOGY
 ROUNDABOUT CAPACITY: THE UK EMPIRICAL METHODOLOGY 1 Introduction Roundabouts have been used as an effective means of traffic control for many years. This article is intended to outline the substantial
Traffic Parameter Methods for Surrogate Safety Comparative Study of Three Non-Intrusive Sensor Technologies
 Traffic Parameter Methods for Surrogate Safety Comparative Study of Three Non-Intrusive Sensor Technologies CARSP 2015 Collision Prediction and Prevention Approaches Joshua Stipancic 2/32 Acknowledgements
BAYLOR UNIVERSITY PUBLIC INFRACTIONS REPORT APRIL 11, 2012
 BAYLOR UNIVERSITY PUBLIC INFRACTIONS REPORT APRIL 11, 2012 A. INTRODUCTION. This case was resolved through the summary disposition process, a cooperative endeavor in which the Committee on Infractions
Television Match Official Decision Analysis for Super 12 Rugby Union 2002 Season
 Australian Rugby Level III Referee October Activity 1 4 th October 2002 by: Andrew Halmarick Topic: Major Assignment - Television Match Official Decision Analysis for Super 12 Rugby Union 2002 Season Contents
Safety assessments for Aerodromes (Chapter 3 of the PANS-Aerodromes, 1 st ed)
") Safety assessments for Aerodromes (Chapter 3 of the PANS-Aerodromes, 1 st ed) ICAO MID Seminar on Aerodrome Operational Procedures (PANS-Aerodromes) Cairo, November 2017 Avner Shilo, Technical officer
Safety assessments for Aerodromes (Chapter 3 of the PANS-Aerodromes, 1 st ed) ICAO MID Seminar on Aerodrome Operational Procedures (PANS-Aerodromes) Cairo, November 2017 Avner Shilo, Technical officer
The International Coach Federation (ICF) Global Consumer Awareness Study
 Global Consumer Awareness Study") www.pwc.com The International Coach Federation (ICF) Global Consumer Awareness Study Key Results and Main Messages Fort Worth, Texas Presentation Structure 2 Research Overview 3 Research objectives To
www.pwc.com The International Coach Federation (ICF) Global Consumer Awareness Study Key Results and Main Messages Fort Worth, Texas Presentation Structure 2 Research Overview 3 Research objectives To
Evaluating the Influence of R3 Treatments on Fishing License Sales in Pennsylvania
 Evaluating the Influence of R3 Treatments on Fishing License Sales in Pennsylvania Prepared for the: Pennsylvania Fish and Boat Commission Produced by: PO Box 6435 Fernandina Beach, FL 32035 Tel (904)
Diploma of Equitation Science
 10070NAT Diploma of Equitation Science Course Information, Fees & Charges As of: 12/2018 info@esi-education.com 1 10070NAT Diploma of Equitation Science The Diploma of Equitation Science is a nationally
2018/2019. Academy Project
 2018/2019 Academy Project Pedro Monteiro Coach UEFA B 2018/2019 Index Introdution... 2 Mission and Organization... 2 Recruitment for the academy... 2 Groups of Ages Youth Teams... 3 U13 and U14... 3 Main
Distribution competence of a football clubs goalkeepers
 International Journal of Performance Analysis in Sport 2011, 11, 314-324. Distribution competence of a football clubs goalkeepers Marcus Seaton and Jose Campos Faculty of Physical Activity and Sport Sciences,
Position Description. Head Coach NSW Blues. Updated: April 2018
 Position Description Head Coach NSW Blues Updated: April 2018 2 Department: Cricket Performance Reports to: Primary Purpose of the Position Head Coach NSW Blues Position Details Positions Reporting to
Beyond the game: Women s football as a proxy for gender equality
 Beyond the game: Women s football as a proxy for gender equality Morris, Ruth and Morris, Ben. Women s football: Played, Watched, Talked about! FREE Conference University of Copenhagen, June 2013 This
FROM THE ARTICLE: MOMENT OF ORGANIZATION FROM VALENCIA CF (Edition 62, Tactical-Football)
") SYSTEMIC DRILL FROM THE ARTICLE: MOMENT OF ORGANIZATION FROM VALENCIA CF (Edition 62, al-football) Name: Manuel Torres Pericás Physical Education Teacher Bachelor CAFE (Specialty Football) Football manager
SYSTEMIC DRILL FROM THE ARTICLE: MOMENT OF ORGANIZATION FROM VALENCIA CF (Edition 62, al-football) Name: Manuel Torres Pericás Physical Education Teacher Bachelor CAFE (Specialty Football) Football manager
Exploring the relationship between Heart Rate (HR) and Ventilation Rate (R) in humans.
 and Ventilation Rate (R) in humans.") Exploring the relationship between Heart Rate (HR) and Ventilation Rate (R) in humans. The Research Question In this investigation I will be considering the following general research question: Does increased
Exploring the relationship between Heart Rate (HR) and Ventilation Rate (R) in humans. The Research Question In this investigation I will be considering the following general research question: Does increased
University Challenge UEFA Youth League 2015/16. Finals week
 University Challenge UEFA Youth League 2015/16 Finals week Table of Contents 1. THE UEFA YOUTH LEAGUE... 3 2. FINALS WEEK... 4 2.1 2013/14 season... 4 2.2 2014/15 season... 4 2.3 2015/16 season... 5 2.4
The KING S Medium Term Plan Physical Education GIRLS Football Program Module
 The KING S Medium Term Plan Physical Education GIRLS Football Program 2016-17 Module Overarching subject challenge question Lines of Enquiry Week 1: Can you be successful in football with a poor first
MINE SAFETY TARGETED ASSESSMENT PROGRAM. Ground or strata failure NSW metalliferous mines. April
 MINE SAFETY TARGETED ASSESSMENT PROGRAM Ground or strata failure NSW metalliferous mines April 2017 www.resourcesandenergy.nsw.gov.au Document control Publication title: Ground or strata failure NSW metalliferous
THE PLAYING PATTERN OF WORLD S TOP SINGLE BADMINTON PLAYERS
 THE PLAYING PATTERN OF WORLD S TOP SINGLE BADMINTON PLAYERS Yuen-Ming Tong and Youlian Hong Department of Sports Science and Physical Education, The Chinese University of Hong Kong, Hong Kong SAR A total