Project Manager: Neil Beckett. Prepared by: Peter Howe. Reviewed by: Neil Beckett. Approved for issue by:
|
|
|
- Amie Sims
- 5 years ago
- Views:
Transcription


1 Annual Weigh-In-Motion (WiM) Report 2009
2 This report has been prepared for the benefit of the NZ Transport Agency (NZTA). No liability is accepted by this company or any employee or sub-consultant of this company with respect to its use by any other person. This disclaimer shall apply notwithstanding that the report may be made available to other persons for an application for permission or approval or to fulfil a legal requirement. Quality Assurance Statement Project Manager: Neil Beckett Prepared by: Peter Howe Reviewed by: Neil Beckett Approved for issue by: Revision Schedule Rev. No Date Description Prepared by Reviewed by Approved by 1 19/03/2010 First draft Peter Howe Neil Beckett 2 25/03/2010 Final Version Peter Howe Neil Beckett
3 CONTENTS 1.0 DISCLAIMER 2.0 INTRODUCTION 3.0 OTHER DOCUMENTS 4.0 TECHNOLOGY 5.0 DATA QUALITY REQUIREMENTS 6.0 PERMITTED VEHICLES 7.0 EXECUTIVE SUMMARY 8.0 CLASSIFICATION SCHEME 9.0 AVERAGE ANNUAL DAILY TRAFFIC VOLUME BY SITE 10.0 VEHICLE FLEET DISTRIBUTION 11.0 VEHICLE FLEET OVERWEIGHT 12.0 VEHICLE FLEET > 44T 13.0 AXLE GROUP DISTRIBUTION 14.0 APPENDIX A 15.0 APPENDIX B GROSS MASS DISTRIBUTION CHARTS BY WiM SITE 1.0 DISCLAIMERS 1) The traffic data contained in this report is intended to be used as an approximate indication of traffic loading and vehicle weights at WiM sites. The limitations of the equipment and their installation, congestion effects and various analysis procedures contribute to a level of approximation in the data. These factors should be taken into account when using the data. The NZ Transport Agency and its employees or agents involved in preparation of this information cannot accept liability for its contents or for any consequences arising from its use. People using the contents of the report should apply, and rely upon, their own skill and judgement. The contents should not be used in isolation from other sources of advice and information. 2) The legal limits indicated in this report represent the highest legal gross for the axle groups depicted. In certain cases, a lower limit may apply. 3) TNZ Class 9, PAT Type 69, 6 axle artic and the TNZ Class 11, PAT Type 791, 7 axle artic are legally limited to below 44 Tonne Gross, but may be operating on overweight permits at 44 Tonne Gross. Version 2 25/03/2009 Page 1 of 21
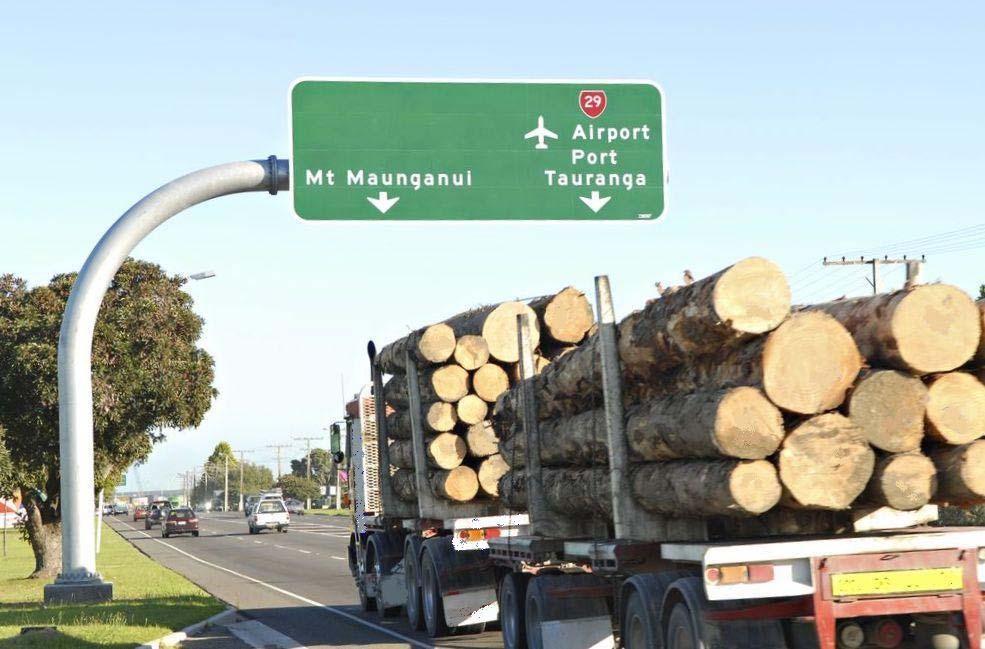
4 2.0 INTRODUCTION There are four Weigh in Motion (WiM) sites in New Zealand collecting axle loading data for use nationally in traffic monitoring. An additional source of WiM data is being developed in Auckland and this project will include the provision of loading data to the national system. The current sites are as follows: Table 1.0: WiM Site Locations Region SH RS Description 02 - Auckland 1N 461 DRURY -Telemetry Site 48 - (WiM Site 1205) 03 - Waikato 1N 625 TOKOROA - Telemetry Site 51 - (WiM Site 421) 03 - Bay of Plenty TE PUKE - Telemetry Site 49 - (WiM Site 24) 11 - Canterbury 1S 284 WAIPARA - Telemetry Site 52 - (WiM Site 518) All data used within this report was collected within the 2009 calendar year and is available to selected users, within the NZTA s State Highway Traffic Monitoring System (TMS). This report is proposed to provide insight into what is available for further, more detailed analysis to be undertaken by TMS users. All listed sites use bending plate technology. 3.0 OTHER DOCUMENTS The documents below will provide useful information relating to Traffic Monitoring practices used on State Highways by the NZ Transport Agency. They can be downloaded from our website. Traffic Monitoring for State Highways Manual SM052 State Highway Traffic Volumes Booklet 4.0 TECHNOLOGY NZTA is using the PAT bending plate technology at a total of four TMS sites and two further sites at the Auckland Harbour Bridge for special studies with a total of 20 lanes. All sites are continuously collecting individual truck records and statistics downloaded weekly, or daily if vehicle by vehicle (VBV) data of all vehicles are recorded. The first system was installed 1985 at Pukurua Bay near Wellington, relocated to Te Puke in the Bay of Plenty in Four of the original six bending plates there are still in operation. Version 2 25/03/2009 Page 2 of 21
5 5.0 DATA QUALITY Readers of this report should take note of the accuracy tolerances required during the collection of data. Accuracy or precision is as defined for high speed weigh in motion in ASTM E 1318 (or latest revision): For 95 of conformity: Gross Vehicle Weight: ± 10 Axle group load: ± 15 With good (new) pavement the above weight errors are reduced by a factor of 1.5 Requisite quality is determined by the final use of data, in simple terms: - Pavement is periodically checked for level and rectified - Calibration is carried out with vehicle of known axle weights and speed. - Data is monitored for errors and deviation. Current use of data: - Average ESA s for pavement design. - Load distributions for bridge design. - Network loading analysis. - Indicators for Police Enforcement. Potential future use of data: - Assessments of revenue from Road User Charges. Other factors affecting data accuracy - Pavement smoothness. Trucks bouncing onto scales will affect accuracy. - Truck Driver Behavior - Strong Winds etc 6.0 PERMITTED VEHICLES Within this report, permitted vehicles were not identified separately. A small proportion of the vehicles identified as being overweight will be operating under a permit. TNZ Class 9, PAT Type 69, 6 axle artic and the TNZ Class 11, PAT Type 791, 7 axle artic are legally limited to below 44 Tonne Gross, but may be operating on overweight permits at 44 Tonne Gross. Version 2 25/03/2009 Page 3 of 21
6 7.0 EXECUTIVE SUMMARY All heavy vehicles are referred to as vehicles in this report. Table 2.0: Vehicle Frequency by group type Group Type Vehicles Vehicles Overweight Vehicles (Group Type) Overweight Vehicles (Group Type) Rigid 1,078, ,657 3 T&T 989, , Artic 372, , A&B Train 250, , ,690, ,637 9 Vehicle Fleet PAT class 891, 21 and 31 as shown in table 6.0 represent the largest heavy vehicle frequencies reported (combined they account for approximately 50 of the heavy vehicle fleet). There has been a 3.1 increase in total vehicle frequencies from 2008 to Vehicle Fleet Overweight PAT class 891, 751 and 851 (see figure 1.0, table 7.0) represent the largest frequencies of heavy vehicles recorded as overweight (combined approximately 65 of the total heavy vehicles recorded as overweight). PAT class 891 is reporting a long term increasing trend of vehicles being recorded as overweight from 2001 to 2009 (see chart 4.0). Figure 1.0: PAT type 21, 31, 891, 751 and 851 PAT type 21: PAT type 31: PAT type 891: PAT type 751: PAT type 851: Version 2 25/03/2009 Page 4 of 21
7 Vehicle Fleet > 44T PAT class 891, 751 and 851 (see table 8.0) represent the largest frequencies of heavy vehicles recorded at > 44T (combined they account for approximately 84 of the total heavy vehicles recorded at > 44T). Time of Day Table 3.0 indicates the times overweight vehicle frequencies peak at each WiM site during an average day: Table 3.0: Overweight Peak distribution times by WiM Site WiM Site Peak 1 Peak 2 Drury 06:00 06:59 13:00 13:59 Tokoroa 09: :00 13:59 Te Puke 08:00 08:59 14:00 14:59 Waipara 07:00 07:59 13:00 13:59 The peaks may represent long-hauls reported across two or more WiM Sites, the smaller peaks may represent local distribution (see section 10, Charts ). Version 2 25/03/2009 Page 5 of 21
8 8.0 CLASSIFICATION SCHEME Table 4.0: Heavy vehicle classification scheme PEM Class TNZ Class PAT Class Vehicle Type Axles Length Range (WiM data) RUC Class Group Axle Group (Pave. Des.) MCV 3 20 o-o RIGID 2 4m-11m 2 21 o--o RIGID 1s-1d 4 31 o--oo 6 RIGID 1s-2 3 7m-12m 34 oo--o 5 RIGID 1s-1s-1d 5 30 o-o--o 3 6m-15m 2,24 T&T 1s-1d-1d 45 oo--oo 4 14 RIGID 1s-1s o--ooo (truck) 8m-11m HCV1 14 RIGID 1s-3 40 o--o-o--o 2,30 T&T 1s-1d-1d-1d 7 44 oo-o--o 4 5,24 T&T 1s-1s-1d-1d 11m-19m 41 o-o--oo (T&T) 2,29 T&T 1s-1d-2 42 o-oo--o 6,24 T&T 1s-2-1d 8 52 o--oo-o--o 6,30 T&T 1s-2-1d-1d 5 11m-19m 53 o-oo--oo 6,29 ARTIC 1s o-oo--ooo 6,33 ARTIC 1s m-18m 68 oo-oo--oo 14,29 T&T 1s-1s o--oo-o--oo 6,37 T&T 1s-2-1d-2 66 oo--oo-o--o 6 14,30 T&T 1s-1s-2-1d-1d (T&T) 65 oo--o-o--oo 16m-20m 5,37 T&T 1s-1s-1d-1d-2 (A- 61 o-o--o-o--oo Train) 6,29,30 T&T 1s-2-1d-1d-1d 621 o-oo--o-o--o? 751 o-oo--oo--oo 6,29 T&T 1s o-oo--oo-o--o 6,29,30 A TRAIN 1s-2-2-1d-1d 78 o--ooo-o--oo? HCV o-oo--o-o--oo 7 18m-21m? 747 o--ooo---ooo 14,33 ARTIC 1s o-oo-oooo 6,43 ARTIC 1s oo-oo--ooo? ARTIC 77 oo--oo-o--oo 14,37 T&T 1s-1s-2-1d oo--oo-oo--oo 14,43 T&T 1s-1s oo-oo--ooo-oo 14 T&T 1s-1s oo-oo--oooo m-21m 14,43 ARTIC 1s-1s oo-oo--oo-ooo 14,33,29 T&T 1s-1s oo-oo-ooo-ooo 14,33,33 B TRAIN 1s-1s oo-oo-ooo-oooo 14,33,43 B TRAIN 1s-1s o-oo--ooo--oo 6,33,29 B TRAIN 1s o-oo-ooo-ooo 6,33,33 B TRAIN 1s o-oo-ooo-oooo? B TRAIN 1s m-21m 85 o-oo--oo-o--oo? 89 o-oo--ooo-o--o? 847 o--ooo---oooo 14,43 ARTIC 1s Not Classified Version 2 25/03/2009 Page 6 of 21
9 9.0 ANNUAL AVERAGE DAILY TRAFFIC BY SITE AADT AADT provides an estimation of the number of vehicles crossing a site on an average day. Heavy The Heavy column provides an estimate of the proportion of the AADT, which is deemed a heavy vehicle: i.e. greater than 3.5 tonnes for the current year. Table 5.0: Annual average daily traffic by WiM site WiM Site SH AADT (2009) Number of Heavies per Day Heavy Drury Telemetry Site 48 1N 41,259 4, Tokoroa Telemetry Site 51 1N 8,504 1, Te Puke Telemetry Site ,273 1, Waipara Telemetry Site 52 1S 7,431 1, (Source: State Highway Traffic Data Booklet , to be published May 2010) Version 2 25/03/2009 Page 7 of 21
10 10.0 VEHICLE FLEET DISTRIBUTION PAT Class This is the code relating to the axle configuration. Description This illustrates the PAT type by providing an indication of the spacing between axles. Volume This indicates the number of heavy vehicles for each PAT class. Table 6.0: Distribution by PAT class Drury Tokoroa Te Puke Waipara Group PEM PAT Class Class Description Volume Volume Volume Volume MCV 20 o-o (wb m, gw >= 2.5t) o--o (wb >3.2m, gw >= 2.5t) o--oo Rigid 34 oo--o HCV1 45 oo--oo o--ooo o-o--o o--o-o--o o-o--oo o-oo--o oo-o--o o--oo-o--o T&T o-oo--oo T&T o-o--o-o--oo T & T o--oo-o--oo T & T oo--o-o--oo T & T T&T HCV2 66 oo--oo-o--o T & T oo-oo--oo T & T oo--oo-o--oo o--ooo-o--oo o-oo--oo-o--oo o-oo--ooo-o--o o-oo--o-o--o o-oo--o-o--oo o-oo--oo--oo T&T oo--oo-oo--oo T&T oo-oo--ooo-oo T&T oo-oo--oo-ooo T&T o-oo--ooo oo-oo--ooo Tri Artic Artic HCV2 747 o--ooo---ooo Tri Artic o-oo-oooo Quad Artic oo-oo--oooo Quad Artic o--ooo---oooo Quad Artic o-oo--oo-o--o A Train o-oo--ooo--oo B Train A&B 951 o-oo-ooo-ooo B Train HCV2 Train 1020 oo-oo-ooo-ooo B Train o-oo-ooo-oooo B Train oo-oo-ooo-oooo B Train Interpretation: At the Tokoroa WiM site, 6.61 of all heavy vehicles were PAT type 45. Note: 2009 reported PAT class 891, 21 and 31 (respectively) as having the largest portion of heavy vehicles across all four WiM sites. Version 2 25/03/2009 Page 8 of 21
11 10.0 VEHICLE FLEET DISTRIBUTION (Continued) Chart 1.0: Heavy vehicle load frequency distribution by PAT class. 120,000 Load Frequency Distribution 2009 by WiM Site Drury Tokoroa Te Puke Waipara 100,000 Current Max legal load, 44T 80,000 Frequency 60,000 40,000 20,000 0 < >60 Tonnes Interpretation: Three heavy vehicle load distribution peaks are reported in 2009, the peaks occur approximately at 3-5, and tonnes. Version 2 25/03/2009 Page 9 of 21
12 10.0 VEHICLE FLEET DISTRIBUTION (Continued) Chart 2.0: Growth in vehicle load frequencies by PAT type ( ) at all WiM sites Trend Analysis All Sites - Heavy Vehicle Load Frequnecy by PAT type ( ) Growth (Normalised, 2001) Year Interpretation: PAT class 891, 21 have experienced fairly consistent growth (largest frequencies across the four WiM sites). PAT class 31 has reported small long term growth and yet still represents significant volumes of the heavy vehicles in the fleet. Version 2 25/03/2009 Page 10 of 21
13 11.0 VEHCILE FLEET OVERWEIGHT PAT Type This is the code relating to the axle configuration Description This illustrates the PAT type by providing an indication of the spacing between axles. Overweight This indicates the number of heavy vehicles overweight for each PAT type. Percentage This indicates the of the total vehicles recorded as being overweight for each PAT type. Table 7.0: of total heavy vehicles overweight by WiM site Group PEM Class Rigid T&T Artic MCV HCV1 HCV2 HCV2 A&B Train HCV2 Drury Tokoroa Te Puke Waipara PAT Class Description Volume Volume Volume Volume 20 o-o (wb m, gw >= 2.5t) o--o (wb >3.2m, gw >= 2.5t) o--oo oo--o oo--oo o--ooo o-o--o o--o-o--o o-o--oo o-oo--o oo-o--o o--oo-o--o T&T o-oo--oo T&T o-o--o-o--oo T & T o--oo-o--oo T & T oo--o-o--oo T & T oo--oo-o--o T & T oo-oo--oo T & T oo--oo-o--oo o--ooo-o--oo o-oo--oo-o--oo o-oo--ooo-o--o o-oo--o-o--o o-oo--o-o--oo o-oo--oo--oo T&T oo--oo-oo--oo T&T oo-oo--ooo-oo T&T oo-oo--oo-ooo T&T o-oo--ooo oo-oo--ooo Tri Artic o--ooo---ooo Tri Artic o-oo-oooo Quad Artic oo-oo--oooo Quad Artic o--ooo---oooo Quad Artic o-oo--oo-o--o A Train o-oo--ooo--oo B Train o-oo-ooo-ooo B Train oo-oo-ooo-ooo B Train o-oo-ooo-oooo B Train oo-oo-ooo-oooo B Train Interpretation: 29 of all overweight vehicles crossing Drury WiM Site were of PAT class 891. Note: 2008 reported PAT class 891, 751 and 851 as having the largest portions of vehicles recorded as overweight. Version 2 25/03/2009 Page 11 of 21
14 11.0 VEHICLE FLEET OVERWEIGHT (Continued) The following charts depict the time distribution of the vehicle fleet that are deemed as overweight at each site. Chart 3.0: Drury Chart 3.1: Tokoroa Drury - Overweight Time Distribution 2009 Tokoroa - Overweight Time Distribution ,000 2,500 7,000 6,000 2,000 5,000 4,000 3,000 1,500 1,000 2,000 1, :00 to 00:59 01:00 to 01:59 02:00 to 02:59 03:00 to 03:59 04:00 to 04:59 05:00 to 05:59 06:00 to 06:59 07:00 to 07:59 08:00 to 08:59 09:00 to 09:59 10:00 to 10:59 11:00 to 11:59 12:00 to 12:59 13:00 to 13:59 14:00 to 14:59 15:00 to 15:59 16:00 to 16:59 17:00 to 17:59 18:00 to 18:59 19:00 to 19:59 20:00 to 20:59 21:00 to 21:59 22:00 to 22:59 23:00 to 23:59 00:00 to 00:59 01:00 to 01:59 02:00 to 02:59 03:00 to 03:59 04:00 to 04:59 05:00 to 05:59 06:00 to 06:59 07:00 to 07:59 08:00 to 08:59 09:00 to 09:59 10:00 to 10:59 11:00 to 11:59 12:00 to 12:59 13:00 to 13:59 14:00 to 14:59 15:00 to 15:59 16:00 to 16:59 17:00 to 17:59 18:00 to 18:59 19:00 to 19:59 20:00 to 20:59 21:00 to 21:59 22:00 to 22:59 23:00 to 23:59 No of Vehicles No of Vehicles Time of Day Time of Day Chart 3.2: Te Puke Chart 3.3: Waipara Te Puke - Overweight Time Distribution 2009 Waipara - Overweight Time Distribution ,000 4,000 5,000 3,500 3,000 4,000 3,000 2,000 2,500 2,000 1,500 1, :00 to 00:59 01:00 to 01:59 02:00 to 02:59 03:00 to 03:59 04:00 to 04:59 05:00 to 05:59 06:00 to 06:59 07:00 to 07:59 08:00 to 08:59 09:00 to 09:59 10:00 to 10:59 11:00 to 11:59 12:00 to 12:59 13:00 to 13:59 14:00 to 14:59 15:00 to 15:59 16:00 to 16:59 17:00 to 17:59 18:00 to 18:59 19:00 to 19:59 20:00 to 20:59 21:00 to 21:59 22:00 to 22:59 23:00 to 23:59 00:00 to 00:59 01:00 to 01:59 02:00 to 02:59 03:00 to 03:59 04:00 to 04:59 05:00 to 05:59 06:00 to 06:59 07:00 to 07:59 08:00 to 08:59 09:00 to 09:59 10:00 to 10:59 11:00 to 11:59 12:00 to 12:59 13:00 to 13:59 14:00 to 14:59 15:00 to 15:59 16:00 to 16:59 17:00 to 17:59 18:00 to 18:59 19:00 to 19:59 20:00 to 20:59 21:00 to 21:59 22:00 to 22:59 23:00 to 23:59 No of Vehicles No of Vehicles 1, Time of Day Time of Day Interpretation: Drury WiM site reported two peaks in frequency/time distribution of overweight vehicles. The peaks occur at approximately between 06:00-06:59 and between 13:00-13:59. The peak at Tokoroa may exist as a result of a long-haul from the peak in Drury. Version 2 25/03/2009 Page 12 of 21
15 11.0 VEHICLE FLEET OVERWEIGHT (Continued) Chart 4.0: Growth in vehicles recorded as overweight ( ) by PAT type at all WiM sites All Sites - Overweight Frequency by PAT type ( ) Growth (Normalised, 2001) Tonnes Interpretation: PAT class 891 continues to report an increasing overweight frequency trend, whereas both PAT class 751 and 851 report an overweight frequency that that indicates a possible decreasing trend. Note: 2008 values were omitted from the trend line calculations. Version 2 25/03/2009 Page 13 of 21
16 11.0 VEHICLE FLEET OVERWEIGHT (Continued) Chart 5.0: Vehicle load frequency vs. overweight frequency ( ) Pat type 891 at all sites All Sites - Load Frequency vs. Load Frequency Overweight by PAT type Overweight Growth (Normalised, 2001) Year Interpretation: There exists a possible correlation between the frequency of heavy vehicles and the frequency of heavy vehicles overweight. The two plots both indicate a long term increasing trend from See Appendix A for PAT type 751 and 891, note: PAT type 891, 751 and 851 were reported as the most frequent overweight. Note: 2008 overweight values were omitted from the trend line calculations. Version 2 25/03/2009 Page 14 of 21
17 12.0 VEHICLE FLEET > 44T PAT Type This is the code relating to the axle configuration. Description This illustrates the number of axles and an indication of the spacing between axles. Percentage This indicates the of the total heavy vehicles recorded as exceeding 44T for each PAT type. Table 8.0: of heavy vehicles > 44T by WiM site Drury Tokoroa Te Puke Waipara Group PEM PAT Class Class Description Volume Volume Volume Volume MCV 20 o-o (wb m, gw >= 2.5t) o--o (wb >3.2m, gw >= 2.5t) o--oo Rigid 34 oo--o HCV1 45 oo--oo o--ooo o-o--o o--o-o--o o-o--oo o-oo--o oo-o--o o--oo-o--o T&T o-oo--oo T&T o-o--o-o--oo T & T o--oo-o--oo T & T oo--o-o--oo T & T T&T HCV2 66 oo--oo-o--o T & T oo-oo--oo T & T oo--oo-o--oo o--ooo-o--oo o-oo--oo-o--oo o-oo--ooo-o--o o-oo--o-o--o o-oo--o-o--oo o-oo--oo--oo T&T oo--oo-oo--oo T&T oo-oo--ooo-oo T&T oo-oo--oo-ooo T&T o-oo--ooo oo-oo--ooo Tri Artic Artic HCV2 747 o--ooo---ooo Tri Artic o-oo-oooo Quad Artic oo-oo--oooo Quad Artic o--ooo---oooo Quad Artic o-oo--oo-o--o A Train o-oo--ooo--oo B Train A&B 951 o-oo-ooo-ooo B Train Train HCV oo-oo-ooo-ooo B Train o-oo-ooo-oooo B Train oo-oo-ooo-oooo B Train Interpretation: At Tokoroa WiM site, PAT class 851 reported 2,671 heavily vehicles > 44T. Version 2 25/03/2009 Page 15 of 21
18 13.0 AXLE GROUP DISTRIBUTIONS Load (kn) This is the load imposed by each axle type. Axle Groups SAST Single Axle Single Tyre SADT - Single Axle Dual Tyre TADT Tandem Axle Dual Tyre TSST Twin Steer Single Tyre TRDT Triple Axle Dual Tyre QADT - Quad Axle Dual Tyre It is important to note that the weigh-in-motion (WiM) data from which the following table is derived, cannot distinguish between single and dual tyres. It is assumed that steer axles are single tyred and all others are dual tyred. From observation, there is an increase in the utilisation of super single type tyres in the SADT, TADT, TAST and TRDT groups, however, the impact or significance can not be measured or derived from this technology. Despite the QADT description, of Quad Axles are single tyred. The highlighted sections indicate the peaks in load per axle group. Table 9.0: Site: 01N00463 (Drury) Load (kn) SAST SADT TADT TSST TRDT QADT Version 2 25/03/2009 Page 16 of 21
19 13.0 AXLE GROUP DISTRIBUTIONS (Continued) Table 9.1: Site: 01N00628 (Tokoroa) Load (kn) SAST SADT TADT TSST TRDT QADT Version 2 25/03/2009 Page 17 of 21
20 13.0 AXLE GROUP DISTRIBUTIONS (Continued) Table 9.2: Site: (Te Puke) Load (kn) SAST SADT TADT TSST TRDT QADT Version 2 25/03/2009 Page 18 of 21
21 13.0 AXLE GROUP DISTRIBUTIONS (Continued) Table 9.3: Site: 01S00285 (Waipara) Load (kn) SAST SADT TADT TSST TRDT QADT Version 2 25/03/2009 Page 19 of 21
22 14.0 APPENDIX A Chart 6.0: Vehicle load frequency vs. overweight frequency ( ) Pat type 751 at all sites All Sites - Load Frequency vs. Load Frequency Overweight by PAT type Overweight 1.6 Growth (Normalised, 2001) Year Chart 6.1: Vehicle load frequency vs. overweight frequency ( ) Pat type 851 at all sites All Sites - Load Frequency vs. Load Frequency Overweight by PAT type Overweight 1.4 Growth (Normalised, 2001) Year Version 2 25/03/2009 Page 20 of 21
23 Version 2 25/03/2009 Page 21 of 21
WIM #36 MN 36 MP 15.0 LAKE ELMO APRIL 2014 MONTHLY REPORT
 WIM #36 MN 36 MP 15.0 LAKE ELMO APRIL 2014 MONTHLY REPORT In order to understand the vehicle classes and groupings, the MnDOT Vehicle Classification Scheme and the Vehicle Class Groupings for Forecasting
WIM #37 I-94, MP OTSEGO, MN APRIL 2012 MONTHLY REPORT
 WIM #37 I-94, MP 200.1 OTSEGO, MN APRIL 2012 MONTHLY REPORT In order to understand the vehicle classes and groupings the Mn/DOT Vehicle Classification Scheme and the Vehicle Classification Groupings for
PUBLISHED PROJECT REPORT PPR850. Optimisation of water flow depth for SCRIM. S Brittain, P Sanders and H Viner
 PUBLISHED PROJECT REPORT PPR850 Optimisation of water flow depth for SCRIM S Brittain, P Sanders and H Viner Report details Report prepared for: Project/customer reference: Copyright: Highways England,
The Use of BS 5400: Part 10: Code of Practice for Fatigue
 THE HIGHWAYS AGENCY THE SCOTTISH OFFICE DEVELOPMENT DEPARTMENT Amendment No. 1, dated November 1983 THE WELSH OFFICE Y SWYDDFA GYMREIG THE DEPARTMENT OF THE ENVIRONMENT FOR NORTHERN IRELAND The Use of
Overhead Pedestrian Crossings Economic Evaluation through Vehicle Operating Cost and Travel Time Savings
 OUSL Journal (2014) Vol 7, (pp77-94) Overhead Pedestrian Crossings Economic Evaluation through Vehicle Operating Cost and Travel Time Savings K. M. G. N. S. Kumara, V. K. M. Pinnagoda and K. S. Weerasekera
Traffic Impact Study. Westlake Elementary School Westlake, Ohio. TMS Engineers, Inc. June 5, 2017
 TMS Engineers, Inc. Traffic Impact Study Westlake Elementary School Westlake, Ohio June 5, 2017 Prepared for: Westlake City Schools - Board of Education 27200 Hilliard Boulevard Westlake, OH 44145 TRAFFIC
Loughborough University Travel Planning
 Document Ti tle Client Name Loughborough University Travel Planning Loughborough University Travel Plan Executive Summary 2015-2020 23 December 2015 Loughborough University Travel Planning Project no:
DYNAMIC LANES FOR AUCKLAND
 Dynamic Lanes for Auckland MENEZES M. and INMAN R. Page 1 DYNAMIC LANES FOR AUCKLAND Authors: INMAN, Robert BA (Hons) Previously Auckland Transport Senior Traffic Engineer Now Aurecon Robert.Inman@aurecongroup.com
Road Safety Trends, Targets and Safety Programs in New Zealand. by Dr Shane Turner
 Road Safety Trends, Targets and Safety Programs in New Zealand by Dr Shane Turner New Zealand Kiwi s vs Aussies Outline Land transport organisations NZ & US crash/accident trends NZ safety targets & priorities
Regional Cycle Programme Update
 Agenda Item 10 (ii) Regional Cycle Programme Update Glossary Auckland Council Auckland Transport Cycle Action Auckland New Zealand Transport Agency Regional Cycle Network (AC) (AT) (CAA) (NZTA) (RCN) Executive
SH3 Waitara to Bell Block
 SH3 Waitara to Bell Block NZ Transport Agency August 2017 Community feedback report Copyright information This publication is copyright NZ Transport Agency. Material in it may be reproduced for personal
INTERIM ADVICE NOTE 150/12. Guidance for Alternative Temporary Traffic Management Techniques for Relaxation Schemes on Dual Carriageways.
 INTERIM ADVICE NOTE 150/12 Guidance for Alternative Temporary Traffic Management Techniques for Relaxation Schemes on Dual Carriageways Summary Guidance for temporary traffic management (TTM), on the approach
road safety issues 2002 road trauma for TNZ Region Two July 2003 Road deaths Estimated social cost of crashes* Major road safety issues
 road safety issues July 23 22 road trauma for TNZ Region Two The Land Transport Safety Authority (LTSA) has prepared this road safety issues report. It is based on reported crash data and trends for the
INTERIM ADVICE NOTE 188/16
 INTERIM ADVICE NOTE 188/16 Guidance on Omission of Warning Lights (Road Danger Lamps) for Relaxation Works on Dual Carriageways Summary Guidance for omission of warning lights (road danger lamps) in temporary
Stena Line Ports Ltd. Port Marine Safety Code Annual Performance Review: 2016
 Stena Line Ports Ltd Port Marine Safety Code Annual Performance Review: 2016 Introduction Stena Line is an international transport and travel service company with Europe's most comprehensive route network.
1.3.4 CHARACTERISTICS OF CLASSIFICATIONS
 Geometric Design Guide for Canadian Roads 1.3.4 CHARACTERISTICS OF CLASSIFICATIONS The principal characteristics of each of the six groups of road classifications are described by the following figure
THE IMPACT OF ADAPTIVE ROAD LIGHTING ON ROAD SAFETY
 The impact of adaptive road lighting on road safety Frith and Jackett Page 1 THE IMPACT OF ADAPTIVE ROAD LIGHTING ON ROAD SAFETY William Frith 1 M Sc (Hons), M. Sc (Transport Engineering), BA, FCILT, AFACRS,
Memorandum INTRODUCTION METHODOLOGY. Smart Growth. Bruce Robinson, Transport Advisor, Infrastructure Planning
 Memorandum To: Smart Growth From: Bruce Robinson, Transport Advisor, Infrastructure Planning Subject: Te Tumu Transportation Assessment: Stage 1 Sensitivity Analysis Date: 1 June 2016 INTRODUCTION This
IGEM/TD/2 Edition 2 with amendments July 2015 Communication 1779 Assessing the risks from high pressure Natural Gas pipelines
 Communication 1779 Assessing the risks from high pressure Natural Gas pipelines Founded 1863 Royal Charter 1929 Patron: Her Majesty the Queen Communication 1779 Assessing the risks from high pressure Natural
FINAL DESIGN TRAFFIC TECHNICAL MEMORANDUM
 FINAL DESIGN TRAFFIC TECHNICAL MEMORANDUM July 2014 FINAL (SR 43) Project Development and Environment Study From State Road 60 (Adamo Drive) to I-4 (SR 400) Hillsborough County, Florida Work Program Item
1. THE IMPACT OF HEAVY VEHICLE TRAFFIC ON ROAD PAVEMENTS
 1. THE IMPACT OF HEAVY VEHICLE TRAFFIC ON ROAD PAVEMENTS 1.1 Background The road network in NZ compromises approximately 95,100 km of roads. About 12.5 % or 11,900 km of these roads are State Highways
DESIGN BULLETIN #66/2010
 DESIGN BULLETIN #66/2010 Highway Geometric Design Guide Chapter B, Climbing Lane Warrants for Two Lane Undivided and Four Lane Divided Highways - Revised Summary This Design Bulletin is being issued as
APPENDIX F: TECHNICAL NOTE 22 (VICARAGE ROAD JUNCTION)
") APPENDIX F: TECHNICAL NOTE 22 (VICARAGE ROAD JUNCTION) West Midlands Interchange Transport Assessment DCO Submission WEST MIDLANDS INTERCHANGE SUBJECT: Technical Note 22 Review of Vicarage Road Junction
APPENDIX F: TECHNICAL NOTE 22 (VICARAGE ROAD JUNCTION) West Midlands Interchange Transport Assessment DCO Submission WEST MIDLANDS INTERCHANGE SUBJECT: Technical Note 22 Review of Vicarage Road Junction
CITY OF WEST KELOWNA COUNCIL POLICY MANUAL
 CITY OF WEST KELOWNA COUNCIL POLICY MANUAL Page 1 of 7 DEPARTMENT: Engineering Services SUBJECT: Traffic Calming Policy (Revised June 6, 2017) Policy Statement: The provision of traffic calming measures
Background to the UK National Annexes to
 Background to the UK National Annexes to EN1990: Basis of Structural Design - Annex A2 : Application for Bridges EN1991-2: Traffic Loads on Bridges Report prepared by Atkins Highways and Transportation
Traffic Impact Analysis Walton Acres at Riverwood Athletic Club Clayton, NC
 Traffic Impact Analysis Walton Acres at Riverwood Athletic Club Clayton, NC 1. TABLE OF CONTENTS INTRODUCTION...1 1.1. Site Location and Study Area...1 1.2. Proposed Land Use and Site Access...2 1.3.
AS/NZS :2017. Retroreflective materials and devices for road traffic control purposes AS/NZS :2017. Part 1: Retroreflective sheeting
 AS/NZS 1906.1:2017 Australian/New Zealand Standard Retroreflective materials and devices for road traffic control purposes Part 1: Retroreflective sheeting Superseding AS/NZS 1906.1:2007 AS/NZS 1906.1:2017
AS91430: Cycleways Waiopehu College Year 13 Geography Matt Reeves
 AS91430: Cycleways Waiopehu College Year 13 Geography Matt Reeves December 2017 AS91430: Cycleways Cycling is an activity that a large proportion of our national population decides to enjoy and participate
Speed Data Analysis. Monk Fryston Parish Council. Traffic Speed data Statistical Analysis 30th. November 2017 to 6th December 2017.
 Traffic Speed data Statistical Analysis 30th November 2017 to 6th December 2017 and 14th December 2017 to 21st December 2017 Monk Fryston Parish Council December 2017 Speed Data Analysis Monk Fryston Parish
An Application of Signal Detection Theory for Understanding Driver Behavior at Highway-Rail Grade Crossings
 An Application of Signal Detection Theory for Understanding Driver Behavior at Highway-Rail Grade Crossings Michelle Yeh and Jordan Multer United States Department of Transportation Volpe National Transportation
DRAFT INTERIM ADVICE NOTE 150/17
 DRAFT INTERIM ADVICE NOTE 150/17 Guidance on Alternative Temporary Traffic Management Techniques for Relaxation Works on Dual Carriageways Summary Guidance for temporary traffic management (TTM), on the
CITY OF ALPHARETTA DOWNTOWN MASTER PLAN TRAFFIC EVALUATION
 CITY OF ALPHARETTA DOWNTOWN MASTER PLAN TRAFFIC EVALUATION June 2015 CITY OF ALPHARETTA DOWNTOWN MASTER PLAN TRAFFIC EVALUATION Introduction The Alpharetta Downtown Master Plan was developed in the fall
TRANSPORTATION ANALYSIS REPORT US Route 6 Huron, Erie County, Ohio
 TRANSPORTATION ANALYSIS REPORT US Route 6 Huron, Erie County, Ohio December 12, 2012 Prepared for: The City of Huron 417 Main Huron, OH 44839 Providing Practical Experience Technical Excellence and Client
Sketch Level Assessment. of Traffic Issues. for the Fluor Daniel I-495 HOT Lane Proposal. Ronald F. Kirby
 Sketch Level Assessment of Traffic Issues for the Fluor Daniel I-495 HOT Lane Proposal Ronald F. Kirby Director of Transportation Planning National Capital Region Transportation Planning Board (TPB) Metropolitan
Highway 111 Corridor Study
 Highway 111 Corridor Study June, 2009 LINCOLN CO. HWY 111 CORRIDOR STUDY Draft Study Tea, South Dakota Prepared for City of Tea Sioux Falls Metropolitan Planning Organization Prepared by HDR Engineering,
2002 Virginia Department of Transportation Daily Traffic Volume Estimates. Special Locality Report 209
 2002 Daily Traffic Volume Estimates Special Locality Report 209 Prepared By Mobility Management Division In Cooperation With U.S. Department of Transportation Federal Highway Administration Mobility Management
Tulsa Metropolitan Area LONG RANGE TRANSPORTATION PLAN
 Tulsa Metropolitan Area LONG RANGE TRANSPORTATION PLAN Indian Nations Council of Governments August 2005 CONTACTING INCOG In developing the Destination 2030 Long Range Transportation Plan, INCOG s Transportation
briefing notes - road safety issues
 briefing notes road safety Waikato District briefing notes - road safety issues Waikato District New Zealand Transport Agency has prepared this eleventh road safety issues report. It is based on reported
2002 Virginia Department of Transportation Daily Traffic Volume Estimates Including Vehicle Classification Estimates. Special Locality Report 261
 2002 Daily Traffic Volume Estimates Including Vehicle Classification Estimates where available Special Locality Report 261 Prepared By In Cooperation With U.S. Department of Transportation Federal Highway
land transport road assets
 land transport road assets land transport road assets Otago Region Information as at June 2007 land transport road assets 2 Purpose of this publication Land Transport New Zealand annually publishes comparative
Organization for Traffic Control on County Highways
 Organization for Traffic Control on County Highways G eorge L. Reyman Assistant District Traffic Engineer, Indiana State Highway Commission Seymour The need for the establishment of a traffic control operation
PREDICTING TEXTURE DEFICIENCY IN PAVEMENT MANAGEMENT PREDICTING TEXTURE DEFICIENCY IN PAVEMENT MANAGEMENT
 PREDICTING TEXTURE DEFICIENCY IN PAVEMENT MANAGEMENT Sean Rainsford Chris Parkman MWH NZ Ltd Transit New Zealand PREDICTING TEXTURE DEFICIENCY IN PAVEMENT MANAGEMENT Inadequate texture is one of the key
Highway & Transportation (I) ECIV 4333 Chapter (4): Traffic Engineering Studies. Spot Speed
 ECIV 4333 Chapter (4): Traffic Engineering Studies. Spot Speed") Introduction Spot Speed Speed is an important measure of the quality of travel and safety of road network. Speed by definition is the rate of movement of vehicle in distance per unit time. A typical unit
Introduction Spot Speed Speed is an important measure of the quality of travel and safety of road network. Speed by definition is the rate of movement of vehicle in distance per unit time. A typical unit
Rural Highway Overtaking Lanes
 Rural Highway Overtaking Lanes Kah Wai Ng School of Civil and Resource Engineering, University of Western Australia Song Wang School of Mathematics and Statistics, University of Western Australia Doina
Truck Climbing Lane Traffic Justification Report
 ROUTE 7 (HARRY BYRD HIGHWAY) WESTBOUND FROM WEST MARKET STREET TO ROUTE 9 (CHARLES TOWN PIKE) Truck Climbing Lane Traffic Justification Report Project No. 6007-053-133, P 101 Ι UPC No. 58599 Prepared by:
AMETI PANMURE: A SUSTAINABLE TRANSPORT SOLUTION - OR NOT? Phil Harrison, Opus International Consultants
 IPWEA Conference: 7 June 11 June 2015 Abstract AMETI PANMURE: A SUSTAINABLE TRANSPORT SOLUTION - OR NOT? Phil Harrison, Opus International Consultants The AMETI project is a package of multi-modal transport
TRAFFIC IN THE CITY Strategic Transportation Department of the Built Environment
 TRAFFIC IN THE CITY 218 Strategic Transportation Department of the Built Environment February 218 Contents 1. Introduction Page 2 2. Traffic Composition Survey Trend Data Page 6 3. Traffic Composition
Update June 2018 OUR 2017 PUBLIC ENGAGEMENT
 Update June 2018 Hi, Let s Get Wellington Moving (LGWM) is developing a Recommended Programme of Investment (RPI) that meets our programme objectives and supports the city s and region s growth. As part
Transportation and Public Works Annual Motor Vehicle Collision Report
 Transportation and Public Works 22 Annual Motor Vehicle Collision Report Table of Contents Table of Contents.. 2 Introduction.. 3 22 Collision Summary. 4 Demographics 5 Collisions by Severity.. 5 Personal
2010 Virginia Department of Transportation Daily Traffic Volume Estimates Including Vehicle Classification Estimates. Special Locality Report 172
 2010 Daily Traffic Volume Estimates Including Vehicle Classification Estimates where available Special Locality Report 172 Town of Boyce Information in this report is included in Report (Clarke County)
Health and Safety Inspection Procedure
 Template v4 WILTSHIRE POLICE FORCE PROCEDURE Health and Safety Inspection Procedure Effective from: 25.03.2012 Last Review Date: 10.05.2015 Version: 2.0 Next Review Date: 10.05.2018 TABLE OF CONTENTS PROCEDURE
2005 Virginia Department of Transportation Daily Traffic Volume Estimates Including Vehicle Classification Estimates. Special Locality Report 324
 2005 Virginia Department of Transportation Daily Traffic Volume Estimates Including Vehicle Classification Estimates where available Special Locality Report 324 Prepared By Virginia Department of Transportation
TECHNICAL NOTE THROUGH KERBSIDE LANE UTILISATION AT SIGNALISED INTERSECTIONS
 TECHNICAL NOTE THROUGH KERBSIDE LANE UTILISATION AT SIGNALISED INTERSECTIONS Authors: Randhir Karma NDip: Eng (Civil) B. Tech Eng (Civil) M Eng (Hons) (Transportation) Auckland Traffic Service Group Manager
2014 STATE OF THE SYSTEM REPORT
 2014 STATE OF THE SYSTEM REPORT March 2016 This page intentionally left blank System Performance Monitoring This page intentionally left blank System Performance Monitoring State of the System Performance
Speed Limit Policy Isle of Wight Council
 APPENDIX B Speed Limit Policy Isle of Wight Council 2009 Contents Section 1 Introduction 1.1 Links with the Local Transport Plan Section 2 Speed Limits on Urban Roads and Residential Areas 2.1 20mph Limits
POLICY: TRAFFIC CALMING
 2006 MAY REFERENCE: COUNCIL APPROVED BY COUNCIL MAY 23, 2006 CITY OPERATIONS - NO. 608 POLICY: TRAFFIC CALMING A. All requests for traffic calming within the City shall be considered in accordance with
Appendix B Transportation Report
 Project File Report Appendix B Transportation Report Town of Whitby HMM Project No. 327878 Final Report October 2014 Revision and Version Tracking CP Rail Crossing at New Coronation Road Class EA Study
91
 90 91 92 93 94 95 96 97 98 99 100 101 102 103 104 105 106 As previously depicted in Exhibit 4-J, vehicular accidents are shown along Forrester Road. The contributing factors may be due to its current two
TRAFFIC STUDY GUIDELINES Clarksville Street Department
 TRAFFIC STUDY GUIDELINES Clarksville Street Department 9/1/2009 Introduction Traffic studies are used to help the city determine potential impacts to the operation of the surrounding roadway network. Two
At each type of conflict location, the risk is affected by certain parameters:
 TN001 April 2016 The separated cycleway options tool (SCOT) was developed to partially address some of the gaps identified in Stage 1 of the Cycling Network Guidance project relating to separated cycleways.
Managed Motorways All Lanes Running
 Managed Motorways All Lanes Running All-Purpose Trunk Roads (APTR)/Dual 3- lane Motorway (D3M) Analysis and Hazard Assessment 1039092-ATA-035 Date: 8 May 2012 Version: 1.0 MMFD-ATA-035 - Issue 1 0 08-05-12.doc
Planning Committee STAFF REPORT March 7, 2018 Page 2 of 4 The following MTSOs are being used across the five subregions: Intersection Level of Service
 Planning Committee STAFF REPORT Meeting Date: March 7, 2018 Subject Summary of Issues Recommendations Financial Implications Options Attachments Changes from Committee Review Draft 2017 Multimodal Transportation
2015 Virginia Department of Transportation Daily Traffic Volume Estimates Including Vehicle Classification Estimates
 2015 Virginia Department of Transportation Daily Traffic Volume Estimates Including Vehicle Classification Estimates where available Special Locality Report 161 Information in this report is included in
2016 Virginia Department of Transportation Daily Traffic Volume Estimates Including Vehicle Classification Estimates
 2016 Virginia Department of Transportation Daily Traffic Volume Estimates Including Vehicle Classification Estimates where available Jurisdiction Report WV West Virginia repared By Virginia Department
Unit 7 Speed, Travel Time and Delay Studies
 Unit 7 Speed, Travel Time and Delay Studies Introduction Speed, travel time and delay are all related measures that are common used as indicators of performance for traffic facilities Measure of Effectiveness
Reduction of Speed Limit at Approaches to Railway Level Crossings in WA. Main Roads WA. Presenter - Brian Kidd
 Australasian College of Road Safety Conference A Safe System: Making it Happen! Melbourne 1-2 September 2011 Reduction of Speed Limit at Approaches to Railway Level Crossings in WA Radalj T 1, Kidd B 1
UNIT V 1. What are the traffic management measures? [N/D-13] 2. What is Transportation System Management (TSM)? [N/D-14]
![UNIT V 1. What are the traffic management measures? [N/D-13] 2. What is Transportation System Management (TSM)? [N/D-14]](/thumbs/87/95571671.jpg "UNIT V 1. What are the traffic management measures? [N/D-13] 2. What is Transportation System Management (TSM)? [N/D-14]") UNIT V 1. What are the traffic management measures? [N/D-13] Some of the well-known traffic management measures are: a) Restrictions on turning movements b) One - way streets c) Tidal - flow operations
UNIT V 1. What are the traffic management measures? [N/D-13] Some of the well-known traffic management measures are: a) Restrictions on turning movements b) One - way streets c) Tidal - flow operations
2002 Virginia Department of Transportation Daily Traffic Volume Estimates. Special Locality Report 146
 Virginia Department of Transportation Daily Traffic Volume Estimates Special Locality Report 146 Prepared By Virginia Department of Transportation Mobility Management Division In Cooperation With U.S.
M9/A90/M90 Edinburgh to Fraserburgh Trunk Road. A90 Tealing. Moving Cursor Programme Junction Study
 A90 Tealing Moving Cursor Programme Junction Study This is an unpublished report prepared for the Transport Scotland, Trunk Road and Bus Operations Division (TRBO) and must not be referred to in any publication
2003 Virginia Department of Transportation Daily Traffic Volume Estimates. Special Locality Report 198
 2003 Virginia Department of Transportation Daily Traffic Volume Estimates Special Locality Report 198 Prepared By Virginia Department of Transportation Mobility Management Division In Cooperation With
INTERIM ADVICE NOTE 150/11. Temporary Traffic Management Signing: Simplification of lane change zone signing for relaxation schemes.
 INTERIM ADVICE NOTE 150/11 Temporary Traffic Management Signing: Simplification of lane change zone signing for relaxation schemes Summary Guidance to those planning traffic management on omission of certain
Analysis of Run-Off-Road Crashes in Relation to Roadway Features and Driver Behavior
 Analysis of Run-Off-Road Crashes in Relation to Roadway Features and Driver Behavior Ertan Örnek University of Wisconsin, Madison Traffic Operations Lab 141 NW Barstow Street Waukesha, WI 53187 ornek@wisc.edu
ONE SIZE DOESN T FIT ALL RECONCILING OVERLAPPING TRANSPORT NETWORKS IN A CONSTRAINED URBAN ENVIRONMENT
 One Size Doesn t Fit All S Corbett, C Chenery Page 1 ONE SIZE DOESN T FIT ALL RECONCILING OVERLAPPING TRANSPORT NETWORKS IN A CONSTRAINED URBAN ENVIRONMENT Authors/Presenters: Sam Corbett, Principal Transport
Travel Patterns and Characteristics
 DRAFT 2006 Transportation Fact Book SECTION 4 Travel Patterns and Characteristics 43 2006 Transportation Fact Book DRAFT 44 DRAFT 2006 Transportation Fact Book Why do we conduct travel surveys? The main
A5.1 Permitted activities
 Section A5 Transportation A5.1 Permitted activities A5.1.1 Activities within roads Note: Refer to Section D for the definition of road (a) Any activity associated with the movement of traffic and the functioning
PRELIMINARY DRAFT FIRST AMENDMENT TO VISION 2050: A REGIONAL LAND USE AND TRANSPORTATION PLAN FOR SOUTHEASTERN WISCONSIN
 PRELIMINARY DRAFT FIRST AMENDMENT TO VISION 2050: A REGIONAL LAND USE AND TRANSPORTATION PLAN FOR SOUTHEASTERN WISCONSIN ESTABLISHING TARGETS FOR FEDERAL PERFORMANCE MEASURES: HIGHWAY SAFETY SOUTHEASTERN
Minor Amendments to the Street and Traffic By-law 2849 and Skateboards in Protected Bike Lanes
 ADMINISTRATIVE REPORT Report Date: October 31, 2017 Contact: Lon LaClaire Contact No.: 604.873.7336 RTS No.: 12241 VanRIMS No.: 08-2000-20 Meeting Date: November 15, 2017 TO: FROM: SUBJECT: Standing Committee
Regional Bus Priority
 Regional Bus Priority Recommendation(s) That the Board: i) Notes the systematic review for bus priority measures on the proposed Frequent Transit Network (FTN). Executive summary The New Network public
PROVINCIAL MAINTENANCE STANDARDS FOR MUNICIPAL HIGHWAYS AMENDMENTS 2018 RECOMMENDATION
 TO: FROM: SUBJECT: CHAIR AND MEMBERS CIVIC WORKS COMMITTEE MEETING ON AUGUST 13, 2018 KELLY SCHERR, P.ENG, MBA, FEC MANAGING DIRECTOR OF ENVIRONMENTAL AND ENGINEERING SERVICES AND CITY ENGINEER PROVINCIAL
2017 Virginia Department of Transportation Daily Traffic Volume Estimates Including Vehicle Classification Estimates
 2017 Virginia Department of Transportation Daily Traffic Volume Estimates Including Vehicle Classification Estimates where available Special Locality Report 200 Town of Columbia Information in this report
Recently Developed Intersection CMFs. Nancy Lefler, VHB ATSIP Traffic Records Forum, 2014
 Recently Developed Intersection CMFs Nancy Lefler, VHB ATSIP Traffic Records Forum, 2014 Overview General Methodology Treatments Installation of traffic signals - with and without left-turn lanes (NCDOT)
Design Criteria. Design Criteria
 F Design Criteria Design Criteria Ministry of Transportation Ministère des Transports DESIGN CRITERIA Page: 1 of 13 WORK PROJECT NO. N/A GO Bloomington Station TYPE OF PROJECT LOCATION Bloomington Road
Blue cod 5 (BCO5) pot mesh size review
 pot mesh size review") Blue cod 5 (BCO5) pot mesh size review Discussion Document MPI Discussion Paper No: 2017/01 Prepared for public consultation by the Ministry for Primary Industries ISBN No: 978-1-77665-454-3 (o) ISSN No:
Blue cod 5 (BCO5) pot mesh size review Discussion Document MPI Discussion Paper No: 2017/01 Prepared for public consultation by the Ministry for Primary Industries ISBN No: 978-1-77665-454-3 (o) ISSN No:
Pedestrian Level Crossings Design and Installation
 Discipline: Engineering (Track & Civil) Category: Standard Pedestrian Level Crossings Design and Installation ETD-16-03 Applicability New South Wales CRIA (NSW CRN) Primary Source ARTC NSW Standard XDS
Chapter 5 FUNCTIONAL CLASSIFICATION
 Chapter 5 FUNCTIONAL CLASSIFICATION Functional classification is a system by which streets and roadways may be distinguished by types according to their function within the entire transportation network.
Traffic Impact Analysis Chatham County Grocery Chatham County, NC
 Chatham County Grocery Chatham County, NC TABLE OF CONTENTS 1. INTRODUCTION... 1 1.1. Location and Study Area... 1 1.2. Proposed Land Use and Access... 2 1.3. Adjacent Land Uses... 2 1.4. Existing ways...
Beamex. Calibration White Paper. Weighing scale calibration - How to calibrate weighing instruments
 Beamex Calibration White Paper info@beamex.com Weighing scale calibration - How to calibrate weighing instruments Weighing scale calibration - How to calibrate weighing instruments Weighing scales, weighing
CHAPTER 2G. PREFERENTIAL AND MANAGED LANE SIGNS
 2011 Edition - Revision 2 Page 275 Section 2G.01 Scope CHAPTER 2G. PREFERENTIAL AND MANAGED LANE SIGNS 01 Preferential lanes are lanes designated for special traffic uses such as high-occupancy vehicles
General Accreditation Guidance. User checks and maintenance of laboratory balances
 General Accreditation Guidance User checks and maintenance of laboratory balances January 2018 Copyright National Association of Testing Authorities, Australia 2010 All intellectual property rights in
Formwork Labourer Initial work capacity form
 Purpose of this form Formwork Labourer This form is designed to be completed by injured workers and their supervisors and/or the return to work coordinator, if applicable; to determine the tasks the worker
2019 ProKart Series Permit No: 1921SP
 2019 ProKart Series Permit No: 1921SP Supplementary Rules and Entry Form On behalf of the ProKart Promoters, our sponsors and partners, we would like to welcome you the driver, family and crew to ProKart
2014 Virginia Department of Transportation Daily Traffic Volume Estimates Including Vehicle Classification Estimates
 Daily Traffic Volume Estimates Including Vehicle Classification Estimates where available Special Locality Report 271 Information in this report is included in Report (Scott County) Prepared By In Cooperation
To: The results of these surveys have been analysed and are summarised within this Technical Note.
 Technical Note Project: Histon Road / Milton Road, Cambridge Parking Surveys To: Andy Harrison Subject: Survey Report v1.6 From: Jonathan Barlow Date: 18 th February 2016 cc: Richard Jones / Dave Boddy
Appendix B27 - Weekend and off-peak benefits
 Appendix B27 - Weekend and off-peak benefits Technical Note Project Title: MVA Project Number: Subject: SY BRT Northern - BAFFB C3a556 Report A5b: Off-Peak and Weekend Benefits Note Number: 56 Version:
Baseline Survey of New Zealanders' Attitudes and Behaviours towards Cycling in Urban Settings
 Baseline Survey of New Zealanders' Attitudes and Behaviours towards Cycling in Urban Settings Highlights 67% of urban New Zealanders, 18 years of age or more own or have access to a bicycle that is in
INTERIM ADVICE NOTE 150/14 Revision 02. Guidance on Alternative Temporary Traffic Management Techniques for Relaxation Works on Dual Carriageways
 INTERIM ADVICE NOTE 150/14 Revision 02 Guidance on Alternative Temporary Traffic Management Techniques for Relaxation Works on Dual Carriageways Summary Guidance for temporary traffic management (TTM),
Traffic Engineer s Annual Report
 Traffic Engineer s Annual Report Fiscal Year Ended June 30, 2012 STATE OF FLORIDA DEPARTMENT OF TRANSPORTATION Florida Department of Transportation January 22, 2013 Mrs. Nicola A. Liquori, C.P.A. Chief
2017 Virginia Department of Transportation Daily Traffic Volume Estimates Including Vehicle Classification Estimates
 2017 Virginia Department of Transportation Daily Traffic Volume Estimates Including Vehicle Classification Estimates where available Special Locality Report 294 Information in this report is included in
Intersection of Massachusetts Avenue and Maple Street in Lexington Signalized Intersection and Roundabout Comparison
 Intersection of Massachusetts Avenue and Maple Street in Lexington Signalized Intersection and Roundabout Comparison Michael Wallwork, Roundabout Expert, Orange Park, Florida Tom Bertulis (MS, PE, PTOE),
Northland Region road trauma for Northland Region. Road casualties Estimated social cost of crashes* Major road safety issues
 ISSN 1176-841X July 26 Land Transport has prepared this road safety issues report. It is based on reported crash data and trends for the 21 25 period. The intent of the report is to highlight key road