MEMO DRAFT VIA . Mr. Terry Bailey Foremost Development Company. To: Michael J. Labadie, PE Steven J. Russo, E.I.T. Fleis & VandenBrink.
|
|
|
- Wilfrid Gardner
- 5 years ago
- Views:
Transcription

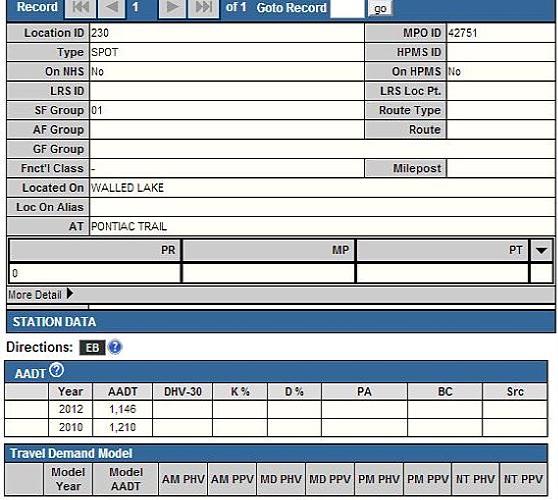
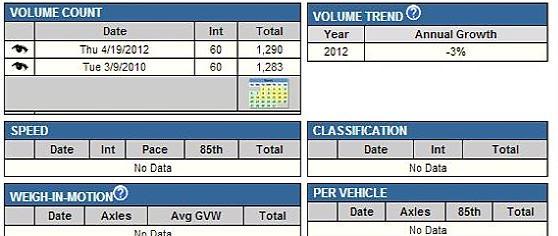
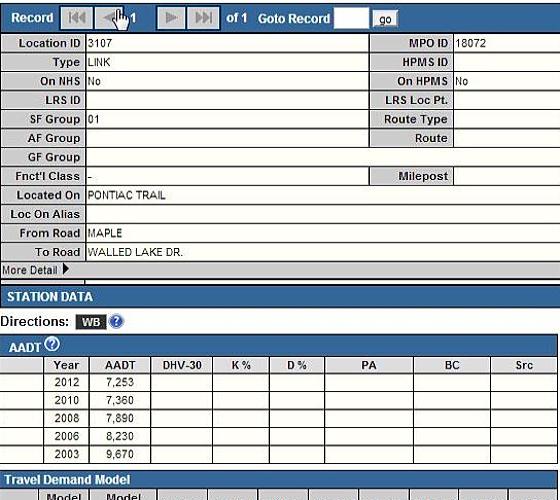
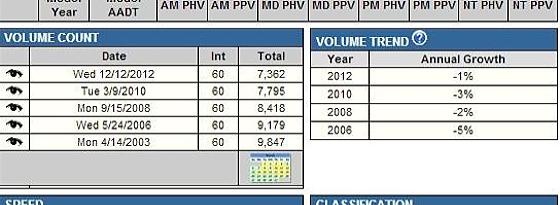
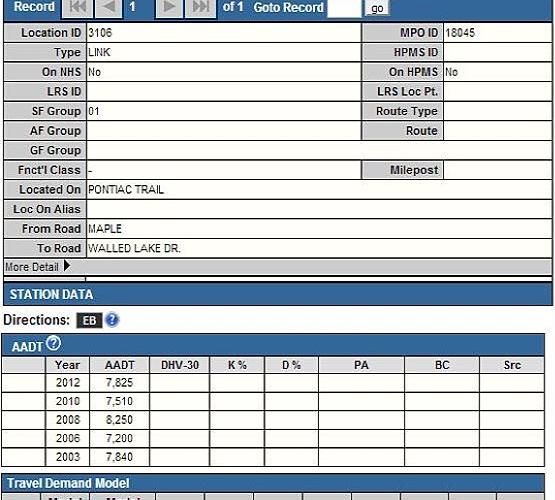
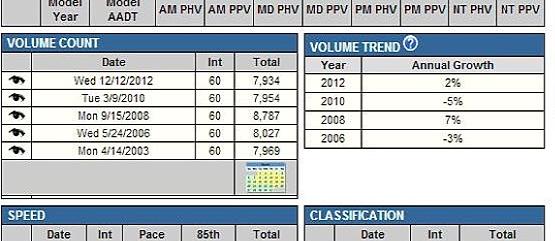
1 MEMO DRAFT VIA To: From: Mr. Terry Bailey Foremost Development Company Michael J. Labadie, PE Steven J. Russo, E.I.T. Fleis & VandenBrink Date: August 29, 214 Re: Proposed Apartments City of Walled Lake, Michigan Traffic Impact Assessment Introduction This memorandum presents the results of a Traffic Impact Assessment (TIA) for the proposed residential development project in the City of Walled Lake, Michigan. The project site is located on the north side of Walled Lake Drive approximately 8 feet east of Pontiac Trail and is being proposed for a residential development that will include 71 apartment units with site access provided via two driveways to Market Street. Also, as part of the project Witherall Street between Walled Lake Drive and Market Street is proposed to be vacated. The City of Walled Lake has required a TIA for the project to evaluate traffic operations with the proposed project. The purpose of this study is to evaluate the traffic related impacts (if any) of this project on the adjacent road network including the impact of eliminating access to Walled Lake Drive from Witherall Street. The study was completed according to accepted traffic engineering practice and methodologies published by the Institute of Transportation Engineers (ITE). The study analyses were completed using Synchro and SimTraffic, Version 8 traffic analysis software. Data Collection Existing weekday traffic volume data were collected by Fleis & VandenBrink (F&V) on August 13 th -14 th, and 19 th -21 st, 214. Vehicular turning movement counts were collected during the AM (7: AM to 9: AM) and PM (4: PM to 6: PM) peak periods at the intersection of Pontiac Trail & Walled Lake Drive and the intersections of Market Street, Northport Street, and Nicolet Street with Pontiac Trail. Additionally, in order to determine the impacts of closing access to Walled Lake Drive via Witherall Street, turning movement counts were also collected at the intersections of Witherall Street with Northport Street and Walled Lake Drive. Further, AM and PM peak hour volumes were forecast at the intersection of Walled Lake Drive & Hillcroft Drive, based on the number of single-family dwelling units along Hillcroft Drive and data published by ITE in Trip Generation, 9 th Edition. These trips were then assigned to the intersection based on the directional proportion of traffic at the Walled Lake Drive & Witherall Street intersection. Lastly, F&V collected an inventory of existing lane use and traffic control at the study intersections and obtained existing traffic signal timing information from the Road Commission for Oakland County (RCOC). The applicable data referenced in this memorandum are attached. Walled Lake Apartments TIA DRAFT Memo Farmington Hills, MI P: F:
2 MEMO Existing Conditions The existing AM and PM peak hour traffic volumes were identified based on the data collected. Peak hour volumes for each intersection were used and through volumes were balanced upward where appropriate. Existing peak hour vehicle delays and Levels of Service (LOS) were calculated based on the existing lane use and traffic control, the existing peak hour traffic volumes, and the methodologies presented in the Highway Capacity Manual, 2 (HCM). Typically, LOS D is considered acceptable, with LOS A representing minimal delay. The results of the existing conditions analysis are attached and summarized in Table 1. Table 1 Existing Intersection Operations AM Peak Delay PM Peak Delay Intersection Control Approach (s/veh) LOS (s/veh) LOS 1. Pontiac Trail Signalized EB 42.3 D 43. D & Walled Lake Drive WB 41.9 D 42.2 D NB 16.9 B 17.8 B SB 19.7 B 17.8 B Overall 25.1 C 25.1 C 2. Pontiac Trail STOP EB 13.2 B 14.9 B & Market / Common (Minor) WB 14.8 B 17.8 C Street NB.1 A.* A SB.* A.1 A 3. Pontiac Trail STOP EB 25.5 D 1. B & Northport / Liberty (Minor) WB 11.9 B 11.6 B Street NB.* A.* A SB 2. A 1.4 A 4. Pontiac Trail STOP EB 1.6 B 11.3 B & Nicolet Street (Minor) NB SB Free.4 A Free.6 A 5. Walled Lake Drive STOP EB.* A.3 A & Witherall Street (Minor) WB SB Free 16.5 C Fee 18.7 C 6. Walled Lake Drive STOP SB 15.8 C 17.4 C & Hillcroft Drive (Minor) * - No traffic demand present for the left turn movement. Walled Lake Apartments TIA DRAFT Memo Farmington Hills, MI P: F:
3 MEMO The intersection of Pontiac Trail & Northport Street / Liberty Street is configured as an unsignalized multi-leg intersection with STOP signs on the minor street approaches of Northport and Liberty Streets. This intersection configuration currently exceeds the limitations of the HCM. Therefore, for analysis purposes Liberty Street was relocated to form a T intersection with the east leg of Northport Street and all traffic to and from Liberty Street was reassigned to the Northport Street approach. The existing conditions results indicate that all study intersection approaches and movements currently operate acceptably at a LOS D or better during both peak periods. Review of the network simulations indicates acceptable traffic operations during the AM peak hour. During the PM peak hour, the westbound and southbound approaches at the signalized intersection of Pontiac Trail & Walled Lake Drive experience brief periods of vehicle queues; however, these queues dissipate and are not present throughout the duration of the peak hour. In order to determine the applicable growth rate for the existing traffic volumes to project build-out, historical traffic data were referenced from the Southeast Michigan Council of Governments (SEMCOG). SEMCOG data for Pontiac Trail and Walled Lake Drive do not indicate significant traffic growth in the near future. Consistent with stagnant traffic growth patterns throughout southeast Michigan, the background growth rate was assumed to be zero percent to project buildout. Therefore, future background conditions without the proposed development are assumed equal to existing conditions. Site Trip Generation and Assignment The number of AM and PM peak hour vehicle trips that would be generated by the proposed apartment development was forecast based on data published by the Institute of Transportation Engineers (ITE) in Trip Generation, 9 th Edition. The site trip generation forecast is shown in Table 2. Table 2 Site Trip Generation ITE Average AM Peak Hour PM Peak Hour Land Use Code Amount Units Daily Traffic In Out Total In Out Total Apartments D.U The vehicle trips that would be generated by the proposed development were assigned to the study road network based on existing peak hour traffic patterns and the proposed site access plan. The existing traffic patterns indicate the distribution of site-generated traffic shown in Table 3. Table 3 Site Trip Distribution To via AM PM North Pontiac Trail 31% 26% South Pontiac Trail 39% 46% East Walled Lake Drive 28% 24% West Walled Lake Drive 2% 4% 1% 1% Walled Lake Apartments TIA DRAFT Memo Farmington Hills, MI P: F:
4 MEMO Future Conditions Future peak hour vehicle delays and LOS were calculated based on the future traffic volumes with the apartment development. Additionally, the proposed development will eliminate the segment of Witherall Street between Walled Lake Drive and Market Street. Thus, all traffic using this section of roadway was redistributed to the adjacent streets of Hillcroft Drive, Ferland Street, and Liberty Street. The results of the future conditions analysis are attached and summarized in Table 4. Table 4 Future Intersection Operations AM Peak Delay PM Peak Delay Intersection Control Approach (s/veh) LOS (s/veh) LOS 1. Pontiac Trail Signalized EB 42.3 D 43. D & Walled Lake Drive WB 41.7 D 42.7 D NB 17.3 B 18. B SB 2.2 C 17.9 B Overall 25.5 C 25.3 C 2. Pontiac Trail STOP EB 13.3 B 14.9 B & Market / Common (Minor) WB 12.7 B 17.8 C Street NB.1 A.* A SB.* A.1 A 3. Pontiac Trail STOP EB 26.4 D 1. B & Northport / Liberty (Minor) WB 11.7 B 11.7 B Street NB.* A.* A SB 2. A 1.5 A 4. Pontiac Trail STOP EB 1.6 B 11.4 B & Nicolet Street (Minor) NB Free Free SB.4 A.7 A 6. Walled Lake Drive STOP SB 17.4 C 2.1 C & Hillcroft Drive (Minor) * - No traffic demand present for the left turn movement. The results of the future conditions analysis indicate that future vehicle delays and LOS at the study intersections would be similar to existing conditions and any increases would not be discernable. At the signalized intersection of Pontiac Trail & Walled Lake Drive, the proposed development would increase traffic Walled Lake Apartments TIA DRAFT Memo Farmington Hills, MI P: F:
5 MEMO by less than 2% during both peak periods, which is not significant. Additionally, review of network simulations indicates acceptable future traffic operations, and vehicle queues are observed to be acceptably processed. With the closure of Witherall Street between Walled Lake Drive and Market Street, Hillcroft Drive and Liberty Street will become the main routes of travel for existing egress Witherall Street traffic wishing to travel east on Walled Lake Drive. This will result in approximately 32 and 39 more vehicles traveling down Hillcroft Drive during the AM and PM peak hours, respectively. As Hillcroft Drive is a one-way street in the southbound direction only, current ingress Witherall Street traffic will use Ferland Street and Liberty Street. Conclusions The conclusions of this Traffic Impact Assessment are as follows: 1. All study intersection approaches and movements currently operate acceptably at a LOS D or better during both peak periods. 2. The proposed development will not have a significant impact on traffic operations as compared to existing conditions. 3. Future traffic at the signalized intersection of Pontiac Trail & Walled Lake Drive will increase by less than 2% during the peak hours, which is not significant. 4. With the closure of Witherall Street, Hillcroft Drive and Liberty Street will become the primary routes of travel for existing egress Witherall Street traffic and Ferland Street and Liberty Street for existing ingress Witherall Street traffic to and from the east on Walled Lake Drive. Overall, traffic operations will be acceptable with the proposed apartment development. Any questions related to this memorandum, study, analyses, and results should be addressed to Fleis & VandenBrink Engineering, Inc. Attached: Traffic Volume Data SEMCOG Data Synchro Results SJR:mjl Walled Lake Apartments TIA DRAFT Memo Farmington Hills, MI P: F:
6 Project: Walled Lake Apartments TIA Weather: Sunny, 7's Location: Pontiac Trail & Walled Lake Dr Southbound Fleis & VandenBrink Engineering, Inc. Farmington Hills, MI 48334File Name : Pontiac Trail & Walled Lake Drive Site Code : Start Date : 8/13/214 Groups Printed- Unshifted WALLED LAKE DRIVE Westbound Northbound Page No : 1 WALLED LAKE DRIVE Eastbound Start Time Right Thru Left Peds Right Thru Left Peds Right Thru Left Peds Right Thru Left Peds Int. Total 7: AM :15 AM :3 AM :45 AM Total : AM :15 AM :3 AM :45 AM Total *** BREAK *** 4: PM :15 PM :3 PM :45 PM Total : PM :15 PM :3 PM :45 PM Total Grand Total Apprch % Total %
7 WALLED LAKE DRIVE Fleis & VandenBrink Engineering, Inc. Farmington Hills, MI 48334File Name : Pontiac Trail & Walled Lake Drive Site Code : Start Date : 8/13/214 Page No : Unshifted 7: AM 5:45 PM North WALLED LAKE DRIVE
8 Fleis & VandenBrink Engineering, Inc. Farmington Hills, MI 48334File Name : Pontiac Trail & Walled Lake Drive Site Code : Start Date : 8/13/214 Page No : 3 Southbound WALLED LAKE DRIVE Westbound Northbound WALLED LAKE DRIVE Eastbound Start Rig Thr Time ht u Left Ped App. Rig Thr s Total ht u Left Ped App. Rig Thr s Total ht u Left Ped App. Rig Thr s Total ht u Left Ped App. Int. s Total Total Peak Hour From 7: AM to 11:45 AM - Peak 1 of 1 Intersecti on 7:15 AM Volume Percent :45 Volume Peak Factor.895 High Int. 7:45 AM 7:45 AM 7:3 AM 7:3 AM Volume Peak Factor WALLED LAKE DRIVE Unshifted 7:15 AM 8: AM WALLED LAKE DRIVE North
9 Fleis & VandenBrink Engineering, Inc. Farmington Hills, MI 48334File Name : Pontiac Trail & Walled Lake Drive Site Code : Start Date : 8/13/214 Page No : 4 Southbound WALLED LAKE DRIVE Westbound Northbound WALLED LAKE DRIVE Eastbound Start Rig Thr Time ht u Left Ped App. Rig Thr s Total ht u Left Ped App. Rig Thr s Total ht u Left Ped App. Rig Thr s Total ht u Left Ped App. Int. s Total Total Peak Hour From 12: PM to 5:45 PM - Peak 1 of 1 Intersecti on 4:3 PM Volume Percent : Volume Peak Factor.966 High Int. 4:45 PM 5:15 PM 5: PM 4:45 PM Volume Peak Factor WALLED LAKE DRIVE Unshifted 4:3 PM 5:15 PM WALLED LAKE DRIVE North
10 Project: Walled Lake Apartments TIA Weather: Sunny, 7's Location: Pontiac Trail & Northport / Li Start Time Rig ht Southbound Thr u Be ar Left Left Pe ds Fleis & VandenBrink Engineering, Inc. Farmington Hills, MI NORTHPORT STREET Westbound Rig ht Har Thr u Left d Left Groups Printed- Unshifted LIBERTY STREET Northwestbound Har Be Be Har Pe d ar ar d ds Rig Rig Left Left ht ht Har d Rig ht Northbound Rig ht Thr u Left Pe ds File Name : PONTIA~2 Site Code : Start Date : 8/14/214 Page No : 1 NORTHPORT STREET Eastbound Be Rig ar Thr ht Rig u Left Pe ds ht 7: AM :15 AM :3 AM :45 AM Total : AM :15 AM :3 AM :45 AM Total *** BREAK *** 4: PM :15 PM :3 PM :45 PM Total : PM :15 PM :3 PM :45 PM Total Grand Total Apprch % Total % Int. Total
11 Fleis & VandenBrink Engineering, Inc. Farmington Hills, MI Out In Total File Name : PONTIA~2 Site Code : Start Date : 8/14/214 Page No : 2 9 Right 1734 Thru 263 Bear Left 16 Left Peds NORTHPORT STREET Out In Total Left Thru Bear Right Right Peds 8/14/214 7:: AM 8/14/214 5:45: PM Unshifted North Right Thru Left Hard Peds Left Out In Total NORTHPORT STREET Hard Right 1 Left 6 Thru 2174 Right 9 Hard Right Peds Hard Left 1 Bear Left 1 Bear Right In 43 Total Out In Total 27 Out LIBERTY STREET
12 Fleis & VandenBrink Engineering, Inc. Farmington Hills, MI File Name : PONTIA~2 Site Code : Start Date : 8/14/214 Page No : 3 Start Time Ri gh t Southbound Th ru Be ar Le ft Le ft Pe ds App. Tot al Ri gh t NORTHPORT STREET Westbound Th ru Le ft Peak Hour From 7: AM to 11:45 AM - Peak 1 of 1 Interse 7:15 AM ction H ar d Le ft Pe ds App. Tot al LIBERTY STREET Northwestbound H ar d Ri gh t Be ar Ri gh t Be ar Le ft H ar d Le ft App. Tot al H ar d Ri gh t Northbound Ri gh t Th ru Le ft Pe ds App. Tot al Ri gh t NORTHPORT STREET Eastbound Volume Percen t :45 Volume Peak Factor.857 High Int. 7:45 AM 7:15 AM 7:3 AM 8: AM 7:3 AM Volume Peak Factor Be ar Ri gh t Th ru Le ft Pe ds App. Tot al Int. Tot al Out In Total Right 411 Thru 9 Bear Left 1 Left Peds NORTHPORT STREET Out In Total Left Thru Bear Right Right Peds 8/14/214 7:15: AM 8/14/214 8:: AM Unshifted North Right Thru Left Hard Peds Left Out In Total NORTHPORT STREET Hard Left Bear Left Bear Right 24 Hard Right 2 Left Thru 43 Right Hard Right Peds 26 In 118 Total Out In Total 92 Out LIBERTY STREET
13 Fleis & VandenBrink Engineering, Inc. Farmington Hills, MI File Name : PONTIA~2 Site Code : Start Date : 8/14/214 Page No : 4 Start Time Ri gh t Southbound Th ru Be ar Le ft Le ft Pe ds App. Tot al Ri gh t NORTHPORT STREET Westbound Th ru Le ft Peak Hour From 12: PM to 5:45 PM - Peak 1 of 1 Interse 4:45 PM ction H ar d Le ft Pe ds App. Tot al LIBERTY STREET Northwestbound H ar d Ri gh t Be ar Ri gh t Be ar Le ft H ar d Le ft App. Tot al H ar d Ri gh t Northbound Ri gh t Th ru Le ft Pe ds App. Tot al Ri gh t NORTHPORT STREET Eastbound Volume Percen t :3 Volume Peak Factor.945 High Int. 4:45 PM 5:3 PM 4:45 PM 5:15 PM 5: PM Volume Peak Factor Be ar Ri gh t Th ru Le ft Pe ds App. Tot al Int. Tot al Out In Total Right 51 Thru 6 Bear Left 6 Left Peds NORTHPORT STREET Out In Total Left Thru Bear Right Right Peds 8/14/214 4:45: PM 8/14/214 5:3: PM Unshifted North Right Thru Left Hard Peds Left Out In Total NORTHPORT STREET Hard Left Bear Left Bear Right 4 Hard Right 3 Left Thru 688 Right 3 Hard Right Peds 43 In 14 Total Out In Total 61 Out LIBERTY STREET
14 Project: Walled Lake Apartments TIA Weather: Sunny, 7's Location: Pontiac Trail & Market / Commo Southbound Fleis & VandenBrink Engineering, Inc. Farmington Hills, MI Groups Printed- Unshifted MARKET STREET Westbound Northbound File Name : PONTIA~4 Site Code : Start Date : 8/14/214 Page No : 1 COMMON STREET Eastbound Start Time Right Thru Left Peds Right Thru Left Peds Right Thru Left Peds Right Thru Left Peds Int. Total 7: AM :15 AM :3 AM :45 AM Total : AM :15 AM :3 AM :45 AM Total *** BREAK *** 4: PM :15 PM :3 PM :45 PM Total : PM :15 PM :3 PM :45 PM Total Grand Total Apprch % Total %
15 Fleis & VandenBrink Engineering, Inc. Farmington Hills, MI File Name : PONTIA~4 Site Code : Start Date : 8/14/214 Page No : 2 COMMON STREET Unshifted 7: AM 5:45 PM MARKET STREET North
16 Fleis & VandenBrink Engineering, Inc. Farmington Hills, MI File Name : PONTIA~4 Site Code : Start Date : 8/14/214 Page No : 3 Southbound MARKET STREET Westbound Northbound COMMON STREET Eastbound Start Rig Thr Time ht u Left Ped App. Rig Thr s Total ht u Left Ped App. Rig Thr s Total ht u Left Ped App. Rig Thr s Total ht u Left Ped App. Int. s Total Total Peak Hour From 7: AM to 11:45 AM - Peak 1 of 1 Intersecti on 7:15 AM Volume Percent :45 Volume Peak Factor.888 High Int. 7:45 AM 7:45 AM 8: AM 7:45 AM Volume Peak Factor COMMON STREET Unshifted 7:15 AM 8: AM MARKET STREET North
17 Fleis & VandenBrink Engineering, Inc. Farmington Hills, MI File Name : PONTIA~4 Site Code : Start Date : 8/14/214 Page No : 4 Southbound MARKET STREET Westbound Northbound COMMON STREET Eastbound Start Rig Thr Time ht u Left Ped App. Rig Thr s Total ht u Left Ped App. Rig Thr s Total ht u Left Ped App. Rig Thr s Total ht u Left Ped App. Int. s Total Total Peak Hour From 12: PM to 5:45 PM - Peak 1 of 1 Intersecti on 4:45 PM Volume Percent :15 Volume Peak Factor.933 High Int. 4:45 PM 5:15 PM 5:15 PM 5:3 PM Volume Peak Factor COMMON STREET Unshifted 4:45 PM 5:3 PM MARKET STREET North
18 Project: Walled Lake Apartments TIA Weather: Cloudy, 7's Location: Pontiac Trail & Nicolet Southbound Fleis & VandenBrink Engineering, Inc. Farmington Hills, MI NICOLET STREET Westbound Groups Printed- Unshifted Northbound File Name : Pontiac Trail & Nicolet Street Site Code : Start Date : 8/19/214 Page No : 1 NICOLET STREET Eastbound Start Time Right Thru Left Peds Right Thru Left Peds Right Thru Left Peds Right Thru Left Peds Int. Total 7: AM :15 AM :3 AM :45 AM Total : AM :15 AM :3 AM :45 AM Total *** BREAK *** 4: PM :15 PM :3 PM :45 PM Total : PM :15 PM :3 PM :45 PM Total Grand Total Apprch % Total %
19 Fleis & VandenBrink Engineering, Inc. Farmington Hills, MI File Name : Pontiac Trail & Nicolet Street Site Code : Start Date : 8/19/214 Page No : NICOLET STREET 1 - Unshifted 7: AM 5:45 PM NICOLET STREET North
20 Fleis & VandenBrink Engineering, Inc. Farmington Hills, MI File Name : Pontiac Trail & Nicolet Street Site Code : Start Date : 8/19/214 Page No : 3 Southbound NICOLET STREET Westbound Northbound NICOLET STREET Eastbound Start Time Righ Ped App. Righ Ped App. Righ Ped App. Righ Ped App. Int. Thru Left Thru Left Thru Left Thru Left t s Total t s Total t s Total t s Total Total Peak Hour From 7: AM to 11:45 AM - Peak 1 of 1 Intersectio n 7:3 AM Volume Percent :45 Volume Peak.95 Factor High Int. 7:45 AM 7:3 AM 8:15 AM 6:45: AM Volume Peak Factor NICOLET STREET 1 - Unshifted 7:3 AM 8:15 AM NICOLET STREET North
21 Fleis & VandenBrink Engineering, Inc. Farmington Hills, MI File Name : Pontiac Trail & Nicolet Street Site Code : Start Date : 8/19/214 Page No : 4 Southbound NICOLET STREET Westbound Northbound NICOLET STREET Eastbound Start Time Righ Ped App. Righ Ped App. Righ Ped App. Righ Ped App. Int. Thru Left Thru Left Thru Left Thru Left t s Total t s Total t s Total t s Total Total Peak Hour From 12: PM to 5:45 PM - Peak 1 of 1 Intersectio n 4:3 PM Volume Percent :15 Volume Peak.94 Factor High Int. 4:3 PM 5:15 PM 5:15 PM Volume Peak Factor NICOLET STREET 1 - Unshifted 4:3 PM 5:15 PM NICOLET STREET North
22 Project: Walled Lake Apartments TIA Weather: Partly Cloudy, 8's Location: Walled Lake Drive & Witherall WITHERALL STREET Southbound Fleis & VandenBrink Engineering, Inc. Farmington Hills, MI WALLED LAKE DRIVE Westbound Groups Printed- Unshifted WITHERALL STREET Northbound File Name : WALLED~1 Site Code : Start Date : 8/2/214 Page No : 1 WALLED LAKE DRIVE Eastbound Start Time Right Thru Left Peds Right Thru Left Peds Right Thru Left Peds Right Thru Left Peds Int. Total 7: AM :15 AM :3 AM :45 AM Total : AM :15 AM :3 AM :45 AM Total *** BREAK *** 4: PM :15 PM :3 PM :45 PM Total : PM :15 PM :3 PM :45 PM Total Grand Total Apprch % Total %
23 Fleis & VandenBrink Engineering, Inc. Farmington Hills, MI WITHERALL STREET File Name : WALLED~1 Site Code : Start Date : 8/2/214 Page No : WALLED LAKE DRIVE Unshifted 7: AM 5:45 PM WALLED LAKE DRIVE WITHERALL STREET North
24 Fleis & VandenBrink Engineering, Inc. Farmington Hills, MI File Name : WALLED~1 Site Code : Start Date : 8/2/214 Page No : 3 WITHERALL STREET Southbound WALLED LAKE DRIVE Westbound WITHERALL STREET Northbound WALLED LAKE DRIVE Eastbound Start Time Righ Ped App. Righ Ped App. Righ Ped App. Righ Ped App. Int. Thru Left Thru Left Thru Left Thru Left t s Total t s Total t s Total t s Total Total Peak Hour From 7: AM to 11:45 AM - Peak 1 of 1 Intersectio n 7:15 AM Volume Percent :45 Volume Peak Factor.79 High Int. 7:15 AM 7:45 AM 6:45: AM 7:45 AM Volume Peak Factor WITHERALL STREET 6 28 WALLED LAKE DRIVE Unshifted 7:15 AM 8: AM WALLED LAKE DRIVE WITHERALL STREET North
25 Fleis & VandenBrink Engineering, Inc. Farmington Hills, MI File Name : WALLED~1 Site Code : Start Date : 8/2/214 Page No : 4 WITHERALL STREET Southbound WALLED LAKE DRIVE Westbound WITHERALL STREET Northbound WALLED LAKE DRIVE Eastbound Start Time Righ Ped App. Righ Ped App. Righ Ped App. Righ Ped App. Int. Thru Left Thru Left Thru Left Thru Left t s Total t s Total t s Total t s Total Total Peak Hour From 12: PM to 5:45 PM - Peak 1 of 1 Intersectio n 4:45 PM Volume Percent :45 Volume Peak.947 Factor High Int. 5:3 PM 5:15 PM 4:45 PM Volume Peak Factor WITHERALL STREET WALLED LAKE DRIVE Unshifted 4:45 PM 5:3 PM WALLED LAKE DRIVE WITHERALL STREET North
26 Project: Walled Lake Apartments TIA Weather: Cloudy, 8's Location: Northport & Witherall WITHERALL STREET Southbound Fleis & VandenBrink Engineering, Inc. Farmington Hills, MI NORTHPORT STREET Westbound Groups Printed- Unshifted WITHERALL STREET Northbound File Name : Northport Street & Witherall Street Site Code : Start Date : 8/21/214 Page No : 1 NORTHPORT STREET Eastbound Start Time Right Thru Left Peds Right Thru Left Peds Right Thru Left Peds Right Thru Left Peds Int. Total 7: AM :15 AM :3 AM :45 AM Total : AM :15 AM 2 2 8:3 AM :45 AM Total *** BREAK *** 4: PM :15 PM :3 PM :45 PM Total : PM :15 PM :3 PM :45 PM Total Grand Total Apprch % Total %
27 Fleis & VandenBrink Engineering, Inc. Farmington Hills, MI WITHERALL STREET File Name : Northport Street & Witherall Street Site Code : Start Date : 8/21/214 Page No : NORTHPORT STREET Unshifted 7: AM 5:45 PM NORTHPORT STREET WITHERALL STREET 1 North
28 Fleis & VandenBrink Engineering, Inc. Farmington Hills, MI File Name : Northport Street & Witherall Street Site Code : Start Date : 8/21/214 Page No : 3 WITHERALL STREET Southbound NORTHPORT STREET Westbound WITHERALL STREET Northbound NORTHPORT STREET Eastbound Start Time Righ Ped App. Righ Ped App. Righ Ped App. Righ Ped App. Int. Thru Left Thru Left Thru Left Thru Left t s Total t s Total t s Total t s Total Total Peak Hour From 7: AM to 11:45 AM - Peak 1 of 1 Intersectio n 7: AM Volume Percent : Volume Peak Factor.817 High Int. 7: AM 7:15 AM 7: AM 7:15 AM Volume Peak Factor WITHERALL STREET NORTHPORT STREET Unshifted 7: AM 7:45 AM NORTHPORT STREET WITHERALL STREET North
29 Fleis & VandenBrink Engineering, Inc. Farmington Hills, MI File Name : Northport Street & Witherall Street Site Code : Start Date : 8/21/214 Page No : 4 WITHERALL STREET Southbound NORTHPORT STREET Westbound WITHERALL STREET Northbound NORTHPORT STREET Eastbound Start Time Righ Ped App. Righ Ped App. Righ Ped App. Righ Ped App. Int. Thru Left Thru Left Thru Left Thru Left t s Total t s Total t s Total t s Total Total Peak Hour From 12: PM to 5:45 PM - Peak 1 of 1 Intersectio n 4:45 PM Volume Percent :15 Volume Peak.629 Factor High Int. 4:45 PM 5: PM 5:15 PM 5:15 PM Volume Peak Factor WITHERALL STREET NORTHPORT STREET Unshifted 4:45 PM 5:3 PM NORTHPORT STREET WITHERALL STREET 1 North
30
31
32
33 Level of Service Criteria for Stop Sign Controlled Intersections The level of service criteria are given in Table As used here, control delay is defined as the total elapsed time from the time a vehicle stops at the end of the queue until the vehicle departs from the stop line; this time includes the time required for the vehicle to travel from the last-in-queue position to the first-in-queue position, including deceleration of vehicles from free-flow speed to the speed of vehicles in queue. The average total delay for any particular minor movement is a function of the service rate or capacity of the approach and the degree of saturation.... Exhibit Level of Service Criteria for TWSC Intersections LEVEL OF SERVICE AVERAGE CONTROL DELAY (sec/veh) A < 1 B > 1 and < 15 C > 15 and < 25 D > 25 and < 35 E > 35 and < 5 F > 5 Average total delay less than 1 sec/veh is defined as Level of Service (LOS) A. Follow-up times of less than 5 sec have been measured when there is no conflicting traffic for a minor street movement, so control delays of less than 1 sec/veh are appropriate for low flow conditions. To remain consistent with the AWSC intersection analysis procedure described later in this chapter, a total delay of 5 sec/veh is assumed as the break point between LOS E and F. The proposed level of service criteria for TWSC intersections are somewhat different from the criteria used in Chapter 16 for signalized intersections. The primary reason for this difference is that drivers expect different levels of performance from different kinds of transportation facilities. The expectation is that a signalized intersection is designed to carry higher traffic volumes than an unsignalized intersection. Additionally, several driver behavior considerations combine to make delays at signalized intersections less onerous than at unsignalized intersections. For example, drivers at signalized intersections are able to relax during the red interval, where drivers on the minor approaches to unsignalized intersections must remain attentive to the task of identifying acceptable gaps and vehicle conflicts. Also, there is often much more variability in the amount of delay experienced by individual drivers at unsignalized than signalized intersections. For these reasons, it is considered that the total delay threshold for any given level of service is less for an unsignalized intersection than for a signalized intersection.... LOS F exists when there are insufficient gaps of suitable size to allow a side street demand to cross safely through a major street traffic stream. This level of service is generally evident from extremely long total delays experienced by side street traffic and by queueing on the minor approaches. The method, however, is based on a constant critical gap size - that is, the critical gap remains constant, no matter how long the side street motorist waits. LOS F may also appear in the form of side street vehicles selecting smaller-than-usual gaps. In such cases, safety may be a problem and some disruption to the major traffic stream may result. It is important to note that LOS F may not always result in long queues but may result in adjustments to normal gap acceptance behavior. The latter is more difficult to observe on the field than queueing, which is more obvious. Source: Highway Capacity Manual, 2. Transportation Research Board, National Research Council
34 Level of Service for Signalized Intersections Level of service for signalized intersections is defined in terms of delay, which is a measure of driver discomfort and frustration, fuel consumption, and lost travel time. Specifically, level-of-service (LOS) criteria are stated in terms of the average stopped delay per vehicle for a 15-min analysis period. The criteria are given in Exhibit Delay may be measured in the field or estimated using procedures presented later in this chapter. Delay is a complex measure and is dependent on a number of variables, including the quality of progression, the cycle length, the green ratio, and the v/c ratio for the lane group in question. LOS A describes operations with very low delay, up to 1 sec per vehicle. This level of service occurs when progression is extremely favorable and most vehicles arrive during the green phase. Most vehicles do not stop at all. Short cycle lengths may also contribute to low delay. LOS B describes operations with delay greater than 1 and up to 2 sec per vehicle. This level generally occurs with good progression, short cycle lengths, or both. More vehicles stop than with LOS A, causing higher levels of average delay. Exhibit Level-of-Service Criteria for Signalized Intersections LEVEL OF SERVICE STOPPED DELAY PER VEHICLE (SEC) A <1. B > 1. and <2. C > 2. and < 35. D > 35. and < 55. E > 55. and < 8. F >8. LOS C describes operations with delay greater than 2 and up to 35 sec per vehicle. These higher delays may result from fair progression, longer cycle lengths, or both. Individual cycle failures may begin to appear at this level. The number of vehicles stopping is significant at this level, though many still pass through the intersection without stopping. LOS D describes operations with delay greater than 35 and up to 55 sec per vehicle. At level D, the influence of congestion becomes more noticeable. Longer delays may result from some combination of unfavorable progression, long cycle lengths, or high v/c ratios. Many vehicles stop, and the proportion of vehicles not stopping declines. Individual cycle failures are noticeable. LOS E describes operations with delay greater than 55 and up to 8 sec per vehicle. This level is considered by many agencies to be the limit of acceptable delay. These high delay values generally indicate poor progression, long cycle lengths, and high v/c ratios. Individual cycle failures are frequent occurrences. LOS F describes operations with delay in excess of 8 sec per vehicle. This level, considered to be unacceptable to most drivers, often occurs with oversaturation, that is, when arrival flow rates exceed the capacity of the intersection. It may also occur at high v/c ratios below 1. with many individual cycle failures. Poor progression and long cycle lengths may also be major contributing causes to such delay levels. Source: Highway Capacity Manual, 2. Transportation Research Board, National Research Council
35 HCM Signalized Intersection Capacity Analysis Existing Conditions 1: Pontiac Trail & Walled Lake Drive AM Peak Hour Movement EBL EBT EBR WBL WBT WBR NBL NBT NBR SBL SBT SBR Lane Configurations Volume (vph) Ideal Flow (vphpl) Total Lost time (s) Lane Util. Factor Frt Flt Protected Satd. Flow (prot) Flt Permitted Satd. Flow (perm) Peak-hour factor, PHF Adj. Flow (vph) RTOR Reduction (vph) 16 3 Lane Group Flow (vph) Turn Type Split NA Split NA Perm NA NA Perm Protected Phases Permitted Phases 1 1 Actuated Green, G (s) Effective Green, g (s) Actuated g/c Ratio Clearance Time (s) Vehicle Extension (s) Lane Grp Cap (vph) v/s Ratio Prot.1 c.13 c.8.2 c.25 v/s Ratio Perm.18. v/c Ratio Uniform Delay, d Progression Factor Incremental Delay, d Delay (s) Level of Service C D D D B B B Approach Delay (s) Approach LOS D D B B Intersection Summary HCM 2 Control Delay 25.1 HCM 2 Level of Service C HCM 2 Volume to Capacity ratio.56 Actuated Cycle Length (s) 1. Sum of lost time (s) 18. Intersection Capacity Utilization 53.7% ICU Level of Service A Analysis Period (min) 15 c Critical Lane Group Walled Lake Apartments Synchro 8 Report Fleis & VandenBrink Engineering, Inc. 8/28/214
36 HCM Unsignalized Intersection Capacity Analysis Existing Conditions 2: Pontiac Trail & Common Street/Market Street AM Peak Hour Movement EBL EBT EBR WBL WBT WBR NBL NBT NBR SBL SBT SBR Lane Configurations Volume (veh/h) Sign Control Stop Stop Free Free Grade % % % % Peak Hour Factor Hourly flow rate (vph) Pedestrians Lane Width (ft) Walking Speed (ft/s) Percent Blockage Right turn flare (veh) Median type None None Median storage veh) Upstream signal (ft) 29 px, platoon unblocked vc, conflicting volume vc1, stage 1 conf vol vc2, stage 2 conf vol vcu, unblocked vol tc, single (s) tc, 2 stage (s) tf (s) p queue free % cm capacity (veh/h) Direction, Lane # EB 1 WB 1 NB 1 NB 2 SB 1 SB 2 Volume Total Volume Left Volume Right 2 3 csh Volume to Capacity Queue Length 95th (ft) 1 1 Control Delay (s) Lane LOS B B A Approach Delay (s) Approach LOS B B Intersection Summary Average Delay.2 Intersection Capacity Utilization 24.8% ICU Level of Service A Analysis Period (min) 15 Walled Lake Apartments Synchro 8 Report Fleis & VandenBrink Engineering, Inc. 8/28/214
37 HCM Unsignalized Intersection Capacity Analysis Existing Conditions 3: Pontiac Trail & Northport Street AM Peak Hour Movement EBL EBT EBR WBL WBT WBR NEL NET NER SWL SWT SWR Lane Configurations Volume (veh/h) Sign Control Stop Stop Free Free Grade % % % % Peak Hour Factor Hourly flow rate (vph) Pedestrians Lane Width (ft) Walking Speed (ft/s) Percent Blockage Right turn flare (veh) Median type None None Median storage veh) Upstream signal (ft) 58 px, platoon unblocked vc, conflicting volume vc1, stage 1 conf vol vc2, stage 2 conf vol vcu, unblocked vol tc, single (s) tc, 2 stage (s) tf (s) p queue free % cm capacity (veh/h) Direction, Lane # EB 1 WB 1 NE 1 NE 2 SW 1 SW 2 Volume Total Volume Left Volume Right 33 1 csh Volume to Capacity Queue Length 95th (ft) Control Delay (s) Lane LOS D B A Approach Delay (s) Approach LOS D B Intersection Summary Average Delay 1.5 Intersection Capacity Utilization 38.2% ICU Level of Service A Analysis Period (min) 15 Walled Lake Apartments Synchro 8 Report Fleis & VandenBrink Engineering, Inc. 8/28/214
38 HCM Unsignalized Intersection Capacity Analysis Existing Conditions 4: Pontiac Trail & Nicolet Street AM Peak Hour Movement WBL WBR NBT NBR SBL SBT Lane Configurations Volume (veh/h) Sign Control Stop Free Free Grade % % % Peak Hour Factor Hourly flow rate (vph) Pedestrians 1 Lane Width (ft) 12. Walking Speed (ft/s) 4. Percent Blockage Right turn flare (veh) Median type None None Median storage veh) Upstream signal (ft) 13 px, platoon unblocked vc, conflicting volume vc1, stage 1 conf vol vc2, stage 2 conf vol vcu, unblocked vol tc, single (s) tc, 2 stage (s) tf (s) p queue free % cm capacity (veh/h) Direction, Lane # WB 1 NB 1 NB 2 SB 1 SB 2 Volume Total Volume Left 2 25 Volume Right 18 1 csh Volume to Capacity Queue Length 95th (ft) 2 2 Control Delay (s) Lane LOS B A Approach Delay (s) Approach LOS B Intersection Summary Average Delay.4 Intersection Capacity Utilization 38.6% ICU Level of Service A Analysis Period (min) 15 Walled Lake Apartments Synchro 8 Report Fleis & VandenBrink Engineering, Inc. 8/28/214
39 HCM Unsignalized Intersection Capacity Analysis Existing Conditions 5: Walled Lake Drive & Witherall Street AM Peak Hour Movement EBL EBT WBT WBR SBL SBR Lane Configurations Volume (veh/h) Sign Control Free Free Stop Grade % % % Peak Hour Factor Hourly flow rate (vph) Pedestrians 1 Lane Width (ft) 12. Walking Speed (ft/s) 4. Percent Blockage Right turn flare (veh) Median type None None Median storage veh) Upstream signal (ft) 848 px, platoon unblocked.89 vc, conflicting volume vc1, stage 1 conf vol vc2, stage 2 conf vol vcu, unblocked vol tc, single (s) tc, 2 stage (s) tf (s) p queue free % cm capacity (veh/h) Direction, Lane # EB 1 WB 1 SB 1 Volume Total Volume Left 42 Volume Right 8 6 csh Volume to Capacity Queue Length 95th (ft) 11 Control Delay (s) Lane LOS C Approach Delay (s) Approach LOS C Intersection Summary Average Delay.9 Intersection Capacity Utilization 34.4% ICU Level of Service A Analysis Period (min) 15 Walled Lake Apartments Synchro 8 Report Fleis & VandenBrink Engineering, Inc. 8/28/214
40 HCM Unsignalized Intersection Capacity Analysis Existing Conditions 6: Walled Lake Drive & Hillcroft Drive AM Peak Hour Movement EBL EBT WBT WBR SBL SBR Lane Configurations Volume (veh/h) Sign Control Free Free Stop Grade % % % Peak Hour Factor Hourly flow rate (vph) Pedestrians Lane Width (ft) Walking Speed (ft/s) Percent Blockage Right turn flare (veh) Median type None None Median storage veh) Upstream signal (ft) 1134 px, platoon unblocked.91 vc, conflicting volume vc1, stage 1 conf vol vc2, stage 2 conf vol vcu, unblocked vol tc, single (s) tc, 2 stage (s) tf (s) p queue free % cm capacity (veh/h) Direction, Lane # EB 1 WB 1 SB 1 Volume Total Volume Left 8 Volume Right 1 csh Volume to Capacity Queue Length 95th (ft) 2 Control Delay (s) Lane LOS C Approach Delay (s) Approach LOS C Intersection Summary Average Delay.2 Intersection Capacity Utilization 35.8% ICU Level of Service A Analysis Period (min) 15 Walled Lake Apartments Synchro 8 Report Fleis & VandenBrink Engineering, Inc. 8/28/214
41 HCM Signalized Intersection Capacity Analysis Existing Conditions 1: Pontiac Trail & Walled Lake Drive PM Peak Hour Movement EBL EBT EBR WBL WBT WBR NBL NBT NBR SBL SBT SBR Lane Configurations Volume (vph) Ideal Flow (vphpl) Total Lost time (s) Lane Util. Factor Frpb, ped/bikes Flpb, ped/bikes Frt Flt Protected Satd. Flow (prot) Flt Permitted Satd. Flow (perm) Peak-hour factor, PHF Adj. Flow (vph) RTOR Reduction (vph) Lane Group Flow (vph) Confl. Peds. (#/hr) 1 1 Turn Type Split NA Split NA Perm NA NA Perm Protected Phases Permitted Phases 1 1 Actuated Green, G (s) Effective Green, g (s) Actuated g/c Ratio Clearance Time (s) Vehicle Extension (s) Lane Grp Cap (vph) v/s Ratio Prot.1 c.4.14 c v/s Ratio Perm c.28.2 v/c Ratio Uniform Delay, d Progression Factor Incremental Delay, d Delay (s) Level of Service D D D D B B B Approach Delay (s) Approach LOS D D B B Intersection Summary HCM 2 Control Delay 25.1 HCM 2 Level of Service C HCM 2 Volume to Capacity ratio.56 Actuated Cycle Length (s) 1. Sum of lost time (s) 18. Intersection Capacity Utilization 61.% ICU Level of Service B Analysis Period (min) 15 c Critical Lane Group Walled Lake Apartments Synchro 8 Report Fleis & VandenBrink Engineering, Inc. 8/28/214
42 HCM Unsignalized Intersection Capacity Analysis Existing Conditions 2: Pontiac Trail & Common Street/Market Street PM Peak Hour Movement EBL EBT EBR WBL WBT WBR NBL NBT NBR SBL SBT SBR Lane Configurations Volume (veh/h) Sign Control Stop Stop Free Free Grade % % % % Peak Hour Factor Hourly flow rate (vph) Pedestrians Lane Width (ft) Walking Speed (ft/s) Percent Blockage Right turn flare (veh) Median type None None Median storage veh) Upstream signal (ft) 29 px, platoon unblocked vc, conflicting volume vc1, stage 1 conf vol vc2, stage 2 conf vol vcu, unblocked vol tc, single (s) tc, 2 stage (s) tf (s) p queue free % cm capacity (veh/h) Direction, Lane # EB 1 WB 1 NB 1 NB 2 SB 1 SB 2 Volume Total Volume Left Volume Right csh Volume to Capacity Queue Length 95th (ft) 4 3 Control Delay (s) Lane LOS B C A Approach Delay (s) Approach LOS B C Intersection Summary Average Delay.4 Intersection Capacity Utilization 29.8% ICU Level of Service A Analysis Period (min) 15 Walled Lake Apartments Synchro 8 Report Fleis & VandenBrink Engineering, Inc. 8/28/214
43 HCM Unsignalized Intersection Capacity Analysis Existing Conditions 3: Pontiac Trail & Northport Street PM Peak Hour Movement EBL EBT EBR WBL WBT WBR NEL NET NER SWL SWT SWR Lane Configurations Volume (veh/h) Sign Control Stop Stop Free Free Grade % % % % Peak Hour Factor Hourly flow rate (vph) Pedestrians Lane Width (ft) Walking Speed (ft/s) Percent Blockage Right turn flare (veh) Median type None None Median storage veh) Upstream signal (ft) 583 px, platoon unblocked vc, conflicting volume vc1, stage 1 conf vol vc2, stage 2 conf vol vcu, unblocked vol tc, single (s) tc, 2 stage (s) tf (s) p queue free % cm capacity (veh/h) Direction, Lane # EB 1 WB 1 NE 1 NE 2 SW 1 SW 2 Volume Total Volume Left 9 71 Volume Right csh Volume to Capacity Queue Length 95th (ft) 23 6 Control Delay (s) Lane LOS B B A Approach Delay (s) Approach LOS B B Intersection Summary Average Delay 1.7 Intersection Capacity Utilization 58.7% ICU Level of Service B Analysis Period (min) 15 Walled Lake Apartments Synchro 8 Report Fleis & VandenBrink Engineering, Inc. 8/28/214
REDEVELOPMENT TRAFFIC IMPACT STUDY
 REDEVELOPMENT TRAFFIC IMPACT STUDY For Wendy s Parker, Colorado January 215 Prepared for: Sterling Design Associates, LLC 29 W. Littleton Boulevard #3 Littleton, Colorado 812 Prepared by: 1233 Airport
James M. Moore, Director of Planning & Building Services, Town of Fairfax. Victory Village Senior Housing Development Traffic Study
 Traffic Study To: From: James M. Moore, Director of Planning & Building Services, Town of Fairfax David Parisi, PE, TE, Parisi Transportation Consulting Date: October 14, 216 Subject: Victory Village Senior
Traffic Impact Study. Crestline Piggly Wiggly Mountain Brook, Alabama. Goodwyn, Mills and Cawood, Inc. Birmingham, Alabama.
 Traffic Impact Study Crestline Piggly Wiggly Mountain Brook, Alabama Prepared for: Goodwyn, Mills and Cawood, Inc. Birmingham, Alabama September 214 Revision 1 October 214 Crestline Piggly Wiggly Mountain
HUMC/Mountainside Hospital Redevelopment Plan
 Traffic and Parking Analysis HUMC/Mountainside Hospital Redevelopment Plan in Glen Ridge Borough and Montclair Township PREPARED FOR H2M 119 Cherry Hill Road, Suite 11 Parsippany, NJ 754 862.27.59 PREPARED
February 13, Mr. Chuck Marshall Stewart's Shops Corp. PO Box 435 Saratoga Springs, NY 12866
 February 13, 2017 Mr. Chuck Marshall Stewart's Shops Corp. PO Box 435 Saratoga Springs, NY 12866 Re: Modified Entrance Layout - Revised Traffic Assessment and Sight Distance Analysis Proposed Stewart's
George Street Transportation Impact Study. Paradigm Transportation Solutions Limited
 George Transportation Impact Study Paradigm Transportation Solutions Limited January 217 Project Summary Project Number 16191 January 217 Client Wastell Homes 5-1895 Blue Heron Drive London ON N6H 5L9
Bistro 6. City of Barrie. Traffic Impact Study for Pratt Hansen Group Inc. Type of Document: Final Report. Project Number: JDE 1748
 City of Barrie Traffic Impact Study for Pratt Hansen Group Inc. Type of Document: Final Report Project Number: JDE 1748 Date Submitted: June 12 th, 2017 06/12/17 John Northcote, P.Eng. Professional License
Travel Demand Management Plan
 Travel Demand Management Plan Linden Corner at 43 rd Street & Upton Avenue South AUTHORIZED PROPERTY REPRESENTATIVE: By Dated: Mark Dwyer Linden Hills Redevelopment, LLC 4632 Washburn Avenue South Minneapolis,
Student Housing Development
 Traffic Impact Study for the proposed Student Housing Development City of Oneonta Otsego County, New York Project No. 3259 December 212 Revised February 13, 212 Prepared For: Newman Development Group,
Michigan Avenue Traffic Study
 City of Sarnia Michigan Avenue Traffic Study Final Report November 29, 218 B17 SUBMITTED BY CIMA CANADA INC. 4 327 Harvester Road Burlington, ON L7N 3G7 T 289 288-287 F 289 288-285 cima.ca CONTACT Stephen
9 Leeming Drive Redevelopment Ottawa, ON Transportation Brief. Prepared By: Stantec Consulting Ltd.
 9 Leeming Drive Redevelopment Ottawa, ON Transportation Brief Prepared By: Stantec Consulting Ltd. TIA GUIDELINES CHECKLIST Report Context Municipal Address Comment: Section 1.1 Location relative to major
The proposed development is located within 800m of an existing Transit Station where infill developments and intensification are encouraged.
 Stantec Consulting Ltd. 1331 Clyde Avenue, Suite 4 Ottawa ON K2C 3G4 Tel: (613) 722-442 Fax: (613) 722-2799 May 14, 213 File: 1638823 Robinson Park Development Corp. 5699 Power Road Ottawa, ON, K1G 3N4
Place Vanier 250 Montreal Road Transportation Impact Study Addendum. Prepared for Broccolini Construction September 20 th, 2012
 Update for the May 31 st, 2012 Traffic Impact Study Prepared for Broccolini Construction 111-23596-00 September 20 th, 2012 2611 Queensview Drive, Suite 300, Ottawa, Ontario CANADA K2B 8K2 Telephone: 613-829-2800
Syracuse University University Place Road Closure
 Transportation Impact Study for the proposed Syracuse University University Place Road Closure City of Syracuse, Onondaga County, NY March 216 Project No. 3613 Prepared For: Syracuse University Office
STRATEGY 4 INC Mainway, City of Burlington. [ Month Year ] Project No.: TRAFFIC IMPACT AND PARKING STUDY APRIL 2018
![STRATEGY 4 INC Mainway, City of Burlington. [ Month Year ] Project No.: TRAFFIC IMPACT AND PARKING STUDY APRIL 2018](/thumbs/96/127235543.jpg "STRATEGY 4 INC Mainway, City of Burlington. [ Month Year ] Project No.: TRAFFIC IMPACT AND PARKING STUDY APRIL 2018") STRATEGY 4 INC. TRAFFIC IMPACT AND PARKING STUDY 3257 Mainway, City of Burlington Project No.: 27-675 APRIL 28 [ Month Year ] April 7, 28 Reference No. 27-675 Mr. Jeff Kenny Strategy 4 Inc. 262 Bristol
STRATEGY 4 INC. TRAFFIC IMPACT AND PARKING STUDY 3257 Mainway, City of Burlington Project No.: 27-675 APRIL 28 [ Month Year ] April 7, 28 Reference No. 27-675 Mr. Jeff Kenny Strategy 4 Inc. 262 Bristol
February 24, 2017 Project #: 20076
 February 24, 217 Project #: 276 Jinde Zhu Washington County Department of Land Use and Transportation 14 SW Walnut Street MS 17 Hillsboro, Oregon 97213 RE: Sunset Ridge Phase 2 Access Report and Zone Change
EXECUTIVE SUMMARY. Page 1 of 6
 EXECUTIVE SUMMARY The purpose of this report is to identify conformance with the original traffic impact study for the proposed retail development on Lot 5 of Riverdale Retail Filing No. 1 located on the
Technical Memo. Steve Gramm, SDDOT. RE: Phase 1, Task 100: Baseline Analysis. To: From: Steve Hoff, HDR Engineering, Inc.
 Technical Memo To: Steve Gramm, SDDOT From: Steve Hoff, Engineering, Inc. Project: I-190/Silver Street Study CC: Date: 6//010 Job No: DOT Contract 41044, Order PD-0-09 RE: Phase 1, Task 100: Baseline Analysis
CENTRAL TRANSPORTATION PLANNING STAFF MEMORANDUM
 CTPS CENTRAL TRANSPORTATION PLANNING STAFF Staff to the Boston Region Metropolitan Planning Organization MEMORANDUM To: Thomas Cummings February 17, 2011 Holbrook Public Works Superintendent From: Re:
TRAFFIC IMPACT REPORT CASTLE PINES APARTMENTS CASTLE PINES, COLORADO
 TRAFFIC IMPACT REPORT CASTLE PINES APARTMENTS CASTLE PINES, COLORADO APRIL 12, 218 REV. JULY 16, 218 Prepared for: Davis Development 43 Corporate Center Dr Suite 21 Stockbridge, GA 3281 Prepared by: 112
SUNY Uptown Campus and Harriman State Office Campus Traffic Impact Study for the Emerging Technology and Entrepreneurship Complex (ETEC) Building
 Building") SUNY Uptown Campus and Harriman State Office Campus Traffic Impact Study for the Emerging Technology and Entrepreneurship Complex (ETEC) Building State University of New York at Albany City of Albany,
SUNY Uptown Campus and Harriman State Office Campus Traffic Impact Study for the Emerging Technology and Entrepreneurship Complex (ETEC) Building State University of New York at Albany City of Albany,
LIBERTY TREE ACADEMY TRAFFIC IMPACT STUDY
 LIBERTY TREE ACADEMY TRAFFIC IMPACT STUDY Prepared for: Liberty Tree Academy Prepared by: 161 Blake Street, Suite 2 Denver, Colorado 822 Contact: David Kline, PE, PTOE (33)-572-2 On Behalf of: Liberty
joint access drive. will be
 Date: To: From: Subject: June 22, 2015 Bradley Reiner, PE Bowman Consulting David R. Kline, PE, PTOE, Incline Associates Thornton Self-Storage Traffic Analysis (DRAFT) - Thornton, Colorado INTRODUCTION
Bank Street Retail/Hotel Development
 M a y 214 89-9 Bank Street Retail/Hotel Development Transportation Brief Google 214 Bing 214 Prepared for: Prepared by: Study 89-9 Type Bank Street May 214 Study Retail/Hotel Name Development February
Traffic Impact Study, Premier Gold Mines Limited, Hardrock Property
 Traffic Impact Study, Premier Gold Mines Limited, Hardrock Property Prepared for: Premier Gold Mines Limited Prepared by: Stantec Consulting Ltd. November 2014
Walmart (Store # ) 60 th Street North and Marion Road Sioux Falls, South Dakota
 60 th Street North and Marion Road Sioux Falls, South Dakota") Walmart (Store #4865-00) 60 th Street North and Marion Road Sioux Falls, South Dakota Prepared for: Wal-Mart Stores, Inc. Bentonville, Arkansas Prepared by: Kimley-Horn and Associates, Inc. ã2013 Kimley-Horn
Walmart (Store #4865-00) 60 th Street North and Marion Road Sioux Falls, South Dakota Prepared for: Wal-Mart Stores, Inc. Bentonville, Arkansas Prepared by: Kimley-Horn and Associates, Inc. ã2013 Kimley-Horn
INDUSTRIAL BUILDING 3009 HAWTHORNE ROAD CITY OF OTTAWA TRANSPORTATION OVERVIEW REVISED. Prepared for: Canada Inc.
 INDUSTRIAL BUILDING 3009 HAWTHORNE ROAD CITY OF OTTAWA TRANSPORTATION OVERVIEW REVISED Prepared for: 7849648 Canada Inc. Octiober 1, 2015 114-598 Overview_2.doc D. J. Halpenny & Associates Ltd. Consulting
Alfred Street Baptist Church (301 Alfred Street) Supplemental Traffic Analysis Based on Comments Received at Meeting on November 16, 2016
 Supplemental Traffic Analysis Based on Comments Received at Meeting on November 16, 2016") To: Cc: From: Re: Subject: Ravindra Raut City of Alexandria, VA Bob Garbacz Katye North City of Alexandria, VA Larry Sefcik Grady Vaughan, EIT Wells + Associates, Inc. (31 Alfred Street) Supplemental Traffic
To: Cc: From: Re: Subject: Ravindra Raut City of Alexandria, VA Bob Garbacz Katye North City of Alexandria, VA Larry Sefcik Grady Vaughan, EIT Wells + Associates, Inc. (31 Alfred Street) Supplemental Traffic
OFFICE/RETAIL DEVELOPMENT 1625 BANK STREET OTTAWA, ONTARIO TRANSPORTATION BRIEF. Prepared for: Canada Inc.
 OFFICE/RETAIL DEVELOPMENT 1625 BANK STREET OTTAWA, ONTARIO TRANSPORTATION BRIEF Prepared for: 9402209 Canada Inc. December 15, 2015 115-625 Report_2.doc D. J. Halpenny & Associates Ltd. Consulting Transportation
Arterial Traffic Analysis Some critical concepts. Prepared by Philip J. Tarnoff
 Arterial Traffic Analysis Some critical concepts Prepared by Philip J. Tarnoff Agenda Fundamentals Signal timing concepts Actuated signal controllers Developing timing plans Types of signal control First
February 8, Ms. Jamie Jun, Esq. Fromhold Jaffe & Adams 789 East Lancaster Avenue, Suite 220 Villanova, PA 19085
 WWW.TRAFFICPD.COM February 8, 2016 Ms. Jamie Jun, Esq. Fromhold Jaffe & Adams 789 East Lancaster Avenue, Suite 220 Villanova, PA 19085 Re: Kohelet Yeshiva School Lower Merion Township, Montgomery County,
Traffic Impact Analysis Chatham County Grocery Chatham County, NC
 Chatham County Grocery Chatham County, NC TABLE OF CONTENTS 1. INTRODUCTION... 1 1.1. Location and Study Area... 1 1.2. Proposed Land Use and Access... 2 1.3. Adjacent Land Uses... 2 1.4. Existing ways...
Prepared for Lutheran Services Carolinas. Project Number: /07/2017. Trinity Landing. New Hanover County, NC
 Prepared for Lutheran Services Carolinas Project Number: 16273 4/7/217 Trinity Landing New Hanover County, NC Trinity Landing Transportation Impact nalysis Prepared for Lutheran Services Carolinas New
Oregon Country Fair Events
 Oregon Country Fair Events Traffic Impact Analysis Lane County, Oregon September, 5 Oregon Country Fair Events Traffic Impact Analysis. Introduction The purpose of this report is to provide a Traffic Impact
ENKA INTERMEDIATE SCHOOL
 TRANSPORTATION IMPACT ANALYSIS Prepared for Buncombe County Schools ENKA INTERMEDIATE SCHOOL Asheville, NC Project Number: 13-71 8/1/13 www.davenportworld.com DAVENlORT Transportation Impact Analysis Enka
Signal Warrant Studies
 Signal Warrant Studies Seven Locations Piqua, Ohio December 12, 217 Signal Warrant Studies Seven Locations Piqua, Ohio TABLE OF CONTENTS Executive Summary... 3 Introduction... 5 Study Location... 5 Data
Traffic Impact Study WestBranch Residential Development Davidson, NC March 2016
 Traffic Impact Study WestBranch Residential Development Davidson, NC March 216 TRAFFIC IMPACT STUDY FOR THE WestBranch Residential Development LOCATED IN DAVIDSON, NC Prepared For: Lennar Carolinas, LLC
Traffic Impact Analysis Walton Acres at Riverwood Athletic Club Clayton, NC
 Traffic Impact Analysis Walton Acres at Riverwood Athletic Club Clayton, NC 1. TABLE OF CONTENTS INTRODUCTION...1 1.1. Site Location and Study Area...1 1.2. Proposed Land Use and Site Access...2 1.3.
Multnomah County Courthouse Relocation. Transportation Alternatives Analysis Technical Memorandum: FINAL
 Multnomah County Courthouse Relocation Portland, Oregon Transportation Alternatives Analysis Technical Memorandum: FIL Prepared for Multnomah County Facilities and Property Management Division 41 N Dixon
HILTON GARDEN INN HOTEL HOTEL EXPANSION 2400 ALERT ROAD, OTTAWA TRANSPORTATION BRIEF. Prepared for:
 HILTON GARDEN INN HOTEL HOTEL EXPANSION 2400 ALERT ROAD, OTTAWA TRANSPORTATION BRIEF Prepared for: Bona Building & Management Co. Ltd. Place Vanier, 333 North River Road Vanier, Ontario K1L 8B9 October
HOLIDAY INN HOTEL 235 KING EDWARD AVENUE CITY OF OTTAWA TRANSPORTATION BRIEF. Prepared for:
 HOLIDAY INN HOTEL 235 KING EDWARD AVENUE CITY OF OTTAWA TRANSPORTATION BRIEF Prepared for: Momentum Planning & Communications 1165 Greenlawn Crescent Ottawa, ON K1L 6C2 June 29, 2015 115-618 Brief_1.doc
FAIRFIELD INN & SUITES HOTEL 135 THAD JOHNSON PRIVATE OTTAWA TRANSPORTATION BRIEF. Prepared for:
 FAIRFIELD INN & SUITES HOTEL 135 THAD JOHNSON PRIVATE OTTAWA TRANSPORTATION BRIEF Prepared for: Bona Building & Management Co. Ltd. Place Vanier, 333 North River Road Vanier, Ontario K1L 8B9 August 12,
Chapter Capacity and LOS Analysis of a Signalized I/S Overview Methodology Scope Limitation
 Chapter 37 Capacity and LOS Analysis of a Signalized I/S 37.1 Overview The Highway Capacity Manual defines the capacity as the maximum howdy rate at which persons or vehicle can be reasonably expected
6060 North Central Expressway Mixed-Use Site Dallas, Texas
 Volume 1 Traffic Impact Analysis 6060 North Central Expressway Mixed-Use Site Dallas, Texas April 30, 2018 Kimley-Horn and Associates, Inc. Dallas, Texas Project #063238300 Registered Firm F-928 Traffic
4. Include the associated years anticipated for the short term and long term analysis in the
 2nd DE Review SM ROCHA, LLC responses to City comments are provided within. 8. Trip distribution is displayed in Figure 6. Distribution assumes SFA and commercial traffic combined for most conservative
TRAFFIC ASSESSMENT River Edge Colorado
 TRAFFIC ASSESSMENT River Edge Colorado Submitted by: Fehr & Peers 621 17th Street, Ste. 231 Denver, CO 8293 (33) 296-43 December, 21 App. M-2 Traffic Assessment River Edge Colorado December 21 TABLE OF
Table of Contents FIGURES TABLES APPENDICES. Traffic Impact Study Hudson Street Parking Garage MC Project No.: A Table of Contents
 Traffic Impact Study Hudson Street Parking Garage MC Project No.: 151714A Table of Contents Table of Contents I. INTRODUCTION... 2 II. EXISTING CONDITIONS... 5 III. 215 EXISTING TRAFFIC CONDITIONS... 6
ATTACHMENT A EXISTING TRAFFIC ENVIRONMENT
 ATTACHMENT A EXISTING TRAFFIC ENVIRONMENT a partnership of EXISTING CONDITIONS AND OPPORTUNITIES REPORT Public Review Draft December 217 Bascom Avenue Complete Streets Study Existing Data Review: Traffic
Traffic Impact Study Little Egypt Road Development Denver, North Carolina June 2017
 Traffic Impact Study Little Egypt Road Development Denver, North arolina June 2017 N. Little Egypt Road DQ\ QDQFLQJ VDOHV RU RWKHU SHUIRUPDQFH EDVHG FULWHULD Proposed Site Driveways Site Driveway 1 TRAFFI
Traffic Circulation Study for Neighborhood Southwest of Mockingbird Lane and Airline Road, Highland Park, Texas
 ARIZONA TEXAS NEW MEXICO OKLAHOMA February 13, 2015 Mr. Meran Dadgostar P.E., R.S. Town of Highland Park 4700 Drexel Dr. Highland Park, Texas 75205 Re: Traffic Circulation Study for Neighborhood Southwest
CENTRAL TRANSPORTATION PLANNING STAFF MEMORANDUM
 CTPS CENTRAL TRANSPORTATION PLANNING STAFF Staff to the Boston Region Metropolitan Planning Organization MEMORANDUM To: Martha White, Natick Town Administrator February 17, 2011 Eric Nascimento, MassDOT
INDUSTRIAL BUILDING 1660 COMSTOCK ROAD CITY OF OTTAWA TRANSPORTATION OVERVIEW. Prepared for:
 INDUSTRIAL BUILDING 1660 COMSTOCK ROAD CITY OF OTTAWA TRANSPORTATION OVERVIEW Prepared for: Simluc Contractors Limited 2550 Blackwell Street, Ottawa K1B 5R1 October 18, 2013 113-584 Overview_1.doc D. J.
MEETING FACILITY 2901 GIBFORD DRIVE CITY OF OTTAWA TRANSPORTATION BRIEF. Prepared for: Holiday Inn Express 2881 Gibford Drive Ottawa, ON K1V 2L9
 MEETING FACILITY 2901 GIBFORD DRIVE CITY OF OTTAWA TRANSPORTATION BRIEF Prepared for: Holiday Inn Express 2881 Gibford Drive Ottawa, ON K1V 2L9 December 18, 2012 112-566 Brief_1.doc D. J. Halpenny & Associates
APARTMENT BUILDING DEVELOPMENT 1161 HERON ROAD OTTAWA, ONTARIO TRANSPORTATION IMPACT STUDY. Prepared for:
 APARTMENT BUILDING DEVELOPMENT 1161 HERON ROAD OTTAWA, ONTARIO TRANSPORTATION IMPACT STUDY Prepared for: 1649362 Ontario Inc. c/o Manor Park Management 231 Brittany Drive, Suite D Ottawa ON K1K 0R8 July
S. Johnston (IBI Group)
") IBI GROUP 100 175 Galaxy Boulevard Toronto ON M9W 0C9 Canada tel 416 679 1930 fax 416 675 4620 ibigroup.com Memorandum To/Attention Project File Date October 15, 2013 From A. Ortlieb Project No 24RX12.0246.00
IBI GROUP 100 175 Galaxy Boulevard Toronto ON M9W 0C9 Canada tel 416 679 1930 fax 416 675 4620 ibigroup.com Memorandum To/Attention Project File Date October 15, 2013 From A. Ortlieb Project No 24RX12.0246.00
ATTACHMENT B: SYNCHRO HCM CAPACITY ANALYSIS OUTPUT
 ATTACHMENT B: SYNCHRO HCM CAPACITY ANALYSIS OUTPUT 1: T:ine Boulevard &Grann:i White Pike AM Existing Conditions.,J- +- -+ t of '- ~ t ~ \.!,.I Lane Configurations Sign Control Volume (vph) 58 43 87 121
FRONT RANGE CROSSINGS TRAFFIC IMPACT STUDY
 FRONT RANGE CROSSINGS TRAFFIC IMPACT STUDY Prepared for: City of Thornton And Colorado Department of Transportation Prepared by: 11 Blake Street, Suite 2 Denver, Colorado 822 Contact: Brian Bern, PE, PTOE
TRAFFIC IMPACT STUDY And A TRAFFIC SIGNAL WARRANT ANALYSIS FOR A SENIOR LIVING AND APARTMENT DEVELOPMENT
 TRAFFIC IMPACT STUDY And A TRAFFIC SIGNAL WARRANT ANALYSIS FOR A SENIOR LIVING AND APARTMENT DEVELOPMENT DEERFIELD TOWNSHIP, WARREN COUNTY, OHIO Nantucket Circle and Montgomery Road () Prepared for: ODLE
TRAFFIC IMPACT STUDY
 675 Millcreek Drive, Unit 1 Mississauga, Ontario L5N 5M4 T: 416.213.7121 F: 95.89.8499 www.transtech.co TRAFFIC IMPACT STUDY PROPOSED MOSQUE DEVELOPMENT 4269 REGIONAL ROAD 25 TOWN OF OAKVILLE PREPARED
URBAN QUARRY HEADQUARTERS 2717 STEVENAGE DRIVE CITY OF OTTAWA TRANSPORTATION OVERVIEW. Prepared for: Urban Quarry 4123 Belgreen Drive, Ottawa K1G 3N2
 URBAN QUARRY HEADQUARTERS 2717 STEVENAGE DRIVE CITY OF OTTAWA TRANSPORTATION OVERVIEW Prepared for: Urban Quarry 4123 Belgreen Drive, Ottawa K1G 3N2 February 27, 2014 113-584 Overview_1.doc D. J. Halpenny
192 & 196 Bronson Avenue / 31 Cambridge Street
 Bronson Inc. July 213 192 & 196 Bronson Avenue / 31 Cambridge Street TRANSPORTATION BRIEF Prepared by: Study 192 Bronson Type Avenue July 213 Study Transportation Name Brief February 211 TB Check List
BOSTON REGION METROPOLITAN PLANNING ORGANIZATION
 PLANNING ORGANIZATIO BOSTON REGION MPO NMETROPOLITAN BOSTON REGION METROPOLITAN PLANNING ORGANIZATION Richard A. Davey, MassDOT Secretary and CEO and MPO Chairman Karl H. Quackenbush, Executive Direcr,
OTTAWA TRAIN YARDS PHASE 3 DEVELOPMENT CITY OF OTTAWA TRANSPORTATION IMPACT STUDY. Prepared for:
 OTTAWA TRAIN YARDS PHASE 3 DEVELOPMENT CITY OF OTTAWA TRANSPORTATION IMPACT STUDY Prepared for: The Ottawa Train Yards Inc. 223 Colonnade Road South, Suite 212 Nepean, Ontario K2E 7K3 January 17, 2012
ALLEY 24 TRAFFIC STUDY
 ALLEY 24 TRAFFIC STUDY in City of Frostburg, Maryland January 2013 3566 Teays Valley Road Hurricane, WV Office: (304) 397-5508 www.denniscorporation.com Alley 24 Traffic Study January 2013 Frostburg, Maryland
Evaluation of M-99 (Broad Street) Road Diet and Intersection Operational Investigation
 Road Diet and Intersection Operational Investigation") Evaluation of M-99 (Broad Street) Road Diet and Intersection Operational Investigation City of Hillsdale, Hillsdale County, Michigan June 16, 2016 Final Report Prepared for City of Hillsdale 97 North Broad
Evaluation of M-99 (Broad Street) Road Diet and Intersection Operational Investigation City of Hillsdale, Hillsdale County, Michigan June 16, 2016 Final Report Prepared for City of Hillsdale 97 North Broad
Henderson Avenue Mixed-Use Development
 Zoning Case: Z145-3 Traffic Impact Analysis Henderson Avenue Mixed-Use Development Dallas, TX October 26 th, 216 Kimley-Horn and Associates, Inc. Dallas, Texas Project #644827 Registered Firm F-928 Traffic
DUNBOW ROAD FUNCTIONAL PLANNING
 DUNBOW ROAD FUNCTIONAL PLANNING Final Report August 3, 216 #31, 316 5th Avenue NE Calgary, AB T2A 6K4 Phone: 43.273.91 Fax: 43.273.344 wattconsultinggroup.com Dunbow Road Functional Planning Final Report
TRAFFIC IMPACT STUDY. Creekside Thornton, Colorado. For. August 2015 November 2015 Revised: August Prepared for:
 TRAFFIC IMPACT STUDY For Creekside Thornton, Colorado August 215 November 215 Revised: August 216 Prepared for: Jansen Strawn Consulting Engineers 45 West 2 nd Avenue Denver, Colorado 8223 Prepared by:
Traffic Impact Study. Roderick Place Columbia Pike Thompson s Station, TN. Transportation Group, LLC Traffic Engineering and Planning
 F i s c h b a c h Transportation Group, LLC Traffic Engineering and Planning Traffic Impact Study Roderick Place Columbia Pike Thompson s Station, TN Prepared March 2016 Ms. Gillian L. Fischbach, P.E.,
Draft Report. Traffic Impact Study. Superstore, Wal-Mart, and Kent Development. Yarmouth, Nova Scotia. Prepared for
 oad & Traffic Management Road & Traffic Management R Atlantic Traffic Engineering Specialists Draft Report Traffic Impact Study Superstore, Wal-Mart, and Kent Development Yarmouth, Nova Scotia Prepared
Harbord Street and Hoskin Avenue (Queens Park Crescent to Ossington Avenue) Final Report
 Final Report") Consultant Services for Updating Intersections Operations to Accommodate Bi-Directional Cycle Tracks Harbord Street and Hoskin Avenue (Queens Park Crescent to Ossington Avenue) January 30, 2014 Consultant
Consultant Services for Updating Intersections Operations to Accommodate Bi-Directional Cycle Tracks Harbord Street and Hoskin Avenue (Queens Park Crescent to Ossington Avenue) January 30, 2014 Consultant
MEDICAL/OFFICE BUILDING 1637 BANK STREET OTTAWA, ONTARIO TRANSPORTATION OVERVIEW. Prepared for:
 MEDICAL/OFFICE BUILDING 1637 BANK STREET OTTAWA, ONTARIO TRANSPORTATION OVERVIEW Prepared for: 2434984 Ontario Inc. 13-5510 Canotek Road Ottawa, Ontario K1J 9J5 June 4, 2015 115-613 Report_2.doc D. J.
DRAFT Step 3 Roundabout Evaluation
 DRAFT Step 3 Roundabout Evaluation Geometric and Operational Analysis SR 655 (Recker Highway) at Thornhill Road Polk County, Florida Financial Management Number: 436560-1-22-01 Federal-Aid Project Number:
TRAFFIC IMPACT STUDY COMPREHENSIVE UPDATE TOWN OF THOMPSON S STATION, TENNESSEE PREPARED FOR: THE TOWN OF THOMPSON S STATION
 TRAFFIC IMPACT STUDY COMPREHENSIVE UPDATE TOWN OF THOMPSON S STATION, TENNESSEE PREPARED FOR: THE TOWN OF THOMPSON S STATION Transportation Consultants, LLC 1101 17 TH AVENUE SOUTH NASHVILLE, TN 37212
NO BUILD TRAFFIC OPERATIONS
 3. 23 NO BUILD TRAFFIC OPERATIONS This section addresses the operations of the transportation system and details how it would be expected to function under year 23 No Build conditions with the projected
Subject: Solberg Avenue / I-229 Grade Separation: Traffic Analysis
 MEMORANDUM Transportation Bill Troe, AICP Jason Carbee, AICP 12120 Shamrock Plaza Suite 300 Omaha, NE 68154 (402) 334-8181 (402) 334-1984 (Fax) To: Project File Date: Subject: Solberg Avenue / I-229 Grade
Project Report. South Kirkwood Road Traffic Study. Meadows Place, TX October 9, 2015
 Meadows Place, TX October 9, 2015 Contents 1 Introduction... 1 2 Data Collection... 1 3 Existing Roadway Network... 2 4 Traffic Volume Development... 2 5 Warrant Analysis... 3 6 Traffic Control Alternative
5858 N COLLEGE, LLC N College Avenue Traffic Impact Study
 5858 N COLLEGE, LLC nue Traffic Impact Study August 22, 2016 Contents Traffic Impact Study Page Preparer Qualifications... 1 Introduction... 2 Existing Roadway Conditions... 5 Existing Traffic Conditions...
EAST AND SOUTH STREET CITY OF ANAHEIM, CALIFORNIA
 T R A F F I C I M P A C T A N A LY S I S EAST AND SOUTH STREET CITY OF ANAHEIM, CALIFORNIA April 217 T R A F F I C I M P A C T A N A LY S I S EAST AND SOUTH STREET CITY OF ANAHEIM, CALIFORNIA Submitted
THIS PAGE LEFT BLANK INTENTIONALLY
 GA SR 25 Spur at Canal Road Transportation Impact Analysis PREPARED FOR GLYNN COUNTY, GEORGIA 1725 Reynolds Street, Suite 300 Brunswick, Georgia 31520 PREPARED BY 217 Arrowhead Boulevard Suite 26 Jonesboro,
Kanata North Catholic Elementary School
 December 216 Kanata North Catholic Elementary School Transportation Brief SITE Potential Future Development Trillium Woods Prepared for: Bryden Martel Architects Inc Prepared by: KANATA NORTH CATHOLIC
TRAFFIC IMPACT STUDY
 TRAFFIC IMPACT STUDY for the GLEN ELLEN COUNTRY CLUB SENIOR RESIDENTIAL REDEVELOPMENT 84 Millis, Massachusetts Prepared by: McMahon Associates, Inc. Prepared for: Toll Brothers, Inc. August 216 DRAFT
QUICKIE C STORE AND GAS BAR 1780 HERON ROAD OTTAWA, ONTARIO TRANSPORTATION BRIEF. Prepared for:
 QUICKIE C STORE AND GAS BAR 1780 HERON ROAD OTTAWA, ONTARIO TRANSPORTATION BRIEF Prepared for: Quickie Convenience Stores Larny Holdings Ltd. c/o PBC Group April 15, 2015 115-615 Report_1.doc D. J. Halpenny
Chapter 16: Traffic and Parking A. INTRODUCTION
 Chapter 6: Traffic and Parking A. ITRODUCTIO This chapter examines the potential traffic and parking impacts of the proposed Fresh Kills Park roads. The analysis of transit and pedestrians is presented
Road Conversion Study Plumas Street
 Plumas Street Phase I Submitted to The Regional Transportation Commission of Washoe County Submitted by Zong Tian, Ph.D., P.E. Saeedeh Farivar Haiyuan Li, Ph.D. Center for Advanced Transportation Education
METHODOLOGY. Signalized Intersection Average Control Delay (sec/veh)
") Chapter 5 Traffic Analysis 5.1 SUMMARY US /West 6 th Street assumes a unique role in the Lawrence Douglas County transportation system. This principal arterial street currently conveys commuter traffic
Chapter 5 Traffic Analysis 5.1 SUMMARY US /West 6 th Street assumes a unique role in the Lawrence Douglas County transportation system. This principal arterial street currently conveys commuter traffic
Troutbeck Farm Development
 Troutbeck Farm Development Willistown Township, Chester County PA For Submission To: Willistown Township Last Revised: October, 4 TPD# INLM.A. 5 E. High Street Suite 65 Pottstown, PA 9464 6.36.3 TPD@TrafficPD.com
Appendix G: Future Conditions Traffic Analysis Memorandum
 ppendix G: Future Conditions Traffic nalysis Memorandum Prepared by: Bolton & Menk, Inc. Riverfront Drive Corridor Study ǀ T42.867 ppendix MEMORNDUM Date: pril, 27 To: Paul Vogel From: Ross B. Tillman,
Figure 1: Vicinity Map of the Study Area
 ARIZONA TEXAS NEW MEXICO OKLAHOMA May 5, 2016 Mr. Anthony Beach, P.E. BSP Engineers 4800 Lakewood Drive, Suite 4 Waco, Texas 76710 Re: Intersection and Access Analysis along Business 190 in Copperas Cove
DRAFT Davidson Elementary School Expansion Transportation Impact Analysis
 DRAFT Davidson Elementary School Expansion Transportation Impact Analysis Prepared for: Town of Davidson 216 S. Main Street Davidson, NC 28036 Prepared by: Stantec Consulting Services Inc. 2127 Ayrsley
List of Attachments. Location Map... Site Plan... City of Lake Elsinore Circulation Element... City of Lake Elsinore Roadway Cross-Sections...
 List of Attachments Exhibits Location Map... Site Plan... City of Lake Elsinore Circulation Element... City of Lake Elsinore Roadway Cross-Sections... Existing Lane Geometry and Traffic Controls... Existing
ORLEANS GARDENS SHOPPING CENTRE 1615 ORLEANS BOULEVARD CITY OF OTTAWA, ONTARIO TRANSPORTATION IMPACT STUDY. Prepared for:
 ORLEANS GARDENS SHOPPING CENTRE 1615 ORLEANS BOULEVARD CITY OF OTTAWA, ONTARIO TRANSPORTATION IMPACT STUDY Prepared for: Orleans Gardens Shopping Centre Inc. 2851 John Street, Suite 1 Markham, ON K3R 5R7
FAIRFIELD - RYAN S CORNER TRAFFIC IMPACT ANALYSIS LOUDOUN COUNTY, VIRGINIA
 FAIRFIELD - RYAN S CORNER TRAFFIC IMPACT ANALYSIS LOUDOUN COUNTY, VIRGINIA Submitted on behalf of: Fairfield Residential Prepared by: Wells + Associates, Inc. 1420 Spring Hill Road, Suite 00 McLean, Virginia
PRELIMINARY DRAFT WADDLE ROAD / I-99 INTERCHANGE PROJECT ALTERNATIVE ANALYSIS FINAL TRAFFIC SUMMARY REPORT
 PRELIMINARY DRAFT WADDLE ROAD / I-99 INTERCHANGE PROJECT ALTERNATIVE ANALYSIS FINAL TRAFFIC SUMMARY REPORT Prepared by: In Association with: November 2013 EXECUTIVE SUMMARY Patton Township, in partnership
URBAN STREET CONCEPTS
 CHAPTER 10 URBAN STREET CONCEPTS CONTENTS I. INTRODUCTION... 10-1 II. URBAN STREETS...10-1 Flow Characteristics... 10-3 Free-Flow Speed...10-3 Running Speed... 10-3 Travel Speed... 10-4 Time-Space Trajectory...10-4
Appendices. Appendix J: Traffic Study
 Appendices Appendix J: Traffic Study The Platinum Triangle Subsequent EIR The Planning Center Appendices This page intentionally left blank. The Platinum Triangle Subsequent EIR The Planning Center TRAFFIC
An Evaluation of Signalized Intersection System Analysis Techniques Walter J. Freeman, P.E., Kien Y. Ho, P.E., Elizabeth A. McChesney, E.I.T.
 An Evaluation of Signalized Intersection System Analysis Techniques Walter J. Freeman, P.E., Kien Y. Ho, P.E., Elizabeth A. McChesney, E.I.T. A system of signalized intersections is a critical element
25 May 2018 OUR REF:
 25 May 2018 OUR REF: 476088-01000 Roderick Lahey Architect Inc. 56 Beech Street Ottawa, ON K1S 3J6 Attention: Robert Verch Dear Rob: Re: 929 Richmond Road Transportation Impact Assessment Addendum #1 1.
Average Delay/Vehicle (sec/veh) Signalized. Unsignalized Intersection
 Signalized. Unsignalized Intersection") Attachment: Traffic Analysis Results Traffic simulation modeling analysis was completed for Santa Cruz Ave from Alameda De Las Pulgas to Junipero Serra Blvd. Analysis was performed for existing conditions
Attachment: Traffic Analysis Results Traffic simulation modeling analysis was completed for Santa Cruz Ave from Alameda De Las Pulgas to Junipero Serra Blvd. Analysis was performed for existing conditions
Chapter 4 Traffic Analysis
 Chapter 4 Traffic Analysis PURPOSE The traffic analysis component of the K-68 Corridor Management Plan incorporates information on the existing transportation network, such as traffic volumes and intersection