ATTACHMENT A EXISTING TRAFFIC ENVIRONMENT
|
|
|
- Kathryn McCarthy
- 5 years ago
- Views:
Transcription


1 ATTACHMENT A EXISTING TRAFFIC ENVIRONMENT a partnership of EXISTING CONDITIONS AND OPPORTUNITIES REPORT Public Review Draft December 217


2 Bascom Avenue Complete Streets Study Existing Data Review: Traffic Environment FINAL November 28, 217
3
4 FINAL-Bascom Corridor Complete Streets Study Existing Data Review: Traffic Environment Table of Contents 1. Purpose & Complete Street Study Context Existing Physical Charactistics Motor Vehicle Traffic Volumes & Capacities Traffic Safety Summary Figures Figure 1. Examples of Complete Street Amenities... 1 Figure 2. Study Corridor Segment Map... 3 Figure 3. Typical Cross-section: North Bascom Avenue... 7 Figure 4. Typical Cross-section: South Bascom Urban Village... 8 Figure 5. Typical Cross-section: South Bascom Avenue near SR Figure 6. Daily Traffic Volumes by Segment Figure 7. Existing Traffic Level of Service Map AM Peak Hour Figure 8. Existing Traffic Level of Service Map PM Peak Hour Figure 9. Collision Map Figure 1. Pedestrian Collisions Figure 11. Bicycle Collisions... 2 Tables Table 1. Typical Roadway Characteristics by Segment... 6 Table 2. Existing Daily Traffic Volumes & Capacities Table 3. Peak Hour Traffic Level of Service Definitions at Intersections Table 4. Collision Characteristics by Mode & Type of Injury Appendix Appendix A. Study Intersection Level of Service Output Sheets Page i
5

 as relevant to the key goals of the Bascom Corridor Complete Streets")


6 FINAL-Bascom Corridor Complete Streets Study Existing Data Review: Traffic Environment 1. PURPOSE & COMPLETE STREET STUDY CONTEXT This report summarizes existing street and traffic conditions on the Bascom Avenue corridor between Interstate 88 (I-88) and State Route 85 (SR-85) as relevant to the key goals of the Bascom Corridor Complete Streets Study planning effort. The term Complete Streets generally refers to a balanced, multimodal transportation network that meets the needs of all users of streets, including bicyclists, children, persons with disabilities, motorists, movers of commercial goods, pedestrians, public transportation, and seniors. A Complete Street is one that provides safe and convenient travel in a manner that is suitable to the local context. Figure 1 shows examples of complete street amenities. Figure 1. Examples of Complete Street Amenities Page 1


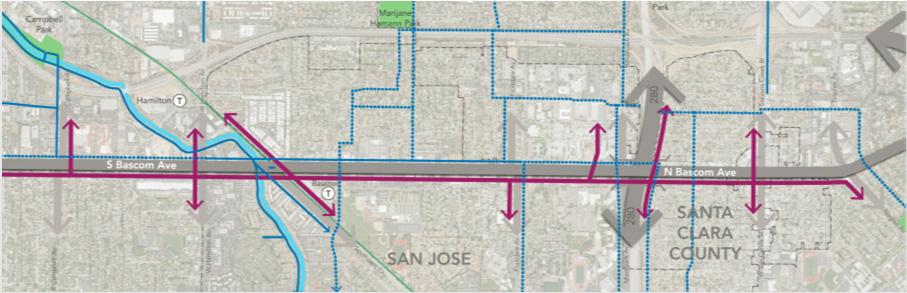
7 FINAL-Bascom Corridor Complete Streets Study Existing Data Review: Traffic Environment Land Use & Mobility Context The roughly five-mile study area includes segments within the cities of San Jose and Campbell, as well as several segments within the jurisdiction of Santa Clara County. Figure 2 provides a map of the study area and segments. General characteristics of the surrounding land use patterns include: Relatively low-density land use pattern, with one to two story buildings bordering much of the corridor, with the exception of higher-density nodes near Santa Clara Valley Medical Center/San Jose City College and some newer apartment buildings south of Hamilton Avenue. Internally focused site development pattern, as most adjacent properties were developed with buildings that are oriented towards on-site surface parking lots, generally not oriented towards street access by pedestrians or bicyclists. Minimal demand for on-street parking, except for some segments near the Santa Clara Valley Medical Center and San Jose City College. Most land uses bordering the corridor have an abundant supply of off-street parking. Given the development pattern, wide curb-to-curb width (seven lanes across, with three through lanes per direction on most segments), and lack of uninterrupted bicycle and pedestrian facilities, Bascom Avenue is not currently thought of as a complete street corridor. Nonetheless, the north-south orientation of Bascom Avenue could allow for a reconfigured street that would serve as a multimodal counterpart to State Route 17 (SR-17) between Los Gatos, Campbell and downtown San Jose. Actual traffic volumes are relatively low compared to its capacity, as described on the following pages. Page 2

8 FINAL-Bascom Corridor Complete Streets Study Existing Data Review: Traffic Environment Figure 2. Study Corridor Segment Map Page 3


9 FINAL-Bascom Corridor Complete Streets Study Existing Data Review: Traffic Environment Planning Goals A number of adopted plans are relevant to the study area and the goals of the complete streets planning effort including the following: General Plan Street Classifications for the cities of San Jose and Campbell, as well as Santa clara County, provide designations for Bascom Avenue within their General Plan street classifications and typologies: o Main Street segments (San Jose) - the San Jose General Plan classifies Bascom Avenue as a Main Street between Stevens Creek Boulevard-West San Carlos Street and Hamilton Avenue. o Connector Street segments (San Jose) remaining segments of Bascom Avenue within the City of San Jose study area are classified as a Connector Street north of Stevens Creek Boulevard-West San Carlos Street to Interstate 88 (I-88), as well as portions of Bascom Avenue south of Hamilton Avenue that are within the City of San Jose. Example of San Jose Main Street Potential Design including recommended lane widths. Example of San Jose Connector Street Potential Design including lane widths. o Arterial with Parkway concept (Campbell) Some southern segments south of Hamilton Avenue to Dry Creek Road are within the City of Campbell, while the segment from Camden Avenue to near SR-85 is bordered by City of City of Campbell Parkway concept for Bascom Avenue including 1 landscape strip between sidewalk and roadway. Campbell on the west and City of San Jose on the east side. The Campbell General Plan classifies Bascom Avenue as a Class I Arterial with a parkway concept that would include trees along both sides and in the median, landscaping to screen parking, and buffered sidewalks. o Urban Commuter Arterial (County of Santa Clara) Bascom Avenue between Olive Avenue and Bailey Avenue, and between Elliot Street and.4 mile south of Fruitdale Avenue are under the jurisdiction of Santa Clara County (See Official County Road Book 217 for details). The desirable design accommodates bicycle travel on a paved shoulder, a buffer between the shoulder bikeway and adjacent motor vehicle travel lanes, with 2 or 3 motor vehicle lanes in each direction. Urban Commuter Arterial designation specifies a desirable design that includes bicycle accommodations on a paved shoulder, with a buffer between the bicycle travelway. Although not specified, the County segments of Bascom Avenue provide sidewalks on both sides, consistent with typical urban streets. Page 4
10 FINAL-Bascom Corridor Complete Streets Study Existing Data Review: Traffic Environment City of San Jose Complete Street Guidelines identifies complete streets design guidelines intended to ensure that streets are comfortable and welcoming to all modes of travel, as well as supporting the City s goal to eliminate traffic-related deaths and severe injuries (San Jose Vision Zero). The guidelines include an emphasis on minimizing pedestrian crossing distance and exposure to conflicts, minimizing traffic stress and conflicts; and providing a continuous, connected system of bicycle facilities. City of Campbell General Plan includes adopted goals and policies aimed at achieving accommodating all users (General Plan Goal LUT-2), and implementing a safe and balanced multimodal transportation network with strategies for concrete improvements in bicycle facilities, pedestrian design, transit access, and roadway efficiency (General Plan Policy LUT 2.1). Vision Zero San Jose was prepared in accordance with an international goal of reducing trafficrelated injuries and fatalities to zero. It is the most recent annual traffic safety study completed by the San Jose DOT and SJPD, with a shift in focus from motorist convenience to the safety and accessibility of other modes. South Bascom Urban Village Plan, prepared in 214 and pending adoption, focuses on a 1.3- mile segment of Bascom Avenue between Interstate 28 (I-28) and Southwest Expressway (which serves the Bascom VTA Light Rail Station). A key design element includes a proposed reduction in the motor vehicle travel-way to two lanes per direction, in order to accommodate bicycle and pedestrian facility improvements. Page 5
11 FINAL-Bascom Corridor Complete Streets Study Existing Data Review: Traffic Environment 2. EXISTING PHYSICAL CHARACTISTICS Roadway Characteristics Table 1 summarizes the typical roadway characteristics on segment, from north to south, between I-88 and SR -85. Additional left-turn and right-turn lanes are provided at key intersections. Figures 3 to 5 show typical roadway characteristics including travel lane, bicycle lane and sidewalk widths, as well as total curb-to-curb width (relevant to pedestrian crossing distances). Table 1. Typical Roadway Characteristics by Segment Motor Vehicle Bicycle # From To Sidewalks Lanes Lanes Traffic Capacity (Daily Vehicles) Pedestrian Crossing Distance (feet) 1 I-88 Stevens Creek Blvd- West San Carlos St 4 lanes (4 through without left-turn pocket) 13 avg lane No Bicycle Lanes 12 (or 4 with 8 landscape strip) 32, 54 2 Stevens Creek Blvd- West San Carlos St Hamilton Ave 7 lanes (6 through + 1 left-turn) 11 avg lane 2 bicycle lanes. 1 each 54, 96 3 Hamilton Ave Dry Creek Rd 7 lanes (6 through + 1 left-turn) No Bicycle Lanes Varies 54, 1 14 avg lane 4 Dry Creek Rd Camden Ave 7 lanes (6 through + 1 left-turn) No Bicycle Lanes Varies 54, 1 14 avg lane 5 Camden Ave SR-85 7 lanes (6 through + 1 left-turn) No Bicycle Lanes 6 each 54, 1 14 avg lane Note: daily capacity estimate based on 9, per through lane where continuous left-turn pockets are provide (also taking into account the current signal pattern), or 8, per lane without left-turn pockets. Page 6


12 FINAL-Bascom Corridor Complete Streets Study Existing Data Review: Traffic Environment Figure 3. Typical Cross-section: North Bascom Avenue North of Stevens Creek Boulevard-West San Carlos Street, segments of North Bascom Avenue have two lanes per direction with a curb-to-curb width of approximately 54 feet at mid-block locations and at most intersections (thus much narrower than most segments of Bascom Avenue where existing crossing distances are approximately 1 feet). Based on the traffic volume of 19, daily vehicles, this segment could be an ideal candidate for a four to three road diet conversion to one motor vehicle lane per direction with center turn-lane which would provide space for bicycle lanes in both directions. On-street parking could be accommodated on one side of the street, if desired, with such a configuration, while pedestrian crossing distances could be reduced to approximately 46 feet with corner bulbouts. Page 7
 and Southwest Expressway (just north of Hamilton Avenue) is within the boundaries of")

13 FINAL-Bascom Corridor Complete Streets Study Existing Data Review: Traffic Environment Figure 4. Typical Cross-section: South Bascom Urban Village The segment of South Bascom Avenue between Interstate 28 (I-28) and Southwest Expressway (just north of Hamilton Avenue) is within the boundaries of the South Bascom Urban Village Plan. The existing 7-lane motor vehicle travelway includes three motor vehicle travel lanes per direction, plus a center left-turn lane. Bicycle lanes are provided in both directions, with adjacent 1-foot sidewalks. On-street motor vehicle parking is permitted on some limited segments. Eliminating one motor vehicle lane per direction is feasible based on traffic volumes, which would reduce the currently lengthy 96-foot crossing distances and allow 22 or more feet to be reallocated for pedestrian and bicyclist enhancements. Traffic volumes are much lower than capacity. On most segments, a reduction from seven to five lanes (thus two through lanes per direction) could be implemented to reduce travel speeds and reallocate space to complete streets uses. Such uses could include higher quality bicycle lanes or paths and/or pedestrian realm improvements as envisioned in the South Bascom Village Plan. Page 8
 and City of San Jose (on the east side).")

14 FINAL-Bascom Corridor Complete Streets Study Existing Data Review: Traffic Environment Figure 5. Typical Cross-section: South Bascom Avenue near SR-85 This southernmost segment serves as the border between City of Campbell (on the west side) and City of San Jose (on the east side). Pedestrian travel on the 6 sidewalk is frequently interrupted at mid-block locations by streetlight poles that were installed in the middle of the sidewalks on both sides. City of Campbell anticipates restriping the 19 curbside lane to include a 6 bicycle lane in both directions. In addition, Campbell General Plan streetscape standards call for 1-foot landscape strip between sidewalk and roadway. Traffic volumes are relatively low, between 17,- 27, vehicles per day. One lane per direction could accommodate volumes near Dry Creek Road, while two lanes per direction may be desirable between Camden Avenue and SR-85. Roadway capacity is discussed further below. Page 9
15 FINAL-Bascom Corridor Complete Streets Study Existing Data Review: Traffic Environment 3. MOTOR VEHICLE TRAFFIC VOLUMES & CAPACITIES Table 2 summarizes the relationship between the existing traffic capacity and existing volume, and identifies potential opportunities for reconfiguration. Figure 6 provides a map showing estimated daily traffic volumes by segment. As a general rule of thumb, daily volumes of up to 4, vehicles can generally be accommodated by two lanes per direction provided left-turn pockets are provided. Up to 22, vehicles can often be accommodated by one lane per direction with left-turn pockets. As shown, the traffic volume on the corridor ranges from 17, to 37, daily. Page 1
16 FINAL-Bascom Corridor Complete Streets Study Existing Data Review: Traffic Environment Table 2. Existing Daily Traffic Volumes & Capacities Motor Capacity Existing # From To Vehicle (Daily Volume Lanes Vehicles) Potential Street Reconfiguration Opportunities 1 I-88 Stevens Creek Boulevard/ West San Carlos Street 4 lanes (4 through without leftturn pocket) 32, Varies from 17, to 27, Reduction from 4 to 3 lanes (1 per direction plus center turn-lane) could be feasible on this segment. 14 avg lane 2 Stevens Creek Boulevard / West San Carlos Street Hamilton Avenue 7 lanes (6 through + 1 left-turn) 14 avg lane 54, Varies from 22, to 37, Reduction from to 7 to 5 lanes (2 per direction plus center turn-lane) would be feasible. 3 Hamilton Avenue Dry Creek Road 7 lanes (6 through + 1 left-turn) 14 avg lane 54, Varies from 22, to 37, Reduction from to 7 to 5 lanes (2 per direction plus center turn-lane) would be feasible. 4 Dry Creek Road Camden Avenue 7 lanes (6 through + 1 left-turn) 14 avg lane 54, Varies from 17, to 22, Reduction from 7 to 3 lanes (1 per direction plus center turn-lane) could be feasible on this segment. 5 Camden Avenue SR-85 7 lanes (6 through + 1 left-turn) 14 avg lane 54, Various from 17, 27, Reduction from 7 to 5 lanes (2 per direction plus center turn-lane) would be feasible on this segment. Note: daily capacity estimate based on 9, per through lane where continuous left-turn pockets are provided, or 8, per lane without left-turn pockets. Existing daily volumes are based on recent 24-hour counts and/or derived from peak-hour turning movement counts Peak Hour volumes are generally 1 percent of Daily Volumes (consistent with Daily Capacity assumptions). Page 11

17 FINAL-Bascom Corridor Complete Streets Study Existing Data Review: Traffic Environment Figure 6. Daily Traffic Volumes by Segment Page 12
18 FINAL-Bascom Corridor Complete Streets Study Existing Data Review: Traffic Environment Traffic Level of Service at Key Intersections Motor vehicle traffic operations are often evaluated based on intersection level of service (LOS) standards described in the Highway Capacity Manual (HCM) that focus on average delay to motor vehicles. Table 3 summarizes the LOS definitions and relative delay to motorists based on HCM methodology. Table 3. Peak Hour Traffic Level of Service Definitions at Intersections Average Delay LOS Flow Type Operational Characteristics (seconds per motor vehicle) Signalized Stop-sign Intersection Controlled A Stable Flow Free-flow conditions with negligible to minimal delays. < 1 1 B Stable Flow Good progression with slight delays. Short cycle-lengths typical. > 1 2 > 1 15 C Stable Flow Relatively higher delays resulting from fair progression and/or longer cycle lengths. > 2 35 > D Approaching Somewhat congested conditions. Longer but Unstable Flow tolerable delays may result. > > Congested conditions. Significant delays result E Unstable Flow from poor progression, long cycle lengths, and > 55 8 > 35 5 high volume-to-capacity ratios. F Forced Flow Jammed or grid-lock type operating conditions. Generally considered unacceptable for most drivers. > 8 > 5 Source: Highway Capacity Manual (HCM) 21 The cities of San Jose and Campbell both identify LOS D or better as acceptable during the a.m. and p.m. peak hours. Santa Clara County Valley Transportation Authority (VTA) standard for Congestion Management Program (CMP) intersections is LOS E or better during the a.m. and p.m. peak hours. Existing a.m. and p.m. peak hour level of service was reviewed at 18 key intersections on the study corridor based on recent traffic studies in the area. These studies used either TRAFFIX or Synchro software with the Highway Capacity Manual 2 methodology, as required under VTA study guidelines. The LOS outputs sheets for each intersection are provided in Appendix A. As illustrated on Figures 7 and 8: During the a.m. peak hour, all intersections operate at LOS D or better with the exception of the intersection of South Bascom Avenue with Camden Avenue, that operates at LOS E. During the p.m. peak hour, all intersections operate at LOS D or better with the exception of the intersections of South Bascom Avenue with Stevens Creek Boulevard, Moorpark Avenue, and Hamilton Avenue, that both operate at LOS E. Large intersections with long crossing distances often negatively affect LOS by requiring long crossing distances for pedestrians and long clearance times for motor vehicles. Large intersections generally require long signal cycles that contribute to delay. Therefore, reducing the width of intersections (such as Page 13
19 FINAL-Bascom Corridor Complete Streets Study Existing Data Review: Traffic Environment by removing through lanes) can have a positive effect on LOS, while shorter cycle lengths can be particularly beneficial to pedestrians and bicyclists, since pedestrians do not benefit from signal coordination plans that reduce delay to motorists (while cyclists rarely benefit from signal coordination except on urban streets where the coordination plan is based on the typical bicyclist speed). As a result, pedestrians and cyclists are often delayed for roughly half the signal cycle (presuming a random arrival pattern) thus an average delay of roughly 6 seconds in many cases, which is a level of delay that is considered unacceptable for motor vehicle travel (consistent with motor vehicle LOS E where average delay is between 55 and 8 seconds). Page 14

20 FINAL-Bascom Corridor Complete Streets Study Existing Data Review: Traffic Environment Figure 7. Existing Traffic Level of Service Map AM Peak Hour Page 15

21 FINAL-Bascom Corridor Complete Streets Study Existing Data Review: Traffic Environment Figure 8. Existing Traffic Level of Service Map PM Peak Hour Page 16
22 FINAL-Bascom Corridor Complete Streets Study Existing Data Review: Traffic Environment 4. TRAFFIC SAFETY Collision Data Review Available collision data was reviewed for a six-year period from January 1, 28 to December 31, 213, The data review indicates 329 reported motor vehicle collisions that involved injuries, including 83 with serious injuries and five fatalities. Table 4 summarizes collision characteristics by travel mode. Key findings are summarized below: 1. Bicyclists and pedestrians are disproportionately affected. Although less than 1 percent of existing trips on the corridor are via bicycling or walking, bicyclists and pedestrians were involved in 23 percent of reported injury collisions (11 percent involving pedestrians, and 12 percent involving bicyclists). 2. Furthermore, collisions with serious injuries and fatalities were more likely to involve bicyclists and pedestrians, as the collision data indicates that 56 percent of serious injuries reported to result from collisions on the corridor were to bicyclists or pedestrians (39 percent pedestrians and 17 percent bicyclists), and 6 percent of the fatalities (3 fatalities to pedestrians, none to bicyclists). 3. The most common single cause of collisions on the corridor was unsafe speed, identified in 28 percent of collision reports on Bascom Avenue. Table 4. Collision Characteristics by Mode & Type of Injury Motor Vehicle collisions with: Reported Collisions including Minor Collisions with Serious Fatalities Injuries Injuries Motor Vehicles 77% 44% 4% Bicyclists 12% 17% % Pedestrians 11% 39% 6% Total Bicyclists & Pedestrians Share of Collisions 23% 56% 6% Source: January 28-December 213 Statewide Integrated Traffic Record Service (SWITRS) Figure 9 to 11 provide maps showing each of the collision locations by mode, and highlights hot spots where the frequency of reported collisions exceeded that of other areas on the corridor. As shown, three such hot spot locations are evident: Collision Hot Spot 1: Bascom Avenue from Fruitdale Avenue to Stevens Creek Boulevard/East San Tomas Avenue, particularly including the portion of Bascom Avenue that borders the San Jose City College and Santa Clara Valley Medical Center campus. Collision Hot Spot 2: Bascom Avenue from Hamilton Avenue to Southwest Expressway, which borders the VTA light-rail station. Collision Hot Spot 3: Bascom Avenue near the intersection with Camden Avenue. Page 17

23 FINAL-Bascom Corridor Complete Streets Study Existing Data Review: Traffic Environment Figure 9. Collision Map Page 18

24 FINAL-Bascom Corridor Complete Streets Study Existing Data Review: Traffic Environment Figure 1. Pedestrian Collisions Page 19
25 FINAL-Bascom Corridor Complete Streets Study Existing Data Review: Traffic Environment Figure 11. Bicycle Collisions Page 2
 on Main Street segments (applicable to the segments between Stevens")
26 FINAL-Bascom Corridor Complete Streets Study Existing Data Review: Traffic Environment Average Travel Speeds Based on a review of City planning documents and travel speed data for the corridor, key findings are that: City of San Jose Complete Streets Guidelines identify a desirable target speed of 25 to 3 miles per hour (mph) on Main Street segments (applicable to the segments between Stevens Creek Boulevard and Hamilton Avenue), and 25 to 35 miles on City Connector Streets (applicable to remaining segments within the City of San Jose). The current average travel speeds is much higher than the City of San Jose s desired target speeds, generally averaging about 4 miles per hour (mph) along the corridor. On some segments, the 85 th percentile travel speed was identified as 43 mph based on speed surveys based on City of San Jose 211 speed survey data. Page 21
27 FINAL-Bascom Corridor Complete Streets Study Existing Data Review: Traffic Environment 5. SUMMARY As described in the preceding pages, key findings relevant to the complete streets study are: 1. Reduction to two motor vehicle lanes per direction would be feasible on all segments, while just one lane per direction may be adequate on some segments. Traffic volumes range from 18, to 34, daily, well below the capacity of approximately 6, provided by the current 7-lane configuration including left-turn pockets. Daily volumes of up to 4, vehicles can generally be accommodated by just two lanes per direction provided left-turn pockets are provided, while up to 22, vehicles can often be accommodated by just one lane per direction with left-turn pockets. 2. Bicyclists and pedestrians are disproportionately affected by collisions on the corridor. Although less than 1 percent of existing trips on the corridor are via bicycling or walking, bicyclists and pedestrians were involved in 23 percent of reported injury collisions, including 56 percent of serious injury collisions, and 6 percent of fatalities. 3. Travel speeds on Bascom Avenue average about 4 miles per hour (mph), well above the target speed goals established by the San Jose Complete Streets Guidelines that aim for 25 to 3 mph (between Moorpark and Hamilton Avenue) and 25 to 35 mph on remaining segments in San Jose. Page 22
28 FINAL-Bascom Corridor Complete Streets Study Existing Data Review: Traffic Environment APPENDIX A Study Intersection Level of Service Output Sheets Appendix A
29 Bascom Avenue Level of Service: Most Recent Available AM Peak Hour: 7 9 AM PM Peak Hour: 4 6 PM LOS LOS ID Cross Street Control CMP City Year LOS Software LOS Source Pg. # Int # Year LOS Software LOS Source 4 Pg. # Int # Comments 1 Newhall St Signalized San Jose 2 Cherrystone Dr/ 88 SB Ramps Signalized * San Jose 21 A Synchro SJ TLSP Phase II A TRAFFIX CMP Monitoring NB Ramps Signalized * San Jose 21 B Synchro SJ TLSP Phase II A TRAFFIX CMP Monitoring 4 W Hedding st Signalized San Jose 21 D Synchro SJ TLSP Phase II D Synchro SJ TLSP Phase II Naglee Ave Signalized San Jose 21 C Synchro SJ TLSP Phase II D Synchro SJ TLSP Phase II Olive 1 way Stop San Jose 7 Stevens Creek Blvd/ W San Carlos St Signalized San Jose 21 D Synchro SJ TLSP Phase II E Synchro SJ TLSP Phase II Scott St Signalized San Jose 21 B Synchro SJ TLSP Phase II B Synchro SJ TLSP Phase II Parkmoor Ave Signalized San Jose 21 D Synchro SJ TLSP Phase II C Synchro SJ TLSP Phase II Moorpark Ave Signalized * San Jose 21 C Synchro SJ TLSP Phase II E TRAFFIX CMP Monitoring Renova Dr Signalized San Jose 21 B Synchro SJ TLSP Phase II B Synchro SJ TLSP Phase II Fruitdale Ave/Enborg Signalized * San Jose 21 D Synchro SJ TLSP Phase II D TRAFFIX CMP Monitoring Lindaire Ave 1 way Stop San Jose 14 Downing Ave Signalized San Jose 21 B Synchro SJ TLSP Phase II B Synchro SJ TLSP Phase II Stokes St Signalized * San Jose 21 C Synchro SJ TLSP Phase II C TRAFFIX CMP Monitoring Southwest Expresswa Signalized San Jose 17 Hamilton Ave Signalized * Campbell/SJ 215 D TRAFFIX Pruneyard TIA D TRAFFIX CMP Monitoring Campisi Way Signalized Campbell 215 B TRAFFIX Pruneyard TIA D TRAFFIX Pruneyard TIA Ridgeley Dr/Pruneyard Signalized Campbell 215 C TRAFFIX Pruneyard TIA B TRAFFIX Pruneyard TIA Fewtrell Dr 1 way Stop Campbell 21 E Campbell Ave Signalized * Campbell 215 C TRAFFIX Pruneyard TIA C TRAFFIX CMP Monitoring Apricot Ave Signalized Campbell 21 A Synchro SJ TLSP Phase II B Synchro SJ TLSP Phase II Dry Creek Rd Signalized Campbell 21 A Synchro SJ TLSP Phase II B Synchro SJ TLSP Phase II Union Ave Signalized * San Jose 21 D Synchro SJ TLSP Phase II D+ TRAFFIX CMP Monitoring Curtner Ave Signalized * San Jose 21 D Synchro SJ TLSP Phase II D+ TRAFFIX CMP Monitoring Camden Ave Signalized * San Jose 214 E TRAFFIX Samaritan Med TIA D TRAFFIX CMP Monitoring Woodard Rd Signalized San Jose 21 B Synchro SJ TLSP Phase II B? SJ Bascom Gas Station 4 28 White Oaks Rd Signalized Campbell 21 B Synchro SJ TLSP Phase II B Synchro SJ TLSP Phase II E Mozart Ave 1 way Stop Campbell 3 85 NB Ramps Signalized * San Jose 214 C TRAFFIX Samaritan Med TIA C+ TRAFFIX CMP Monitoring SB Ramps Signalized * San Jose 214 B TRAFFIX Samaritan Med TIA C TRAFFIX CMP Monitoring 32 Notes: 1 Mainline volumes: northbound plus southbound volumes in on Bascom Avenue. Used when N/S volume is more than twice E/W volume. 2 Mainline volume shown if no prior volumes available. 3 Blank if same year. 4 Red indicates LOS worksheet unavailable 11/8/217
30 FINAL-Bascom Corridor Complete Streets Study Existing Data Review: Traffic Environment AM Peak AM Peak LOS Output Sheets
31 36: Apricot Avenue & Bascom Avenue AM Peak 63: Hedding St & Bascom Avenue AM Peak Lane Group EBL EBR NBL NBT SBU SBT SBR Volume (vph) Confl. Peds. (#/hr) Confl. Bikes (#/hr) 5 Peak Hour Factor Growth Factor 1% 1% 1% 1% 1% 1% 1% Heavy Vehicles (%) 2% 2% 2% 2% 2% 2% 2% Bus Blockages (#/hr) Mid-Block Traffic (%) % % % Turn Type Perm Prot Prot Protected Phases Permitted Phases 4 Detector Phases Minimum Initial (s) Minimum Split (s) Total Split (s) Total Split (%) 31.8% 31.8% 18.2% 5.% 18.2% 5.%.% Yellow Time (s) All-Red Time (s) Lead/Lag Lead Lag Lead Lag Recall Mode None None Min C-Max None Max Act Effct Green (s) Actuated g/c Ratio v/c Ratio Control Delay Queue Delay Total Delay LOS D B E A E A Approach Delay Approach LOS C A B Cycle Length: 11 Actuated Cycle Length: 11 Offset: 99 (9%), Referenced to phase 2:NBT, Start of Green Natural Cycle: 8 Maximum v/c Ratio:.36 Intersection Signal Delay: 8. Intersection LOS: A Intersection Capacity Utilization 45.6% ICU Level of Service A Volume (vph) Confl. Peds. (#/hr) Confl. Bikes (#/hr) Peak Hour Factor Bus Blockages (#/hr) Turn Type Split Split Prot Prot Protected Phases Permitted Phases Detector Phases Minimum Initial (s) Minimum Split (s) Total Split (s) Total Split (%) 23.6% 23.6%.% 22.1% 22.1%.% 11.4% 43.6%.% 1.7% 42.9%.% Yellow Time (s) All-Red Time (s) Lead/Lag Lead Lead Lag Lag Lag Lag Lead Lead Recall Mode None None None None None C-Max None Max Act Effct Green (s) Actuated g/c Ratio v/c Ratio Control Delay Queue Delay Total Delay LOS E E E B F C Approach Delay Approach LOS E E B C Cycle Length: 14 Actuated Cycle Length: 14 Offset: 49 (35%), Referenced to phase 6:NBT, Start of Red Natural Cycle: 15 Maximum v/c Ratio:.84 Intersection Signal Delay: 37.6 Intersection LOS: D Intersection Capacity Utilization 7.7% ICU Level of Service C 36: Apricot Avenue & Bascom Avenue 63: Hedding St & Bascom Avenue 17: Naglee Ave & Bascom Avenue AM Peak 121: Bascom Avenue & I-88 NB On-ramp AM Peak Volume (vph) Confl. Peds. (#/hr) Confl. Bikes (#/hr) Peak Hour Factor Bus Blockages (#/hr) 3 Turn Type Prot Perm Prot Prot Prot Perm Protected Phases Permitted Phases 8 2 Detector Phases Minimum Initial (s) Minimum Split (s) Total Split (s) Total Split (%) 14.3% 24.3% 24.3% 14.3% 24.3%.% 32.1% 5.7%.% 1.7% 29.3% 29.3% Yellow Time (s) All-Red Time (s) Lead/Lag Lead Lag Lag Lead Lag Lead Lead Lag Lag Lag Recall Mode None None None None None None Max None C-Max C-Max Act Effct Green (s) Actuated g/c Ratio v/c Ratio Control Delay Queue Delay Total Delay LOS F D C F E E B F B A Approach Delay Approach LOS E E C C Cycle Length: 14 Actuated Cycle Length: 14 Offset: 41 (29%), Referenced to phase 2:SBT, Start of Red Natural Cycle: 85 Maximum v/c Ratio:.8 Intersection Signal Delay: 34.7 Intersection LOS: C Intersection Capacity Utilization 67.4% ICU Level of Service C Lane Group NBT NBR SBL SBT SWL SWR ø4 Volume (vph) Confl. Peds. (#/hr) 2 Confl. Bikes (#/hr) 2 Peak Hour Factor Growth Factor 1% 1% 1% 1% 1% 1% Heavy Vehicles (%) 2% 2% 2% 2% 2% 2% Bus Blockages (#/hr) Mid-Block Traffic (%) % % % Turn Type Prot Protected Phases Permitted Phases Detector Phases Minimum Initial (s) Minimum Split (s) Total Split (s) Total Split (%) 53.6%.% 25.% 78.6%.%.% 21% Yellow Time (s) All-Red Time (s) Lead/Lag Lag Lead Recall Mode C-Max None C-Max Min Act Effct Green (s) Actuated g/c Ratio v/c Ratio Control Delay Queue Delay.1.. Total Delay LOS A E A Approach Delay Approach LOS A C Cycle Length: 14 Actuated Cycle Length: 14 Offset: 62 (44%), Referenced to phase 2:SBT and 6:NBT, Start of Red Natural Cycle: 8 Maximum v/c Ratio:.83 Intersection Signal Delay: 13.1 Intersection LOS: B Intersection Capacity Utilization 58.8% ICU Level of Service B 17: Naglee Ave & Bascom Avenue 121: Bascom Avenue & I-88 NB On-ramp
32 124: Union Avenue & Bascom Avenue AM Peak 125: Camden Avenue & Bascom Avenue AM Peak Lane Group NBL NBT NBR SBL SBT SBR NEL NET NER SWL SWT SWR Volume (vph) Confl. Peds. (#/hr) Confl. Bikes (#/hr) Peak Hour Factor Bus Blockages (#/hr) Turn Type Prot Prot Prot Prot Protected Phases Permitted Phases Detector Phases Minimum Initial (s) Minimum Split (s) Total Split (s) Total Split (%) 11.3% 35.5%.% 11.3% 35.5%.% 2.2% 35.5%.% 17.7% 33.1%.% Yellow Time (s) All-Red Time (s) Lead/Lag Lead Lag Lead Lag Lead Lag Lead Lag Recall Mode Min C-Max Min C-Max None None None None Act Effct Green (s) Actuated g/c Ratio v/c Ratio Control Delay Queue Delay Total Delay LOS E D E B E D E D Approach Delay Approach LOS D C D D Cycle Length: 124 Actuated Cycle Length: 124 Offset: 74 (6%), Referenced to phase 4:NBT and 8:SBT, Start of Green Natural Cycle: 15 Maximum v/c Ratio: 1. Intersection Signal Delay: 45.5 Intersection LOS: D Intersection Capacity Utilization 67.3% ICU Level of Service C 124: Union Avenue & Bascom Avenue Volume (vph) Confl. Peds. (#/hr) Confl. Bikes (#/hr) 3 5 Peak Hour Factor Bus Blockages (#/hr) Turn Type Prot Perm Prot Prot Prot Protected Phases Permitted Phases 8 Detector Phases Minimum Initial (s) Minimum Split (s) Total Split (s) Total Split (%) 13.9% 42.8% 42.8% 17.8% 46.7%.% 17.2% 29.4%.% 1.% 22.2%.% Yellow Time (s) All-Red Time (s) Lead/Lag Lead Lag Lag Lead Lag Lead Lag Lead Lag Recall Mode None C-Max C-Max None C-Max None None None None Act Effct Green (s) Actuated g/c Ratio v/c Ratio dr Control Delay Queue Delay Total Delay LOS F C B F E F D F F Approach Delay Approach LOS D E F F Cycle Length: 18 Actuated Cycle Length: 18 Offset: 135 (75%), Referenced to phase 4:WBT and 8:EBT, Start of Red Natural Cycle: 18 Maximum v/c Ratio: 1.19 Intersection Signal Delay: 77.6 Intersection LOS: E Intersection Capacity Utilization 98.9% ICU Level of Service F dr Defacto Right Lane. Recode with 1 though lane as a right lane. 125: Camden Avenue & Bascom Avenue 127: Stokes Street & Bascom Avenue AM Peak 143: San Carlos St & Bascom Avenue AM Peak Volume (vph) Confl. Peds. (#/hr) Confl. Bikes (#/hr) Peak Hour Factor Bus Blockages (#/hr) Turn Type Split Split Prot Prot Protected Phases Permitted Phases Detector Phases Minimum Initial (s) Minimum Split (s) Total Split (s) Total Split (%) 22.7% 22.7%.% 25.8% 25.8%.% 17.8% 33.7%.% 17.8% 33.7%.% Yellow Time (s) All-Red Time (s) Lead/Lag Lead Lead Lag Lag Lead Lag Lead Lag Recall Mode None None None None None Min None Min Act Effct Green (s) Actuated g/c Ratio v/c Ratio Control Delay Queue Delay Total Delay LOS E E B E C E C Approach Delay Approach LOS E D C C Cycle Length: 163 Actuated Cycle Length: Natural Cycle: 13 Control Type: Actuated-Uncoordinated Maximum v/c Ratio:.78 Intersection Signal Delay: 35. Intersection Capacity Utilization 63.4% 127: Stokes Street & Bascom Avenue Intersection LOS: C ICU Level of Service B Volume (vph) Confl. Peds. (#/hr) Confl. Bikes (#/hr) Peak Hour Factor Bus Blockages (#/hr) Turn Type Prot Prot Prot Perm Prot Prot Protected Phases Permitted Phases 4 Detector Phases Minimum Initial (s) Minimum Split (s) Total Split (s) Total Split (%) 12.9% 23.6%.% 23.6% 34.3%.% 27.9% 39.3% 39.3% 13.6% 25.% 25.% Yellow Time (s) All-Red Time (s) Lead/Lag Lead Lag Lead Lag Lead Lag Lag Lead Lag Lag Recall Mode None C-Max None C-Max None None None None None None Act Effct Green (s) Actuated g/c Ratio v/c Ratio Control Delay Queue Delay Total Delay LOS F D E D E D A E D B Approach Delay Approach LOS D E D D Cycle Length: 14 Actuated Cycle Length: 14 Offset: 33 (24%), Referenced to phase 2:EBT and 6:WBT, Start of Red Natural Cycle: 95 Maximum v/c Ratio:.92 Intersection Signal Delay: 47.1 Intersection LOS: D Intersection Capacity Utilization 76.4% ICU Level of Service D 143: San Carlos St & Bascom Avenue
33 159: I-88 SB Off-ramp & Bascom Avenue AM Peak 23: Curtner Avenue & Bascom Avenue AM Peak Lane Group WBL WBR NBT NBR SBL SBT Volume (vph) Confl. Peds. (#/hr) Confl. Bikes (#/hr) 3 Peak Hour Factor Growth Factor 1% 1% 1% 1% 1% 1% Heavy Vehicles (%) 2% 2% 2% 2% 2% 2% Bus Blockages (#/hr) Mid-Block Traffic (%) % % % Turn Type Perm Protected Phases Permitted Phases 4 Detector Phases Minimum Initial (s) Minimum Split (s) Total Split (s) Total Split (%) 34.3% 34.3% 65.7%.%.% 65.7% Yellow Time (s) All-Red Time (s) Lead/Lag Recall Mode None None C-Max C-Max Act Effct Green (s) Actuated g/c Ratio v/c Ratio Control Delay Queue Delay.... Total Delay LOS C B A A Approach Delay Approach LOS C A A Cycle Length: 7 Actuated Cycle Length: 7 Offset: 59 (84%), Referenced to phase 2:NBSB, Start of Red Natural Cycle: 4 Maximum v/c Ratio:.54 Intersection Signal Delay: 9.3 Intersection LOS: A Intersection Capacity Utilization 52.4% ICU Level of Service A Volume (vph) Confl. Peds. (#/hr) Confl. Bikes (#/hr) Peak Hour Factor Bus Blockages (#/hr) Turn Type Prot Perm Prot Perm Prot Prot Protected Phases Permitted Phases 8 4 Detector Phases Minimum Initial (s) Minimum Split (s) Total Split (s) Total Split (%) 17.7% 32.3% 32.3% 22.6% 37.1% 37.1% 12.1% 33.1%.% 12.1% 33.1%.% Yellow Time (s) All-Red Time (s) Lead/Lag Lead Lag Lag Lead Lag Lag Lead Lag Lead Lag Recall Mode None None None None None None None C-Max None C-Max Act Effct Green (s) Actuated g/c Ratio v/c Ratio Control Delay Queue Delay Total Delay LOS E D B E D B E B D C Approach Delay Approach LOS D E C C Cycle Length: 124 Actuated Cycle Length: 124 Offset: 5 (4%), Referenced to phase 2:SBT and 6:NBT, Start of Red Natural Cycle: 15 Maximum v/c Ratio:.89 Intersection Signal Delay: 36.7 Intersection LOS: D Intersection Capacity Utilization 73.8% ICU Level of Service D 159: I-88 SB Off-ramp & Bascom Avenue 23: Curtner Avenue & Bascom Avenue 39: Burton Road & Bascom Avenue AM Peak 4: Woodard Road & Bascom Avenue AM Peak Volume (vph) Confl. Peds. (#/hr) Confl. Bikes (#/hr) Peak Hour Factor Bus Blockages (#/hr) Turn Type Split Split Perm Prot Perm Prot Perm Protected Phases Permitted Phases Detector Phases Minimum Initial (s) Minimum Split (s) Total Split (s) Total Split (%) 14.% 14.%.% 33.% 33.% 33.% 14.% 36.% 36.% 17.% 39.% 39.% Yellow Time (s) All-Red Time (s) Lead/Lag Lag Lag Lead Lead Lead Lead Lag Lag Lead Lag Lag Recall Mode None None None None None None C-Max C-Max None C-Max C-Max Act Effct Green (s) Actuated g/c Ratio v/c Ratio Control Delay Queue Delay Total Delay LOS E D D C E D B F C B Approach Delay Approach LOS E C D D Cycle Length: 1 Actuated Cycle Length: 1 Offset: 1 (1%), Referenced to phase 2:SBT and 6:NBT, Start of Red Natural Cycle: 95 Maximum v/c Ratio: 1.2 Intersection Signal Delay: 42.2 Intersection LOS: D Intersection Capacity Utilization 71.1% ICU Level of Service C Lane Group WBL WBR NBU NBT NBR SBL SBT Volume (vph) Confl. Peds. (#/hr) Confl. Bikes (#/hr) 7 6 Peak Hour Factor Growth Factor 1% 1% 1% 1% 1% 1% 1% Heavy Vehicles (%) 2% 2% 2% 2% 2% 2% 2% Bus Blockages (#/hr) Mid-Block Traffic (%) % % % Turn Type Perm Prot Prot Protected Phases Permitted Phases 4 Detector Phases Minimum Initial (s) Minimum Split (s) Total Split (s) Total Split (%) 4.% 4.% 15.% 45.%.% 15.% 45.% Yellow Time (s) All-Red Time (s) Lead/Lag Lead Lag Lead Lag Recall Mode None None None C-Max None C-Max Act Effct Green (s) Actuated g/c Ratio v/c Ratio Control Delay Queue Delay Total Delay LOS D C D A D A Approach Delay Approach LOS C A B Cycle Length: 1 Actuated Cycle Length: 1 Offset: 55 (55%), Referenced to phase 2:SBT and 6:NBT, Start of Red Natural Cycle: 7 Maximum v/c Ratio:.77 Intersection Signal Delay: 15.9 Intersection LOS: B Intersection Capacity Utilization 48.4% ICU Level of Service A 39: Burton Road & Bascom Avenue 4: Woodard Road & Bascom Avenue
34 541: Downing Avenue & Bascom Avenue AM Peak 66: White Oaks Road & Bascom Avenue AM Peak Lane Group EBL EBR NBL NBT SBU SBT SBR Volume (vph) Confl. Peds. (#/hr) Confl. Bikes (#/hr) 13 3 Peak Hour Factor Growth Factor 1% 1% 1% 1% 1% 1% 1% Heavy Vehicles (%) 2% 2% 2% 2% 2% 2% 2% Bus Blockages (#/hr) 3 Mid-Block Traffic (%) % % % Turn Type Prot Prot Protected Phases Permitted Phases Detector Phases Minimum Initial (s) Minimum Split (s) Total Split (s) Total Split (%) 34.5%.% 16.8% 48.7% 16.8% 48.7%.% Yellow Time (s) All-Red Time (s) Lead/Lag Lead Lag Lead Lag Recall Mode None None Min None Min Act Effct Green (s) Actuated g/c Ratio v/c Ratio Control Delay Queue Delay..... Total Delay LOS C D B D B Approach Delay Approach LOS C B B Cycle Length: 113 Actuated Cycle Length: 69.5 Natural Cycle: 75 Control Type: Actuated-Uncoordinated Maximum v/c Ratio:.53 Intersection Signal Delay: 15.4 Intersection Capacity Utilization 6.3% 541: Downing Avenue & Bascom Avenue Intersection LOS: B ICU Level of Service B Volume (vph) Confl. Peds. (#/hr) Confl. Bikes (#/hr) Peak Hour Factor Bus Blockages (#/hr) Turn Type Perm Perm Perm Prot Prot Protected Phases Permitted Phases Detector Phases Minimum Initial (s) Minimum Split (s) Total Split (s) Total Split (%) 41.% 41.%.% 41.% 41.% 41.% 17.% 43.%.% 16.% 42.%.% Yellow Time (s) All-Red Time (s) Lead/Lag Lag Lag Lead Lead Recall Mode None None None None None None C-Max None Max Act Effct Green (s) Actuated g/c Ratio v/c Ratio Control Delay Queue Delay Total Delay LOS C A D C A D A D B Approach Delay Approach LOS B C B B Cycle Length: 1 Actuated Cycle Length: 1 Offset: 27 (27%), Referenced to phase 6:NBT, Start of Red Natural Cycle: 9 Maximum v/c Ratio:.65 Intersection Signal Delay: 17. Intersection LOS: B Intersection Capacity Utilization 57.5% ICU Level of Service B 66: White Oaks Road & Bascom Avenue 625: Dry Creek Road & Bascom Avenue AM Peak 688: SR-85 NB Ramps & Bascom Avenue AM Peak Volume (vph) Confl. Peds. (#/hr) Confl. Bikes (#/hr) Peak Hour Factor Bus Blockages (#/hr) Turn Type Split Perm Split Perm Prot Perm Prot Protected Phases Permitted Phases Detector Phases Minimum Initial (s) Minimum Split (s) Total Split (s) Total Split (%) 35.5% 35.5% 35.5% 18.2% 18.2% 18.2% 14.5% 31.8% 31.8% 14.5% 31.8%.% Yellow Time (s) All-Red Time (s) Lead/Lag Lead Lag Lag Lead Lag Recall Mode None None None None None None None C-Max C-Max None C-Max Act Effct Green (s) Actuated g/c Ratio v/c Ratio Control Delay Queue Delay Total Delay LOS D C D B D B A E A Approach Delay Approach LOS D B B B Cycle Length: 11 Actuated Cycle Length: 11 Offset: 29 (26%), Referenced to phase 2:SBT and 6:NBT, Start of Red Natural Cycle: 9 Maximum v/c Ratio:.82 Intersection Signal Delay: 16.1 Intersection LOS: B Intersection Capacity Utilization 53.% ICU Level of Service A Volume (vph) Confl. Peds. (#/hr) Confl. Bikes (#/hr) 2 5 Peak Hour Factor Bus Blockages (#/hr) Turn Type Split Perm Prot Protected Phases Permitted Phases 4 Detector Phases Minimum Initial (s) Minimum Split (s) Total Split (s) Total Split (%).%.%.% 41.% 41.% 41.% 24.% 59.%.%.% 35.%.% Yellow Time (s) All-Red Time (s) Lead/Lag Lag Lead Recall Mode None None None None C-Max Max Act Effct Green (s) Actuated g/c Ratio v/c Ratio Control Delay Queue Delay Total Delay LOS D D A D A A Approach Delay Approach LOS C B A Cycle Length: 1 Actuated Cycle Length: 1 Offset: 39 (39%), Referenced to phase 6:NBT, Start of Red Natural Cycle: 8 Maximum v/c Ratio:.68 Intersection Signal Delay: 14.2 Intersection LOS: B Intersection Capacity Utilization 47.8% ICU Level of Service A 625: Dry Creek Road & Bascom Avenue 688: SR-85 NB Ramps & Bascom Avenue
35 689: SR-85 SB Ramps & Bascom Avenue AM Peak 925: Foxworthy Avenue & Bascom Avenue AM Peak Volume (vph) Confl. Peds. (#/hr) Confl. Bikes (#/hr) 5 3 Peak Hour Factor Bus Blockages (#/hr) Turn Type Split Prot Protected Phases Permitted Phases Detector Phases Minimum Initial (s) Minimum Split (s) Total Split (s) Total Split (%) 27.% 27.%.%.%.%.%.% 5.%.% 23.% 73.%.% Yellow Time (s) All-Red Time (s) Lead/Lag Lag Lead Recall Mode None None C-Max None C-Max Act Effct Green (s) Actuated g/c Ratio v/c Ratio Control Delay Queue Delay Total Delay LOS D C A D A Approach Delay Approach LOS C A A Cycle Length: 1 Actuated Cycle Length: 1 Offset: 21 (21%), Referenced to phase 2:SBT and 6:NBT, Start of Red Natural Cycle: 5 Maximum v/c Ratio:.72 Intersection Signal Delay: 8.7 Intersection LOS: A Intersection Capacity Utilization 47.8% ICU Level of Service A 689: SR-85 SB Ramps & Bascom Avenue Lane Group WBL WBR NBU NBT NBR SBL SBT Volume (vph) Confl. Peds. (#/hr) Confl. Bikes (#/hr) 3 Peak Hour Factor Growth Factor 1% 1% 1% 1% 1% 1% 1% Heavy Vehicles (%) 2% 2% 2% 2% 2% 2% 2% Bus Blockages (#/hr) Mid-Block Traffic (%) % % % Turn Type Perm Prot Prot Protected Phases Permitted Phases 4 Detector Phases Minimum Initial (s) Minimum Split (s) Total Split (s) Total Split (%) 35.2% 35.2% 22.2% 42.6%.% 22.2% 42.6% Yellow Time (s) All-Red Time (s) Lead/Lag Lead Lag Lead Lag Recall Mode None None None Min None Min Act Effct Green (s) Actuated g/c Ratio v/c Ratio Control Delay Queue Delay Total Delay LOS B B C B C B Approach Delay Approach LOS B B B Cycle Length: 18 Actuated Cycle Length: 49.8 Natural Cycle: 8 Control Type: Actuated-Uncoordinated Maximum v/c Ratio:.58 Intersection Signal Delay: 13.5 Intersection Capacity Utilization 51.2% 925: Foxworthy Avenue & Bascom Avenue Intersection LOS: B ICU Level of Service A 374: Moorpark Avenue & Bascom Avenue AM Peak 572: Scott Street & Bascom Avenue AM Peak Volume (vph) Confl. Peds. (#/hr) Confl. Bikes (#/hr) 8 2 Peak Hour Factor Bus Blockages (#/hr) Turn Type Split Perm Prot Prot Protected Phases Permitted Phases 4 Detector Phases Minimum Initial (s) Minimum Split (s) Total Split (s) Total Split (%) 37.1% 37.1% 37.1%.%.%.% 21.4% 32.1%.% 3.7% 41.4%.% Yellow Time (s) All-Red Time (s) Lead/Lag Lead Lag Lead Lag Recall Mode None None None None C-Max None Max Act Effct Green (s) Actuated g/c Ratio v/c Ratio Control Delay Queue Delay Total Delay LOS E C E C E B Approach Delay Approach LOS D D C Cycle Length: 14 Actuated Cycle Length: 14 Offset: 1 (7%), Referenced to phase 2:NBT, Start of Green Natural Cycle: 9 Maximum v/c Ratio:.84 Intersection Signal Delay: 34.2 Intersection LOS: C Intersection Capacity Utilization 73.9% ICU Level of Service D Volume (vph) Confl. Peds. (#/hr) Confl. Bikes (#/hr) Peak Hour Factor Bus Blockages (#/hr) Turn Type Perm Perm Prot Prot Protected Phases Permitted Phases 4 4 Detector Phases Minimum Initial (s) Minimum Split (s) Total Split (s) Total Split (%) 28.6% 28.6%.% 28.6% 28.6%.% 14.3% 57.1%.% 14.3% 57.1%.% Yellow Time (s) All-Red Time (s) Lead/Lag Lead Lag Lead Lag Recall Mode None None None None None C-Max None Max Act Effct Green (s) Actuated g/c Ratio v/c Ratio Control Delay Queue Delay Total Delay LOS D C E A D B Approach Delay Approach LOS D C A B Cycle Length: 14 Actuated Cycle Length: 14 Offset: 2 (1%), Referenced to phase 2:NBT, Start of Green Natural Cycle: 85 Maximum v/c Ratio:.57 Intersection Signal Delay: 1. Intersection LOS: B Intersection Capacity Utilization 42.9% ICU Level of Service A 374: Moorpark Avenue & Bascom Avenue 572: Scott Street & Bascom Avenue
9 Leeming Drive Redevelopment Ottawa, ON Transportation Brief. Prepared By: Stantec Consulting Ltd.
 9 Leeming Drive Redevelopment Ottawa, ON Transportation Brief Prepared By: Stantec Consulting Ltd. TIA GUIDELINES CHECKLIST Report Context Municipal Address Comment: Section 1.1 Location relative to major
REDEVELOPMENT TRAFFIC IMPACT STUDY
 REDEVELOPMENT TRAFFIC IMPACT STUDY For Wendy s Parker, Colorado January 215 Prepared for: Sterling Design Associates, LLC 29 W. Littleton Boulevard #3 Littleton, Colorado 812 Prepared by: 1233 Airport
CENTRAL TRANSPORTATION PLANNING STAFF MEMORANDUM
 CTPS CENTRAL TRANSPORTATION PLANNING STAFF Staff to the Boston Region Metropolitan Planning Organization MEMORANDUM To: Martha White, Natick Town Administrator February 17, 2011 Eric Nascimento, MassDOT
James M. Moore, Director of Planning & Building Services, Town of Fairfax. Victory Village Senior Housing Development Traffic Study
 Traffic Study To: From: James M. Moore, Director of Planning & Building Services, Town of Fairfax David Parisi, PE, TE, Parisi Transportation Consulting Date: October 14, 216 Subject: Victory Village Senior
Lincoln Avenue Road Diet Trial
 Lincoln Avenue Road Diet Trial Data Collection Report June 1, 2015 Department of Transportation Table of Contents I. Introduction...... 3 II. Data Collection Methodology & Results...... 5 A. Traffic Volume
Syracuse University University Place Road Closure
 Transportation Impact Study for the proposed Syracuse University University Place Road Closure City of Syracuse, Onondaga County, NY March 216 Project No. 3613 Prepared For: Syracuse University Office
CENTRAL TRANSPORTATION PLANNING STAFF MEMORANDUM
 CTPS CENTRAL TRANSPORTATION PLANNING STAFF Staff to the Boston Region Metropolitan Planning Organization MEMORANDUM To: Thomas Cummings February 17, 2011 Holbrook Public Works Superintendent From: Re:
Road Conversion Study Plumas Street
 Plumas Street Phase I Submitted to The Regional Transportation Commission of Washoe County Submitted by Zong Tian, Ph.D., P.E. Saeedeh Farivar Haiyuan Li, Ph.D. Center for Advanced Transportation Education
ENKA INTERMEDIATE SCHOOL
 TRANSPORTATION IMPACT ANALYSIS Prepared for Buncombe County Schools ENKA INTERMEDIATE SCHOOL Asheville, NC Project Number: 13-71 8/1/13 www.davenportworld.com DAVENlORT Transportation Impact Analysis Enka
Technical Memo. Steve Gramm, SDDOT. RE: Phase 1, Task 100: Baseline Analysis. To: From: Steve Hoff, HDR Engineering, Inc.
 Technical Memo To: Steve Gramm, SDDOT From: Steve Hoff, Engineering, Inc. Project: I-190/Silver Street Study CC: Date: 6//010 Job No: DOT Contract 41044, Order PD-0-09 RE: Phase 1, Task 100: Baseline Analysis
Traffic Impact Study. Crestline Piggly Wiggly Mountain Brook, Alabama. Goodwyn, Mills and Cawood, Inc. Birmingham, Alabama.
 Traffic Impact Study Crestline Piggly Wiggly Mountain Brook, Alabama Prepared for: Goodwyn, Mills and Cawood, Inc. Birmingham, Alabama September 214 Revision 1 October 214 Crestline Piggly Wiggly Mountain
TRAFFIC IMPACT ANALYSIS
 TRAFFIC IMPACT ANALYSIS FOR THE CHAMPAIGN UNIT#4 SCHOOL DISTRICT PROPOSED HIGH SCHOOL (SPALDING PARK SITE) IN THE CITY OF CHAMPAIGN Final Report Champaign Urbana Urbanized Area Transportation Study 6/24/2014
Multnomah County Courthouse Relocation. Transportation Alternatives Analysis Technical Memorandum: FINAL
 Multnomah County Courthouse Relocation Portland, Oregon Transportation Alternatives Analysis Technical Memorandum: FIL Prepared for Multnomah County Facilities and Property Management Division 41 N Dixon
MEMO DRAFT VIA . Mr. Terry Bailey Foremost Development Company. To: Michael J. Labadie, PE Steven J. Russo, E.I.T. Fleis & VandenBrink.
 MEMO DRAFT VIA EMAIL To: From: Mr. Terry Bailey Foremost Development Company Michael J. Labadie, PE Steven J. Russo, E.I.T. Fleis & VandenBrink Date: August 29, 214 Re: Proposed Apartments City of Walled
Santa Clara I-280 CORRIDOR STUDY
 Santa Clara I-280 CORRIDOR STUDY OCTOBER 2017 PREPARED BY: 1.1 Background The I-280 Corridor Study within Santa Clara County is a high-level highway planning study led by the Santa Clara VTA, in partnership
Northbound San Jose Avenue & I-280 Off-Ramp Road Diet Pilot Project
 Project Overview Fed by a two-lane Interstate-280 (I-280) off-ramp, high vehicular volumes and speeds are longstanding issues along San Jose Avenue. Residents in the surrounding neighborhoods have expressed
Michigan Avenue Traffic Study
 City of Sarnia Michigan Avenue Traffic Study Final Report November 29, 218 B17 SUBMITTED BY CIMA CANADA INC. 4 327 Harvester Road Burlington, ON L7N 3G7 T 289 288-287 F 289 288-285 cima.ca CONTACT Stephen
3.9 - Transportation and Traffic
 Transportation and Traffic 3.9 - Transportation and Traffic This section describes the potential transportation and traffic effects of project implementation on the project site and its surrounding area.
PRELIMINARY DRAFT WADDLE ROAD / I-99 INTERCHANGE PROJECT ALTERNATIVE ANALYSIS FINAL TRAFFIC SUMMARY REPORT
 PRELIMINARY DRAFT WADDLE ROAD / I-99 INTERCHANGE PROJECT ALTERNATIVE ANALYSIS FINAL TRAFFIC SUMMARY REPORT Prepared by: In Association with: November 2013 EXECUTIVE SUMMARY Patton Township, in partnership
The proposed development is located within 800m of an existing Transit Station where infill developments and intensification are encouraged.
 Stantec Consulting Ltd. 1331 Clyde Avenue, Suite 4 Ottawa ON K2C 3G4 Tel: (613) 722-442 Fax: (613) 722-2799 May 14, 213 File: 1638823 Robinson Park Development Corp. 5699 Power Road Ottawa, ON, K1G 3N4
192 & 196 Bronson Avenue / 31 Cambridge Street
 Bronson Inc. July 213 192 & 196 Bronson Avenue / 31 Cambridge Street TRANSPORTATION BRIEF Prepared by: Study 192 Bronson Type Avenue July 213 Study Transportation Name Brief February 211 TB Check List
Travel Demand Management Plan
 Travel Demand Management Plan Linden Corner at 43 rd Street & Upton Avenue South AUTHORIZED PROPERTY REPRESENTATIVE: By Dated: Mark Dwyer Linden Hills Redevelopment, LLC 4632 Washburn Avenue South Minneapolis,
Welcome! San Jose Avenue Open House August 25, 2015
 Welcome! San Jose Avenue Open House August 25, 2015 Vision Zero The City and County of San Francisco adopted Vision Zero San Francisco Vision Zero High Injury Network as a policy in 2014, committing an
25 May 2018 OUR REF:
 25 May 2018 OUR REF: 476088-01000 Roderick Lahey Architect Inc. 56 Beech Street Ottawa, ON K1S 3J6 Attention: Robert Verch Dear Rob: Re: 929 Richmond Road Transportation Impact Assessment Addendum #1 1.
Cycle Track Design Best Practices Cycle Track Sections
 Design Best Practices Sections It is along street segments where the separation and protection methods of cycle tracks offer more comfort than conventional bicycle lanes, and are more attractive to a wide
Dr. M.L. King, Jr. Street North Complete Streets Resurfacing Opportunities HOUSING, LAND USE, AND TRANSPORTATION COMMITTEE MARCH 22, 2018
 Dr. M.L. King, Jr. Street North Complete Streets Resurfacing Opportunities HOUSING, LAND USE, AND TRANSPORTATION COMMITTEE MARCH 22, 2018 What s Happening The City plans to mill and resurface Dr. M.L.
EXECUTIVE SUMMARY... vii 1 STUDY OVERVIEW Study Scope Study Area Study Objectives
 Contents EXECUTIVE SUMMARY... vii 1 STUDY OVERVIEW... 1-1 1.1 Study Scope... 1-1 1.2 Study Area... 1-1 1.3 Study Objectives... 1-3 2 EXISTING CONDITIONS... 2-1 2.1 Existing Freeway Conditions... 2-4 2.1.1
Appendices. Appendix J: Traffic Study
 Appendices Appendix J: Traffic Study The Platinum Triangle Subsequent EIR The Planning Center Appendices This page intentionally left blank. The Platinum Triangle Subsequent EIR The Planning Center TRAFFIC
Welcome. If you have any questions or comments on the project, please contact:
 Welcome This drop-in public open house is intended to provide information about the Bay Street bike lanes project. This project proposes a dedicated cycling facility along Bay Street between Aberdeen Avenue
Magnolia Place. Traffic Impact Analysis. Prepared for: City of San Mateo. Prepared by: Hexagon Transportation Consultants, Inc.
 Magnolia Place Traffic Impact Analysis Prepared for: City of San Mateo Prepared by: Hexagon Transportation Consultants, Inc. Updated January 4, 2010 Table of Contents 1. Introduction...1 2. Existing Conditions...6
Walmart (Store # ) 60 th Street North and Marion Road Sioux Falls, South Dakota
 60 th Street North and Marion Road Sioux Falls, South Dakota") Walmart (Store #4865-00) 60 th Street North and Marion Road Sioux Falls, South Dakota Prepared for: Wal-Mart Stores, Inc. Bentonville, Arkansas Prepared by: Kimley-Horn and Associates, Inc. ã2013 Kimley-Horn
Walmart (Store #4865-00) 60 th Street North and Marion Road Sioux Falls, South Dakota Prepared for: Wal-Mart Stores, Inc. Bentonville, Arkansas Prepared by: Kimley-Horn and Associates, Inc. ã2013 Kimley-Horn
Place Vanier 250 Montreal Road Transportation Impact Study Addendum. Prepared for Broccolini Construction September 20 th, 2012
 Update for the May 31 st, 2012 Traffic Impact Study Prepared for Broccolini Construction 111-23596-00 September 20 th, 2012 2611 Queensview Drive, Suite 300, Ottawa, Ontario CANADA K2B 8K2 Telephone: 613-829-2800
Multimodal Through Corridors and Placemaking Corridors
 68 Multimodal Through Corridors and Placemaking Corridors Corridors have different functions in a region. Some corridors are used to get smoothly and rapidly through a region or to get quickly to major
December TRANSPORTATION BRIEF 1-19 Beechwood Avenue, Ottawa, ON TRANSPORTATION INFORMATION TE WATER
 December 2012 TRANSPORTATION BRIEF 1-19 Beechwood Avenue, Ottawa, ON TRANSPORTATION INFORMATION TE WATER 1-19 Beechwood Avenue Mixed Use Development Transportation Brief prepared for: Minto Communities
Evaluation of M-99 (Broad Street) Road Diet and Intersection Operational Investigation
 Road Diet and Intersection Operational Investigation") Evaluation of M-99 (Broad Street) Road Diet and Intersection Operational Investigation City of Hillsdale, Hillsdale County, Michigan June 16, 2016 Final Report Prepared for City of Hillsdale 97 North Broad
Evaluation of M-99 (Broad Street) Road Diet and Intersection Operational Investigation City of Hillsdale, Hillsdale County, Michigan June 16, 2016 Final Report Prepared for City of Hillsdale 97 North Broad
S. Johnston (IBI Group)
") IBI GROUP 100 175 Galaxy Boulevard Toronto ON M9W 0C9 Canada tel 416 679 1930 fax 416 675 4620 ibigroup.com Memorandum To/Attention Project File Date October 15, 2013 From A. Ortlieb Project No 24RX12.0246.00
IBI GROUP 100 175 Galaxy Boulevard Toronto ON M9W 0C9 Canada tel 416 679 1930 fax 416 675 4620 ibigroup.com Memorandum To/Attention Project File Date October 15, 2013 From A. Ortlieb Project No 24RX12.0246.00
Kanata North Catholic Elementary School
 December 216 Kanata North Catholic Elementary School Transportation Brief SITE Potential Future Development Trillium Woods Prepared for: Bryden Martel Architects Inc Prepared by: KANATA NORTH CATHOLIC
M-58 HIGHWAY ACCESS MANAGEMENT STUDY Mullen Road to Bel-Ray Boulevard. Prepared for CITY OF BELTON. May 2016
 M-58 HIGHWAY ACCESS MANAGEMENT STUDY Prepared for CITY OF BELTON By May 2016 Introduction Missouri State Highway 58 (M-58 Highway) is a major commercial corridor in the City of Belton. As development has
San Tomas Expressway
 Implementation Plan San Tomas Expressway Roads and Airports Department August 19, 2003 Implementation Plan San Tomas Expressway County of Santa Clara Roads and Airports Department 101 Skyport Drive San
Bistro 6. City of Barrie. Traffic Impact Study for Pratt Hansen Group Inc. Type of Document: Final Report. Project Number: JDE 1748
 City of Barrie Traffic Impact Study for Pratt Hansen Group Inc. Type of Document: Final Report Project Number: JDE 1748 Date Submitted: June 12 th, 2017 06/12/17 John Northcote, P.Eng. Professional License
CITY OF OAKLAND. 27th Street Bikeway Feasibility and Design. Final Report (v3) March 23, Kimley-Horn and Associates, Inc.
 March 23, Kimley-Horn and Associates, Inc.") CITY OF OAKLAND 27th Street Bikeway Feasibility and Design Final Report (v3) March 23, 2007 PREPARED BY: Kimley-Horn and Associates, Inc. Table of Contents 1. Introduction 3 2. 27 th Street/Bay Place Corridor
CITY OF OAKLAND 27th Street Bikeway Feasibility and Design Final Report (v3) March 23, 2007 PREPARED BY: Kimley-Horn and Associates, Inc. Table of Contents 1. Introduction 3 2. 27 th Street/Bay Place Corridor
Balancing Operation & Safety for Motorized and Non-Motorized Traffic
 Balancing Operation & Safety for Motorized and Non-Motorized Traffic Brian Willham, PE, PTOE Iowa Director - MOVITE June 30, 2014 Learning Objectives: When & Why should we measure the performance of complete
Washington St. Corridor Study
 FIGURE 7.17 Bridge Alternatives - Cross Sections 86 Discarded Alternative: Short-Term Bridge Repair Short-term repairs and west bridge span replacement were considered during analysis. Short-term repairs
4. Include the associated years anticipated for the short term and long term analysis in the
 2nd DE Review SM ROCHA, LLC responses to City comments are provided within. 8. Trip distribution is displayed in Figure 6. Distribution assumes SFA and commercial traffic combined for most conservative
Re: Tanger Retail Outlets - Phase 2 Addendum #1 to Phase 1 CTS/TIS
 1223 Michael Street, Suite 100 Ottawa, Ontario K1J 7T2 (613) 738-4160 Fax: (613) 739-7105 www.parsons.com 8 December 2014 OUR REF: TO3186TOA RioCan Management Inc. Yonge Eglinton Centre 2300 Yonge Street
EXECUTIVE SUMMARY. Page 1 of 6
 EXECUTIVE SUMMARY The purpose of this report is to identify conformance with the original traffic impact study for the proposed retail development on Lot 5 of Riverdale Retail Filing No. 1 located on the
Complete Street Analysis of a Road Diet: Orange Grove Boulevard, Pasadena, CA
 Complete Street Analysis of a Road Diet: Orange Grove Boulevard, Pasadena, CA Aaron Elias, Bill Cisco Abstract As part of evaluating the feasibility of a road diet on Orange Grove Boulevard in Pasadena,
Circulation and Mobility
 SECTION 4 Circulation and Mobility OVERVIEW The first phase of the circulation analysis is to address specific concerns regarding the circulation system in the vicinity of the Gateway Specific Plan area
BOSTON REGION METROPOLITAN PLANNING ORGANIZATION
 PLANNING ORGANIZATIO BOSTON REGION MPO NMETROPOLITAN BOSTON REGION METROPOLITAN PLANNING ORGANIZATION Richard A. Davey, MassDOT Secretary and CEO and MPO Chairman Karl H. Quackenbush, Executive Direcr,
What Is a Complete Street?
 Session 5 Charleen Zimmer, AICP, Zan Associates May 5-7, 2010 What Is a Complete Street? May 2010 5-1 Not a Complete Street More of a Complete Street May 2010 5-2 Benefits of Complete Streets Safety for
Bank Street Retail/Hotel Development
 M a y 214 89-9 Bank Street Retail/Hotel Development Transportation Brief Google 214 Bing 214 Prepared for: Prepared by: Study 89-9 Type Bank Street May 214 Study Retail/Hotel Name Development February
Student Housing Development
 Traffic Impact Study for the proposed Student Housing Development City of Oneonta Otsego County, New York Project No. 3259 December 212 Revised February 13, 212 Prepared For: Newman Development Group,
OFFICE/RETAIL DEVELOPMENT 1625 BANK STREET OTTAWA, ONTARIO TRANSPORTATION BRIEF. Prepared for: Canada Inc.
 OFFICE/RETAIL DEVELOPMENT 1625 BANK STREET OTTAWA, ONTARIO TRANSPORTATION BRIEF Prepared for: 9402209 Canada Inc. December 15, 2015 115-625 Report_2.doc D. J. Halpenny & Associates Ltd. Consulting Transportation
Highway 111 Corridor Study
 Highway 111 Corridor Study June, 2009 LINCOLN CO. HWY 111 CORRIDOR STUDY Draft Study Tea, South Dakota Prepared for City of Tea Sioux Falls Metropolitan Planning Organization Prepared by HDR Engineering,
THIS PAGE LEFT BLANK INTENTIONALLY
 GA SR 25 Spur at Canal Road Transportation Impact Analysis PREPARED FOR GLYNN COUNTY, GEORGIA 1725 Reynolds Street, Suite 300 Brunswick, Georgia 31520 PREPARED BY 217 Arrowhead Boulevard Suite 26 Jonesboro,
HILTON GARDEN INN HOTEL HOTEL EXPANSION 2400 ALERT ROAD, OTTAWA TRANSPORTATION BRIEF. Prepared for:
 HILTON GARDEN INN HOTEL HOTEL EXPANSION 2400 ALERT ROAD, OTTAWA TRANSPORTATION BRIEF Prepared for: Bona Building & Management Co. Ltd. Place Vanier, 333 North River Road Vanier, Ontario K1L 8B9 October
David DiPierro, John Amberson. Steering Committee Meeting #4 Overview
 IBI GROUP 18401 Von Karman Avenue Suite 110 Irvine CA 92612 USA tel 949 833 5588 fax 949 833 5511 ibigroup.com Memorandum To/Attention Steering Committee Members Date February 17, 2016 From IBI Group Project
Waterford Lakes Small Area Study
 Waterford Lakes Small Area Study Existing Traffic Conditions PREPARED FOR: ORANGE COUNTY PUBLIC WORKS DEPARTMENT TRAFFIC ENGINEERING DIVISION ORLANDO, FLORIDA PREPARED WITH: INWOOD CONSULTING ENGINEERS
February 24, 2017 Project #: 20076
 February 24, 217 Project #: 276 Jinde Zhu Washington County Department of Land Use and Transportation 14 SW Walnut Street MS 17 Hillsboro, Oregon 97213 RE: Sunset Ridge Phase 2 Access Report and Zone Change
US 41 COMPLETE STREETS CORRIDOR PLANNING STUDY from University Parkway to Whitfield Avenue
 41 US 41 COMPLETE STREETS CORRIDOR PLANNING STUDY from University Parkway to Whitfield Avenue EXECUTIVE SUMMARY DRAFT FEBRUARY 2019 Project Overview The US 41 Complete Streets Corridor Planning Study,
Simulation Analysis of Intersection Treatments for Cycle Tracks
 Abstract Simulation Analysis of Intersection Treatments for Cycle Tracks The increased use of cycle tracks also known as protected bike lanes has led to investigations of how to accommodate them at intersections.
Implementing Complete Streets in Ottawa. Project Delivery Process and Tools Complete Streets Forum 2015 October 1, 2015
 Implementing Complete Streets in Ottawa October 1, 2015 The Essentials Complete Streets Implementation Framework will become part of the routine delivery of City transportation projects Approach uses every
ATTACHMENT C EXISTING TRANSIT CONDITIONS AND POTENTIAL IMPROVEMENTS
 ATTACHMENT C EXISTING TRANSIT CONDITIONS AND POTENTIAL IMPROVEMENTS a partnership of EXISTING CONDITIONS AND OPPORTUNITIES REPORT Public Review Draft December 2017 MEMORANDUM Date: To: From: Subject: Dan
TABLE OF CONTENTS. Executive Summary
 Executive Summary Background... ES-1 Pedestrian Network... ES-2 Bikeway Network... ES-2 Collision History... ES-2 Public Input... ES-4 Conclusions and Recommendations... ES-4 1. Introduction and Setting
DUNBOW ROAD FUNCTIONAL PLANNING
 DUNBOW ROAD FUNCTIONAL PLANNING Final Report August 3, 216 #31, 316 5th Avenue NE Calgary, AB T2A 6K4 Phone: 43.273.91 Fax: 43.273.344 wattconsultinggroup.com Dunbow Road Functional Planning Final Report
Road Diets FDOT Process
 Florida Department of TRANSPORTATION Road Diets FDOT Process Humberto Castillero, PE, PTOE Roadway Design Office Purpose of Guide Develop a statewide lane elimination review process Balance state & local
DOWNTOWN TUPELO MAIN STREET: ROAD DIET STUDY
 DOWNTOWN TUPELO MAIN STREET: ROAD DIET STUDY Since mid-2009, RPM Transportation Consultants (RPM) has worked with the Downtown Tupelo Main Street Association to evaluate traffic conditions and potential
INDUSTRIAL BUILDING 3009 HAWTHORNE ROAD CITY OF OTTAWA TRANSPORTATION OVERVIEW REVISED. Prepared for: Canada Inc.
 INDUSTRIAL BUILDING 3009 HAWTHORNE ROAD CITY OF OTTAWA TRANSPORTATION OVERVIEW REVISED Prepared for: 7849648 Canada Inc. Octiober 1, 2015 114-598 Overview_2.doc D. J. Halpenny & Associates Ltd. Consulting
TRANSPORTATION COMMISSION Agenda Staff Report
 TRANSPORTATION COMMISSION Agenda Staff Report Agenda Item No. 5.a DATE: JULY 31, 2014 TO: FROM: SUBJECT: TRANSPORTATION COMMISSION COMMUNITY DEVELOPMENT DEPARTMENT - PLANNING DRAFT OLYMPIC CORRIDOR PREFERRED
APPENDIX A: Complete Streets Checklist DRAFT NOVEMBER 2016
 APPENDIX A: Complete Streets Checklist DRAFT NOVEMBER 2016 Complete Streets Checklist MetroPlan Orlando s Complete Streets Checklist is an internal planning tool for staff to further implementation of
3.0 PROJECT DESCRIPTION
 The following section of the Draft EIR contains a description of the proposed Elk Grove Boulevard/SR 99 Interchange Modification project, consistent with the requirements of CEQA Guidelines Section 15124.
Transportation and General Civil Engineering Projects
 Continuing Engineering Services for Transportation and General Civil Engineering Projects Broward County, Florida Why Atkins 2 Existing and Past Clients 3 25+ years Experienced in Civil Engineering PM
HUMC/Mountainside Hospital Redevelopment Plan
 Traffic and Parking Analysis HUMC/Mountainside Hospital Redevelopment Plan in Glen Ridge Borough and Montclair Township PREPARED FOR H2M 119 Cherry Hill Road, Suite 11 Parsippany, NJ 754 862.27.59 PREPARED
Date: April 7, 2015 To: Chris Hartzell, PE Dakota County, MN From: Jacob Bongard, PE Bolton & Menk, Inc. Subject: Traffic Considerations Memorandum
 M E M O R A N D U M Date: April 7, 2015 To: Chris Hartzell, PE Dakota County, MN From: Jacob Bongard, PE Bolton & Menk, Inc. Subject: Traffic Considerations Memorandum I. Introduction The objective of
DRAFT MEMORANDUM. 1. Introduction
 Dowling Associates, Inc. 180 Grand Ave., Suite 250, Oakland, CA 94612 (510) 839-1742 FAX: (510) 839-0871 428 J Street, Suite 500, Sacramento, CA 95814 (916) 266-2190 FAX: (916) 266-2195 MEMORANDUM To:
4. ENVIRONMENTAL IMPACT ANALYSIS 9. TRANSPORTATION AND TRAFFIC
 4. ENVIRONMENTAL IMPACT ANALYSIS 9. TRANSPORTATION AND TRAFFIC 4.9.1 INTRODUCTION The following section addresses the Proposed Project s impact on transportation and traffic based on the Traffic Study
C C C
 C-012-001 Thank you for your support for the creation of new public space and nonmotorized access between downtown and the waterfront through the Overlook Walk, the East-West Connections, and the Promenade.
STRATEGY 4 INC Mainway, City of Burlington. [ Month Year ] Project No.: TRAFFIC IMPACT AND PARKING STUDY APRIL 2018
![STRATEGY 4 INC Mainway, City of Burlington. [ Month Year ] Project No.: TRAFFIC IMPACT AND PARKING STUDY APRIL 2018](/thumbs/96/127235543.jpg "STRATEGY 4 INC Mainway, City of Burlington. [ Month Year ] Project No.: TRAFFIC IMPACT AND PARKING STUDY APRIL 2018") STRATEGY 4 INC. TRAFFIC IMPACT AND PARKING STUDY 3257 Mainway, City of Burlington Project No.: 27-675 APRIL 28 [ Month Year ] April 7, 28 Reference No. 27-675 Mr. Jeff Kenny Strategy 4 Inc. 262 Bristol
STRATEGY 4 INC. TRAFFIC IMPACT AND PARKING STUDY 3257 Mainway, City of Burlington Project No.: 27-675 APRIL 28 [ Month Year ] April 7, 28 Reference No. 27-675 Mr. Jeff Kenny Strategy 4 Inc. 262 Bristol
APPENDIX H EXISTING TRAFFIC CONDITIONS ANALYSIS
 APPENDIX H EXISTING TRAFFIC CONDITIONS ANALYSIS MEMO : Peter Steacy, P.Eng. Date: December 3, 2014 : Ian Borsuk, P.Eng. Job No.: 3414015-000 Subject: City of Ottawa O-Train Extension Planning & EA Study
Clackamas County Comprehensive Plan
 ROADWAYS The County s road system permits the movement of goods and people between communities and regions, using any of a variety of modes of travel. Roads provide access to virtually all property. They
San Jose Transportation Policy
 San Jose Transportation Policy Protected Intersections in LOS Policies to Support Smart Growth Presented by: Manuel Pineda City of San Jose Department of Transportation Bay Area Map San Francisco Oakland
FAIRFIELD INN & SUITES HOTEL 135 THAD JOHNSON PRIVATE OTTAWA TRANSPORTATION BRIEF. Prepared for:
 FAIRFIELD INN & SUITES HOTEL 135 THAD JOHNSON PRIVATE OTTAWA TRANSPORTATION BRIEF Prepared for: Bona Building & Management Co. Ltd. Place Vanier, 333 North River Road Vanier, Ontario K1L 8B9 August 12,
RZC Appendix 8A Marymoor Subarea Street Requirements
 RZC Appendix 8A Marymoor Subarea Street Requirements For additional design details for Marymoor Subarea infrastructure, refer to the 2017 Marymoor Subarea Infrastructure Planning Report. STREET REQUIREMENTS
Figure 1: Vicinity Map of the Study Area
 ARIZONA TEXAS NEW MEXICO OKLAHOMA May 5, 2016 Mr. Anthony Beach, P.E. BSP Engineers 4800 Lakewood Drive, Suite 4 Waco, Texas 76710 Re: Intersection and Access Analysis along Business 190 in Copperas Cove
ALLEY 24 TRAFFIC STUDY
 ALLEY 24 TRAFFIC STUDY in City of Frostburg, Maryland January 2013 3566 Teays Valley Road Hurricane, WV Office: (304) 397-5508 www.denniscorporation.com Alley 24 Traffic Study January 2013 Frostburg, Maryland
122 Avenue: 107 Street to Fort Road
 : 107 Street to Fort Road November 24, 2015 4:30 8:00 p.m. Meeting Purpose Summarize project work completed to date Share results of public input from Phase 1 Share the draft concept plan and proposed
BETHEL ROAD AND SEDGWICK ROAD CORRIDOR STUDY
 DRAFT PLAN City Council Meeting August 14, 2017 STUDY AREA Sedgwick Corridor State Route 160, principal arterial with Class 3 access management designation, commuter and freight route, connection to SR
METHODOLOGY. Signalized Intersection Average Control Delay (sec/veh)
") Chapter 5 Traffic Analysis 5.1 SUMMARY US /West 6 th Street assumes a unique role in the Lawrence Douglas County transportation system. This principal arterial street currently conveys commuter traffic
Chapter 5 Traffic Analysis 5.1 SUMMARY US /West 6 th Street assumes a unique role in the Lawrence Douglas County transportation system. This principal arterial street currently conveys commuter traffic
List of Attachments. Location Map... Site Plan... City of Lake Elsinore Circulation Element... City of Lake Elsinore Roadway Cross-Sections...
 List of Attachments Exhibits Location Map... Site Plan... City of Lake Elsinore Circulation Element... City of Lake Elsinore Roadway Cross-Sections... Existing Lane Geometry and Traffic Controls... Existing
City of Seattle Edward B. Murray, Mayor
 City of Seattle Edward B. Murray, Mayor Department of Transportation Scott Kubly, Director Eastlake Community Council 117 E Louisa St. #1 Seattle, WA 98102-3278 January 28, 2016 RE: Roosevelt to Downtown
TRANSPORTATION TRAINING TOPICS. April 6, 2010
 TRANSPORTATION TRAINING TOPICS April 6, 2010 Roles of Transportation Providers Context and Policy Makers Division of Transportation and Traffic Other City Operations Other Transportation Operators CMA
5858 N COLLEGE, LLC N College Avenue Traffic Impact Study
 5858 N COLLEGE, LLC nue Traffic Impact Study August 22, 2016 Contents Traffic Impact Study Page Preparer Qualifications... 1 Introduction... 2 Existing Roadway Conditions... 5 Existing Traffic Conditions...
Operational Comparison of Transit Signal Priority Strategies
 Operational Comparison of Transit Signal Priority Strategies Revision Submitted on: November, 0 Author: Adriana Rodriguez, E.I Assistant Engineer Parsons Brinckerhoff 0 South Orange Avenue, Suite 00 Orlando,
CITY OF LOS ANGELES INTER-DEPARTMENTAL MEMORANDUM
 CITY OF LOS ANGELES INTER-DEPARTMENTAL MEMORANDUM Date: April 1, 219 To: Honorable City Council c/o City Clerk, Room 395, City Hall Attention: Honorable Mike Bonin, Chair, Transportation Committee From:
CITY OF LOMITA CITY COUNCIL REPORT
 CITY OF LOMITA CITY COUNCIL REPORT TO: FROM: City Council Ryan Smoot, City Manager Item No. SCH 12 PREPARED BY: Mark A. McAvoy, P.E., Public Works Director/City Engineer MEETING DATE: August 1, 2017 SUBJECT:
Route 7 Corridor Study
 Route 7 Corridor Study Executive Summary Study Area The following report analyzes a segment of the Virginia State Route 7 corridor. The corridor study area, spanning over 5 miles in length, is a multi
Los Altos Hills Town Council - June 18, 2015 Palo Alto City Council June 22, AGENDA ITEM #2.B Presentation
 Los Altos Hills Town Council - June 18, 2015 Palo Alto City Council June 22, 2015 AGENDA ITEM #2.B Presentation Previous Presentations Los Altos Hills Town Council in May 2014 and February 2015 Palo Alto
4.13 TRANSPORTATION AND TRAFFIC
 4.13 This chapter describes the regulatory framework and existing conditions in the vicinity of the Project site related to transportation and traffic, and the potential impacts of the proposed Project
George Street Transportation Impact Study. Paradigm Transportation Solutions Limited
 George Transportation Impact Study Paradigm Transportation Solutions Limited January 217 Project Summary Project Number 16191 January 217 Client Wastell Homes 5-1895 Blue Heron Drive London ON N6H 5L9
Broadway Complete Streets Project
 Broadway Complete Streets Project Megan Johnson, P.E. Associate Civil Engineer James Pangburn, P.E. Consultant Project Manager After the construction of the highway system, Broadway was cut off