US 81 CORRIDOR STUDY FROM NORTH OF UNION CITY SOUTH TO SH 19 SOUTH OF CHICKASHA CANADIAN AND GRADY COUNTIES, OKLAHOMA JULY 2007
|
|
|
- Jared Walton
- 5 years ago
- Views:
Transcription
1 US 81 CORRIDOR STUDY FROM NORTH OF UNION CITY SOUTH TO SH 19 SOUTH OF CHICKASHA CANADIAN AND GRADY COUNTIES, OKLAHOMA JULY 2007 PREPARED BY THE RESEARCH AND PLANNING DIVISION OKLAHOMA DEPARTMENT OF TRANSPORTATION
2 Section TABLE OF CONTENTS Page 1.0 INTRODUCTION Background Northern Section Description Chickasha Section Description Summary of Previous Studies Existing Roadway Characteristics Surface Width and Type Shoulder Width and Type Existing Right-of-Way Widths Access Control Sufficiency Ratings Environmental Analysis EXISTING TRAFFIC EVALUATION Baseline Traffic Conditions Northern Section Twenty-Four Hour Vehicle Counts Peak Hour Turning Movement Counts Vehicle Classification Accident Summary Chickasha Section Hour Vehicle Counts License Plate Survey Vehicle Classification Accident Summary i
3 3.2 Baseline Roadway Capacity Analysis Northern Section Chickasha Section Baseline Traffic Operations Summary Baseline Intersection Capacity Analysis US 81 at SH 37E, Downtown Minco US 81 at SH 152E, Union City US 81 at SH 37W and SH 152W Origin-Destination Study Data Collection Methodology and Execution Factors Affecting Data Collection Chickasha Section Traffic Rationale Data Analysis West Bypass Analysis Origin-Destination Findings IMPROVEMENT ANALYSIS Future Traffic Analysis, No-Build Alternative Future Traffic Demand Northern Section Chickasha Section Future Roadway Capacity Analysis Northern Section Chickasha Section Development of Build Alternatives Northern Section Chickasha Section ii
4 4.3 Future Traffic Analysis, Build Alternatives Future Traffic Demand Northern Section Chickasha Section Future Roadway Capacity Analysis Northern Section Chickasha Section Intersection Warrant Analysis Intersection Warrant Studies US 81 and SH 37E, Downtown Minco US 81 and SH 152E, Union City Selection of Recommended Alternative Northern Section, Rural Areas Construction Costs Environmental Analysis Recommended Improvement Northern Section, Through Cities Construction Costs and LOS Comparison Environmental Analysis Recommended Improvement Chickasha Section Environmental Analysis Recommended Improvement Project Segment Identification, Costs, and Prioritization Programmed Projects along US 81 Corridor Northern Section iii
5 4.5.3 Chickasha Section PUBLIC INVOLVEMENT Introduction Informal Stakeholder Meetings Public Meetings Summary RECOMMENDATIONS iv
6 LIST OF TABLES Table Page 2-1 Elements of Roadway Sufficiency Ratings Roadway Sufficiency Rating Structure Sufficiency Ratings Average Daily Traffic Summary, US 81 Corridor, Northern 13 Section Peak Hour Turning movement Counts, US 81 Corridor, 14 Northern Section Average Daily Traffic Summary, US 81 Corridor, Chickasha 19 Section 3-4 Roadway Level of Service Definition Summary Baseline Roadway Level of Service Summary, US 81 Corridor, 23 Northern Section 3-6 Baseline Roadway Level of Service Summary, US 81 Corridor, 24 Chickasha Section 3-7 Intersection Level of Service Definition Summary Baseline Intersection Level of Service Summary Rationale Matrix for Origin Location Traffic Travel along West 30 Bypass 3-10 Rationale Matrix for Origin Location Traffic Travel along North 31 Bypass 3-11 Proposed Bypass Routes Trip Destination Summary AM Peak Proposed Bypass Routes Trip Destination Summary PM Peak Proposed Bypass Routes Trip Destination Summary ADT Proposed West Bypass Routes Trip Destination Summary AM Peak Proposed West Bypass Routes Trip Destination Summary PM Peak Proposed West Bypass Routes Trip Destination Summary ADT Compared Field Data and ODOT ADT Projected Average Daily Traffic Volumes, US 81 Corridor, 37 Northern Section, No-Build Alternative 4-3 Projected Average Daily Traffic Volumes, US 81 Corridor, 38 Chickasha Section, No-Build Alternative 4-4 Future 2030 Capacity and LOS Analysis, US 81 Corridor, 42 Northern Section, No-Build Alternative 4-5 Future 2030 Capacity and LOS Analysis, US 81 Corridor, 43 Chickasha Section, No-Build Alternative 4-6 Projected Average Daily Traffic Volumes, US 81 Corridor, 53 Northern Section, Alternatives 1, 2, and Projected Average Daily Traffic Volumes, US 81 Corridor, 54 Chickasha Section, West Bypass Alternative 4-8 Future 2030 Capacity and LOS Analysis, US 81 Corridor, Northern 57 Section, Alternatives 1, 2, and Future 2030 Capacity and LOS Analysis, US 81 Corridor, Chickasha 59 Section, West Bypass Alternative 4-10 Future 2030 Capacity and LOS Analysis, US 81 Corridor, 60 Chickasha Section, Existing US 81 after Construction of West Bypass Alternative v
7 4-11 Future 2030 Intersection LOS Summary, US 81 Corridor, Northern 60 Section 4-12 Justification of Northern Section Intersection Signalization Using 62 MUTCD Warrants 4-13 Construction Segment Summary, US 81 Corridor, Northern Section Construction Cost Estimates for 12 Construction Segments, US Corridor, Northern Section 4-15 Construction Segment Prioritization, US 81 Corridor, Northern Section Construction Cost Estimates for Construction Segments, US 81 Corridor, 71 Proposed Chickasha West Bypass 4-17 Cost Estimates and Priorities for 12 Construction Segments, US Corridor, Northern Section 4-18 Cost Estimates and Priorities, US 81 Corridor, Proposed Chickasha 79 West Bypass vi
8 LIST OF FIGURES Figure Page 1-1 US Highway 81 Corridor US 81 Corridor Study Sufficiency Ratings, District US 81 Corridor Study Sufficiency Ratings, District Traffic Survey Locations, Northern Section Traffic Survey Locations, Chickasha Section Existing Facility, 2004 Traffic Volumes and Level of Service Existing Facility, 2030 Traffic Volumes and Level of Service Union City Bypass Alignments Minco Bypass Alignments Pocasset Bypass Alignments Chickasha West Bypass Alignment Chickasha North Bypass Alignment Proposed Facility 4-Lane, 2030 Traffic Volumes and Level of Service Proposed Chickasha West Bypass 4-Lane, 2030 Traffic Volumes 55 and Level of Service 4-10 Chickasha West Bypass Alternates US 81 Corridor Construction Segments, Northern Section US 81 Corridor Construction Information, Chickasha West Bypass 72 vii
9 LIST OF APPENDICES Appendix A Previous Studies B Roadway Data C Sufficiency Ratings D Environmental Analysis Materials (Solicitation Letters and Responses; Environmental Data Resources, Inc. Reports; and Environmental Constraints Maps under separate cover) E Origin-Destination Study F Interchange Traffic Volumes, with and Without improvement G Intersection Warrant Analyses H 4-Lane vs. 5-Lane Comparison/Recommendation I Construction Cost Estimates J Right-of-Way Cost Estimates K Utility Cost Estimates L Public Meeting Materials M Internal Meeting Minutes viii
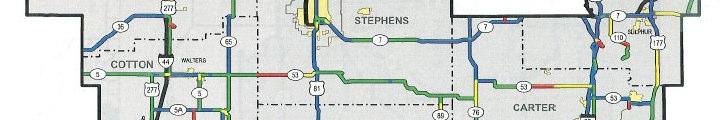
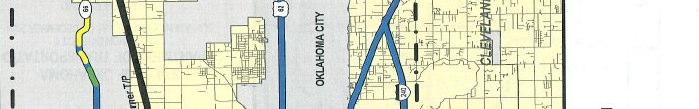
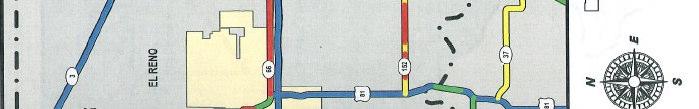
10 1.0 INTRODUCTION 1.1 Background The scope of this Corridor Study is to evaluate US 81 for improvement to four lanes along an approximate 30-mile segment from the existing reconstruction of US 81 just north of Union City to south of SH 19 in Chickasha. The Corridor Study also evaluates the need for bypasses in the communities of Union City, Minco, Pocasset, and Chickasha. The project extents are illustrated on Figure 1-1. This Corridor Study report contains the following information: Description of the Study Corridor and a summary of previous studies (Chapter One) Existing roadway and traffic characteristics, a comparison to current federal safety standards, sufficiency ratings, and environmental conditions along the corridor (Chapter Two) Evaluation of baseline traffic, roadway capacity, and intersection capacity, as well as a discussion of the origin-destination (O-D) study performed for the Chickasha Section (Chapter Three) A review of projected future traffic under the No-Build Alternative, identification of proposed Build Alternatives and analysis of future traffic under those alternatives, selection of recommended improvements, and a discussion of project segment identification and prioritization (Chapter Four) Public involvement with stakeholders, other agencies, organizations, and the public (Chapter Five) Summary of recommendations (Chapter Six) This facility is a north-south US numbered route. The original 1926 highway was a border-to-border route, but decommissioning in the 1990s moved the southern end from Laredo, Texas to Saginaw, Texas, just north of Fort Worth. Currently, the highway s northern terminus is just north of Pembina, North Dakota at the Canadian border. 1
11
12 From the Texas border north to US 412 in Enid, Oklahoma, US 81 is part of the National Highway System. Through this section, the majority of US 81 is primarily a four-lane highway that has been greatly improved in recent years. The approximate 30-mile segment of US 81 which is the subject of this Corridor Study will be divided into two (2) distinct sections for purposes of analysis. This report will refer to these two sections as the Northern Section and the Chickasha Section. 1.2 Northern Section Description The Northern Section extends from the existing reconstruction of US 81 just north of Union City and proceeds southerly approximately 26 miles to the US 62 and US 81 junction northwest of Chickasha. Three (3) towns are located along this section of US 81: Union City, Minco, and Pocasset. 1.3 Chickasha Section Description The Chickasha Section of US 81 begins at the US 62 and US 81 junction northwest of Chickasha, proceeds east for two miles, then continues south through the City of Chickasha approximately four miles to just south of the US 81 and SH 19 junction south of Chickasha. 1.4 Summary of Previous Studies A report prepared by ODOT s Rural Transportation Planning Branch in 1978 titled Preliminary Background Report on US 81 (Chickasha Bypass) in Grady County indicated that a proposed west US 81 bypass of Chickasha was not a justifiable expenditure of public funds at that time. However, the report concluded that if traffic volumes continue to increase, the bypass may prove to be a feasible investment in the future. A subsequent ODOT report dated 1992 and titled Feasibility Study for a US 81 Bypass Route in Chickasha, Oklahoma indicated that a West Bypass of Chickasha should be considered for programming when funding became available. Copies of these reports are included in Appendix A. 3
13 2.0 EXISTING ROADWAY CHARACTERISTICS 2.1 Surface Width and Type The Northern Section of the US 81 study corridor is primarily a two-lane, 24-foot wide asphaltic concrete facility. Through the developed areas of Union City, Minco, and Pocasset, the roadway sections range from two-lane to four-lane wide asphaltic concrete facilities. The Chickasha Section of the US 81 study corridor is constructed as both a divided section and an undivided section roadway. The undivided section is generally located in the downtown Chickasha area, beginning at 11 th Street and proceeding easterly to 4 th Street, then continuing southerly to Grand Avenue. This undivided section is predominantly a four-lane, 48-foot wide asphalt facility. US 81 has been widened to five-lane cross sections at some of the downtown intersections to accommodate left turn bays. The remaining roadway in the Chickasha Section is divided. The divided section located west of 11th Street is constructed mostly as an asphaltic concrete facility with two 12-foot lanes in each direction and a 40-foot median. The divided section roadway located south of Grand Avenue is constructed as a Portland cement concrete facility, consisting of two 12-foot lanes in each direction and a 16-foot or 24-foot median. 2.2 Shoulder Width and Type In the Northern Section, paved outside shoulders varying in width from 8 to 10 feet exist along most of the roadway corridor. Some roadway sections have curbs on both sides in place of a shoulder. Through the developed areas of Union City, Minco, and Pocasset, curbs often replace the paved shoulders for the widened segments of US 81. In the Chickasha Section northwest of Chickasha, shoulders are 10 feet on the outside and 4 feet along the inside. In the downtown area and south of Chickasha, shoulders are paved or curb and gutter is present. 4
14 2.3 Existing Right-of-Way Widths Various right-of-way (ROW) widths exist along US 81 within the study corridor limits. Most of US 81 is a two-lane facility and has a ROW width ranging from 100 to 160 feet. The ROW through the developed areas of Union City, Minco, and Pocasset is 80 feet. From the US 81 and US 62 split northwest of Chickasha proceeding northerly to south of the Chickasha airport, the ROW width is 300 feet or greater. Appendix B contains roadway data for US 81 including ROW widths. 2.4 Access Control There is currently no access control along US 81. No access control is defined as a facility for which the number of points of ingress and egress onto the roadway are unlimited, except for control over the placement and geometrics of connections as necessary for the safety of the traveling public. In contrast, facilities with full control of access provide connections only at grade-separated interchanges, thus prohibiting atgrade crossings and direct private driveway connections. 2.5 Sufficiency Ratings Biennially, ODOT prepares a statewide needs study and sufficiency rating report for roadways, bridges, and structures throughout Oklahoma. The latest study was published in 2005 and contains sufficiency ratings as of July 1, The study assesses the adequacy of the design and condition of the existing State Highway System to serve traffic for the next 20 years. Elements of design and condition are evaluated and assigned relative point values, and the roadway or structure is then assigned a sufficiency rating based upon the total rating value. The total rating value ranges from 0 to 100 points. The factors rated and their maximum point values for roadways are presented in Table 2-1. Table 2-1: Elements of Roadway Sufficiency Ratings Rural Roadway Municipal Roadway 5
15 Design Factor Surface Width Surface Type Shoulder Width & Type Maximum Value Condition Factor Maximum Value Design Factor 16 Foundation 14 Surface Width 8 Wearing Surface 10 Traffic Control 6 Drainage 7 Cross Section Curvature 8 Shoulders 4 Surface Type Maximum Value Gradient 5 Drainage 5 Stopping Sight Distance Passing Opportunity 8 Alignment 8 8 Hazards 6 Condition Factor Maximum Value 16 Foundation Wearing Surface Drainage 7 8 Shoulders 4 Total 65 Total 35 Total 65 Total 35 Total Design & Condition ( ) = 100 The roadway can then be classified according to adequacy as a result of total points as shown in Table 2-2. Table 2-2: Roadway Sufficiency Ratings Sufficiency Rating Classification Adequate Tolerable Inadequate 59 & Critically Below Inadequate Structures are assessed and rated in the terms presented in Table 2-3. Table 2-3: Structure Sufficiency Ratings 6
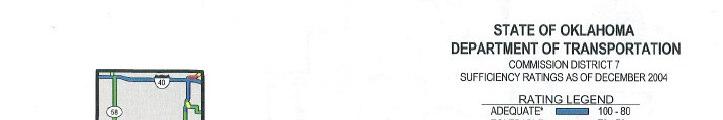
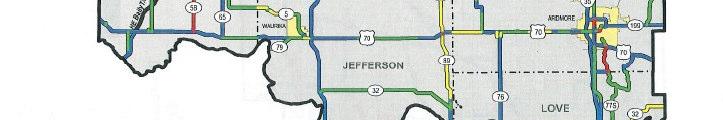
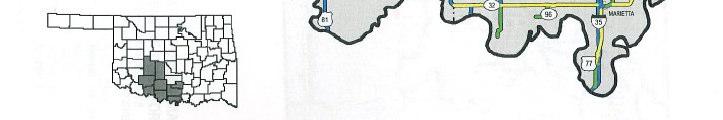
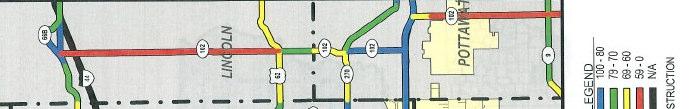
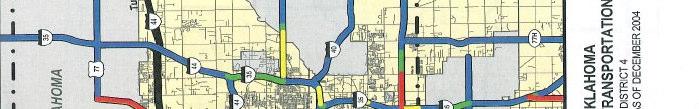
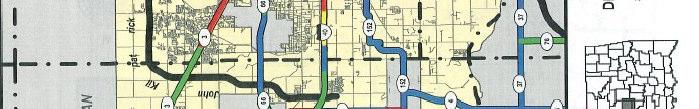
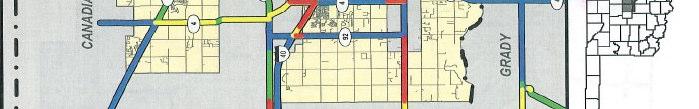
16 Sufficiency Rating Adequate (AD) Structurally Deficient (SD) Functionally Deficient (FD) Not Rated (NR) Description Meeting minimum design and safety standards Physical condition properties below minimum standards Geometric properties considered deficient Structure underground and cannot be rated Review of the 2005 needs study and sufficiency rating report indicates that most of the roadways within the US 81 corridor limits are rated as Adequate. Only a short extent within Chickasha has a lower rating of Tolerable. The only structure within the corridor that is not rated Adequate is the Canadian River bridge, located north of SH 37 on US 81. See Figures 2-1 and 2-2 for maps of sufficiency ratings in District 7 and 4, or Appendix C for sufficiency ratings for the project extent. 2.6 Environmental Analysis Letters soliciting comments relative to anticipated social, economic, and environmental effects of improvement to the US 81 corridor were issued April 26, 2005 to tribal, local, state, and federal agencies. A copy of the solicitation letter, a list of the agencies contacted, and all responses are included in Appendix D, which is bound under separate cover. A database search was also conducted for known environmental issues as reported by Federal, State and/or Local regulatory agencies. Environmental Data Resources, Inc. (EDR) located in Southport, Connecticut, performed the database search and prepared reports of all available environmental information for the corridor, including Leaking Underground Storage Tanks (LUSTs) sites and hazardous and solid waste management sites. Copies of the EDR reports are included in Appendix D. Lastly, a windshield survey of the corridor was conducted to note sensitive areas and facilities. The information collected from the agencies responses, the EDR reports, and 7
17


18
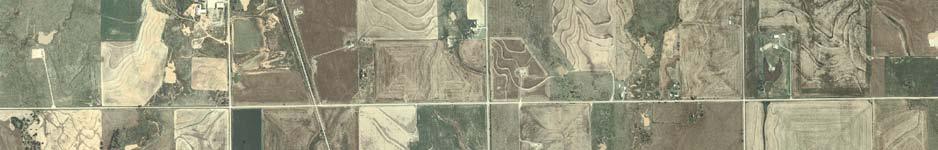
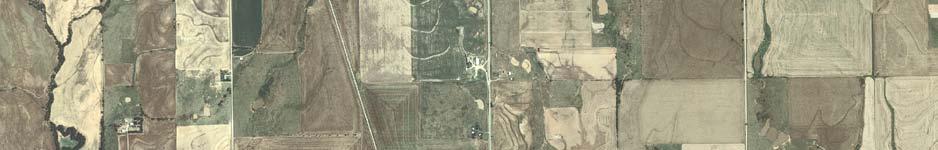
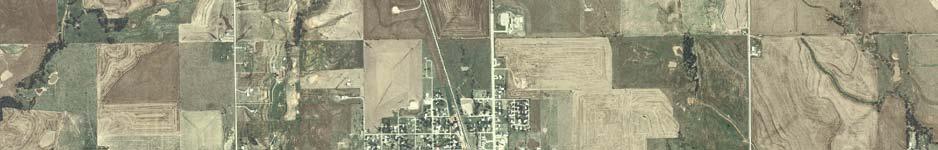
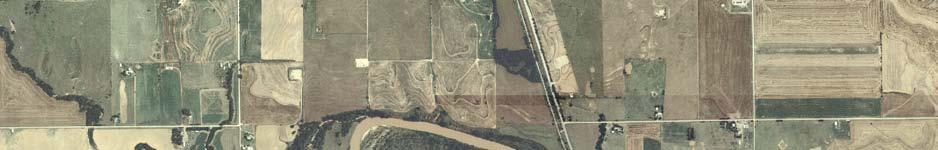
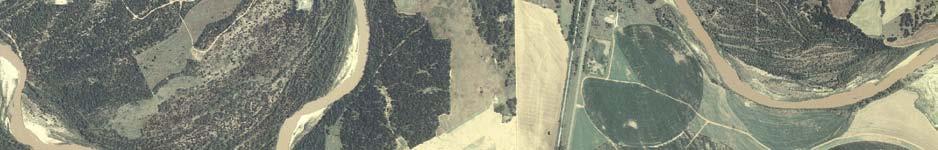
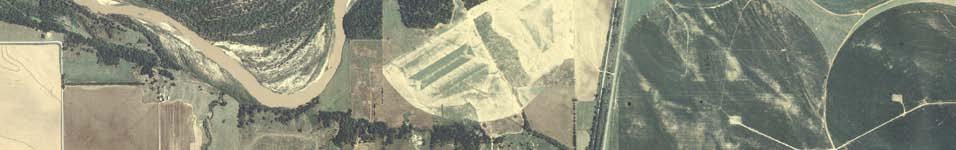
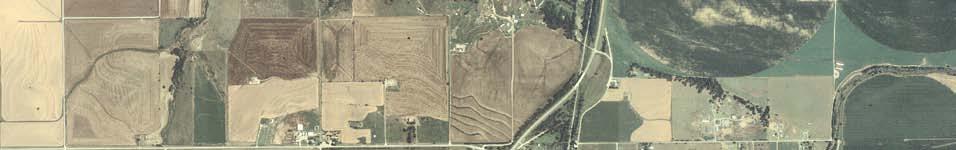
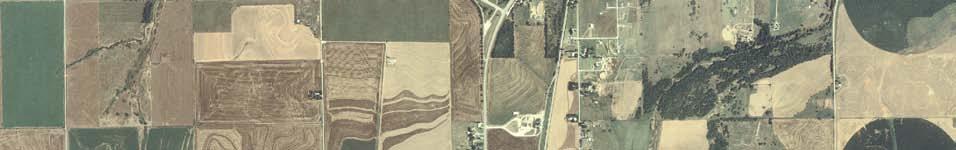
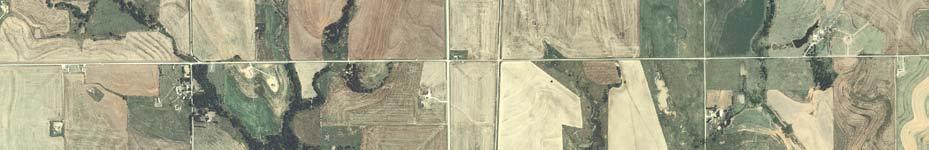
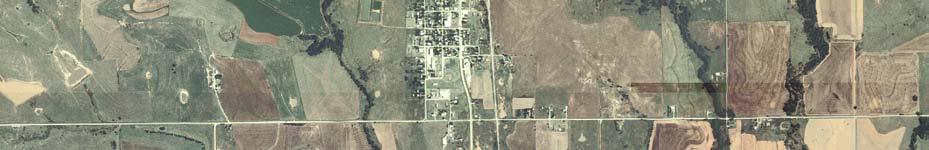
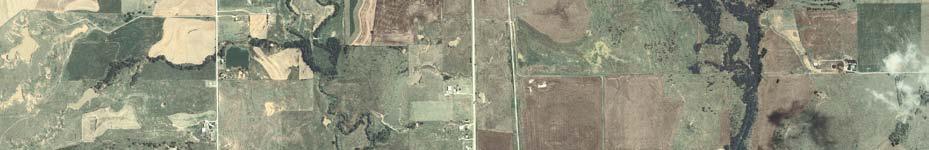
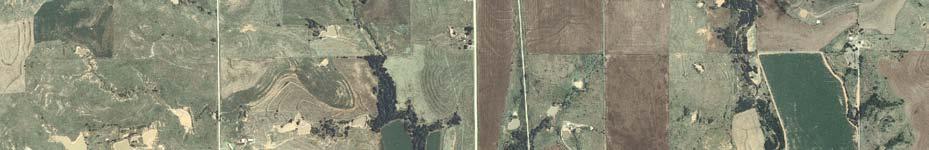
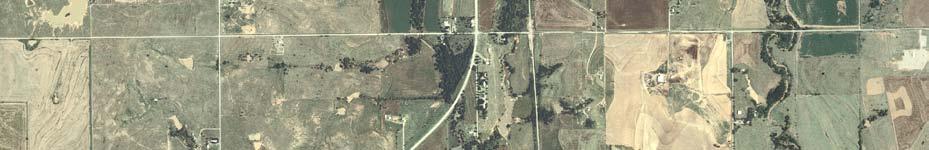
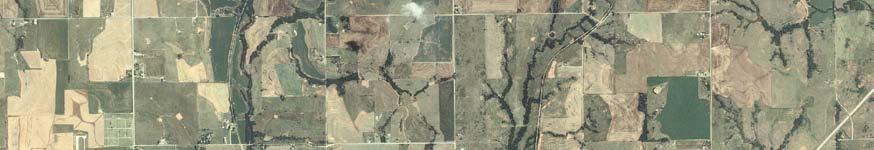
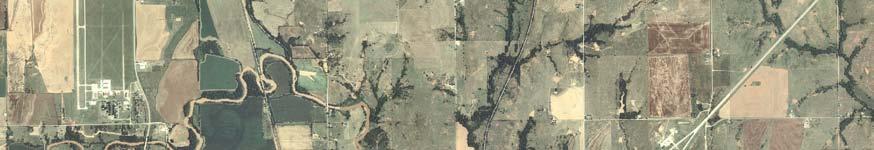
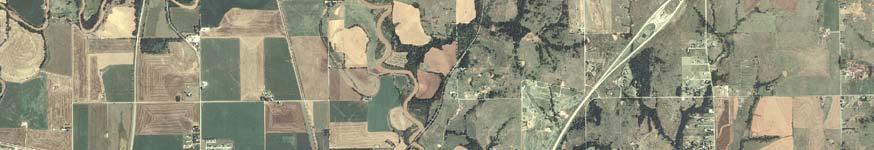
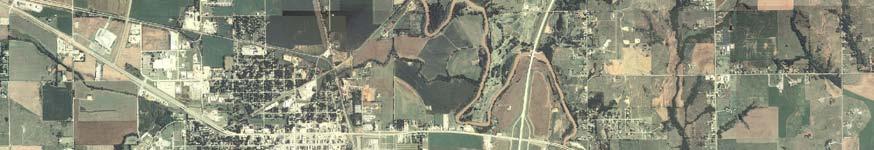
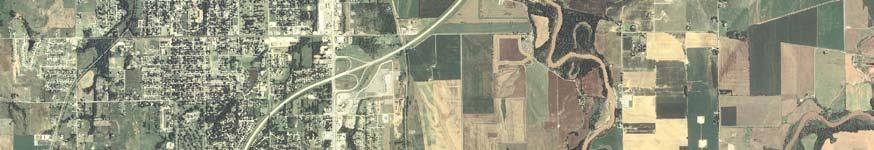
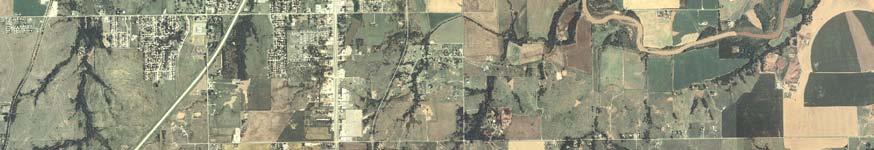
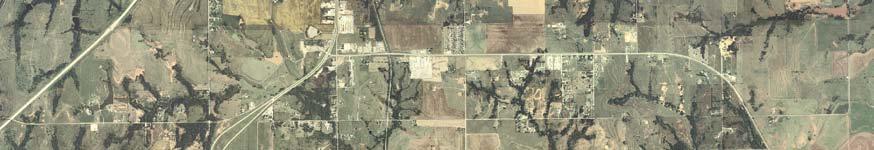
19 the windshield survey were compiled to prepare environmental constraints maps, using aerial base maps of the corridor. Selected environmental considerations within the study corridor of approximately 600 feet wide were depicted on these maps. During the public meetings, the public was encouraged to review and comment on the constraints maps. Pertinent information provided by the public was used to finalize the maps. The final environmental constraints maps are included in Appendix D. 10
20 3.0 EXISTING TRAFFIC EVALUATION 3.1 Baseline Traffic Conditions Baseline (2004) traffic conditions along the US 81 Corridor Study area (i.e., traffic volumes, accident data, roadway capacity and level-of-service) were established for the Northern Section and Chickasha Section Northern Section Four (4) methods of traffic data collection were used to establish baseline conditions for the US 81 Northern Section: 24-Hour Vehicle Counts Peak Hour Turning Movement Counts Vehicle Classification Accident Summary Twenty-Four Hour Vehicle Counts 24-hour vehicle counts were conducted at six (6) locations for over a 1-week period from Monday, November 8, 2004 through Wednesday, November 17, The 24- hour vehicle count for the other location, Station N4, was obtained from the ODOT 2004 Annual Average Daily Traffic (AADT) Map. The locations of the seven (7) vehicle count stations are depicted on Figure 3-1 and can be described as follows: Station N1: US 81, South of Pocasset Station N2: US 81, South of Minco Station N3: SH 37E, East of Minco Station N4: SH 37W/SH 152W, North of Minco Station N5: US 81, South of Union City Station N6: SH 152E, East of Union City Station N7: US 81, North of Union City Table 3-1 summarizes the average daily traffic (ADT) measured at the seven locations. Weekday ADT volumes ranged from 2,050 vehicles on US 81 at SH 37E, east of Minco (N-3) to 5,700 vehicles just south of Union City (N-5). Weekend ADT volumes ranged FIGURE
21
22 from 1,800 vehicles on US 81 at SH 37E, east of Minco (N-3) to 4,200 vehicles south of Union City (N-5). The daily traffic information for SH 37W/SH 152W, north of Minco (N- 4), as AADT obtained from the ODOT Traffic Map, is 4,600. Table 3-1: 2004 Average Daily Traffic Summary, Northern Section 2004 Average Daily Traffic (ADT) Station Location Weekday Weekend N-1 US 81, South of Pocasset 4,050 2,700 N-2 US 81, South of Minco 3,300 2,400 N-3 SH 37E, East of Minco 2,050 1,800 N-4 US 81, North of Minco* 4,600 - N-5 US 81, South of Union City 5,400 4,200 N-6 SH 152E, East of Union City 3,000 2,450 N-7 US 81 North of Union City 5,700 4,800 * Source: ODOT 2004 Annual Average Daily Traffic (AADT) Map Peak Hour Turning Movement Counts Peak hour turning movement counts were conducted at two locations from 6:00 AM to 9:00 AM and 3:00 PM to 6:00 PM, on Wednesday, November 10, These counts were performed at the following intersections, as indicated in Figure 3-1: US 81 and SH 37E in Minco US 81 and SH 152E in Union City Table 3-2 presents the peak hour turning movement counts measured at the two locations. Review of collected data indicates that the intersection of US 81 and SH 37E carried the highest AM peak hour traffic between 7:15 AM and 8:15 AM and the highest PM peak hour between 4:30 PM and 5:30 PM. The intersection of US 81 and SH 152E carried the highest AM peak hour traffic between 6:00 AM and 7:00 AM and the highest PM peak hour traffic between 4:45 PM and 5:45 PM. These maximum AM and PM peak hour volumes were used to determine existing intersection capacity and delay, as well as to evaluate the need for bypasses. Table 3-2: 2004 Peak Hour Turning Movement Counts, Northern Section 13
23 2004 AM AND PM PEAK HOUR TURNING MOVEMENT COUNTS Intersection Name Time Northbound Southbound Eastbound Westbound TOTAL Left Thru Right Left Thru Right Left Thru Right Left Thru Right US 81 and SH 37E, Downtown Minco US 81 and SH 152E, Union City 7:15 AM to 8:15 AM :30 PM to 5:30 PM :00 AM to 7:00 AM :45 PM to 5:45 PM For a detailed discussion of intersection operability and functionality, refer to Section Vehicle Classification Manual classification counts were performed at two locations along US 81 to study the different classes of vehicles that use the study corridor. The classification counts were conducted at the intersections of US 81 and SH 37E in Downtown Minco and US 81 and SH 152E in Union City. The counts were performed during the morning peak hours between 6:00 AM and 9:00 AM and evening peak hours between 3:00 PM and 6:00 PM. Vehicles were classified as either passenger vehicles (cars, vans, half-ton trucks) or trucks (two or more axle trucks, delivery trucks, buses). The observed vehicle classification counts were compared against the recorded traffic volumes to obtain a heavy vehicle percentage using US 81 in the study corridor. US 81 at SH 37E in Downtown Minco recorded a total bidirectional volume of 376 vehicles during the AM period and 408 vehicles during the PM period. The manual classification counts showed a heavy vehicle factor of 8% during the AM peak and 4% during the PM peak hour along US 81 between Minco and Pocasset. US 81 at SH 152E recorded a total bidirectional volume of 292 vehicles during the AM peak period and 465 vehicles during the PM peak period. The manual classification 14
24 counts showed a heavy vehicle factor of 9% during the AM peak and 8% during the PM peak hour along US 81 between Union City and Minco. Heavy vehicle percentage data furnished by the ODOT Planning & Research Division indicated a heavy vehicle factor of 24% for the Design Hour Volume (DHV) along US 81 from Chickasha to Union City, which is significantly higher than the observed heavy vehicle factor. It is possible that heavy vehicles may be avoiding US 81 due to the current highway construction work north of Union City, causing the observed heavy vehicle percentage for the corridor to be lower than normal. In order to assess a worsecase scenario, the 24% heavy vehicle percentage furnished by ODOT was used instead of the observed value to perform intersection capacity analyses. Also, the Highway Capacity Manual (HCM) recommended default value of 4% for Recreational Vehicles (RVs) for two-lane rural highways was used Accident Summary The ODOT Collision Rate Analysis for Statewide Highways for the years indicates that there are no reported areas with high crash rates north of US 81/US Chickasha Section Four (4) methods of traffic data collection were used for the US 81 Chickasha Section: 24-Hour Vehicle Counts and Oklahoma Turnpike Authority (OTA) Toll Collection Volumes and Classification License Plate Survey Vehicle Classification Accident Summary 15
25
26 Hour Vehicle Counts 24-hour vehicle counts were conducted at eight (8) locations which account for the majority of traffic entering or leaving the Chickasha area. The counts were conducted for a 2-week period from Monday, November 29, 2004 through Friday, December 10, These counts were utilized, along with results of the O-D study, to identify the percentage of traffic that would benefit from using a Northern or a West Bypass of Chickasha. A summary of the O-D study is provided in Section 3.4, and the detailed study is included in Appendix E. The locations of the eight vehicle count stations are depicted on Figure 3-3 and can be described as follows: Station 1, US 62 west of US 62/US 81 Station 2, US 81 north of US 62 /US 81 Station 3A and 3D, I-44 ramps at US 62 Station 4, US 62 east of I-44 Station 5A, 5B, 5C, and 5D, I-44 ramps at US 81 Station 6, SH 19 east of US 81 Station 7, US 81 south of SH 19 Station 8, Norge Road south of Country Club Road At the I-44 and US 62 interchange, traffic counts for the eastbound off-ramp and westbound on-ramp (i.e., Stations 3B and 3C) were furnished by OTA through their automated toll collection system. Table 3-3 presents the weekday, weekend, and combined average daily traffic (ADT) for all the eight (8) locations measured during the traffic counts. Weekday ADT volumes along US 81 ranged from 4, 300 vehicles north of US 62/ US 81 to 8,550 south of SH
27
28 Table 3-3: 2004 Average Daily Traffic Summary, Chickasha Section 2004 Average Daily Traffic (ADT) Station Location Weekday Weekend 1 US 62 west of US 62/US 81 8,350 5,750 2 US 81 north of US 62 /US 81 4,300 3,350 3A WB I-44 off-ramp at US 62 2,750 2,750 3B EB I-44 off-ramp at US 62* 1,200 1,050 3C WB I-44 on-ramp at US 62* 1,200 1,050 3D EB I-44 on-ramp at US 62 4,100 2,800 4 US 62 east of I-44 9,650 7,200 5A WB I-44 off-ramp at US 81 3,200 3,600 5B WB I-44 on-ramp at US C EB I-44 off-ramp at US D EB I-44 on-ramp at US 81 4,000 3,550 6 SH 19 east of US 81 5,650 3,850 7 US 81 south of SH 19 8,800 8,550 8 Norge Road south of Country Club Road 3,200 2,350 * Traffic counts provided by OTA License Plate Survey License plate surveys were conducted at twenty (20) locations surrounding Chickasha (see Figure 3-3 for license plate survey locations). License plate surveys were conducted on Thursday, December 2, 2004 from 6:30 AM to 9:30 AM and from 2:30 PM to 5:30 PM. Data collected from the survey, as well as the ADT from the non-us 81 count locations were used to conduct the O-D study discussed in Section Vehicle Classification Manual classification counts were performed as part of the license plate survey for two locations along US 81 to study the different classes of vehicles that use the study corridor. The classification counts were conducted along US 81 north of US 62 / US81 and US 81 south of SH 19. The counts were performed during the morning peak hours between 6:30 AM and 9:30 AM and evening peak hours between 2:30 PM and 5:30 PM. 19
29 Vehicles were classified as either passenger vehicles (cars, vans, half-ton trucks) or trucks (two or more axle trucks, delivery trucks, buses). The observed vehicle classification counts were compared against the recorded traffic volumes to obtain a heavy vehicle percentage using US 81 in the study corridor. US 81 north of US 62 / US 81 recorded a total bidirectional volume of 334 vehicles during the AM period and 368 vehicles during the PM period. The manual classification counts showed a heavy vehicle factor of 10% during the AM and PM peak periods along US 81 north of US 62 / US 81 in Chickasha. US 81 south of SH 19 recorded a total bidirectional volume of 536 vehicles during the AM peak period and 771 vehicles during the PM peak period. The manual classification counts showed a heavy vehicle factor of 5% during the AM peak and 8% during the PM peak hour along US 81 south of SH 19 in Chickasha. Heavy vehicle percentage data furnished by the ODOT Planning & Research Division indicated a heavy vehicle factor of 24% for the Design Hour Volume (DHV) along US 81 from Chickasha to Union City, which is significantly higher than the observed heavy vehicle factor. In order to assess a worse-case scenario, the 24% heavy vehicle percentage furnished by ODOT was used instead of the observed value to perform intersection capacity analyses. Also, the Highway Capacity Manual (HCM) recommended default value of 4% for Recreational Vehicles (RVs) for two-lane rural highways was used Accident Summary The ODOT Collision Rate Analysis for Statewide Highways for the years indicates that one (1) segment located in the Chickasha Section of the US 81 corridor has a collision rating that is critically high. This segment is described as US 81 from SH 19 north, then west to US 81/US 62 junction. Critically High segments are defined by 20
30 the number of collisions per 100 million vehicle miles traveled, as compared to all other like roadway segments in the state. 3.2 Baseline Roadway Capacity Analysis Capacity and LOS analyses were also performed for the highway segments along US 81 in both the Northern and Chickasha Sections to determine the operation of the existing roadway under current demand. Methodologies in the Highway Capacity Manual 2000 (HCM 2000) for rural two-lane and rural and urban multi-lane highways were used for this analysis. Traffic data required for the analysis, including the peak hour factor (PHF), directional distribution of traffic flow, and heavy vehicle percent (HV%), were extracted from the field collected traffic data discussed previously. The HCM 2000 recommended default values for recreational vehicles (RVs), and PHF for rural and urban highway sections were used at locations where data was not available. The LOS for Class I two-lane highways is defined in terms of both the percent timespent-following and average travel speed. Class I includes two-lane highways that are major intercity routes, primary arterials connecting major traffic generators, daily commuter routes, and primary links in state or national highway networks. The HCM 2000-recommended default value of 8 for access-point density was used in the two-lane highway segments analysis. The LOS for multilane highways is primarily determined by the roadway density in terms of passenger car per mile per lane. The five LOS ratings ranging from A to F used to describe roadway capacity and operability are described in Table 3-4. Table 3-4: Roadway Level of Service Definition Summary Level of Service Flow Characteristics Definition 21
31 A B C D E F Free flow Low-density stable flow Medium-density stable flow High-density stable flow Unstable flow Forced/ Breakdown Flow Individual drivers are free to select desired speeds, a high degree of maneuverability is present within the traffic stream, and drivers are generally unaffected by the presence of other vehicles. The general level of comfort and convenience is excellent. Drivers remain free to select desired speeds but a slight decline in maneuverability occurs compared with LOS A and the presence of other vehicles becomes noticeable. The level of comfort and convenience is somewhat less than at LOS A. Selection of speed is affected by the presence of other vehicles, maneuvering within the traffic stream requires substantial driver vigilance, and driver operations are affected significantly by others in the traffic stream. The general level of comfort and convenience is noticeably less at this level than at LOS A or B. Selection of speed and freedom to maneuver are severely restricted and small increases in traffic flow will generally cause operational problems. The level of comfort and convenience is generally poor. Speed is reduced to a low, relatively uniform value and freedom to maneuver is extremely difficult. Operating conditions are at or near the capacity level. Comfort and convenience levels are extremely poor, and driver frustration is generally high. Operations are extremely unstable. The amount of traffic approaching a point exceeds the amount that can traverse the point and arrival flow exceeds discharge flow. Queues form behind such locations and operations within the queue are characterized by stop-and-go waves Northern Section The existing US 81 highway segments in the Northern Section, north of Chickasha to Union City, are mostly two-lane roadway sections in the rural areas, with some four-lane roadway sections along the urban areas of Pocasset, Minco, and Union City. The Northern Section was divided into four different segments for analysis purposes, based on the collected traffic volumes and heavy vehicle percentages. The highway segments were analyzed as five to ten-mile long Class I highways located in rolling terrain and comprised of approximately fifty percent (50%) no-passing zones. Table 3-5 summarizes the LOS calculations for the Northern Section roadway segments. All the Northern Section roadways operated at a LOS C, with the exception of the US 81 roadway segment south of Minco, which provided a LOS B in the AM peak. The worst LOS was for the PM peak on US 81 south of Union City, which reported that vehicles would spend approximately 64% of their time following another vehicle with an average travel speed of 54 miles per hour (mi/h). Table 3-5: Baseline Roadway LOS Summary, US 81 Corridor, Northern Section 22
32 Highway Segment Capacity Units Capacity (AM/PM) US 81, North of US 62 and SH 9 [T] US 81, Just South of Pocasset - [T] US 81, Just South of Minco - [T] US 81, Just South of Union City - [T] US 81, Just North of Union City - [T] Note: [T] = Two-Lane Highway Percent Time Spent Following Average Travel Speed, mph Overall LOS Percent Time Spent Following Average Travel Speed, mph Overall LOS Percent Time Spent Following Average Travel Speed, mph Overall LOS Percent Time Spent Following Average Travel Speed, mph Overall LOS Percent Time Spent Following Average Travel Speed, mph Overall LOS 54.9 / / 56.1 C / C 58.0 / / 55.7 C / C 44.9 / / 56.2 B / C 61.5 / / 54.2 C / C 60.6 / / 55.7 C / C Chickasha Section The segments analyzed in the Chickasha Section include US 81 and other intersecting highways within the study corridor. The roadways are mostly four-lane divided highways through the rural and urban areas of Chickasha and five lane sections with left-turn lanes at intersections in the downtown area. The roadway segments were analyzed as level terrain. Refer to Appendix B for traffic data used in the capacity analysis of the Chickasha Section. Table 3-6 summarizes the results of the roadway analysis for the Chickasha Section segments. Existing typical sections for some of these segments include two-lane and multilane highways which report LOS differently, i.e., two-lane roadways report an overall LOS based on percent time spent following and an average travel speed, whereas multilane roadways report an overall LOS based on density in passenger cars per mile per lane (pc/mi/ln). 23
33 Table 3-6: Baseline Roadway LOS Summary - Chickasha Section Highway Segment or Intersection Capacity Units Capacity (AM/PM) US 81, South of SH 19 [M] Eastbound LOS/Density A(3.3) / A(3.3) Westbound LOS/Density A(1.5) / A(2.6) US 81/4 th St, South of US 62/SH 9 [M] Northbound LOS/Density --- / B(12.4) Southbound LOS/Density --- / A(10.1) US 81, South of Grand Ave. [M] Northbound LOS/Density --- / B(17.1) Southbound LOS/Density --- / B(13.9) US 81, South of I-44 [M] Northbound LOS/Density --- / B(13.6) Southbound LOS/Density --- / B(16.6) US 81, North of SH-19 [M] Northbound LOS/Density --- / A(10.1) Southbound LOS/Density --- / A(8.2) Norge Road, South of Country Club Road - [T] Percent Time Spent Following Average Travel Speed, mph Overall LOS 52.6 / / 53.5 C / C US 62 and SH 9, West of US 81 [M] Eastbound LOS/Density A(3.8) / A(5.7) Westbound LOS/Density A(3.6) / A(4.1) US 62/US 277/SH 9, East of I-44 [M] Eastbound LOS/Density A(3.0) / A(6.0) Westbound LOS/Density A(6.3) / A(4.6) SH 19, East of US 81 [M] Eastbound LOS/Density A(3.8) / A(3.3) Westbound LOS/Density A(3.8) / A(2.9) Note: [M]=Multi-Lane Highway; [T]=Two-Lane Highway; and Density=passenger cars/mile/lane The two-lane segment, i.e., Norge Road, operates at an overall LOS C. Drivers on this segment spend approximately 54% of their time following another vehicle; but the highest average speed is reported as approximately 55 mph. The multilane segments within the business district of Chickasha operated at LOS B, and the segments outside the commercial area operated at LOS A. Peak hour analysis for the multilane segments within the business district was performed only for the PM period due to the lack of available data. 24
34 LOS A for multilane highways means that drivers are generally unaffected by the presence of other vehicles and the general level of comfort and convenience is excellent. LOS B for multilane highways means free flow with a noticeable awareness to the presence of other vehicles and a little less freedom to maneuver than LOS A Baseline Traffic Operations Summary The Northern and Chickasha Sections of the US 81 study corridor, when analyzed for intersection capacity and roadway flow characteristics, exhibit no major congestion problems. Sections of US 81 that have been improved to multi-lane segments report the greatest LOS, thereby offering room for future traffic growth. Sections of US 81 that are still two-lane are less accommodative to future traffic growth, and are operating at a LOS that may be approaching conditions that could lead to unstable flows and increased delay in the future. See Chapter 4 for detailed discussions and analyses based on future traffic growths and proposed alternatives. 3.3 Baseline Intersection Capacity Analysis Capacity analyses for this Study were performed using Synchro 6, Traffic Signal Coordination Software. Capacity analysis provides a measure of the facility s capacity and the delay that vehicular traffic will experience at specific locations. Delay and operability of intersections is measured using Level of Service (LOS) values ranging from A to F, with F representing failing conditions. Table 3-7 provides an intersection LOS definition summary. A summary of the results of the intersection capacity analyses performed as part of this Study are found in Table 3-8. Signalized intersections are noted with an [S] and unsignalized with an [N]. Table 3-7: Intersection Level of Service Definition Summary Level of Service Description LOS Delay, Unsignalized (seconds) LOS Delay, Signalized (seconds) A Uncongested operations; all queues clear in a single signal cycle. <= 10s <= 10s 25
35 Level of Service Description LOS Delay, Unsignalized (seconds) LOS Delay, Signalized (seconds) B Very light congestion; an occasional approach phase is fully utilized. >10s and <=15s >10s and <=20s C Light congestion; occasional backups on critical approaches. >15s and <=25s >20s and <=35s D Significant congestion on critical approaches, but intersection functional. Cars required to wait through more than one cycle during short peaks. No long-standing queues formed. >25s and <=35s >35s and <=55s E Severe congestion with some long-standing queues on critical approaches. Blockage of intersection may occur if traffic signal does not provide for protected turning movements. Traffic queue may block nearby intersection(s) upstream of critical approach(es). >35s and <=50s >55s and <=80s F Total breakdown, stop-and-go operation. >50s >80s US 81 at SH 37E, Downtown Minco The intersection of US 81 and SH 37E in downtown Minco is a four-legged unsignalized intersection with NW Main Street as the west leg. The intersection is stop controlled with flashing red signals at all approaches. The US 81 northbound and southbound approaches provide a shared thru/right-turn lane and a shared thru/left-turn lane. The NW Main Street eastbound and SH 37E westbound approaches provide a shared thru/right/left-turn lane. The existing intersection of US 81 and SH 37E is operating at an overall LOS A for the existing AM and PM peak hours (See Table 3-8) US 81 at SH 152E, Union City The intersection of US 81 and SH 152E in Union City is a four-legged intersection with West Division Street as the west leg. The intersection is unsignalized with stop control at all approaches. The US 81 northbound approach provides a shared thru/left-turn lane, an exclusive through lane, and a yield controlled exclusive right-turn lane. The US 81 southbound approach provides a shared thru/right-turn lane and a shared thru/leftturn lane. The SH 152E westbound approach provides a shared thru/left-turn lane with a yield controlled exclusive right-turn lane. The West Division Street eastbound 26
36 approach provides a shared thru/right/left-turn lane. The existing intersection of US 81 and SH 152E is operating at an overall LOS A for the existing AM and PM peak hours (See Table 3-8). Table 3-8: Baseline Intersection LOS Summary Intersection and Direction of Approach Calculated LOS US 81 and SH 37E [N] Eastbound A/A Westbound A/A Northbound A/A Southbound A/A US 81 and SH 152E [N] Eastbound A/A Westbound A/A Northbound A/A Southbound A/A Note: [N] = Non-Signalized Intersection US 81 at SH 37W and SH 152W The intersection of US 81 with SH 37W/SH 152W is three-legged and is located north of its intersection with SH 37E in Minco and south of its intersection with SH 152E in Union City. The intersection is stop controlled along the eastbound minor street (SH 37W/SH 152W) approach and free along the major street (US 81) approaches. US 81 at SH 37W/SH 152W is a two-lane highway with exclusive left and right turn lanes from the northbound and southbound approaches to SH 37W/SH 152W. SH 37W/SH 152W is a two-lane highway with an exclusive right turn lane at the intersection approach to southbound US 81. The primary traffic in conflict is the left turns from the SH 37W/SH 152W westbound approach. Site observations revealed adequate gap between the major street traffic for the entry of minor street vehicles with minimum or no delay. Based on the site observations, intersection geometry, location and traffic control, an intersection capacity analysis was not considered necessary and hence no peak hour turning movement counts were conducted. 3.4 Origin-Destination Study The Origin-Destination (O-D) study was conducted only for the Chickasha Section. An O-D study was not conducted for the Northern Section as it is assumed that the majority 27
37 of traffic would be through traffic and would thereby make use of any proposed bypass. In the Chickasha area, the license plate surveys were conducted to determine the amount of traffic that could potentially make use of a Chickasha bypass. Traffic for a bypass would consist of external local and external through traffic. External local traffic consists of those vehicles traveling from an origin outside the study area to a destination within the study area, and from an origin inside the study area with a destination outside the study area. External through traffic has both an origin and destination outside the study area and is only passing through the area Data Collection Methodology and Execution License plate surveys were conducted on a typical weekday with at least one surveyor designated at each survey point. This surveyor was responsible for recording the last three characters of a license plate for one direction of traffic. The license plate data of the roadways were recorded for both directions during the morning (AM) and evening (PM) peak hours, from 6:30 AM to 9:30 AM and 2:30 PM to 5:30 PM. A total of twenty (20) survey points were established to collect license plate data. The locations of these survey points are depicted in Figure Factors Affecting Data Collection Some vehicle license plates were not recorded due to uncontrollable factors in the field common to these types of surveys. These factors included: Multiple vehicles traveling at a high rate of speed, and grouped closely together Newly-registered vehicles with only a paper license in the rear window Dirty license plates Inability to read license plates in early AM or late PM, due to no license plate illumination bulbs These factors may have resulted in some vehicles not being represented in the O-D summary. However, it is assumed that the overall impact of these factors is relatively insignificant. 28
38 3.4.3 Chickasha Section Traffic Rationale A rationale for traffic travel in the Chickasha area was developed in order to identify plausible origin and destination points for vehicles that would potentially make use of a proposed Chickasha bypass. This rationale was based on the assumption that vehicles would use a bypass to avoid traveling US 81 through Chickasha, and that they did not have a secondary destination within Chickasha. The proposed bypass alternatives include: West Bypass: A proposed West Bypass having a southern terminus near the intersection of US 81 and SH 19 and a northern terminus at the US 81 and US 62/SH 9 intersection AND North Bypass: A proposed North Bypass having an eastern terminus north of the I-44/US 62 interchange and a western terminus at the intersection of US 81 and County Road 1320 Tables 3-9 and 3-10 summarize the proposed rationales for traffic travel on the West and North Bypasses, respectively. 29
39 Survey Location 1 - US 62, W of US US 81, N of US I 44 at US 62 Table 3-9: Rationale Matrix for 'Origin' Location Traffic Travel Along West Bypass Zone No. 1B 2A Traffic Surveyed EB traffic SB traffic Rationale for Traffic Travel* to 44W, 19E, 81/277S and 92S to 44W, 19E, 81/277S and 92S West Bypass Survey Locations to 3B, 5B, 6B, 7A and 8A to 3B, 5B, 6B, 7A and 8A 3B WB on ramp to 19E, 81/277S and 92S to 6B, 7A and 8A Proposed Travel Route S on W Bypass S on W Bypass N or S on W Bypass 3C EB off ramp to 62W and 81N to 1A and 2B N on W Bypass 4 - US 62, E of I I 44 at US SH 19, E of US US 81, S of SH 19 4A WB traffic to 19E, 81/277S and 92S to 6B, 7A and 8A 5A WB off ramp to 19E, 81/277S and 92S to 6B, 7A and 8A 5C 6A 7B EB off ramp WB traffic NB traffic to 62W, 81N, 19E, 81/277S, and 92S to 62W, 81N, 44W, 44E and 92S to 62W, 81N, 44W, 44E and 92S to 1A, 2B, 6B, 7A and 8A to 1A, 2B, 5B, 5D and 8A to 1A, 2B, 5B, 5D and 8A N or S on W Bypass N or S on W Bypass N or S on W Bypass N on W Bypass N on W Bypass 8 - SH 92, S of Country Club Road 8B NB traffic to 62W, 81N, 9/62/277E, 44W, 44E, 19E and 81/277S to 1A, 2B, 4B, 5B, 5D, 6B and 7A N or S on W Bypass *: The above directions indicate the directions of travel and not the roadway direction. Table 3-10: Rationale Matrix for 'Origin' Location Traffic Travel Along North Bypass 30
40 Survey Location Zone No. Traffic Surveyed Rationale for Traffic Travel* North Bypass Survey Locations Proposed Travel Route 1 - US 62, W of US US 81, N of US 62 1B EB traffic to 44E to 3D E on N Bypass 2A SB traffic to 44E and 9/62/277E to 3D and 4B E on N Bypass 3 - I 44 at US US 62, E of I I 44 at US SH 19, E of US US 81, S of SH 19 3A WB off ramp to 62W and 81N to 1A, 2B 3C EB off ramp to 81N to 2B 4A WB traffic to 81N to 2B 5C EB off ramp to 81N to 2B 6A WB traffic to 81N to 2B 7B NB traffic to 81N to 2B W on N Bypass W on N Bypass W on N Bypass W on N Bypass W on N Bypass W on N Bypass *: The above directions indicate the directions of travel and not the roadway direction Data Analysis Following the license plate survey data collection effort, recorded data was compiled in a database for analysis. Data was analyzed via a computer module to determine the number of vehicles traveling from or to specific locations in the Chickasha area. Results from this analysis were used to develop matrices summarizing the potential traffic volumes for the West and North Bypasses for the AM peak, PM peak, and average daily traffic (Tables 3-11, 3-12, and 3-13, respectively.) Table 3-11: Proposed Bypass Routes Trip Distribution Summary-AM Peak AM SUMMARY 31
41 TOTAL 'ORIGIN' POINT SURVEYED VEHICLES 4,729 TOTAL MATCHED PERCENT (%) MATCHED PERCENT (%) MATCHED vs. TOTAL VEHICLES BYPASS TRAVEL % 14% N on W bypass 1,496 79% 32% % 18% S on W bypass % 4% W on N bypass % 8% % 4% E on N bypass 1,905 TOTAL 'ORIGIN' POINT SURVEYED VEHICLES 6,157 Table 3-12: Proposed Bypass Routes Trip Distribution Summary-PM Peak TOTAL MATCHED PM SUMMARY PERCENT (%) MATCHED PERCENT (%) MATCHED vs. TOTAL VEHICLES BYPASS TRAVEL 1,223 37% 20% N on W bypass 2,502 76% 41% 1,279 39% 21% S on W bypass % 7% W on N bypass % 13% % 6% E on N bypass 3,305 Table 3-13: Proposed Bypass Routes Trip Distribution Summary-2004 ADT TOTAL 'ORIGIN' POINT VEHICLES 29,087 TOTAL MATCHED 13, West Bypass Analysis 2004 ADT SUMMARY PERCENT (%) MATCHED PERCENT (%) MATCHED vs. TOTAL VEHICLES BYPASS TRAVEL 4,592 34% 16% N on W bypass 10,120 75% 35% 5,528 41% 19% S on W bypass 1,826 13% 6% W on N bypass 3,430 25% 12% 1,604 12% 6% E on N bypass As an additional analysis effort, a segmental analysis of the West Bypass was performed to determine the amount of Chickasha area traffic that would benefit from each segment of the West Bypass. The analyzed segments include: 32
42 Segment 1 Proposed West Bypass from its northern terminus at the US81/US62 intersection and southern terminus at the Norge Road/Country Club Road intersection Segment 2 Northern terminus at the Norge Road/Country Club Road intersection and southern terminus at the proposed I-44/West Bypass interchange near Cottonwood Road Segment 3 Northern terminus at the I-44/West Bypass interchange and southern terminus at US81 south near the US81/SH19 intersection The license plate survey data was analyzed via a computer module to determine the number of vehicles traveling each segment of the West Bypass for the AM peak, PM peak, and average daily traffic (Tables 3-14, 3-15, and 3-16, respectively). Table 3-14: Proposed West Bypass Routes Trip Distribution Summary-AM Peak AM SUMMARY WEST BYPASS TOTAL SURVEYED VEHICLES TOTAL MATCHED PERCENT (%) MATCHED vs. TOTAL VEHICLES Segment 1 2, % Segment 2 4, % Segment 3 4,055 1,016 25% Table 3-15: Proposed West Bypass Routes Trip Distribution Summary-PM Peak WEST BYPASS TOTAL SURVEYED VEHICLES PM SUMMARY TOTAL MATCHED PERCENT (%) MATCHED vs. TOTAL VEHICLES Segment 1 3,794 1,199 32% 33
43 Segment 2 5,705 1,747 31% Segment 3 5,392 1,472 27% Table 3-16: Proposed West Bypass Routes Trip Distribution Summary-2004 ADT WEST BYPASS 2004 ADT SUMMARY TOTAL TOTAL VEHICLES MATCHED PERCENT (%) MATCHED vs. TOTAL VEHICLES Segment 1 17,128 4,724 28% Segment 2 26,349 6,628 25% Segment 3 25,096 6,389 25% As indicated by Table 3-16, an overall 25-28% of the total surveyed External through traffic would benefit from the West Bypass Segments 1, 2 and 3. A high of 32% travel during the PM peak was recorded along Segment 1, with its northern terminus at the Country Club Road and SH92 intersection and southern terminus along I-44, immediately south of Cottonwood Road. Therefore, at least 25% or more of the surveyed vehicles would be benefited from the West Bypass Origin-Destination Findings The Origin-Destination study results for the proposed West and North Bypasses were examined for the AM and PM peak hour and average daily traffic conditions. Results indicate that a significantly high percentage of traffic is estimated to travel the West Bypass, while the estimated percentage of traffic likely to travel the North Bypass is low. The O-D study results indicate that the West Bypass is likely to reduce the total traffic traveled on US 81 through Chickasha by approximately 32% in the AM, 41% in the PM, and 35% daily. The exclusive West Bypass analysis indicates that an approximate 25% to 28% of the External through traffic would bypass downtown Chickasha by traveling the West Bypass. The O-D study results indicate that the North Bypass is likely to reduce the total traffic traveled on US 81 through Chickasha by approximately 8% in the AM, 13% in the PM, and 12% daily. If traffic traveling only on I-44 and/or US 62 (e.g., a vehicle westbound on US 62 east of Chickasha destined for northbound US 81 north of Chickasha) is 34
44 removed from this analysis, only 6% to 7% of external through traffic would bypass downtown Chickasha by traveling the North Bypass. Based on these results, a West Bypass is chosen for further evaluation to improve travel time through the US 81 corridor and decrease fuel consumption and emissions. The North Bypass will be eliminated from any additional evaluations. The complete detailed O-D study is contained in Appendix E. 35
45 4.0 IMPROVEMENT ANALYSIS 4.1 Future Traffic Analysis, No-Build Alternative The purpose of the Study includes improving the operations of the study corridor to accommodate the existing and future demand. Future traffic demand was developed for the No-Build Alternative and the LOS was determined to assess the operational conditions of the study corridor. The raw traffic data obtained during the field study were compared against the volumes provided by ODOT Planning & Research Division. Table 4-1 presents the comparison at some locations in the Northern and Chickasha Sections. Ref No. Table 4-1: Compared Field Data and ODOT ADT Location 2003 ADT (ODOT) 2004 Raw ADT NORTHERN SECTION 1/1A US 81, South of Pocasset 3,500 3,474 2 US 81, South of Minco 3,200 3,075 3 SH 37E, East of Minco 2,000 1,974 4 US 81, South of Union City 5,100 5,314 CHICKASHA SECTION 1 SH 62, West of US 81/SH 62 Split 7,500 7,790 2 US 81, South of Airport Road 4,300 4,106 8 Norge Road, South of Country Club Road 3,000 3,008 Table 4-1 indicates that the volumes obtained from the field study compare favorably with the average daily traffic provided by ODOT. Based on this comparison, it was decided that the ODOT projected traffic volumes for the year 2030 would be used for all the future alternatives analyses (Sections and 4.3.1). 36
46 4.1.1 Future Traffic Demand Northern Section Table 4-2 presents the existing (2004) and future (2030) average daily traffic volumes for all the segments in the Northern Section for the No-Build Alternative. Table 4-2: Projected Average Daily Traffic Volumes, US 81 Corridor, Northern Section, No-Build Alternative US 81 Segment US 81, North of Chickasha Existing Traffic Volume (2004) No-Build Alternative Projected Traffic Volume (2030) 4,100 7,300 US 81 at Pocasset 3,500 5,300 US 81, South of Minco 4,600 7,000 US 81, North of Minco 5,100 7,850 US 81, South of Union City US 81, North of Union City 5,600 8,500 5,900 9, Chickasha Section Table 4-3 presents the existing (2004) and future (2030) ADT along US 81, major intersecting highways, and impacted intersections for the No-Build Alternative. The data was developed in coordination with ODOT Planning & Research Division and information obtained from various sources including ODOT Planning & Research Division, City of Chickasha Urban Counts, ODOT 1992 Feasibility Study, and the field study. 37
47 Table 4-3: Projected Average Daily Traffic Volumes, US 81 Corridor, Chickasha Section, No-Build Alternative Arterial Description Existing Traffic Volume (2004) No-Build Alternative Projected Traffic Volume (2030) US 62/SH 9, West of US 81 8,300 12,500 US 81, North of US 62/SH 9 4,300 8,900 US 62/US 277/SH 9, East of I-44 9,200 21,200 US 81/4th Street, South of US 62/SH 9 20,350 46,750 US 81 at Grand Avenue 28,000 49,850 US 81, South of I-44 27,300 47,850 US 81, North of SH 19 16,550 31,600 SH 19, East of US 81 5,500 9,400 US 81, South of SH 19 8,900 15,400 The existing (2004) and future (2030) design hour traffic volumes for the No-Build Alternative are presented in Figures 4-1 and Future Roadway Capacity Analysis Capacity and LOS analyses were performed for the US 81 study corridor in both the Northern and Chickasha Sections for the No-Build Alternative to determine the roadway capacity for future 2030 traffic demand. Methodologies in the Highway Capacity Manual 2000 (HCM 2000) for rural two-lane and rural and urban multi-lane highways were used for this analysis. 38
48
49
50 Northern Section The future 2030 traffic demand on the No-Build Alternative, as outlined in Table 4-2, was used to determine the future roadway capacity and LOS. Traffic data required for the analysis include peak hour factor, K factor, directional distribution, percent of heavy and recreation vehicles and topography. The peak hour factor (PHF) is an adjustment to fix the variation of flow during the peak hour. A PHF ranging from was observed from the site studies for the Northern Section study corridor. The proportion of total daily traffic that occurs in the peak hour is defined by the K-factor. The K-factors for Union City and Minco were identified by comparing the peak hour turning movement counts and average daily traffic information from the Northern Section count locations. The Highway Capacity Manual (HCM 2000) recommends default values of and for rural developed and rural undeveloped regions. A default value of was used for deriving the peak hour volumes for Pocasset from the ADT. The heavy vehicle factors used for the Northern Section No-Build Alternative are shown in Table 4-4. Directional distribution identifies the traffic characteristic when volume may be greater in one direction than in the other. HCM recommends a default value of 60/40 for rural highways. Traffic data from the field, which was used in the study, revealed a directional split ranging from 55/45 to 70/30 in the Northern Section study corridor. Terrain type is used in the capacity analysis in lieu of a specific grade and HCM classifies it as level, rolling and mountainous. Rolling terrain was used in the capacity analysis for the Northern Section US 81 study corridor. Rolling terrain is a combination of horizontal and vertical alignments causing heavy vehicles to reduce their speed substantially below that of passenger cars but not to operate at crawl speeds for a significant amount of time. As indicated in Table 4-4, most of the Northern Section roadway segments operate at unacceptable LOS D, except for the segment through Pocasset, which operates at LOS C. The capacity analysis indicates that the LOS for the Northern Section US 81 segments would deteriorate under the No-Build Alternative. 41
51 Table 4-4: Future 2030 Capacity and LOS Analysis, US 81 Corridor, Northern Section, No-Build Alternative No Arterial Description 2030 ADT % Trucks Percent Time Spent Following Average Travel Speed (mph) v/c Ratio LOS US 81, North of Chickasha US 81 at Pocasset US 81, South of Minco US 81, North of Minco US 81, South of Union City US 81, North of Union City 7, D 5, C 7, D 7, D 8, D 9, D Chickasha Section The future 2030 traffic demand for the No-Build Alternative as outlined in Table 4-3 was used to determine the future roadway capacity and LOS. Traffic data required for the analysis include peak hour factor, K factor, directional distribution, percent of heavy and recreation vehicles and topography. The peak hour factor (PHF) is an adjustment to fix the variation of flow during the peak hour. A PHF ranging from was observed from the site studies for the Chickasha Section study corridor. The proportion of total daily traffic that occurs in the peak hour is defined by the K-factor. The K-factor for Chickasha was identified by comparing the peak hour counts from the license plate survey and average daily traffic information from the Chickasha Section count locations. The Highway Capacity Manual (HCM 2000) recommends default values of and for urbanized and urban regions. A default value of was used at locations where field data was not available. The heavy vehicle factors used for the Chickasha Section No-Build Alternative are shown in Table 4-5. Directional distribution identifies 42
52 the traffic characteristic when volume may be greater in one direction than in the other. HCM recommends a default value of 60/40 for urban highways. Traffic data from the field, which was used in the study, revealed a directional split ranging from 55/45 to 60/40 in the Chickasha Section study corridor. Terrain type is used in the capacity analysis in lieu of a specific grade and HCM classifies it as level, rolling and mountainous. Rolling terrain was used in the capacity analysis for the Chickasha Section US 81 study corridor. Rolling terrain is a combination of horizontal and vertical alignments causing heavy vehicles to reduce their speed substantially below that of passenger cars but not to operate at crawl speeds for a significant amount of time. Table 4-5 summarizes the results of the LOS and capacity analysis for the four-lane Chickasha Section US 81 study corridor under the No-Build Alternative. Table 4-5: Future 2030 Capacity and LOS Analysis, US 81 Corridor, Chickasha Section, No-Build Alternative No Arterial Description 2030 ADT % Trucks Density (pc/mi/ln) LOS NB SB NB SB 1 2 US 81/4th Street South of US 62/SH 9 US 81 South of Grand Avenue 46, C D 49, D D 3 US 81 South of I-44 47, C D 4 US 81 North of SH 19 31, B C 5 US 81 South of SH 19 15, A A Table 4-5 indicates that under the No-Build Alternative the US 81 segments through the Central Business District (CBD) of Chickasha operate at an unacceptable level of LOS D. The roadway segments south of the business district operate at LOS C and A. The capacity analysis indicates that the LOS for the US 81 Chickasha Section would deteriorate under the No-Build Alternative. 43
53 4.2 Development of Build Alternatives Northern Section Because the future average daily traffic volumes and roadway LOS for the Northern Section indicate that the facility s ability to effectively handle future traffic will deteriorate to an unacceptable level under the No-Build Alternative, three build alternatives for the Northern Section were developed for evaluation, as follows: Alternative 1 is the improvement of US 81 to four lanes along the existing alignment. Alternative 2 would be the same as Alternative 1, except at the south edge of Minco, where the existing facility would be realigned to eliminate the three and four degree curves. Similarly to Alternative 2, Alternative 3 would be the same as Alternative 1, except for bypasses around Pocasset, Minco and Union City. The realignment of US 81 in Alternative 2 is located slightly east of the existing alignment, starting on the south at County Road 1200 and proceeding north to South Street in Minco, where the original US 81 alignment would be resumed. Alternative 3 includes a bypass either to the east or to the west of each city. Descriptions of each bypass alignment are provided in the following text. Union City: General alignment of the west bypass began on the south at approximately one quarter mile south of 89 th Street, traversing Union City to the west of Maple Avenue to a point approximately one half mile north of 59 th Street. The general alignment of the eastern bypass began on the south at one half mile north of 89 th Street, traversing Union City to the east to approximately 59 th Street. The Union City bypass alignments are indicated on Figure


54
55 Minco: The general alignment of the west bypass began near the US 81 and Clayton Road intersection, traversing Minco to the west of West 9th Street to a northern terminus near the intersection of US 81 with SH 37 and SH 152. The general alignment of the eastern bypass began south of Clayton Road, traversing Minco to the east of Buggy Creek and Cemetery Road, to a northern terminus north of SH 37 and SH 152. The Minco bypass alignments are indicated on Figure 4-4. Pocasset: The general alignment of the west bypass began roughly a half-mile south of Cardinal Street, traversing Pocasset to the west of the City s boundary to a point north of Dutton Road. The eastern bypass general alignment began roughly a quartermile south of Cardinal Street, traversing Pocasset to the east of the City s boundary to a point north of Dutton Road. The Pocasset bypass alignments are indicated on Figure Chickasha Section Similarly, traffic analysis of the Chickasha Section indicates that its ability to effectively handle future traffic will deteriorate to an unacceptable level under the No-Build Alternative. Therefore, West and North Bypass alignments for the Chickasha Section were developed for evaluation. Either bypass would be an access-controlled, 4-lane, divided facility. The general alignment for the West Bypass was from a southern terminus point connecting to US 81 near SH 19, proceeding west of Chickasha to a northern terminus point with US 62 near US 81, with access proposed to I-44, Norge Road, Grand Avenue, and Idaho Street. Figure 4-6 depicts this general West Bypass alignment. The general alignment for a North Bypass was from the intersection of US 81 and County Road 1320, proceeding east along County Road 1320 for approximately 2 ½ miles, continuing east through unimproved land for another 2 ½ miles before joining I-44 with a new interchange. The North Bypass would then follow I-44 south to just south of Pikes Peak Road, then exit via a new Toll Plaza and I-44 interchange, proceeding southeast back to existing US 81. This alternate will require construction of two new 46


56


57
58
59 interchanges with I-44, and some method of payment for the lost tolls associated with bypass traffic s use of I-44. Figure 4-7 depicts the North Bypass alignment. As indicated in Section 3.4, the O-D study results indicated that only 6% - 7% of total US 81 traffic would use a North Bypass of Chickasha. Based on this evaluation, further consideration of the North Bypass was not conducted. Therefore, the following build alternative was selected for further evaluation: West Bypass Alternative, which would be a West Bypass of Chickasha with proposed interchanges at US 62, Idaho Avenue, Grand Avenue, Norge Road, I- 44, and US 81 south of SH 19 Several alignments were evaluated for a West Bypass of Chickasha. A total of six (6) potential alignments which had been identified in the previous bypass studies conducted in 1978 and 1992 were further evaluated during this Corridor Study. Two (2) additional alignments were considered further west of the previous alignments, due to the degree of development which had occurred on the west side of Chickasha since the previous studies. Therefore, a total of eight (8) potential alignments for the West Bypass were evaluated. 4.3 Future Traffic Analysis, Build Alternatives Future Traffic Demand Northern Section Table 4-6 presents the existing (2004) and future (2030) average daily traffic volumes for the Northern Section three build alternatives. This data is also depicted in Figures 4-1 and 4-8. Alternative 1 (existing alignment) and Alternative 2 (realignment south of Minco) are assumed to have induced traffic with ADT higher than the No-Build Alternative. Alternative 3 (bypasses) will result in traffic diversions and induced traffic with an ADT higher than Alternatives 1 and 2. Bypasses would result in considerable reduction of the ADT and truck traffic along the existing US 81 corridor through Pocasset, Minco and Union City with most of the external through vehicular traffic and truck traffic diverted to the bypass. 50

60
Traffic Impact Study. Westlake Elementary School Westlake, Ohio. TMS Engineers, Inc. June 5, 2017
 TMS Engineers, Inc. Traffic Impact Study Westlake Elementary School Westlake, Ohio June 5, 2017 Prepared for: Westlake City Schools - Board of Education 27200 Hilliard Boulevard Westlake, OH 44145 TRAFFIC
Traffic Impact Analysis Walton Acres at Riverwood Athletic Club Clayton, NC
 Traffic Impact Analysis Walton Acres at Riverwood Athletic Club Clayton, NC 1. TABLE OF CONTENTS INTRODUCTION...1 1.1. Site Location and Study Area...1 1.2. Proposed Land Use and Site Access...2 1.3.
Traffic Impact Analysis Chatham County Grocery Chatham County, NC
 Chatham County Grocery Chatham County, NC TABLE OF CONTENTS 1. INTRODUCTION... 1 1.1. Location and Study Area... 1 1.2. Proposed Land Use and Access... 2 1.3. Adjacent Land Uses... 2 1.4. Existing ways...
METHODOLOGY. Signalized Intersection Average Control Delay (sec/veh)
") Chapter 5 Traffic Analysis 5.1 SUMMARY US /West 6 th Street assumes a unique role in the Lawrence Douglas County transportation system. This principal arterial street currently conveys commuter traffic
Chapter 5 Traffic Analysis 5.1 SUMMARY US /West 6 th Street assumes a unique role in the Lawrence Douglas County transportation system. This principal arterial street currently conveys commuter traffic
Truck Climbing Lane Traffic Justification Report
 ROUTE 7 (HARRY BYRD HIGHWAY) WESTBOUND FROM WEST MARKET STREET TO ROUTE 9 (CHARLES TOWN PIKE) Truck Climbing Lane Traffic Justification Report Project No. 6007-053-133, P 101 Ι UPC No. 58599 Prepared by:
TRANSPORTATION ANALYSIS REPORT US Route 6 Huron, Erie County, Ohio
 TRANSPORTATION ANALYSIS REPORT US Route 6 Huron, Erie County, Ohio December 12, 2012 Prepared for: The City of Huron 417 Main Huron, OH 44839 Providing Practical Experience Technical Excellence and Client
FINAL DESIGN TRAFFIC TECHNICAL MEMORANDUM
 FINAL DESIGN TRAFFIC TECHNICAL MEMORANDUM July 2014 FINAL (SR 43) Project Development and Environment Study From State Road 60 (Adamo Drive) to I-4 (SR 400) Hillsborough County, Florida Work Program Item
Chapter 4 Traffic Analysis
 Chapter 4 Traffic Analysis PURPOSE The traffic analysis component of the K-68 Corridor Management Plan incorporates information on the existing transportation network, such as traffic volumes and intersection
Traffic Impact Study WestBranch Residential Development Davidson, NC March 2016
 Traffic Impact Study WestBranch Residential Development Davidson, NC March 216 TRAFFIC IMPACT STUDY FOR THE WestBranch Residential Development LOCATED IN DAVIDSON, NC Prepared For: Lennar Carolinas, LLC
JONESBORO HIGHWAY 63 HIGHWAY 18 CONNECTOR STUDY
 JONESBORO HIGHWAY 63 HIGHWAY 18 CONNECTOR STUDY Craighead County May 2007 JONESBORO HIGHWAY 63 HIGHWAY 18 CONNECTOR STUDY Craighead County May 2007 Prepared by Planning and Research Division Arkansas State
Subject: Solberg Avenue / I-229 Grade Separation: Traffic Analysis
 MEMORANDUM Transportation Bill Troe, AICP Jason Carbee, AICP 12120 Shamrock Plaza Suite 300 Omaha, NE 68154 (402) 334-8181 (402) 334-1984 (Fax) To: Project File Date: Subject: Solberg Avenue / I-229 Grade
Highway 49, Highway 351 and Highway 91 Improvements Feasibility Study Craighead County
 Highway 49, Highway 351 and Highway 91 Improvements Feasibility Study Craighead County Executive Summary March 2015 Highway 49, Highway 351 and Highway 91 Improvements Feasibility Study Craighead County
Traffic Impact Study Little Egypt Road Development Denver, North Carolina June 2017
 Traffic Impact Study Little Egypt Road Development Denver, North arolina June 2017 N. Little Egypt Road DQ\ QDQFLQJ VDOHV RU RWKHU SHUIRUPDQFH EDVHG FULWHULD Proposed Site Driveways Site Driveway 1 TRAFFI
Traffic Study of Fuller Street, Cady Street, West Street and West Avenue. Final Report
 Traffic Study of Fuller Street, Cady Street, West Street and West Avenue Final Report July 2005 Prepared for: Town of Ludlow Prepared by: Pioneer Valley Planning Commission 26 Central Street West Springfield,
Traffic Circulation Study for Neighborhood Southwest of Mockingbird Lane and Airline Road, Highland Park, Texas
 ARIZONA TEXAS NEW MEXICO OKLAHOMA February 13, 2015 Mr. Meran Dadgostar P.E., R.S. Town of Highland Park 4700 Drexel Dr. Highland Park, Texas 75205 Re: Traffic Circulation Study for Neighborhood Southwest
APPENDIXB. Traffic Operations Technical Memorandum
 APPENDIXB Traffic Operations Technical Memorandum Environmental Assessment - Lincoln County, SD 85 th Street: Sundowner Avenue to Louise Avenue November 2017 MEMORANDUM Transportation Jim Kollbaum, PE
TRAFFIC IMPACT STUDY And A TRAFFIC SIGNAL WARRANT ANALYSIS FOR A SENIOR LIVING AND APARTMENT DEVELOPMENT
 TRAFFIC IMPACT STUDY And A TRAFFIC SIGNAL WARRANT ANALYSIS FOR A SENIOR LIVING AND APARTMENT DEVELOPMENT DEERFIELD TOWNSHIP, WARREN COUNTY, OHIO Nantucket Circle and Montgomery Road () Prepared for: ODLE
Project Report. South Kirkwood Road Traffic Study. Meadows Place, TX October 9, 2015
 Meadows Place, TX October 9, 2015 Contents 1 Introduction... 1 2 Data Collection... 1 3 Existing Roadway Network... 2 4 Traffic Volume Development... 2 5 Warrant Analysis... 3 6 Traffic Control Alternative
Glenn Avenue Corridor Traffic Operational Evaluation
 Glenn Avenue Corridor Traffic Operational Evaluation PREPARED FOR: THE CITY OF AUBURN PREPARED BY: DECEMBER 2007 Glenn Avenue Corridor Study--Auburn, Alabama TABLE OF CONTENTS Introduction... 1 Background
TRAFFIC IMPACT ANALYSIS
 TRAFFIC IMPACT ANALYSIS FOR THE CHAMPAIGN UNIT#4 SCHOOL DISTRICT PROPOSED HIGH SCHOOL (SPALDING PARK SITE) IN THE CITY OF CHAMPAIGN Final Report Champaign Urbana Urbanized Area Transportation Study 6/24/2014
Highway 111 Corridor Study
 Highway 111 Corridor Study June, 2009 LINCOLN CO. HWY 111 CORRIDOR STUDY Draft Study Tea, South Dakota Prepared for City of Tea Sioux Falls Metropolitan Planning Organization Prepared by HDR Engineering,
FRONT RANGE CROSSINGS TRAFFIC IMPACT STUDY
 FRONT RANGE CROSSINGS TRAFFIC IMPACT STUDY Prepared for: City of Thornton And Colorado Department of Transportation Prepared by: 11 Blake Street, Suite 2 Denver, Colorado 822 Contact: Brian Bern, PE, PTOE
Table of Contents FIGURES TABLES APPENDICES. Traffic Impact Study Hudson Street Parking Garage MC Project No.: A Table of Contents
 Traffic Impact Study Hudson Street Parking Garage MC Project No.: 151714A Table of Contents Table of Contents I. INTRODUCTION... 2 II. EXISTING CONDITIONS... 5 III. 215 EXISTING TRAFFIC CONDITIONS... 6
DUNBOW ROAD FUNCTIONAL PLANNING
 DUNBOW ROAD FUNCTIONAL PLANNING Final Report August 3, 216 #31, 316 5th Avenue NE Calgary, AB T2A 6K4 Phone: 43.273.91 Fax: 43.273.344 wattconsultinggroup.com Dunbow Road Functional Planning Final Report
Cricket Valley Energy Project Dover, NY Updated Traffic Impact Study
 Updated Traffic Impact Study Community Resources 6.3A Traffic and Transportation Amended This amended Traffic Study incorporates comments from NYSDOT, provided after their review of the original Traffic
TRAFFIC STUDY GUIDELINES Clarksville Street Department
 TRAFFIC STUDY GUIDELINES Clarksville Street Department 9/1/2009 Introduction Traffic studies are used to help the city determine potential impacts to the operation of the surrounding roadway network. Two
Technical Memorandum TRAFFIC IMPACT STUDY. RIDLEY ROAD CONVENIENCE STORE Southampton County, VA. Prepared for: Mr. David Williams.
 Technical Memorandum TRFFIC IMPCT STUDY RIDLEY ROD CONVENIENCE STORE Southampton County, V Prepared for: Mr. David Williams By: Charles Smith, P.E., PTOE EPR Charlottesville, V July 2014 1 TBLE OF CONTENTS
Evaluation of M-99 (Broad Street) Road Diet and Intersection Operational Investigation
 Road Diet and Intersection Operational Investigation") Evaluation of M-99 (Broad Street) Road Diet and Intersection Operational Investigation City of Hillsdale, Hillsdale County, Michigan June 16, 2016 Final Report Prepared for City of Hillsdale 97 North Broad
Evaluation of M-99 (Broad Street) Road Diet and Intersection Operational Investigation City of Hillsdale, Hillsdale County, Michigan June 16, 2016 Final Report Prepared for City of Hillsdale 97 North Broad
7.0 FREEWAYS CONGESTION HOT SPOT PROBLEM & IMPROVEMENT PROJECT ANALYSIS & DEFINITION
 7.0 FREEWAYS CONGESTION HOT SPOT PROBLEM & IMPROVEMENT PROJECT ANALYSIS & DEFINITION 7.1 INTRODUCTION & METHODOLOGY FEASIBILITY REPORT Congestion hot spot problem locations have been assessed using the
Donahue Drive Corridor Traffic Operational Evaluation
 Donahue Drive Corridor Traffic Operational Evaluation PREPARED FOR: THE CITY OF AUBURN PREPARED BY: JANUARY 2007 Donahue Drive Corridor Study--Auburn, Alabama TABLE OF CONTENTS Introduction... 1 Background
TRAFFIC IMPACT STUDY. Creekside Thornton, Colorado. For. August 2015 November 2015 Revised: August Prepared for:
 TRAFFIC IMPACT STUDY For Creekside Thornton, Colorado August 215 November 215 Revised: August 216 Prepared for: Jansen Strawn Consulting Engineers 45 West 2 nd Avenue Denver, Colorado 8223 Prepared by:
Capital Region Council of Governments
 March 23, 2018 Capital Region Council of Governments PROJECT CONCEPT REPORT Realignment of Swamp and Northfield Road s approaches to Route 44 (Boston Turnpike) Town of Coventry SUMMARY: The Town of Coventry
Walmart (Store # ) 60 th Street North and Marion Road Sioux Falls, South Dakota
 60 th Street North and Marion Road Sioux Falls, South Dakota") Walmart (Store #4865-00) 60 th Street North and Marion Road Sioux Falls, South Dakota Prepared for: Wal-Mart Stores, Inc. Bentonville, Arkansas Prepared by: Kimley-Horn and Associates, Inc. ã2013 Kimley-Horn
Walmart (Store #4865-00) 60 th Street North and Marion Road Sioux Falls, South Dakota Prepared for: Wal-Mart Stores, Inc. Bentonville, Arkansas Prepared by: Kimley-Horn and Associates, Inc. ã2013 Kimley-Horn
3.9 - Transportation and Traffic
 Transportation and Traffic 3.9 - Transportation and Traffic This section describes the potential transportation and traffic effects of project implementation on the project site and its surrounding area.
T R A N S P O R T A T I O N M E M O R A N D U M
 WILKINSON LLC t raffic engineering and t ransportation p lanning 3405 Harbor Way Fort Collins, CO 80524 phone: 970-988-0143 fax: 970-472-0223 martinawilkinson@msn.com T R A N S P O R T A T I O N M E M
Design Traffic Technical Memorandum
 State Road 7 Extension PD&E Study Design Traffic Technical Memorandum Palm Beach County, FL October 2010 State Road 7 Extension PD&E Study Design Traffic Technical Memorandum Palm Beach County, FL Prepared
STILLWATER AVENUE CORRIDOR STUDY Old Town, Maine
 Draft Study STILLWATER AVENUE CORRIDOR STUDY Old Town, Maine SUBMITTED TO: BANGOR AREA COMPREHENSIVE TRANSPORTATION SYSTEM SUBMITTED BY: I MAY 23, 2017 DRAFT STILLWATER AVENUE STUDY FINAL REPORT Table
Figure 1: Vicinity Map of the Study Area
 ARIZONA TEXAS NEW MEXICO OKLAHOMA May 5, 2016 Mr. Anthony Beach, P.E. BSP Engineers 4800 Lakewood Drive, Suite 4 Waco, Texas 76710 Re: Intersection and Access Analysis along Business 190 in Copperas Cove
5858 N COLLEGE, LLC N College Avenue Traffic Impact Study
 5858 N COLLEGE, LLC nue Traffic Impact Study August 22, 2016 Contents Traffic Impact Study Page Preparer Qualifications... 1 Introduction... 2 Existing Roadway Conditions... 5 Existing Traffic Conditions...
Shockoe Bottom Preliminary Traffic and Parking Analysis
 Shockoe Bottom Preliminary Traffic and Parking Analysis Richmond, Virginia August 14, 2013 Prepared For City of Richmond Department of Public Works Prepared By 1001 Boulders Pkwy Suite 300, Richmond, VA
Transportation Impact Study for Abington Terrace
 Transportation Impact Study for Abington Terrace Abington Township, Montgomery County, PA Sandy A. Koza, P.E., PTOE PA PE License Number PE059911 Prepared by McMahon Associates, Inc. 425 Commerce Drive,
DIMARCO CANANDAIGUA PROPERTIES HOUSING PROJECT CANANDAIGUA, ONTARIO COUNTY, NEW YORK
 TRAFFIC IMPACT STUDY FOR THE DIMARCO CANANDAIGUA PROPERTIES HOUSING PROJECT CANANDAIGUA, ONTARIO COUNTY, NEW YORK MARCH 14, 2017 PREPARED FOR: 1950 Brighton Henrietta Town Line Rd Rochester, NY 14623 PREPARED
INDUSTRIAL BUILDING 3009 HAWTHORNE ROAD CITY OF OTTAWA TRANSPORTATION OVERVIEW REVISED. Prepared for: Canada Inc.
 INDUSTRIAL BUILDING 3009 HAWTHORNE ROAD CITY OF OTTAWA TRANSPORTATION OVERVIEW REVISED Prepared for: 7849648 Canada Inc. Octiober 1, 2015 114-598 Overview_2.doc D. J. Halpenny & Associates Ltd. Consulting
TRAFFIC ASSESSMENT River Edge Colorado
 TRAFFIC ASSESSMENT River Edge Colorado Submitted by: Fehr & Peers 621 17th Street, Ste. 231 Denver, CO 8293 (33) 296-43 December, 21 App. M-2 Traffic Assessment River Edge Colorado December 21 TABLE OF
Intersection Traffic Control Feasibility Study
 Intersection Traffic Control Feasibility Study CSAH 9 at CSAH 60 (185th Avenue) Prepared For: Dakota County Transportation Department Western Service Center 14955 Galaxie Avenue, 3rd Floor Apple Valley,
MEETING FACILITY 2901 GIBFORD DRIVE CITY OF OTTAWA TRANSPORTATION BRIEF. Prepared for: Holiday Inn Express 2881 Gibford Drive Ottawa, ON K1V 2L9
 MEETING FACILITY 2901 GIBFORD DRIVE CITY OF OTTAWA TRANSPORTATION BRIEF Prepared for: Holiday Inn Express 2881 Gibford Drive Ottawa, ON K1V 2L9 December 18, 2012 112-566 Brief_1.doc D. J. Halpenny & Associates
FORM A PASCO COUNTY ACCESS CONNECTION PERMIT APPLICATION
 FORM 901.3.A PASCO COUNTY ACCESS CONNECTION PERMIT APPLICATION The following information is required from all applicants directly or indirectly accessing any collector or arterial road or as otherwise
EAST AND SOUTH STREET CITY OF ANAHEIM, CALIFORNIA
 T R A F F I C I M P A C T A N A LY S I S EAST AND SOUTH STREET CITY OF ANAHEIM, CALIFORNIA April 217 T R A F F I C I M P A C T A N A LY S I S EAST AND SOUTH STREET CITY OF ANAHEIM, CALIFORNIA Submitted
DRAFT. Corridor study. Honeysuckle Road. October Prepared for the City of Dothan, AL. Prepared by Gresham, Smith and Partners
 DRAFT Corridor study Honeysuckle Road October 2017 Prepared for the City of Dothan, AL Prepared by TABLE OF CONTENTS SECTION I... 1 STUDY SUMMARY... 1 INTRODUCTION... 1 CONCLUSIONS... 5 SECTION II... 7
Roundabout Feasibility Memorandum
 Roundabout Feasibility Memorandum To From Gwen Pipkin Bill Howell Date June 18, 2013 Subject Roundabout Feasibility Study SR 29 PD&E Study From Oil Well Road to SR 82 Collier County, FL FPID 417540-1-22-01
Traffic Analysis and Design Report. NW Bethany Boulevard. NW Bronson Road to NW West Union Road. Washington County, Oregon
 Traffic Analysis and Design Report NW Bethany Boulevard NW Bronson Road to NW West Union Road Washington County, Oregon May 2011 Table of Contents Table of Contents Section 1 Executive Summary... 2 Section
INTERSECTION SAFETY STUDY State Route 57 / Seville Road
 INTERSECTION SAFETY STUDY State Route 57 / Seville Road City of Wadsworth, Medina County, Ohio Prepared For: City of Wadsworth Engineering Department 120 Maple Street Wadsworth, OH 44281 Prepared By: GPD
Harrah s Station Square Casino
 Transportation Analysis Harrah s Station Square Casino Pittsburgh, Pennsylvania Submitted To: City of Pittsburgh and Pennsylvania Gaming Control Board Prepared By: DKS Associates GAI Consultants December
TRAFFIC IMPACT STUDY COMPREHENSIVE UPDATE TOWN OF THOMPSON S STATION, TENNESSEE PREPARED FOR: THE TOWN OF THOMPSON S STATION
 TRAFFIC IMPACT STUDY COMPREHENSIVE UPDATE TOWN OF THOMPSON S STATION, TENNESSEE PREPARED FOR: THE TOWN OF THOMPSON S STATION Transportation Consultants, LLC 1101 17 TH AVENUE SOUTH NASHVILLE, TN 37212
TRANSPORTATION IMPACT STUDY PROPOSED RIVERFRONT 47 MIXED USE DEVELOPMENT
 November 2016 TRANSPORTATION IMPACT STUDY PROPOSED RIVERFRONT 47 MIXED USE DEVELOPMENT & Aspinwall Borough, Sharpsburg Borough & O Hara Township, Allegheny County, Pennsylvania Prepared for: Riverfront
ALLEY 24 TRAFFIC STUDY
 ALLEY 24 TRAFFIC STUDY in City of Frostburg, Maryland January 2013 3566 Teays Valley Road Hurricane, WV Office: (304) 397-5508 www.denniscorporation.com Alley 24 Traffic Study January 2013 Frostburg, Maryland
OFFICE/RETAIL DEVELOPMENT 1625 BANK STREET OTTAWA, ONTARIO TRANSPORTATION BRIEF. Prepared for: Canada Inc.
 OFFICE/RETAIL DEVELOPMENT 1625 BANK STREET OTTAWA, ONTARIO TRANSPORTATION BRIEF Prepared for: 9402209 Canada Inc. December 15, 2015 115-625 Report_2.doc D. J. Halpenny & Associates Ltd. Consulting Transportation
EXECUTIVE SUMMARY. Page 1 of 6
 EXECUTIVE SUMMARY The purpose of this report is to identify conformance with the original traffic impact study for the proposed retail development on Lot 5 of Riverdale Retail Filing No. 1 located on the
List of Attachments. Location Map... Site Plan... City of Lake Elsinore Circulation Element... City of Lake Elsinore Roadway Cross-Sections...
 List of Attachments Exhibits Location Map... Site Plan... City of Lake Elsinore Circulation Element... City of Lake Elsinore Roadway Cross-Sections... Existing Lane Geometry and Traffic Controls... Existing
TABLE OF CONTENTS TABLE OF CONTENTS... I APPENDICES... III LIST OF EXHIBITS... V LIST OF TABLES... VII LIST OF ABBREVIATED TERMS...
 TABLE OF CONTENTS TABLE OF CONTENTS... I APPENDICES... III LIST OF EXHIBITS... V LIST OF TABLES... VII LIST OF ABBREVIATED TERMS... IX 1 INTRODUCTION... 1 1.1 Project Overview... 1 1.2 Analysis Scenarios...
Existing Conditions. Date: April 16 th, Dan Holderness; Coralville City Engineer Scott Larson; Coralville Assistant City Engineer
 Date: April 16 th, 2015 To: From: Re: Dan Holderness; Coralville City Engineer Scott Larson; Coralville Assistant City Engineer Darian Nagle-Gamm, Traffic Engineering Planner Highway 6 (2 nd Street) /
1609 E. FRANKLIN STREET HOTEL TRAFFIC IMPACT STUDY EXECUTIVE SUMMARY
 1609 E. FRANKLIN STREET HOTEL TRAFFIC IMPACT STUDY EXECUTIVE SUMMARY Prepared for: The Town of Chapel Hill Public Works Department Traffic Engineering Division Prepared by: HNTB North Carolina, PC 343
APPENDIX F SUPPLEMENTAL TRAFFIC DATA
 APPENDIX F SUPPLEMENTAL TRAFFIC DATA Environmental and Planning Consultants 440 Park Avenue South 7th Floor New York, NY 10016 tel: 212 696-0670 fax: 212 213-3191 www.akrf.com Draft Memorandum To: Michael
Waterford Lakes Small Area Study
 Waterford Lakes Small Area Study Existing Traffic Conditions PREPARED FOR: ORANGE COUNTY PUBLIC WORKS DEPARTMENT TRAFFIC ENGINEERING DIVISION ORLANDO, FLORIDA PREPARED WITH: INWOOD CONSULTING ENGINEERS
Corridor Studies. LA 415 and LA 73
 Corridor Studies LA 415 and LA 73 Project Approach for Both Corridors 1. Data Collection 2. Data Summary 3. Traffic Analysis 4. Micro-Simulation modeling 5. Generation of alternatives 6. Modeling alternatives
Complete Street Analysis of a Road Diet: Orange Grove Boulevard, Pasadena, CA
 Complete Street Analysis of a Road Diet: Orange Grove Boulevard, Pasadena, CA Aaron Elias, Bill Cisco Abstract As part of evaluating the feasibility of a road diet on Orange Grove Boulevard in Pasadena,
Troutbeck Farm Development
 Troutbeck Farm Development Willistown Township, Chester County PA For Submission To: Willistown Township Last Revised: October, 4 TPD# INLM.A. 5 E. High Street Suite 65 Pottstown, PA 9464 6.36.3 TPD@TrafficPD.com
QUICKIE C STORE AND GAS BAR 1780 HERON ROAD OTTAWA, ONTARIO TRANSPORTATION BRIEF. Prepared for:
 QUICKIE C STORE AND GAS BAR 1780 HERON ROAD OTTAWA, ONTARIO TRANSPORTATION BRIEF Prepared for: Quickie Convenience Stores Larny Holdings Ltd. c/o PBC Group April 15, 2015 115-615 Report_1.doc D. J. Halpenny
NO BUILD TRAFFIC OPERATIONS
 3. 23 NO BUILD TRAFFIC OPERATIONS This section addresses the operations of the transportation system and details how it would be expected to function under year 23 No Build conditions with the projected
TRAFFIC IMPACT STUDY
 TRAFFIC IMPACT STUDY for the GLEN ELLEN COUNTRY CLUB SENIOR RESIDENTIAL REDEVELOPMENT 84 Millis, Massachusetts Prepared by: McMahon Associates, Inc. Prepared for: Toll Brothers, Inc. August 216 DRAFT
Access Location, Spacing, Turn Lanes, and Medians
 Design Manual Chapter 5 - Roadway Design 5L - Access Management 5L-3 Access Location, Spacing, Turn Lanes, and Medians This section addresses access location, spacing, turn lane and median needs, including
Proposed Action, Purpose and Need Technical Memorandum
 Proposed Action, Purpose and Need Technical Memorandum MoPac (State Loop 1) Intersections, Austin District From North of Slaughter Lane to South of La Crosse Avenue CSJ: 3136-01-015 Travis County, Texas
REDEVELOPMENT TRAFFIC IMPACT STUDY
 REDEVELOPMENT TRAFFIC IMPACT STUDY For Wendy s Parker, Colorado January 215 Prepared for: Sterling Design Associates, LLC 29 W. Littleton Boulevard #3 Littleton, Colorado 812 Prepared by: 1233 Airport
THIS PAGE LEFT BLANK INTENTIONALLY
 GA SR 25 Spur at Canal Road Transportation Impact Analysis PREPARED FOR GLYNN COUNTY, GEORGIA 1725 Reynolds Street, Suite 300 Brunswick, Georgia 31520 PREPARED BY 217 Arrowhead Boulevard Suite 26 Jonesboro,
2. Existing Conditions
 2. Existing Conditions The existing traffic and parking conditions on the site and the surrounding area were reviewed based on the study methodology in Section 1.2. 2.1 Existing Land Use The portion of
Bistro 6. City of Barrie. Traffic Impact Study for Pratt Hansen Group Inc. Type of Document: Final Report. Project Number: JDE 1748
 City of Barrie Traffic Impact Study for Pratt Hansen Group Inc. Type of Document: Final Report Project Number: JDE 1748 Date Submitted: June 12 th, 2017 06/12/17 John Northcote, P.Eng. Professional License
NEW YORK CENTRAL PARK SUBDIVISION BLAIS STREET/ST-PIERRE STREET EMBRUN, ONTARIO TRAFFIC IMPACT STUDY. Prepared for:
 NEW YORK CENTRAL PARK SUBDIVISION BLAIS STREET/ST-PIERRE STREET EMBRUN, ONTARIO TRAFFIC IMPACT STUDY Prepared for: Solidex Holdings Limited & Investissement Maurice Lemieux Investments Attn: Mr. Anthony
I-95 Northbound at US 1 (Exit 126) Design and Study Final Report
 Design and Study Final Report") I-95 Northbound at US 1 (Exit 126) Design and Study Final Report July 2018 Prepared by: Prepared for: TABLE OF CONTENTS 1 Introduction... 1 Study Area Limits... 1 Purpose and Need of the Study... 1 Safety
I-95 Northbound at US 1 (Exit 126) Design and Study Final Report July 2018 Prepared by: Prepared for: TABLE OF CONTENTS 1 Introduction... 1 Study Area Limits... 1 Purpose and Need of the Study... 1 Safety
Date: September 7, Project #: Re: Spaulding Youth Center Northfield, NH Property. Traffic Impact Study
 To: Ms. Susan C. Ryan Spaulding Youth Center 72 Spaulding Road Northfield, NH 03276 Date: September 7, 2017 Project #: 52455.00 From: Robin Bousa Director of Transportation Systems Re: Spaulding Youth
Traffic Impact Study. Roderick Place Columbia Pike Thompson s Station, TN. Transportation Group, LLC Traffic Engineering and Planning
 F i s c h b a c h Transportation Group, LLC Traffic Engineering and Planning Traffic Impact Study Roderick Place Columbia Pike Thompson s Station, TN Prepared March 2016 Ms. Gillian L. Fischbach, P.E.,
Tonight we will be discussing accidents
 Good evening PRAG members WELCOME BACK SAFETY ON HANA HIGHWAY NEAR PAIA Tonight we will be discussing accidents Safety is a Top Priority One of the top priority Goals and objectives of this project is
MEDICAL/OFFICE BUILDING 1637 BANK STREET OTTAWA, ONTARIO TRANSPORTATION OVERVIEW. Prepared for:
 MEDICAL/OFFICE BUILDING 1637 BANK STREET OTTAWA, ONTARIO TRANSPORTATION OVERVIEW Prepared for: 2434984 Ontario Inc. 13-5510 Canotek Road Ottawa, Ontario K1J 9J5 June 4, 2015 115-613 Report_2.doc D. J.
5.3 TRAFFIC, CIRCULATION AND PARKING
 5.3 TRAFFIC, CIRCULATION AND PARKING This section is based upon the Downtown Lancaster Specific Plan Traffic Impact Analysis (April 2, 2008) and the Downtown Lancaster Specific Plan Parking Analysis (May
EXISTING (2006) CONDITIONS
 CONDITIONS") Section 2 EXISTING (2006) CONDITIONS This section provides a description of the existing transportation system in the study area and a comprehensive analysis of existing traffic operations and crash history.
Section 2 EXISTING (2006) CONDITIONS This section provides a description of the existing transportation system in the study area and a comprehensive analysis of existing traffic operations and crash history.
OTTAWA TRAIN YARDS PHASE 3 DEVELOPMENT CITY OF OTTAWA TRANSPORTATION IMPACT STUDY. Prepared for:
 OTTAWA TRAIN YARDS PHASE 3 DEVELOPMENT CITY OF OTTAWA TRANSPORTATION IMPACT STUDY Prepared for: The Ottawa Train Yards Inc. 223 Colonnade Road South, Suite 212 Nepean, Ontario K2E 7K3 January 17, 2012
STUDY PROCESS & SCHEDULE
 STUDY PROCESS & SCHEDULE Route Centennial Bridge Study KDOT Project No. -52 KA-3229-01 STUDY OVERVIEW STUDY SCHEDULE The Kansas Department of Transportation (KDOT) has identified a future need to replace
Traffic Signal Redesign 50% Design Report
 Traffic Signal Redesign 50% Design Report Joseph Davis, Jace Elkins, Jordan Weyrauch and Zach Crimmins CENE 486 Capstone J3Z Engineering March 10 th, 2016 Table of Contents 1.0 Project Description...1
MEMORANDUM. DATE March 1, 2012 TO Town of Milton Mark Abbott, Seth Asante, and Efi Pagitsas Boston Region MPO Staff
 MEMORANDUM DATE March 1, 212 TO Town of Milton FROM RE Mark Abbott, Seth Asante, and Efi Pagitsas Boston Region MPO Staff FFY 211 Safety and Operations Analyses at Selected Boston Region MPO Intersections:
Basic Freeways and Multilane Highways (LOS) CIVL 4162/6162
 CIVL 4162/6162") Basic Freeways and Multilane Highways (LOS) CIVL 4162/6162 Learning Objectives Define uninterrupted facilities Determine LOS of Basic freeway segments Multilane highways Uninterrupted Flow Facilities Pure
Basic Freeways and Multilane Highways (LOS) CIVL 4162/6162 Learning Objectives Define uninterrupted facilities Determine LOS of Basic freeway segments Multilane highways Uninterrupted Flow Facilities Pure
Grant Avenue Streetscape
 REPORT TYPE GOES HERE Grant Avenue Streetscape PREPARED FOR City of Manassas 9027 Center Street Manassas, VA 20110 PREPARED BY 8300 Boone Boulevard Suite 700 Vienna, Virginia 22182 571.389.8121 July 31,
HOLIDAY INN HOTEL 235 KING EDWARD AVENUE CITY OF OTTAWA TRANSPORTATION BRIEF. Prepared for:
 HOLIDAY INN HOTEL 235 KING EDWARD AVENUE CITY OF OTTAWA TRANSPORTATION BRIEF Prepared for: Momentum Planning & Communications 1165 Greenlawn Crescent Ottawa, ON K1L 6C2 June 29, 2015 115-618 Brief_1.doc
Small Area Study U.S. Route 220 and VA Route 615 Intersection. Bath County, Virginia
 Small Area Study U.S. Route 220 and VA Route 615 Intersection Bath County, Virginia Prepared by the Central Shenandoah Planning District Commission Final Report February 2018 Table of Contents 1. INTRODUCTION...
CarMax Auto Superstore/ Reconditioning Center #6002 Murrieta, California
 CarMax Auto Superstore/ Reconditioning Center #6002 Murrieta, California TUSTIN 17782 17th Street Suite 200 Tustin, CA 92780-1947 714.665.4500 Fax: 714.665.4501 LOS ANGELES 145 S. Spring Street Suite 120
HILTON GARDEN INN HOTEL HOTEL EXPANSION 2400 ALERT ROAD, OTTAWA TRANSPORTATION BRIEF. Prepared for:
 HILTON GARDEN INN HOTEL HOTEL EXPANSION 2400 ALERT ROAD, OTTAWA TRANSPORTATION BRIEF Prepared for: Bona Building & Management Co. Ltd. Place Vanier, 333 North River Road Vanier, Ontario K1L 8B9 October
A plan for improved motor vehicle access on Railroad Avenue in Provincetown
 A plan for improved motor vehicle access on Railroad Avenue in Provincetown February 2011 A plan for improved motor vehicle access on Railroad Avenue in Provincetown INTRODUCTION AND PROBLEM IDENTIFICATION
Route 28 (South Orleans Road)/Route 39 (Harwich Road)/Quanset Road Intersection
/Route 39 (Harwich Road)/Quanset Road Intersection") TRAFFIC FEASIBILITY STUDY Route 28 (South Orleans Road)/Route 39 (Harwich Road)/Quanset Road Intersection Orleans, Massachusetts Prepared for: Town of Orleans Prepared by: Fay, Spofford & Thorndike, LLC
TRAFFIC FEASIBILITY STUDY Route 28 (South Orleans Road)/Route 39 (Harwich Road)/Quanset Road Intersection Orleans, Massachusetts Prepared for: Town of Orleans Prepared by: Fay, Spofford & Thorndike, LLC
FINAL Albertville Business Park AUAR Update Traffic Study
 FINAL Albertville Business Park AUAR Update Traffic Study Prepared for City of Albertville, MN July 20, 2017 SRF No. 10060.00 Table of Contents Introduction... 1 Existing Conditions... 1 Data Collection...
Draft Report. Traffic Impact Study. Superstore, Wal-Mart, and Kent Development. Yarmouth, Nova Scotia. Prepared for
 oad & Traffic Management Road & Traffic Management R Atlantic Traffic Engineering Specialists Draft Report Traffic Impact Study Superstore, Wal-Mart, and Kent Development Yarmouth, Nova Scotia Prepared
2009 PE Review Course Traffic! Part 1: HCM. Shawn Leight, P.E., PTOE, PTP Crawford Bunte Brammeier Washington University
 2009 PE Review Course Traffic! Part 1: HCM Shawn Leight, P.E., PTOE, PTP Crawford Bunte Brammeier Washington University sleight@cbbtraffic.com Topic Areas Highway Capacity Manual Highway Capacity Analysis
Clay Street Realignment Project Traffic Study
 Final Clay Street Realignment Project Traffic Study November 24, 2009 Prepared for: City of Placerville RS07-2466 2990 Lava Ridge Court, Suite 200 Roseville, CA 95661 (916) 773-1900 Fax (916) 773-2015