Intersection Control Evaluation
|
|
|
- Prudence Walsh
- 5 years ago
- Views:
Transcription
1 Intersection Control Evaluation Lor Ray Drive at Howard Drive in North Mankato, Nicollet County, Minnesota Mankato/North Mankato Area Planning Organization October 2016 SRF No
2
3 Table of Contents Introduction... 1 Existing Intersection Characteristics... 3 Future Conditions... 5 Traffic Volumes... 7 Analysis of Alternatives Alternatives Assessment Conclusions and Recommendations Appendix H:\Projects\09000\9243\SD\Reports\9243 ICE Lor Ray Howard docx Intersection Control Evaluation ii SRF Consulting Group, Inc. Lor Ray Drive at Howard Drive
4 Introduction This report contains the intersection control evaluation results for the Lor Ray Drive at Howard Drive intersection in North Mankato, Nicollet County, Minnesota (see Figure 1). The purpose of the evaluation was to analyze the intersection control alternatives for the intersection to identify the long-term preferred intersection control. The following intersection control alternatives were considered applicable and are analyzed within this report: All-Way Stop Control Roundabout Control Traffic Signal Control A mini-roundabout variation was also explored. According to Mini-Roundabouts Technical Summary (Federal Highway Administration, 2010), mini-roundabouts are best suited/most efficient in lower speed environments, and are generally recommended for intersections where the total entering daily traffic volume does not exceed approximately 15,000 vehicles. The intersection currently has 12,300 entering vehicles and is forecasted to be 15,900 by Large vehicles, including school buses, are typically required to over-run the fully traversable central island, and high volumes of large vehicles will significantly reduce the capacity of a mini-roundabout, and may lead to rapid wear of the roadway markings. Based on these factors, the mini-roundabout option was not analyzed further at the study intersection. A detailed warrants analysis, operational analysis, safety analysis, and planning-level cost analysis were performed to determine the preferred intersection control alternative. In addition to these analyses, other factors considered for this evaluation that were applicable to determining the long-term preferred intersection control included: Right-of-Way Considerations Transportation System Considerations Pedestrian and Bicycle Considerations Local Acceptance Intersection Control Evaluation 1 SRF Consulting Group, Inc. Lor Ray Drive at Howard Drive

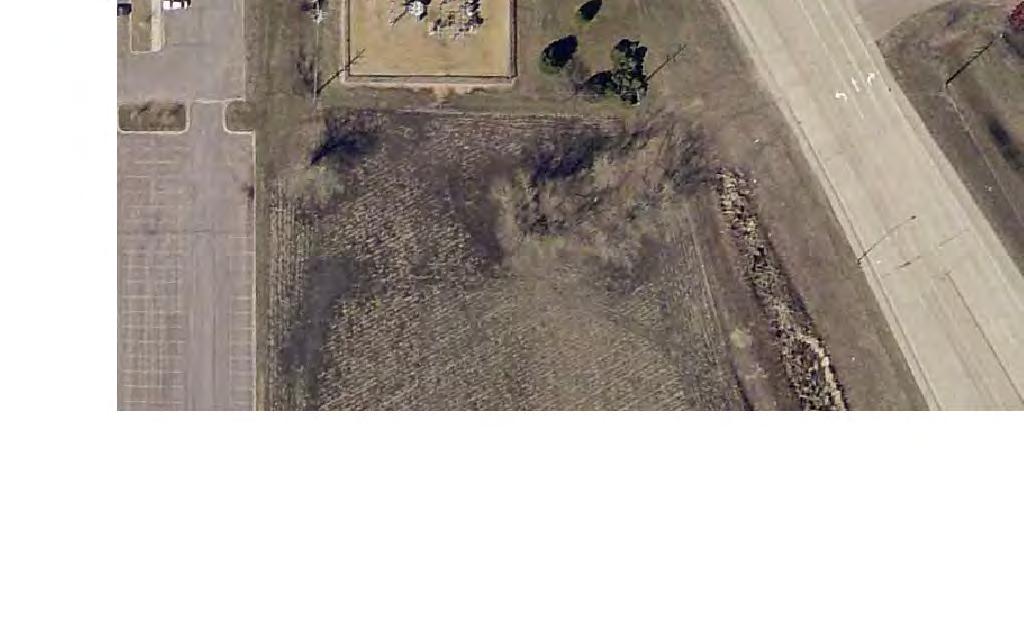
5 North Study Intersection Image Source: Microsoft Bing Maps October 2016 Study Intersection Intersection Control Evaluation Lor Ray Drive at Howard Drive Figure 1
6 Existing Intersection Characteristics Existing Conditions The study intersection is located in the City of North Mankato, Nicollet County north of T.H. 14, as shown in Figure 1. Lor Ray Drive is a five-lane divided roadway south of the study intersection through the T.H. 14 interchange and is a three-lane undivided roadway to the north. Lor Ray Drive is a city street with a speed limit of 30 mph and is functionally classified as a Minor Arterial. Howard Drive is a two-lane undivided roadway with a speed limit of 30 mph. Howard Drive is a city street and is functionally classified as a Major Collector west of Lor Ray Drive and a Local road to the east of Lor Ray Drive. The intersection of Lor Ray Drive and Howard Drive is currently all-way stop controlled. There are bicycle and pedestrian accommodations on both sides of Lor Ray Drive and Howard Drive with marked pedestrian crossings at the intersection. The adjacent area has primarily residential and industrial land uses. Lor Ray Drive, including the intersection at Howard Drive, was reconstructed in The existing lane configurations for the Lor Ray Drive at Howard Drive intersection are listed in Table 1 below and are shown in Figure 2. Table 1. Existing Conditions Leg Northbound Lor Ray Drive Southbound Lor Ray Drive Eastbound Howard Drive Westbound Howard Drive Configuration One left-turn lane, one thru lane, and one right-turn lane One left-turn lane, one thru lane, and one shared thru/right-turn lane One left-turn lane, one thru lane, and one right-turn lane One left-turn lane and one shared thru/right-turn lane Crash History Crash data was obtained from the Minnesota Crash Mapping Analysis Tool (MnCMAT) database for a five-year period from 2011 to There were seven recorded crashes at the study intersection during the analysis period. Detailed crash data is provided in the Appendix. This results in a crash rate of 0.31 crashes per million entering vehicles, which is below the statewide average of 0.35 for all-way stop controlled intersections and the critical crash rate of 0.58 (0.95 level of confidence) for this intersection. Intersection Control Evaluation 3 SRF Consulting Group, Inc. Lor Ray Drive at Howard Drive


7 scale in feet LOR RAY DR. HOWARD DR. HOWARD DR. H:\Projects\09000\9243\CAD_BIM\Graphics\9243 Figure 2 - Existing Conditions.dgn LOR RAY DR October 2016 Existing Conditions Intersection Control Evaluation Lor Ray Drive at Howard Drive Figure 2
8 Future Conditions Based on discussions with City staff in the summer of 2016, no short-term improvements to Lor Ray Drive, Howard Drive, or the study intersection are planned. As part of the City s adopted 2015 Comprehensive Plan, future land uses in the vicinity of the study intersection were updated to commercial land uses. This may include retail, office, hotel, restaurant, and convenience store type uses. Additionally, a new elementary school is planned at the intersection of Lor Ray Drive and Carlson Drive as well as possible expansion of Caswell Park. However, no formal development plans have been submitted for these areas. Nonetheless, future development will necessitate an intersection control change to support traffic growth. For the alternatives analysis, the existing lane configurations under all-way stop control (listed in Table 1 and shown in Figure 2) were assumed to be the same for the traffic signal control alternative. The lane configurations for the roundabout control alternative are listed in Table 2 below and are shown in Figure 3. Table 2. Proposed Lane Configurations for Roundabout Control Alternative Leg Northbound Lor Ray Drive Southbound Lor Ray Drive Eastbound Howard Drive Westbound Howard Drive Configuration One shared thru/left-turn lane and one channelized right-turn lane One shared thru/left-turn lane and one shared thru/right-turn lane One shared lane (all movements) One shared lane (all movements) Intersection Control Evaluation 5 SRF Consulting Group, Inc. Lor Ray Drive at Howard Drive


9
10 Traffic Volumes Hourly traffic volumes including the existing a.m. and p.m. peak hour were collected in early April 2016 by the City of Mankato prior to the closure of T.H. 169 and are shown in Figure 4. Pedestrian and bicycle volumes were also collected. Growth rates from the MAPO 2045 Transportation Plan were used to determine Forecasted Year 2036 peak hour turning movement volumes, which are shown in Figure 5. Due to anticipated land use changes in the area adjacent to the study intersection, forecasted yearly growth rates of 1.4% for Lor Ray Drive (Minor Arterial) and 1.7% for Howard Drive (Major Collector) were used. These rates capture some, but not all, of the proposed commercial, recreational, and educational land uses, discussed previously, in the vicinity of the intersection since no formal development plans have been submitted. Intersection Control Evaluation 7 SRF Consulting Group, Inc. Lor Ray Drive at Howard Drive
11 North 55 (10) 390 (235) 5 (5) 0 (0) 30 (5) 250 (130) (10) 15 (5) 20 (110) 220 (70) 245 (365) 140 (195) 80 Image Source: Microsoft Bing Maps Legend XX = A.M. Peak [7:15-8:15] (XX) = P.M. Peak [4:30-5:30] October 2016 Existing Year 2016 Volumes Intersection Control Evaluation Lor Ray Drive at Howard Drive Figure 4
 = P.M. Peak 016 09243 October 2016 Forecasted Year 2036 Volumes Intersection Control Evaluation Lor Ray Drive at Howard Drive Figure 5")
12 North 70 (15) 500 (300) 5 (5) 0 (5) 40 (5) 340 (175) (15) 20 (5) 25 (145) 295 (90) 310 (470) 175 (250) 100 Image Source: Microsoft Bing Maps Legend XX = A.M. Peak (XX) = P.M. Peak October 2016 Forecasted Year 2036 Volumes Intersection Control Evaluation Lor Ray Drive at Howard Drive Figure 5
13 Analysis of Alternatives The analysis of the all-way stop control, traffic signal control, and roundabout control alternatives included a warrants analysis, operational analysis, planning-level crash analysis, and a planning-level cost analysis. Existing Year 2016 and Forecasted Year 2036 volumes with proposed lane configurations discussed previously were used for the analysis. Warrants Analysis A warrants analysis was performed for the traffic signal control alternative as outlined in the February 2015 Minnesota Manual on Uniform Traffic Control Devices (MN MUTCD). The signal warrants analysis was based on the assumptions shown in Table 3. Table 3. Warrants Analysis Assumptions Leg Geometry Speed Northbound Mainline (Lor Ray Drive) 2 or more approach lanes 30 mph Southbound Mainline (Lor Ray Drive) 2 or more approach lanes 30 mph Eastbound Minor Street (Howard Drive) 1 approach lane 30 mph Eastbound Minor Street (Howard Drive) 1 approach lane 30 mph Because of the low thru and right-turn volumes compared to the left-turn volumes on the westbound approach, it was considered a one lane approach, and similarly the eastbound approach was considered a one lane approach due to the low thru and left-turn volumes compared to the right-turn volumes. Table 4 provides a summary of the results of the warrants analysis. The detailed warrants analysis can be found in the Appendix. Intersection Control Evaluation 10 SRF Consulting Group, Inc. Lor Ray Drive at Howard Drive
14 Table 4. Warrants Analysis Results MN MUTCD Warrant Hours Required Year 2016 Volumes Forecasted Year 2036 Volumes Hours Met Warrant Met Hours Met Warrant Met Warrant 1A: Minimum Vehicular Volume Warrant 1B: Interruption of Continuous Traffic Warrant 1C: Combination of Warrants Warrant 2: Four-Hour Volume Warrant 3B: Peak-Hour Volume Multi-way Stop Applications Condition C 8 3 No 5 No 8 0 No 4 No 8 3 No 7 No 4 2 No 4 Yes 1 0 No 2 Yes 8 7 No 10 Yes Warrants 4-9 were investigated but were determined to be not applicable. Results of the warrants analysis indicate that Existing Year 2016 volumes do not satisfy any MN MUTCD traffic signal warrants, while Forecasted Year 2036 volumes satisfy the MN MUTCD warrant requirements for traffic signal Warrants 2 and 3B. Operational Analysis An initial planning-level analysis was performed for the roundabout control alternative based on Highway Capacity Manual methods found in NCHRP Report 672 Roundabouts: An Informational Guide, Second Edition (Transportation Research Board, 2010). The analysis involved testing the theoretical capacity of a single-lane roundabout against the Forecasted Year 2036 entering and circulating volumes. As shown in Chart 1, the Forecasted Year 2036 volumes exceed the theoretical capacity of a single-lane roundabout. Therefore, the roundabout alternative included additional lanes needed to support the traffic volumes and match into the existing roadway layout. Intersection Control Evaluation 11 SRF Consulting Group, Inc. Lor Ray Drive at Howard Drive
15 Capacity (pc/h) Conflicting Flow Rate (pc/h) A.M. Peak P.M. Peak capacity against one conflicting lane Chart 1. Single-Lane Roundabout Entry Lane Capacity (Forecasted Year 2036 volumes) Operational analysis of the roundabout control alternative was performed using RODEL and Highway Capacity Software (HCS). RODEL is a software program that is based on existing roundabout operational research and uses an empirical formula method to determine roundabout delay based on geometric features and traffic flows. RODEL is the current MnDOT accepted analysis tool for evaluating roundabouts. HCS is based on methodologies found in the 2010 Highway Capacity Manual (HCM) which is considered a conservative approach to determining the capacity of a roundabout. It is important to note that RODEL and HCS only report stop or control delay. Therefore, in order to determine the total delay, geometric delay, or delay due to vehicle deceleration and acceleration through an intersection, must be added to the stop or control delay. The detailed operational analysis of all-way stop control and traffic signal control was performed using methods outlined in the 2010 HCM using Synchro/SimTraffic. Synchro/SimTraffic is capable of calculating various measures of effectiveness such as control delay, queuing, and total travel time impacts. SimTraffic results are reported for the analysis. The operational analysis identified a Level of Service (LOS), which indicates how well an intersection is operating based on average delay per vehicle. Intersections are given a ranking from LOS A to LOS F. LOS A indicates the best traffic operation and LOS F indicates an intersection where demand exceeds capacity. LOS A through LOS D are generally considered acceptable. RODEL results for a Confidence Level (CL) of 50% and 85% were determined. 50% CL results are typically used for roundabout analysis while the 85% CL results indicate the sensitivity of the roundabout design. When a substantial degradation in LOS is expected Intersection Control Evaluation 12 SRF Consulting Group, Inc. Lor Ray Drive at Howard Drive
16 from 50% CL to 85% CL, designers should exercise caution in the design of the roundabout to ensure adequate capacity is provided. Tables 5 and 6 provide a summary of the operational analysis for Existing Year 2016 and Forecasted Year 2036 conditions, respectively. Detailed operational analysis results can be found in the Appendix. Table 5. Existing Year 2016 Operational Analysis Results Alternative Analysis Tool Delay (1) (sec/veh) A.M. Peak LOS Delay (1) (sec/veh) P.M. Peak All-Way Stop Control Synchro/SimTraffic 26/51 D/F 4/5 A/A Traffic Signal Control Synchro/SimTraffic 14/22 B/C 6/13 A/B Roundabout Control RODEL LOS HCS /13 A/B 6/7 A/A 50% CL 4/6 A/A 5/7 A/A 85% CL 6/10 A/A 8/11 A/B (1) Control/stop delay is reported. Overall results are followed by the worst approach results. Table 6. Forecasted Year 2036 Operational Analysis Results Alternative Analysis Tool Delay (1) (sec/veh) A.M. Peak LOS Delay (1) (sec/veh) P.M. Peak All-Way Stop Control Synchro/SimTraffic >100/>100 F/F 6/6 A/A Traffic Signal Control Synchro/SimTraffic 26/28 C/C 7/15 A/B Roundabout Control RODEL LOS HCS /29 C/D 8/10 A/A 50% CL 6/9 A/A 7/10 A/B 85% CL 10/21 B/C 16/25 C/D (1) Control/stop delay is reported. Overall results are followed by the worst approach results. Results of the operational analysis indicate that under the existing all-way stop control, the westbound approach operates with an unacceptable level of service during the a.m. peak. Under Forecasted Year 2036 conditions, the all-way stop control alternative would continue to operate with unacceptable levels of service in the a.m. peak, therefore the all-way stop control alternative was not considered further as a viable alternative. The traffic signal control and roundabout control alternatives would operate with acceptable levels of service under forecasted conditions. The traffic signal control alternative would be best suited to accommodate additional traffic volumes by signal retiming and/or lane use changes if future commercial, recreational, and educational land uses, discussed previously, are fully realized. The roundabout control alternative would require reconstruction to provide additional capacity. Intersection Control Evaluation 13 SRF Consulting Group, Inc. Lor Ray Drive at Howard Drive
17 Safety Analysis A crash analysis was performed to determine the projected crashes per year for Year 2016 and Forecasted Year 2036 conditions for the study intersection. Crash rates from the MnDOT Green Sheets (2011 to 2015 data) were used for the crash analysis of the alternatives. According to NCHRP Report 672 Roundabouts: An Informational Guide, Second Edition (Transportation Research Board, 2010), the conversion of an all-way stop controlled intersection to a roundabout has an insignificant impact on safety. Therefore, the crash rate for all-way stop control was used for the roundabout control alternative. A summary of the crash analysis is shown in Table 7. Table 7. Crash Analysis Results Alternative Intersection AADT (2016) Intersection AADT (2036) Crash Rate Projected Crashes/Year (2016) Projected Crashes/Year (2036) Traffic Signal Control ,300 15,900 Roundabout Control Based on the results of the crash analysis, the roundabout control alternative is anticipated to have slightly less crashes than the traffic signal control alternative. Studies have determined that the installation of a roundabout can improve overall safety of an intersection when compared to other forms of intersection control. Roundabouts typically have fewer conflict points than conventional intersections and the geometry of a roundabout induces lower speeds for vehicles approaching and traversing an intersection. With lower speeds, the severity of the crashes is decreased. A roundabout virtually eliminates right-angle and left-turn head-on crashes. Studies have shown the frequency of injury crashes is reduced more than property damage only crashes. At a roundabout, drivers must be aware of traffic traveling around the circle when merging on or off the roundabout. Conversely, drivers at a traditional intersection must be aware of vehicles at all approaches and the movements they are making. This issue is most prevalent at stop-controlled intersections where there is not a traffic signal to control vehicle movements. Intersection Control Evaluation 14 SRF Consulting Group, Inc. Lor Ray Drive at Howard Drive
18 Planning-Level Cost Analysis Capital Costs The traffic signal control alternative can utilize the existing geometric conditions, therefore the cost for this alternative would only be the cost of installing a traffic signal system, along with ADA improvements. The roundabout control alternative would require substantial reconstruction at and leading up to the intersection, which results in a much higher cost than the traffic signal control alternative. Operation and Maintenance Costs Traffic signals typically have higher operation and maintenance costs than roundabouts because of the electricity required to operate the signal and routine maintenance required to keep the signal in operation. Operation and maintenance costs associated with a roundabout can vary depending on the amount of illumination required or landscaping alternatives used for the center island. A cost analysis summary is shown in Table 8. Detailed cost analysis results can be found in the Appendix. Table 8. Cost Analysis Summary Alternative Capital Costs (1) Operation/Maintenance Costs (annual) Traffic Signal Control $300,000 $4,000-$6,000 Roundabout Control $1,490,000 $500-$1,000 (1) Does not include engineering or right-of-way costs. Intersection Control Evaluation 15 SRF Consulting Group, Inc. Lor Ray Drive at Howard Drive
19 Alternatives Assessment Right-of-Way Considerations The roadway geometry for the traffic signal control alternative would use existing conditions and therefore no additional right-of-way would be expected. Construction of a roundabout at the study intersection would require additional right-of-way in all four quadrants of the intersection. The right-of-way impacts in the northwest and southeast quadrants would be minimal, while the impacts in the northeast and southwest quadrants would be more significant. In the southwest quadrant, the roundabout control alternative would result in the roadway and sidewalk moving closer to the power distribution facility. Transportation System Considerations There is an existing traffic signal approximately 900 feet south of the study intersection at the Lor Ray Drive and T.H. 14 north ramps intersection, and another a quarter mile farther south at the Lor Ray Drive and Commerce Drive intersection. The traffic signal control alternative would extend the continuity of this type of intersection control along Lor Ray Drive. There are several roundabouts west of the study intersection at T.H. 14 interchanges. No significant queues are expected with either the traffic signal control or roundabout control alternatives. Pedestrian and Bicycle Considerations Currently, there are sidewalks on both sides of all legs of the study intersection. Caswell Park and Dakota Meadows Middle School in the adjacent area contribute to high pedestrian activity. Pedestrian accommodations can be provided regardless of selected intersection control. The design of a roundabout allows pedestrians to cross one direction of traffic at a time with a refuge space in the middle of each leg of the roundabout, and these short crossing distances and reduced travel speeds of traffic improve pedestrian safety. Their route is slightly longer since they are kept to the outside of the inscribed circle. The design of signalized intersections can create a safe environment for pedestrian crossings with the use of pedestrian signal phasing. This phasing allows pedestrians to safely cross an intersection while vehicular movements are served. Although signalized intersections can provide indications showing pedestrian right-of-way, potential conflicts can come from red-light running through vehicles and permissive turning traffic. Local Acceptance Drivers are familiar with traveling through signalized intersections since there are many intersections in the area under this type of traffic control. Drivers are also familiar with traveling through roundabout controlled intersections since there are many existing roundabouts throughout the Mankato area including two roundabouts a mile west at the T.H. 14 and Lookout Drive interchange. Intersection Control Evaluation 16 SRF Consulting Group, Inc. Lor Ray Drive at Howard Drive
20 Conclusions and Recommendations The following conclusions are provided for this intersection control evaluation for the Lor Ray Drive at Howard Drive intersection in North Mankato, Nicollet County, Minnesota: Warrants Analysis Results of the warrants analysis indicate that Existing Year 2016 volumes do not satisfy any traffic signal warrants, while Forecasted Year 2036 volumes satisfy the MN MUTCD warrant requirements for traffic signal Warrants 2 and 3B. Operational Analysis Results of the operational analysis indicate that all-way stop is not a viable alternative. The traffic signal control and roundabout control alternatives would operate with acceptable levels of service under forecasted conditions. Safety Analysis Based on the results of the crash analysis, the roundabout control alternative is anticipated to have slightly less crashes than the traffic signal control alternative. Roundabouts typically have fewer conflict points than conventional intersections and the geometry of a roundabout induces lower speeds for vehicles approaching and traversing an intersection. With lower speeds, the severity of the crashes is decreased. Planning-Level Cost Analysis The traffic signal control alternative can utilize the existing geometric conditions, therefore the cost for this alternative would only be the cost of installing a traffic signal system, along with ADA improvements, which would be approximately $300,000. The roundabout control alternative would require substantial reconstruction at and leading up to the intersection, which results in a much higher cost estimate of approximately $1,490,000. Traffic signals typically have higher operation and maintenance costs because of the electricity required to operate the signal and routine maintenance required to keep the signal in operation. Operation and maintenance costs associated with a roundabout can vary depending on the amount of illumination required or landscaping alternatives used for the center island. Right-of-Way Considerations The roadway geometry for the traffic signal control alternative would use existing conditions and therefore no additional right-of-way would be expected. Construction of a roundabout at the study intersection would require additional right-of-way in all four quadrants of the intersection. The right-of-way impacts in the northwest and southeast quadrants would be minimal, while the impacts in the northeast and southwest quadrants would be more significant. Transportation System Considerations There is an existing traffic signal approximately 900 feet south of the study intersection at the Lor Ray Drive and T.H. 14 north ramps intersection, and one quarter mile farther Intersection Control Evaluation 17 SRF Consulting Group, Inc. Lor Ray Drive at Howard Drive
21 south there is another traffic signal. There are several roundabouts west of the study intersection at T.H. 14 interchanges. The traffic signal control alternative would extend the intersection control continuity along Lor Ray Drive. Pedestrian and Bicycle Considerations The design of signalized intersections can take pedestrian crossings and safety into consideration with the use of pedestrian signal phasing. The design of a roundabout allows pedestrians to cross one direction of traffic at a time on each leg of the roundabout. Their route is slightly longer since they are kept to the outside of the inscribed circle. Local Acceptance Drivers are familiar with traveling through signalized intersections since there are many intersections in the area under this type of traffic control. Drivers are also familiar with traveling through roundabout controlled intersections since there are many existing roundabouts throughout the Mankato area including two roundabouts a mile west at the T.H. 14 and Lookout Drive interchange. A decision matrix was developed to help evaluate the key factors and is provided on the following page. Based on the results of this Intersection Control Evaluation, both the traffic signal control and roundabout control alternatives are viable options for the Lor Ray Drive at Howard Drive intersection. Roundabout control is recommended since this type of control is anticipated to have slightly less crashes than the traffic signal control alternative. Roundabouts typically have fewer conflict points than conventional intersections and the geometry of a roundabout induces lower speeds for vehicles approaching and traversing an intersection. With lower speeds, the severity of the crashes is decreased. Drivers are familiar with roundabout control since there are many existing roundabouts throughout the Mankato area including two roundabouts a mile west at the T.H. 14 and Lookout Drive interchange. Consideration should be made during the design of the roundabout for future capacity needs that may be necessary if proposed future commercial, recreational, and educational land uses are fully realized. These considerations would include additional right of way needs in addition to utility relocations. Intersection Control Evaluation 18 SRF Consulting Group, Inc. Lor Ray Drive at Howard Drive
22 Alternatives Decision Matrix: Lor Ray Drive at Howard Drive Factor Warrants Analysis Operational Analysis 2016 All-Way Stop Control Traffic Signal Control Roundabout Control AWSC warrant not met 2036 AWSC warrant met 2016 Lowest p.m. peak delay Unacceptable a.m. peak LOS Existing Year 2016 volumes do not meet traffic signal control warrants Forecasted Year 2036 volumes meet traffic signal control warrants Acceptable LOS N/A N/A Acceptable LOS 2036 Unacceptable a.m. peak LOS Acceptable LOS Acceptable LOS Recommended Alternative(s) Based on Factor Roundabout Control All-Way Stop Control Traffic Signal Control Roundabout Control Traffic Signal Control Roundabout Control Traffic Signal Control Roundabout Control Additional Capacity for Future Growth Safety Analysis Cost Analysis Right-of-Way Transportation System Considerations Pedestrian and Bicycle Considerations Local Acceptance Pro(s): N/A Con(s): N/A Pro(s): N/A Con(s): N/A Con(s): N/A none Slightly more crashes expected than roundabout Higher operation/maintenance costs than roundabout control Con(s): N/A none none Con(s): N/A Forecasted Year 2036 volumes are over capacity Additional capacity can be realized by signal retiming and/or lane use adjustments. Signal indications show vehicle right-of-way Lower capital costs ($300,000) than roundabout control Pro(s): N/A No ROW impacts none Pro(s): N/A Pro(s): N/A Provides control continuity along Lor Ray Drive Pedestrian pushbuttons and signal phasing Pedestrian signal phasing can lead to a false sense of security Con(s): N/A none none Additional capacity would require reconstruction of portions of the roundabout. Least number of crashes expected Lower vehicle speeds through intersection Drivers select acceptable gaps Lower operation/maintenance costs than traffic signal control Higher capital costs ($1,490,000) than traffic signal control Requires substantial reconstruction Requires additional ROW in all four quadrants Matches control of roundabouts at nearby T.H. 14 interchanges Pedestrian refuge islands Lower vehicles speeds through intersection Longer pedestrian route No pedestrian phase Pro(s): N/A Familiar to drivers Familiar to drivers Traffic Signal Control Roundabout Control Traffic Signal Control Traffic Signal Control Traffic Signal Control Roundabout Control Traffic Signal Control Roundabout Control Traffic Signal Control Roundabout Control Intersection Control Evaluation Lor Ray Drive at Howard Drive SRF Consulting Group, Inc.
23 Appendix Crash History Existing Year 2016 Warrants Analysis Forecasted Year 2036 Warrants Analysis Existing Year 2016 Detailed Operational Analysis Forecasted Year 2036 Detailed Operational Analysis Detailed Cost Analysis Intersection Control Evaluation 20 SRF Consulting Group, Inc. Lor Ray Drive at Howard Drive
24 Crash History
25 Crash Detail Report Lor Ray Drive and Howard Drive Report Version 1.0 March 2010 Crash ID: Date: 02/28/2011 Time: County: NICOLLET City: NORTH MANKATO 1358 Sys: Route: 05-MSAS Severity: Road Type: Road Char: Crash Type: Surf Cond: Light Cond: Weather 1: Weather 2: PROPERTY DAMAGE 4_6 LANES UNDIV 2_WAY STRAIGHT AND LEVEL COLL W/MV IN TRANSPORT DRY DAYLIGHT CLEAR NOT SPECIFIED First Event: To Junction: Traffic Device: Speed Limit: Diagram: Officer: Reliability: # of Vehicles: ON ROADWAY 4-LEGGED INTERSECTION STOP SIGN 4-WAY 30 SIDESWIPE PASSING CONFIDENT 2.00 Unit 1 Unit 2 Unit 3 Trav Dir: Veh Act: Veh Type: Age: Gender: Cond: Cont Fact 1 Cont Fact 2 EAST RIGHT TURN PASSENGER CAR 44 F NORMAL NO IMPROPER DRIVING NOT SPECIFIED E RIGHT TURN TRUCK W/ SEMI TRAILER 26 M NORMAL NO IMPROPER DRIVING NOT SPECIFIED Crash ID: Date: 08/25/2011 Time: County: NICOLLET City: NORTH MANKATO 1451 Sys: Route: 05-MSAS Severity: Road Type: Road Char: Crash Type: Surf Cond: Light Cond: Weather 1: Weather 2: NON-INCAPACITATING INJURY 4_6 LANES UNDIV 2_WAY STRAIGHT AND LEVEL COLL W/PEDALCYCLE DRY DAYLIGHT CLEAR NOT SPECIFIED First Event: To Junction: Traffic Device: Speed Limit: Diagram: Officer: Reliability: # of Vehicles: ON ROADWAY 4-LEGGED INTERSECTION STOP SIGN 4-WAY 30 HEAD ON CONFIDENT 1.00 Unit 1 Unit 2 Unit 3 Trav Dir: Veh Act: Veh Type: Age: Gender: Cond: Cont Fact 1 Cont Fact 2 EAST START TRAFFIC PICKUP TRUCK 57 M NORMAL DISTRACTION NOT SPECIFIED NW STRAIGHT AHEAD BICYCLE 45 M NORMAL NO IMPROPER DRIVING NOT SPECIFIED 08/01/2016 Page 1 of 4 MnCMAT 1.0.0
26 Crash ID: Date: 03/21/2012 Time: County: NICOLLET City: NORTH MANKATO 1510 Sys: Route: 05-MSAS Severity: Road Type: Road Char: Crash Type: Surf Cond: Light Cond: Weather 1: Weather 2: PROPERTY DAMAGE 3 LANES UNDIVIDED STRAIGHT AND LEVEL COLL W/MV IN TRANSPORT DRY DAYLIGHT CLOUDY NOT SPECIFIED First Event: To Junction: Traffic Device: Speed Limit: Diagram: Officer: Reliability: # of Vehicles: ON ROADWAY INTERSECTION-RELATED STOP SIGN 4-WAY 30 RIGHT ANGLE CONFIDENT 2.00 Unit 1 Unit 2 Unit 3 Trav Dir: Veh Act: Veh Type: Age: Gender: Cond: Cont Fact 1 Cont Fact 2 N START TRAFFIC VAN OR MINIVAN 86 F NORMAL FAIL TO YIELD ROW NOT SPECIFIED E STRAIGHT AHEAD VAN OR MINIVAN 38 F NORMAL NO IMPROPER DRIVING NOT SPECIFIED Crash ID: Date: 07/22/2012 Time: County: NICOLLET City: NORTH MANKATO 1147 Sys: Route: 05-MSAS Severity: Road Type: Road Char: Crash Type: Surf Cond: Light Cond: Weather 1: Weather 2: PROPERTY DAMAGE 4_6 LANES UNDIV 2_WAY STRAIGHT AND LEVEL COLL W/MV IN TRANSPORT DRY DAYLIGHT CLEAR NOT SPECIFIED First Event: To Junction: Traffic Device: Speed Limit: Diagram: Officer: Reliability: # of Vehicles: ON ROADWAY NON-JUNCTION STOP SIGN 4-WAY 30 SIDESWIPE PASSING CONFIDENT 2.00 Unit 1 Unit 2 Unit 3 Trav Dir: Veh Act: Veh Type: Age: Gender: Cond: Cont Fact 1 Cont Fact 2 N STRAIGHT AHEAD PICKUP TRUCK 38 M NORMAL NO IMPROPER DRIVING NOT SPECIFIED N STRAIGHT AHEAD PASSENGER CAR 87 F NORMAL IMPROPER LANE IMPROPER TURN 08/01/2016 Page 2 of 4 MnCMAT 1.0.0
27 Crash ID: Date: 09/03/2013 Time: County: NICOLLET City: NORTH MANKATO 1645 Sys: Route: 05-MSAS Severity: Road Type: Road Char: Crash Type: Surf Cond: Light Cond: Weather 1: Weather 2: PROPERTY DAMAGE 4_6 LANES UNDIV 2_WAY STRAIGHT AND LEVEL COLL W/MV IN TRANSPORT DRY DAYLIGHT CLEAR NOT SPECIFIED First Event: To Junction: Traffic Device: Speed Limit: Diagram: Officer: Reliability: # of Vehicles: ON ROADWAY 4-LEGGED INTERSECTION STOP SIGN 4-WAY 30 RIGHT ANGLE CONFIDENT 2.00 Unit 1 Unit 2 Unit 3 Trav Dir: Veh Act: Veh Type: Age: Gender: Cond: Cont Fact 1 Cont Fact 2 W LEFT TURN SPORT UNTILITY VEHICLE 48 F NORMAL NO IMPROPER DRIVING NOT SPECIFIED S STRAIGHT AHEAD PICKUP TRUCK 29 M NORMAL DISREGARD TRAFFIC DEVICE FAIL TO YIELD ROW Crash ID: Date: 07/09/2014 Time: County: NICOLLET City: NORTH MANKATO 1938 Sys: Route: 05-MSAS Severity: Road Type: Road Char: Crash Type: Surf Cond: Light Cond: Weather 1: Weather 2: POSSIBLE INJURY 4_6 LANES UNDIV 2_WAY STRAIGHT AND LEVEL COLL W/PEDALCYCLE DRY SUNSET CLEAR NOT SPECIFIED First Event: To Junction: Traffic Device: Speed Limit: Diagram: Officer: Reliability: # of Vehicles: ON ROADWAY 4-LEGGED INTERSECTION STOP SIGN 4-WAY 30 NOT APPLICABLE CONFIDENT 1.00 Unit 1 Unit 2 Unit 3 Trav Dir: Veh Act: Veh Type: Age: Gender: Cond: Cont Fact 1 Cont Fact 2 W STRAIGHT AHEAD VAN OR MINIVAN 72 F NORMAL FAIL TO YIELD ROW NOT SPECIFIED E STRAIGHT AHEAD BICYCLE 37 F NORMAL NO IMPROPER DRIVING NOT SPECIFIED 08/01/2016 Page 3 of 4 MnCMAT 1.0.0
28 Crash ID: Date: 02/19/2015 Time: County: NICOLLET City: NORTH MANKATO 0815 Sys: Route: 05-MSAS Severity: Road Type: Road Char: Crash Type: Surf Cond: Light Cond: Weather 1: Weather 2: PROPERTY DAMAGE 4_6 LANES UNDIV 2_WAY STRAIGHT AND LEVEL COLL W/MV IN TRANSPORT DRY DAYLIGHT CLEAR NOT SPECIFIED First Event: To Junction: Traffic Device: Speed Limit: Diagram: Officer: Reliability: # of Vehicles: ON ROADWAY INTERSECTION-RELATED STOP SIGN 4-WAY 30 LEFT TURN INTO TRAFFIC CONFIDENT 2.00 Unit 1 Unit 2 Unit 3 Trav Dir: Veh Act: Veh Type: Age: Gender: Cond: Cont Fact 1 Cont Fact 2 N STRAIGHT AHEAD PICKUP TRUCK 59 M NORMAL NO IMPROPER DRIVING NOT SPECIFIED NE LEFT TURN VAN OR MINIVAN 21 M NORMAL FAIL TO YIELD ROW OTHER VEHICLE DEFECT Selection Filter: WORK AREA: Statewide - FILTER: CRASH_YEAR('2011','2012','2013','2014','2015'), TRAFFIC_CONTROL_DEVICE_CODE('03') - SPATIAL FILTER APPLIED Analyst: Notes: Luke James 08/01/2016 Page 4 of 4 MnCMAT 1.0.0
29 Existing Year 2016 Warrants Analysis
30 Background Information Warrants Analysis: Warrants 1A, 1B and 1C WARRANTS ANALYSIS Existing Year 2016 Lor Ray Drive at Howard Drive Intersection Control Evaluation Studies MAPO Location : MAPO Speed (mph) Lanes Date: 9/28/ or more Major Approach 1: Analysis Prepared By: Luke James 30 2 or more Major Approach 3: Population Less than 10,000: No 30 1 Minor Approach 2: Seventy Percent Factor Used: No 30 1 Minor Approach 4: Approach Northbound Lor Ray Drive Southbound Lor Ray Drive Eastbound Howard Drive Westbound Howard Drive Major Major Total Warrant Met Minor Minor Largest Warrant Met Met Same Hours Combination MWSA (C) Hour Approach 1 Approach Approach 2 Approach 4 Minor App Condition A Condition B A B AM X X 7-8 AM X X X X X X X X 8-9 AM X X X X 9-10 AM X X AM X X AM X X 12-1 PM X X X 1-2 PM X X 2-3 PM X X X X 3-4 PM X X X X X X X 4-5 PM X X X X X X X X 5-6 PM X X X X X X 6-7 PM X X X Warrant Summary Warrant and Description Warrant 1A: Minimum Vehicular Volume Warrant 1B: Interruption of Continuous Traffic Warrant 1C: Combination of Warrants Warrant 2: Four-Hour Vehicular Volume Warrant 3B: Peak Hour MWSA (C): Multiway Stop Applications Condition C Hours Met Hours Required Met/Not Met 3 8 Not Met 0 8 Not Met 3 8 Not Met 2 4 Not Met 0 1 Not Met 7 8 Not Met 7
31 WARRANTS ANALYSIS Existing Year 2016 Lor Ray Drive at Howard Drive Intersection Control Evaluation Studies MAPO WARRANT 2 - FOUR-HOUR VEHICULAR VOLUME Warrants Analysis: Warrant 2 MINOR STREET HIGH VOLUME APPROACH -- VPH MAJOR STREET -- TOTAL OF BOTH APPROACHES -- VPH Number of Hours Satisfying Requirements: 2 Notes: VPH APPLIES AS THE LOWER THRESHOLD VOLUME FOR A MINOR STREET APPROACH WITH TWO OR MORE LANES AND 80 VPH APPLIES AS THE LOWER THRESHOLD VOLUME FOR A MINOR STREET APPROACHING WITH ONE LANE.
32 WARRANTS ANALYSIS Existing Year 2016 Lor Ray Drive at Howard Drive Intersection Control Evaluation Studies MAPO WARRANT 3 - PEAK HOUR Warrants Analysis: Warrant 3 MINOR STREET HIGH VOLUME APPROACH -- VPH MAJOR STREET -- TOTAL OF BOTH APPROACHES -- VPH Number of Hours Satisfying Requirements: 0 Notes: VPH APPLIES AS THE LOWER THRESHOLD VOLUME FOR A MINOR STREET APPROACH WITH TWO OR MORE LANES AND 100 VPH APPLIES AS THE LOWER THRESHOLD VOLUME FOR A MINOR STREET APPROACHING WITH ONE LANE.
33 Forecasted Year 2036 Warrants Analysis
34 Background Information Warrants Analysis: Warrants 1A, 1B and 1C WARRANTS ANALYSIS Forecasted Year 2036 Lor Ray Drive at Howard Drive Intersection Control Evaluation Studies MAPO Location : MAPO Speed (mph) Lanes Date: 9/28/ or more Major Approach 1: Analysis Prepared By: Luke James 30 2 or more Major Approach 3: Population Less than 10,000: No 30 1 Minor Approach 2: Seventy Percent Factor Used: No 30 1 Minor Approach 4: Approach Northbound Lor Ray Drive Southbound Lor Ray Drive Eastbound Howard Drive Westbound Howard Drive Major Major Total Warrant Met Minor Minor Largest Warrant Met Met Same Hours Combination MWSA (C) Hour Approach 1 Approach Approach 2 Approach 4 Minor App Condition A Condition B A B AM X X 7-8 AM X X X X X X X X X X 8-9 AM X X X X X X X X 9-10 AM X X AM X X AM X X X X 12-1 PM X X X X X 1-2 PM X X X X X 2-3 PM X X X X X X 3-4 PM X X X X X X X X X X 4-5 PM X X X X X X X X X X 5-6 PM X X X X X X X X X X 6-7 PM X X X X X X Warrant Summary Warrant and Description Warrant 1A: Minimum Vehicular Volume Warrant 1B: Interruption of Continuous Traffic Warrant 1C: Combination of Warrants Warrant 2: Four-Hour Vehicular Volume Warrant 3B: Peak Hour MWSA (C): Multiway Stop Applications Condition C Hours Met Hours Required Met/Not Met 5 8 Not Met 4 8 Not Met 7 8 Not Met 4 4 Met - Warrant 2 Satisfied 2 1 Met - Warrant 3B Satisfied 10 8 Met - Multiway Stop Applications 10
35 WARRANTS ANALYSIS Forecasted Year 2036 Lor Ray Drive at Howard Drive Intersection Control Evaluation Studies MAPO WARRANT 2 - FOUR-HOUR VEHICULAR VOLUME Warrants Analysis: Warrant 2 MINOR STREET HIGH VOLUME APPROACH -- VPH MAJOR STREET -- TOTAL OF BOTH APPROACHES -- VPH Number of Hours Satisfying Requirements: 4 Notes: VPH APPLIES AS THE LOWER THRESHOLD VOLUME FOR A MINOR STREET APPROACH WITH TWO OR MORE LANES AND 80 VPH APPLIES AS THE LOWER THRESHOLD VOLUME FOR A MINOR STREET APPROACHING WITH ONE LANE.


36 WARRANTS ANALYSIS Forecasted Year 2036 Lor Ray Drive at Howard Drive Intersection Control Evaluation Studies MAPO WARRANT 3 - PEAK HOUR Warrants Analysis: Warrant 3 MINOR STREET HIGH VOLUME APPROACH -- VPH MAJOR STREET -- TOTAL OF BOTH APPROACHES -- VPH Number of Hours Satisfying Requirements: 2 Notes: VPH APPLIES AS THE LOWER THRESHOLD VOLUME FOR A MINOR STREET APPROACH WITH TWO OR MORE LANES AND 100 VPH APPLIES AS THE LOWER THRESHOLD VOLUME FOR A MINOR STREET APPROACHING WITH ONE LANE.
37 Existing Year 2016 Detailed Operational Analysis All-Way Stop Control
38 SimTraffic Report 09/28/ AWSC (Existing) - A.M. Peak Average of 10 Runs 1: Lor Ray Drive & Howard Drive Performance by approach Approach EB WB NB SB All Denied Delay (hr) Denied Del/Veh (s) Total Delay (hr) Total Del/Veh (s) Stop Delay (hr) Stop Del/Veh (s) Total Stops Stop/Veh Intersection Control Evaluation SRF Consulting Group, Inc. MAPO Page 1
39 SimTraffic Report 09/28/ AWSC (Existing) - A.M. Peak Average of 10 Runs Intersection: 1: Lor Ray Drive & Howard Drive Movement EB EB EB WB WB NB NB SB SB SB Directions Served L T R L TR L T L T TR Maximum Queue (ft) Average Queue (ft) th Queue (ft) Link Distance (ft) Upstream Blk Time (%) Queuing Penalty (veh) Storage Bay Dist (ft) Storage Blk Time (%) Queuing Penalty (veh) Intersection Control Evaluation SRF Consulting Group, Inc. MAPO Page 2
40 SimTraffic Report 09/28/ AWSC (Existing) - P.M. Peak Average of 10 Runs 1: Lor Ray Drive & Howard Drive Performance by approach Approach EB WB NB SB All Denied Delay (hr) Denied Del/Veh (s) Total Delay (hr) Total Del/Veh (s) Stop Delay (hr) Stop Del/Veh (s) Total Stops Stop/Veh Intersection Control Evaluation SRF Consulting Group, Inc. MAPO Page 1
41 SimTraffic Report 09/28/ AWSC (Existing) - P.M. Peak Average of 10 Runs Intersection: 1: Lor Ray Drive & Howard Drive Movement EB EB EB WB WB NB NB SB SB SB Directions Served L T R L TR L T L T TR Maximum Queue (ft) Average Queue (ft) th Queue (ft) Link Distance (ft) Upstream Blk Time (%) Queuing Penalty (veh) Storage Bay Dist (ft) Storage Blk Time (%) 0 Queuing Penalty (veh) 0 Intersection Control Evaluation SRF Consulting Group, Inc. MAPO Page 2
42 Existing Year 2016 Detailed Operational Analysis Traffic Signal Control
43 SimTraffic Report 09/29/ Signal - A.M. Peak Average of 10 Runs 1: Lor Ray Drive & Howard Drive Performance by approach Approach EB WB NB SB All Denied Delay (hr) Denied Del/Veh (s) Total Delay (hr) Total Del/Veh (s) Stop Delay (hr) Stop Del/Veh (s) Total Stops Stop/Veh Intersection Control Evaluation SRF Consulting Group, Inc. MAPO Page 1
44 SimTraffic Report 09/29/ Signal - A.M. Peak Average of 10 Runs Intersection: 1: Lor Ray Drive & Howard Drive Movement EB EB EB WB WB NB NB SB SB SB Directions Served L T R L TR L T L T TR Maximum Queue (ft) Average Queue (ft) th Queue (ft) Link Distance (ft) Upstream Blk Time (%) Queuing Penalty (veh) Storage Bay Dist (ft) Storage Blk Time (%) Queuing Penalty (veh) Intersection Control Evaluation SRF Consulting Group, Inc. MAPO Page 2
45 SimTraffic Report 09/29/ Signal - P.M. Peak Average of 10 Runs 1: Lor Ray Drive & Howard Drive Performance by approach Approach EB WB NB SB All Denied Delay (hr) Denied Del/Veh (s) Total Delay (hr) Total Del/Veh (s) Stop Delay (hr) Stop Del/Veh (s) Total Stops Stop/Veh Intersection Control Evaluation SRF Consulting Group, Inc. MAPO Page 1
46 SimTraffic Report 09/29/ Signal - P.M. Peak Average of 10 Runs Intersection: 1: Lor Ray Drive & Howard Drive Movement EB EB EB WB WB NB NB SB SB SB Directions Served L T R L TR L T L T TR Maximum Queue (ft) Average Queue (ft) th Queue (ft) Link Distance (ft) Upstream Blk Time (%) Queuing Penalty (veh) Storage Bay Dist (ft) Storage Blk Time (%) Queuing Penalty (veh) Intersection Control Evaluation SRF Consulting Group, Inc. MAPO Page 2
47 Existing Year 2016 Detailed Operational Analysis Roundabout Control (HCS)
48 ROUNDABOUT REPORT General Information Analyst Luke James Agency or Co. SRF Consulting Group, Inc. Date Performed 8/5/2016 Time Period A.M. Peak Peak Hour Factor 1.00 Project Description: Volume Adjustment and Site Characteristics Site Information Intersection Lor Ray Drive at Howard Drive E/W Street Name Howard Drive N/S Street Name Lor Ray Drive Analysis Year 2016 Project ID 9243 EB WB NB SB L T R U L T R U L T R U L T R U Number of Lanes (N) Lane Assignment LTR LTR LT R LT TR Right-Turn Bypass None None None None Conflicting Lanes Volume (V), veh/h Heavy Veh. Adj. (f HV ), % Pedestrians Crossing Critical and Follow-Up Headway Adjustment EB WB NB SB Left Right Bypass Left Right Bypass Left Right Bypass Left Right Bypass Critical Headway (sec) Follow-Up Headway (sec) Flow Computations EB WB NB SB Left Right Bypass Left Right Bypass Left Right Bypass Left Right Bypass Circulating Flow (V c ), pc/h Exiting Flow (V ex ), pc/h Entry Flow (V e ), pc/h Entry Volume veh/h Capacity and v/c Ratios EB WB NB SB Left Right Bypass Left Right Bypass Left Right Bypass Left Right Bypass Capacity (c PCE ), pc/h Capacity (c), veh/h v/c Ratio (X) Delay and Level of Service EB WB NB SB Left Right Bypass Left Right Bypass Left Right Bypass Left Right Bypass Lane Control Delay (d), s/veh Lane LOS B A A A A B Lane 95% Queue Approach Delay, s/veh Approach LOS, s/veh B A A B Intersection Delay, s/veh 9.52 Intersection LOS Copyright 2015 University of Florida, All Rights Reserved A HCS 2010 TM 6.70 Roundabouts Generated: 9/19/2016 9:12 AM
49 ROUNDABOUT REPORT General Information Analyst Luke James Agency or Co. SRF Consulting Group, Inc. Date Performed 8/5/2016 Time Period P.M. Peak Peak Hour Factor 1.00 Project Description: Volume Adjustment and Site Characteristics Site Information Intersection Lor Ray Drive at Howard Drive E/W Street Name Howard Drive N/S Street Name Lor Ray Drive Analysis Year 2016 Project ID 9243 EB WB NB SB L T R U L T R U L T R U L T R U Number of Lanes (N) Lane Assignment LTR LTR LT R LT TR Right-Turn Bypass None None None None Conflicting Lanes Volume (V), veh/h Heavy Veh. Adj. (f HV ), % Pedestrians Crossing Critical and Follow-Up Headway Adjustment EB WB NB SB Left Right Bypass Left Right Bypass Left Right Bypass Left Right Bypass Critical Headway (sec) Follow-Up Headway (sec) Flow Computations EB WB NB SB Left Right Bypass Left Right Bypass Left Right Bypass Left Right Bypass Circulating Flow (V c ), pc/h Exiting Flow (V ex ), pc/h Entry Flow (V e ), pc/h Entry Volume veh/h Capacity and v/c Ratios EB WB NB SB Left Right Bypass Left Right Bypass Left Right Bypass Left Right Bypass Capacity (c PCE ), pc/h Capacity (c), veh/h v/c Ratio (X) Delay and Level of Service EB WB NB SB Left Right Bypass Left Right Bypass Left Right Bypass Left Right Bypass Lane Control Delay (d), s/veh Lane LOS A A A A A A Lane 95% Queue Approach Delay, s/veh Approach LOS, s/veh A A A A Intersection Delay, s/veh 6.47 Intersection LOS Copyright 2015 University of Florida, All Rights Reserved A HCS 2010 TM 6.70 Roundabouts Generated: 9/19/2016 9:13 AM
50 Existing Year 2016 Detailed Operational Analysis Roundabout Control (RODEL)
51
52
53 Forecasted Year 2036 Detailed Operational Analysis All-Way Stop Control
54 SimTraffic Report 09/28/ AWSC (No Build) - A.M. Peak Average of 10 Runs 1: Lor Ray Drive & Howard Drive Performance by approach Approach EB WB NB SB All Denied Delay (hr) Denied Del/Veh (s) Total Delay (hr) Total Del/Veh (s) Stop Delay (hr) Stop Del/Veh (s) Total Stops Stop/Veh Intersection Control Evaluation SRF Consulting Group, Inc. MAPO Page 1
55 SimTraffic Report 09/28/ AWSC (No Build) - A.M. Peak Average of 10 Runs Intersection: 1: Lor Ray Drive & Howard Drive Movement EB EB EB WB WB NB NB NB SB SB SB Directions Served L T R L TR L T R L T TR Maximum Queue (ft) Average Queue (ft) th Queue (ft) Link Distance (ft) Upstream Blk Time (%) Queuing Penalty (veh) Storage Bay Dist (ft) Storage Blk Time (%) Queuing Penalty (veh) Intersection Control Evaluation SRF Consulting Group, Inc. MAPO Page 2
56 SimTraffic Report 09/28/ AWSC (No Build) - P.M. Peak Average of 10 Runs 1: Lor Ray Drive & Howard Drive Performance by approach Approach EB WB NB SB All Denied Delay (hr) Denied Del/Veh (s) Total Delay (hr) Total Del/Veh (s) Stop Delay (hr) Stop Del/Veh (s) Total Stops Stop/Veh Intersection Control Evaluation SRF Consulting Group, Inc. MAPO Page 1
57 SimTraffic Report 09/28/ AWSC (No Build) - P.M. Peak Average of 10 Runs Intersection: 1: Lor Ray Drive & Howard Drive Movement EB EB EB WB WB NB NB NB SB SB SB Directions Served L T R L TR L T R L T TR Maximum Queue (ft) Average Queue (ft) th Queue (ft) Link Distance (ft) Upstream Blk Time (%) Queuing Penalty (veh) Storage Bay Dist (ft) Storage Blk Time (%) Queuing Penalty (veh) Intersection Control Evaluation SRF Consulting Group, Inc. MAPO Page 2
58 Forecasted Year 2036 Detailed Operational Analysis Traffic Signal Control
59 SimTraffic Report 09/29/ Signal - A.M. Peak Average of 10 Runs 1: Lor Ray Drive & Howard Drive Performance by approach Approach EB WB NB SB All Denied Delay (hr) Denied Del/Veh (s) Total Delay (hr) Total Del/Veh (s) Stop Delay (hr) Stop Del/Veh (s) Total Stops Stop/Veh Intersection Control Evaluation SRF Consulting Group, Inc. MAPO Page 1
60 SimTraffic Report 09/29/ Signal - A.M. Peak Average of 10 Runs Intersection: 1: Lor Ray Drive & Howard Drive Movement EB EB EB WB WB NB NB SB SB SB Directions Served L T R L TR L T L T TR Maximum Queue (ft) Average Queue (ft) th Queue (ft) Link Distance (ft) Upstream Blk Time (%) Queuing Penalty (veh) Storage Bay Dist (ft) Storage Blk Time (%) Queuing Penalty (veh) Intersection Control Evaluation SRF Consulting Group, Inc. MAPO Page 2
61 SimTraffic Report 09/29/ Signal - P.M. Peak Average of 10 Runs 1: Lor Ray Drive & Howard Drive Performance by approach Approach EB WB NB SB All Denied Delay (hr) Denied Del/Veh (s) Total Delay (hr) Total Del/Veh (s) Stop Delay (hr) Stop Del/Veh (s) Total Stops Stop/Veh Intersection Control Evaluation SRF Consulting Group, Inc. MAPO Page 1
62 SimTraffic Report 09/29/ Signal - P.M. Peak Average of 10 Runs Intersection: 1: Lor Ray Drive & Howard Drive Movement EB EB EB WB WB NB NB SB SB SB Directions Served L T R L TR L T L T TR Maximum Queue (ft) Average Queue (ft) th Queue (ft) Link Distance (ft) Upstream Blk Time (%) Queuing Penalty (veh) Storage Bay Dist (ft) Storage Blk Time (%) Queuing Penalty (veh) Intersection Control Evaluation SRF Consulting Group, Inc. MAPO Page 2
63 Forecasted Year 2036 Detailed Operational Analysis Roundabout Control (HCS)
64 ROUNDABOUT REPORT General Information Analyst Luke James Agency or Co. SRF Consulting Group, Inc. Date Performed 8/5/2016 Time Period A.M. Peak Peak Hour Factor 1.00 Project Description: Volume Adjustment and Site Characteristics Site Information Intersection Lor Ray Drive at Howard Drive E/W Street Name Howard Drive N/S Street Name Lor Ray Drive Analysis Year 2036 Project ID 9243 EB WB NB SB L T R U L T R U L T R U L T R U Number of Lanes (N) Lane Assignment LTR LTR LT R LT TR Right-Turn Bypass None None None None Conflicting Lanes Volume (V), veh/h Heavy Veh. Adj. (f HV ), % Pedestrians Crossing Critical and Follow-Up Headway Adjustment EB WB NB SB Left Right Bypass Left Right Bypass Left Right Bypass Left Right Bypass Critical Headway (sec) Follow-Up Headway (sec) Flow Computations EB WB NB SB Left Right Bypass Left Right Bypass Left Right Bypass Left Right Bypass Circulating Flow (V c ), pc/h Exiting Flow (V ex ), pc/h Entry Flow (V e ), pc/h Entry Volume veh/h Capacity and v/c Ratios EB WB NB SB Left Right Bypass Left Right Bypass Left Right Bypass Left Right Bypass Capacity (c PCE ), pc/h Capacity (c), veh/h v/c Ratio (X) Delay and Level of Service EB WB NB SB Left Right Bypass Left Right Bypass Left Right Bypass Left Right Bypass Lane Control Delay (d), s/veh Lane LOS D C A A C C Lane 95% Queue Approach Delay, s/veh Approach LOS, s/veh D C A C Intersection Delay, s/veh Intersection LOS Copyright 2015 University of Florida, All Rights Reserved C HCS 2010 TM 6.70 Roundabouts Generated: 9/19/2016 9:13 AM
65 ROUNDABOUT REPORT General Information Analyst Luke James Agency or Co. SRF Consulting Group, Inc. Date Performed 8/5/2016 Time Period P.M. Peak Peak Hour Factor 1.00 Project Description: Volume Adjustment and Site Characteristics Site Information Intersection Lor Ray Drive at Howard Drive E/W Street Name Howard Drive N/S Street Name Lor Ray Drive Analysis Year 2036 Project ID 9243 EB WB NB SB L T R U L T R U L T R U L T R U Number of Lanes (N) Lane Assignment LTR LTR LT R LT TR Right-Turn Bypass None None None None Conflicting Lanes Volume (V), veh/h Heavy Veh. Adj. (f HV ), % Pedestrians Crossing Critical and Follow-Up Headway Adjustment EB WB NB SB Left Right Bypass Left Right Bypass Left Right Bypass Left Right Bypass Critical Headway (sec) Follow-Up Headway (sec) Flow Computations EB WB NB SB Left Right Bypass Left Right Bypass Left Right Bypass Left Right Bypass Circulating Flow (V c ), pc/h Exiting Flow (V ex ), pc/h Entry Flow (V e ), pc/h Entry Volume veh/h Capacity and v/c Ratios EB WB NB SB Left Right Bypass Left Right Bypass Left Right Bypass Left Right Bypass Capacity (c PCE ), pc/h Capacity (c), veh/h v/c Ratio (X) Delay and Level of Service EB WB NB SB Left Right Bypass Left Right Bypass Left Right Bypass Left Right Bypass Lane Control Delay (d), s/veh Lane LOS A A A A A A Lane 95% Queue Approach Delay, s/veh Approach LOS, s/veh A A A A Intersection Delay, s/veh 8.00 Intersection LOS Copyright 2015 University of Florida, All Rights Reserved A HCS 2010 TM 6.70 Roundabouts Generated: 9/19/2016 9:14 AM
66 Forecasted Year 2036 Detailed Operational Analysis Roundabout Control (RODEL)
67

68
Intersection Control Evaluation
 Intersection Control Evaluation Stadium Road at Pohl Road in Mankato, Blue Earth County, Minnesota Mankato/North Mankato Area Planning Organization October 2016 SRF No. 016 09243 Table of Contents Introduction...
Traffic Impact Study. Roderick Place Columbia Pike Thompson s Station, TN. Transportation Group, LLC Traffic Engineering and Planning
 F i s c h b a c h Transportation Group, LLC Traffic Engineering and Planning Traffic Impact Study Roderick Place Columbia Pike Thompson s Station, TN Prepared March 2016 Ms. Gillian L. Fischbach, P.E.,
Traffic Impact Analysis Chatham County Grocery Chatham County, NC
 Chatham County Grocery Chatham County, NC TABLE OF CONTENTS 1. INTRODUCTION... 1 1.1. Location and Study Area... 1 1.2. Proposed Land Use and Access... 2 1.3. Adjacent Land Uses... 2 1.4. Existing ways...
Traffic Impact Study WestBranch Residential Development Davidson, NC March 2016
 Traffic Impact Study WestBranch Residential Development Davidson, NC March 216 TRAFFIC IMPACT STUDY FOR THE WestBranch Residential Development LOCATED IN DAVIDSON, NC Prepared For: Lennar Carolinas, LLC
TRANSPORTATION ANALYSIS REPORT US Route 6 Huron, Erie County, Ohio
 TRANSPORTATION ANALYSIS REPORT US Route 6 Huron, Erie County, Ohio December 12, 2012 Prepared for: The City of Huron 417 Main Huron, OH 44839 Providing Practical Experience Technical Excellence and Client
Traffic Impact Analysis Walton Acres at Riverwood Athletic Club Clayton, NC
 Traffic Impact Analysis Walton Acres at Riverwood Athletic Club Clayton, NC 1. TABLE OF CONTENTS INTRODUCTION...1 1.1. Site Location and Study Area...1 1.2. Proposed Land Use and Site Access...2 1.3.
Walmart (Store # ) 60 th Street North and Marion Road Sioux Falls, South Dakota
 60 th Street North and Marion Road Sioux Falls, South Dakota") Walmart (Store #4865-00) 60 th Street North and Marion Road Sioux Falls, South Dakota Prepared for: Wal-Mart Stores, Inc. Bentonville, Arkansas Prepared by: Kimley-Horn and Associates, Inc. ã2013 Kimley-Horn
Walmart (Store #4865-00) 60 th Street North and Marion Road Sioux Falls, South Dakota Prepared for: Wal-Mart Stores, Inc. Bentonville, Arkansas Prepared by: Kimley-Horn and Associates, Inc. ã2013 Kimley-Horn
INDUSTRIAL BUILDING 3009 HAWTHORNE ROAD CITY OF OTTAWA TRANSPORTATION OVERVIEW REVISED. Prepared for: Canada Inc.
 INDUSTRIAL BUILDING 3009 HAWTHORNE ROAD CITY OF OTTAWA TRANSPORTATION OVERVIEW REVISED Prepared for: 7849648 Canada Inc. Octiober 1, 2015 114-598 Overview_2.doc D. J. Halpenny & Associates Ltd. Consulting
INDUSTRIAL BUILDING 1660 COMSTOCK ROAD CITY OF OTTAWA TRANSPORTATION OVERVIEW. Prepared for:
 INDUSTRIAL BUILDING 1660 COMSTOCK ROAD CITY OF OTTAWA TRANSPORTATION OVERVIEW Prepared for: Simluc Contractors Limited 2550 Blackwell Street, Ottawa K1B 5R1 October 18, 2013 113-584 Overview_1.doc D. J.
List of Attachments. Location Map... Site Plan... City of Lake Elsinore Circulation Element... City of Lake Elsinore Roadway Cross-Sections...
 List of Attachments Exhibits Location Map... Site Plan... City of Lake Elsinore Circulation Element... City of Lake Elsinore Roadway Cross-Sections... Existing Lane Geometry and Traffic Controls... Existing
FINAL Albertville Business Park AUAR Update Traffic Study
 FINAL Albertville Business Park AUAR Update Traffic Study Prepared for City of Albertville, MN July 20, 2017 SRF No. 10060.00 Table of Contents Introduction... 1 Existing Conditions... 1 Data Collection...
STILLWATER AVENUE CORRIDOR STUDY Old Town, Maine
 Draft Study STILLWATER AVENUE CORRIDOR STUDY Old Town, Maine SUBMITTED TO: BANGOR AREA COMPREHENSIVE TRANSPORTATION SYSTEM SUBMITTED BY: I MAY 23, 2017 DRAFT STILLWATER AVENUE STUDY FINAL REPORT Table
ALLEY 24 TRAFFIC STUDY
 ALLEY 24 TRAFFIC STUDY in City of Frostburg, Maryland January 2013 3566 Teays Valley Road Hurricane, WV Office: (304) 397-5508 www.denniscorporation.com Alley 24 Traffic Study January 2013 Frostburg, Maryland
Traffic Circulation Study for Neighborhood Southwest of Mockingbird Lane and Airline Road, Highland Park, Texas
 ARIZONA TEXAS NEW MEXICO OKLAHOMA February 13, 2015 Mr. Meran Dadgostar P.E., R.S. Town of Highland Park 4700 Drexel Dr. Highland Park, Texas 75205 Re: Traffic Circulation Study for Neighborhood Southwest
OFFICE/RETAIL DEVELOPMENT 1625 BANK STREET OTTAWA, ONTARIO TRANSPORTATION BRIEF. Prepared for: Canada Inc.
 OFFICE/RETAIL DEVELOPMENT 1625 BANK STREET OTTAWA, ONTARIO TRANSPORTATION BRIEF Prepared for: 9402209 Canada Inc. December 15, 2015 115-625 Report_2.doc D. J. Halpenny & Associates Ltd. Consulting Transportation
Updated Roundabout Analysis Methodology
 Updated Roundabout Analysis Methodology In 1998, the Transportation Planning Analysis Unit (TPAU) working as part of the Roundabout Task Group selected the interim roundabout methodologies of the SIDRA
Traffic Impact Study. Westlake Elementary School Westlake, Ohio. TMS Engineers, Inc. June 5, 2017
 TMS Engineers, Inc. Traffic Impact Study Westlake Elementary School Westlake, Ohio June 5, 2017 Prepared for: Westlake City Schools - Board of Education 27200 Hilliard Boulevard Westlake, OH 44145 TRAFFIC
HILTON GARDEN INN HOTEL HOTEL EXPANSION 2400 ALERT ROAD, OTTAWA TRANSPORTATION BRIEF. Prepared for:
 HILTON GARDEN INN HOTEL HOTEL EXPANSION 2400 ALERT ROAD, OTTAWA TRANSPORTATION BRIEF Prepared for: Bona Building & Management Co. Ltd. Place Vanier, 333 North River Road Vanier, Ontario K1L 8B9 October
METHODOLOGY. Signalized Intersection Average Control Delay (sec/veh)
") Chapter 5 Traffic Analysis 5.1 SUMMARY US /West 6 th Street assumes a unique role in the Lawrence Douglas County transportation system. This principal arterial street currently conveys commuter traffic
Chapter 5 Traffic Analysis 5.1 SUMMARY US /West 6 th Street assumes a unique role in the Lawrence Douglas County transportation system. This principal arterial street currently conveys commuter traffic
Highway 49, Highway 351 and Highway 91 Improvements Feasibility Study Craighead County
 Highway 49, Highway 351 and Highway 91 Improvements Feasibility Study Craighead County Executive Summary March 2015 Highway 49, Highway 351 and Highway 91 Improvements Feasibility Study Craighead County
Highway 111 Corridor Study
 Highway 111 Corridor Study June, 2009 LINCOLN CO. HWY 111 CORRIDOR STUDY Draft Study Tea, South Dakota Prepared for City of Tea Sioux Falls Metropolitan Planning Organization Prepared by HDR Engineering,
Gene Dillon Elementary School Traffic Study Division Street Site
 To: From: Dr. James Hess, Superintendent Jordan Schwarze, PE, Senior Engineer Matt Pacyna, PE, Senior Associate Date: March 30, 2016 Subject: Gene Dillon Elementary School Traffic Study reet Site Memorandum
Chapter 4 Traffic Analysis
 Chapter 4 Traffic Analysis PURPOSE The traffic analysis component of the K-68 Corridor Management Plan incorporates information on the existing transportation network, such as traffic volumes and intersection
133 rd Street and 132 nd /Hemlock Street 132 nd Street and Foster Street MINI ROUNDABOUTS. Overland Park, Kansas
 133 rd Street and 132 nd /Hemlock Street 132 nd Street and Foster Street MINI ROUNDABOUTS Overland Park, Kansas September 1, 2017 TABLE OF CONTENTS 1. INTRODUCTION... 1 2. LITERATURE REVIEW... 1 3. CONCEPT
MEETING FACILITY 2901 GIBFORD DRIVE CITY OF OTTAWA TRANSPORTATION BRIEF. Prepared for: Holiday Inn Express 2881 Gibford Drive Ottawa, ON K1V 2L9
 MEETING FACILITY 2901 GIBFORD DRIVE CITY OF OTTAWA TRANSPORTATION BRIEF Prepared for: Holiday Inn Express 2881 Gibford Drive Ottawa, ON K1V 2L9 December 18, 2012 112-566 Brief_1.doc D. J. Halpenny & Associates
Subject: Solberg Avenue / I-229 Grade Separation: Traffic Analysis
 MEMORANDUM Transportation Bill Troe, AICP Jason Carbee, AICP 12120 Shamrock Plaza Suite 300 Omaha, NE 68154 (402) 334-8181 (402) 334-1984 (Fax) To: Project File Date: Subject: Solberg Avenue / I-229 Grade
QUICKIE C STORE AND GAS BAR 1780 HERON ROAD OTTAWA, ONTARIO TRANSPORTATION BRIEF. Prepared for:
 QUICKIE C STORE AND GAS BAR 1780 HERON ROAD OTTAWA, ONTARIO TRANSPORTATION BRIEF Prepared for: Quickie Convenience Stores Larny Holdings Ltd. c/o PBC Group April 15, 2015 115-615 Report_1.doc D. J. Halpenny
5858 N COLLEGE, LLC N College Avenue Traffic Impact Study
 5858 N COLLEGE, LLC nue Traffic Impact Study August 22, 2016 Contents Traffic Impact Study Page Preparer Qualifications... 1 Introduction... 2 Existing Roadway Conditions... 5 Existing Traffic Conditions...
HOLIDAY INN HOTEL 235 KING EDWARD AVENUE CITY OF OTTAWA TRANSPORTATION BRIEF. Prepared for:
 HOLIDAY INN HOTEL 235 KING EDWARD AVENUE CITY OF OTTAWA TRANSPORTATION BRIEF Prepared for: Momentum Planning & Communications 1165 Greenlawn Crescent Ottawa, ON K1L 6C2 June 29, 2015 115-618 Brief_1.doc
MEDICAL/OFFICE BUILDING 1637 BANK STREET OTTAWA, ONTARIO TRANSPORTATION OVERVIEW. Prepared for:
 MEDICAL/OFFICE BUILDING 1637 BANK STREET OTTAWA, ONTARIO TRANSPORTATION OVERVIEW Prepared for: 2434984 Ontario Inc. 13-5510 Canotek Road Ottawa, Ontario K1J 9J5 June 4, 2015 115-613 Report_2.doc D. J.
Glenn Avenue Corridor Traffic Operational Evaluation
 Glenn Avenue Corridor Traffic Operational Evaluation PREPARED FOR: THE CITY OF AUBURN PREPARED BY: DECEMBER 2007 Glenn Avenue Corridor Study--Auburn, Alabama TABLE OF CONTENTS Introduction... 1 Background
Evaluation of M-99 (Broad Street) Road Diet and Intersection Operational Investigation
 Road Diet and Intersection Operational Investigation") Evaluation of M-99 (Broad Street) Road Diet and Intersection Operational Investigation City of Hillsdale, Hillsdale County, Michigan June 16, 2016 Final Report Prepared for City of Hillsdale 97 North Broad
Evaluation of M-99 (Broad Street) Road Diet and Intersection Operational Investigation City of Hillsdale, Hillsdale County, Michigan June 16, 2016 Final Report Prepared for City of Hillsdale 97 North Broad
INTERSECTION SAFETY STUDY State Route 57 / Seville Road
 INTERSECTION SAFETY STUDY State Route 57 / Seville Road City of Wadsworth, Medina County, Ohio Prepared For: City of Wadsworth Engineering Department 120 Maple Street Wadsworth, OH 44281 Prepared By: GPD
Project Report. South Kirkwood Road Traffic Study. Meadows Place, TX October 9, 2015
 Meadows Place, TX October 9, 2015 Contents 1 Introduction... 1 2 Data Collection... 1 3 Existing Roadway Network... 2 4 Traffic Volume Development... 2 5 Warrant Analysis... 3 6 Traffic Control Alternative
TRAFFIC IMPACT STUDY And A TRAFFIC SIGNAL WARRANT ANALYSIS FOR A SENIOR LIVING AND APARTMENT DEVELOPMENT
 TRAFFIC IMPACT STUDY And A TRAFFIC SIGNAL WARRANT ANALYSIS FOR A SENIOR LIVING AND APARTMENT DEVELOPMENT DEERFIELD TOWNSHIP, WARREN COUNTY, OHIO Nantucket Circle and Montgomery Road () Prepared for: ODLE
REDEVELOPMENT TRAFFIC IMPACT STUDY
 REDEVELOPMENT TRAFFIC IMPACT STUDY For Wendy s Parker, Colorado January 215 Prepared for: Sterling Design Associates, LLC 29 W. Littleton Boulevard #3 Littleton, Colorado 812 Prepared by: 1233 Airport
APARTMENT BUILDING DEVELOPMENT 1161 HERON ROAD OTTAWA, ONTARIO TRANSPORTATION IMPACT STUDY. Prepared for:
 APARTMENT BUILDING DEVELOPMENT 1161 HERON ROAD OTTAWA, ONTARIO TRANSPORTATION IMPACT STUDY Prepared for: 1649362 Ontario Inc. c/o Manor Park Management 231 Brittany Drive, Suite D Ottawa ON K1K 0R8 July
Roundabout Design 101: Roundabout Capacity Issues
 Design 101: Capacity Issues Part 2 March 7, 2012 Presentation Outline Part 2 Geometry and Capacity Choosing a Capacity Analysis Method Modeling differences Capacity Delay Limitations Variation / Uncertainty
Abrams Associates. Transportation Impact Analysis. City of Rocklin. Prepared for: David Mohlenbrok City of Rocklin 4081 Alvis Court Rocklin, CA 95677
 Transportation Impact Analysis Sierra College Boulevard Commercial Project City of Rocklin Prepared for: David Mohlenbrok City of Rocklin 081 Alvis Court Rocklin, CA 95677 Prepared by: 1875 Olympic Boulevard,
URBAN QUARRY HEADQUARTERS 2717 STEVENAGE DRIVE CITY OF OTTAWA TRANSPORTATION OVERVIEW. Prepared for: Urban Quarry 4123 Belgreen Drive, Ottawa K1G 3N2
 URBAN QUARRY HEADQUARTERS 2717 STEVENAGE DRIVE CITY OF OTTAWA TRANSPORTATION OVERVIEW Prepared for: Urban Quarry 4123 Belgreen Drive, Ottawa K1G 3N2 February 27, 2014 113-584 Overview_1.doc D. J. Halpenny
EXECUTIVE SUMMARY. Page 1 of 6
 EXECUTIVE SUMMARY The purpose of this report is to identify conformance with the original traffic impact study for the proposed retail development on Lot 5 of Riverdale Retail Filing No. 1 located on the
Intersection of Massachusetts Avenue and Maple Street in Lexington Signalized Intersection and Roundabout Comparison
 Intersection of Massachusetts Avenue and Maple Street in Lexington Signalized Intersection and Roundabout Comparison Michael Wallwork, Roundabout Expert, Orange Park, Florida Tom Bertulis (MS, PE, PTOE),
Traffic Impact Analysis
 Traffic Impact Analysis Isle of Capri Casinos, Inc. Waterloo, Iowa SEH No. A-CLAAS0501.00 November 16, 2004 Table of Contents (Continued) Table of Contents Certification Page Table of Contents Page 1.0
Traffic Impact Study Little Egypt Road Development Denver, North Carolina June 2017
 Traffic Impact Study Little Egypt Road Development Denver, North arolina June 2017 N. Little Egypt Road DQ\ QDQFLQJ VDOHV RU RWKHU SHUIRUPDQFH EDVHG FULWHULD Proposed Site Driveways Site Driveway 1 TRAFFI
Roundabout Feasibility Memorandum
 Roundabout Feasibility Memorandum To From Gwen Pipkin Bill Howell Date June 18, 2013 Subject Roundabout Feasibility Study SR 29 PD&E Study From Oil Well Road to SR 82 Collier County, FL FPID 417540-1-22-01
PRELIMINARY DRAFT WADDLE ROAD / I-99 INTERCHANGE PROJECT ALTERNATIVE ANALYSIS FINAL TRAFFIC SUMMARY REPORT
 PRELIMINARY DRAFT WADDLE ROAD / I-99 INTERCHANGE PROJECT ALTERNATIVE ANALYSIS FINAL TRAFFIC SUMMARY REPORT Prepared by: In Association with: November 2013 EXECUTIVE SUMMARY Patton Township, in partnership
OTTAWA TRAIN YARDS PHASE 3 DEVELOPMENT CITY OF OTTAWA TRANSPORTATION IMPACT STUDY. Prepared for:
 OTTAWA TRAIN YARDS PHASE 3 DEVELOPMENT CITY OF OTTAWA TRANSPORTATION IMPACT STUDY Prepared for: The Ottawa Train Yards Inc. 223 Colonnade Road South, Suite 212 Nepean, Ontario K2E 7K3 January 17, 2012
Capital Region Council of Governments
 March 23, 2018 Capital Region Council of Governments PROJECT CONCEPT REPORT Realignment of Swamp and Northfield Road s approaches to Route 44 (Boston Turnpike) Town of Coventry SUMMARY: The Town of Coventry
Existing Conditions. Date: April 16 th, Dan Holderness; Coralville City Engineer Scott Larson; Coralville Assistant City Engineer
 Date: April 16 th, 2015 To: From: Re: Dan Holderness; Coralville City Engineer Scott Larson; Coralville Assistant City Engineer Darian Nagle-Gamm, Traffic Engineering Planner Highway 6 (2 nd Street) /
THIS PAGE LEFT BLANK INTENTIONALLY
 GA SR 25 Spur at Canal Road Transportation Impact Analysis PREPARED FOR GLYNN COUNTY, GEORGIA 1725 Reynolds Street, Suite 300 Brunswick, Georgia 31520 PREPARED BY 217 Arrowhead Boulevard Suite 26 Jonesboro,
ORLEANS GARDENS SHOPPING CENTRE 1615 ORLEANS BOULEVARD CITY OF OTTAWA, ONTARIO TRANSPORTATION IMPACT STUDY. Prepared for:
 ORLEANS GARDENS SHOPPING CENTRE 1615 ORLEANS BOULEVARD CITY OF OTTAWA, ONTARIO TRANSPORTATION IMPACT STUDY Prepared for: Orleans Gardens Shopping Centre Inc. 2851 John Street, Suite 1 Markham, ON K3R 5R7
FAIRFIELD INN & SUITES HOTEL 135 THAD JOHNSON PRIVATE OTTAWA TRANSPORTATION BRIEF. Prepared for:
 FAIRFIELD INN & SUITES HOTEL 135 THAD JOHNSON PRIVATE OTTAWA TRANSPORTATION BRIEF Prepared for: Bona Building & Management Co. Ltd. Place Vanier, 333 North River Road Vanier, Ontario K1L 8B9 August 12,
Draft Report. Traffic Impact Study. Superstore, Wal-Mart, and Kent Development. Yarmouth, Nova Scotia. Prepared for
 oad & Traffic Management Road & Traffic Management R Atlantic Traffic Engineering Specialists Draft Report Traffic Impact Study Superstore, Wal-Mart, and Kent Development Yarmouth, Nova Scotia Prepared
DRAFT. Corridor study. Honeysuckle Road. October Prepared for the City of Dothan, AL. Prepared by Gresham, Smith and Partners
 DRAFT Corridor study Honeysuckle Road October 2017 Prepared for the City of Dothan, AL Prepared by TABLE OF CONTENTS SECTION I... 1 STUDY SUMMARY... 1 INTRODUCTION... 1 CONCLUSIONS... 5 SECTION II... 7
Technical Memorandum TRAFFIC IMPACT STUDY. RIDLEY ROAD CONVENIENCE STORE Southampton County, VA. Prepared for: Mr. David Williams.
 Technical Memorandum TRFFIC IMPCT STUDY RIDLEY ROD CONVENIENCE STORE Southampton County, V Prepared for: Mr. David Williams By: Charles Smith, P.E., PTOE EPR Charlottesville, V July 2014 1 TBLE OF CONTENTS
Chapter 5 5. INTERSECTIONS 5.1. INTRODUCTION
 Chapter 5 5. INTERSECTIONS 5.1. INTRODUCTION Intersections are the physical component of the roadways where two highways intersect. They are the most complex element of roadways, since it requires more
Patuxent Green Golf Course
 Patuxent Green Golf Course Laurel, Maryland February 23, 2018 Traffic Impact Analysis Prepared for: ADC Builders Alan Cohen 2701 Tower Oaks Boulevard, Suite 200 Rockville, Maryland 20852 TABLE OF CONTENTS
Harrah s Station Square Casino
 Transportation Analysis Harrah s Station Square Casino Pittsburgh, Pennsylvania Submitted To: City of Pittsburgh and Pennsylvania Gaming Control Board Prepared By: DKS Associates GAI Consultants December
NO BUILD TRAFFIC OPERATIONS
 3. 23 NO BUILD TRAFFIC OPERATIONS This section addresses the operations of the transportation system and details how it would be expected to function under year 23 No Build conditions with the projected
Intersection Control Evaluation
 Intersection Control Evaluation Trunk Highway 33 at Interstate 35 Ramps Cloquet, Carlton County, Minnesota S.P. 98-5 Minnesota Department of Transportation District June 27 SRF. 6 934 Table of Contents
FRONT RANGE CROSSINGS TRAFFIC IMPACT STUDY
 FRONT RANGE CROSSINGS TRAFFIC IMPACT STUDY Prepared for: City of Thornton And Colorado Department of Transportation Prepared by: 11 Blake Street, Suite 2 Denver, Colorado 822 Contact: Brian Bern, PE, PTOE
TRAFFIC IMPACT STUDY
 TRAFFIC IMPACT STUDY for the GLEN ELLEN COUNTRY CLUB SENIOR RESIDENTIAL REDEVELOPMENT 84 Millis, Massachusetts Prepared by: McMahon Associates, Inc. Prepared for: Toll Brothers, Inc. August 216 DRAFT
1609 E. FRANKLIN STREET HOTEL TRAFFIC IMPACT STUDY EXECUTIVE SUMMARY
 1609 E. FRANKLIN STREET HOTEL TRAFFIC IMPACT STUDY EXECUTIVE SUMMARY Prepared for: The Town of Chapel Hill Public Works Department Traffic Engineering Division Prepared by: HNTB North Carolina, PC 343
Route 28 (South Orleans Road)/Route 39 (Harwich Road)/Quanset Road Intersection
/Route 39 (Harwich Road)/Quanset Road Intersection") TRAFFIC FEASIBILITY STUDY Route 28 (South Orleans Road)/Route 39 (Harwich Road)/Quanset Road Intersection Orleans, Massachusetts Prepared for: Town of Orleans Prepared by: Fay, Spofford & Thorndike, LLC
TRAFFIC FEASIBILITY STUDY Route 28 (South Orleans Road)/Route 39 (Harwich Road)/Quanset Road Intersection Orleans, Massachusetts Prepared for: Town of Orleans Prepared by: Fay, Spofford & Thorndike, LLC
Truck Climbing Lane Traffic Justification Report
 ROUTE 7 (HARRY BYRD HIGHWAY) WESTBOUND FROM WEST MARKET STREET TO ROUTE 9 (CHARLES TOWN PIKE) Truck Climbing Lane Traffic Justification Report Project No. 6007-053-133, P 101 Ι UPC No. 58599 Prepared by:
MEMORANDUM. DATE March 1, 2012 TO Town of Milton Mark Abbott, Seth Asante, and Efi Pagitsas Boston Region MPO Staff
 MEMORANDUM DATE March 1, 212 TO Town of Milton FROM RE Mark Abbott, Seth Asante, and Efi Pagitsas Boston Region MPO Staff FFY 211 Safety and Operations Analyses at Selected Boston Region MPO Intersections:
FINAL DESIGN TRAFFIC TECHNICAL MEMORANDUM
 FINAL DESIGN TRAFFIC TECHNICAL MEMORANDUM July 2014 FINAL (SR 43) Project Development and Environment Study From State Road 60 (Adamo Drive) to I-4 (SR 400) Hillsborough County, Florida Work Program Item
6060 North Central Expressway Mixed-Use Site Dallas, Texas
 Volume 1 Traffic Impact Analysis 6060 North Central Expressway Mixed-Use Site Dallas, Texas April 30, 2018 Kimley-Horn and Associates, Inc. Dallas, Texas Project #063238300 Registered Firm F-928 Traffic
DUNBOW ROAD FUNCTIONAL PLANNING
 DUNBOW ROAD FUNCTIONAL PLANNING Final Report August 3, 216 #31, 316 5th Avenue NE Calgary, AB T2A 6K4 Phone: 43.273.91 Fax: 43.273.344 wattconsultinggroup.com Dunbow Road Functional Planning Final Report
Public Information Meeting. Orange Camp Road. Dr. Martin Luther King Jr. Beltway to I-4. Presented by: Volusia County August 2, 2018
 Public Information Meeting Orange Camp Road Dr. Martin Luther King Jr. Beltway to I-4 Presented by: Volusia County August 2, 2018 1 Project Goals To improve the operations and safety for Orange Camp Road
I-95 Northbound at US 1 (Exit 126) Design and Study Final Report
 Design and Study Final Report") I-95 Northbound at US 1 (Exit 126) Design and Study Final Report July 2018 Prepared by: Prepared for: TABLE OF CONTENTS 1 Introduction... 1 Study Area Limits... 1 Purpose and Need of the Study... 1 Safety
I-95 Northbound at US 1 (Exit 126) Design and Study Final Report July 2018 Prepared by: Prepared for: TABLE OF CONTENTS 1 Introduction... 1 Study Area Limits... 1 Purpose and Need of the Study... 1 Safety
ORANGE COUNTY PUBLIC WORKS TRAFFIC INVESTIGATIONS
 ORANGE COUNTY PUBLIC WORKS TRAFFIC INVESTIGATIONS STAFF REPORT OF: January 6, 2019 SUPERVISORIAL DISTRICT: 5 SUBJECT: LOCATION: INVESTIGATOR: O Neill Drive at Roanoke Drive; Ladera Ranch; TB 922-E6 Clever
Shockoe Bottom Preliminary Traffic and Parking Analysis
 Shockoe Bottom Preliminary Traffic and Parking Analysis Richmond, Virginia August 14, 2013 Prepared For City of Richmond Department of Public Works Prepared By 1001 Boulders Pkwy Suite 300, Richmond, VA
Meadow Woods Elementary School
 Drag and drop pic and stretch/crop to the limits of the blue rectangle (delete this text box) Meadow Woods Elementary School Drag and drop pic and stretch/crop to the limits of the blue rectangle (delete
Update to DOTD Roundabout Design Policy
 Update to DOTD Roundabout Design Policy Roundabout In Louisiana Louisiana has 18 roundabouts in operation and 53 proposed History EDSM s or Engineering Directives and Standards set DOTD policies, procedures,
TRAFFIC SIGNAL WARRANT STUDY
 TRAFFIC SIGNAL WARRANT STUDY 5 th STREET & ENCHANTED PINES DRIVE JANUARY 2013 TRAFFIC OPERATIONS ENGINEERING SERVICES/PUBLIC WORKS DEPARTMENT TABLE OF CONTENTS INTERSECTION LOCATION MAP ii INTRODUCTION
Grant Avenue Streetscape
 REPORT TYPE GOES HERE Grant Avenue Streetscape PREPARED FOR City of Manassas 9027 Center Street Manassas, VA 20110 PREPARED BY 8300 Boone Boulevard Suite 700 Vienna, Virginia 22182 571.389.8121 July 31,
Signal Warrant Studies
 Signal Warrant Studies Seven Locations Piqua, Ohio December 12, 217 Signal Warrant Studies Seven Locations Piqua, Ohio TABLE OF CONTENTS Executive Summary... 3 Introduction... 5 Study Location... 5 Data
INTERSECTION OPERATIONAL ANALYSIS AND NECESSARY RECOMMENDATIONS CIVL 440 Project
 INTERSECTION OPERATIONAL ANALYSIS AND NECESSARY RECOMMENDATIONS CIVL 44 Project INTERSECTION: 16TH AVENUE & EAST MALL FOR AM PEAK HOUR Group Work: Syed Shafaat Ali Shah (2347426) Mohammad Moudud Hasan
NEW YORK CENTRAL PARK SUBDIVISION BLAIS STREET/ST-PIERRE STREET EMBRUN, ONTARIO TRAFFIC IMPACT STUDY. Prepared for:
 NEW YORK CENTRAL PARK SUBDIVISION BLAIS STREET/ST-PIERRE STREET EMBRUN, ONTARIO TRAFFIC IMPACT STUDY Prepared for: Solidex Holdings Limited & Investissement Maurice Lemieux Investments Attn: Mr. Anthony
Intersection Traffic Control Feasibility Study
 Intersection Traffic Control Feasibility Study CSAH 9 at CSAH 60 (185th Avenue) Prepared For: Dakota County Transportation Department Western Service Center 14955 Galaxie Avenue, 3rd Floor Apple Valley,
Roundabouts. By: Nezamuddin, Valparaiso University. February 19, 2015
 Roundabouts By: Nezamuddin, Valparaiso University February 19, 2015 Outline 1. Background on Roundabouts 2. Silhavy Rd. Corridor Improvement Project in Valparaiso, IN 3. 5-points Roundabout in Valparaiso,
I-95/Temple Avenue Interchange
 Roundabout Peer Review I-95/Temple Avenue Interchange Colonial Heights, Virginia January 2013 Roundabout Peer Review I 95/Temple Avenue Interchange Colonial Heights, Virginia Prepared for: Robert E. Vilak,
Roundabout Evaluations in Virginia: US 15/US 50 Gilberts Corner, VA SR 106/SR 634 Prince George County, VA
 Roundabout Evaluations in Virginia: US 15/US 50 Gilberts Corner, VA SR 106/SR 634 Prince George County, VA VDOT & FHWA Roundabout Workshop September 17, 2013 Chris Tiesler, PE Presentation Outline US 15/US
Waterford Lakes Small Area Study
 Waterford Lakes Small Area Study Existing Traffic Conditions PREPARED FOR: ORANGE COUNTY PUBLIC WORKS DEPARTMENT TRAFFIC ENGINEERING DIVISION ORLANDO, FLORIDA PREPARED WITH: INWOOD CONSULTING ENGINEERS
TRAFFIC ASSESSMENT River Edge Colorado
 TRAFFIC ASSESSMENT River Edge Colorado Submitted by: Fehr & Peers 621 17th Street, Ste. 231 Denver, CO 8293 (33) 296-43 December, 21 App. M-2 Traffic Assessment River Edge Colorado December 21 TABLE OF
Intersection Improvement Study Hendricks County Road 100 South & Dan Jones Road Avon, Indiana
 Intersection Improvement Study Hendricks Avon, Indiana Final Report November 7, 2003 Prepared for The Town of Avon By DLZ Indiana, LLC 36 South Pennsylvania Street, Suite 360 Indianapolis, Indiana 46204
Figure 1: East West Connector Alignment Alternatives Concept Drawing
 Page 2 of 9 Figure 1: East West Connector Alignment Alternatives Concept Drawing The Montebello Drive extension will run north south and connect Wilsonville Road to the Boones Ferry Road to Brown Road
Troutbeck Farm Development
 Troutbeck Farm Development Willistown Township, Chester County PA For Submission To: Willistown Township Last Revised: October, 4 TPD# INLM.A. 5 E. High Street Suite 65 Pottstown, PA 9464 6.36.3 TPD@TrafficPD.com
Introduction Roundabouts are an increasingly popular alternative to traffic signals for intersection control in the United States. Roundabouts have a
 HIGH-CAPACITY ROUNDABOUT INTERSECTION ANALYSIS: GOING AROUND IN CIRCLES David Stanek, PE and Ronald T. Milam, AICP Abstract. Roundabouts have become increasingly popular in recent years as an innovative
USA Parkway Traffic Operations Analysis, Roundabout Option. Pedro Rodriguez, NDOT; Bryan Gant, Jacobs; Randy Travis, NDOT
 Technical Memorandum TO: Hoang Hong, NDOT DATE: September 21, 2012 FROM: SUBJECT: COPIES: John Karachepone, Jacobs USA Parkway Traffic Operations Analysis, Pedro Rodriguez, NDOT; Bryan Gant, Jacobs; Randy
3.9 - Transportation and Traffic
 Transportation and Traffic 3.9 - Transportation and Traffic This section describes the potential transportation and traffic effects of project implementation on the project site and its surrounding area.
Queensgate Drive Corridor Traffic Study
 January 2015 Prepared for: City of Richland Prepared by: J-U-B ENGINEERS, Inc. 2810 W. Clearwater Avenue, Suite 201 Kennewick, Washington 99336 Table of Contents Introduction and Background... 1 Existing
9 Leeming Drive Redevelopment Ottawa, ON Transportation Brief. Prepared By: Stantec Consulting Ltd.
 9 Leeming Drive Redevelopment Ottawa, ON Transportation Brief Prepared By: Stantec Consulting Ltd. TIA GUIDELINES CHECKLIST Report Context Municipal Address Comment: Section 1.1 Location relative to major
HCM 2010: ROUNDABOUTS. PRAVEEN EDARA, PH.D., P.E., PTOE UNIVERSITY OF MISSOURI - COLUMBIA
 HCM 2010: ROUNDABOUTS PRAVEEN EDARA, PH.D., P.E., PTOE UNIVERSITY OF MISSOURI - COLUMBIA EMAIL: edarap@missouri.edu OUTLINE Terminology used Input data needs Capacity of single and multilane roundabouts
Road Conversion Study Plumas Street
 Plumas Street Phase I Submitted to The Regional Transportation Commission of Washoe County Submitted by Zong Tian, Ph.D., P.E. Saeedeh Farivar Haiyuan Li, Ph.D. Center for Advanced Transportation Education
Orange Center Elementary School
 Drag and drop pic and stretch/crop to the limits of the blue rectangle (delete this text box) Orange Center Elementary School Drag and drop pic and stretch/crop to the limits of the blue rectangle (delete
TABLE TRAFFIC ANALYSIS SCENARIOS
 4.11 TRANSPORTATION The potential traffic impacts of the proposed project are evaluated in the Buena Park Beach/Orangethorpe Mixed Use Project Traffic Analysis (Traffic Analysis) by Austin-Foust Associates
Date: September 7, Project #: Re: Spaulding Youth Center Northfield, NH Property. Traffic Impact Study
 To: Ms. Susan C. Ryan Spaulding Youth Center 72 Spaulding Road Northfield, NH 03276 Date: September 7, 2017 Project #: 52455.00 From: Robin Bousa Director of Transportation Systems Re: Spaulding Youth
TRAFFIC CONTROL DEVICES ON EDGEWATER BOULEVARD AT PORT ROYAL AVENUE (NORTH)
") Attachment 2 DATE: August 6, 2012 TO: VIA: FROM: SUBJECT: Mayor and Members of the City Council James C. Hardy, City Manager Ramon Towne, Director of Public Works Leah Edwards, Assistant Engineer TRAFFIC
Attachment 2 DATE: August 6, 2012 TO: VIA: FROM: SUBJECT: Mayor and Members of the City Council James C. Hardy, City Manager Ramon Towne, Director of Public Works Leah Edwards, Assistant Engineer TRAFFIC