EAST BAY/BLACKWATER BAY/LOWER YELLOW RIVER PRELIMINARY BASELINE RESOURCE CHARACTERIZATION
|
|
|
- Stephen Perry
- 5 years ago
- Views:
Transcription
1
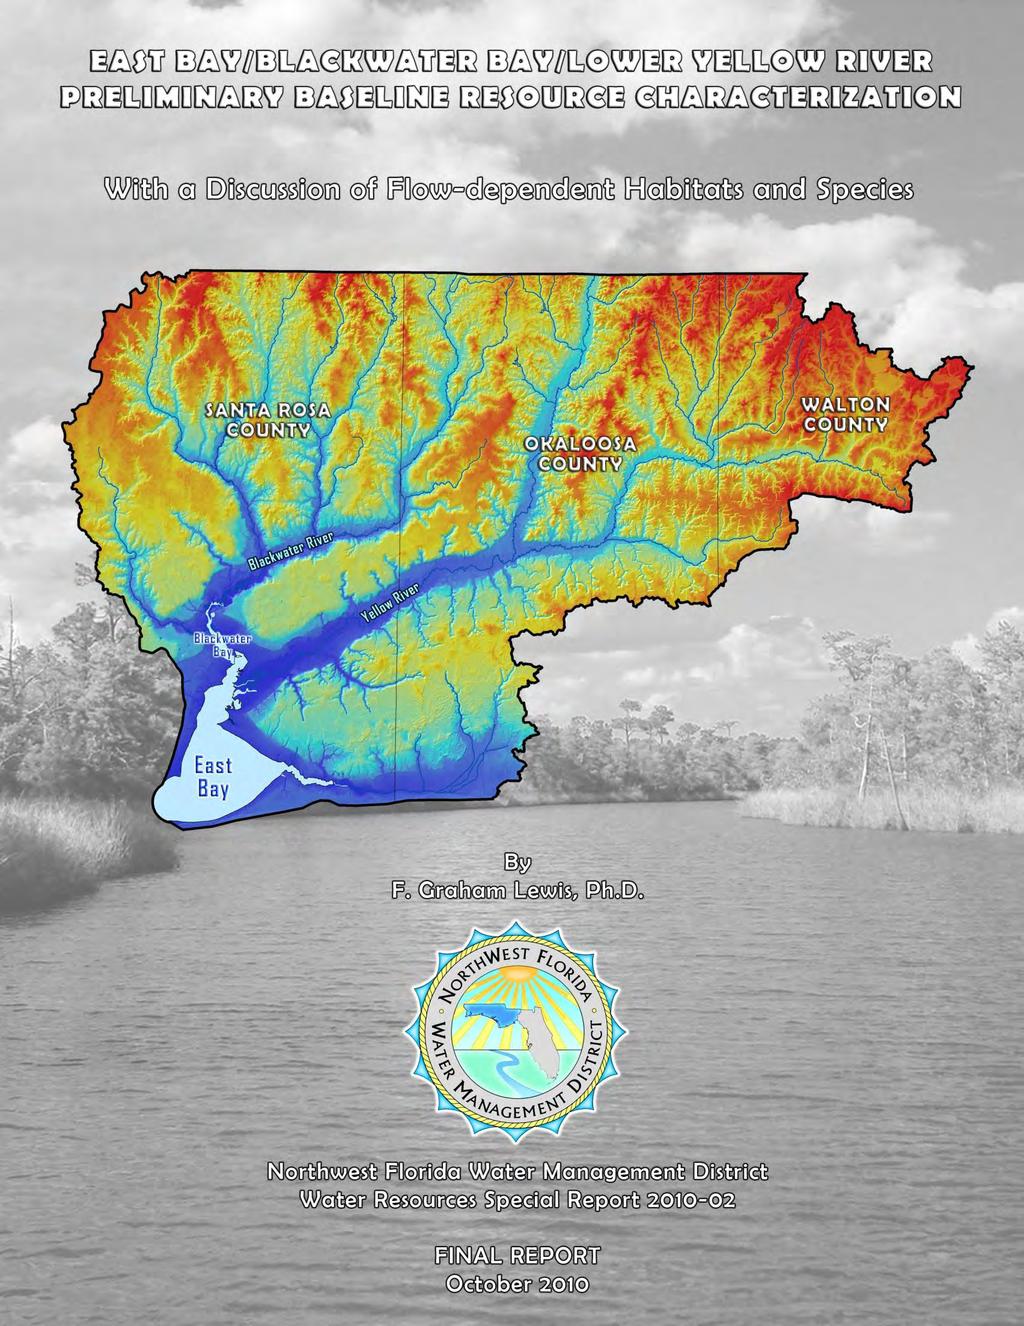
2 EAST BAY/BLACKWATER BAY/LOWER YELLOW RIVER PRELIMINARY BASELINE RESOURCE CHARACTERIZATION With a Discussion of Flow-dependent Habitats and Species By F. Graham Lewis, Ph.D. Northwest Florida Water Management District Water Resources Special Report FINAL REPORT October 2010
3 NORTHWEST FLORIDA WATER MANAGEMENT DISTRICT GOVERNING BOARD George Roberts, Chair Panama City Philip McMillan, Vice Chair Blountstown Steve Ghazvini, Secretary/Treasurer Tallahassee Peter Antonacci Stephanie Bloyd Joyce Estes Tallahassee Panama City Beach Eastpoint Tim Norris Jerry Pate Ralph Rish Santa Rosa Beach Pensacola Port St. Joe Douglas E. Barr Executive Director For additional information, write or call: Northwest Florida Water Management District 81 Water Management Drive Havana, Florida (850)
4 ACKNOWLEDGEMENTS The authors gratefully acknowledge the assistance of NWFWMD staff and other researchers that provided information and guidance during the development of this report. The contributions of the following NWFWMD staff are appreciatively acknowledged: Kris Barrios, Ron Bartel, Leigh Brooks, David Clayton, Christina Coger, John Crowe, Karen Kebart and Paul Thorpe. The authors also acknowledge the researchers and individuals that provided information and technical data that were referenced in this report. Among those, special thanks go to Ted Hoehn and John Knight (FFWCC) for information on freshwater fish distributions in the Yellow, Shoal and adjacent rivers, and Shelly Alexander (FDEP) for information related to the Yellow River Aquatic Preserve. Cover: John Crowe, NWFWMD
5 TABLE OF CONTENTS 1.0 INTRODUCTION Surface Water Improvement and Management Program Watershed Research and Evaluations Watershed Protection and Preservation Purpose and Scope THE PENSACOLA BAY SYSTEM GENERAL FEATURES OF EAST BAY/BLACKWATER BAY Watershed/Drainage Basins Land Use Freshwater Discharge Water Quality Classifications Water Quality Characteristics Estuarine Areas Riverine Areas Sediment Characteristics Physical Properties Sediment Contamination HABITATS ASSOCIATED WITH THE EAST BAY COMPLEX Palustrine Forests Fresh/Brackish Wetlands Tidal Salt Marshes Seagrass/Submerged Aquatic Vegetation Soft-bottom Habitat Hard-bottom Habitat FAUNAL COMMUNITIES IN THE EAST BAY/BLACKWATER BAY SYSTEM Benthic Macrofauna (Infauna/Epifauna) Shrimp and Crab Abundance Fish Abundance Commercial Landings Threatened and Endangered Species i
6 6.0 IMPORTANCE OF FRESHWATER TO THE LOWER YELLOW RIVER AND THE BLACKWATER/EAST BAY SYSTEM Species and Habitats with Freshwater Dependence Flow Dependence and Salinity Tolerance Palustrine Forests Freshwater/Brackish Marshes Tidal Salt Marshes Submerged Aquatic Vegetation (SAV) Oyster Reefs Faunal Abundance and Distribution REFERENCES CITED APPENDICES SALINITY TOLERANCES FOR SELECTED ORGANISMS Appendix A Appendix A ii
7 LIST OF FIGURES Figure 1 Watershed of the Pensacola Bay system...4 Figure 2 The Pensacola Bay system...5 Figure 3 Bathymetric profile of the Pensacola Bay system...6 Figure 4 Watersheds draining into East Bay/Blackwater Bay...8 Figure 5 Land use in the Pensacola Bay region...9 Figure 6 Conservation and publicly owned lands surrounding the Pensacola Bay system...10 Figure 7 Blackwater River discharge measured at Baker, FL, for the period from April 1950 to September Figure 8 Big Coldwater Creek discharge measured at Milton, FL, for the period from December 1938 to September Figure 9 Yellow River discharge measured at Milligan, FL, for the period from August 1938 to September Figure 10 Shoal River discharge measured at Crestview, FL, for the period from August 1938 to September Figure 11 Yellow River discharge measured at the SR87 bridge near Milton, FL for the period October 2001 to September Figure 12 Shellfish harvesting area classifications in the Pensacola Bay system...15 Figure 13 Location of water quality sampling stations in Blackwater and East Bays...18 Figure 14 Comparison of salinity between stations in Blackwater Bay and East Bay...21 Figure 15 Comparison of water temperature and dissolved oxygen between stations in Blackwater Bay and East Bay...22 Figure 16 Comparison of nitrate+nitrite, ammonia, total Kjeldahl nitrogen and total nitrogen at sites in Blackwater and East Bays...24 Figure 17 Water quality collection sites on the Yellow and Shoal rivers...25 Figure 18 Comparison of long-term surface specific conductance at two sites in the Yellow River...28 Figure 19 Comparison of long-term specific conductance from surface and bottom samples taken in the lower Yellow River (Site 3551 at the SR87 bridge)...29 Figure 20 Comparison of long-term dissolved oxygen at two sites in the Yellow River...30 Figure 21 Long-term nutrient concentrations at Station 3546 (at the SR2 bridge) in the upper reach of the Yellow River...31 Figure 22 Long-term nutrient concentrations at Station 3551 (at the SR87 bridge) in the lower reach of the Yellow River...31 Figure 23 Wetlands in the East Bay watersheds...36 Figure 24 Wetland habitats in the vicinity of East Bay...40 Figure 25 Charted oyster resources, including natural reefs, aquaculture enhancement areas and shellfish lease sites, located in the Pensacola Bay system...45 iii
8 Figure 26 Figure 27 Fish and benthos collection sites in the Yellow and Shoal rivers taken during by the FFWCC...47 Recent fish collection sites on the Yellow and Shoal rivers, including small tributary streams and creeks...58 iv
9 LIST OF TABLES Table 1 Summary of water quality characteristics for East Bay/Blackwater Bay sites ( )...19 Table 2 Summary of water quality characteristics for East Bay/Blackwater Bay sites ( )...20 Table 3 Summary of selected water quality characteristics collected at sites in the Yellow/Shoal River system...26 Table 4 Sediment quality in the Blackwater Bay/East Bay system. Selected characteristics are presented for Blackwater, East, Escambia and Pensacola Bays (Olinger et al. 1975)...33 Table 5 Sediment quality in the Blackwater Bay/East Bay system. Selected characteristics are presented for three sites in Blackwater and three sites in East Bays (Long et al. 1997)...35 Table 6 Summary of benthic macrofaunal taxa collected in Blackwater and East Bays during (Olinger et al. 1975)...48 Table 7 Summary of benthic macrofauna collected in Blackwater and East Bays during (Olinger et al. 1975)...51 Table 8 Summary of shrimp collected in East and Escambia Bays during (Olinger et al. 1975)...53 Table 9 Abundance of fishes collected by electrofishing at six sites in the Yellow and Shoal rivers ( )...55 Table 10 Comparison of relative abundances of common fishes collected in small streams within the Pensacola and Perdido Bay watersheds ( )...57 Table 11 List of common fishes collected by reach in the Yellow and Shoal rivers by the Florida Fish and Wildlife Conservation Commission ( )...59 Table 12 Summary of fishes collected in Blackwater Bay during (Bass and Hitt 1977)...62 Table 13 Summary of fishes collected in East and Escambia Bays during (Olinger et al. 1975)...64 Table 14 Recent commercial harvests of selected estuarine species landed in Santa Rosa County compared with all finfish (estuarine and marine) landed in the county...68 v
10 EAST BAY/BLACKWATER BAY/LOWER YELLOW RIVER PRELIMINARY BASELINE RESOURCE CHARACTERIZATION 1.0 INTRODUCTION 1.1 Surface Water Improvement and Management Program The Pensacola Bay system was included by the Northwest Florida Water Management District (NWFWMD) as one of its priority water bodies in the Surface Water Improvement and Management (SWIM) Program. The SWIM Program was initiated by the Florida legislature in 1987 to prioritize surface waters of the state and to develop and implement plans to improve the quality of these waters and their associated resources. The five water management districts were directed to carry out the SWIM Program under the aegis of the Florida Department of Environmental Regulation (now the Florida Department of Environmental Protection (FDEP)). The SWIM Plan for the Pensacola Bay system was originally approved in 1988, with revisions in 1990 and The 1997 revision expanded the watershed and planning area boundary to include the Escambia, Blackwater, Yellow, Shoal, and East Bay rivers and the majority of Santa Rosa Sound as well as the bays and their associated bayous. The plan includes a variety of projects to assess and improve water, sediment and habitat quality, to enhance public education and awareness, and to assist in the administration, planning and coordination of the various resources management initiatives in the basins (Thorpe et al. 1997). 1.2 Watershed Research and Evaluations Numerous studies and evaluations related to the Pensacola Bay system provide a broad range of information about activities within the drainage basin. As part of the Pensacola Bay SWIM Program, the NWFWMD identified point sources of pollution within the watersheds (Wiley et al. 1990), completed a review of nonpoint source methodologies (NWFWMD 1993) and developed preliminary nonpoint loading rates for the system (Hunner et al. 1994), assessed existing water and sediment quality data (Jones et al. 1992; Roaza and Pratt 1992; Wood and Bartel 1994), provided stormwater assessments for Bayou Chico (Pratt et al. 1993), Bayou Texar (NWFWMD 1988) and the Palafox/Coyle watersheds (Guo and Pratt 1993; Hunner et al. 1995), reviewed and assessed the current status and trends of biological communities (Collard 1991a) and management options for habitat restoration and monitoring (Collard 1991b), updated the assessment of biological monitoring data collected within the system (Von Appen and Winter 2000) and, most recently, reassessed sediment quality throughout the system (DeBusk et al. 2002). 1.3 Watershed Protection and Preservation The NWFWMD uses a variety of management strategies and tactics as identified in the Pensacola SWIM Plan (1997) to restore, protect and preserve the water resources in the watershed. Some of the ongoing activities include: hydrologic data collection and monitoring, freshwater needs assessment, local stormwater planning assistance, reuse of 1
11 reclaimed water, construction of stormwater retrofit facilities and implementation of stormwater Best Management Practices (BMPs), integration of the Flood Hazard Map Modernization Program, preservation of critical lands and habitats, ecological restoration, and public education and outreach. The implementation of these activities is outlined in the SWIM Plan. In addition to these activities, the NWFWMD initiated a program of water quality protection in the watersheds through land acquisition. Using funds from Preservation 2000, Save Our Rivers, Florida Forever and Florida Department of Transportation, the NWFWMD has purchased property along the Escambia, Blackwater, and Yellow/Shoal Rivers as well as on Garcon Point. As of the end of 2009, the NWFWMD had purchased approximately 34,919 acres along the Escambia, 380 acres along the Blackwater, and 17,742 acres along the Yellow/Shoal Rivers; the District currently owns 3,245 acres on Garcon Point. Additional acreages in these basins have been identified for possible acquisition (NWFWMD 2009). 1.4 Purpose and Scope Freshwater inflows are a dominant influence on habitat and biological resources within the Pensacola Bay system. The quantity, quality and timing of these discharges is critical to maintaining the estuarine conditions found here. Recent activities in the eastern portion of the drainage basin have the potential to affect biological resources in East Bay/Blackwater Bay prompting this compilation of available data and preliminary baseline resource assessment. The Yellow River, for example, was recently considered for impoundment and use as a surface water source for future public water supplies by the U.S. Army Corps of Engineers (USACOE 2004). An existing Sand and Gravel Aquifer wellfield between the Blackwater and Yellow Rivers that is permitted currently to extract relatively small quantities of groundwater connected to these rivers has been proposed for expansion. Additionally, surface water and/or riverbank wells within the Yellow/Shoal Rivers basin have been proposed to divert small quantities of surface water for public water supply. Potential upstream water diversions within the State of Alabama are also possible, although little is known at present. The primary focus of this study is to provide a detailed description and characterization of water resources and natural systems within the Blackwater/East Bay system. The following report focuses on those resources potentially affected by altered surface water discharges into East and Blackwater Bays, including the lower portion of the Yellow River. 2
12 2.0 THE PENSACOLA BAY SYSTEM The Pensacola Bay watershed covers nearly 7,000 square miles (Figure 1), about onethird of which is in Florida (Thorpe et al. 1997). This area includes the majority of Escambia, Santa Rosa and Okaloosa Counties, the northwestern quadrant of Walton County, and a substantial portion of southern Alabama. Three major rivers, the Escambia, the Blackwater and the Yellow Rivers, discharge into the Pensacola Bay complex and provide the bulk of the freshwater input to the system. These rivers vary considerably in length, basin size, and type (Thorpe et al. 1997). The Pensacola Bay estuarine system is a drowned river estuary and lagoon located in the extreme western portion of the panhandle of Florida. The system consists of five interconnecting waterbodies, Pensacola Bay, Escambia Bay, Blackwater Bay, East Bay, and Santa Rosa Sound (Figure 2), with a combined surface area of about 144 square miles (Thorpe et al. 1997), excluding Santa Rosa Sound. The bays stretch approximately 25 miles (roughly west to east, excluding Santa Rosa Sound) along an axis parallel to the Gulf of Mexico and extend about 20 miles inland (Thorpe et al. 1997). The boundaries of the estuarine system extend from the head of tide on the Escambia River near Quintette, on the Blackwater River approximately 5 km north of US Highway 90, and the Yellow River near its juncture with Blackwater Bay (Orlando et al. 1993). The bays are separated from the Gulf of Mexico by Santa Rosa Island which absorbs the majority of the wave energy to the system. A single 800 m wide inlet (Caucus Channel at Ft. Pickens) provides for the predominant exchange of water between the Gulf and the bays. The Pensacola Bay system historically supported a rich and diverse ecology, productive fisheries and considerable recreational opportunities (Thorpe et al. 1997). It also provided significant economic and quality-of-life benefits for the residents of northwest Florida. Unfortunately, it has become apparent that the cumulative effects of a variety of human activities over the last several decades have impaired the system s ecology and diminished the benefits it provides. Point and nonpoint pollution, direct habitat destruction, and the impacts of development and other activities throughout the watershed have combined to degrade the health and productivity of the bay. 3.0 GENERAL FEATURES OF EAST BAY/BLACKWATER BAY The East Bay/Blackwater Bay complex is a relatively small shallow estuarine embayment located in the eastern portion of the Pensacola Bay system (see Figure 2). The bay system consists of a relatively shallow shelf peripheral to a deeper mid-bay region (Figure 3). Blackwater Bay, the northern component, has a surface area of approximately 25 km 2 with a mean depth of 2.0 m; East Bay covers approximately 110 km 2 and has a mean depth of 2.5 m (Collard 1991a). Circulation in the bays is limited (Jones et al. 1992) and is a function primarily of tidal action, freshwater inflows, basin morphology and winds. Tides are a major component of 3

13 Figure 1. Watershed of the Pensacola Bay system; note over half of the watershed is located outside the State of Florida. 4

14 Figure 2. The Pensacola Bay system with Blackwater and East bays making up the eastern portions of the Pensacola estuary. 5

15 Figure 3. Bathymetric profile of the Pensacola Bay system. Depth contours are shown in feet. 6
16 circulation in many estuarine systems; however, because of the location of the Pensacola system along the Gulf coastline, tidal energy is minimal. Tides in this region are predominantly diurnal (one tidal cycle per day) with average amplitude of 0.34 m (1.1 ft) at the entrance on Pensacola Bay. According to Jones et al. (1992), East Bay is the least affected portion of the Pensacola Bay system to factors influencing circulation; East Bay has very little transport capability due to tidal forcing alone, indicating that circulation is extremely weak. They suggested that East Bay has reduced assimilative capacity because of this limited response to tidal fluctuations. These observations underscored conclusions made by Collard (1991a) that East Bay was one of the more vulnerable areas of the Pensacola Bay system, in part, because of poor circulation and limited flushing. 3.1 Watershed/Drainage Basins Three watersheds provide the bulk of the surface drainage to the East Bay/Blackwater Bay complex (Figure 4). The majority of freshwater is derived from the Blackwater and Yellow Rivers; a relatively small flow volume is contributed from the East Bay River. The Blackwater River originates in Bradely, Alabama, and travels south approximately 62 miles before discharging into Blackwater Bay. The river drains approximately 860 squares miles, of which about 700 are within Florida, and has an average annual discharge of about 342 cubic feet per second (cfs), as gaged at Baker, Florida, about 35 miles above its mouth (Mossa 1998). The major source of flow is groundwater discharge from the Sand and Gravel Aquifer, with a smaller contribution from surface runoff. Surface waters drain primarily from acidic flatwoods and other wetlands adjacent to the river, giving it a reddish color due to the presence of tannins and organic acids. The Blackwater River is designated an Outstanding Florida Water and is among the most popular waterbodies in the state for canoeing and other recreactional activities (Thorpe et al. 1997). The upper Blackwater River and its tributaries have been described as swift, relatively shallow and sand-bottomed (Bass and Hitt 1977). The lower Blackwater River system receives discharge from domestic wastewater treatment facilities, and portions of the system are subject to impacts from nonpoint source pollution. A series of lake-like freshwater and brackish basins are found in the lower reach, much of which is tidally influenced. Water quality in general has been characterized as excellent with much of the river basin protected by conservation lands (Thorpe et al. 1997). The Yellow River originates in Covington County, Alabama, and travels 110 miles to Blackwater Bay. The river has a drainage basin of about 1,365 square miles with an extensive forested floodplain (Thorpe et al. 1997). Average annual discharge is approximately 1,181 cfs as measured at Milligan, Florida, about 40 miles above its mouth (Mossa 1998). The Yellow River is described as a sand-bottom river with shallow, cleartan waters. The main tributary of the Yellow River is the Shoal River, which originates in northern Walton County. The Shoal River drains approximately 499 square miles (Thorpe et al. 1997) and has an average annual discharge of about 1,104 cfs as gaged at Crestview, Florida, about seven miles above it confluence with the Yellow River (Mossa 7

17 Figure 4. Watersheds draining into East Bay/Blackwater Bay. 8

18 1998). A recently established gage on the lower Yellow River (SR87 near Milton) downstream of the confluence with the Shoal has measured an average flow of 2,289 cfs. The lower portion of the Yellow River, and parts of Blackwater and East Bays, are managed as the Yellow River Marsh Aquatic Preserve. The Shoal River and waters within the Aquatic Preserve are designated as Outstanding Florida Waters. The Yellow River system is subject to a variety of nonpoint pollution sources, as well as drainage from domestic and industrial wastewater reuse facilities (Thorpe et al. 1997). Urban runoff from the town of Crestview is problematic for both the Yellow and Shoal Rivers (Thorpe et al. 1997). Despite these impacts, water quality throughout the system has been described as some of the most pristine in the state (DEP 1998). 3.2 Land Use Land use and land cover in the vicinity of East Bay/Blackwater Bay (Figure 5) is predominantly undeveloped wetlands and upland forests to the east (Eglin property), Figure 5. Landuse in the Pensacola Bay region. Landuse/landcover data are based on information (FDEP ). 9
 and agricultural lands (18%) make up")
19 agriculture and wetlands to the west (Garcon Point), and residential to the north and south associated with the town of Milton and the Gulf Breeze peninsula. Predominant land use within the Florida portion of the East Bay/Blackwater Bay watershed is upland forest, comprising nearly 54% of the acreage; wetlands (19%) and agricultural lands (18%) make up the majority of the remainder. Land use proportions vary somewhat within the three basins with upland forests ranging from 48.1% (East River) to 56.6% (Blackwater) and wetlands spanning from 15.4% (Blackwater) to 26.2% (East River). Developed areas averaged about 7.5% over the watershed, ranging from 7.0% (Yellow) to 11.1% (East River) within the basins. A significant portion of the watershed is in public ownership (Figure 6) with large tracts owned and managed by the NWFWMD, the State of Florida (e.g. Blackwater State Forest) and federal government (e.g., Gulf Islands National Seashore, Eglin Air Force Base, Hurlbert Field, Naval Air Station Pensacola). Figure 6. Conservation and publicly owned lands surrounding the Pensacola Bay system. 10
20 3.3 Freshwater Discharge The primary freshwater inflows to the East Bay/Blackwater Bay system include the Blackwater River and the Yellow/Shoal Rivers, both of which discharge into Blackwater Bay proper. Relatively small amounts of freshwater enter East Bay directly through the East Bay River. Gages are located on the Blackwater, Yellow and Shoal Rivers with records extending for over 50 years; the East Bay River is ungaged. Blackwater River flows, as recorded at the Baker, Florida gage over the period of record (1950 to 2008), are shown in Figure 7. Daily discharge has varied noticeably from 58 cfs to 23,900 cfs over the period of record and exhibited a moderate degree of seasonality. Monthly mean flows ranged from 64 cfs to 2029 cfs. Highest flows are generally found during winter and early spring (January to March) with lowest flows in the fall (September to November). Greatest discharge during the period of record was measured on 29 September 1998 associated with Hurricane Georges. The hurricane made landfall on 28 September 1998 near Biloxi, Mississippi, and turned eastward, dropping large quantities of rainfall over the panhandle during the following two days. Over 24 inches of rainfall were officially recorded at Eglin AFB, to the east, associated with the storm (Guiney 1999), significantly affecting discharge of all rivers in the area Blackwater River Flow (4/1/1950-9/30/2008) River Flow (cfs) Apr-50 Apr-60 Apr-70 Apr-80 Apr-90 Apr-00 Date Figure 7. Blackwater River discharge measured at Baker, FL, for the period from April 1950 to September Missing data: 11/18/92 to 9/30/96. Source: U.S. Geological Survey
21 Since the gage at Baker only captures flow from the upper portions of the Blackwater River basin, it is useful to include additional discharge measured at the Big Coldwater Creek gage as a contributor to estuarine inflows. Big Coldwater Creek is a major tributary of the Blackwater River below the Baker gage and as such provides significant inflows into Blackwater Bay. In fact, average flow in the creek is 562 cfs, thus adding more than 1.5 times the flow to the river as that measured at the upstream gage. Discharge varied significantly over the period of record (Figure 8) ranging from 158 cfs to 29,700 cfs. Although discharge was very high associated with Hurricane Georges, greatest flow was measured on 17 March 1990 unassociated with tropical weather conditions Big Coldwater Creek Flow (12/1/1938-7/28/2010) River Flow (cfs) Dec-38 Dec-48 Dec-58 Dec-68 Dec-78 Dec-88 Dec-98 Dec-08 Date Figure 8. Big Coldwater Creek discharge measured near Milton, FL, for the period from December 1938 to September Missing data: 6/12/79-2/12/80, 4/23/80-7/14/80, 3/4/92-9/30/97, 9/1/99-4/30/00. Source: U.S. Geological Survey Significantly greater amounts of freshwater enter the bay system from the Yellow/Shoal River complex. Both rivers are gaged above their confluence such that freshwater entering Blackwater Bay is a combination of the two. Yellow River discharge, as recorded at the Milligan, Florida gage (1938 to 2008), is shown in Figure 9. Daily flow varied greatly from 123 cfs to 71,700 cfs over the period of record and exhibited moderate seasonality. Monthly mean flows ranged from 127 cfs to 6,587 cfs. Highest flows were generally found during winter and early spring (January to April) with lowest flows in the fall (September to November). Greatest discharge during the period of record was measured on 1 October 1998 associated with Hurricane Georges. 12
22 80000 Yellow River Flow (8/1/1938-9/30/2008) River Flow (cfs) Aug-38 Aug-48 Aug-58 Aug-68 Aug-78 Aug-88 Aug-98 Aug-08 Date Figure 9. Yellow River discharge measured at Milligan, FL, for the period of record from August 1938 to September Missing data: 10/18/93 to 9/30/96. Source: U.S. Geological Survey Shoal River flows, as recorded at the Crestview, Florida gage over the period (1938 to 2008), are shown in Figure 10. Daily discharge on the Shoal River was similar to that observed for the Yellow River; flows varied greatly from 186 cfs to 55,500 cfs over the period of record and exhibited a moderate degree of seasonality. Monthly mean flows ranged from 261 cfs to 5,436 cfs. As with the Yellow, highest flows are generally found during winter and early spring (January to April) with lowest flows in the fall (October to November). Greatest discharge during the period of record was measured on 30 September 1998, again associated with Hurricane Georges. The Yellow River is currently gaged at the SR87 bridge near Milton, Florida, below the confluence with the Shoal River. This site provides a measurement of the combined flows from the upper reaches of both rivers although the period of record is considerably shorter (10/1/2001 to present) than for the two upstream gages. Average flow at this site is 2,289 cfs, varying daily from 471 cfs to 9,290 cfs (Figure 11). Seasonality is similar to that noted at other sites. 13
23 60000 Shoal River Flow (8/1/1938-9/30/2008) River Flow (cfs) Aug-38 Aug-48 Aug-58 Aug-68 Aug-78 Aug-88 Aug-98 Aug-08 Date Figure 10. Shoal River discharge measured at Crestview, FL, for the period of record from August 1938 to September No missing data in the period of record. Source: U.S. Geological Survey Yellow River (10/1/2001-9/30/2010) River Flow (cfs) Oct-01 Oct-03 Oct-05 Oct-07 Oct-09 Date Figure 11. Yellow River discharge measured at the SR87 bridge near Milton, FL for the period October 2001 to September Missing data: 2/2/05-6/4/05, 10/20/09-11/8/09. Source: U.S. Geological Survey

24 3.4 Water Quality Classifications Surface waters within the East Bay/Blackwater Bay are classified by the State of Florida (Department of Environmental Protection) as either Class II or III. These classifications are based on use, not by the actual quality of the water. Class II waters are designated as Shellfish Propagation or Harvest areas. These areas have water quality standards focusing on particular components that affect the quality of the shellfish harvested to protect consumers from possible diseases associated with their consumption. Shellfish harvesting areas within East Bay/Blackwater Bay are shown in Figure 12. This recently adopted classification combined the two seasonal scenarios that had previously been in effect. Figure 12. Shellfish harvesting area classifications in the Pensacola Bay system (DACS 2009). Currently, commercial harvesting is prohibited from all areas of Blackwater Bay and the mouth of the East Bay River. The majority of East Bay is conditionally approved during both seasons with a relatively small portion of the northwestern section of East Bay, between Escribano and White Points conditionally restricted during winter months of November to February. Conditionally approved East Bay waters are open for harvest during the winter months (November to February) unless the Escambia River stage, measured at Century, Florida, exceeds feet or the cumulative seven-day rainfall, measured at Philpot Forestry Tower, exceeds 2.43 inches. Conditionally approved East 15
25 Bay waters are harvestable during the spring/fall months (March to October) unless the Escambia River stage, measured at Century, exceeds feet or the cumulative fiveday rainfall, measured at the Molino Forestry Tower exceeds 3.45 inches. A small portion of East Bay waters is conditionally restricted during the winter months when cumulative seven-day rainfall, measured at the Philpot Forestry Tower, exceeds 5.01 inches. In all cases waters are temporary closed when the above conditions occur and are reopened when bacteriological levels meet the standards described in Rule 5L and fecal coliform levels in shellfish return to normal background levels. All surface waters in East Bay/Blackwater Bay not specifically listed as Class II are designated as Class III. Class III waters are designated to provide Recreation and Propagation of Healthy, Well-balanced Populations of Fish and Wildlife. Standards for these waters are not as stringent for most parameters as for the above discussed classes and are directed to maintaining biodiversity and water quality sufficient for human contact such as swimming (hence the name Fishable/Swimable waters). Class III waters are confined to the area of Blackwater Bay north of Interstate 10 and the various rivers and tributaries entering the system. 3.5 Water Quality Characteristics Considerable water quality data have been collected in the Pensacola Bay System over the last 40 years; yet, most has been restricted to Escambia and Pensacola Bays and their associated bayous. The existing water quality data set for the East Bay/Blackwater Bay is relatively sparse and generally restricted to short-term collections associated with larger sampling efforts focused on other portions of the system. No comprehensive, long-term, water quality monitoring program is being carried out currently in either East or Blackwater Bay. Similarly, water quality information has been collected at numerous riverine sites within the drainage basin yet long-term data are available for only a handful of locations. As part of the Florida Department of Environmental Protection s (DEP) watershed management approach for protecting water resources and addressing Total Maximum Daily Load (TMDL) requirements, a water quality assessment was developed for the Pensacola Bay system (DEP 2007). Recent water quality data were obtained from the Storage and Retrieval (STORET) databases, new data collected as necessary, and all information was assessed according to methodologies prescribed in the 1972 federal Clean Water Act and the 1999 Florida Watershed Restoration Act. From this assessment a verified list of waterbodies not meeting state water quality standards was generated; TMDLs are to be drafted for these waterbodies. Several portions of East and Blackwater bays were placed on the verified list as not meeting water quality standards (DEP 2007). Two waterbody segments in Blackwater Bay were listed for excessive mercury in fish tissue while East Bay and one segment off Redfish Point (along the southern shoreline) were included for high historical chlorophyll (indicative of high nutrient concentrations), high total coliform bacteria, and high mercury in fish tissue. Upstream of the estuarine portions of the system, seven segments 16
26 in the Blackwater River, six segments in the Yellow River and two segments of the Shoal River were included on the verified impaired list. Impaired riverine segments had either high bacterial counts or high concentrations of mercury in fish Estuarine Areas Among the estuarine locations are two sites presently being monitored by the Department of Environmental Protection: one in the upper reach of Blackwater Bay (Site ) and the other in Redfish Cove (Site 33030D71) along the southern shoreline of East Bay (Figure 13). Both sites have been sampled for at least ten years on a weekly basis; but, while they span the spatial extent of the system, they should not be considered as representative of the bay complex overall. Data from these two sites were obtained from Florida STORET and are summarized here for the time period (Table 1). For comparative purposes and to allow greater spatial coverage, summary water quality data were taken from the comprehensive Escambia Bay Recovery Study (Olinger et al. 1975) done in Sampling stations covered a broad spatial scale (Figure 13), but were collected over a limited time period; summary data are provided in Table 2. Some conditions are likely to have improved since these mid-1970 s collections, yet others have undoubtedly deteriorated (as indicated in Collard 1991a); little information exists to verify potential trends baywide. Salinity in East Bay/Blackwater Bay varied spatially and temporally during the most recent sampling period ( ) (Florida STORET 2009), ranging from 0 (less than about 40 S/cm specific conductance) to 34.6 ppt (Table 1). [Note: specific conductance, rather than salinity, was measured at the Blackwater Bay site; values were converted to salinity for comparison according to Tiphane and St.-Pierre (1962)]. Salinity at the upper Blackwater Bay site was very low (mean salinity = 1.1 ppt) with values frequently below 1 ppt; rarely did salinity exceed 10 ppt. This site is located in the transition zone between the lower reach of the Blackwater River and upper reach of the bay, and as such, is usually fresh. Because salinities are usually so low, concentrations of dissolved ions were actually measured as specific conductance rather than salinity. Salinities underwent noticeable seasonal fluctuations with highest values generally in the late summer-fall coincident with low river flows. Salinities at the lower East Bay site were consistently higher (mean salinity = 19.2 ppt) than those measured in Blackwater Bay. Little seasonality was observed; however, dramatic swings in salinity values were noted over relatively short time intervals (i.e., 1-2 weeks) during the ten years of observations (Figure 14). On several occasions, surface salinities varied by as much as ppt between weekly measurements. Salinity at the lower East Bay site generally increased during and coincident with drought conditions in the southeastern United States (Figure 14); these higher values were not as pronounced in Blackwater Bay. 17

27 Figure 13. Location of water quality stations in Blackwater and East Bays. Stations shown with black closed circles were sampled during the Olinger et al. (1975) study; those shown in red are currently being sampled by DEP. 18
28 Table 1. Summary of water quality characteristics for long-term East Bay/Blackwater Bay collection sites ( ). Samples were taken from surface depths (<0.25m). Data source: Florida STORET (2009). Site Salinity Temp DO TSS Turbidity Color Nitrate+ Ammonia TKN Total Total Chlorophyll (ppt) ( o C) (mg/l) (mg/l) (NTU) (PCU) Nitrite (mg/l) (mg/l) Nitrogen Phosphorus ( g/l) (mg/l) (mg/l) (mg/l) Blackwater Bay (Site ) Mean Minimum Maximum East Bay (Site 33030D71) Mean Minimum Maximum Characteristics: Temp = Temperature DO = Dissolved Oxygen TSS = Total Suspended Solids TKN = Total Kjeldahl Nitrogen 19
29 Table 2. Summary of water quality characteristics for East Bay/Blackwater Bay sites ( ). Table entries are mean values for surface/bottom samples; only surface chlorophyll was collected. Data source: Olinger et al. (1975). Stations Salinity Temperature Dissolved Turbidity Nitrate+ Ammonia Total Total Chlorophyll (ppt) ( o C) Oxygen (NTU) Nitrite (mg/l) Nitrogen Phosphorus ( g/l) (mg/l) (mg/l) (mg/l) (mg/l) Blackwater Bay Stations BFEI 0.9/ / / / / / / / BJIV 1.9/ / / / / / / / BNGA 3.0/ / / / / / / / BREA 5.9/ / / / / / / / East Bay Stations ADGV 8.1/ / / / / / / / AJFD 12.5/ / / / / / / / ALEX 13.8/ / / / / / / / AGJI 13.1/ / / / / / / / AGPH 13.3/ / / / / / / / P / / / / / / /
30 Salinity in the Blackwater Bay/East Bay System 40 East Bay Blackwater Bay 30 Salinity (ppt) /1/99 1/1/00 1/1/01 1/1/02 1/1/03 1/1/04 1/1/05 1/1/06 1/1/07 1/1/08 1/1/09 Date Figure 14. Comparison of salinity between stations in Blackwater Bay (Site ) and East Bay (Site 33030D71). Salinity at the Blackwater Bay site was converted from specific conductance measurements. Data source: Florida STORET (2009). Mean salinity generally increased with distance from the upper reach of Blackwater Bay to lower East Bay; this was most pronounced during the early sampling program (Olinger et al. 1975; Table 2). Mean surface salinity during the period increased from 0.9 to 13.8 ppt while bottom salinity increased from 8.3 to 28.3 ppt between stations BFEI in Blackwater Bay and P15 in East Bay (Olinger et al. 1975). Significant vertical stratification was noted at all sites (Table 2). Temperature varied seasonally (Figure 15, upper panel), ranging over the recent 4-year period from 4.4 to 33.6 o C (Florida STORET 2009). Winter lows tended to vary more than summer highs. Temperature differed between locations with the Blackwater Bay site moderated seasonally by water from the Blackwater River (i.e., cooler conditions in summer and warmer in winter). This temperature moderation was also observed in the Olinger et al. (1975) data set, with surface and bottom values at the upper Blackwater site (BFEI) averaging at least 3.0 o C greater than those at other Blackwater locations (Table 2). Temperature stratification, although small, appeared greater in Blackwater than in East Bay. 21
31 Water Temperature in the Blackwater Bay/East Bay System Temperature ( o C) East Bay Blackwater Bay 0 1/1/99 1/1/00 1/1/01 1/1/02 1/1/03 1/1/04 1/1/05 1/1/06 1/1/07 1/1/08 1/1/09 Date Dissolved Oxygen in the Blackwater Bay/East Bay System East Bay Blackwater Bay Dissolved Oxygen (mg/l) /1/99 1/1/00 1/1/01 1/1/02 1/1/03 1/1/04 1/1/05 1/1/06 1/1/07 1/1/08 1/1/09 Date Figure 15. Comparison of water temperature (upper panel) and dissolved oxygen (lower panel) between stations in Blackwater Bay (Station ) and East Bay (Station 33030D71). Data source: Florida STORET (2009). 22
32 Water clarity was generally high throughout the bay complex. Surface turbidity values were low with mean values ranging from 3.5 NTUs in upper Blackwater Bay to 4.2 NTUs in lower East Bay (Florida STORET 2009; Table 1). These values were similar or slightly lower than those observed by Olinger et al. (1975) where mean surface turbidity ranged from 7.0 NTUs at BNGA (mid-blackwater Bay) to 2.1 NTUs at ALEX (lower East Bay) (Table 2). Bottom values were generally higher than surface. Color was higher in Blackwater Bay (Table 1) reflecting the influence of the Blackwater River. Dissolved oxygen (DO) was relatively high with surface values averaging greater than 6.5 mg/l at both current DEP water quality collection sites (Figure 15, lower panel). DO varied seasonally with high values in winter and lows in summer, inversely related to water temperature (compare upper and lower panels, Figure 15). Greater DO variability was observed in East Bay with values often higher in winter and lower in summer relative to Blackwater Bay. This is likely related to the moderated temperatures in Blackwater relative to East Bay. DO at both locations occasionally dropped below 4 mg/l with more frequent occurrences in lower East Bay than Blackwater (Figure 15, lower panel). Data collected during the Olinger et al. (1975) study indicated similar high surface DO values (Table 2), averaging between 7.5 and 8.1 mg/l at all but one site. Bottom concentrations were lower than surface with two locations averaging below 4 mg/l. Mean DO at the upper Blackwater Bay site (BFEI) was noticeably lower than other locations with 5.9 and 2.2 mg/l observed at the surface and bottom, respectively (Table 2). Nutrient concentrations were generally low (<1 mg/l TN and <0.03 mg/l TP) throughout the East Bay/Blackwater Bay system, with nitrogen slightly higher in Blackwater Bay and phosphorus higher in East Bay (Tables 1 and 2). Current sampling indicated nitrate+nitrite, ammonia and total nitrogen concentrations were one and one-half to six times greater at the Blackwater Bay site (upper bay) than along the southern East Bay shoreline (Table 1); total Kjeldahl nitrogen was similar at the two sites. A similar spatial trend was observed in the Olinger et al. (1975) data with concentrations declining with distance from the river mouths (Table 2). Some degree of seasonality was noted in the current nitrogen data in Blackwater Bay (Figure 16) with higher values appearing in winter; limited data from East Bay precluded any seasonal assessment. Current nitrate+nitrite levels were noticeably lower than those observed historically. Mean nitrate+nitrite in Blackwater Bay is one-third the mean noted by Olinger et al. (1975) while the East Bay mean is one-sixth that observed historically. Mean total phosphorus in East Bay is currently twice the value in Blackwater (Table 1) and is nearly double that observed historically (Olinger et al. 1975). Chlorophyll values were low throughout both collection periods (Tables 1 and 2), probably reflecting the relatively low water column nutrient levels. Chlorophyll concentrations appeared relatively uniform among stations, averaging 3.6 g/l at current monitoring sites (Florida STORET 2009). An occasional high value was noted (up to 38.5 and 13.7 g/l at Blackwater and East Bay sites, respectively). Numerous samples were at or below detection limits at both current locations. No trends were apparent either spatially or seasonally. 23
33 1.8 Nitrogen Concentrations collected at Blackwater Bay Site Nitrogen concentration (mg/l) NO3+NO2 NH3 TKN TN 0.0 1/1/99 1/1/00 1/1/01 1/1/02 1/1/03 1/1/04 1/1/05 1/1/06 1/1/07 1/1/08 1/1/09 Date 0.7 Nitrogen Concentrations collected at East Bay Site Nitrogen concentration (mg/l) /1/99 1/1/00 1/1/01 1/1/02 1/1/03 1/1/04 1/1/05 1/1/06 1/1/07 1/1/08 1/1/09 24 Date Figure 16. Comparison of nitrate+nitrite (NO 3 +NO 2 ), ammonia (NH 3 ), total Kjeldahl nitrogen (TKN), and total nitrogen (TN) at sites in Blackwater (upper panel) and East (lower panel) Bays. Limited collections have been made at this site over the last seven years. Data source: Florida STORET (2009).

34 3.5.2 Riverine Areas To examine the influence of freshwater inflows to the estuary, water quality characteristics were obtained from the Florida STORET database for a series of 22 sites throughout the Yellow River and lower portion of the Shoal River just upstream of its confluence with the Yellow (Figure 17). Collections were taken by disparate agencies and organizations (e.g., DEP, FFWCC) with varying characteristics examined, sampling procedures and analytical methods. Six of these sites have had multiple collections spanning months to years while the remainder represent single sampling events. Data from all sites are combined and summarized here (Table 3) only to provide an overview of environmental characteristics in various reaches of the system. Long-term data will be plotted separately to examine temporal trends. Figure 17. Water quality collection sites on the Yellow and Shoal rivers. These sites are grouped by river reach and the data are summarized in Table 3. Data source: Florida STORET (2009). 25
35 Table 3. Summary of selected water quality characteristics collected at sites in the Yellow/Shoal River system. Stations are arranged by location from upstream to downstream (see Figure 17). Table entries are values from surface (<0.5 m) samples over the period of collection. Means are presented where multiple samples were collected (*); otherwise entries represent single sampling events. ** = < detection limits. Data source: Florida STORET (2009). Station Specific Temp DO NH 3 NO 3 +NO 2 TKN TN PO 4 TP Chl-a Conductance ( o C) (mg/l) (mg/l) (mg/l) (mg/l) (mg/l) (mg/l) (mg/l) ( g/l) ( S/cm) YELLOW RIVER UPPER REACH Yellow SR2 (3546)* < * ** SHOAL RIVER SR-11* < Shoal SR85 ( )* ** ** YELLOW RIVER MIDDLE REACH ** ** YR-14* < <0.36 <0.48 < ** ** ** 0.04 ** ** ** ** 26
36 Table 3. Continued. Station Specific Temp DO NH 3 NO 3 +NO 2 TKN TN PO 4 TP Chl-a Conductance ( o C) (mg/l) (mg/l) (mg/l) (mg/l) (mg/l) (mg/l) (mg/l) ( g/l) ( S/cm) YELLOW RIVER LOWER REACH Yellow SR87 (3551)* < * < YR-01 (marsh)* < <0.32 <0.44 < Characteristics examined: Temp = temperature NO 3 +NO 2 = nitrate + nitrite PO 4 = ortho-phosphate DO = dissolved oxygen TKN = total Kjeldahl nitrogen TP = total phosphorus NH 3 = ammonia TN = total nitrogen Chl-a = chlorophyll-a 27
37 Overall, freshwater entering the Blackwater/East Bay system from the Yellow River is of relatively high quality (Table 3). Water quality characteristics varied spatially and temporally throughout the collection sites with downstream waters generally showing a mix of those coming from upstream locations. Specific conductance was generally low throughout the system with mean values in the upper reach of the Yellow River (mean = 74.6 S/cm at Station 3546 at the SR2 bridge) about three times those found in the Shoal River (mean = 25.6 S/cm at Station SR-11). Downstream waters indicated a combination of upstream flows (mean = 35.3 S/cm at Station 3551 at the SR87 bridge). Long-term data suggested a seasonal trend in values in the upper reach (Station 3546) with higher values during summer/fall months; no seasonal trend is evident in the lower reach (Station 3551) (Figure 18). On only one occasion (October 17, 2006) was specific conductance elevated (1654 S/cm); this high value was not associated with any of the tropical storms and their related surges. Little difference was observed between surface and bottom values, even in the lower portions of the river; no stratification was noted in the long-term data set collected at the SR87 bridge (Figure 19) except during the single elevated event mentioned above (1654 S/cm surface, S/cm bottom). 160 Specific Conductance in the Yellow SR87 and SR2 SR87=1654 Scm -1 Specific Conductance ( Scm -1 ) /1/00 1/1/01 1/1/02 1/1/03 1/1/04 1/1/05 1/1/06 1/1/07 1/1/08 Date SR87 (Site 3551) SR2 (Site 3546) Figure 18. Comparison of long-term surface specific conductance at two sites in the Yellow River. See Figure 17 for site locations. Data source: Florida STORET (2009). 28
38 100 Specific Conductance in the Yellow SR87 Specific Conductance ( Scm -1 ) Surface Bottom S=1654 Scm -1 B=23555 Scm /1/00 1/1/01 1/1/02 1/1/03 1/1/04 1/1/05 1/1/06 1/1/07 1/1/08 Date Figure 19. Comparison of long-term specific conductance from surface and bottom samples taken in the lower Yellow River (Site 3551 at the SR87 bridge). See Figure 17 for site location. Data source: Florida STORET (2009). Dissolved oxygen was fairly high (> 6 mg/l) throughout the river (Table 3); however, several sites had values between 4-5 mg/l (from single sampling events usually). Longterm means from the upper (Station 3546) and lower (Station 3551) reaches indicated high DO concentrations, 8.8 mg/l and 7.6 mg/l, respectively (Table 3). Long-term river concentrations displayed similar seasonal patterns (Figure 17) to those noted in the bay with higher values observed during colder winter months. DO was consistently higher at upper reach Station 3546 than at lower Station Concentrations were observed below 4 mg/l on only one occasion (Station 3551 in September 2004) over the ten-year collection period (Figure 20). 29
39 14 Dissolved Oxygen in the Yellow SR87 and SR2 12 Dissolved Oxygen (mgl -1 ) SR87 (Site 3551) SR2 (Site 3546) 0 1/1/00 1/1/01 1/1/02 1/1/03 1/1/04 1/1/05 1/1/06 1/1/07 1/1/08 Date Figure 20. Comparison of long-term dissolved oxygen at two sites in the Yellow River. See Figure 17 for site locations. Data source: Florida STORET (2009). Nitrogen concentrations throughout the river system were relatively low with values generally less than 0.04 mg/l ammonia, 0.15 mg/l nitrate+nitrite, 0.40 mg/l TKN, and 0.60 mg/l TN (Table 3). Phosphorus was somewhat elevated in the upper reach of the Yellow River (0.033 mg/l at Station 3546) yet values were less than in the lower reach; TP was usually below 0.04 mg/l throughout the system. Seasonality was not apparent in the long-term data from either the upper and lower reach (Figures 21 and 22). With relatively low nutrient concentrations it was not surprising to find low chlorophyll at all sites (Table 3); numerous samples had concentrations below detection limits. 30
40 Nitrogen concentrations (mgl -1 ) Nitrogen Concentrations in the Yellow SR2 NO2+NO3 NH3 TKN TN Nitrogen concentration (mgl -1 ) 0 1/1/00 1/1/01 1/1/02 1/1/03 1/1/04 1/1/05 1/1/06 1/1/07 1/1/ Nitrogen Concentrations in the Yellow SR87 NO2+NO3 NH3 TKN TN Date Figure 21. Long-term nutrient concentrations at Station 3546 (at the SR2 bridge) in the upper reach of the Yellow River. See Figure 17 for site locations. Data source: Florida STORET (2009). 0 1/1/00 1/1/01 1/1/02 1/1/03 1/1/04 1/1/05 1/1/06 1/1/07 1/1/08 Date Figure 22. Long-term nutrient concentrations at Station 3551 (at the SR87 bridge) in the lower reach of the Yellow River. See Figure 17 for site locations. Data source: Florida STORET (2009). 31
41 3.6 Sediment Characteristics Three extensive studies have been carried out examining the nature of the sediments in the Pensacola Bay system (Horvath 1968; Olinger et al. 1975; George 1988). Of these, Horvath (1968) and George (1988) investigated the physical makeup of the sediments, while Olinger et al. (1975) took a comprehensive view of sediment contamination. These studies, along with others, have been summarized by Collard (1991a), Jones et al. (1992), and DeBusk et al. (2002) Physical Properties Bay wide, the range of grain sizes and the average grain size has been reported to have decreased over the twenty years between the two major sedimentological studies (Collard 1991a; Jones et al. 1992); average grain size appears to have decreased from 4.13 (Horvath 1968) to 6.39 (George 1988) [Note: Phi units increase as particle sizes decrease]. Additionally, Horvath (1968) observed the average sand-silt-clay percentages for East Bay sediments were , respectively; George (1988) noted percentages of , respectively. In comparing results from these two studies, both Collard (1991a) and Jones et al. (1992) appear to have overlooked the confounding nature of different station locations (see Figure 8 in Jones et al. 1992). Horvath s samples contained numerous inshore locations (samples collected in depths less than 6 feet) representative of the nearshore sandy shelf; these shallow stations appear to be underrepresented in George s collections. In addition, Horvath sampled throughout Santa Rosa Sound, a large sandy lagoon not sampled by George. Thus, it is not surprising that George reported smaller particle size and differences in composition relative to the earlier study. Lack of inshore samples, however, only partially explains differences noted between the two studies (Horvath 1968; George 1988). Examining sediment distribution maps (as depicted in Figures 14 and 15 in Jones et al. 1992), it is clear that some areas of the Pensacola Bay system have indeed undergone changes. Blackwater Bay appears to have shifted from a sandy to a relatively silty-clay environment. At the same time, the siltyclay area of central East Bay has noticeably expanded. Thus, while the observation of decreasing particle size may be correct, it may not be as extreme as noted by Collard (1991a) and Jones et al. (1992). In general for East Bay/Blackwater Bay, grain size is related to depth with fine to medium grain quartz sands noted along the shallow shelf grading to fine silty clays and clayey silts in the deeper areas (see sediment maps; Figures 9-15 in Jones et al. 1992). These changes are likely due to increased erosion resulting from land use practices in the basin coupled with the poor circulation pattern inherent to East Bay (as discussed by Collard 1991a) Sediment Contamination Numerous studies examined sediment contamination throughout the Pensacola Bay system, yet most have focused on Escambia and Pensacola Bays, and their associated 32
42 bayous. Limited data collection occurred from sites in East and Blackwater Bays (Olinger et al. 1975; EPA unpublished data surveys 1992, 1996 [presented in DeBusk et al. 2002]; Seal et al. 1994; Long et al. 1997). Olinger et al. (1975) is the largest and most comprehensive data set available for Pensacola Bay sediments, in general, and East Bay/Blackwater Bay specifically; unfortunately, the data set is fairly outdated. Early sediment contamination studies have been summarized in Collard (1991a) while more recent works were discussed by DeBusk et al. (2002). Two EPA studies (1992, 1996) are discussed by DeBusk et al. (2002) which contain numerous sampling sites in both Blackwater and East Bays. However, as with water quality, no current large-scale sediment survey is underway. Selected sediment data from Olinger et al. (1975) are summarized in Table 4. Where available, mean concentrations are given as reported for Total Organic Carbon (TOC), Total Phosphorus (TP), Total Organic Nitrogen (TON), and a variety of metals; mean concentrations are given for Escambia and Pensacola Bays for comparison with East and Blackwater Bays. Overall, moderate levels of organic carbon were found in East Bay sediments (no data were given for Blackwater Bay) with TOC ranging between 3-4 percent. TOC generally increased from nearshore to midbay, where the highest levels were found (Olinger et al. 1975). Long et al. (1997) noted TOC concentrations ranging from % in East Bay and % in Blackwater Bay. Moderate to high TOC concentrations coupled with limited hydrodynamic circulation in Blackwater and East Table 4. Sediment quality in the Blackwater Bay/East Bay system. Selected characteristics are presented for Blackwater, East, Escambia and Pensacola Bays for comparison. Table entries are mean values. Data source: Olinger et al. (1975). Bay Area TOC TP TON Al Cd Cr Cu Ni Pb Zn Blackwater * * * 4684 < East < Escambia < Pensacola Units = Total Organic Carbon (mg/g) Chromium (ppm) * no data Total Phosphorus (mg/g) Copper (ppm) Total Organic Nitrogen (mg/g) Nickel (ppm) Aluminum (ppm) Lead (ppm) Cadmium (ppm) Zinc (ppm) 33
43 Bays have prompted some authors (Collard 1991a; Jones et al. 1992) to caution that these two areas are more vulnerable than other parts of the system to increasing development and concurrent pollution. East Bay and Escambia Bay had comparable values of TP and TON, with concentrations in both areas less than that in Pensacola Bay (Table 4). Depth distributions of TP and TON were reported to be similar to that of TOC, with greatest values found at midbay locations (Olinger et al. 1975). Sediment metal concentrations generally increased from Blackwater Bay to Pensacola Bay (Table 4). Concentrations were similar for cadmium, chromium, nickel and lead between East and Escambia Bays; highest values for all metals examined were observed in Pensacola Bay with lowest in Blackwater Bay. It should be noted, however, that aluminum concentrations followed, or likely contributed to, the above distribution pattern. Lowest mean aluminum value was noted in Blackwater Bay (4,684 ppm) and highest in Pensacola Bay (14,565 ppm); East and Escambia Bays had comparable and intermediate levels. Aluminum has been used to standardize metal concentrations for a variety of estuarine sediment types and is generally related to grain size, with high aluminum concentrations found in fine-grain silts and clays. Significant positive relationships have been observed between aluminum and various metals (Windom et al. 1989; Schropp et al. 1990; Summers et al. 1996) with higher metals concentrations naturally occurring in sediments with higher aluminum. Based on these metal:aluminum standardizations, sediments in Blackwater and East Bays do not appear to be enriched in metals to any degree. With aluminum ranging only from 4,684 to 14,565 mg/kg (ppm), the sites reported in Olinger et al. (1975) were probably relatively sandy with low to moderate amounts of silts and/or clays. Concentrations of metals would be expected to be relatively low, and in fact, they were. Plotting metal:aluminum ratios, lead and zinc were the only metals that appeared enriched, and only slightly so. Examining metal:aluminum data from Long et al. (1997) for Blackwater and East Bays (Table 5), only zinc showed slight enrichment. While nearly all metal concentrations were higher at sites reported by Long et al. (1997) compared with Olinger et al. (1975), aluminum concentrations were likewise significantly higher as well. Sites sampled by Long et al. (1997) were primarily from fine-grained, silt-clay sediments with grain size between 6.2 and 9.4 ; only the upper Blackwater Bay station had coarser sediments (3.4 ). All recently collected sediment metals concentrations reported for Blackwater and East Bays by DeBusk et al. (2002) were considered in the low to moderate contamination range based on the Sediment Quality Assessment Guidelines (SQAGs) developed by MacDonald (1994). Synthetic organic compounds have been observed throughout the Pensacola Bay system with considerable interest focused on polychlorinated biphenyls (PCBs) since an industrial leak of Arochlor 1254 in the Escambia River in Sampling six years after the spill, Olinger et al. (1975) observed PCB concentrations remained widespread throughout the system; yet levels appeared to be significantly reduced. They estimated that PCBs were decreasing in sediments at a rate of about 90 percent per year. Olinger et 34
44 Table 5. Sediment quality in the Blackwater Bay/East Bay system. Selected characteristics are presented for three sites in Blackwater Bay and three sites in East Bay. Stations are oriented from north to south. Data source: Long et al. (1997). Bay Area C% N% Grain Size Al Cd Cr Cu Ni Pb Zn Blackwater Bay East Bay Units = Total Organic Carbon (%) Chromium (ppm) Total Organic Nitrogen (%) Copper (ppm) Grain size ( ) Nickel (ppm) Aluminum (ppm) Lead (ppm) Cadmium (ppm) Zinc (ppm) al. (1975) also reported that of 21 pesticides analyzed only DDE (a DDT derivative) was widespread in distribution. DDE was noted in both Blackwater and East Bays, but did not exceed concentrations of 1.9 ppb. All recently collected sediment PCB data and nearly all DDE (as well as DDD and DDT) concentrations reported for Blackwater and East Bays by DeBusk et al. (2002) were considered in the low contamination range based on the SQAGs developed by MacDonald (1994). No pesticide or PCB information was presented by either Seal et al. (1994) or Long et al. (1997) for Blackwater and East Bays. Low and high molecular weight polycyclic aromatic hydrocarbons (PAHs), as well as total PAHs, were observed throughout Blackwater and East Bays, but were considered in the low contamination range (DeBusk et al. 2002) using the above cited SQAGs (MacDonald 1994). Only slight PAH enrichment was noted by Seal et al. (1994) and Long et al. (1997) at some sites. Based on their review of recent metals and synthetic organics data throughout the Pensacola Bay system, DeBusk et al. (2002) highlighted the bayous, upper- and mid- Escambia Bay, and portions of Pensacola Bay near the downtown waterfront as the areas of greatest contamination concern. While observing detectible quantities of most contaminants reviewed, concentrations in Blackwater and East Bays were low and generally considered to be of only low toxicity. 35
, soft and hard bottom.")
45 4.0 HABITATS ASSOCIATED WITH THE EAST BAY COMPLEX The East Bay/Blackwater Bay watershed supports a variety of biotic communities and maintains a high level of biodiversity. Those habitats directly associated with surface waters of East Bay include: palustrine forests, fresh/brackish wetlands, tidal salt marshes, submerged aquatic vegetation (SAV), soft and hard bottom. Approximately 175,120 acres of wetland habitats are found in the watersheds draining into the East Bay/Blackwater Bay system (Figure 23; NWI 2008) with nearly half found in the Yellow River basin. This acreage estimate combines only the wetland forests, marshes (all kinds) and SAV beds; soft and hard bottom are not included. Figure 23. Wetlands in the East Bay watersheds. Mapped wetlands include all National Wetland Inventory (NWI) palustrine and estuarine categories combined for the Florida portions of the three East Bay/Blackwater Bay drainage basins. Data source: NWI
46 4.1 Palustrine Forests Few investigations have focused on the wetland forests of the lower portion of the Yellow River and Blackwater River basins, although studies are planned for parts of the Yellow River Aquatic Preserve (S. Alexander, DEP, personal comm.). Based on forest community studies in the Apalachicola, Ochlockonee, Wakulla/St. Marks and other panhandle systems (Clewell 1986; Leitman et al. 1984, 1991, 1993; Darst and Light 2008), riverine forests in this area are likely composed of at least three major vegetation types: bottomland hardwoods, cypress swamps and coastal tidal swamps. The distribution of these forests types are heavily influenced by elevation, the degree and type of inundation, and proximity to the coast (i.e., salt water). Bottomland hardwood forests occupy wet-mesic to nearly hydric habitats that are usually associated with stream and river floodplains (Clewell 1986). Habitats in these forests are generally inundated, sometimes briefly but sometimes for prolonged periods annually. During the dry season, the root zone is usually well aerated. In areas where flooding is more pronounced, cypress-tupelo swamps dominate. These swamps are characterized by prolonged hydroperiods in which the soils are inundated at least several weeks every year and often for as long as six months (Clewell 1986). Coastal swamps occur along river floodplains within the zone of tidal influence and along the inland margins of tidal marshes (Clewell 1986). While freshwater conditions generally prevail, coastal swamps are subject to tidal fluctuations and can tolerate some salt water inundation. Proximity to the coast results in rapid dissipation of flood waters precluding lengthy or prolonged inundation during seasonal flooding. Generally uniform hydrological conditions and occasional salinity shock likely limit the species present. Much of the lower Yellow River floodplain appears composed of mixed bottomland hardwood forests; these forests are quite variable yet diverse in floral composition. Leitman et al. (1984) and Darst and Light (2008) described several variants of this mixed bottomland hardwood forest from the Apalachicola River basin that are likely to be found in the Yellow River. These include both high and low bottomland hardwood habitats and tupelo-cypress swamps; these forest types are influenced primarily by surface elevation and degree of inundation. River swamps are found on the wettest sites with the greatest duration and frequency of inundation. Sites are typically continuously flooded from 4 to 9 months each year (Darst and Light 2008). These swamps are dominated by water tupelo (Nyssa aquatica), swamp tupelo (N. biflora), Ogeechee tupelo (N. ogeche), bald cypress (Taxodium distichum), pop ash (Fraxinus caroliniana) and planer tree (Planera aquatica). Variation within swamp types was observed with varying relative abundance of the above dominant trees. Chief associates in these swamps include red maple (Acer rubrum), overcup oak (Quercus lyrata), pumpkin ash (F. profunda), and sweetbay (Magnolia virginiana). Low bottomland hardwood forests occupy somewhat drier portions of the floodplain with less inundation; continuous flooding usually lasts 2 to 4 months per year (Darst and Light 2008). These forests are dominated by water hickory (Carya aquatica), green ash (F. pennsylvanica), overcup and swamp laurel (Q. lauriflora) oaks, sweetgum (Liquidambar styraciflua) and American elm (Ulmus americana). Hackberry (Celtis laevigata) and red maples are often found as associates. High bottomland hardwoods are located at higher elevation, drier sites than either the river swamps or the low bottomland hardwoods. These areas are commonly inundated for 2 to 6 weeks each year (Darst and Light 2008). 37
47 Sweetgum, hackberry, ironwood (Carpinus caroliniana), water oak (Q. nigra) and possum haw (Ilex decidua) predominate with swamp laurel oak and green ash found as chief associates. Similar forest composition was observed in the floodplain of the Ochlockonee River (Leitman et al. 1991, 1993); forest type in the various topographic zones was strongly influenced by hydrologic conditions. Lowest areas of the floodplain were dominated by Ogeechee tupelo and bald cypress with lesser amounts of planer tree and pop ash. Low terraces were dominated by swamp laurel oak and red maple; sweetgum and Ogeechee tupelo were also found in relatively high abundance. Higher elevation sites (termed high terraces) were occupied by sweetgum, spruce pine (Pinus glabra), live (Q. virginiana) and water oaks; swamp laurel oak, American holly (Ilex opaca) and swamp tupelo were relatively common as well. Coastal swamps have been described by Light et al. (2002) for the lower Suwannee River. Canopy composition in these lower tidal swamps was dominated by pumpkin ash, bald cypress, swamp tupelo, with pumpkin ash, swamp tupelo, sweet bay, cabbage palm (Sabal palmetto) and loblolly pine (Pinus taeda) dominating in the lower tidal mixed bottomland and hammocks. Cabbage palms were found in all tidal communities as both canopy and subcanopy trees. Lower tidal hammocks, as described by Light et al. (2002), vary in elevation and in distance from the Gulf, thus in exposure to river flooding, tidal surge, and salinity. Hammocks closest to the Gulf tended to have the largest proportion of cabbage palms. Clewell (1986) described most of the forest along the Blackwater River as a cedar swamp dominated by Atlantic white cedar (Chamaecyparis thyoides) in the overstory on the levees with American holly in the understory. Other common trees noted included water and live oaks, southern magnolia (Magnolia grandiflora), swamp bay (Persea palustris), loblolly pine and titi (Cyrilla racemiflora). Clewell s description is brief and is not accompanied by additional site information; the spatial extent is unknown and it is unclear if this account pertains to the lower reach of the river. Based on the limited information available to date, detailed forest composition and distribution in the lower reaches of these systems are uncertain and will await further survey and monitoring to determine specific community types and abundances. Preliminary investigations have confirmed the dominance of bald cypress, Atlantic white cedar, swamp laurel and overcup oaks, swamp and silver bays, red maple, black gum and slash pine (Pinus elliottii) in the lower Yellow River floodplain, and as such are similar to other panhandle river floodplain forests. The bulk of the wetlands found within the watershed are palustrine forests (including palustrine forested and scrub-shrub categories); these are found primarily in the river floodplain corridors. Of the 154,757 acres of wetland forests in the three basins, most is located in the Yellow River basin (49.4%) followed by the Blackwater (32.6%) and East Bay (18.0%) rivers. The majority of the palustrine forest in the Yellow River lies downstream of its confluence with the Shoal River and is associated with the widening expanse of river floodplain. 38
48 4.2 Fresh/Brackish Wetlands The fresh and brackish wetlands include both emergent and submergent plant forms and result in a floral continuum from the headwaters to the estuary. A riparian marsh habitat is found in the freshwater portion of the system with the brackish marsh extending downstream through the oligohaline region of the estuary where salinities range from 0 to 15 ppt. Marsh species composition is likely influenced by a combination of salinity tolerance and differences in soil type, elevations and competitive interactions. This habitat is primarily limited to the oligohaline region of the estuary where salinities range from 0 to 15 ppt and is generally located along river mouths subject to tidal influence. Often the emergent portions of these fresh/brackish marshes are dominated by sawgrass (Cladium jamaicense), maidencane (Panicum hemitomon), giant cutgrass (Zizaniopsis miliacea) and cattails (Typha spp.), but may contain large interspersed patches of black needlerush (Juncus roemerianus). In the underwater areas, various species of submerged aquatic vegetation (see below) often proliferate. The presence of true fresh/brackish wetlands in the East Bay/Blackwater Bay area appears limited to the sizeable delta region at the mouth of the Yellow River, the mouths of the Blackwater and East Bay Rivers and the tributary bayous which have freshwater inflows. Additionally, large emergent wetlands are found at the southern end of Garcon Point. The most recent NWI data (2008) indicate 2,527 acres of estuarine emergent vegetation in the East Bay/Blackwater Bay area (Figure 24), with the largest tracts located in the delta of the Yellow River and the lower portion of Garcon Point. However, this NWI coverage does not appear to accurately differentiate the acreages of fresh/brackish wetlands from tidal salt marsh. The majority of the delta marsh is classified as estuarine emergent (generally interpreted as salt marsh); yet personal observations indicate the presence of numerous fresh/brackish species. Palustrine emergent vegetation is not mapped in the delta (except in the most upstream portion) but is widely scattered throughout the basins (6,794 acres). Nearly 45% of the mapped palustrine emergent habitat is found in three large wetland areas (Figure 24), two of which are on Garcon Point and not associated with the river mouths. Based on a composite of these NWI data, the Yellow River delta marsh is estimated at about 1,500 acres and is composed of a mix of fresh, brackish and salt marsh species. One older source (DNR 1989) estimated that the Yellow River delta marsh covered about 2,400 acres but did not indicate how much of this included portions of the forested wetlands. 39
 palustrine and estuarine categories found in the vicinity of East and Blackwater bays. Data source: NWI 2008. 4.")
49 Figure 24. Wetland habitats in the vicinity of East Bay. Mapped wetlands include the National Wetland Inventory (NWI) palustrine and estuarine categories found in the vicinity of East and Blackwater bays. Data source: NWI Tidal Salt Marshes Salt marshes are similar to brackish marshes in that they serve as a transition between terrestrial and marine systems. Generally, salt marshes are intertidal and develop along relatively low energy shorelines. Unlike brackish marshes, they may be found under significantly more saline conditions. Salt marshes in the panhandle are usually characterized by large, fairly homogeneous expanses of dense black needlerush (Juncus roemerianus). Often they are accompanied on the waterward side by smooth cordgrass (Spartina alterniflora). The Juncus and Spartina zones are very distinctive and can be separated easily by elevation, with Spartina 40
50 inhabiting the lower, regularly flooded zone, and Juncus found in higher, less flooded area. Frequently, additional species of cordgrass (Spartina spp.), salt grass (Distichlis spicata), glasswort (Salicornia virginica), various sedges (Scirpus spp.) and the common cane (Phragmites australis) occur. Generally, tidal marshes can be divided into four ecological zones governing by elevation and extent of inundation: Spartina alterniflora zone, Juncus marsh, salt flats, and barrens (Wolfe et al. 1988). The Spartina alterniflora zone typically fringes tidal creeks and channels. A small landward increase in elevation permits development of lush Juncus stands that are by far the most extensive and conspicuous feature of the tidal marsh. Juncus plants may grow to 6-7 feet in height throughout the majority of the marsh declining to about one-half this height at the landward edge of the marsh near the flatwoods where they merge with the salt flats. Stunted plants of several genera typify the flats, especially Salicornia, Batis, Borrichia and Aster. The barrens are landward of the flats and consist of bare ground flooded by high tides for only brief periods. This infrequent tidal inundation coupled with long exposure to sunlight results in such high salt content of the soil that most plants are excluded. True salt marshes appear limited to the higher salinity regions of the East Bay/Blackwater Bay complex with an expansive area noted on Garcon Point. Early estimates of tidal marsh habitat in the East Bay area (McNulty et al. 1972) indicated about 3,307 acres occurred; these were shown in Figures 23 and 24 of the above cited report. More recent information, available from the National Wetlands Inventory (NWI), indicated about 2,500 acres of emergent estuarine marsh habitat adjacent to the two bays (Figure 24). No distinctions were made in either study between fresh/brackish and tidal salt marsh; NWI coverage combines the habitats and classifies them as either palustrine or estuarine (generally interpreted as salt marsh) emergent. It is unclear if the difference in these two estimates depicts real habitat loss or differences in mapping methodologies between the two sources. The largest contiguous tidal salt marsh area (1,544 acres) is located along the southern shore of Garcon Point, north and southwest of White Point (Figure 24). Smaller areas are scattered throughout many of the higher salinity, tributary bayous as well as mixed with fresh and brackish species in the river deltas. 4.4 Seagrass/Submerged Aquatic Vegetation Seagrasses represent one of the most important and productive habitats in estuarine and nearshore environments. Seagrass beds support highly diverse and abundant floral and faunal communities and provide spawning, feeding, nursery and protective refugia for a wide array of aquatic organisms including many of recreational and commercial value. Seagrass beds in the Pensacola Bay system are dominated by turtle grass (Thalassia testudinum) and shoal grass (Halodule wrightii). Other species include manatee grass (Syringodium filiforme, referred to as Cymodocea in Collard 1991a), star grass (Halophila engelmannii) and widgeon grass (Ruppia maritima, not referred to as a true seagrass by Collard 1991a). The majority of seagrass found in the Pensacola system is located in Santa Rosa Sound with only small beds scattered in parts of Pensacola, Escambia, East and Blackwater bays. 41
51 Vertical zonation of seagrasses generally correlates with tidal level in most shallow estuarine waters (Zieman 1987). Halodule wrightii and Ruppia maritima are abundant intertidally, with Ruppia preferring a somewhat lower level than Halodule; Thalassia, Syringodium and Halophila are found only below low water levels. Low or unusually high salinity may restrict or eliminate Thalassia and Syringodium. Thalassia and Syringodium are usually associated with stable, nearmarine salinities (20-36 ppt), open coastal water, and subtropical to tropical temperatures. Halodule is generally found in more estuarine conditions (10-25 ppt), but also forms dense stands in open coastal, high-salinity regions, in areas of high water movement or in tidal flats where it is subject to exposure. Ruppia is most common in very brackish water (1-5 ppt), with meadows extending into the mouths of rivers (Dawes 1987). Submerged aquatic vegetation (SAV) is the fresh/brackish water equivalent to seagrasses and includes such species as tapegrass (Vallisneria americana), pondweed (Potamogeton spp.) and widgeon grass (Ruppia maritima). SAV beds provide many of the same functions as seagrass beds, only in the fresh to oligohaline portions of the estuary. Generally these species can tolerate only minor intrusion of salt for short periods of time and as such are limited to relatively narrow regions at the head of estuaries. The shallow nearshore zone of the lower Yellow River and estuary is inhabited by moderate amounts of SAV which appear relatively well established along sluggish river bends and estuarine shoreline to depths of about three feet (DNR 1989). Tapegrass and lemon bacopa (Bacopa caroliniana) were most prevalent with an understory including widgeon grass, southern naiad (Najas guadalupensis), green fanwort (Cabomba caroliniana) and bladderwort (Utricularia sp.). The exotic Eurasian watermilfoil (Myriophyllum spicatum) was identified from the bay, but was reported as sparse (DNR 1989). Distribution of vegetation was depicted in Figure 3 of the above cited report. Submerged vegetation in the East Bay/Blackwater Bay area was estimated to occupy only about 310 acres in the early 1970s (McNulty et al. 1972); these acreages were shown in Figures 23 and 24 of the above cited report. Small patches of seagrass were depicted along the southern shoreline of East Bay and a large elongated, relatively contiguous bed was noted along the northeastern shore, southeast of Escribano Point. No areas of submerged vegetation were mapped for Blackwater Bay, although they were likely present (see Figure 3 in DNR 1989). While discussed as seagrass acreage, no data were given to differentiate seagrass from SAV. Since no SAV beds were actually mapped in the vicinity of either the Blackwater or Yellow Rivers, it is unclear (but doubtful) whether they were included in the total acreage estimates. Mapping of NWI data from the mid-1990s indicated approximately 220 acres of submerged vegetation observed primarily along the shoreline in Blackwater Bay, with widest expanse along the eastern shore associated with the Yellow River delta marsh. Using the more current 2008 NWI data (Figure 24), SAV was estimated to cover about 83 acres; much of the mid-blackwater Bay SAV previously mapped (1995) does not appear in this later data set. Because of potential differences in mapping methodologies between these studies, it is unclear how much of the estimated acreage differences depict actual habitat loss. Seagrass losses throughout the Pensacola Bay system, however, are well documented (Olinger et al. 1975; Collard 1991a; Schwenning 2001) with significant declines observed throughout the East Bay area. Noticeably 42
52 absent in the 1990 s survey were the beds southeast of Escribano Point and along the southern shore of East Bay. Two additional surveys shed more light on historical trends in seagrass decline and provide the most recent assessment of seagrass/sav coverage in the system. Using historical photographic data, the U.S. Geological Survey s National Wetland Research Center (USGS/NWRC) estimated a significant decline in seagrass coverage in East Bay/Blackwater Bay from the 1960s to present (Handley et al. 2007). The authors estimated overall coverage declined from about 1,175 acres in the 1960s to 245 acres in the 1980s rising to 408 acres in the early 1990s. Continuous beds consistently declined from 110 to 30 acres between 1960 and 1980 with only 13 acres estimated by These acreages (both continuous and patchy) were confined to areas north of Escribano Point (i.e., Blackwater Bay proper) with highest density observed around the mouth of the Yellow River. In 2003 a series of aerial photos were taken throughout the panhandle by the U.S. Fish and Wildlife Service to estimate the current status of seagrass coverage. These photos were digitized and mapped by USGS/NWRC but were not included in the above cited publication. Results of this effort estimated seagrass/sav coverage at 284 acres with most cover found within Blackwater Bay (as noted previously). This value might indicate an additional decline over the last 20 years. Combining results from these various surveys, the amount of seagrass/sav in the East Bay/Blackwater Bay complex has been and is currently low (likely less than 100 acres) representing less than 0.3% of bay bottom (approximately 33,360 total acres). Despite its low frequency of occurrence, however, this habitat is one of the more important in the system and appears concentrated in areas proximal to freshwater inflow points. 4.5 Soft-bottom Habitat Unvegetated sand and mud make up the bulk of the bay bottom in the Pensacola Bay system and its subareas, including Blackwater and East Bays. These bottoms, although devoid of most structure, can be none-the-less quite productive in terms of infaunal organisms and the communities they support. These areas can serve as significant feeding habitat for a variety of fin and shellfish of recreational and commercial value. Much of the bottom in the Pensacola Bay system, however, is covered with unconsolidated, ooze-like sediments, particularly in the deeper areas; benthic macroinvertebrate surveys have provided presumptive evidence that primarily stress-tolerant near-surface infaunal species are favored throughout these regions (Collard 1991b). In his summary of biological trends and current status of the Pensacola Bay system, Collard (1991a) listed a variety of pejorative terms that had been used to describe these soft sediments including, sludge, organic muck, gelatinous ooze, reducing, contaminated, stressed, degraded, and heavily polluted. These terms were most often used subjectively and presented, in his opinion, without adequate backup technical information (Collard 1991a). None-the-less, the consensus remains that soft-bottom habitats comprise the majority of the 43
53 bottom in the system, are relatively unproductive and may be increasing in size in some portions of the system, particularly Blackwater and East Bays. 4.6 Hard-bottom Habitat Most of the hard substrate habitat in panhandle estuaries is artificial, comprised of structures such as jetties, bridges, and pier pilings. Of the naturally occurring hard substrate habitats in this area, oyster reefs are the most abundant as well as ecologically and economically important. The biology of the oyster has been extensively studied because of its economic interests (Galtsoff 1964; Kennedy et al. 1996). Oysters are typically reef building organisms, growing on the shell substrate accumulated from generations of oysters. They may occur in both intertidal and subtidal environments. The primary reef-building commercial oyster in the panhandle is the Eastern or American oyster (Crassostrea virginica). This species grows in a wide salinity range (10-30 ppt) with optimal growth occurring at water temperature of about 25 o C. Frequently reefs also contain large numbers of other bivalve mollusks such as horse oysters (Ostrea equestris) and hooked mussels (Ischadium recurvum). The location and distribution of oyster reefs depend on many interacting factors which include complex combinations of geological, physical, chemical and biological processes. Reef oysters, although tolerant of broad ranges on important habitat variables such as temperature and salinity, are susceptible to various forms of physical disturbance and adversely affect or destroy reef structures. Success of the eastern oyster depends of factors that influence spawning, planktonic larval development, metamorphosis of the spat stage, and longevity of the sexually mature adult. Commercial harvesting, predation, disease and physical processes such as sedimentation (burial) are major causes of mortality in the developing oyster reefs. Water circulation is important for larval transport, settlement, delivery of food (phytoplankton), and removal of waste. Salinity is a key factor in the incidence of predation and disease, with both increasing with increasing salinity. Oyster habitat in the Pensacola Bay system is limited in distribution with bars suffering massive mortalities during the last 40 years (Collard 1991b). Significant dieoffs (with up to 100% mortality) have been recorded at least once per decade since the 1960s (e.g., 1963, 1971, 1987); smaller-scale dieoffs occurred more frequently, but were not adequately recorded. The 1971 dieoff caused by the protozoan pathogen Perkinsus marinus, was attributed, at least in part, to environmental stress. Continued poor water and sediment quality are suggested as primary factors restricting oyster growth and reproduction in the area (Collard 1991b). Estimates of the coverage of oyster habitat in the East Bay/Blackwater Bay area appear to differ significantly over time. Early estimates indicated very limited available oyster habitat with only about 218 acres of reefs in the system (McNulty et al. 1972). Of these, 80 acres were in public bars with 138 acres in private leases. Seven locations were mapped (see Figure 23 of the cited report). At the time this report was drafted, no reef enhancements projects were underway. Reports compiled recently by the Florida Department of Agriculture and Consumer Service (Knight 2003) indicate 12 charted natural bars and eight enhancement sites within the two bays (Figure 25); no lease sites are shown on the current maps. Commercial harvesting is currently 44
54 allowed only on those reefs in East Bay (see Figure 12 for approved shellfish harvesting areas); bars located in Blackwater Bay are not approved. Enhancement (relocation of clutch, i.e., old oyster shell) of reef areas was begun in 1972 and has been carried out sporadically since, with major efforts in 1987, 1988, 1990 and 2000 (see Figure 25). Figure 25. Charted oyster resources, including natural reefs, aquaculture enhancement areas and shellfish lease sites, located in the Pensacola Bay system (DACS 2003). Numbers inside the open circles (i.e., aquaculture enhancement projects) indicate the year in which the enhancement was accomplished. 5.0 FAUNAL COMMUNITIES IN THE EAST BAY/BLACKWATER BAY SYSTEM Ecological information on invertebrate and fish communities in the East Bay/Blackwater Bay estuary appears limited to a handful of studies, with the two most comprehensive occurring nearly 25 years apart (Olinger et al. 1975; Livingston 1999). The former study (Olinger et al. 1975), known as the Escambia Bay Recovery Study, was designed to document environmental conditions in the Pensacola Bay system, determine significant mechanisms degrading Escambia Bay, and assess feasibility of restoration. While other small studies were carried out since in various portions of the bay, Collard (1991a) described the Olinger work as the only comprehensive study accomplished on the PBS [i.e., Pensacola Bay system] to date. Although designed primarily to examine Escambia Bay, collections were taken in parts of Blackwater and East Bays. Collections were made using benthic grabs for infauna/epifauna (collectively termed benthic macrofauna), and bag seines and balloon trawls for fishes and large, motile invertebrates 45
55 (primarily shrimp). Sampling was done either bimonthly or quarterly during Selected portions of the data were taken from tables and appendices in Olinger et al. (1975) and are summarized here. No large-scale study of the system was done until Livingston (1999) [and others; see summary in Gallagher et al. (1999)] investigated the possible effects of an additional waste load from Champion International Corporation, now International Paper Corporation (pulp and paper mill located in Cantonment currently discharging waste water to Perdido Bay via Eleven Mile Creek) redirected into the Escambia River. As with the Olinger et al. (1975) work, Livingston s collections were concentrated in Escambia Bay, with some sampling accomplished in Blackwater and East Bays. Sampling stations of interest included: 1 site in the Blackwater River, 1 in the Yellow River, 3 in Blackwater Bay and 4 in East Bay. Collections were taken for benthic infauna and epifauna, and fishes during Data were unavailable directly from Livingston (1999), but summary information was taken from Von Appen and Winter (2000) for comparison. These comprehensive investigations, as well as the numerous small-scale studies examining portions of the system, have been summarized by Collard (1991a) for those occurring prior to 1990 and by Von Appen and Winter (2000) for those occurring between Riverine portions of the East Bay/Blackwater Bay system have been sampled for benthos and fishes by the Florida Fish and Wildlife Conservation Commission (FFWCC) sporadically over the last 50 years. Early collections were reported by Byrd et al. (1962) and Bass et al. (1979). Recent collections have been made at a variety of sites throughout the lower Yellow, Shoal and Blackwater rivers (J. Knight, FFWCC, personal comm.). 5.1 Benthic Macrofauna (Infauna/Epifaunal) Benthic invertebrate communities were examined at seven sites in the Yellow and Shoal rivers (Figure 26) during ; abundance and biomass of benthic organisms were recorded from shoreline and mid-river locations (Bass et al. 1979). Clearly, higher densities and biomass were observed at Yellow River sites relative to Shoal stations with shoreline locations having greater amounts of both compared to mid-river. Yellow River densities ranged from individuals per m 2 along the shoreline and in mid- river; biomass ranged from grams per m 2 along the shore compared with in mid-river. Shoal River sites had densities from individuals per m 2 along the shore and in mid-river; biomass ranged from grams per m 2. Sites on both rivers were dominated by midge (Tendipedidae) and mayfly (Ephemeroptera) larvae, oligochaetes and bivalves (particularly the Asiatic clam Corbicula leana [probably C. fluminea]) with some variation noted between rivers. Overall, Yellow River habitats were considered relatively productive when compared with other river systems (i.e., Blackwater, Escambia and Suwannee rivers) while Shoal sites were deemed relatively unproductive. Differences between the Yellow and Shoal river productivity were suggested to be related to the greater proportions of organic debris/detritus in the Yellow River.. 46
.")
56 Figure 26. Fish and benthos collection sites in the Yellow and Shoal rivers taken during by the FFWCC. Benthic collections were taken at all sites while fishes were sampled only at sites 1-6. Data source: Bass et al. (1979). Sixty-nine benthic macrofaunal taxa were collected from three transects in the East Bay/Blackwater Bay system (Table 6) (Olinger et al. 1975). Fauna were dominated by amphipod and decapod crustaceans, gastropod and pelecypod molluscs, and polychaete worms. Densities were generally low to moderate at most sites, ranging from 56 to 4,272 individuals per square meter (Table 7). Lowest densities tended to be found at the muddy, fine-grained sites at the waterward end of each transect; higher densities were generally found at inshore sandy locations. Overall, highest density was noted at a transition site (EBEC), located between the sandy shelf and deeper mud stations on the northeast side of East Bay. Species richness (number of species per site) was low with number of taxa per site ranging from 8 to 26 (Table 7). Highest species richness was noted at another transition site (EBEE), but not concurrent with the highest density (EBEC). Interestingly, both highest density (EBEC) and highest species richness (EBEE) were noted from the same transect in northeastern East Bay and were found at stations adjacent to the site with the lowest species richness (EBED). Species diversity, like species richness, was low ranging from 0.50 to 2.52 (Table 7). The station (EBEC) with the highest density (4,272 inds/m 2 ) and next to the highest species richness (25 taxa) had one of the lowest 47
57 Table 6. Summary of benthic macrofaunal taxa collected in Blackwater and East Bays during by Olinger et al. (1975). Collections were taken from 11 stations over 3 transects in the two bays. Arthropoda Crustacea Amphipoda Ampelisca vadorum Corophium sp. (near C. acutum) Grandidierella bonneroides Haustorius sp. Listriella sp. (near L. barnardi) Melita nitida Monoculodes edwardsi Monoculodes sp. Isopoda Cyathura sp. Edotea sp. Erichsonella filiformis Tanaidacea Leptochelia sp. Cumacea Oxyurostylis smithi Mysidacea Mysidopsis bigelowi Praunus sp. Decapoda Callianassa jamaicense Callinectes ornatus Callinectes sapidus Eurypanopeus depressus Farfantepenaeus aztecus Litopenaeus setiferus Micropanope sp. Neopanope texana Palaemonetes pugio Palaemonetes sp. Pinnixa sayana Mollusca Gastropoda Crepidula plana Neritina reclivata Nudibranchs Odostomia spp. 48
58 Table 6. Benthic macrofaunal taxa list (continued). Polychaeta Gastropoda (continued) Polinices duplicata Retusa canaliculata Pelecypoda Amygdalum papyria Brachiodontes exustus Brachiodontes recurvus Crassostrea virginica Cyclinella tenuis Ensis minor Macoma mitchelli Martesia cuneiformis Martesia smithi Mercenaria campechiensis Mulinia lateralis Mysella planulata Polymesoda caroliniana Tagelus plebeius Ampharetidae Amphicteis gunneri Arabellidae Drilonereis cylindrica Capitellidae Heteromastus filiformis Glyceridae Glycera oxycephala Goniadidae Glycinde solitaria Hesionidae Gyptis capensis Maldanidae Grayierella sp. Isocirrus longiceps Nereidae Laeonereis culveri Neanthes succinea Onuphidae Diopatra c. cuprea Orbiniidae Haploscoloplos fragilis Pectinariidae Pectenaria gouldii 49
59 Table 6. Benthic macrofaunal taxa list (continued). Pilargidae Ancistrosyllis hamata Parandalia fauveli Sigambra bassi Sigalionidae Sthenelais boa Spionidae Paraprionospio pinnata Polydora caeca Polydora websteri Scolelepis squamata Nemertea Cerebratulus lacteus Echinodermata Holothuroidea Synaptula hydriformis 50
60 Table 7. Summary of benthic macrofauna collected in Blackwater and East Bays during by Olinger et al. (1975). Collections were taken from 11 stations over 3 transects in the two bays. Stations Density Species Richness Diversity (H') (No. of inds/m 2 ) (No. of spp/site) Blackwater Bay BWA BWB BWC Mean East Bay East EBEA EBEB EBEC EBED EBEE Mean East Bay West EBWA EBWB EBWC Mean East Bay Deep EBD
61 diversities (0.96), resulting probably from a high level of dominance by one or a few taxa. These collections generally support the notion of a relatively depauperate benthic fauna in East Bay. Collard (1991a) developed a master species list as part of his review of the biological trends and current status of the Pensacola Bay system. His review, based on pre-1990 studies, included a total of 408 primarily sessile infaunal macroinvertebrate taxa, 82 of which were recorded from Blackwater and East Bays. Of these, 17 taxa from East Bay/Blackwater Bay were widely considered to be indicators of stressed environments. In his examination of biological trends, Collard (1991a) concluded that short-term benthic faunal increases and decreases reported in the documents that he reviewed suggested that the Pensacola Bay system had not significantly changed in the last years. In fact, taking seasonal and annual fluctuations into account, benthic invertebrates in 1990 appeared in much the same overall condition, with low biomass and diversity, as noted in the 1950s. He further stated that Blackwater and East Bays, and their associated bayous, may be the exceptions to this relatively stable view. These areas seemed to have been adversely impacted at a greater rate than other portions of the system; however, inadequate sampling precludes definitive conclusions. Livingston (1999) [as summarized by Von Appen and Winter 2000] examined 40 sites throughout the Pensacola Bay system, 10 of which were located in East and Blackwater Bays and associated rivers. No community quantification was provided in Von Appen and Winter, only subjective summaries. Overall, Livingston found degraded benthic infaunal communities in most areas, likely due to toxic sediment contaminants. Infaunal biomass was greatest in upper Escambia Bay, associated with high primary production probably resulting from the high nutrient loading from the Escambia River. Highest infaunal biomass was noted in the shallow shelf areas of upper Escambia and Blackwater Bays in the vicinity of river inflows. Infaunal species diversity was highest in the high salinity portions of mid-escambia and Pensacola Bays. Low infaunal biomass and species diversity was observed in deeper areas of East Bay, lower and eastern portions of Escambia Bay, and portions of Pensacola Bay. Indicator species for pollution were found in these areas. 5.2 Shrimp and Crab Abundance Shrimp were poorly represented in PBS collections overall (Table 8) and specifically in East Bay (Olinger et al. 1975). Only about 16% of the shrimp collected baywide were found in East Bay samples, with the majority of these being brown shrimp (Farfantepenaeus aztecus); very few pink (F. duorarum) or white shrimp (Litopenaeus setiferus) were observed. Livingston (1999) [as summarized by Von Appen and Winter 2000] noted low overall secondary productivity throughout the Pensacola Bay system. As with infauna, highest benthic epifaunal abundance was noted in upper Escambia Bay and was dominated by brown shrimp (F. aztecus) and blue crabs (Callinectes sapidus). Blackwater and East Bays were largely devoid of epibenthic macroinvertebrates, while low numbers were found in Pensacola and lower Escambia Bays. 52
62 Table 8. Summary of shrimp collected in East and Escambia Bays during by Olinger et al. (1975). Collections were taken from 11 stations throughout the two bays and are summarized by region. Species East Bay Upper Middle Lower Bayous Total Percent of Escambia Escambia Escambia Catch Total Catch in East Bay Number of Trawls % Penaeidae Farfantepenaeus aztecus % (brown shrimp) Farfantepenaeus duorarum % (pink shrimp) Litopenaeus setiferus % (white shrimp) Totals % 5.3 Fish Abundance Fishes were sampled at a variety of sites throughout the Yellow and Shoal rivers by the FFWCC over the last 50 years; early reports include those of Byrd et al. (1962), Bass et al. (1979) and Bass (1993). Byrd et al. (1962), using rotenone and gill and trammel nets, recorded 79 species for the Yellow and Shoal river collections. Samples from the Yellow River were dominated by channel catfish (Ictalurus punctatus), black madtom (Noturus funebris), weed (Notropis texanus) and blacktail shiner (N. venustus), bay anchovy (Anchoa mitchelli) and menhaden (Brevoortia patronus). Bluegill (Lepomis macrochirus) and warmouth (L. gulosus), speckled madtom (Noturus leptocanthus), pirate perch (Aphredoderus sayanus), blackspotted topminnow (Fundulus olivaceus) and an unidentified minnow (Notropis sp.) were most abundant in Shoal River collections. No comparisons of relative abundance could be made between the rivers because of differences in sampling effort. Bass et al. (1979) sampled fish populations at six locations (Stations 1-6; Figure 26) in the Yellow and Shoal rivers during ; collections were made using electrofishing gear and were standardized for catch per hour of sampling. Forty-six species were observed over all sites (Table 9) with only 10 taxa common to all locations. Fourteen species were found only in one sub-basin with 11 of these restricted to the Yellow River and only 3 confined to the Shoal. Of these, only the redear sunfish (Yellow) and the unidentified cyprinids (Shoal) were found to be 53
63 common. Overall, the fish community was dominated by blacktail and weed shiner, blacktail redhorse, spotted sucker, bluegill, longear sunfish and blackbanded darter. Distinct faunal communities were noted in different reaches of the river system. Longnose gar, golden shiner, spotted sucker, bluegill and redear sunfish dominated the lower Yellow River marsh (Site 1) while clear chub, blacktail and weed shiner, blacktail redhorse and blackbanded darter were most abundant at the upper reach site (Site 4). Similar to the upper Yellow reach, Shoal River locations were dominated by blacktail and weed shiner, blacktail redhorse and blackbanded darter. Fewest species and lowest catch rates (catch per hour) were noted in the lower reach of the Yellow River (Sites 1 and 2); catch rates were three to four times greater at middle and upper river locations. Bass (1993) compared fish communities in four river systems draining into either Pensacola or Perdido bays; of the 75 small stream sampled, 24 were located in the Yellow River. Fifty-nine species were observed over all sites (Table 10) of which 47 taxa were found in the Yellow River. Greatest number of species and number of individuals per site were noted in the Yellow River with least abundance and diversity at Perdido River sites; however, comparisons are hampered by unequal sampling efforts in the various river systems. Relative abundances of common fishes (Table 10) differed somewhat among the systems. Yellow River sites were dominated by weed, sailfin and blacktail shiners and blackbanded darter while sailfin and flagfin shiners and blackbanded darters were common on the Blackwater and Perdido. Weed, sailfin and rough shiners along with Dixie chub were most abundant in the Escambia. Fishes have been sampled in recent years throughout the Yellow and Shoal rivers by the FFWCC (Figure 27); collections are summarized here by river reach (Table 11). Sixty species were observed throughout the river system with noticeable differentiation by reach; only 11 species were common to all reaches. Least number of species (29) was noted in the lower reach of the river and was possibly influenced by salinity intrusion in the river delta. Little salinity intrusion, however, was noted at the upper end of this reach (i.e., SR87 bridge; see water quality section). Several species collected in the lower reach are typically found in low salinity waters including longnose gar (Lepisosteus osseus), striped mullet (Mugil cephalus) and Atlantic needlefish (Strongylura marina); several freshwater species found in this reach are known to tolerate low salinities including largemouth bass (Micropterus salmoides), lake chubsucker (Erimyzon sucetta) and coastal shiner (Notropis petersoni). Fish communities have been examined at relatively few sites in the estuarine portions of the Blackwater/East Bay system; collections were taken by Bass and Hitt (1977) in Blackwater Bay and by Olinger et al. (1975) in East Bay. More recently, Livingston (1999) sampled 10 locations in Blackwater and East Bays including the mouths of the Blackwater and Yellow rivers. Bass and Hitt (1977) sampled two sites in Blackwater Bay: a lower site along the northern shore of Escribano Point (Station 1) and an upper site approximately halfway down the western shore at Bay Point (Station 2). Collections were taken with a variety of methods including seines, gill nets and trawls in the brackish areas, and electrofishing and rotenone in the freshwater areas. Unfortunately, comparisons between the upper and lower sites are hindered by the different types of sampling gear used; only very subjective, qualitative assessments can be made. 54
64 Table 9. Abundance of fishes collected by electrofishing at six sites in the Yellow and Shoal rivers ( ). Abundance is shown as catch per hour of electrofishing. Stations are shown in Figure 26. Data source: Bass et al. (1979). Species Yellow River Sites Shoal River Sites Spotted gar Longnose gar American eel 0.3 Bowfin 0.3 Redfin pickerel Chain pickerel Silverjaw minnow Clear chub Sailfin shiner 0.4 Longnose shiner Flagfin shiner Blacktail shiner Golden shiner 4.0 Pugnose minnow Coastal shiner Weed shiner Cyprinidae spp. (unidentified) 38.3 Lake chubsucker 1.0 Sharpfin chubsucker Spotted sucker Blacktail redhorse Channel catfish Yellow bullhead Speckled madtom Pirate perch Starhead topminnow 0.3 Blackspotted topminnow Brook silverside Rock bass Warmouth Bluegill Dollar sunfish Longear sunfish Redear sunfish
65 Table 9. Continued. Species Yellow River Sites Shoal River Sites Spotted sunfish Lepomis sp. (fry) 0.3 Spotted bass 0.4 Largemouth bass Black crappie 1.0 Florida sand darter Speckled darter Gulf darter Etheostoma sp Blackbanded darter Southern flounder 0.7 Hogchoker 0.7 Total Catch per Hour Total Number of species
66 Table 10. Comparison of relative abundances of common fishes (those constituting 1% or more of total collected) collected in small streams within the Pensacola and Perdido Bay watersheds ( ). Four sites were excluded because they were located on streams draining directly into bay waters. Data source: Bass (1993). Species All Yellow Blackwater Escambia Perdido Sites River River River River Number of Sites Weed shiner Sailfin shiner Flagfin shiner Blackbanded darter Blacktail shiner Longnose shiner Mosquitofish 2.9 Speckled madtom Rough shiner Blackspotted topminnow Spotted sunfish Dixie chub Orangeside darter Silverjaw minnow Southern brook lamprey Redfin pickerel Bluegill American eel Black madtom Clear chub 3.8 Bluehead chub 3.7 Longear sunfish 1.0 Total Number of Species Number of Individuals Mean Number per Site

67 Figure 27. Recent fish collection sites on the Yellow and Shoal rivers, including small tributary streams and creeks. Stations are combined by reach with data summarized in Table 11. Data source: Florida Fish and Wildlife Conservation Commission (2009). 58
Florida Seagrass Integrated Mapping and Monitoring Program
 Florida Seagrass Integrated Mapping and Monitoring Program - 2004 The following document is composed of excerpts taken from the 2011 publication, Seagrass Integrated Mapping and Monitoring for the State
Texas Water Resources Institute
 Texas Water Resources Institute November/December 1982 Volume 8 No. 6 A Precise Environment By Lou Ellen Ruesink, Editor, Texas Water Resources Aquarium enthusiasts know just how particular fish are about
Refined Designated Uses for the Chesapeake Bay and Tidal Tributaries
 A-1 appendixa Refined Designated Uses for the Chesapeake Bay and Tidal Tributaries BACKGROUND Federal water quality standards regulations establish that states must specify appropriate water uses to be
Minnesota Department of Natural Resources Division of Fish and Wildlife Section of Fisheries. Stream Survey Report. Luxemburg Creek.
 Minnesota F-29-R(P)-24 Area 315 Study 3 March 2016 Minnesota Department of Natural Resources Division of Fish and Wildlife Section of Fisheries Stream Survey Report Luxemburg Creek 2015 Mark Pelham Sauk
Chagrin River TMDL Appendices. Appendix F
 Appendix F The following are excerpts from the Eastern Brook Trout Joint Venture s Conservation Strategy (Working Draft v.6), Conserving the Eastern Brook Trout: Strategies for Action Found at: http://www.easternbrooktrout.org/constrategy.html
Three point plan to addressing land use and habitat loss impacts on Chesapeake Bay tidal fish and shellfish
 Three point plan to addressing land use and habitat loss impacts on Chesapeake Bay tidal fish and shellfish 1. Establish Principles for Protection of Chesapeake Bay Fish and Shellfish The Fisheries GIT
Indian River Lagoon: Lessons, Challenges and Opportunities
 Indian River Lagoon: Lessons, Challenges and Opportunities Upper Chain of Lakes Lake Kissimmee Kissimmee River Indian River Lagoon Caloosahatchee Estuary Lake Okeechobee St. Lucie Estuary Mark Perry, Executive
Managing Chesapeake Bay s Land Use, Fish Habitat, and Fisheries: Studies. Jim Uphoff & Margaret McGinty, Fisheries Service
 Managing Chesapeake Bay s Land Use, Fish Habitat, and Fisheries: Positive Image and or Negative Graphic Case Studies Jim Uphoff & Margaret McGinty, Fisheries Service Maryland Fisheries Service has been
Maryland Chapter Trout Unlimited Brook Trout Conservation Effort
 Maryland Chapter Trout Unlimited Brook Trout Conservation Effort Photo by Matt Kline Portfolio of Recent Work MDTU Brook Trout Conservation Coordinator: Scott C. Scarfone, ASLA sscarfone@oasisdesigngroup.com
Habitat Fact Sheets. Rocky habitats are dominated by seaweeds and often mussels, which rely on the rocks for attachment.
 Habitat Fact Sheets Habitats in the Gulf of Maine serve many important roles for the environment and for humans as well. These include: cycling nutrients, filtering pollution, trapping sediments, storing
The Blue Heron Slough Conservation Bank
 1 The Blue Heron Slough Conservation Bank CONSERVATION BANKING July 19-23, 2010 CASE STUDY SERIES The Blue Heron Slough Conservation Bank (Washington) I. OVERVIEW & BACKGROUND: Location: Snohomish River
NYS Coastal Waters. Water Resources of NYS: THE NATURE of the COASTAL ZONE. NYS Coastal Waters. NYS Coastal Atlas. Coastal Zone Management 10/10/2014
 Water Resources of NYS: THE NATURE of the COASTAL ZONE NYS Coastal Waters NYS is the only state to border the Atlantic Ocean and the Great Lakes (Lakes Erie and Ontario). Great Lakes shoreline: 577 miles
ELIZABETH RIVER FACTS
 ELIZABETH RIVER FACTS How is she different from inland rivers? The Elizabeth River is an estuary a tidal finger of the Chesapeake Bay, rather than a freshwater river with a spring as origin. The Elizabeth
Information for File # SEW
 Information for File #2014-02744-SEW Applicant: Minnesota Department of Transportation (MnDOT), District 3; c/o Mr. Robert Nibbe Corps Contact: Sarah Wingert, U.S. Army Corps of Engineers, 180 5 th Street
SECTION 2 HYDROLOGY AND FLOW REGIMES
 SECTION 2 HYDROLOGY AND FLOW REGIMES In this section historical streamflow data from permanent USGS gaging stations will be presented and discussed to document long-term flow regime trends within the Cache-Bayou
SOUTH CAROLINA ELECTRIC & GAS COMPANY COLUMBIA, SOUTH CAROLINA
 SOUTH CAROLINA ELECTRIC & GAS COMPANY COLUMBIA, SOUTH CAROLINA SALUDA HYDROELECTRIC PROJECT FERC NO. 516 DOWNSTREAM TEMPERATURE STUDY DRAFT REPORT MAY 28 Prepared by: SOUTH CAROLINA ELECTRIC & GAS COMPANY
X.B WETLANDS ROGUE RIVER ESTUARY
 X.B WETLANDS ROGUE RIVER ESTUARY The Rogue River has a drainage area of 5,100 square miles, yet the estuary of the Rogue River is one of the smallest in Oregon, measuring approximately 1,880 acres during
MARSH DEGRADATION AT THE MOUTH OF MOORE CREEK
 MARSH DEGRADATION AT THE MOUTH OF MOORE CREEK Hunter Winstanley, Department of Earth Sciences, University of South Alabama, Mobile, AL 36688. E-Mail: hcw501@jaguar1.usouthal.edu. Moore Creek is located
From Phosphorus to Fish: Beneficial Use of Excess Nutrients
 FLOATINGISLANDINTERNATIONAL From Phosphorus to Fish: Beneficial Use of Excess Nutrients Project Location: Shepherd, Montana Fishing can be the primary method for transitioning excess nonpoint source nutrients
OFFICE OF STRUCTURES MANUAL FOR HYDROLOGIC AND HYDRAULIC DESIGN CHAPTER 11 APPENDIX B TIDEROUT 2 USERS MANUAL
 OFFICE OF STRUCTURES MANUAL FOR HYDROLOGIC AND HYDRAULIC DESIGN CHAPTER 11 APPENDIX B TIDEROUT 2 USERS MANUAL APRIL 2011 APRIL 2011 Page 1 Preface TIDEROUT 2, Build 1.22 dated June 29, 2006 is the current
BAYKEEPER. Utilizing Volunteers in Baykeeper s Oyster Restoration Program
 NY/NJ BAYKEEPER Utilizing Volunteers in Baykeeper s Oyster Restoration Program Meredith Comi, Oyster Restoration Program Director Hooked on our Waters October 19, 2013 Baykeeper s Mission PROTECT, PRESERVE,
Warm-up # 7 A day 5/17 - B day 5/18 UPDATE YOUR TABLE OF CONTENTS
 Warm-up # 7 A day 5/17 - B day 5/18 UPDATE YOUR TABLE OF CONTENTS Question: List all examples of surface water on Earth. Answer: Rivers and streams, lakes and reservoirs, (ponds) wetlands, estuaries and
Managing Development and Chesapeake Bay s Estuarine Fish
 Managing Development and Chesapeake Bay s Estuarine Fish Habitat Image and or Graphic Fisheries James H. Uphoff Jr. and Margaret M. McGinty Maryland Fisheries Service Funded through USFWS Federal Aid Maryland
Minnesota Department of Natural Resources Division of Fish and Wildlife Section of Fisheries. Stream Survey Report. Cold Spring Creek.
 Minnesota F-29-R(P)-24 Area 315 Study 3 March 2015 Minnesota Department of Natural Resources Division of Fish and Wildlife Section of Fisheries Stream Survey Report Cold Spring Creek 2014 Mark Pelham Montrose
Jason Blackburn, Paul Hvenegaard, Dave Jackson, Tyler Johns, Chad Judd, Scott Seward and Juanna Thompson
 Alberta Conservation Association (ACA) Date: 2014-2015 Project Name: Owl River Walleye and Aquatic Habitat Assessment Fisheries Program Manager: Peter Aku Project Leader: Tyler Johns Primary ACA staff
APPENDIX C. Fluvial and Tidal Hydraulics Report
 APPENDIX C Fluvial and Tidal Hydraulics Report BUENA VISTA LAGOON ENHANCEMENT PROJECT FLUVIAL AND TIDAL HYDRAULICS ANALYSES Prepared for: SANDAG 401 B Street, Suite 800 San Diego, California 92101 Contact:
UNDERSTANDING YOUR ESTUARY Level IA- ESTUARY SEARCH
 UNDERSTANDING YOUR ESTUARY Level IA- ESTUARY SEARCH Kakagon/Bad River Sloughs, a Lake Superior estuary located on the Bad River Reservation near Ashland, WI. GOAL Select one Wisconsin estuary to study
Significant Ecological Marine Area Assessment Sheet
 Significant Ecological arine Area Assessment Sheet Name: ouhora arbour arine Values Summary: The entrance subtidal channel, tidal flats, seagrass mangrove and saltmarsh habitats of ouhora arbour have given
FACT SHEET MCGREGOR LAKE RESTORATION HABITAT PROJECT POOL 10, UPPER MISSISSIPPI RIVER, WISCONSIN ENVIRONMENTAL MANAGEMENT PROGRAM
 FACT SHEET MCGREGOR LAKE RESTORATION HABITAT PROJECT POOL 10, UPPER MISSISSIPPI RIVER, WISCONSIN ENVIRONMENTAL MANAGEMENT PROGRAM LOCATION McGregor Lake is located within a mid-river island in Pool 10
Estuarine Shoreline Stabilization
 Estuarine Shoreline Stabilization Property Owner s Guide to Determining the Most Appropriate Stabilization Method Estuarine shorelines are dynamic features that experience continued erosion. Land is lost
CHAPTER 4 DESIRED OUTCOMES: VISION, GOALS, AND OBJECTIVES
 CHAPTER 4 DESIRED OUTCOMES: VISION, GOALS, AND OBJECTIVES Vision One of the first steps in developing this Plan was articulating a vision - a clear statement of what the Plan strives to achieve and what
Climate Change Adaptation and Stream Restoration. Jack Williams;
 Climate Change Adaptation and Stream Restoration Jack Williams; jwilliams@tu.org 1 Goals for this presentation Develop strategies for adapting streams to climate impacts by Thinking like a watershed Understanding
Figure 4, Photo mosaic taken on February 14 about an hour before sunset near low tide.
 The Impact on Great South Bay of the Breach at Old Inlet Charles N. Flagg and Roger Flood School of Marine and Atmospheric Sciences, Stony Brook University Since the last report was issued on January 31
DECISION MEMO. Pursuant to 36 C.F.R (e), the following persons are exempted from this order:
, the following persons are exempted from this order:") DECISION MEMO Forest Supervisor s Orders for the Upper Tellico Off-Highway Vehicle System USDA Forest Service Southern Region Nantahala National Forest Tusquitee Ranger District Cherokee County, North
DECISION MEMO Forest Supervisor s Orders for the Upper Tellico Off-Highway Vehicle System USDA Forest Service Southern Region Nantahala National Forest Tusquitee Ranger District Cherokee County, North
Inlet Management Study for Pass-A-Grille and Bunces Pass, Pinellas County, Florida
 Inlet Management Study for Pass-A-Grille and Bunces Pass, Pinellas County, Florida Final Report Submitted By Ping Wang, Ph.D., Jun Cheng Ph.D., Zachary Westfall, and Mathieu Vallee Coastal Research Laboratory
State of San Francisco Bay 2011 Appendix O Steelhead Trout Production as an Indicator of Watershed Health
 State of San Francisco Bay 2011 Appendix O Steelhead Trout Production as an Indicator of Watershed Health Gordon Becker and Katherine Smetak, Center for Ecosystem Management and Restoration 290 Introduction
OYSTER REEF RESTORATION; RESTORING ECOLOGICAL FUNCTION
 OYSTER REEF RESTORATION; RESTORING ECOLOGICAL FUNCTION Paul Jensen, David Buzan, and Ka-Leung Lee; Atkins Mark Dumesnil and Julie Sullivan; The Nature Conservancy Presentation Overview The Nature Conservancy
SKIATOOK LAKE MANAGEMENT PLAN
 SKIATOOK LAKE MANAGEMENT PLAN Background Skiatook Lake impounds Hominy Creek, 5 miles west of Skiatook in Osage County, Oklahoma (Figure 1). Skiatook Lake covers 10,540 surface acres and was constructed
LOXAHATCHEE RIVER WATER QUALITY AND BIOLOGICAL MONITORING TASK 2: FINAL REPORT ASSESSMENT OF LOXAHATCHEE RIVER OYSTER MAPPING & RECRUITMENT
 LOXAHATCHEE RIVER WATER QUALITY AND BIOLOGICAL MONITORING TASK 2: FINAL REPORT ASSESSMENT OF 2007-2008 LOXAHATCHEE RIVER OYSTER MAPPING & RECRUITMENT In Partial Fulfillment of Agreement No. 4600001281
USING BIOLOGICALLY IMPORTANT PHYSICAL CHARACTERISTICS OF ESTUARIES TO CLASSIFY AUSTRALIAN AND NEW ZEALAND ESTUARIES
 USING BIOLOGICALLY IMPORTANT PHYSICAL CHARACTERISTICS OF ESTUARIES TO CLASSIFY AUSTRALIAN AND NEW ZEALAND ESTUARIES Michael Whelan, Southern Cross University, Australia. Peter Saenger, Southern Cross University,
SOCIETAL GOALS TO DETERMINE ECOSYSTEM HEALTH: A FISHERIES CASE STUDY IN GALVESTON BAY SYSTEM, TEXAS
 SOCIETAL GOALS TO DETERMINE ECOSYSTEM HEALTH: A FISHERIES CASE STUDY IN GALVESTON BAY SYSTEM, TEXAS Anthony S. Pait, NOAA, National Centers for Coastal Ocean Science Thomas P. O Connor, David R. Whitall,
Total Suspended Solids, Stable Flow, and Wet Weather Event Monitoring in the Bass River Watershed. December The Cadmus Group, Inc.
 Total Suspended Solids, Stable Flow, and Wet Weather Event Monitoring in the Bass River Watershed December 2004 The Cadmus Group, Inc. Grand Valley State University Annis Water Resources Institute Submitted
NIANGUA SNAPSHOT ISSUE Nutrients 2 Suspended Sediment 3 Salinity 4 Summary 5
 Niangua River Watershed Snapshot Volume 14 Number 2 The 125-mile long Niangua River meanders northward from the town of Marshfield on I-44 to the Lake of the Ozarks. Its watershed covers more than 658,000
Collaborative. City of Stuart. September 7, Mark Perry, Executive Director Oceanographic Society. Upper Chain of Lakes
 Lake Okeechobee Collaborative Upper Chain of Lakes Lake Kissimmee Indian River Lagoon City of Stuart September 7, 2016 Kissimmee River Caloosahatchee Estuary Lake Okeechobee St. Lucie Estuary Everglades
1.Mill Creek Watershed Summary Description and Land Use
 1.Mill Creek Watershed Summary Description and Land Use Table xxx: Mill Creek Watershed Overview Watershed Size 31,435 acres/49.1 sq miles/ 127.1 sq km Elevation Range 5,594 feet [4,967-10,561] Stream
Mecklenburg County. Fish Consumption Advisories A Local Government Perspective
 Mecklenburg County Fish Consumption Advisories A Local Government Perspective David Caldwell Charlotte-Mecklenburg Storm Water Services Water Quality Program NCLMS October 4, 2012 Lake monitoring program
Types of Estuaries and Mixing Patterns. Mrs. Stahl Marine Science Honors
 Types of Estuaries and Mixing Patterns Mrs. Stahl Marine Science Honors Coastal Plain Form between glacial periods, when water from melting glaciers raises the sea level and floods coastal plains and low
SARASOTA BAY ESTUARY PROGRAM OYSTER HABITAT MONITORING RESULTS: YEAR 1. Jay R. Leverone
 SARASOTA BAY ESTUARY PROGRAM OYSTER HABITAT MONITORING RESULTS: YEAR 1 by Jay R. Leverone Mote Marine Laboratory 1600 Ken Thompson Parkway Sarasota, Fl 34236 to Gary Raulerson Sarasota Bay Estuary Program
SURGE SUPPRESSION ACHIEVED BY DIFFERENT COASTAL SPINE (IKE DIKE) ALIGNMENTS. Bruce A. Ebersole, Thomas W. Richardson and Robert W.
 ALIGNMENTS. Bruce A. Ebersole, Thomas W. Richardson and Robert W.") SURGE SUPPRESSION ACHIEVED BY DIFFERENT COASTAL SPINE (IKE DIKE) ALIGNMENTS Abstract Bruce A. Ebersole, Thomas W. Richardson and Robert W. Whalin, Jackson State University, Jackson, Mississippi The primary
SURGE SUPPRESSION ACHIEVED BY DIFFERENT COASTAL SPINE (IKE DIKE) ALIGNMENTS Abstract Bruce A. Ebersole, Thomas W. Richardson and Robert W. Whalin, Jackson State University, Jackson, Mississippi The primary
Outline. 1. Overview 2. Population 3. Flooding 4. Land Use 5. References. Overview
 Outline 1. Overview 2. Population 3. Flooding 4. Land Use 5. References Overview The two main rivers in the Cannon River watershed are the Cannon and Straight Rivers. The Cannon River originates in Shields
EVALUATING THE EFFECTS OF BIVALVE SHELLFISH AQUACULTURE AND ITS ECOLOGICAL ROLE IN THE ESTUARINE ENVIRONMENT IN THE UNITED STATES
 EVALUATING THE EFFECTS OF BIVALVE SHELLFISH AQUACULTURE AND ITS ECOLOGICAL ROLE IN THE ESTUARINE ENVIRONMENT IN THE UNITED STATES Brett Dumbauld USDA Agricultural Research Service, Hatfield Marine Science
Conservation and Restoration Florida s Coastal Marshes: An Overview of MESS. Jeff Beal, Kent Smith, Erin McDevitt, Maria Merrill
 Conservation and Restoration Florida s Coastal Marshes: An Overview of MESS Jeff Beal, Kent Smith, Erin McDevitt, Maria Merrill FWC s MESS: -Marine/Estuarine Subsection -within Aquatic Habitat Conservation
Minnesota Department of Natural Resources Division of Fish and Wildlife Section of Fisheries. Stream Survey Report. Cold Spring Creek.
 Minnesota F-29-R(P)-24 Area 315 Study 3 March 2013 Minnesota Department of Natural Resources Division of Fish and Wildlife Section of Fisheries Stream Survey Report Cold Spring Creek 2012 Mark Pelham Montrose
Enclosure 9. Memorandum for Record, meeting with FWS on August 12, 2002
 Enclosure 9 Memorandum for Record, meeting with FWS on August 12, 2002 CESAM-PD-EI Brandt/690-3260/23 August 2002 MEMORANDUM FOR RECORD SUBJECT: Meeting with USFWS and FWCC to Discuss ACF Water Control
Proposed Reclassification of Muskrat Creek, North Platte River Basin in Goshen County, Wyoming
 Proposed Reclassification of Muskrat Creek, North Platte River Basin in Goshen County, Wyoming October 25, 2010 Waterbody: Muskrat Creek - Mainstem of Muskrat Creek from its headwaters downstream to its
San Lorenzo Valley Water District, Watershed Management Plan, Final Version Part I: Existing Conditions Report
 LIST OF FIGURES Figure 1-1. Map of the San Lorenzo River watershed Figure 2-1. The Santa Cruz Mountains Bioregion Figure 2-2. Protected areas within the San Lorenzo River watershed Figure 2-3. Primary
Examples of estuaries include bays, sounds, salt marshes, mangrove forests, mud flats, swamps, inlets, and sloughs.
 An estuary is a partially enclosed body of water where incoming seawater is mixed with fresh water coming from the land. Examples of estuaries include bays, sounds, salt marshes, mangrove forests, mud
SALINITY. It's the amount of dissolved salts the water contains.
 AQUATIC ECOSYSTEMS SALINITY The types of organisms in an aquatic ecosystem depend upon the water s Salinity. It's the amount of dissolved salts the water contains. Salinity determines the two main aquatic
FISHERIES BLUE MOUNTAINS ADAPTATION PARTNERSHIP
 FISHERIES A warming climate, by itself, substantially affects the hydrology of watersheds in the Blue Mountains. Among the key hydrologic changes projected under all scenarios for the 2040s and beyond
Columbia Lake Dam Removal Project
 Columbia Lake Dam Removal Project The Columbia Lake dam located 1/4 mile upstream of the Paulins Kill River's confluence with the Delaware River in Knowlton Township, Warren County has been proposed for
Properties. terc.ucdavis.edu 8
 Physical Properties 8 Lake surface level Daily since 1900 The lowest lake level on record was 6,220.26 feet on Nov. 30, 1992. Since 1900, lake level has varied by more than 10 feet. Lake level typically
Kissimmee River Channelization
 Environmental Restoration ti Update Phil Flood, South Florida Water Management District Presentation Overview Kissimmee River Restoration Everglades Stormwater Treatment Areas Comprehensive Everglades
Trout Unlimited Comments on the Scope of Environmental Impact Statement for the Constitution Pipeline Project, Docket No. PF12-9
 October 9, 2012 Kimberly D. Bose, Secretary Federal Energy Regulatory Commission 888 First Street, NE, Room 1A Washington, DC 20426 RE: Trout Unlimited Comments on the Scope of Environmental Impact Statement
Tide Gate Modifications for Fish Passage and Water Quality Enhancement
 Tide Gate Modifications for Fish Passage and Water Quality Enhancement Tillamook Bay National Estuary Project 613 Commercial St. PO Box 493 Garibaldi, OR 97118 Phone (503) 322-2222 Fax (503) 322-2261 Jay
Project Webpage:
 Project Webpage: http://nature.ly/marinesatlanticbightera Coastal Data and Full Metadata: http://easterndivision.s3.amazonaws.com/marine/sab MA/SABMACoastalEcosystems.zip Coastal Chapter: http://easterndivision.s3.amazonaws.com/marine/sab
CLAM PASS ANNUAL RESTORATION & MANAGEMENT PLAN TIDAL ANALYSIS ELEMENT REPORT NO. 13
 CLAM PASS ANNUAL RESTORATION & MANAGEMENT PLAN TIDAL ANALYSIS ELEMENT REPORT NO. 13 Submitted to: Pelican Bay Services Division Prepared by: Humiston & Moore Engineers H&M File No. 13-078 November 2012
Rainbow Smelt. Appendix A: Fish. Osmerus mordax. New Hampshire Wildlife Action Plan Appendix A Fish-125
 Rainbow Smelt Osmerus mordax Federal Listing State Listing Global Rank State Rank Regional Status SC S3 Photo by John Lyons Justification (Reason for Concern in NH) Rainbow smelt were once harvested by
WFC 50 California s Wild Vertebrates Jan. 11, Inland Waters (Lakes and Streams) Lisa Thompson
 Lisa Thompson") Inland Waters: Lakes and Streams WFC 50 11 January 2011 Lisa Thompson Fisheries Extension Specialist Wildlife, Fish, & Conservation Biology Department University of California, Davis Take home messages
Inland Waters: Lakes and Streams WFC 50 11 January 2011 Lisa Thompson Fisheries Extension Specialist Wildlife, Fish, & Conservation Biology Department University of California, Davis Take home messages
Allegheny Parker. Credit: Timothy Wertz, PFBC
 Pennsylvania Fish & Boat Commission 2012 Annual Summary Allegheny River @ Parker. Credit: Timothy Wertz, PFBC In this issue. Pennsylvania s Wildlife Action Plan Mussels of the Susquehanna River Fishes
Management Plan for the Obey River Trout Fishery
 Management Plan for the Obey River Trout Fishery 28-214 By: James Travis Scott Jack Swearengin Walter Scott Webb D.W. Young Tennessee Wildlife Resources Agency January 28 Management Plan for the Obey River
MINNESOTA DEPARTMENT OF NATURAL RESOURCES DIVISION OF FISHERIES AND WILDLIFE. Gamefish Assessment Report
 Minnesota DNR F-29-R(P) Area F312 February 1, 2013 MINNESOTA DEPARTMENT OF NATURAL RESOURCES DIVISION OF FISHERIES AND WILDLIFE Gamefish Assessment Report Spring Gamefish Assessment on the Mississippi
Response of a Newly Created Marsh-Wetland Affected by Tidal Forcing, Upland Discharge, and Groundwater Interaction
 Response of a Newly Created Marsh-Wetland Affected by Tidal Forcing, Upland Discharge, and Groundwater Interaction Mouth of Columbia River, Cape Disappointment State Park, Washington 12 Hans R. Moritz
021 Deer Management Unit
 021 Deer Management Unit Geographic Location: Deer Management Unit (DMU) 021 is 1,464 square miles in size and is located in the central Upper Peninsula (UP). This DMU is dominated by publicly owned land
Puget Sound Nearshore Ecosystem Restoration Project Restore America s Estuaries Conference 2012 Tampa, FL
 Restore America s Estuaries Conference 2012 Tampa, FL presented by: Theresa Mitchell, WA Dept. of Fish & Wildlife Nearshore General Investigation Change Analysis: Comparison of historical and current
Abundance of Steelhead and Coho Salmon in the Lagunitas Creek Drainage, Marin County, California
 scanned for KRIS Abundance of Steelhead and Coho Salmon in the Lagunitas Creek Drainage, Marin County, California Prepared for: Marin Municipal Water District 220 Nellen Drive Corte Madera, California
CARL BLACKWELL LAKE MANAGEMENT PLAN
 CARL BLACKWELL LAKE MANAGEMENT PLAN Background Lake Carl Blackwell impounds Stillwater Creek, 10 miles west of Stillwater in Payne County, Oklahoma (Figure 1). The lake covers 3,370 surface acres and was
Total Suspended Solids, Stable Flow, and Wet Weather Event Monitoring in the Unnamed Tributary to the Grand River Watershed.
 Total Suspended Solids, Stable Flow, and Wet Weather Event Monitoring in the Unnamed Tributary to the Grand River Watershed December 2004 The Cadmus Group, Inc. Grand Valley State University Annis Water
Eastern Brook Trout Joint Venture Annual Report The Nature Conservancy 2013
 Eastern Brook Trout Joint Venture Annual Report The Nature Conservancy 2013 2013 Annual Performance Report Enhancing Connectivity in the Ash-Black Rock Sub-basin of the West Branch Narraguagus River. Project
Proposed Reclassification of Cherry Creek, North Platte River Basin, Wyoming. October 25, 2010
 Proposed Reclassification of Cherry Creek, North Platte River Basin, Wyoming October 25, 2010 Waterbody: Location: Tributary to: Cherry Creek - Mainstem from headwaters downstream to the confluence with
Eastern Brook Trout. Roadmap to
 Eastern Brook Trout Roadmap to CONSERVATION Our Brook Trout heritage he wild Brook Trout is an American symbol of persistence, adaptability, and the pristine wilderness that covered North America prior
MISSISSIPPI MAKEOVER A Plan for Restoration, Just Around the Bend
 MISSISSIPPI MAKEOVER A Plan for Restoration, Just Around the Bend Interim Report Card 2013 Project coordinated by the Dakota County Soil and Water Conservation District and sponsored by the Minnesota Pollution
FINAL REPORT APPENDIX A. Physical Description of the Shubenacadie River
 FINAL REPORT APPENDIX A Physical Description of the Shubenacadie River Smart Solutions for Engineering, Science and Computing Physical Description of the Shubenacadie River Martec Technical Report # TR-07-12
Union Pacific Railroad
 Input Questions: 404/401 Pre Application Meeting, December 18, 2013, Portland, Oregon 1. What is the project purpose and need? The purpose of the project is to improve the efficiency and average velocity
What is an Estuary? Importance of Estuaries. Importance of Estuaries. Importance of Estuaries
 Oceanography 101, Richard Strickland Lecture 20 What is an Estuary? Portion of the ocean that is semi-enclosed by land and diluted by freshwater runoff All estuaries are embayments But embayments without
Near-Field Sturgeon Monitoring for the New NY Bridge at Tappan Zee. Quarterly Report July 1 September 30, 2014
 Near-Field Sturgeon Monitoring for the New NY Bridge at Tappan Zee Quarterly Report July 1 September 30, 2014 Prepared by AKRF, Inc. 7250 Parkway Drive, Suite 210 Hanover, MD 21076 for New York State Thruway
The Chesapeake Bay as an Estuary: An introduction. Istvan A. Urcuyo Gettysburg College
 The Chesapeake Bay as an Estuary: An introduction. Istvan A. Urcuyo Gettysburg College The Chesapeake Bay -Native Americans resided on its shores since 8000 B.C. The Chesapeake Bay -Original Native American
CLAM PASS RESTORATION AND MANAGEMENT PLAN BATHYMETRIC MONITORING REPORT NO. 7 Including Interior Bay Dredge Cuts and Tidal Data
 CLAM PASS RESTORATION AND MANAGEMENT PLAN BATHYMETRIC MONITORING REPORT NO. 7 Including Interior Bay Dredge Cuts and Tidal Data Submitted to: Florida Department of Environmental Protection DEP File No.
Bay of Fundy Estuary Profile
 s The is a sub-basin of the Bay of Fundy along the northwestern shore of Nova Scotia and at the western end of the Annapolis Valley. The Annapolis River is the major water source flowing into the estuary.
3.0 Basin and Watershed Characteristics
 3.0 Basin and Watershed Characteristics 3.1 Basin Characteristics 3.1.1 Crystal Lake Crystal Lake, located in the cities of Burnsville and Lakeville (Dakota County), covers an area of approximately 292
EcoLogic Memorandum. TO: Ben Brezell; EDR FROM: Mark Arrigo RE: Possible Impacts of Dredging Snooks Pond DATE: 6/4/07
 EcoLogic Memorandum TO: Ben Brezell; EDR FROM: Mark Arrigo RE: Possible Impacts of Dredging Snooks Pond DATE: 6/4/07 Background EDR P.C. (EDR) has been contracted by a landowner to assess the feasibility
Minnesota Department of Natural Resources Division of Fish and Wildlife Section of Fisheries. Stream Survey Report. Three Mile Creek 2011
 Minnesota Department of Natural Resources Division of Fish and Wildlife Section of Fisheries Stream Survey Report Three Mile Creek 2011 By Joseph D. Stewig Montrose Area Fisheries Office TABLE OF CONTENTS
Upper Iroquois River atershed Management Plan
 2013 Upper Iroquois River atershed Management Plan Daniel M Perkins Jasper County Soil and Water Conservation District 12/30/2013 Table of Contents 1.1 WATERSHED COMMUNITY INITIATIVE... 12 1.2 Project
Coastal Wetlands Protection Act. Fisheries Management, Marine Sanctuaries and Closures
 , STATE AND LOCAL AUTHORITY FOR MARINE PROTECTION (2014). MISSISSIPPI 1 State Authority for Protection Summary of State Authorities Mississippi has several options for conserving marine habitat; however,
Klickitat County Shoreline Master Program Update. Open House March 15, 2017
 Klickitat County Shoreline Master Program Update Open House March 15, 2017 Agenda 6:00 6:10 Welcome 6:10 6:40 Presentation SMP Update Process Shoreline Analysis review 6:40 8:00 Open House Topics SMP Process
What happens to Oregon s tidal wetlands with sea level rise?
 What happens to Oregon s tidal wetlands with sea level rise? Laura Brophy Estuary Technical Group Institute for Applied Ecology Corvallis, OR Laura@appliedeco.org Project maps future tidal wetlands, predicts
What is a River Basin Restoration Priority? 1. Criteria for Selecting a Targeted Local Watershed (TLW) 2. Hiwassee River Basin Overview 3
 2. Hiwassee River Basin Overview 3") Hiwassee River Basin Restoration Priorities 2008 TABLE OF CONTENTS Introduction 1 What is a River Basin Restoration Priority? 1 Criteria for Selecting a Targeted Local Watershed (TLW) 2 Hiwassee River
Hiwassee River Basin Restoration Priorities 2008 TABLE OF CONTENTS Introduction 1 What is a River Basin Restoration Priority? 1 Criteria for Selecting a Targeted Local Watershed (TLW) 2 Hiwassee River
Sustaining the Raritan River Watershed
 Sustaining the Raritan River Watershed 8 th Annual Sustainable Raritan River Conference June 10, 2016 Rick Lathrop Department of Ecology, Evolution & Natural Resources Rutgers School of Environmental and
CORRESPONDENCE/MEMORANDUM
 CORRESPONDENCE/MEMORANDUM State of Wisconsin DATE: November 13, 2012 FILE REF: [Click here and type file ref.] TO: FROM: Mike Donofrio Harpt Lake File Steve Hogler SUBJECT: 2012 Harpt Lake Electrofishing
SOONER LAKE MANAGEMENT PLAN
 SOONER LAKE MANAGEMENT PLAN Background Lake Sooner impounds Greasy Creek, 15 miles south of Ponca City in Noble and Pawnee Counties, Oklahoma (Figure 1). The Grease Creek basin that Sooner Lake impounds
Notebooks or journals for drawing and taking notes
 Title: Have to Have a Habitat Grade Level: 5 th -8 th grade Topic: Trout Habitat Background: The following chart lists the ideal conditions for trout habitat. Dissolved Oxygen: > 7 mg/l ph: 5.5-7 Next