CITY OF CHICAGO 2012 BICYCLE CRASH ANALYSIS. SUMMARY REPORT and Recommendations
|
|
|
- Rodney Casey
- 5 years ago
- Views:
Transcription

1 CITY OF CHICAGO 2012 BICYCLE CRASH ANALYSIS SUMMARY REPORT and Recommendations
2 Summary Report Dear Fellow Chicagoans: Making our streets safer for bicycling will benefit all Chicagoans even if they don t currently ride a bike. Everyone should feel safe on our City s streets, from an eight-year-old learning to ride a bike for the first time to an eightyyear-old who wants to ride to the store. To achieve this goal, it is essential for us to look at all of the factors that contribute to the safety of bicyclists on our streets, and to take the opportunity to make our streets safer for pedestrians and auto users at the same time. ii The Chicago Bicycle Crash Analysis looks at all aspects of bicycle crashes in the city. With this report, we set out to identify all of the factors that contribute to bicycle crashes in Chicago, and then set goals for improvement. The period of study ( ) gives us a clear picture of what we need to achieve the goals of Chicago s Bike 2015 Plan and the Streets for Cycling Plan The following report lays out benchmarks for various types of crash data and information. Locations, time of day, gender and weather are just a few of the elements and factors we looked at to analyze crashes in Chicago. At the end of the report, you will find a comprehensive set of recommendations for improvements to our bike network and our reporting mechanisms that will work to improve bicycling for all Chicagoans and visitors alike. Ride safe, Gabe Klein, Commissioner Chicago Department of Transportation


3 CITY OF CHICAGO 2012 BICYCLE CRASH ANALYSIS Crash Data Summary Report and Recommendations iii Made possible through a grant by the Illinois Department of Transportation

4 Summary Report iv Introduction 1 Key findings 4 Key recommendations 6 Bicycle safety programs in Chicago 8 Trends in bicycle crashes 10 Growth in cycling 12 Fatal and injury crashes 13 Comparison of bicycle and pedestrian crashes 14 Comparison with peer cities 16 Cyclist and motorist characteristics 18 Gender of cyclists 20 Age of cyclists 21 Gender and age of drivers 22 Vehicles and operators 24 Driver action 26 Bicyclist action 27 Vehicle type and use 28 Dooring 29 Helmet Use 30 Hit and run 31 Alcohol 32 When did bicycle crashes occur 34 Crashes by month 36 Crashes by day of week 37 Crashes by time of day 38 Crash location and conditions 40 Location of bicycle crashes 42 Hot spots 44 Intersections 45 Non-Intersection related crashes 46 Dooring on arterial streets 48 Weather, light and road surface conditions 49 Crash reduction strategies 50 Data and reporting solutions 52 Roadway design solutions 54 Education and public awareness solutions 56 Enforcement solutions 58 Policy solutions 59 Countermeasures matrix 60 Acknowledgments 61 References 62

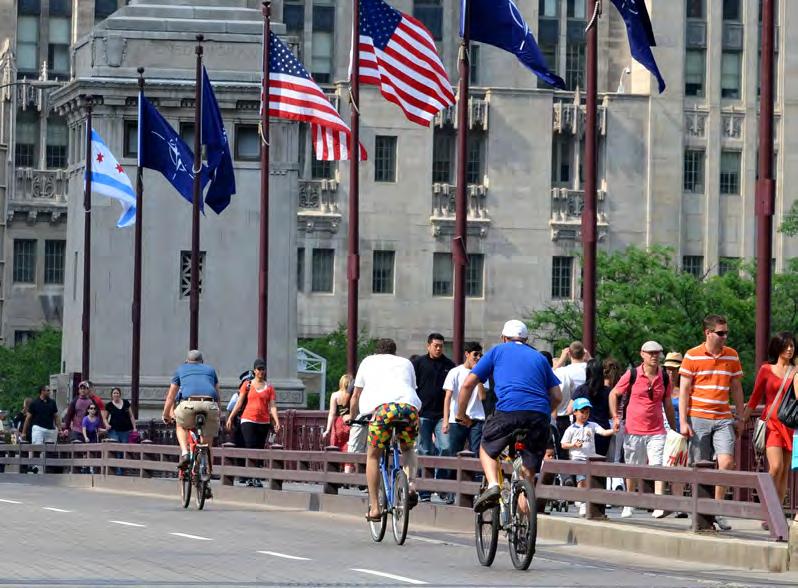
5 INTRODUCTION The City of Chicago has long enjoyed a reputation as one of the best large cities for bicycling in the United States. Through a combination of visionary leadership, thoughtful planning, inter-agency cooperation and dedicated resources, Chicago has created an impressive network of bicycle facilities that reach every corner of the City. Residents currently enjoy a growing network of over 170 miles of on-street bike facilities, quality off-street paths (including the 18.5-mile Lakefront Trail), over 13,000 bike racks and sheltered high-capacity bike parking at many Chicago Transit Authority rail stations. Chicago s Bicycling Ambassadors and other outreach and training programs are among the most robust bicycle education and encouragement initiatives in the country. These investments are beginning to payoff as Chicago is in the midst of a bicycling renaissance. Between 2000 and 2010, Chicago has witnessed a 150 percent increase in the number of Chicagoans bicycling to work as well as implementation of new and innovative bicycling facilities, like protected bike lanes and bike parking corrals. 1

6 Summary Report One key feature of a truly world-class bicycling city is the safety of its bicyclists. Bicycle crashes in Chicago remain a serious concern. In the six-year period between 2005 and 2010, there were nearly 9,000 injury crashes involving bicyclists, with 32 bicyclist fatalities. As a percentage of all traffic crashes, bicycle crashes are on the rise: from 6.7 percent of all crash types in 2005 to 9.8 percent of all crash types in Perhaps the most important point to be made is that with proper street design and behavior change amongst road users, the overwhelming majority of bicycle crashes are preventable. In May 2012, the Chicago Department of Transportation (CDOT) launched Chicago Forward, a 2-year action agenda for improving the way Chicagoans get around. Chicago Forward establishes two goals that are directly focused on bicycle safety: reduce pedestrian and bicycle crash injuries, each by 50 percent within 5 years and increase the total number of adults and children who receive in-person safety education by 5 percent annually. As stated by Mayor Rahm Emanuel: 2 One of my top priorities as mayor is to create a bike network that allows every Chicagoan - from kids on their first ride to senior citizens on their way to the grocery store - to feel safe on our streets. For these reasons and more, the City created this Chicago Bicycle Crash Analysis. The purpose of this report is threefold: 1) to analyze bicycle crashes in the City of Chicago; 2) to identify key areas of concern and 3) to recommend strategies that address these areas of concern, in order to reduce crashes. As bicycling in Chicago continues to grow, the City of Chicago - including its agencies, staff and elected officials - is more committed than ever to making bicycling safer and more accessible for all residents.
 safety data on crashes, injuries and trauma from several sources including the Illinois Department of Transportation (Motor Vehicle Crash File 2005 to")
7 To complete this report, multiple sources of information were utilized. The data used were of two different types: 1) safety data on crashes, injuries and trauma from several sources including the Illinois Department of Transportation (Motor Vehicle Crash File 2005 to 2010 and Dooring Data 2010 to 2011), National Highway Traffic Safety Administration (Fatality Analysis Reporting System), local police reports and the American College of Surgeons (National Trauma Data Bank); and 2) travel trend data to identify patterns in bicycle use from the U.S. Census Bureau (American Community Survey 2005 to 2010 and the Decennial Census 2010) and the Chicago Metropolitan Agency for Planning (Travel Tracker Survey 2007). The research was conducted using summary statistics and graphical methods towards a systematic assessment of the who, what and how of safety risks to bicyclists with the overall goal of supporting safety initiatives and long-term bicycle planning activities. Detailed statistical analysis is left for future research. It is also important to note the challenge of drawing conclusions from the crash data without thorough, accompanying bicycle count data. Knowing the level of exposure of bicyclists in the environment is needed in order to know the relative risk of crashes. Additionally, the number of non-motor vehicle-related crashes is not accurately reported or completely known. These questions need to be answered in future analysis. 3
8 Summary Report KEY FINDINGS EXTENT OF BICYCLING AND HOW HAS IT CHANGED Since 2000, the number of bicycle commuters has increased by 150 percent. Nationally 0.6 percent of workers commuted to work by bicycle in In Chicago, that number was 1.3 percent, or 15,000 cyclists daily. Among peer cities, Chicago has more bicycle commuters per capita than New York or Los Angeles, but fewer than Philadelphia or Seattle. 4 BICYCLE CRASH SAFETY TRENDS, From 2005 to 2010 some 32 cyclists in the City of Chicago were killed in crashes with motor vehicles. The number of fatal crashes decreased by 28 percent from seven in 2005 to five in Almost 9,000 bicyclist injury crashes occurred during the six-year period, or an average of 1,500 per year. The number of injury crashes increased 27 percent from 1,236 in 2005 to 1,566 in WHERE DID CRASHES OCCUR Approximately 55 percent of fatal and injury crashes occurred at intersections. Six of Chicago s 77 Community Areas, those just north and northwest of the Loop, accounted for more than one-third of the bicycle miles traveled and one-third of the bicycle injury crashes.
9 WHEN DID CRASHES OCCUR The largest number of injury crashes occurred between 4:00 and 7:00 P.M., but fatalities were highest between 8:00 P.M. and midnight. There were five fatalities between 4:00 and 7:00 P.M., but nine fatalities between 8:00 P.M. and midnight. Approximately half of all crashes occurred during the summer months of June, July and August. Most bicycle crashes occurred during day light hours and in good weather. Sundays accounted for the highest percentage of fatalities, but the fewest percentage of bicycle injury crashes. CHARACTERISTICS OF CYCLISTS: GENDER AND AGE Overall, males were three times more likely to be involved in a bicycle crash than females. The ratio of male to female crashes was lowest in the age group and increased steadily with age. The ratio of male to female crashes was 12 times higher for males than females in the age group. 5 COMPARING BICYCLE CRASHES WITH PEDESTRIAN CRASHES While the number of motor vehicle crashes with pedestrians declined, crashes involving bicycles increased. Hit and run crashes accounted for 25 percent of both injury and fatal bicycle crashes, while they accounted for 41 percent of pedestrian injury crashes and 33 percent of pedestrian fatal crashes. ADDITIONAL FINDINGS The most common motorist error was failure to yield. The most common bicyclist error was riding against traffic. A helmet was known to be worn in only one fatal crash. Taxis were involved in 1 of 12 injury crashes.
10 Summary Report KEY RECOMMENDATIONS ROADWAY DESIGN SOLUTIONS Implement intersection design improvements at high crash locations. Expand the network of protected bike lanes. Institute traffic calming techniques to slow speeds at severe crash locations. 6 EDUCATION AND MARKETING SOLUTIONS Enhance motorist and bicyclist direct education programs. Expand targeted enforcement outreach. Create broad-reaching marketing campaigns targeting high risk behaviors and road users. Expand commercial vehicle operator training. Institute enhanced driver education. DATA AND REPORTING SOLUTIONS Collect comprehensive, multi-year bicycle counts. Develop mechanisms for collecting non-motor vehicle related crash data. Regularly update and publish bicycle crash data and implement data collection improvement strategies. Develop and implement outcomes evaluation for non-infrastructure initiatives.

11 ENFORCEMENT SOLUTIONS Improve police data and reporting for fatal and serious injury crashes. Increase the number of targeted enforcement events. POLICY SOLUTIONS Improve inter-agency partnerships and collaboration. Fully implement the Child Safety Zone initiative near schools and parks. 7
12 Summary Report 8 BICYCLE SAFETY PROGRAMS IN CHICAGO Beginning in 1992 with the publication of the Bike 2000 Plan, the City of Chicago has consistently demonstrated its commitment to enabling and encouraging bicycling as a safe, healthy, environmentally-friendly and fun way to travel. Over the last two decades, the Chicago Department of Transportation s Bicycle Program has developed a robust, multi-faceted approach to creating a better bicycling environment for the public. CDOT s Bicycle Program focuses on a mix of infrastructure and programmatic approaches for improving the bicycling experience in Chicago. Current initiatives include: On-street bikeway installation Multi-use trail development Bicycle rack installation Bicycling and Pedestrian Ambassadors and Junior Ambassadors Programs Share the Road Outreach events (in partnership with the Chicago Police Department and Chicago s Aldermanic Offices) Training videos and curricula for taxi drivers, Chicago Transit Authority bus operators and Chicago Police Academy cadets Bicycle safety publications Chicago Bike Map Mayor s Bicycle Advisory Council Chicago is fortunate to have the support of other City, County, Regional and State agency partners that also prioritize and promote bicycling and bicycle safety, including: Chicago Transit Authority (CTA), Metra Rail and Pace Suburban Bus Service Chicago Park District and The Forest Preserve District of Cook County Chicago Police Department Bicycle Registry Chicago Department of Cultural Affairs and Special Events Bike Chicago Initiative Chicago Metropolitan Agency for Planning Cook County Highway Department Illinois Department of Transportation

13 Under the leadership of Mayor Rahm Emanuel and Department of Transportation Commissioner Gabe Klein, CDOT s Bicycle Program stands poised to enter a new era for bicycling in the City, moving toward bicycling as a mainstream transportation mode for all Chicagoans. The road map for the future of bicycling in Chicago is outlined in a number of long-term plans and documents, including: Chicago Forward: Department of Transportation Action Agenda Chicago Bike 2015 Plan Streets for Cycling 2020 Plan Bike Share Program Chicago Complete Streets Design Guide 9

14 Trends in Bicycle Crashes

15 Growth in cycling 12 Fatal and injury crashes 13 Comparison of bicycle and pedestrian crashes 14 Comparison with peer cities 16 C


16 Trends in bicycle crashes and rates Summary Report 12 GROWTH IN CYCLING A better understanding of bicycle crash data requires an assessment of the growing popularity of bicycling. The most reliable source of mode share data is the U.S. Census Bureau which reports the number of commuters by mode of transportation. This data shows that the number of workers commuting to work by bicycle increased from 5,956 to 15,096 between 2000 and 2010 (Figure 2). Since 2000, Chicago s bicycle commuter mode share more than doubled, from 0.5 percent to 1.3 percent. Further, the City of Chicago accounted for only 21 percent of all Illinois commuters, but 39 percent of the state s walkers and 42 percent of those who bicycle to work. Figure 2: Number of daily bicycle commuters, City of Chicago, During the first 10 years of this millennium, there was a 150% increase in the number of Chicagoans commuting to work by bicycle

17 FATAL AND INJURY CRASHES From 2005 to 2010 there were a total of 32 fatal bicycle crashes and 8,861 injury crashes. Injury crashes are categorized as A, B and C, with Type A crashes representing incapacitating injury, Type B representing non-incapacitating but serious injury, and Type C crashes being the least serious with only the possibility of injury. The number of fatalities dropped from seven in each of the first two study years to five in each of the latter three years (Table 1). During this period, fatalities in all modes of travel During the study period bicycle crashes increased as a percentage of all transportation crashes declined in Chicago and the bicycle-crash percentage of all crashes has remained at about three to four percent. During the study period bicycle injury crashes showed an overall increase from 2005 to The highest number was in 2007 and the lowest number was in 2005 with the number of crashes in 2006 and 2009 being essentially the same. Most importantly, bicycle injury crashes as a percent of all transportation 13 injury crashes show signs of an increasing trend from less than seven percent in 2005 to about ten percent in Fatal Crashes Injury Crashes Mode TOTAL Bicycle All Modes Percent of all Modes 4% 4% 2% 3% 4% 4% 3% Bicycle 1,236 1,385 1,782 1,506 1,386 1,566 8,861 All Modes 18,505 18,516 17,541 15,599 15,645 15, ,687 Percent of all Modes 6.7% 7.5% 10.2% 9.7% 8.9% 9.9% 8.7% Table 1: Fatal and injury crashes in the City of Chicago,
. The number of bicycle injury crashes peaked in 2007 while the number of pedestrian injury crashes peaked in 2006.")
18 Trends in bicycle crashes and rates Summary Report COMPARISON OF BICYCLE AND PEDESTRIAN CRASHES The number of bicycle crashes in Chicago increased over the study period in contrast to the number of pedestrian crashes (Figure 1). The number of bicycle injury crashes peaked in 2007 while the number of pedestrian injury crashes peaked in Bicycle injury crashes have increased by 27% while pedestrian injury crashes have declined by 9% Figure 1: Pedestrian and bicycle injury crashes,
19 15
20 Trends in bicycle crashes and rates Summary Report COMPARISON WITH PEER CITIES For a meaningful comparison of crash rates, Chicago needs to be compared to cities that most resemble it in population, density and transit use. College towns were not used as peer cities because they tend to have the highest proportion of commuters using bicycles, and large cities commonly have a much lower percentage. For comparison, Chicago s six peer cities were selected: Seattle, Philadelphia, Los Angeles, New York, Baltimore and Milwaukee. Chicago ranks third on propensity to use bicycles to commute amongst its peers. 4.0% % 3.0% 2.5% Among peer cities Chicago ranks third in bicycle commuters, second among the 12 largest US cities 2.0% 1.5% 1.3 % 1.0% 0.5% 0.0% Sea-le Philadelphia Chicago Los Angeles New York BalBmore Milwaukee Figure 3: Bicyclists as a percent of all daily commuters, Peer Cities, 2010
21 2.00% 1.80% 1.60% 1.40% 1.20% 1.00% 0.80% 0.60% Among the twelve largest cities in the nation, eight have a 2010 bicycle mode share greater than 0.5 percent (Figure 4). Chicago s mode share ranks second highest. Cities that are among the twelve largest that are not included in Figure 4 are Houston, Jacksonville, San Antonio and Dallas. Dallas has a mode share of less than 0.2 percent. 0.40% 0.20% 0.00% Figure 4: Bicyclists as a percentage of all daily commuters,12 largest cities with percentages over 0.5, 2010 (8 cities depicted) 100% 90% 80% 70% 60% 50% 40% 30% 20% 10% Philadelphia Chicago San Diego Los Angeles New York San Jose Phoenix Indianapolis The percent change in the mode share of bicycle commuters during the study period is shown in Figure 5. Nine of the twelve largest cities are depicted. On this measure, Philadelphia s mode share doubled and Chicago s increased by 84 percent. Indianapolis and San Antonio also had large percentage increases but were not included as their base mode share was only 0.1 percent and a modest increase resulted in a high percentage increase. Dallas, Jacksonville and Phoenix all show decreases, though the decreases may be statistically insignificant. 17 0% Philadelphia Chicago Bal:more San Diego Sea@le San Jose Los Angeles New York Houston Figure 5: Highest percent increases in the proportion of commuters using bicycles among peer and largest 12 cities, (9 cities depicted) Chicago ranks second among large and peer cities in percent increase in commuting by bicycle

22 Cyclist & Motorist Characteristics

23 Gender of cyclists 20 Age of cyclists 21 Gender and age of motorists 22
.")

24 Cyclist characteristics Summary Report GENDER OF CYCLISTS Males account for approximately two-thirds of all miles cycled by Chicago residents but account for threequarters of injury crashes and have twice the fatality rate as females (Table 2). However, males experienced 40 percent more injury crashes per mile cycled (the miles cycled are derived from a dataset with a moderately small sample). Share of Miles Cycled Percentage Injured Fatalities per 100 Million Miles Injury Crashes per 100 Million Miles Female 31% 25% 2.8 1,000 Male 69% 75% 5.5 1,400 Ratio Total 100% 100% 4.6 1,300 Table 2: Injuries and fatalities by miles cycled (miles estimated from CMAP Travel Tracker data, 2007) 20 Males bike more than females and had proportionately higher rates of injury crashes
. Those 20-24 years old have the greatest likelihood of being involved in crash.")
25 AGE OF CYCLISTS At every age, except for cyclists less than five years old, males had more injury crashes compared to females. Males aged and appeared to have a disproportionately greater number of crashes than females (Figure 6). Those years old have the greatest likelihood of being involved in crash. 21 Males ages and had a disproportionately greater number of crashes Figure 6: Annual average injury crash rate by age per 100,000 residents
 and accounted for an even greater percent of fatal bicycle crashes (70 percent, Table 4).")
26 Cyclist characteristics Summary Report GENDER AND AGE OF MOTORISTS More crashes involved male drivers than female. Male motorists were involved in approximately 64 percent of injury crashes (Table 3) and accounted for an even greater percent of fatal bicycle crashes (70 percent, Table 4). For both male and female drivers involved in injury crashes, over 60 percent were between the ages of 25 and 44. Females, however, accounted for the majority of fatal crashes for drivers aged 55 and older. Injury Crashes Percentage of Injury Crashes Percentage of Known Injury Crashes Male % 63.9% Female % 36.1% Unknown % - 22 Table 3: Gender of drivers involved in bicycle injury crashes Age Male Motorists Female Motorists Total Percent % % % % % % Total Percent 70% 30% 100% Table 4: Age of drivers involved in fatal bicycle crashes

27 23

28 Vehicles & Operators

29 Motorist action 26 Bicyclist action 27 Vehicle type and use 28 Dooring 29 Helmet use 30 Hit and run 31 Alcohol 32
 as well as fatal crashes.")
30 Motorist characteristics Summary Report MOTORIST ACTION Drivers Failure to yield the right of way is a major contributing factor to bicycle crashes. These crashes accounted for approximately 40 percent of the bicycle injury crashes (Table 8) as well as fatal crashes. 26 Cause of Crash Year Driver action Total Percent None , % Failed to yield , % Disregarded control % devices Improper turn % Other , % Total 949 1,066 1,340 1,116 1,076 1,208 6, % Table 8: Driver action in bicycle injury crashes, Failure to yield by a driver occurred in 40% of bicycle crashes

31 BICYCLIST ACTION Approximately 40 percent of the bicycle injury crashes occurred when the bicyclist was traveling with traffic (Table 9) and 10 percent when the bicyclist was traveling against traffic. At signalized intersections, however, nearly twice as many crashes occurred when bicyclists were crossing against the traffic signal. 10% of bicycle crashes occurred when a bicyclist traveled against traffic Bicyclist Action Walking/riding with traffic Crossing with signal Walking/riding against traffic Crossing against signal Enter from drive/alley Other Injury Type A - Incapacitating B - Non-incapacitating C - Possible injury Total Percent 288 1,624 1,084 2, % % % % % % 27 Total 751 3,857 2,807 7, % Table 9: Bicyclist action in bicycle injury crashes,
 and vans were the second and third most common vehicles involved in bicycle crashes.")
32 Motorist characteristics Summary Report VEHICLE TYPE AND USE Passenger cars were involved in the majority of bicycle crashes (Table 6). Sports utility vehicles (SUVs) and vans were the second and third most common vehicles involved in bicycle crashes. Of these three predominant types of vehicles, only the SUVs crash rates increased during the period from 87 to 165. Most of the vehicles involved in bicycle crashes were used for personal travel purposes (Table 7). Taxis ranked second with buses third. Taxis and for-hire uses accounted for approximately 1 in 12 crashes. City buses were involved in 1.6 percent of all bicycle crashes. 28 Vehicle Type Total Percent Passenger car ,109 5, % SUV % Van/mini-van % Other % Total 1,179 1,232 1,547 1,315 1,269 1,540 8, % Table 6: Vehicle type involved in bicycle injury crashes, Vehicle Type Total Percent Personal , ,024 5, % Taxi/for hire % City bus % Other % Total 1,032 1,072 1,376 1,151 1,089 1,304 7, % Citywide, taxis were involved in 8.4% of bicycle crashes and 6.7% of pedestrian crashes Table 7: Vehicle use during crash,


33 DOORING The term dooring applies to incidents in which the cyclist is riding in a legal place and a person in a stationary vehicle opens their door causing a crash. These crashes can result in serious injuries. In particular, Type B non-incapacitating injury crashes occur more frequently in dooring crashes (Table 11). At the time of this analysis there was insufficient overlapping bicycle crash and dooring data to report the percentage of crashes due to dooring. Comprehensive bicycle crash data are available through 2010, while dooring data are available only for 2010 and Injury Type Non-dooring crashes Dooring crashes A - Incapacitating 11% 8% B - Non-incapacitating 51% 61% C - Possible injury 38% 31% Table 11: All crashes vs. dooring bicycle crashes, by injury type Collectively, Type A and B injuries were proportionately higher in dooring crashes


34 Motorist characteristics Summary Report HELMET USE In the 29 fatal crashes for which we have helmet use information, only one of the bicyclists is known to have been wearing a helmet. It is important to note that data from the remaining reports did not indicate clearly whether or not a helmet was worn. For this reason, this report cannot accurately analyze the impact of helmet use in fatal crashes in Chicago. However, national data indicates that only 25 percent of cyclists taken to trauma centers were wearing helmets. 30 Only one fatally injured cyclist is known to have worn a helmet
.")

35 HIT AND RUN Twenty-five percent of all bicycle crashes were hit and run crashes, where the motorist failed to remain at the crash scene. This is considerably lower than the proportion of pedestrian injury and fatal automotive hit and run crashes (Table 5). Even though there were only half as many hit and run crashes for bicyclists as there were for pedestrians, there was 1 hit and run bicycle crash on average every day. 25% of bicycle crashes were hit and runs Hit and run crashes Fatal crashes Injury crashes Bicycle crashes 25% 25% Pedestrian crashes 40% 33% 31 Table 5: Hit-and-run crashes as a percentage of all crashes On average, there was 1 hit and run bicycle crash per day

 is available, eight bicyclists showed measurable alcohol in their system. Four had levels over 0.")
36 Motorist characteristics Summary Report % of bicyclists in fatal crashes were over the legal limit for blood alcohol content ALCOHOL Of the drivers involved in fatal crashes, six were tested for alcohol and one refused. Four did not have alcohol in their system and the two that did had levels less than the legal limit of Of the 27 bicyclist fatalities for which Blood Alcohol Content (BAC) is available, eight bicyclists showed measurable alcohol in their system. Four had levels over 0.08, the legal limit for motor-vehicle drivers in Illinois. Using 0.08 as a benchmark, the percentage for bicyclists riding under the influence is 14.8 percent. This compares to 32 percent for motor-vehicle fatalities in the U.S. and 35 percent in Illinois in 2009.

37 33

38 When Did Bicycle Crashes Occur

39 Crashes by month 36 Crashes by day of week 37 Crashes by time of day 38

40 When did bicycle crashes occur Summary Report CRASHES BY MONTH Bicycle crashes follow a seasonal cycle, increasing sharply from February to July and declining just as quick in the fall (Figure 7). While fatal crashes peaked in the summer months, they continued to occur during the winter, from December to February. Approximately 45% of the injury and fatal crashes occurred during the summer 36 20% 18% 16% 14% Injury crashes Fatal crashes 12% 10% 8% 6% 4% 2% 0% January February March April May June July August September October November December Figure 7: Fatal and injury crashes by month, 2005 to 2010
.")
41 CRASHES BY DAY OF WEEK While there are no large differences between weekdays, injury crashes tended to occur to a greater degree on Friday. Friday had the highest percentage of serious crashes and collectively the largest percentage of overall crashes (Figure 8). Sunday had the fewest crashes, perhaps a reflection of overall lower roadway usage levels by both bicycles and cars. Saturday is the second lowest day, but not noticeably different than Monday. While Sunday had the smallest percentage of crashes, it also had the largest percentage of fatal bicycle crashes at seven. Of the seven, four occurred during darkness. While this may be attributable to idiosyncrasies associated with the small percentage of fatalities during the study period it merits further study. 25% Injury crashes 37 20% Fatal crashes 15% 10% 5% 0% Monday Tuesday Wednesday Thursday Friday Saturday Sunday Figure 8: Fatal and injury crashes by day of week,
, with one important exception:")


42 When did bicycle crashes occur Summary Report CRASHES BY TIME OF DAY The percentage of bicycle crashes increased throughout the day (Figure 9), with one important exception: injury crashes declined in the late evening while fatal crashes continued to increase. An observation of Figure 9 reveals that 40 percent of injury crashes occurred between 3:00 and 8:00 P.M. However, a more detailed analysis shows that the 5:00 P.M. hour had the highest number of crashes during the day. There was also a small peak during the 8:00 A.M. hour. 38 A disproportionate percentage of fatalities occurred in the evening between 8:00 P.M. and midnight Figure 9: Fatal and injury crashes by time of day,

43 39

44 Crash Locations & Conditions

45 Location of bicycle crashes 42 Hot spots 44 Intersections 45 Non-Intersection related crashes 46 Dooring on arterial streets 48 Weather, light and road surface conditions 49
.")

46 Crash location and conditions Summary Report LOCATION OF BICYCLE CRASHES The highest number of fatal and serious bicycle injury crashes occurred in community areas north of the Loop (Figure 10). High levels of bicycle use in these areas combined with the proximity to the Loop and the lakefront may be factors. 6 of 77 Chicago community areas accounted for 1/3 of the injury crashes 42 Figure 10: Fatal and serious bicycle injury crashes,
.")
47 The six community areas with the highest number of fatal and serious injury (Type A) crashes also had high bicycle usage. These community areas had 34 percent of fatal and serious crashes and 37 percent of all injury crashes, however they accounted for an estimated 40 percent of the miles bicycled (Table 12). 6 of 77 Chicago community areas accounted for approximately 40% of the bicycle miles traveled 43 Chicago Community Bicycle crashes Miles / day Area (CCA) Fatal + Type A Total Total of six CCAs with greatest no. of 333 3, ,000 crashes Rest of city 643 5, ,000 City total 976 8, ,000 Six CCAs as percent of city total 34% 37% 40% Table 12: Bicycle crashes and miles cycled in the six highest community areas with the most crashes (by crash location; miles by place of residence)
.")

48 Crash location and conditions Summary Report HOT SPOTS Downtown The largest concentration of bicycle injury crashes were located within and north of downtown Chicago (Figure 11). There were also large pockets of crashes on primary diagonal streets that serve the Loop area, including Milwaukee Avenue, Lincoln Avenue, and Clark Street. One particular hot spot can be seen where Lincoln and Clark converge. There were also smaller hot spots around the city, such as the pocket in Uptown and on Archer Avenue. 44 Figure 11: Fatal and Type A injury crash hot spots,
49 INTERSECTIONS The majority of bicycle crashes occurred at intersections (Table 10). Approximately 55 percent of bicycle injury and fatality crashes occurred at intersections. The intersections with the highest percentage of bicycle crashes included Halsted, Milwaukee and Fullerton Avenues. Additionally, the intersection of the Lakefront Trail and Montrose Avenue had more than 15 crashes in the study period. 55% of bicycle crashes occurred at intersections, with complex intersections being the most hazardous 45 Intersection Fatal Crashes Injury crashes related Number Percent Number Percent Yes % 4, % No % 4, % Total % 8, % Table 10: Bicycle fatal and injury crashes at intersections Figure 12: Intersections with large numbers of injury crashes,
 crashes and Type C (possible injury) crashes than arterials. The lower speeds on local streets may be a factor.")

50 Crash location and conditions Summary Report NON-INTERSECTION RELATED CRASHES Arterial roadways and local streets had the same number of fatal and serious injury crashes. However, local streets had 46 percent more Type B (non-incapacitating) crashes and Type C (possible injury) crashes than arterials. The lower speeds on local streets may be a factor. See Tables 13 and Downtown Street From To Length (miles) Crash/ Mile Milwaukee North Division Clark Racine Fullerton Milwaukee Fullerton Armitage Halsted Diversey North Damen North Chicago Lawrence Ashland Sheridan Ashland Belmont Fullerton Lincoln Lawrence Irving Park Table 13: Crashes identified as non-intersection related, Figure 13: Fatal and injury non-intersection related crashes,


51 Street From To Length (miles) Crash/ Mile Michigan Lake Randolph La Salle Randolph Calhoun Michigan Ontario Superior Halsted Randolph Adams Division Orleans Clark Kinzie Clark State Chicago Franklin La Salle Crash severity decreases with vehicle speed Table 14: Crashes identified as non-intersection related, Downtown Chicago, `Figure 14: Fatal and injury non-intersection related crashes, Downtown Chicago,

52 Crash location and conditions Summary Report 48 DOORING ON ARTERIAL STREETS The 15 arterial streets with the largest number of dooring crashes are shown in Table 15. These arterials accounted for 52 percent of all dooring crashes. Table 15 also reveals the number of overall injury and fatal crashes on each of the arterial streets. The ratio in the last column of Table 15 identifies which of the arterials have disproportionately high and low proportion of dooring crashes compared to bicycle injury crashes. The ratio is computed as an effort to account for variations in the amount of bicycle traffic volume on each street. Lincoln, Clark and Milwaukee are the arterials with the highest rates of dooring crashes. Fullerton, Chicago, Western and Ashland Avenues have the lowest ratios. Arterials not on the top-15 list are Armitage with nine and State with six dooring crashes. Arterial Fatalities Injury crashes Dooring Ratio* Milwaukee Halsted Clark Western Ashland Damen North Fullerton Chicago Division Diversey Belmont Lincoln California Kedzie *(Dooring X 100 /Injury crashes) Table 15: Dooring crashes on the 15 arterials with the higher number of bicycle crashes


53 WEATHER, LIGHT AND ROAD SURFACE CONDITIONS Nearly 90 percent of bicycle crashes occurred when the roadway was dry and the weather was clear (Table 16). However, amount of light was a factor on the percentage of crashes, with 22 percent of crashes and 40 percent of fatalities occurring after sunset. Condition Fatal Crashes Injury Crash Type Injury Total Percent Known A B C Weather Clear ,932 2,939 7,678 89% Light Daylight ,269 2,479 6,383 72% Evening ,913 22% Road surface Dry ,875 2,878 7,555 89% 49 Table 16: Weather, light and road surface conditions during bicycle crashes,

54 Crash Reduction Strategies

55 Roadway design and engineering solutions 52 Education and marketing solutions 54 Data and reporting solutions 56 Enforcement solutions 58 Policy solutions 59 Counter measures matrix 60

56 Crash reduction strategies Summary Report 52 A full understanding of the implications of bicycle crash data is the critical first step in improving bicycle safety in Chicago. But in order to reduce bicycle crashes by 50 percent in 5 years, the aim of this report is the identification of strategically focused solutions and countermeasures to reduce crashes, complete with suggestions for implementation. The following set of Strategic Recommendations puts forth key activities for addressing Chicago s top bicycle crash concerns and improving conditions for bicyclists of all ages and abilities. 1 Roadway Design and Engineering Solutions There has been extensive research conducted in recent years on ways to design, construct and maintain streets for bicycle safety. National resources including the Federal Highway Administration s BIKESAFE project (2006), the National Association of City Transportation Officials Urban Bikeway Design Guide (2011), as well as the City of Chicago s Complete Streets Design Guide provide excellent technical guidance on facility selection and implementation. With regard to the key findings in this report, the following are recommended as areas for highest prioritization: Implement intersection design improvements at high crash locations: 55 percent of bicycle crashes in Chicago occur at or near intersections. Designing intersections to encourage correct roadway behavior for both drivers and bicyclists has the potential to dramatically reduce these crashes (SWOV 2010; Summala et al 1996). Possible treatments include: a. Bike boxes b. Intersection markings including through bike lanes, transitional dashing and colored pavement c. Combined bike lane/right turn lanes d. Bike signals e. Refuge islands f. Turning restrictions g. In-street signage h. Leading pedestrian intervals i. Lighting
.")
57 Expand the network of protected bike lanes: Providing dedicated spaces for bicyclists to ride beyond intersections, especially physically separated on-street bike lanes, has been proven to not only improve safety for cyclists, but for all roadway users (Ewing and Dumbaugh 2009; Marshall and Garrick 2011). The Chicago Bicycle Program is already pursuing the following innovative strategies, outlined in the Streets for Cycling Plan 2020:` a. Separated bikeways b. Buffered bike lanes c. Marked shared lanes d. Neighborhood Greenways e. Bike superhighways Institute traffic calming techniques to slow speeds at the most severe crash locations: Vehicle speed has been shown to be a key factor nationally in crash severity (Ewing and Dumbaugh 2009; Garder 2004; Zegeer et al 2002); 40 percent of crashes in Chicago occurred due to a vehicle s failure to yield. By designing streets for slower speeds, crash injuries and fatalities can be reduced. The following traffic calming features should be considered: a. Reduced curb radii b. Sight distance improvements c. Sidewalk bump outs d. Speed tables or humps e. Reducing and/or narrowing vehicle travel lanes 53

. The CDOT Bicycle Program is nationally renowned for having the longest-running Bicycle Ambassador Program in the U.S.")
58 Crash reduction strategies Summary Report 2 Education and Marketing Solutions Unlike infrastructure solutions, education and marketing strategies lack a comparable level of research that illuminate effective programs and best practices. Raising awareness around crucial safety issues for motorists and bicyclists will improve interactions among these users and enhance the safety of roadway environments (Mineta Transportation Institute 2012, Ch. 7). The CDOT Bicycle Program is nationally renowned for having the longest-running Bicycle Ambassador Program in the U.S. The Bicycle Program is encouraged to research models of social behavior change and successful case studies in other cities in order to enhance the impact of these efforts (City of Chicago 2012a; Mineta Transportation Institute 2012, Ch. 7; Bandura 2004). 54 Expand Targeted Enforcement Outreach: Directly engaging drivers and bicyclists with safety messages while they are in the traffic environment is an important strategy for targeting dangerous roadway behaviors. Issuing citations and warnings for dangerous behavior can lower the potential for crashes. With the continued cooperation of the Chicago Police Department and aldermanic offices, these efforts may be expanded to include: a. Targeted education and outreach activities at locations with disproportionately high numbers of bicycle crashes b. Outreach targeting specific driver and bicyclist errors most highly implicated in crashes, including: Motorist failure to yield Bicyclist crossing against the signal Bicycling without a helmet Bicycling at night without front or rear lights Taxi/bicyclist interactions
.")
59 Expand commercial operator training: CDOT s current training programs for taxi drivers, CTA bus operators and the Chicago Police Department have been effective in delivering education about bicycle-related laws and procedures (City of Chicago 2012a). Yet taking into account the high proportion of crashes involving taxis, and the growing number of crashes involving large vehicles, there is room for improvement. Education for all commercial operators could be made mandatory; including all City of Chicago vehicle operators and hired car service drivers. driver education with this information will help prepare new drivers to operate safely on and off bikes. Create broad reaching marketing campaigns targeting high risk behaviors and road users: Large-scale media campaigns can be effective in educating the general public about the costs and casualties of traffic crashes. The age group that makes up the largest number of crashes involving bicycles in Chicago is 16-35, which is the primary age group targeted for most media advertising on television and online. New York City s Biking Rules and Chicago s recent It s Up to You pedestrian safety initiative are examples of wide-reaching, multi-faceted campaigns that effectively increase understanding of this issue (Transportation Alternatives 2012; City of Chicago 2012c). 55 Promote Enhanced Driver Education: Driver education programs allocate little attention to sharing the road with bicyclists and pedestrians (Chicago Public Schools 2011, Illinois Driving School 2012), yet cyclists aged make up the largest age group of bicycle crashes. Supplementing standard Enhancement direct motorist and bicyclist education programs: With the planned increase in bikeways installation citywide, motorists and bicyclists both will require additional education to learn to safely share the road. Enhancement could include: a. Increase opportunities for on-bike and traffic cycling instruction b. Increase opportunities for routine and repeated exposure to safety messaging

60 Crash reduction strategies Summary Report 56 3 Data and Reporting Solutions A consistent challenge faced by transportation professionals and researchers alike, particularly with regard to non-motorized modes, is a lack of availability of comprehensive data. Ridership levels depict bicyclists relative exposure to potential crashes, which in turn provides perspective to overall crash rates. Drawing firm conclusions from crash data without comparably reliable exposure data may lead to flawed assumptions. The Chicago Bicycle Program has begun recording location-specific ridership data including monthly counts at 6 sites just outside the central business district, and quarterly cordon counts at locations entering and exiting the Loop (City of Chicago 2012b); however, this information is not available for the study period. Mechanisms for the collection of a variety of data types should be developed to enable a holistic impression of the bicycle crash environment. Collect comprehensive, multi-year bicycle counts: Having reliable bicycle usage and exposure data is an absolute necessity for a complete understanding of crashes in Chicago (Klop and Khattak 1999). The crash analysis in this report is limited without the ability to consider bicycle ridership levels. The Chicago Bicycle Program could consider emerging automated bike count technologies as they become available. Bike counts should be controlled for location, time of year, time of day and weather conditions. Focus where possible, should be placed on priority intersections and roadway segments.
, they may comprise a larger percentage of overall crashes than do motor vehicle-related crashes")
61 Develop mechanisms for collecting nonmotor vehicle related crash data: The data analyzed in this report do not include non-motor-vehicle-related crashes, such as pedestrian/pedalcycle crashes. While these types of crashes may not often result in severe injuries or fatalities (Chong et al 2009), they may comprise a larger percentage of overall crashes than do motor vehicle-related crashes in Chicago. Specifically crashes occurring on the Lakefront Trail, on sidewalks and other off-road facilities are in need of analysis and countermeasures. 57 Regularly update and publish bicycle crash data and improvement strategies: Conducting this type of analysis on an annual basis will allow the CDOT Bicycle Program to gauge changes in crash factors and issues in order to better focus safety resources. Objectives should include: a. Producing a comprehensive bicycle crash report every 5 years b. Expanding future analysis to correlate traffic speed and volume data with crashes Develop and implement outcome evaluations for non-infrastructure programs and initiatives: There is little available published data on the impact of bicycle safety education programs (Mineta Transportation Institute 2012, Ch 4). Equally important to understanding roadway design implication on crashes is the ability to assess non-engineering strategies to gauge their effectiveness. Partnering with a qualified research institution on developing an objective evaluation plan for programmatic work will help in making informed investments in these important strategies.

62 Crash reduction strategies Summary Report 4 Enforcement Solutions Improve police reporting for fatal and serious injury crashes: While the majority of reports completed by the Chicago Police Department for bicyclerelated crashes are thorough and informative, a small number of important data categories are often incomplete or inadequate. Specifically, improve reporting regarding: a. Motorist and bicyclist impairment b. Motorist and bicyclist distraction, including cellphone use c. Helmet use 58 Increase targeted bike lane enforcement actions: When motor vehicles park or drive in a marked bike lane, bicyclists are forced to ride into the vehicle travel lane, putting them at increased risk for crashes (Reynolds et al 2009). Similarly, bicyclists must stop for pedestrians in crosswalks, especially when crosswalks intersect bike lanes. Considering Chicago s ambitious goals for installation of new bikeways, these types of violations may increase. For these reasons, targeted enforcement for both motorists and bicyclists at strategic locations (like crash hot spots and new bikeway facility installations) is recommended, using a phased approach of publicity first, followed by warnings and finally citations.
. This concept should be expanded to include a venue for routine inter-agency coordination on issues that relate to bicycle safety.")

63 5 Policy Solutions Improve inter-agency partnerships and collaboration: The Mayor s Bicycle Advisory Council has long provided a forum for citizens and Bicycle Program staff to share updates, exchange ideas and express concerns (City of Chicago 2012d). This concept should be expanded to include a venue for routine inter-agency coordination on issues that relate to bicycle safety. Participating agencies include the Chicago Park District, Office of Emergency Management and Communications, Chicago Police Department, Department of Business Affairs and Consumer Protection and Department of Housing and Economic Development. Implement Chicago s Complete Streets Policy and Children s Safety Zone Policies: The passage of Chicago s Children s Safety Zone Ordinance and adoption of a holistic Complete Streets Policy are important first steps in prioritizing the safety of the City s most vulnerable citizens (City of Chicago 2012e). To realize their full efficacy, good policies must be implemented in a thorough and timely manner. This will complement many recommendations in this report. 59
64 Crash reduction strategies Summary Report 60 Countermeasures Matrix Crash Factors Driver failure to yield Bicyclist crossing against signal Intersection crashes Creative intersection design Solutions Design Education Enforcement Policy Protected bikeways Traffic calming Ambassador programs Share the road outreach Public awareness marketing campaigns Commercial operator training Expanded driver education Improved police reporting Bike lane targeted enforcement actions Inter-agency partnerships X X X X X X X X X X X X X X X X X X X X X X X X X X X X X X X X X X Dooring X X X X X X X X X Nighttime crashes Lack of helmet use Driver and bicyclist impairment X X X X X X X X X X X X X X X X X X X X X X X Child Safety Zones Taxi crashes X X X X X X X

65 ACKNOWLEDGMENTS The authors would like to thank the following individuals and agencies for their valuable contributions to this report: CHICAGO DEPARTMENT OF TRANSPORTATION Luann Hamilton, Deputy Commissioner Ben Gomberg, Bicycle Program Coordinator Charlie Short, Bicycling Safety and Education Manager Mike Amsden, AICP, Bikeways Program Carlin Thomas, Share the Road Coordinator UNIVERSITY OF ILLINOIS AT CHICAGO Piyushimita (Vonu) Thakuriah, Professor Department of Urban Planning and Policy Dr. Siim Soot, Executive Director (Retired) Urban Transportation Center Lu Gan, Graduate Research Assistant ACTIVE TRANSPORTATION ALLIANCE Melody Geraci, Deputy Executive Director Amanda Woodall, Policy Manager Paul Halupka, Graphic Design Manager Patrick Knapp, Planner Brandon Whyte, Planning Intern OTHER CONTRIBUTORS Lori Midden, Illinois Department of Transportation Parry Frank, Chicago Metropolitan Agency for Planning Tracie Smith, Children s Memorial Hospital, Chicago Chrystal Price, American College of Surgeons William Vassilakis, formerly at the University of Illinois at Chicago Dr. Caitlin Cottrill, Postdoctoral Research Associate at Massachusetts Institute of Technology This report was made possible through a grant by the Illinois Department of Transportation 61
66 Summary Report 62 REFERENCES Bandura, Albert Health Promotion by Social Cognitive Means. Health Education & Behavior, Vol. 31 (2): (April 2004). City of Chicago. 2012a. Chicago Department of Transportation: Chicago Bicycle Program. (accessed August 22, 2012) b. Chicago Department of Transportation: Chicago Bicycle Program. Bicycle Counts. bikecounts.php (accessed August 22, 2012) c. Chicago Pedestrian Safety Campaign. About the Campaign. (accessed August 23, 2012) d. Bike Plan 2015 City of Chicago. Mayor s Bicycle Advisory Council. (accessed August 23, 2012) e. Office of the City Clerk: Legislative Information Center. Establishment of Children s Safety Zones program. chicago.legistar.com/legislation.aspx (accessed August 21, 2012) Chicago Public Schools Driver Education. Programs/Before_and_after_school/Pages/DriverEducation.aspx (accessed August 23, 2012). Ewing, Reid and Eric Dumbaugh The Built Environment and Traffic Safety: A Review of Empirical Evidence. Journal of Planning Literature. Volume 23 Number 4 May Federal Highway Administration BIKESAFE: Bicycle Countermeasure Selection System. What is BIKESAFE. (accessed August 22, 2012). Forsyth, Ann and Kevin Krizek Promoting Walking and Bicycling: Assessing the Evidence to Assist Planners. Built Environment. Vol 36 No 4. (2010) Garder, P. E The impact of speed and other variables on pedestrian safety in Maine. Accident Analysis and Prevention 36 (4): Illinois Driving School Illinois Driving School: Classes. (accessed August 23, 2012). Jacobsen, P.L. Safety in numbers: more walkers and bicyclists, safer walking and bicycling Injury Prevention. 9: Klop, Jeremy and Asad Khattak Factors Influencing Bicycle Crash Severity On Two-Lane Undivided Roadways In North Carolina. Washington D.C.: Transportation Research Board 78th Annual Meeting. Chong, Shanley, Roslyn Poulos, Jake Olivier, Wendy L. Watson and Raphael Grzebieta Relative injury severity among vulnerable non-motorized road users: Comparative analysis of injury arising from bicycle motor vehicle and bicycle pedestrian collisions. Accident Analysis and Prevention 42 (2010) Marshall, Wesley E. and Norman W. Garrick Evidence on Why Bike-Friendly Cities Are Safer for All Road Users. Environmental Practice. 13 (1) March Mineta Transportation Institute Report 11-08: Promoting Bicycle Commuter Safety. San Jose, CA: San Jose State University.

67 National Association of City Transportation Officials Urban Bikeway Design Guide. April 2011 Edition. (accessed August 21, 2012). Reynolds, Conor CO, M Anne Harris, Kay Teschke, Peter A Cripton and Meghan Winters The impact of transportation infrastructure on bicycling injuries and crashes: a review of the literature. Environmental Health. 8:47. Summala, Heikki, Eero Pasanen, Mikko Rasanen and Jukka Sievanen Bicycle Accidents and Drivers Visual Search at Left and Right Turns. Accident Analysis and Prevention. Vol. 28, No. 2, pp , SWOV SWOV Institute for Road Safety Research. SWOV Fact Sheet: Bicycle facilities on distributor roads. Leidschendam, the Netherlands: December Factsheets/UK/FS_Bicycle_facilities.pdf (accessed August 22, 2012). Transportation Alternatives Biking Rules: A New Street Code for NYC Cyclists. (accessed August 28, 2012). Zegeer, C. V., C. Seiderman, P. Lagerwey, M. Cynecki, M. Ronkin and R. Schnieder. 2002a. Pedestrian facilities users guide Providing safety and mobility. Report No. FHWA-RD Washington, DC: Federal Highway Administration.


68
Final Report. Siim Sööt, Ph.D. Lu Gan Piyushimita (Vonu) Thakuriah, Ph.D. - Project Lead University of Illinois at Chicago
 Thakuriah, Ph.D. - Project Lead University of Illinois at Chicago") Bicycle Crash Analysis and Review of Trends City of Chicago, 2005 to 2010 Final Report Siim Sööt, Ph.D. Lu Gan Piyushimita (Vonu) Thakuriah, Ph.D. - Project Lead University of Illinois at Chicago Melody
Bicycle Crash Analysis and Review of Trends City of Chicago, 2005 to 2010 Final Report Siim Sööt, Ph.D. Lu Gan Piyushimita (Vonu) Thakuriah, Ph.D. - Project Lead University of Illinois at Chicago Melody
Mayor s Bicycle Advisory Council. Wednesday, December 13 th, 2017
 Mayor s Bicycle Advisory Council Wednesday, December 13 th, 2017 Bicyclist Fatalities, Year to Date (January 1 November 30, 2017) - MBAC Briefing Bicyclist Fatality Statistics Year to date total, 2017
Final Report 2012 Chicago Department of Transportation 30 N. LaSalle St., Ste 500 Chicago IL Gabe Klein, Commissioner
 Final Report 2012 Chicago Department of Transportation 30 N. LaSalle St., Ste 500 Chicago IL 60602 Gabe Klein, Commissioner 1 Funders Partner Organizations Monetary Contributions In-Kind Donations 2 Executive
SPEED MANAGEMENT FOR VISION ZERO
 SPEED MANAGEMENT FOR VISION ZERO LUANN HAMILTON, DEPUTY COMMISSIONER FOR PROJECT DEVELOPMENT CHICAGO DEPARTMENT OF TRANSPORTATION NACTO DESIGNING CITIES 2017 Vision Zero Action Plan Speed management and
PEDESTRIAN ACTION PLAN
 ATTACHMENT 2 CITY OF SANTA MONICA PEDESTRIAN ACTION PLAN CITY OF SANTA MONICA PEDESTRIAN ACTION PLAN This page intentionally left blank EXECUTIVE SUMMARY CHAPTER 1 EXECUTIVE SUMMARY Setting the Stage
Mayor s Pedestrian Advisory Council. Wednesday, February 15
 Mayor s Pedestrian Advisory Council Wednesday, February 15 Annual Pedestrian Fatalities 2005-2016 Year-End Pedestrian Fatalities, 2016 (CPD): 44 Year-End Pedestrian Fatalities, 2015 (CPD): 46 Year-End
Chapter 2. Bellingham Bicycle Master Plan Chapter 2: Policies and Actions
 Chapter 2 Bellingham Bicycle Master Plan Chapter 2: Policies and Actions Chapter 2: Policies and Actions The Bicycle Master Plan provides a road map for making bicycling in Bellingham a viable transportation
The City of Chicago s. Bike 2015 Plan. Nick Jackson, Deputy Director Chicagoland Bicycle Federation RAIL-VOLUTION 2006
 The City of Chicago s Bike 2015 Plan Nick Jackson, Deputy Director Chicagoland Bicycle Federation RAIL-VOLUTION 2006 Plan funded by $75,000 grant from the Unified Work Program (UWP) received from the Chicago
City of Novi Non-Motorized Master Plan 2011 Executive Summary
 City of Novi Non-Motorized Master Plan 2011 Executive Summary Prepared by: February 28, 2011 Why Plan? Encouraging healthy, active lifestyles through pathway and sidewalk connectivity has been a focus
NYC Pedestrian Safety Study & Action Plan. NYTMC Brown Bag Lunch Presentation December 15, 2010
 NYC Pedestrian Safety Study & Action Plan NYTMC Brown Bag Lunch Presentation December 15, 2010 1 Introduction DOT Safety Goal Strategic Plan: Reduce Fatalities by 50% by 2030 From 274 (2007) to 137 (2030)
Corpus Christi Metropolitan Transportation Plan Fiscal Year Introduction:
 Introduction: The Safe, Accountable, Flexible, Efficient Transportation Equity Act: A Legacy for Users (SAFETEA-LU) has continued the efforts started through the Intermodal Surface Transportation Efficiency
About the Active Transportation Alliance
 About the Active Transportation Alliance Chicagoland s voice for better biking, walking and transit Founded 1985 7,000 members, ~33 full time staff Serve Chicago metro region 1 More Cars, More Driving
Chicago Pedestrian and Bicycle Safety Initiative Final Report
 1 Chicago Pedestrian and Bicycle Safety Initiative Final Report Chicago Department of Transportation www.chicagocompletestreets.org 312.744.8147 Executive Summary Since 2001, the Chicago Department of
Pedestrian Safety Action Plan Bicycle Safety Action Plan
 Pedestrian Safety Action Plan Bicycle Safety Action Plan January 24, 2017 VISION: Safe travel for all MISSION STATEMENT: Partner with the community to plan and fund transportation projects and programs
We believe the following comments and suggestions can help the department meet those goals.
 The Honorable Secretary Anthony Foxx The Secretary of Transportation United States Department of Transportation 1200 New Jersey Avenue, SE Washington, DC 20590 August 30, 2013 Dear Secretary Foxx, Thank
City of San Diego Vision Zero Draft Strategic Plan FY 2017
 City of San Diego Vision Zero Draft Strategic Plan FY 2017 Engineering Objective: To develop and implement a strategy that employs best planning, design and engineering practices. Background: Over the
EXECUTIVE SUMMARY. Vision
 Vision Walking and bicycling in Salt Lake City will be safe, convenient, comfortable, and viable transportation options that connect people to places, foster recreational and economic development opportunities,
Safer Cycling: How the City of Vancouver is Proactively Improving Cycling Safety
 Safer Cycling: How the City of Vancouver is Proactively Improving Cycling Safety Brian Patterson, MCIP, RPP Urban Systems 2015 Canadian Association of Road Safety Professionals (CARSP) Conference Session
8. Collisions INTRODUCTION
 8. Collisions INTRODUCTION While traffic collisions can affect anyone, they have a disproportionate impact on bicyclists, who along with pedestrians are the most vulnerable users of the transportation
Bicycle Master Plan Goals, Strategies, and Policies
 Bicycle Master Plan Goals, Strategies, and Policies Mobilizing 5 This chapter outlines the overarching goals, action statements, and action items Long Beach will take in order to achieve its vision of
DRAFT MOVING FORWARD RHODE ISLAND BICYCLE MOBILITY PLAN 2018 PREPARED FOR PREPARED BY IN ASSOCIATION WITH
 RHODE ISLAND MOVING FORWARD BICYCLE MOBILITY PLAN 2018 PREPARED FOR PREPARED BY IN ASSOCIATION WITH T AF CHAPTER 1 D R INTRODUCTION CHAPTER 3 ARTICULATES VISION Bicycling is safe, fun and practical in
BIKE PLAN CONTENTS GATEWAY
 CONTENTS Acknowledgments...vii Great Rivers Greenway District Board of Directors... vii Great Rivers Greenway District Staff... vii Project Consultants... vii Committees... viii Citizens Advisory Committee
FINAL PLAN APPENDIX D CITY OF BERKELEY BIKE PLAN D-1
 CITY OF BERKELEY BIKE PLAN D-1 . Proposed Programs D.1. EDUCATION This appendix presents the recommended bicycle-related programs for the City of Berkeley. The recommendations are organized in four E s:
Agenda. Overview PRINCE GEORGE S PLAZA METRO AREA PEDESTRIAN PLAN
 PRINCE GEORGE S PLAZA METRO AREA PEDESTRIAN PLAN May 28, 2008 Agenda Welcome and introductions Project overview and issue identification Planning context and strengths Design challenges and initial recommendations
Figure 1. Indiana fatal collisions by young driver involvement,
 INDIANA TRAFFIC SAFETY FACTS YOUNG DRIVERS 2016 MAY 2017 ISSUE 17-C06 IN 2016: In 2016, 13.4 percent of all drivers involved in Indiana collisions were young drivers. Young drivers were involved in 105
Mayor s Pedestrian Advisory Council. Wednesday, November 8 th
 Mayor s Pedestrian Advisory Council Wednesday, November 8 th Year-to-Date Pedestrian Fatalities, 2017 (CPD): 39 Year-to-Date Pedestrian Fatalities, 2016 (CPD): 38 Year-to-Date Pedestrian Fatalities, 2010-2014
2014 QUICK FACTS ILLINOIS CRASH INFORMATION. Illinois Emergency Medical Services for Children February 2016 Edition
 2014 QUICK FACTS ILLINOIS CRASH INFORMATION February 2016 Edition Illinois Emergency Medical Services for Children www.luhs.org/emsc Illinois Emergency Medical Services for Children TABLE OF CONTENTS
2012 QUICK FACTS ILLINOIS CRASH INFORMATION. Illinois Emergency Medical Services for Children September 2014 Edition
 2012 QUICK FACTS ILLINOIS CRASH INFORMATION September 2014 Edition Illinois Emergency Medical Services for Children www.luhs.org/emsc Illinois Emergency Medical Services for Children TABLE OF CONTENTS
POLICY AGENDA For Elder Pedestrian Safety
 POLICY AGENDA For Elder Pedestrian Safety Older adults and people with disabilities often have mobility, cognitive, and sensory limitations that affect their behavior as pedestrians and place them at risk
Appendix C 3. Bicycle / Pedestrian Planning
 Appendix C 3. Bicycle / Pedestrian Planning BICYCLE/PEDESTRIAN PLANNING 2005 Master Plan GOAL: Provide for safe and convenient bicycle and pedestrian circulation throughout the City. Develop a city-wide
Why Zone In on Speed Reduction?
 Learn it. Do it. Live it! SPEED REDUCTION IN THE ZONE Why Zone In on Speed Reduction? Speeding is a serious issue that plays a major role in the risk of serious injury and pedestrian fatality in a crash.
Exhibit 1 PLANNING COMMISSION AGENDA ITEM
 Exhibit 1 PLANNING COMMISSION AGENDA ITEM Project Name: Grand Junction Circulation Plan Grand Junction Complete Streets Policy Applicant: City of Grand Junction Representative: David Thornton Address:
May 12, 2016 Metro Potential Ballot Measure Issue Brief: Local Return
 Summary: Local return is an important revenue source for cities to maintain their local transportation infrastructure. Most cities use their local return to operate small bus systems and repave streets,
MTCF. Michigan Traffic Crash Facts FACT SHEETS
 FACT SHEETS This page left intentionally blank GENERAL FACTS The driver, the roadway, and the motor vehicle contribute in some measure to every crash. A preponderance of evidence, however, points to driver
FHWA Resources for Pedestrian and Bicycle Professionals
 FHWA Resources for Pedestrian and Bicycle Professionals Charlie Zegeer, UNC Highway Safety Research Center/PBIC Libby Thomas, UNC Highway Safety Research Center Dan Nabors, Vanasse Hangen Brustlin (VHB)
Chapter VISION, MISSION, AND GOALS AND OBJECTIVES. Vision. Mission. Goals and Objectives CONNECTING COMMUNITIES ACROSS THE ST.
 VISION, MISSION, AND GOALS AND OBJECTIVES Chapter 3 The Plan s vision, mission, and goals and objectives were developed through a series of interactive exercises with the Citizens Advisory Committee (CAC)
Building a bike friendly Chicago
 CASE STUDY Miovision Scout Building a bike friendly Chicago How video data is moving Chicago forward Chicago 2020 Becoming the Most Bike-Friendly City in the United States In 2011, Mayor Rahm Emanuel set
MEMORANDUM. City Constituents. Leilani Schwarcz, Vision Zero Surveillance Epidemiologist, SFDPH
 MEMORANDUM TO: FROM: CC: City Constituents Leilani Schwarcz, Vision Zero Surveillance Epidemiologist, SFDPH Megan Wier, Co-Chair, San Francisco Vision Zero Task Force, SFDPH Commander Ann Mannix, Traffic
Complete Streets Chicago: Data Driven Design. Luann Hamilton Deputy Commissioner
 Complete Streets Chicago: Data Driven Design Luann Hamilton Deputy Commissioner AGENDA Chicago s goals Complete Streets & Sustainable Infrastructure Guides Data-Driven Planning Setting goals Scoping/research
Napier City road trauma for Napier City. Road casualties Estimated social cost of crashes* Major road safety issues.
 ISSN 1176-841X July 25 Land Transport New Zealand has prepared this road safety issues report. It is based on reported crash data and trends for the 2 24 period. The intent of the report is to highlight
MTCF. Michigan Traffic Crash Facts FACT SHEETS
 FACT SHEETS This page left intentionally blank GENERAL FACTS The driver, the roadway, and the motor vehicle contribute in some measure to every crash. A preponderance of evidence, however, points to driver
2. Context. Existing framework. The context. The challenge. Transport Strategy
 Transport Strategy Providing quality connections Contents 1. Introduction 2. Context 3. Long-term direction 4. Three-year priorities 5. Strategy tree Wellington City Council July 2006 1. Introduction Wellington
o n - m o t o r i z e d transportation is an overlooked element that can greatly enhance the overall quality of life for the community s residents.
 N o n - m o t o r i z e d transportation is an overlooked element that can greatly enhance the overall quality of life for the community s residents. 84 Transportation CHAPTER 11 INTRODUCTION Transportation
PEDESTRIAN COLLISIONS IN LOS ANGELES 1994 through 2000
 PEDESTRIAN COLLISIONS IN LOS ANGELES 1994 through 2000 City of Los Angeles Department of Transportation Gloria Jeff, General Manager March, 2006 This document printed with grant funds from the California
Living Streets Policy
 Living Streets Policy Introduction Living streets balance the needs of motorists, bicyclists, pedestrians and transit riders in ways that promote safety and convenience, enhance community identity, create
Bikeway action plan. Bicycle Friendly Community Workshop March 5, 2007 Rochester, MN
 Bikeway action plan Summary The was held on March 5, 2007 at the Rochester Mayo Civic Center. The workshop was hosted by Rochester-Olmsted County Planning Department in collaboration with the League of
VISIONZEROPHL.COM #VISIONZEROPHL
 What is Vision Zero? What is Vision Zero? A policy that states clearly that traffic deaths are preventable and unacceptable. CORE PRINCIPLES: Human life takes priority over mobility; Human error is inevitable
ADDIS ABABA ROAD SAFETY STRATEGY
 ADDIS ABABA ROAD SAFETY STRATEGY (2017-2030) Feb 22, 2017 Presentation: Daniel Molla Overview Addis Ababa Capital City of Ethiopia, Seat of AU Area: 540 km 2 Population 3.4 million Road safety crises 400
NM-POLICY 1: Improve service levels, participation, and options for non-motorized transportation modes throughout the County.
 Transportation PRINCE WILLIAM COUNTY 2008 COMPREHENSIVE PLAN NON-MOTORIZED PLAN CONTENTS Goals, Policies, and Action Strategies Table 4 (Bike Facility Classifications and Descriptions) Table 5 (Bike Facility
CHAPTER 3: Vision Statement and Goals
 Davidson Walks & Rolls: Active Transportation Master Plan CHAPTER 3 Contents: Overview Vision Statement Measurable Goals Public Outreach CHAPTER 3: Vision Statement and Goals Overview The vision statement
Chicago Pedestrian and Bicycle Safety Initiative
 Chicago Pedestrian and Bicycle Safety Initiative Department of Transportation 2015 Final Report 830 TOTAL EVENTS 2014-2015 SEASON PROGRAM SUMMARY Since 2001, the Chicago Department of Transportation (CDOT)
1999 On-Board Sacramento Regional Transit District Survey
 SACOG-00-009 1999 On-Board Sacramento Regional Transit District Survey June 2000 Sacramento Area Council of Governments 1999 On-Board Sacramento Regional Transit District Survey June 2000 Table of Contents
Chapter PERFORMANCE MEASURES AND ACCOUNTABILITY. Introduction
 PERFORMANCE MEASURES AND ACCOUNTABILITY Introduction Performance measures are helpful in evaluating the progress being made toward achieving the goals and objectives of the Gateway Bicycle Plan. The Plan
PRINCE GEORGE S PLAZA METRO AREA PEDESTRIAN PLAN
 PRINCE GEORGE S PLAZA METRO AREA PEDESTRIAN PLAN May 28, 2008 Agenda Welcome and introductions Project overview and issue identification Planning context and strengths Design challenges and initial recommendations
Physical Implications of Complete Streets Policies
 Presentation Overview Physical Implications of Complete Norm Cox, ASLA, LLA Landscape Architect Ann Arbor, Michigan, 10:45 to Noon What Are Complete Streets? What Matters to Bicyclists and Pedestrians
APPENDIX A: Complete Streets Checklist DRAFT NOVEMBER 2016
 APPENDIX A: Complete Streets Checklist DRAFT NOVEMBER 2016 Complete Streets Checklist MetroPlan Orlando s Complete Streets Checklist is an internal planning tool for staff to further implementation of
Wood and Cortland Neighborhood Greenways
 Wednesday, May 25 th, 2016 Wood and Cortland Neighborhood Greenways Alderman Hopkins 2 nd Ward Alderman Waguespack 32 nd Ward Mike Amsden, AICP Assistant Director of Transportation Planning David Smith,
April 30 th, Reducing the Risks to Child Pedestrians
 April 30 th, 2018 Reducing the Risks to Child Pedestrians Technical Tips Audio is broadcast through computer speakers Download resources in the File Share pod (above the slides) If you experience audio
2009 Bike Counts Project. Chicago Department of Transportation Division of Project Development Bicycle Program
 2009 Bike Counts Project Chicago Department of Transportation ASHLAND AVE 1600 W DAMEN AVE 2000 W WESTERN AVE 2400 W CALIFORNIA AVE 2800 W KEDZIE AVE 3200 W PULASKI RD 4000 W CENTRAL PARK AVE 3600 W CICERO
pedestrian safety study Summary Report
 pedestrian safety study April 24, 2012 CITY OF VANCOUVER PEDESTRIAN SAFETY STUDY SUMMARY REPORT Prepared by In association with Dr. Tarek Sayed, P.Eng., Department of Civil Engineering, University of British
APPENDIX C. Systems Performance Report C-1
 APPENDIX C Systems Performance Report C-1 System Performance Report & Requirements According to the FAST Act, a long range transportation plan needs to include a system performance report and subsequent
CITY OF LOS ANGELES INTER-DEPARTMENTAL MEMORANDUM
 CITY OF LOS ANGELES INTER-DEPARTMENTAL MEMORANDUM Date: December 12,2011 To: Honorable City Council c/o City Clerk, Room 395, City Hall Attention: Honorable Bill Rosendahl, Chair, Transportation Committee
CHAPTER 1 INTRODUCTION
 CHAPTER 1 INTRODUCTION Chapter Table of Contents THE 2017 HOUSTON BIKE PLAN 1-1 HOUSTON BIKEWAYS PROGRAM 1-2 HISTORY OF BICYCLE PLANNING IN HOUSTON 1-3 BICYCLE LEVEL OF COMFORT 1-3 EXISTING PLANS, PROGRAMS
REGIONAL BICYCLE AND PEDESTRIAN DESIGN GUIDELINES
 REGIONAL BICYCLE AND PEDESTRIAN DESIGN GUIDELINES November 16, 2011 Deb Humphreys North Central Texas Council of Governments Bicycle and Pedestrian Advisory Committee Snapshot of the Guide 1. Introduction
TABLE OF CONTENTS. Executive Summary
 Executive Summary Background... ES-1 Pedestrian Network... ES-2 Bikeway Network... ES-2 Collision History... ES-2 Public Input... ES-4 Conclusions and Recommendations... ES-4 1. Introduction and Setting
A Complete Streets Policy for Saratoga Springs. Presented By: Shared Access Saratoga
 A Complete Streets Policy for Saratoga Springs Presented By: Shared Access Saratoga April 17, 2012 Agenda 1. Introduction to Complete Streets (CS) 2. Shared Access Saratoga 3. Why is CS Important 4. What
ADOT Statewide Bicycle and Pedestrian Program Summary of Phase IV Activities APPENDIX B PEDESTRIAN DEMAND INDEX
 ADOT Statewide Bicycle and Pedestrian Program Summary of Activities APPENDIX B PEDESTRIAN DEMAND INDEX May 24, 2009 Pedestrian Demand Index for State Highway Facilities Revised: May 29, 2007 Introduction
road safety issues 2001 road toll for Gisborne district July 2002 Road user casualties Estimated social cost of crashes*
 GISBORNE DISTRICT road safety issues July 22 The Land Transport Safety Authority (LTSA) has prepared this Road Safety Issues Report. It is based on reported crash data and trends for the 1997 21 period.
Pedestrian injuries in San Francisco: distribution, causes, and solutions
 Pedestrian injuries in San Francisco: distribution, causes, and solutions Presentation to the San Francisco Health Commission RAJIV BHATIA, MD, MPH DIRECTOR OF OCCUPATIONAL AND ENVIRONMENTAL HEALTH, SAN
UPDATES, SUCCESSES, AND WHAT S AHEAD ON THE ROAD TO ZERO
 Vol. 1, Issue 1 I Spring 2018 www.planhillsborough.org/vision-zero S A F E S T R E E T S N O W H I L L S B O R O U G H UPDATES, SUCCESSES, AND WHAT S AHEAD ON THE ROAD TO ZERO TRACKING PROGRESS This is
Proposed. City of Grand Junction Complete Streets Policy. Exhibit 10
 Proposed City of Grand Junction Complete Streets Policy Exhibit 10 1 City of Grand Junction Complete Streets Policy Vision: The Complete Streets Vision is to develop a safe, efficient, and reliable travel
1. Engineering: An Inviting Network of Bicycling Facilities for Cyclists of All Ages and Abilities and Destinations that Support Bicycling
 This Plan lays out a framework for creating and expanding programs and improvements to increase bicycling in Greenville. The Vision, Goals, and Objectives of the City of Greenville Bicycle Master Plan
Complete Streets Policies in Charlotte
 Complete Streets Policies in Charlotte Complete Streets Peer Exchange Baton Rouge, LA January 19, 2016 Norm Steinman, AICP Charlotte DOT Changing what we do to change what will happen 1. Inventory of Conditions
FEDERAL HIGHWAY ADMINISTRATION APPLICATION
 FEDERAL HIGHWAY ADMINISTRATION APPLICATION REQUEST FOR PERMISSION TO EXPERIMENT WITH A BICYCLE BOX INTERSECTION TREATMENT Submitted by: City of Columbus Department of Public Service Date: June 26, 2009
Street Smart - Regional Pedestrian Safety Campaign. Hopkins Grand Rounds July 16, 2014
 Street Smart - Regional Pedestrian Safety Campaign Hopkins Grand Rounds July 16, 2014 Baltimore Metropolitan Council (BMC) Who We Are The organization of the Baltimore region s elected executives, representing
SANTA CLARA COUNTYWIDE BICYCLE PLAN August 2008
 SANTA CLARA COUNTYWIDE BICYCLE PLAN August 2008 To assist VTA and Member Agencies in the planning, development and programming of bicycle improvements in Santa Clara County. Vision Statement To establish,
City of Elizabeth City Neighborhood Traffic Calming Policy and Guidelines
 City of Elizabeth City Neighborhood Traffic Calming Policy and Guidelines I. Purpose: The City of Elizabeth City is committed to ensure the overall safety and livability of residential neighborhoods. One
CHAPTER 7.0 IMPLEMENTATION
 CHAPTER 7.0 IMPLEMENTATION Achieving the vision of the Better Streets Plan will rely on the ability to effectively fund, build and maintain improvements, and to sustain improvements over time. CHAPTER
AGENDA ITEM NO. 5b HCAOG TAC meeting of May 8, 2014
 Humboldt County Association of Governments Eureka, CA, 95501 AGENDA ITEM NO. 5b HCAOG TAC meeting of May 8, 2014 DATE: May 1, 2014 TO: HCAOG Technical Advisory Committee (TAC) FROM:, SUBJECT: Letters of
Application of Demographic Analysis to Pedestrian Safety. Center for Urban Transportation Research University of South Florida
 Application of Demographic Analysis to Pedestrian Safety BDV25 TWO 977 30 Pei Sung Lin, Ph.D., P.E., PTOE, FITE Program Director Achilleas Kourtellis, Ph.D. Senior Research Associate CUTR, University of
2012 TOWN OF CASTLE ROCK MOTOR VEHICLE ACCIDENT FACTS PREPARED BY THE PUBLIC WORKS DEPARTMENT
 ATTACHMENT A 2012 TOWN OF CASTLE ROCK MOTOR VEHICLE ACCIDENT FACTS PREPARED BY THE PUBLIC WORKS DEPARTMENT ACKNOWLEDGEMENTS This report was assembled from data provided by the Castle Rock Police Department
Chapter 5. Complete Streets and Walkable Communities.
 Chapter 5. Complete Streets and Walkable Communities. 5.1 Description of Complete Streets. Cities throughout the world, and specifically the United States, are coming to embrace a new transportation and
An Assessment of Potential Greenhouse Gas Emissions Reductions from Proposed On Street Bikeways
 An Assessment of Potential Greenhouse Gas Emissions Reductions from Proposed On Street Bikeways Through the Sustainable Bethlehem Initiative, the Town of Bethlehem has identified both the improvement of
Perryville TOD and Greenway Plan
 Perryville TOD and Greenway Plan Greenway Glossary Pathway: A bicycle and pedestrian path separated from motorized vehicular traffic by an open space, barrier or curb. Multi-use paths may be within the
Peterborough Council on Aging
 Peterborough Council on Aging Discussion paper series #4, 2015 Transportation Transportation, including accessible and affordable public transport is a key factor influencing active aging. in particular,
ACTIVE TRANSPORTATION
 ACTIVE TRANSPORTATION Mobility 2040 Supported Goals Improve the availability of transportation options for people and goods. Support travel efficiency measures and system enhancements targeted at congestion
CONNECTING PEOPLE TO PLACES
 CONNECTING PEOPLE TO PLACES 82 EAST BENCH MASTER PLAN 07 Introduction The East Bench transportation system is a collection of slow moving, treelined residential streets and major arteries that are the
Film Guide for Educators. Designing for Safety
 Film Guide for Educators Designing for Safety Designing For Safety Key Concepts Speeding While Driving Speeding is the number one cause of injuries and deaths from driving. The main reasons are because
Broad Street Bicycle Boulevard City Council Study Session Summary
 Broad Street Bicycle Boulevard City Council Study Session Summary Overview: On August 15 th, 2017, a City Council Study Session was held to invite community input and request City Council guidance on a
The Florida Bicycle and Pedestrian Partnership Council
 The Florida Bicycle and Pedestrian Partnership Council Input to the Update of the Florida Transportation Plan March 2015 This document presents input from the Florida Bicycle and Pedestrian Advisory Council
CITY OF COCOA BEACH 2025 COMPREHENSIVE PLAN. Section VIII Mobility Element Goals, Objectives, and Policies
 CITY OF COCOA BEACH 2025 COMPREHENSIVE PLAN Section VIII Mobility Element Goals, Objectives, and Policies Adopted August 6, 2015 by Ordinance No. 1591 VIII MOBILITY ELEMENT Table of Contents Page Number
Lane Area Transportation Safety and Security Plan Vulnerable Users Focus Group
 Lane Area Transportation Safety and Security Plan Vulnerable Users Focus Group Agenda 1. Planning Process Review 2. What are Emphasis Areas? 3. Your Role Today 4. Data Review 5. Small group discussion
Appendix E: Bike Crash Analysis ( )
") Appendix E: Bike Crash Analysis (2009-2012) Davis Bicycle Crashes Analysis 2009-2012 December 2013 Ride Walk Davis Active Transportation Program City of Davis December 2013 Prepared by: Jimmy Fong Active
Appendix E: Bike Crash Analysis (2009-2012) Davis Bicycle Crashes Analysis 2009-2012 December 2013 Ride Walk Davis Active Transportation Program City of Davis December 2013 Prepared by: Jimmy Fong Active
BICYCLE SAFETY OBSERVATION STUDY 2014
 County of Santa Cruz Health Services Agency BICYCLE SAFETY OBSERVATION STUDY BACKGROUND AND PURPOSE The County of Santa Cruz Health Services Agency (HSA) in conjunction with the Community Safety Coalition
APPENDIX F. Safety Planning. October 2018
 APPENDIX F Safety Planning October 2018 APPENDIX F: SAFETY PLANNING October 17, 2018 ABOUT VISUALIZE 2045 & THE TPB Visualize 2045 is the federally required long-range transportation plan for the National
Vision to Action Community Coalition February 14, 2014 Briefing
 Vision to Action Community Coalition February 14, 2014 Briefing Transportation and Transit Planning & Mass Transit Operations Strategic Growth Area Office Brian S. Solis Transportation & Transit Manager
Purpose and Need. Chapter Introduction. 2.2 Project Purpose and Need Project Purpose Project Need
 Chapter 2 Purpose and Need 2.1 Introduction The El Camino Real Bus Rapid Transit (BRT) Project (Project) would make transit and other transportation improvements along a 17.6-mile segment of the El Camino
Proposed White Flint Separated Bike Lane Network September 2015
 Proposed White Flint Separated Bike Lane Network September 2015 Abstract This report includes a proposed separated bike lane network for the White Flint Sector Plan area. Separated bike lanes create a
Briefing Paper #1. An Overview of Regional Demand and Mode Share
 2011 Metro Vancouver Regional Trip Diary Survey Briefing Paper #1 An Overview of Regional Demand and Mode Share Introduction The 2011 Metro Vancouver Regional Trip Diary Survey is the latest survey conducted
Double Dutch: Bicycling Jumps in Philadelphia
 Double Dutch: Bicycling Jumps in Philadelphia Introduction The path to urban sustainability is paved by streets that accommodate all users, not just cars and trucks. 20 th Century transportation policy