Chapter 1: Introduction... 1 Purpose of the Plan...3 Planning Process...3 Plan Organization...5 Douglas County 2030 Comprehensive Plan...
|
|
|
- Debra Owen
- 5 years ago
- Views:
Transcription
1
2 Table of Contents Acknowledgements...vi Chapter 1: Introduction... 1 Purpose of the Plan...3 Planning Process...3 Plan Organization...5 Douglas County 2030 Comprehensive Plan...6 Chapter 2: Study Area Characteristics Automobile...13 Roadway Network...14 Existing Traffic Volumes and Congestion Levels...19 Existing Transit Service...22 Bicycle Network...25 Chapter 3: Forecasts Population and Employment Forecasts...27 Population Growth by Age...29 Trip Generation and Internal/External Travel /2030 Travel Demand...37 Green = Often Asked Questions Blue = Supplemental Information i
3 Table of Contents Chapter 4: Roadway Vision Plan...40 Roadway Hierarchy Roadway Vision Plan Development Process Roadway Vision Plan Roadway Vision Plan DRCOG and Douglas County Comprehensive Master Plan 2030 Sensitivity Analysis System Management Chapter 5: Transit Vision Plan...64 Demand Analysis Transit Analysis Findings Transit Vision Plan Chapter 6: Bicycle Vision Plan Bicycle Concept Plan Bicycle Concept Plan Bicycle Concept Plan Chapter 7: Implementation of the 2030 Transportation Plan...76 Transportation Funding Transportation Plan Implementation Actions Appendices Appendix A: Douglas County 2030 Comprehensive Plan Transportation Goals and Objectives Appendix B: Douglas County Travel Demand Model Appendix C: Level of Service Capacity Analysis Appendix D: North West Planning Area Traffic Assessment Douglas County 2030 Transportation Plan November 2009 ii
4 Table of Contents List of Figures Figure 1: Douglas County Study Area... 2 Figure 2: 2010 Existing + Committed Network - Douglas County Figure 3: 2010 Existing + Committed Network - North Central Douglas County Figure 4: 2010 PM Peak Hour Traffic Volumes and Congestion Douglas County Figure 5: 2010 PM Peak Hour Traffic Volumes and Congestion North Central Douglas County Figure 6: Existing Transit Services Figure 7: Existing Off-Street Bicycle Trails Figure 8: Douglas County Population Forecasts Figure 9: Douglas County Employment Forecasts Figure 10: Differences between the DRCOG and Douglas County s Population Forecasts Figure 11: Differences between the DRCOG and Douglas County s Employment Forecasts Figure 12: Douglas County 2005 to 2030 Population Growth by Age Figure 13: Population and Employment for Figure 14: Population and Employment for Figure 15: Trip Types Figure 16: Internal/External Travel by Year Figure 17: 2010 Travel Patterns Figure 18: 2030 Travel Patterns Figure 19: Relationship between Mobility and Access Figure 20: 2020 Roadway Network Figure 21: 2020 Roadway Network North Central Douglas County Figure 22: 2020 PM Peak Hour Traffic Forecasts and Congestion Levels Figure 23: 2020 PM Peak Hour Traffic Forecasts and Congestion Levels North Central Douglas County Figure 24: 2030 Roadway Network Figure 25: 2030 Roadway Network North Central Douglas County Figure 26: 2030 PM Peak Hour Traffic Forecasts and Congestion Levels Figure 27: 2030 PM Peak Hour Traffic Forecasts and Congestion Levels North Central Douglas County Figure 28: 2030 PM Peak Hour Traffic Forecasts and Congestion Levels With 2030 DC CMP Population and Employment Growth Douglas County 2030 Transportation Plan November 2009 iii
5 Table of Contents Figure 29: 2030 PM Peak Hour Traffic Forecasts and Congestion Levels North Central Douglas County with 2030 DC CMP Population and Employment Growth Figure 30: Individuals with Disabilities in Rural Douglas County Figure 31: Proposed Transit Service Figure 32: Douglas County Bicycle Plan Figure 33: Douglas County Bicycle Plan North Central Douglas County Figure 34: Map of Improvements by Phase Figure 35: Map of 2010 Improvements by Type Figure 36: Map of 2020 Improvements by Type Figure 37: Map of 2030 Improvements by Type Figure 38: 2010 PM Peak Hour Traffic Volumes and Congestion Douglas County Figure 39: 2020 PM Peak Hour Traffic Forecasts and Congestion Levels Figure 40: 2030 PM Peak Hour Traffic Forecasts and Congestion Levels Figure B1: Model Validation Screenline Map...B-3 Figure C1: Factors Which Affect Capacities Number of Lanes... C-7 Figure C2: Factors Which Affect Capacities Lane Widths... C-8 Figure C3: Factors Which Affect Capacities Shoulders... C-9 Figure C4: Factors Which Affect Capacities Passing Zones... C-10 Figure C5: Factors Which Affect Capacities Car/Truck Mix... C-11 Figure C6: Factors Which Affect Capacities Directional Split... C-12 Figure C7: Factors Which Affect Capacities Friction Factors... C-13 Figure C8: Existing PM Peak Hour Roadway Capacities... C-14 Figure D1: DRCOG/Proposed Development Traffic Analysis Zones...D-2 Figure D2: Existing Roadway Network...D-4 Figure D3: Proposed 2030 Roadway Network...D-5 Figure D4: DRCOG Forecasts with No Proposed Development in the Study Area...D-8 Figure D5: DRCOG Forecasts...D-9 Figure D6: Forecasts With Proposed Development...D-10 Figure D7: 2030 Proposed Development PM Peak Hour Select Zone Analysis...D-12 Figure D8: PM Peak Hour Southbound Traffic US-85/Santa Fe South of Highlands Ranch Parkway...D-13 Douglas County 2030 Transportation Plan November 2009 iv
6 Table of Contents List of Tables Table 1: Douglas County 2030 Transportation Plan Public Meetings... 4 Table 2: Committed Short-Term 2010 Douglas County Roadway Improvements Table 3: Transit Service Providers by Geographic Location Table 4: Douglas County Population and Employment Forecasts Table 5: Internal/External Travel by Year Table 6: Functional Classification Criteria Characteristics Table 7: Recommended 2020 Roadway Improvements Table 8: Recommended 2030 Roadway Improvements Table 9: Recommended Roadway Improvements and Costs By Phase Table 10: Development Approaches for Funding New Transportation Improvements Table B1: Vehicle Miles of Travel (VMT) Validation...B-2 Table B2: Screenline Comparison...B-2 Table D1: Households and Employment in the Proposed Development Area...D-6 Table D2: Daily Vehicular Traffic...D-7 Douglas County 2030 Transportation Plan November 2009 v

7 Acknowledgements This study was conducted with input from Douglas County Staff, Douglas County elected officials, residents of Douglas County, and adjacent and interested agencies. Special recognition goes to the following people who spent considerable time and energy in helping to direct and review this planning effort. Douglas County Staff Public Works, Engineering Division Frederick H. Koch, P.E. Lawrence J. Corcoran, P.E. Robert Kenny, P.E. Technical Team LSA Associates, Inc. Ray A. Moe Sean McAtee Stephani Schupbach Ravikumar Palakurthy Scott Ladzinski Elissa Palmer Catalyst, Inc. Barbara Lewis Technical Advisory Committee Lawrence J. Corcoran, P.E. Douglas County Robert Kenny, P.E. Douglas County Amy Branstetter Douglas County Terence T. Quinn DC Planning Services Bob Watts Town of Castle Rock David Aden Town of Parker John Cotten City of Lone Tree Steve Cook DRCOG Ann Skinner Town of Castle Rock (Alt.) Joe Fowler DC Community Development (Alt.) Elizabeth Kay Marchetti DC Community Development (Alt.) Lisa Streisfeld Town of Castle Rock (Alt.) Chris Martin Douglas County (Alt.) Tonya Winkler DRCOG (Alt.) Steve Rudy DRCOG (Alt.) Board of County Commissioners Steven A. Boand Jack Hilbert Jill Repella (2009) Melanie Worley (2008) Planning Commissioners Tim Price, Chair Scott Kirkwood, Vice Chair Barrett Miller, Secretary Roger Partridge Pam Schenck Gary Dani Marvin Taxar Steve Wilson Edward Brewer vi vi Douglas County 2030 Transportation Plan November 2009


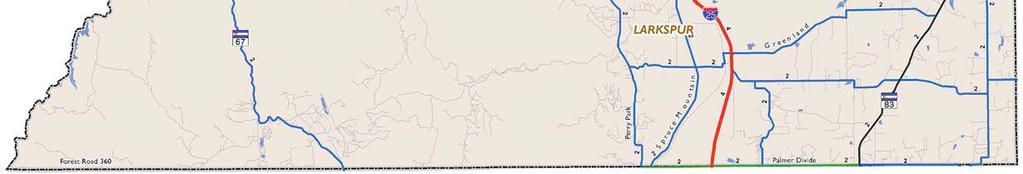
8 Chapter 1: Introduction Douglas County is a vibrant and growing region. It is the eighth most populous county in the State of Colorado and is one of the fastest growing counties in the United States. Douglas County is located midway between Colorado's two largest cities, Denver and Colorado Springs. Douglas County contains the Cities of Lone Tree and Castle Pine North and the Towns of Parker, Castle Rock, and Larkspur and portions of Aurora and Littleton, as depicted in Figure 1. Douglas County borders the Denver metropolitan area. Much of unincorporated Douglas County is rural and lightly wooded, with broken terrain and small streams. Suburbanization is gradually displacing the ranching economy of Douglas County. Residents generally commute to workplaces elsewhere in the metropolitan area outside of the County. Interstate 25 is the primary regional corridor traveling through the County from north to south. The Douglas County 2030 Transportation Plan, which used as a basis the existing 2020 Transportation Plan, updates that plan and creates a vision for a multi-modal transportation system in response to the public outreach process. The Plan provides more mobility options, including transit and bicycle to respond to a changing County. The Douglas County 2030 Transportation Plan identifies future transportation needs and estimates short-term and long-term capital improvements needed to accommodate future growth. The Douglas County 2030 Transportation Plan provides both technical and policy direction for decisions related to planning future transportation facilities and improvements. 1 Douglas County 2030 Transportation Plan November 2009

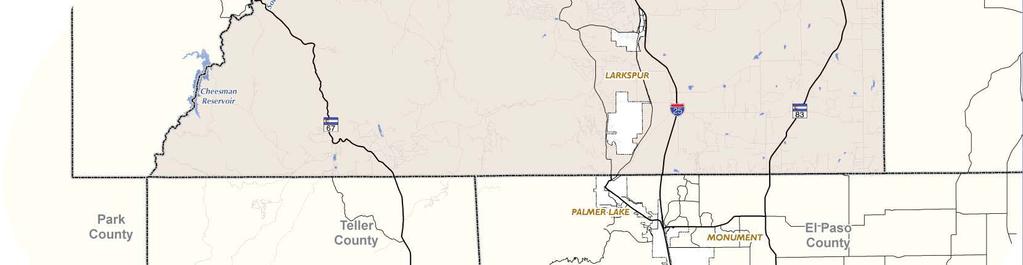
9 FIGURE 1: DOUGLAS COUNTY STUDY AREA FIGURE 1: DOUGLAS COUNTY STUDY AREA 2


10 Chapter 1: Introduction Purpose of the Plan The purpose of the Douglas County 2030 Transportation Plan is to define a long-range vision for a multi-modal transportation system that offers choices in how people travel. The Plan includes corridor prioritization and improvement priorities for funding future transportation needs. Primary elements included in this plan update are as follows: Revised socio-economic forecasts of households and employment consistent with Denver Regional Council of Governments (DRCOG) forecasts; Updated travel demand forecasts, based on the updated socioeconomic data forecasts, and a travel demand model refined for Douglas County; A multi-modal approach in addressing the County s transportation needs, including bicycling, transit, and automobile; A functional hierarchy of roadways, which enhances travel efficiency and safety; and Short-term, mid-term, and long-term transportation improvements. The second phase of the plan process developed preliminary multimodal transportation improvement alternatives to support future growth and travel demand. The third and final phase refined the alternatives for developing a preferred transportation plan, including phasing and implementation strategies. Planning Process The planning process for the development of the Douglas County 2030 Transportation Plan consisted of three (3) phases. The first phase, Issues and Concerns, identified the current state of transportation and development within Douglas County. Issues included growth, travel patterns, automobile congestion, transit needs, and bicycling. Each phase included a review and input from the Technical Advisory Committee (TAC). TAC members provided review of the technical analysis, input as to what their jurisdictions are planning, and recommendations for the transportation plan. Each phase of the planning process also included a public meeting and website postings. A summary of the timing, format, and key questions addressed at each of the public meetings is listed in Table 1. Douglas County 2030 Transportation Plan November
11 Chapter 1: Introduction TABLE 1: DOUGLAS COUNTY 2030 TRANSPORTATION PLAN PUBLIC MEETINGS Step Meeting Date Format Key Questions What is the Transportation Master Plan? Issues and Concerns March 20, 2008 Public Meeting: Open House, Presentation and Workshop What are conditions today? What trends will affect travel in the future? What issues and concerns need to be addressed in this Plan? What transportation improvements should be considered in the Plan? Alternatives Development October 28, 2008 Public Meeting: Open House, Presentation and Workshop What are the choices for the future? What are implications of these choices? What are the funding implications of these choices? Preferred Plan Selection and Refinement June 24, 2009 Open House Did we get it right in response to your input regarding multi-modal transportation improvements? What changes or suggested additions do you propose? Douglas County 2030 Transportation Plan November

12 Chapter 1: Introduction Plan Organization The Douglas County 2030 Transportation Plan is divided into seven (7) chapters. The following provides a list of the chapters and their general contents: 1. INTRODUCTION: Background, purpose, and need for the transportation plan and how the transportation plan addresses the Comprehensive Master Plan s transportation goals and objectives. 2. STUDY AREA CHARACTERISTICS: This chapter describes the current state of the existing transportation system auto, transit, and bicycle. The existing conditions analysis (2010 Plan) focuses on answering the question, how well does our transportation system serve today s mobility needs? Based on those existing needs, what might the transportation system look like in the future? 3. FORECASTS: This chapter looks at the County and regional socio-economic forecasts for households, population, and employment. These population and employment categories are converted to travel demand for estimating where traffic is going to and from. This chapter also describes the process for forecasting traffic. 4. ROADWAY VISION PLAN: This chapter provides the framework for building the future roadway infrastructure for Douglas County. Included in this section are maps depicting the roadway hierarchy from Interstates to Collectors. Two horizon years are reported, an interim 2020 horizon and a long-term 2030 timeframe. This chapter also provides a planning level cost estimate for implementing the Plan. 5. TRANSIT VISION PLAN: With a growing and aging Douglas County population, specialized transit services will become increasingly important. How to coordinate transit between all providers, including the RTD, Castle Rock, and other service providers will be presented in the Transit Vision Plan. This transit vision is based on a summary of the Douglas County Transit Solutions Plan. 6. BICYCLE VISION PLAN: Currently, other than some off-street trails, there are no bicycle facilities. This chapter steps through an implementation process, beginning with available shoulders, to build a comprehensive bicycle network for unincorporated Douglas County. 7. IMPLEMENTATION OF THE PLAN: Visions and plans become a reality when they are implemented. This chapter identifies strategies and actions for the County to implement their multi-modal transportation element. Douglas County 2030 Transportation Plan Public Meeting March 20, 2008 Douglas County 2030 Transportation Plan November
13 Chapter 1: Introduction Douglas County 2030 Comprehensive Plan In April of 2008, Douglas County adopted their new 2030 Comprehensive Master Plan (CMP) to guide future development. The CMP reflects, acknowledges, and balances the common values, rights, and needs of all County residents and landowners, and honors and protects its unique, diverse communities and resources. The Douglas County 2030 Transportation Plan will become an element of the overall Comprehensive Master Plan and replaces the existing 2020 Transportation Plan. The Douglas County 2030 Transportation Plan was developed in response to the Comprehensive Master Plan s vision for transportation planning and the transportation goals and objectives for the County. Transportation Goals and Objectives for the 2030 Comprehensive Master Plan A complete list of all Comprehensive Master Plan transportation related goals, objectives, and policies are presented in Appendix A. The following section presents the Comprehensive Master Plan s transportation goals and objectives, and how each transportation goal and objective was addressed in the Douglas County 2030 Transportation Plan. Goal 7-1 Develop an efficient, multi-functional transportation network that is designed to ensure safety, promote user access, and facilitate costeffective operations and maintenance. Transportation Plan Policy: The Douglas County 2030 Transportation Plan incorporates all transportation modes. The Plan includes a multi-phased Bicycle Vision Plan with objectives to add shoulders when practical during normal maintenance overlays or widening projects to improve capacity and safety and to provide opportunities for bicyclists. The Transit Vision Plan for rural Douglas County focuses on specialized transit needs for a growing senior population and those with special needs. This Transit Vision Plan integrates with existing RTD service. The Douglas County 2030 Transportation Plan targeted cost-effective roadway improvements for improved operations. Vision for Transportation Planning Create a transportation network that is comprised of diverse types of transportation facilities, supports improved access mobility, shapes the way we travel, and the development of our communities. The integration of the transportation network and with land use provides important benefits, including: Improved travel choices and options, A reduction in road network demands, vehicle miles traveled, and time spent driving, Supports community health and active living, Supports economic vitality, Supports improved air quality, and Conserves energy and natural resources. Douglas County 2030 Transportation Plan November
14 Chapter 1: Introduction Objective 7-1A Ensure consistency between the Transportation Plan and local and regional transportation plans. Transportation Plan Policy: The Douglas County 2030 Transportation Planning process included the development of a Technical Advisory Committee, which had representatives from the major incorporated areas of Parker, Castle Rock, Lone Tree, and the Denver Regional Council of Governments. Each step of the planning process incorporated both their plans and input to assure that the resulting Douglas County 2030 Transportation Plan was consistent with local and regional plans. The preparation of the Douglas County 2030 Transportation Plan also included review and coordination with Transportation Plans from Elbert, Arapahoe, Jefferson, and El Paso counties. As new development occurs and as transportation improvements are proposed, it will be a continued policy for Douglas County Engineering to work with all Stakeholders. Objective 7-1B Integrate all appropriate modes of travel within the Transportation Plan. Transportation Plan Policy: The Douglas County 2030 Transportation Plan incorporated a three phased bicycle implementation plan which targeted short-term shoulder to bike lane conversions, followed by additional shoulders constructed as part of normal maintenance improvements. The Transit Vision Plan is very realistic in addressing the appropriate needs of a growing senior population and those with disabilities in rural Douglas County. As these plans move forward, it will be the policy of Douglas County to promote integration of all transportation modes with one another. Objective 7-1C Consider safety a major element of transportation improvements in the County. Transportation Plan Policy: The development of the Plan included research on impacts to roadway travel capacity and safety. This research included understanding the relationship between shoulders and capacity and safety for the automobile and bicyclists. These correlations have been incorporated into the Plan. Safety will remain an important factor in implementing the County s transportation plan. Goal 7-2 Develop and maintain an efficient and safe road network in harmony with natural features and existing neighborhoods. Transportation Plan Policy: Although rural Douglas County is urbanizing, the character of the rural environment continues to be an important attribute to maintain. Preserving the harmony between the existing features and neighborhoods requires attention to roadway design and access control. The Douglas County 2030 Transportation Plan identifies an efficient, high-quality roadway network for County roads. It shall be a policy of development review to manage access to preserve roadway capacity for existing and future residents and businesses. Douglas County 2030 Transportation Plan November
15 Chapter 1: Introduction Objective 7-2A Plan and construct an efficient road network. Transportation Plan Policy: The Douglas County 2030 Transportation Plan identifies a roadway hierarchy which focuses on limited access on major and minor arterials in order to maintain mobility at a higher level of service. It will be important for a collective review of all future development proposals to assure that these access principals are maintained. The development of road improvements needs to compliment and minimize impacts to natural features and landscapes and provide capacity and honor complete streets objectives to accommodate all transportation modes. Objective 7-2B Provide adequate primary, secondary, and emergency connections for subdivisions. Transportation Plan Policy: The 2030 Douglas County Transportation Plan includes a roadway hierarchy, which identifies roadways down to the arterial and collector level. Access from the collector roadways to existing and future planned local streets requires a system of improvements that includes multiple means of ingress and egress, emergency service, and efficient school bus service. It shall be the policy of development review that multiple access opportunities are provided with limited access to the major and minor arterials as last resort. Objective 7-2C Design local roads to serve the purpose and scale of the neighborhood. Transportation Plan Policy: The Douglas County 2030 Transportation Plan provides for a hierarchy of roads, which complements existing local roadway system development. These roads will be constructed per Douglas County Roadway Design and Construction Standards (Roadway Standards) which promote both bike lanes and sidewalks in the urbanized areas of Douglas County and shoulders for safety, capacity, and bicycling in the rural areas. It shall be the policy to require these bicycle and pedestrian improvements at time of development. Objective 7-2D Provide adequate and efficient transportation corridors Countywide, to reduce vehicle miles traveled and driving time. Transportation Plan Policy: Much of the regional transportation network has already been established based on the state and federal freeways, terrain, and urban development. The Douglas County 2030 Transportation Plan incorporates both roadway widening to reduce vehicle hours of congestion and travel time, and in strategic locations, new facilities which will provide more direct connections to reduce vehicle miles of travel. Douglas County 2030 Transportation Plan November
16 Chapter 1: Introduction Goal 7-3 Support enhanced public transit in Douglas County. Objective 7-3B Incorporate transit facilities within development in urban areas. Transportation Plan Policy: Transit outside the RTD boundary and the Town of Castle Rock are non-existing for fixed route transit and extremely limited to specialized demand responsive transit. With the doubling of population between now and 2030 and over a 500% increase in those over 65, which account for the vast majority of those with specialized transit needs, the demand for specialized transit will significantly increase. The Transit Vision Plan identifies specialized demand responsive transit in the County that will be monitored and expanded as demand warrants. This Plan also begins with limited fixed route service from Castle Rock to Lone Tree and RTD light rail and from Castle Rock to Parker, which could also grow over time as demand warrants. Objective 7-3A Facilitate an integrated transit plan as a component of the Douglas County Transportation Plan. Transportation Plan Policy: The Transit Vision Plan chapter provides both the initial steps for implementing transit in Douglas County and a long-range transit vision plan to address future needs through coordination with other existing agency service providers. The transportation plan policy is to continue cooperative relationships with all service providers and stakeholders. Transportation Plan Policy: Short- and long-term transit for urban Douglas County will consist of both specialized demand responsive transit service and some limited fixed route service. The specialized demand responsive transit service does not require specialized facilities, such as transit centers or hubs, but rather a small loading and unloading area within close proximity to the trips origin and destinations. The fixed route service stops will require a more formal stop facility with transit information signage, benches, and in some cases, shelters and even parking areas for Park-n-Ride. As larger development proposals are submitted, it should be the policy of planning and engineering staff to review these proposals for possible transit facilities. These requirements should be included in the County s zoning ordinance and development code. Goal 7-4 Coordinate transportation and land-use planning design, programs, and policies to reduce traffic congestion, provide alternatives to automobile use, improve air quality, and create healthy, desirable living environments. Transportation Plan Policy: The Douglas County 2030 Transportation Plan is based on DRCOG s dwelling unit and employment forecasts. In addition, a sensitivity analysis was conducted using the Douglas County dwelling unit and employment forecasts, which have a higher employment forecast than Douglas County 2030 Transportation Plan November
17 Chapter 1: Introduction DRCOG s forecast. Actual development proposals may be different than either forecasts. In developing a land use and transportation plan that meets this goal, it shall be a policy of the County in urbanizing areas to promote multimodal travel through: DIVERSITY: The future planning area must have a wide-range of land use uses and trip types. This area would include residential land uses from where the trip begins and commercial and service areas where a resident may then walk or ride a bicycle to retail or service destination. Residential areas without retail, service, and employment will require the resident to get in their car and drive to their destination. DENSITY: The planning area must have higher densities to create internal opportunities for trips. If there is limited commercial and services within the area, there will be limited trips served. Density is also necessary to reach the critical mass to support transit service. DISTANCE: The planning area must also be small enough to where a person could walk or ride a bike from one location to another. If the distance is greater than one-quarter of mile, then the probability for walking drops significantly. DESIGN: The transportation network must include Complete Streets, which have bike lanes and sidewalks that are direct, continuous, have easy street crossings, are visually interesting, and are safe and secure. In addition, to reduce rail and highway noise on new development, the Plan practices smart land use planning principles by not proposing noise sensitive land uses in close proximity to major highways and railroads. Objective 7-4A Reduce traffic congestion through implementation of Transportation Demand Management (TDM) and land planning principles. Transportation Plan Policy: Transportation Demand Management is a program based solution for addressing transportation demand. These programs include alternative work hours, carpool/vanpool programs, transit passes, and parking strategies, etc. Successful TDM programs usually require a Transportation Management Organization (TMO) to organize and implement the program. These TMO s are also organized at major employment center locations such as the Downtown Denver Partnership or Southeast Business Partnership at the Denver Tech Center. Unincorporated Douglas County will not see the magnitude of nonresidential development to warrant a TMO, but encouraging businesses to coordinate with DRCOG s RideArrangers for carpool/vanpool coordination would be desirable. Objective 7-4B Use land-use planning to reduce travel by automobile and improve access to community resources. Transportation Plan Policy: The Douglas County 2030 Transportation Plan incorporates bicycle lanes and sidewalks within urban areas and shoulders in rural areas to provide opportunities for walking and bicycling in Douglas County. To promote walking and bicycling, it shall be the policy of the County to require connections to employment centers, shopping, parks, transit Douglas County 2030 Transportation Plan November
18 Chapter 1: Introduction facilities, schools, and other community activity centers, where possible. These bicycle lanes, sidewalks, and shoulders will be coordinated with mixed-use centers and the County s regional trails system. These requirements should be included in the County s zoning ordinance and development code. Zoning ordinances and development codes will also be updated to require connectivity through road and off-street path design to reduce trip lengths, provide multiple alternative travel routes between community uses and destinations, and provide alternatives to automobile use. Goal 7-5 Refine land-use compatibility within the Centennial Airport Review Area Overlay District (CARA) to ensure air and ground safety. Transportation Plan Policy: As future development plans are proposed for the Centennial Airport Area, these plans will be reviewed to ensure proper roadway sizing to minimize traffic impacts and review plans for transit stops. Objective 7-5A Achieve consistency in land-use planning within the CARA. Transportation Plan Policy: Review roadway plans for assuring uncongested access for personal vehicle and freight traffic. Objective 7-5B Coordinate land-use planning activities with other jurisdictions adjacent to the CARA. Transportation Plan Policy: Transportation planning should also be coordinated with other jurisdictions adjacent to the CARA. Goal 7-6 Achieve compatibility between the railways, other transportation corridors, and surrounding land uses. Transportation Plan Policy: Douglas County Engineering will continue working with the railroads and surrounding land uses to create safe and secure railroad crossings with minimum delay. Objective 7-6A Eliminate all at-grade crossings involving public roads as well as private roads, where possible. Transportation Plan Policy: To the extent possible, Douglas County Engineering will work with the railroads to eliminate at-grade crossing. The policy will be to create safe crossings if not grade separated. Douglas County 2030 Transportation Plan November
19 Chapter 1: Introduction Objective 7-6B Achieve land-use compatibility between the railways and adjoining land uses. Transportation Plan Policy: Access to new developments adjacent to railroads shall be required to provide access without railroad crossings. Objective 7-6C Continue to pursue passenger commuter service. Transportation Plan Policy: Douglas County continues to be a supporter of commuter rail along the Front Range and will coordinate efforts for future planning and design. Douglas County 2030 Transportation Plan November


20 Chapter 2: Study Area Characteristics To many, the transportation system is often viewed as a network of streets and interstates that allow automobiles and trucks to travel within, to, and through Douglas County. In reality, roads make up only one component of the transportation system, although a very important one. Transit service and bicycle/pedestrian facilities are essential to a well-balanced multi-modal transportation system. Before determining where Douglas County should be in the future, it is important to first see where we are today. The following chapter provides a snapshot of our current roadway network, a summary of transit options, and what bicycle facilities are available. The included 2010 Plan represents the existing and committed roadway network. Automobile The automobile has been and continues to be the predominant mode of travel in Douglas County, the region, the state, and our nation. We travel along our local streets and interstates for trips to work, shopping, business, and recreation. This infrastructure is also critically important in that it provides the system for delivering our goods and services, emergency response, and is also the system that buses travel along. 13 Douglas County 2030 Transportation Plan November
21 Chapter 2: Study Area Characteristics Roadway Network The 2010 existing plus committed Douglas County roadway network is presented in Figure 2. In order to provide more detail in Northern Douglas County, this area has been enlarged and is presented in Figure 3. As can be seen, the roadway network is made up of various types of roadways with different classifications. These classifications of roadways have different purposes and carry different volumes of traffic. The roadway classifications include Interstates, Major Arterials, Minor Arterials, Collectors, and Local Streets. In assessing and comparing various horizon years, the traffic modeling uses five year increments. Therefore, the 2010 horizon year was selected as the year closest to existing conditions. This network includes all Douglas County existing roadways, from Collector and above plus those committed improvements that will either be completed or in construction by A list of the committed Douglas County roadway improvements is presented in Table 2. The backbone of the existing roadways are federal and state facilities owned and maintained by the Colorado Department of Transportation (CDOT). There are three north-south federal and state facilities which provide continuity throughout the County. Interstate 25, which is central to the County, is the primary transportation corridor through the County. Hwy 67, US-85/County Road 105 (Perry Park Road) to the west, and US/83 (Parker Road) to the east provide continuity through the County, but serve substantially lower through traffic volumes. The C-470/E-470 corridor along the north county line and the SH 86 corridor located easterly from Castle Rock comprise the two primary east-west facilities serving the County. What are the factors which affect the capacity of a roadway? There are many factors which affect the capacity of a roadway. The number of lanes is the most important factor, but design features such as the width of the travel lanes or whether the roadway has shoulders also affect the roadways carrying capacity. The percent of trucks can also reduce the capacity of the roadways because of their slower speeds. Conversely, providing passing lanes along 2-lane roads can increase capacity. One key factor which affects the capacity of a roadway is access. The interstate with only controlled on and off ramps at one mile or greater intervals can accommodate significantly higher traffic volumes per lane than an arterial with numerous access points serving different properties and uses. In addition to traffic volumes increasing over time, which can result in congestion, the capacity of a roadway can be reduced with increased access locations, creating friction between through vehicles and turning vehicles. Also, these access locations can become signalized, which further reduces capacity. Addressing future Douglas County traffic congestion must begin with access control to preserve the maximum capacity of the County s roadways as possible. Douglas County 2030 Transportation Plan November
22 Chapter 2: Study Area Characteristics Roadway Classification The roadway network is based on a range of different types of facilities with varying characteristics that, when combined, make up the roadway system. These facilities range from freeways which serve high-speed, longer-distance trips, to local streets that are designed for lower speeds and shorter trip lengths. Two important variables which define roadway function are mobility and access. Interstates have full access control that allows vehicles to enter and exit only at interchange ramps since mobility is the primary function of a freeway. Local streets, on the other hand, have numerous driveways and connections because their primary function is to provide local access to businesses and residences. In the following discussions of each of the road classifications, the average daily traffic (ADT) for each classification is a general description only. The existing plus committed roadway classifications for individual streets are provided on Figure 2 (page 16) and Figure 3 (page 17). Freeways/Interstates The Freeways within Douglas County, including I-25, E-470 and C-470 provide for the high-speed movement of large volumes of traffic with a minimum of interference. This is accomplished through the use of access control, divided roadways, and grade-separated interchanges. Interstates have the inherent characteristic of lower accident rates because of many built-in safety features such as comfortable alignment, easy grades, speed change lanes, adequate sight distance, and other geometric features that afford a continuous movement of traffic. Major Arterials Major arterials provide a high level of mobility at higher speeds for the longest distances. Access should be controlled with a limited number of intersections, medians with infrequent openings, and no direct parcel access, depending on use and geographic setting. Existing and future land uses adjacent to major arterials shall be served by other network roadways, service roads and inter-parcel connections. Minor Arterials Minor arterials are streets that serve moderate speed and higher-volume traffic over medium distances. Access should be restricted through prescribed distances between intersections and limited direct parcel access. Minor arterials serve major traffic generators and link collector streets with the major arterials. Collectors The collector street system serves intermediate and shortdistance travel. Collectors provide a lower level of mobility than arterials at lower speeds. These streets connect local roads to arterials and have more direct access dependent on use and geographic setting. Local Streets This is the lowest classification of streets. Local streets provide a high level of access to abutting land, but limited mobility. Local streets function primarily to serve local traffic circulation and land access. These streets customarily accommodate shorter trips, has lower traffic volumes, and lower speeds than do collectors and arterials. 15


23 FIGURE 2: 2010 EXISTING + COMMITTED NETWORK - DOUGLAS COUNTY FIGURE 2: 2010 EXISTING + COMMITTED NETWORK - DOUGLAS COUNTY 16
24 FIGURE 3: 2010 EXISTING + COMMITTED NETWORK - NORTH DOUGLAS COUNTY FIGURE 3: 2010 EXISTING + COMMITTED NETWORK - NORTH CENTRAL DOUGLAS COUNTY 17
25 Chapter 2: Study Area Characteristics TABLE 2: COMMITTED SHORT-TERM 2010 DOUGLAS COUNTY ROADWAY IMPROVEMENTS Improvement Projects Street Name From Street To Street Description Hess Rd I-25 Chambers Rd New 2-lane major arterial Local Agencies Plum Creek Parkway Wolfensberger Rd I-25 New 2-lane major arterial (includes Railroad bridge) Plum Creek Parkway Lake Gulch Rd Ridge Rd New 2-lane major arterial Peoria St Crescent Meadow Blvd Ridgegate Pkwy/Mainstreet New 2-lane collector Ridgegate Pkwy/Mainstreet I-25 Meridian Village Pkwy New 2-lane major arterialextension of Mainstreet Town Center Dr Lucent Dr Highlands Ranch Pkwy New 4-lane collector CDOT I-25 Lincoln Ave Founders Parkway Restripe 6 to 8 lanes CDOT I-25 Frontage Ridgegate Pkwy/Mainstreet Castle Pines Parkway New 2-lane minor arterial Douglas County 2030 Transportation Plan November
26 Chapter 2: Study Area Characteristics Existing Traffic Volumes and Congestion Levels Daily and peak hour traffic volumes were collected for this study and used to calibrate the Douglas County Traffic Model. The p.m. peak hour traffic volumes are typically the highest traffic volumes of the day. The p.m. peak hour is also the time period when congestion is the worse and used for determining what improvements are necessary. Presented in Figures 4 and 5 are the estimated 2010 p.m. peak hour traffic volumes based on current traffic counts factored to 2010 conditions. These p.m. peak hour volumes are presented based on directional flow. They are also presented by number (in thousands of vehicles) and graphically in band widths where the thicker the line, the more traffic. In review of the maps, the p.m. outbound flow away from Denver reflecting the commute trip from work to home, tends to be higher then the inbound direction. Also presented in Figures 4 and 5 are congestion levels, with green being uncongested, yellow as congesting, and red as congested. In review of these maps, the majority of the congested roadways are either state and federal roads, or streets within the urbanized cities. Conversely, the majority of the Douglas County roadways are uncongested. What is the Definition of Traffic Congestion? Planners and engineers use a measurement called Level of Service (LOS) to gauge the adequacy of transportation facilities. Similar to grades in school, LOS is scored using letters from A to F, where A represents the best conditions and F represents failure. Level of service scores can be grouped into three color-coded categories as defined below: Uncongested (Level of Service A - C): Corridors that generally operate in free-flow conditions, where the driver tends to be able to travel without undue delay except for typical traffic control operations, such as stop signs or traffic signals. During the peak hour, there might be some delay at a controlled intersection, but generally the driver can get through the intersection within one cycle of the traffic signal. Congesting (Level of Service D): These corridors are roadways where the driver can generally travel in free-flow conditions during the off-peak hours, but might experience having to wait more than one cycle at a signalized intersection during the peak hours or have difficulty changing lanes. Because these corridors are approaching capacity, there can be significant variations in congestion from day to day, fluctuating between acceptable and congested. Congested (Level of Service E F): The congested corridors in Douglas County are those roadways where traffic volumes have either reached or exceeded the facility s theoretical capacity. These facilities experience daily congestion delays where it is not uncommon that a driver might have to wait two or more signal cycles to get through the intersection. Douglas County 2030 Transportation Plan November


27 FIGURE 4: 2010 PM PEAK HOUR TRAFFIC VOLUMES AND CONGESTION DOUGLAS COUNTY FIGURE 4: 2010 PM PEAK HOUR TRAFFIC VOLUMES AND CONGESTION DOUGLAS COUNTY 20
28 FIGURE 5: 2010 PM PEAK HOUR TRAFFIC VOLUMES AND CONGESTION NORTH CENTRAL DOUGLAS COUNTY FIGURE 5: 2010 PM PEAK HOUR TRAFFIC VOLUMES AND CONGESTION NORTH CENTRAL DOUGLAS COUNTY 21

29 Chapter 2: Study Area Characteristics Existing Transit Service There are over 17 different agencies or organizations providing fixed route, demand responsive and specialized transit, or for hire taxi service in Douglas County. Figure 6 presents a map of the key transit services, including RTD and Castle Rock fixed route service, Call and Ride areas, and Front Range Express Service. The following provides a perspective on the primary options available for people who do not have access to a private automobile to get to and from daily activities and employment. Table 3 provides a matrix of all transit service providers by geographic location. RTD The Regional Transportation District (RTD) operates a variety of services within the northern tier of Douglas County and the Parker Road corridor. RTD service is funded primarily through a 1% sales tax on businesses within the RTD boundaries. RTD also accesses Federal Transit Administration funds. RTD services include local and regional fixed route service and connections to light rail stations and services to the greater Denver area. Fixed route services are every 30 to 60 minutes in the peak periods and 60 to 120 minutes in the off-peak. Service hours are from 5:00 a.m. to 11:30 p.m. The majority of these routes are for weekday service only, although some routes provide service on weekends and holidays. Fixed route ridership numbers for Douglas County are not easily attainable given routes traverse county lines and only total ridership per line is available. RTD has performance standards for when a route may be added or removed. Some of the existing fixed route service currently provided in Douglas County is marginally meeting those standards and these routes are in the County s most populous areas. Expanding fixed route service beyond these higher density areas would result in performance less than RTD and industry standards. RTD has two light rail lines, the southwest corridor and the southeast corridor, which provide transit access to Douglas County. The southeast corridor currently has stations in Douglas County and will be extended to south of Lincoln Avenue as part of FasTracks. The southwest corridor stops prior to entering Douglas County, but will be extended into Douglas County as part of FasTracks. RTD also provides call-n-ride demand responsive services in Highlands Ranch, Lone Tree, South Inverness, Meridian and Parker. They also provide Access-a-Ride paratransit service where fixed bus service operates. Castle Rock The Town of Castle Rock Clean Air Shuttle operates three fixed routes. The transit service also provides for route deviation for riders eligible for ADA paratransit service. FREX The Front Range Express (FREX) connects the Fountain, Colorado Springs, Monument, and Castle Rock areas to RTD services at the Arapahoe park-n-ride in Denver and downtown Denver. Castle Rock Senior Center The Castle Rock Senior Center provides demand responsive transportation through a volunteer driver program. The center has approximately 50 volunteer drivers trained in freeway safety and CPR and a fleet of 8 vehicles. Douglas County 2030 Transportation Plan November
30 FIGURE 6: EXISTING TRANSIT SERVICES FIGURE 6: EXISTING TRANSIT SERVICES 23
31 Chapter 2: Study Area Characteristics TABLE 3: TRANSIT SERVICE PROVIDERS BY GEOGRAPHIC LOCATION * Call ahead to schedule your ride Douglas County 2030 Transportation Plan November


32 Chapter 2: Study Area Characteristics Bicycle Network The existing bicycle network in Douglas County consists mostly of off street paved, unpaved trails, and on street bike lanes, primarily located in the urbanized areas and used for recreational trips. These trails are presented in Figure 7. As can be seen in this figure, there are many uncompleted breaks in the trails which limits their use as a form of transportation. There are no designated bike lanes on rural Douglas County roads. There are some roadways which have existing painted shoulders that bicyclists use. The existing roadway network does provide the basis for implementing a bicycle plan for Douglas County. Roadways which have painted shoulders with sufficient width could be converted to bike lanes. Some of the collectors have lower traffic volumes, no parking, and sufficient width where bike lanes could also be added. As streets and roadways are resurfaced, additional width could be added for a painted shoulder which could be used for bicycling. Douglas County 2030 Transportation Plan November


33 FIGURE 7: EXISTING OFF-STREET BICYCLE TRAILS FIGURE 7: EXISTING OFF-STREET BICYCLE TRAILS 26

34 Chapter 3: Forecasts Douglas County s population will double by 2030 and employment will double or triple. These increases will result in a significant increase in trips which must be converted to travel demand, traffic forecasts, and ultimately transportation mitigations. The following chapter presents the available forecasts and estimates for travel demand used to develop the 2030 multi-modal transportation plan elements. Population and Employment Forecasts There are two forecast estimates for population and employment for Douglas County. These are presented in Table 4 and Figures 8 and 9. DRCOG develops population and employment forecasts by traffic analysis zone for the entire DRCOG region, including Douglas County. This socio-economic data includes population, households by three different income categories, and three different employment classifications; basic employment, retail employment, and service employment. These socio-economic data values are used in the DRCOG regional travel model for forecasting base year, interim, and long-range travel. As can be seen in Table 4 and Figures 8 and 9, DRCOG forecasts both population and employment will double between the 2005 year model base year and the 2030 horizon year. As part of the development of the Douglas County Comprehensive Plan, a set of population and employment forecasts were also made. Whereas the base year between DRCOG and Douglas County were similar for 2005, Douglas County population grew faster in the earlier years and then dropped off in the later years. In review of employment, Douglas County has a much higher assumed growth rate which will triple employment by 2030, compared to the DRCOG forecasts which assume employment will double. 27 Douglas County 2030 Transportation Plan November 2009


35 Chapter 3: Forecasts TABLE 4: DOUGLAS COUNTY POPULATION AND EMPLOYMENT FORECASTS Population Employment Year DRCOG Douglas County Douglas County DRCOG Comprehensive Plan Comprehensive Plan , ,500 86,200 82, , , , , , , , , , , , , , , , , , , , ,700 FIGURE 8: DOUGLAS COUNTY POPULATION FORECASTS FIGURE 9: DOUGLAS COUNTY EMPLOYMENT FORECASTS Douglas County 2030 Transportation Plan November
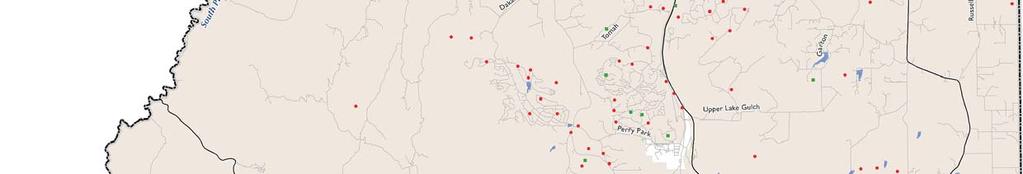
36 Chapter 3: Forecasts It should be noted that one of the key reasons for the difference is that the demographic forecasts in the DRCOG model must adhere to regional control totals. Thus, DRCOG employment forecasts for smaller areas are often not as high as community estimates. In review of the data, there are modest differences between the two datasets and total Douglas County population forecasts. However, there is a significant difference in the employment category with 90,000 more jobs in the Douglas County estimate, as compared to the DRCOG estimates. Presented in Figure 10 are the geographic differences between the DRCOG and Douglas County s population forecasts and Figure 11 for employment forecasts. Utilizing one dataset or the other will result in different forecasts and possibly different transportation recommendations. Therefore, for the travel modeling work effort, model runs were conducted for both scenarios. To seek funding for State and Federal roadways within Douglas County requires consistency with the DRCOG model. Therefore the DRCOG dataset was the primary dataset used. However, in order to assess future traffic conditions with a different distribution of population and employment growth, and with a much higher employment estimate, an additional model run was made using Douglas County s 2030 forecasts. It should also be noted, that for the City of Lone Tree and the Towns of Parker and Castle Rock, the assumed socio-economic data was obtained directly from each jurisdiction. Population Growth by Age In addition to forecasting the growth, it is also important to know how, over time, the age of the population changes. This change is presented graphically in Figure 12. This data is for two years, 2005 and 2030, and is from the Colorado Department of Local Affairs. These forecasts are based on cohort survival from one age category to another over time, plus in migration and out migration. As previously presented, the Department of Local Affairs assumed Douglas County population would double between 2005 and What is critical to both land use and transportation planning for our future is that the 0-20 year old age category will increase by approximately 80%, 20 to 65 year olds also by approximately 80%, but the over 65 year old age category will increase by approximately 550%. Whereas Douglas County currently has a young median age population, that population will grow older and require different transportation needs. The over 65 age group has the highest incident of disabilities which require specialized transportation services. With an increase of 550% in this age group, specialized transportation service demand will increase significantly. Household and Employment Distribution The travel model requires that socio-economic household and employment data be forecasted by traffic analysis zone. This information is presented graphically in Figure 13 for 2005 households and employment and Figure 14 for 2030 households and employment. As can be seen in these figures, there is one dot for each 100 households (red) or jobs (green). It should also be noted that the graphic software used to generate this map randomly places a dot within a traffic analysis zone. The result was that the actual location of the dot does not mean 100 households or jobs are located at that specific spot, but as an analysis tool. It does graphically reflect where current and future households and jobs are forecasted, which indicate what roadways they may be impacting. Douglas County 2030 Transportation Plan November


37 FIGURE 10: DIFFERENCES BETWEEN THE DRCOG AND DOUGLAS COUNTY S POPULATION FORECASTS FIGURE 10: DIFFERENCES BETWEEN THE DRCOG AND DOUGLAS COUNTY S POPULATION FORECASTS 30


38 FIGURE 11: DIFFERENCES BETWEEN THE DRCOG AND DOUGLAS COUNTY S EMPLOYMENT FORECASTS FIGURE 11: DIFFERENCES BETWEEN THE DRCOG AND DOUGLAS COUNTY S EMPLOYMENT FORECASTS 31

39 Chapter 3: Forecasts FIGURE 12: DOUGLAS COUNTY 2005 TO 2030 POPULATION GROWTH BY AGE Douglas County 2030 Transportation Plan November

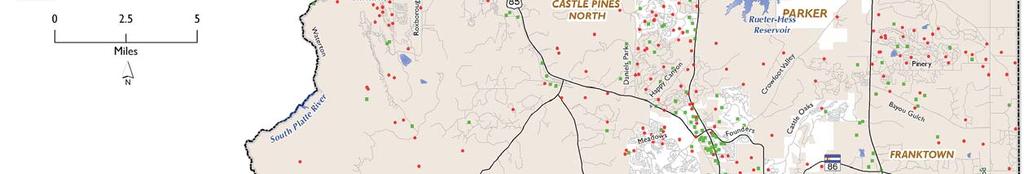


40 FIGURE 13: POPULATION AND EMPLOYMENT FOR 2005 FIGURE 13: POPULATION AND EMPLOYMENT FOR


41 FIGURE 14: POPULATION AND EMPLOYMENT FOR 2030 FIGURE 14: POPULATION AND EMPLOYMENT FOR


42 Chapter 3: Forecasts In review of the 2030 map, population and employment growth will occur in northwest Douglas County, population growth in Highlands Ranch, employment growth in the Lone Tree area, and both population and employment growth in the Towns of Parker and Castle Rock. Population and employment growth in other parts of rural Douglas County was relatively minor and spread throughout the County. FIGURE 15: TRIP TYPES Trip Generation and Internal/External Travel Based on socio-economic data input to the travel model, trip generation was estimated by origin of trip (home to work, home to other, and nonhome based) and by time of day, including an a.m. peak period, a p.m. peak period, and a total average daily traffic (ADT). The travel model also identified where these trips travel to and from. The three basic types of trips included in the travel forecast model are defined below and presented graphically in Figure 15. INTERNAL/INTERNAL: This trip category is comprised of all trips that begin and end within Douglas County. INTERNAL/EXTERNAL: This category includes all trips that begin within Douglas County and end outside of Douglas County, plus those trips that begin outside Douglas County and end within Douglas County. EXTERNAL/EXTERNAL: These are trips which both begin and end outside of Douglas County, but travel through the County. The resulting internal and external trip estimates by year for the 2010, 2020, and 2030 DRCOG and 2030 Douglas County Comprehensive Master Plan estimates are presented in both Table 5 and Figure 16. Douglas County 2030 Transportation Plan November


43 Chapter 3: Forecasts TABLE 5: INTERNAL/EXTERNAL TRAVEL BY YEAR 2010 DRCOG 2020 DRCOG 2030 DRCOG 2030 DC CMP Internal / Internal 598,800 48% 834,200 51% 972,800 49% 1,244,600 54% Internal / External 604,400 48% 753,400 46% 927,200 47% 988,600 43% External / External 52,700 4% 63,700 4% 80,700 4% 66,800 3% Total Trips 1,255, % 1,651, % 1,980, % 2,300, % FIGURE 16: INTERNAL/EXTERNAL TRAVEL BY YEAR Douglas County 2030 Transportation Plan November

44 Chapter 3: Forecasts In review of the data, it can be seen that one-half of all trips generated in Douglas County travel outside Douglas County, or vice versa. Many of these Douglas County trips are located in the northern portions of the County, which easily travel back and forth over the northern County line. Another observation is that with the 2030 employment forecasts based on the Douglas County CMP, as compared to the DRCOG estimates, the percent of all traffic which remains internal to Douglas County increased. This was because of the improved jobs to housing balance. It should also be noted that with this increased employment base per the Comprehensive Master Plan, total trips increased by approximately 16% compared to the DRCOG forecasts. 2010/2030 Travel Demand A graphic presentation of internal/internal and internal/external travel demand by district is presented in Figures 17 and 18. Seven districts were selected to reflect various locations within Douglas County. These districts are generalized, but they do begin to tell the story about travel within and out of Douglas County. Figure 17 presents the 2010 travel demand in blue, whereas Figure 18 presents travel demands for both 2010 and 2030 in blue and red respectively. The wider the bands, the higher the travel demand. The darker color bands represent internal to internal travel and the lighter color bands represent internal to external travel. In review of the figure, the external travel to the Denver region is well pronounced. Because of Denver regions size and opportunity, even the Castle Rock districts generate more trips traveling to the Denver region than to northern Douglas County. Consistent with a doubling of development, much of the traffic volume on Douglas County s travel corridors will similarly double. Douglas County 2030 Transportation Plan November


45 FIGURE 17: 2010 TRAVEL PATTERNS FIGURE 17: 2010 TRAVEL PATTERNS 38


46 FIGURE 18: 2030 TRAVEL PATTERNS FIGURE 18: 2030 TRAVEL PATTERNS 39

47 Chapter 4: Roadway Vision Plan The roadway network forms the backbone of the entire multi-modal transportation system in Douglas County. In addition to automobiles, roads accommodate transit and commercial vehicles carrying freight. Streets and Interstates are an important part of the local and national economy and they provide mobility for most ground transportation users. Historically, the automobile and roadway construction have dominated transportation investments in Douglas County. For the foreseeable future, the automobile will likely continue to be the primary mode of transportation, but as opportunities present themselves, adding shoulders and bike lanes will begin to create an opportunity for bicycling. The roadway network must continue to be maintained and improved to keep pace with growth. The Roadway Vision Plan provides a guideline for future roadway improvements. These improvements may change with different or new proposed development. Roadway Hierarchy The Roadway Vision Plan is based on the roadway hierarchy of streets in the County s Roadway Standards. These roadways include, but are not limited to Freeways, Major Arterials, Minor Arterials, Collectors, and Local Streets. As presented in Figure 19, the higher the level of roadway, the higher volumes of regional and sub-regional traffic and the less emphasis on access. 40 Douglas County 2030 Transportation Plan November 2009


48 Chapter 4: Roadway Vision Plan FIGURE 19: RELATIONSHIP BETWEEN MOBILITY AND ACCESS Roadway Vision Plan Development Process The process for determining the recommended Roadway Vision Plan was based on a three tier process: technical analysis, review by County and local jurisdictional stakeholders, and public input. This process was iterative. If a proposed improvement is evaluated, its effect may not be sufficient enough to mitigate traffic impacts or may affect travel on other corridors. Capacity reductions caused by vehicles turning on and off arterials should be kept to a minimum through controlled and limited access. The lower roadway classifications, including Collectors and Local Streets, should limit through traffic and are designed for slower speeds and for providing local access. A more complete list of characteristics of each roadway, including the service performed, access, and intersection spacing is presented in Table 6. Cross sections are shown in the Douglas County Roadway Standards. Technical The technical evaluation of the proposed roadway network was from the Douglas County Travel Demand Model (see Douglas County Travel Demand Model page 44). The transportation model forecasted p.m. peak hour trips and determined the facilities level of congestion, based upon attributes of the roadway network. If congestion was forecasted, improvements such as widening were tested to see if the congestion was resolved. Alternative transportation modes including transit and bicycle were also tested. Proposed improvements from the City of Lone Tree and the Towns of Parker and Castle Rock were all based on their respective transportation plans and were assumed in the analysis. State and federal freeway improvements were limited to the regional improvements identified by DRCOG. Douglas County 2030 Transportation Plan November
49 Chapter 4: Roadway Vision Plan TABLE 6: FUNCTIONAL CLASSIFICATION CRITERIA CHARACTERISTICS Functional Classification Characteristics Freeways/Interstates Major Arterials Minor Arterials Collectors Local Streets Function Service Performed Typical Trip Lengths Average Daily Traffic (ADT) Mobility Only Traffic movement, highest speed, no direct land access. Interstate and between major regions of metro area. Mobility Primary Accessibility Limited Traffic movement, high speed, limited land access. Between major regions of Douglas County. Mobility Primary Accessibility Secondary Traffic movement, relatively high speed, minimal land access. Between and within communities. Accessibility and Mobility Equal Frequent land access, relatively low speeds. Within communities. Connects residential and business areas to arterials. Accessibility Only Direct land access, lowest speeds. Within neighborhoods and business centers. 50, ,000 50,000 3,500 25,000 1,000 7, ,500 Continuity External External Internal External Internal Internal Internal Internal Internal Only Access/Intersection Type & Spacing Interchanges at 1 to 1½ mile spacing, no at-grade signalized intersections. No private access. At-grade signalized intersections at ½ mile spacing. Private access restricted. At-grade signalized, roundabout, and stop controlled intersections at 1/8 to 1/2 mile spacing. Private access usually restricted. Signalized, stop controlled, or roundabout intersections at 1/8 mile spacing. Stop controlled, roundabout, or uncontrolled intersections. Unrestricted private access. Roadway Spacing 2 3 Miles 1 2 Miles ½ - 1 Mile ¼ - ½ Mile As Needed Shoulder/Bike Lane No Yes Yes Yes No Douglas County 2030 Transportation Plan November
50 Chapter 4: Roadway Vision Plan Review Subsequent to the initial transportation modeling, results were reviewed by members of the Technical Advisory Committee. This review examined the merits of the improvements and consistency with the findings from other jurisdictional plans. Coordinating facilities at jurisdictional boundaries was important. Public Input The final step was to present the draft Roadway Vision Plan to the public for their input as to whether they concurred that the recommended improvements are appropriate or whether there were other options that should be considered. In some cases, these suggestions were added to the improvement list and re-tested and in others, it was found that the suggestion could not be technically supported Roadway Vision Plan The 2020 Roadway Vision Plan, presented in Figures 20 and 21 and Table 7, identifies roadways that should be targeted for improvements between 2010 and These improvements are highlighted in blue for widening and yellow for new roadways and are necessary to mitigate traffic, which will be generated from future Douglas County and regional development that is forecasted to occur by the year In review of Figures 20 and 21, many of the roadways that need improvements are state and federal facilities. These roadways include C- 470, I-25, US-85, and State Highway 83 (SH 83). These roadways currently experience congestion and will be further congested with the forecasted population and employment growth between 2010 and The following summarizes 2010 to 2020 Douglas County roadway improvements PM Peak Hour Traffic Forecasts and Congestion Levels Forecast 2020 p.m. peak hour traffic forecasts and congestion levels were based on the 2020 DRCOG population and employment forecasts and the Douglas County Travel Demand Model. Predicted volumes, including the recommended 2020 roadway improvements, are presented in Figures 22 and 23. These volumes are by direction, where the wider the band, the higher the volume. The level of congestion is also presented where red is congested and green is uncongested. As can be seen in these figures, the roadways which are forecasted to be congested in 2020, even with some necessary improvements, are the federal and state facilities, including C-470, I-25, US-85, and SH 83. Other roadways with forecasted congestion are primarily within the City of Lone Tree and the Towns of Parker and Castle Rock. In review of the roadways owned and maintained by Douglas County, forecasted traffic will generally be uncongested. Douglas County 2030 Transportation Plan November
51 Chapter 4: Roadway Vision Plan Douglas County Travel Demand Model The Douglas County travel demand model used in preparing the Douglas County 2030 Transportation Plan was developed from the DRCOG Regional Transportation Model. The DRCOG model encompasses the entire Denver region, including Douglas County, and is used for testing and evaluating regional improvements. It is the basis for making long-range transportation funding decisions. Although it is a useful tool for evaluating regional improvements, it does not have the detail to evaluate roadways down to the Collector level. Therefore, the DRCOG model was refined to include additional networks and traffic analysis zones (geographic areas which contain socio-economic data) for testing and evaluating alternatives within Douglas County. As part of this refinement, modeling data was obtained from the City of Lone Tree and the Town s of Castle Rock and Parker. These models contained refined traffic analysis zones with their own socio-economic data forecasts and networks used in developing their respective transportation plans. This data was incorporated into the Douglas County travel demand model. As part of the model development process, estimated 2005 base year model volumes were compared to actual ground counts to validate the accuracy of the model. The comparison involved conducting different statistical tests, including comparison of total vehicle miles of travel (VMT), screenlines (imaginary lines that intersected multiple roadways traveling in a given location), and R-squared analysis, a statistical measure comparing the sum of all counts with the sum of the models estimates. (A complete model validation report is presented in Appendix B.) There were two basic adjustments used to calibrate the model. The first was relocating or adding new centroid connectors, which is how traffic from a traffic analysis zone loads on the roadway. These adjustments improved how the model reflected actual travel patterns. The second adjustment was K Factors. K Factors identify the propensity to travel within an area or between areas. Based on the initial model runs, the model predicted more traffic between Douglas County and Denver then actual traffic counts indicated and less traffic between northern Douglas County and Castle Rock. With the appropriate adjustments to the K Factors, these problems were corrected. Based upon initial model runs, adjustments were made to the model to better reflect actual Douglas County travel. Based on the changes and refinement process, the resulting model calibration was rated very high based on standard travel demand model validation measurements. It should be noted that like any well calibrated transportation model, the model will achieve high predictability for given input assumptions, including population and employment estimates. Factors, such as the economy or cost of gas, may affect these forecasts. Douglas County 2030 Transportation Plan November


52 FIGURE 20: 2020 ROADWAY NETWORK FIGURE 20: 2020 ROADWAY NETWORK 45
53 FIGURE 21: 2020 ROADWAY NETWORK NORTH CENTRAL DOUGLAS COUNTY FIGURE 21: 2020 ROADWAY NETWORK NORTH CENTRAL DOUGLAS COUNTY 46
54 Chapter 4: Roadway Vision Plan TABLE 7: RECOMMENDED 2020 ROADWAY IMPROVEMENTS Street Name From Street To Street Improvement Description CDOT Projects* Local Agency Hess Rd I-25 Chambers Rd Widening major arterial from 2 to 4 lanes Titan Rampart Range Rd Titan Park Cir Widening from 2 to 4 lanes Waterton East Roxborough Park Rd Airport Road New Roadway, 2-lane minor arterial Plaza / Erickson Extension Erickson Rd US-85 New 2-lane minor arterial University Blvd Quebec St Cotton Creek Dr Widening from 4 to 6-lane major arterial Monarch Blvd McCarthur Ranch Rd Castle Pines Pkwy Widening from 2-lane minor arterial to 4-lane major arterial Lincoln Ave Peoria Chambers Rd Widening from 4-lane to 6-lane major arterial (including bridges) Lincoln Ave Chambers Rd Keystone Blvd Widening to 6-lane major arterial Pine Ln Parker Rd Pine Dr Widening collector from 2 to 4 lanes N Meadows Dr Meadows Dr US-85 New 2-lane major arterial Prairie Hawk Dr Extension/ West Incorporated Area Boundary Frontage Rd Douglas Ln/Crystal Valley Parkway New 2 lane Minor Arterial directly West of and parallel to I-25 Jordan Rd Main Street Hess Rd Widening from 2 to 4 lanes major arterial Hilltop Rd Canterberry Pkwy Hilltop and Singing Hills Intersection Widening from 2 to 4 lane major arterial Pinery Rd Singletree Ln Thunder Hill Rd Widening collector from 2 to 4 lanes Waterton Rd West county boundary Rampart Range Rd Widening from 2 to 4 lanes where not already widened and new bridges over Platte Rampart Range Rd Titan Rd Waterton Rd Widening from 2 to 4 lanes Stroh Rd State Hwy 83 / Parker Rd Preservation Trail New 2-lane minor arterial Crystal Valley Pkwy I-25 Incorporated area boundary Widening from 2 to 4-lane minor arterial C-470 West county line Quebec St Widening from 4 to 6 lane interstate C-470 Quebec St I-25 Widening from 6 to 8 lanes US-85 / Santa Fe Dr C-470 Titan Rd Widening 4-lane major arterial to 6-lane expressway US-85 Titan Rd Just northwest of State Highway 67 Widening 2-lane major arterial to 4-lane expressway US 85 South east of State Highway 67 NW of Meadows Parkway/Founders Pkwy Widening from 2-lane major arterial to 4-lane expressway I-25 I-25/470 Interchange Lincoln Ave Widening from 6 to 8 lanes I-25 / Lincoln Ave Construction of Urban Interchange State Hwy 83 South of Bayou Gulch Rd Russellville Rd Widening major arterial from 2 to 4 lanes * Funding identified in the DRCOG Fiscally Constrained 2035 Regional Transportation Plan is not expected for the majority of these projects. Douglas County 2030 Transportation Plan November


55 FIGURE 22: 2020 PM PEAK HOUR TRAFFIC FORECASTS AND CONGESTION LEVELS FIGURE 22: 2020 PM PEAK HOUR TRAFFIC FORECASTS AND CONGESTION LEVELS 48
56 FIGURE 23: 2020 PM PEAK HOUR TRAFFIC FORECASTS AND CONGESTION LEVELS NORTH CENTRAL DOUGLAS COUNTY FIGURE 23: 2020 PM PEAK HOUR TRAFFIC FORECASTS AND CONGESTION LEVELS NORTH CENTRAL DOUGLAS COUNTY 49
57 Chapter 4: Roadway Vision Plan 2030 Roadway Vision Plan The 2030 Roadway Vision Plan, presented in Figures 24 and 25 and Table 8, identifies roadways that should be targeted for improvement between 2020 and These improvements are highlighted in green and are necessary to mitigate traffic which will be generated from future Douglas County and regional development that was forecasted to occur by the year Also shows new roads (yellow). In review of Figures 24 and 25, there are additional state and federal roadways that need improvements. These roadways include E-470, I-25 south of Castle Rock, US-85 widened from four to six lanes south of Titan, and SH 83 south of Parker. There are also a number of roadway improvements scheduled within the City of Lone Tree and the Towns of Parker and Castle Rock. Douglas County is participating with the towns and CDOT to construct some of these needed regional improvements. With increased growth between 2020 and 2030, there are additional Douglas County roadway improvements which will be necessary to mitigate growth PM Peak Hour Traffic Forecasts and Congestion Levels Forecast 2030 p.m. peak hour traffic forecasts and congestion levels are presented in Figures 26 and 27. They are based on the 2030 DRCOG population and employment forecasts and 2030 recommended roadway improvements. As can be seen in these figures, the major roadways which are forecasted to be congested in 2030 are primarily the federal and state facilities, including C-470, I-25, US-85, and SH 83. Other roadways with forecasted congestion areas are primarily within the City of Lone Tree and the Towns of Parker and Castle Rock. In review of the roadways owned and maintained by Douglas County, forecasted traffic generally travels without congestion. It should be noted that it was assumed that all improvements identified by 2030 have been completed in this analysis. For information regarding construction of any of these improvements, refer to the Douglas County Capital Improvement Projects. Given that many of these improvements are state and federal roadways, and that their funds are severely in peril, actual congestion could be much more serious causing Douglas County residents to seek alternative routes to get to their destinations. Douglas County collaboration with CDOT and private developers will be critically important in addressing future improvements. Four specific areas of future study include: 1) US-85 corridor, 2) C-470, 3) Phasing of Main Street and Hess Road improvements to relieve the Lincoln Avenue corridor, and 4) I-25. Douglas County 2030 Transportation Plan November


58 FIGURE 24: 2030 ROADWAY NETWORK FIGURE 24: 2030 ROADWAY NETWORK 51
59 FIGURE 25: 2030 ROADWAY NETWORK NORTH CENTRAL DOUGLAS COUNTY FIGURE 25: 2030 ROADWAY NETWORK NORTH CENTRAL DOUGLAS COUNTY 52
60 Chapter 4: Roadway Vision Plan TABLE 8: RECOMMENDED 2030 ROADWAY IMPROVEMENTS Local Agency Street Name From Street To Street Improvement Description Plum Creek Parkway Wolfensberger Rd I-25 Widen from 2 lane major to 4 lane major arterial Plum Creek Parkway Lake Gulch Rd Ridge Rd Widen from 2 lane major to 4 lane major arterial Rampart Range Rd Blue Mesa Way Roxborough Dr Widening collector from 2 to 4 lanes Extension of Maroon Cir Meridian Blvd Lincoln Ave New collector extending from Maroon Cir to Lincoln Ave Peoria St E-470 Lincoln Ave Widening 2-lane collector to 4-lane major arterial Peoria St Lincoln Ave Extension of Ridgegate Pkwy Widening 2-lane collector to 4-lane major arterial Ridgegate Pkwy/Mainstreet I-25 Meridian Village Pkwy Widening to 4-lane major arterial Mainstreet Ave Meridian Village Pkwy Chambers Rd Widening 2-lane collector to 4-lane major arterial Chambers Rd Lincoln Ave Main Street Widening 2-lane collector to 4-lane major arterial Pine Dr County Line Rd Inspiration Rd New 4-lane collector E Parker Rd/ CR 8 Canterberry Pkwy Tomahawk Rd Widening major arterial from 2 to 4 lanes Delbert Rd County Line Rd Singing Hills Rd Widening from 2-lane minor arterial to 4-lane major arterial Extension of Delbert Rd Singing Hills Rd Hilltop Rd New 4-lane major arterial Singing Hills Rd Hilltop Rd Delbert Rd Widening 2-lane minor arterial to 4-lane major arterial Todd Dr Jordan Rd Motsenbecker Rd Completing 2-lane collector extension of Todd Dr from Jordan Rd Todd Dr Motsenbecker Rd Dransfeldt Rd extension New 2-lane collector (including new bridge and ROW) Dransfeldt Road extension Twenty Mile Rd Todd Dr extension New 2-lane collector-southern extension of Dransfeldt in unincorp Stroh Rd Motsenbocker Rd J Morgan Blvd Widening 2-lane collector to 4-lane major arterial (includes widen bridge) Stroh Rd extension Preservation Trail Hilltop Rd New 2-lane minor arterial-extension of Stroh Rd Extension of Monarch Blvd Shoreham Cir Legue New 2-lane minor arterial Happy Canyon Rd I-25 New N/S road along Newlin Gulch New 2-lane collector-extension of Happy Canyon Rd Canyons Pkwy Hess Rd Happy Canyon Rd Extension New 4-lane minor arterial Canyons Pkwy Happy Canyon extension Crowfoot Valley New 4-lane minor arterial Crowfoot Valley Knobcone Dr (North of Founders Pkwy) Stroh Rd Widening from 2 to 4 lanes N Pinery Pkwy extension New road off Crowfoot Valley Rd State Hwy 83 New 4-lane major arterial; ext of N Pinery Pkwy Bayou Gulch Rd extension N Pinery Pkwy extension Vistancia Dr New 4-lane major arterial; extension of N Bayou Gulch Rd Bayou Gulch Rd Vistancia Dr State Hwy 83 Widening of 2-lane collector to 4-lane major arterial Wolfensberger Rd Plum Creek Pkwy Prairie Hawk Dr Widening from 2 to 4 lanes N Meadows Dr US-85 I-25 New 4-lane major arterial Park Street Extension Caprice Ct Liggett Rd New 2-lane collector-east and parallel to Prairie Hawk Dr Woodlands Blvd extension Unincorp portions from Black Feather Trl Unincorp portions near Whispering Oak New 4-lane minor arterial Douglas County 2030 Transportation Plan November
61 Chapter 4: Roadway Vision Plan TABLE 8: RECOMMENDED 2030 ROADWAY IMPROVEMENTS (CONTINUED) Local Agency Street Name From Street To Street Improvement Description Prairie Hawk Dr Extension/ West Incorporated area boundary Frontage Rd Douglas Ln Widen 2 to 4 lane minor arterial directly west of and parallel to I-25 County Line Rd Private road east of Erickson Blvd Southpark Ln Widening major arterial from 2 to 4 lanes Roxborough Park Rd Titan New road south of Waterton Widening collector from 2 to 4 lanes Waterton Rd Rampart Range Rd US-85/Airport Widening minor arterial from 2 to 4 lanes S Ridge Rd Uncorp area near Appleton Wy Lake Gulch Rd Surface type improvement and change to 2-lane minor arterial Peak View Dr Wolfensberger Rd Douglas Ln Surface improvement and facility type change to 2-lane collector Prairie Hawk Dr Extension/West South Castle Rock City Limits Tomah Rd New 4-lane minor arterial parallel to I-25 Sky View Ln Bear Dance Dr I-25 Surface type improvement and facility change to 2-lane minor arterial Territorial Rd Skyview Ln Perry Park Ave New road-2-lane minor arterial Extension of Legue Monarch Blvd Happy Canyon Rd New 2-lane minor arterial Douglas Lane / I-25 Interchange New Interchange CDOT Projects* US-85 Titan Rd Just northwest of State Highway 67 Widening 4-lane 6-lane expressway E-470 I-25 Parker Widening from 6 to 8 lanes State Hwy 86 Enderud Rd State Hwy 83 Widening major arterial from 2 to 4 lanes State Hwy 86 State Hwy 83 East county boundary Widening major arterial from 2 to 4 lanes State Hwy 83 State Hwy 86 Lake Gulch Rd Widening major arterial from 2 to 4 lanes I-25 North County Line I-25/C-470 Widening from 8 to 10 lanes I-25 Within I-25/C-470 Interchange Widening from 6 to 8 lanes I-25 Crystal Valley Pkwy South County Line Rd Widening from 4 to 6 lanes * Funding identified in the DRCOG Fiscally Constrained 2035 Regional Transportation Plan is not expected for the majority of these projects. Douglas County 2030 Transportation Plan November


62 FIGURE 26: 2030 PM PEAK HOUR TRAFFIC FORECASTS AND CONGESTION LEVELS FIGURE 26: 2030 PM PEAK HOUR TRAFFIC FORECASTS AND CONGESTION LEVELS 55
63 FIGURE 27: 2030 PM PEAK HOUR TRAFFIC FORECASTS AND CONGESTION LEVELS NORTH CENTRAL DOUGLAS COUNTY FIGURE 27: 2030 PM PEAK HOUR TRAFFIC FORECASTS AND CONGESTION LEVELS NORTH CENTRAL DOUGLAS COUNTY 56
64 Chapter 4: Roadway Vision Plan DRCOG and Douglas County Comprehensive Master Plan 2030 Sensitivity Analysis As stated in Chapter 3, DRCOG and the Douglas County Comprehensive Master Plan have similar total 2030 population forecasts; however, the employment forecasts from the Douglas County 2030 Comprehensive Plan are significantly greater than assumed in the DRCOG forecasts. It should also be noted that the distribution of these locations of population and employment growth is different. Therefore, a model run was prepared which examined the assumed 2030 recommended roadway improvements and the Douglas County 2030 population and employment forecasts. The results of this analysis are presented in Figures 28 and 29. In comparing the Douglas County forecast with DRCOG, estimates of traffic volumes and congestion do not change significantly along County roads. Overall traffic increases, with the higher Douglas County estimates, are more evident along the state and federal roadways. One observation was that traffic along US-85 does not change significantly between the datasets, even though there is a significant increase in population and employment assumed in the Chatfield area, per the Douglas County population and employment forecasts. However, volumes are forecasted to be much higher volumes along I-25. In review of the travel mode, it appeared that even with a 6-lane US-85 and new connections to the Chatfield area, traffic was severely constrained and those that would prefer to use this facility are diverting to another, less congested facility, I-25. The primary trips using US-85 were those that must use this route to get to their destination, many of which were origins and destinations within the Chatfield area. In conclusion, the intensity of development within the Chatfield and northwest Douglas County area with the Douglas County population and employment forecasts exceeded both existing and recommended improvement capacity. Severe congestion will occur without significant additional mitigations. Douglas County 2030 Transportation Plan November


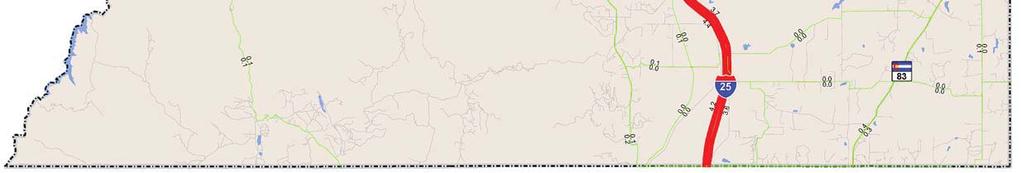
65 FIGURE 28: 2030 PM PEAK HOUR TRAFFIC FORECASTS AND CONGESTION LEVELS WITH 2030 DC CMP POPULATION AND EMPLOYMENT GROWTH FIGURE 28: 2030 PM PEAK HOUR TRAFFIC FORECASTS AND CONGESTION LEVELS WITH 2030 DC CMP POPULATION AND EMPLOYMENT GROWTH 58
66 FIGURE 29: 2030 PM PEAK HOUR TRAFFIC FORECASTS AND CONGESTION LEVELS NORTH CENTRAL DOUGLAS COUNTY WITH 2030 DC CMP POPULATION AND EMPLOYMENT GROWTH FIGURE 29: 2030 PM PEAK HOUR TRAFFIC FORECASTS AND CONGESTION LEVELS NORTH CENTRAL DOUGLAS COUNTY WITH 2030 DC CMP POPULATION AND EMPLOYMENT GROWTH 59
67 Chapter 4: Roadway Vision Plan Mixed-Use Centers The Douglas County Comprehensive Master Plan (CMP) is intended to reflect the future development patterns for Douglas County. One of the land use and transportation visions of the CMP is mixed-use centers supported by alternative transportation modes most notably public transportation, walking, and biking. The mixed-use center design recognizes the link between land use and transportation. There are common land use and transportation elements of mixed-use centers, including a mix of retail, office, and residential land uses, connected by complete streets which serve the automobile, bicycle, pedestrian and transit, and transitfriendly design features. The mixed-use center design encourages a rich diversity of compatible and complementary land uses. Such uses should relate to the physical scale and character of the area. The size, shape, and location of buildings on their parcels should create patterns that help define neighborhood character and local streets. New development should be compatible with and compliment existing development and further the goals planned for the area. Mixed-use centers should include the following transportation design features: 1. The mixed-use centers should maximize internal circulation and minimize conflicts with state freeways and other major arterial roadways that have the primary function of moving high volumes of statewide and regional traffic. 2. Establish multi-modal street cross-sections, design standards, and operational measures to ensure streets are safe, convenient, and appealing for all modes of travel including transit, automobiles, trucks, bicycles, and pedestrians. 3. Provide a dense, interconnected network of local and collector streets that supports walking, bicycling, and transit use, while avoiding excessive traffic in residential neighborhoods. 4. Provide direct bicycle and pedestrian connections within and between residential areas and supporting community facilities and services, such as shopping areas, employment centers, transit stops, neighborhood parks, and schools. 5. Give special consideration to schools and their multi-modal needs to provide a safe, accessible environment for students by giving high priority to bicycle and pedestrian facilities within a two-mile radius of all schools in both new development and re-development. Also in these areas, special design considerations should be made for pedestrian and bicycle crossing of Major and Minor streets. 6. Give special consideration to areas with concentrations of students, seniors, low-income families, or others that are more dependent on modes other than the automobile to provide a safe, accessible environment. 7. Ensure that new developments or re-development projects contribute to providing a safe, convenient, comfortable, and aesthetically pleasing transportation environment that promotes walking, bicycling, and transit use. Appropriate improvements or enhancements to the multi-modal network may be required as a condition of development approval. 8. In areas within the RTD district, work with RTD to ensure that the community is well connected via transit to the regional transit network and that transit stops and waiting areas are safe and comfortable, and enhance intermodal connections. 9. Incorporate Transportation Demand Management (TDM) strategies to alleviate congestion. A range of techniques can be considered, including vanpool/ridesharing programs, parking management, transit vouchers, flextime, and others. 10. Orient buildings to provide pedestrians and bicyclists with easy access and a visually interesting environment that reduces perceived travel distances and increases the understanding of the bicycle and pedestrian networks. Implementing these mixed use center features promote alternatives to the automobile, reduced vehicle miles of travel, and reduces the demand for new roadways. Douglas County 2030 Transportation Plan November
68 Chapter 4: Roadway Vision Plan System Management Improving Douglas County s roadway network by adding new facilities or widening existing roadways is one method for adding capacity. Roadway system management techniques regulate traffic flow and preserve what capacity may exist. The following identifies system management techniques that should be incorporated into the Douglas County s road network or transportation planning. Intelligent Transportation System (ITS) Infrastructure Managing traffic flow along Douglas County s roadway network requires ongoing upgrades into Intelligent Transportation System (ITS) applications. These ITS improvements include signal upgrades, signal system interconnect and upgrades, improved signal maintenance and response times, and preemption/priority control for transit and emergency vehicles. Also, keeping track of traffic flow rates, incidents or congestion, and getting that information to individual vehicle operators will allow for more efficient use of the roadways by assisting drivers in choosing alternate routes. Transportation System Management (TSM) Transportation System Management (TSM) targets problem areas which create bottlenecks in the system. These targeted improvements could include intersection improvements, roundabouts, adding shoulders, curb-lane parking restrictions, and operational improvements. TSM also includes traffic signal coordination, freeway ramp meters, and incident management (crashes, construction, special events, etc.). Access Management Plan Strategies Access Management is the systematic control of the location, spacing, design, and operation of driveways, median openings, and street connections to a roadway. The purpose of Access Management is to provide vehicular access to land development in a manner that preserves the safety and efficiency of the transportation system. Preserving access control is often one of the more difficult policies to maintain. As a development is proposed for Douglas County, the need or desire for that access to sustain their business is often agreed to by decision makers, as it is only one access. This one access, plus the next one, and the next one can reduce the capacity of a roadway by as much as 30% or more. Whereas a roadway may have been designed to carry 30,000 cars a day, it may only have a capacity of 20,000 due to the reductions caused by uncontrolled access. Developing a detailed Access Management Plan is recommended for specific developing corridors so that land developers understand where access may or may not be permitted. This Access Management Plan should be comprehensive so that a consistent approach is applied throughout the corridor. Elements of the Access Management Plan should include: Driveway consolidation and establishment of minimum driveway spacing; Locating driveways away from intersections; Inter parcel access requirements; Construction of a secondary roadway network and parallel access roads to provide access off of the primary roadway; and Integrating Access Management into other planning activities (such as land use plans, zoning and planning regulations, codes, and standards). Douglas County 2030 Transportation Plan November


69 Chapter 4: Roadway Vision Plan What is Travel Demand Management? Travel Demand Management (TDM) is a general term for programs that result in a more efficient use of transportation resources. They aim to influence the demand for travel rather then focusing on the provision of transportation facilities. TDM programs can include numerous strategies that can be described in three basic categories: Increasing vehicle occupancy, Switching to alternative travel modes, and Affecting the time or decision to make a trip. Each of these categories requires the modification of behavior on the part of the traveler. Increasing vehicle occupancy typically includes carpool or vanpool programs combined with ride-matching services. Parking supply and pricing strategies can also influence ridesharing activities. Switching travelers to alternative transportation modes typically involves the increased provision of facilities and services, including bikeways, trails, sidewalks, and transit. Land use changes can also influence alternative mode use, such as increased densities, mixed-uses, and transit oriented developments. Other strategies affect the demand for travel, such as telecommuting programs and shifting work hours outside of the peak rush hours, compressing work weeks, flextime, and others. What are Douglas County Travel Demand Management Policies? Plan walkable communities with bicycle trails and lanes. Identify and support transportation coordinators at major employers, develop feasible goals for trip reductions, and develop codes to be flexible to support TDM activities. Work with DRCOG s RideArrangers to plan and implement appropriate TDM measures. Identify and support opportunities for a local private circulator shuttle system to connect mixed-use centers with regional transit connections. Douglas County 2030 Transportation Plan November
, improve safety, increase efficiency, and minimize lifetime costs.")
70 Chapter 4: Roadway Vision Plan Road Maintenance and Improvements When maintaining and reconstructing existing roadways and bridges, improvements should promote complete streets (opportunities for bicycles and pedestrians), improve safety, increase efficiency, and minimize lifetime costs. As Douglas County roadways are improved or maintained, the following guidelines are recommended: Construct improvements to current design standards; Improve intersections to serve future volumes (turn lanes, etc.); Provide acceleration/deceleration lanes in appropriate locations; Provide appropriate curb/gutter/sidewalk sections on urbanized streets and shoulders on rural roadways; Provide appropriate space and/or treatments for on-street bicyclists or separate trail; Provide applicable crosswalks markings and devices at locations with pedestrian and bicycle activity; Install traffic signals as warranted where more appropriate than other traffic control devices; and Rebuild intersections as roundabouts to improve safety and reduce delay. Douglas County 2030 Transportation Plan November
71 Chapter 5: Transit Vision Plan T he Transit Vision Plan identifies how to develop transit services to meet current and anticipated demand. The Transit Vision Plan focuses on establishing rural, inter-community and specialized transportation services for that part of Douglas County outside the Regional Transportation District (RTD) boundary. It primarily addresses the services needed from unincorporated areas to municipalities and between municipalities. The Transit Vision Plan also proposes a decision-making process that will provide for connections between RTD transit services and the services provided for other areas of Douglas County, for coordination between modes and between transit providers, and for advocacy for transit services that will best meet the needs of all County residents. The Transit Vision Plan is based on demand for transit and the services needed to meet the identified needs. The Transit Vision Plan also presents a concept for an institutional structure for managing, funding, and delivering services. There are several issues that emerged through the planning process that set the stage for the analysis and recommendations. These are: Boundaries are an important consideration as they define the portions of the County within and outside the RTD service area, the portions of the County that are urban and rural, and the limits of the various municipalities and other districts; It will be important to provide for services that mirror local travel patterns with good connectivity between the rural and urban portions of the County; There are human service transportation needs both in the urban and rural portions of the County; There are limited providers in the County; and Funding is limited and issues of how costs are shared will be important. 64 Douglas County 2030 Transportation Plan November 2009
72 Chapter 5: Transit Vision Plan Demand Analysis There are several tools available to assist in identifying demand for transit services. These different tools and approaches were used to converge on a range of demand that were then considered for the development of service alternatives. The demographic and travel characteristics of the region were used as a starting point to determine anticipated demand for service. In addition, national and local experience was used to estimate demand for transportation services. areas. Within Castle Rock the increase in elders with disabilities is also significant. This chart also identifies how the area outside Castle Rock will have growing specialized transportation needs. FIGURE 30: INDIVIDUALS WITH DISABILITIES IN RURAL DOUGLAS COUNTY For Douglas County, age and disability status are the primary indicators for determining transit demand. Over the 20-year planning horizon for this Transit Vision Plan, the aging of the population will have a significant impact on the need for public transit and specialized transportation services. The number of elderly in 2005 and in 2030, based on an examination of Colorado Department of Local Affairs and US Census data show that while the overall population is anticipated to double in this time period, the population above age 65 will increase by 500%. A related and important characteristic is the number of individuals with disabilities. Therefore, it is useful to understand the impact of growth in disabilities in the portion of Douglas County not served by RTD. Figure 30 estimates the number of the individuals with disabilities for Castle Rock and the rest of Douglas County that is outside the RTD service area. These are the individuals most likely to need transportation assistance in order to live independently and maintain a job. This figure identifies those age 16-64, who may be in the workforce, and those ages 65 and over, whose travel needs may be more oriented to independent living. The level of those ages 65 and over is anticipated to increase most rapidly, especially in the small communities and unincorporated County Douglas County 2030 Transportation Plan November
73 Chapter 5: Transit Vision Plan Transit Analysis Findings Based on transit demand analysis, there are three key findings that were identified for defining the Transit Vision Plan. These are: 1. There are not sufficient densities in 2005 and 2030 to warrant additional fixed route transit service in areas served outside the RTD service area and Castle Rock, except for the Town of Castle Rock to Lincoln Avenue and Castle Rock to Parker. 2. Improved mobility is needed, particularly for human service agency trips, but the demand estimation shows that overall levels of demand are low to moderate and will remain in this range even as Douglas County grows. 3. Even though the northern urbanized portion of Douglas County is in the Regional Transportation District, there remain transportation needs in this area. It will be important to provide connectivity to RTD services and address human service transportation needs not met by RTD. Transit Vision Plan The Transit Vision Plan includes service in the I-25 corridor and services linking rural communities to urban areas. These services are presented in Figure 31 and described in the following sections. Service in the I-25 Corridor Limited fixed route transit services operated between Castle Rock and Lincoln Avenue in the I-25 corridor would accomplish several objectives: Serve employment trips early and late in the day. Riders could connect to RTD services (either call-and-ride or light rail) to access jobs. Douglas County 2030 Transportation Plan November 2009 Serve individuals who wish to access medical services in the Sky Ridge medical center. Provide a link for northern Douglas County residents to access services or jobs in Castle Rock. Service alternatives include operating either one or two vehicles during the peak hour and one vehicle operating mid-day. Service would take passengers from downtown Castle Rock to Lincoln Avenue where passengers could board light rail or take other trips. The service can also be operated weekdays only or also on Saturday. Saturday service would not have the employment trips, but would enable people to access stores and services in northern Douglas County. Rural Intercommunity Services Services linking rural communities to urban areas represent another area of need. The proposed services are designed to provide transportation for the basic activities of daily living for individuals who do not need daily access to employment. The demand is not adequate from rural areas to urban areas and in the Parker/Castle Rock corridor to warrant service designed to meet commuter needs. The rural intercommunity transit vision illustrated in Figure 31 includes a limited fixed route service between Parker and Castle Rock. This is shown with a dashed line as it only is proposed to operate six trips per week two days per week with four trips on each day. The proposed trips are one morning trip, one mid-day trip, and two late afternoon trips. This would enable a person to conduct half-day or fullday activities in Parker or Castle Rock. 66
74 FIGURE 31: PROPOSED TRANSIT SERVICE FIGURE 31: PROPOSED TRANSIT SERVICE 67
75 Chapter 5: Transit Vision Plan Demand response service is also proposed and presented in Figure 31. These demand response service areas show some overlap and should be considered approximate zones. They can be adjusted based on actual demand for travel after service is initiated. The demand responsive service would require one vehicle that would provide demand responsive service two days a week in the northwest Douglas County and one day a week in south central Douglas County. This same vehicle would provide limited fixed route service from Castle Rock to Parker and demand responsive service in east Douglas County two days a week. All proposed transit service would be eligible for Federal Transit Administration funding for vehicle capital costs and operating costs. The primary ADA requirement for this rural service is that the vehicle be wheelchair accessible. Douglas County 2030 Transportation Plan November


76 Chapter 6: Bicycle Vision Plan Douglas County s population includes a significant number of young and affluent people. They desire the opportunity to ride their bicycles for recreation, exercise, and as a means of transportation. The development of a bicycle network is an important component of a balanced transportation system. Bicycling can be a healthy alternative to the automobile for many trips. It can also play a role in helping to reduce traffic congestion, improve air quality, and enhance the quality of life in the County. Currently, the bicycle network is virtually non-existent within Douglas County. However, with modest improvements, such as converting shoulders to bike lanes, adding bike lanes to some collector streets, and completing some missing links, the beginnings of a viable Douglas County bicycle network will evolve. This Bicycle Vision Plan is made up of three sets of improvements for immediate implementation (2010), mid-range improvements (2020), and improvements to be completed by This Bicycle Vision Plan is presented graphically in Figures 32 and Bicycle Concept Plan Currently, most bicycle facilities that exist in unincorporated Douglas County are off-street recreational trails that are located within the Highlands Ranch open space area and in rural Douglas County. Although these trails are popular for exercise and recreation, they do not form a network that would allow users to plan a trip to travel from one location to another or for commuting. 69 Douglas County 2030 Transportation Plan November 2009


77 FIGURE 32: DOUGLAS COUNTY BICYCLE PLAN FIGURE 32: DOUGLAS COUNTY BICYCLE PLAN 70
78 FIGURE 33: DOUGLAS COUNTY BICYCLE PLAN NORTH CENTRAL DOUGLAS COUNTY FIGURE 33: DOUGLAS COUNTY BICYCLE PLAN NORTH CENTRAL DOUGLAS COUNTY 71
79 Chapter 6: Bicycle Vision Plan The key to the Bicycle Vision Plan is to create a system of bikeways that bicyclists ride from one area to another. The existing unconnected trails or roadways with shoulders do not create a contiguous system. Therefore, the first phase of the Bicycle Vision Plan is to identify as many of the existing shoulders which are potential bike lane segments that could be assembled into a system. It was recognized that not all of the improvements would be completed in 2010, but they could all be completed within the next 2 to 3 years. The arterials in the Highlands Ranch area generally have shoulders of sufficient width that could be converted to on-street bike lanes. With some minor striping of bike lanes at intersections to assist the bicyclists, the Highlands Ranch trails and bike lanes begin to create a robust bicycle network for travel. Collector roads are also candidates for adding bike lanes. Restriping these collectors to include bike lanes provide another layer of bicycle improvements that would occur on lower volume roadways Bicycle Concept Plan The second phase of the Bicycle Vision Plan is to target key roadways which connect the population areas of Douglas County and add shoulders to these facilities so that they can be used safely by the bicyclist. It should also be noted that the addition of shoulders to a roadway increases the capacity of the roadway. Therefore, there is a dual benefit for adding shoulders. Key corridors which would be targeted for adding shoulders include US-85, SH 83, and Lincoln Avenue. Some of these roadways, such as US-85, have also been identified as needing roadway widening. Roadway widening projects should include shoulders with adequate width to accommodate bicyclists. Douglas County 2030 Transportation Plan November 2009 The 2020 Bicycle Network expands from the 2010 system by providing connections between Highlands Ranch and Castle Rock, providing extended loops along Lake Gulch and Russellville, and includes off-street trail along Lincoln Avenue which would connect Highlands Ranch with Lone Tree and Parker. Bike Routes, Lanes, and Paths How Are They Different? Bikeway - A general term for any street or trail which in some manner is specifically designated for bicycle travel, regardless of whether such facilities are designed for the exclusive use of bicycles or are to be shared with other transportation modes. Trails/Paths - This is a bikeway that is physically separated from motor vehicle traffic by open space or a barrier and is either within the road right-of-way or within an independent right-of-way. These are also referred to as a shared-use or multi-use paths or recreation trails. Bicycle Lane - This is a bikeway on a portion of a street that has been designated by striping, signage, and pavement markings for the exclusive use of bicycles. Bicycle Route - A segment of a system of roadways signed for the shared use of automobiles and bicyclists without striping or pavement markings, often used to connect other parts of a bikeway system. Bike routes can also provide connections between trail segments or on-street bike lanes to provide continuity. 72
80 Chapter 6: Bicycle Vision Plan 2030 Bicycle Concept Plan The final phase of the Bicycle Vision Plan would be to expand the identified Douglas County rural Collector and Arterial roads to include paved shoulders. The AASHTO Guide for the Development of Bicycle Facilities notes that in rural areas "adding or improving paved shoulders often can be the best way to accommodate bicyclists" and they have the additional attraction of providing a variety of benefits to motorists and other road users as well, including increasing the roadways capacity and safety. Paved shoulders should not be less than four feet. This measurement should be the useable width and should not include the gutter pan or any area treated with rumble strips. Five feet or more should be provided when adjacent to a guardrail or other barrier. Paved shoulders, whether they are designated and signed as bike lane or not, provide a great place for people to ride. Most communities do not designate or mark their paved shoulders as bikeways, but some do. American Discovery Trail The American Discovery Trail (ADT) is the nation s first coast-tocoast, non-motorized recreation trail. It traverses urban, public, and wilderness trails from Delaware to California and goes right through Douglas County. The trail enters the county near Palmer Lake and goes north through Pike National Forest and eventually connects to the trails in Roxborough and Chatfield Parks. Its addition to the National Trails System is now in legislation and will provide the backbone to trails in the nation by connecting them together. Many communities, including Canon City, are developing trails partially due to the ADT passing through their areas. Being cognizant of the ADT and supporting the legislation to add it to the National Trails System will behoove Douglas County citizens by providing cohesiveness to the trails in and around the County. Douglas County 2030 Transportation Plan November


81 Chapter 6: Bicycle Vision Plan Techniques for Adding Bike Lanes Bicycles are vehicles and need to be safely accommodated on our streets and roadways. Over half of all bicycle/motor vehicle crashes occur at or near intersections or other accesses. Improvements at these locations have the potential to significantly increase safety. Specialized intersection markings that may help bicyclists and motorists safely navigate through intersections and use of innovative techniques are gaining more prominence in many communities. Roadway Modifications Roadways can be modified often by reducing the width of existing travel lanes or reducing the number of travel lanes on a given roadway. Many modifications are conversions of four-lane undivided roads into three lanes, two through lanes, and a center turn, often including bicycle lanes, sidewalks, and/or on-street parking. These modifications have been shown to improve mobility and access for all travel modes, enhance safety by reducing vehicle speeds, and to promote bicycling. A variety of reconfigurations are possible depending on the current configuration, user needs, and potential operational and safety outcomes. Roadway lane narrowing may also help to reduce vehicle speeds and enhance movement and safety for pedestrians and bicyclists. Lane narrowing is best used where motor vehicle speeds are low. Lane widths can be reduced and excess pavement striped with a bicycle lane or shoulder. Road Modification Douglas County 2030 Transportation Plan November


82 Chapter 6: Bicycle Vision Plan Techniques for Improving Safety Access Management Managing the number and spacing of driveways and street access protects the bicyclists and the automobile driver traveling along the roadway from conflicts with those entering/leaving the roadway. Access Management includes such measures as limiting the number or establishing minimum spacing between driveways; providing for right-in, right-out only movements; restricting turns to certain intersections; and using non-traversable medians to manage left- and U-turn movements. Bicycle Maps Even great bikeways can be well-kept secrets if the average rider can t find them. Many bicyclists would like to see annually updated maps, as shoulders are converted into bike lanes or when shoulders are added to rural roads. A well-designed bike map is typically in high demand and can serve many functions. In addition to showing the best route for getting places, bike maps often contain information or advertising for a variety of resources including a calendar of bike events, location of bike shops, points of interest in the community, laws and local ordinances pertaining to bicycles, and safety tips for the rider and motor vehicle driver. Thus, a good bike map can be a tool for promoting bicycling, as well as for educating and informing riders and motorists. As part of the 2010 Bike Plan, Transportation staff will finalize the format of a Bike Map for Douglas County. Douglas County 2030 Transportation Plan November

83 Chapter 7: Implementation of the 2030 Transportation Plan The Douglas County 2030 Transportation Plan (the Plan) is a part of the recent Comprehensive Master Plan (CMP) update. The development of the Plan was coordinated with neighboring jurisdictions, regional transportation related agencies, and reflects public input from three open house meetings. The 2030 Plan integrates all travel modes and known plans into a single document. The Douglas County 2030 Transportation Plan provides the transportation vision and goals for the future and satisfies the goals in section 7 of the CMP. This chapter on implementation includes recommended actions regarding modifications to County policies, standards, regulations, traffic operation changes, funding, and collaboration with other agencies. It begins with a discussion on funding because of the importance of funding the projected needs of the County to relieve existing deficiencies, to improve the function of the existing transportation system, and to provide additional, alternative, or expanded transportation facilities if future growth follows the CMP. Transportation Funding Without adequate funding, the Goals and Objectives within the newly adopted CMP cannot be met, specifically Goals 7-1, 7-2, and 7-4, which identify the need for improving safety, access, facilitate cost-effective operations & maintenance, improve air quality and reduce congestion, and to include a multi-modal option for trips within the area. It is important to note that funding projects from Douglas County budgeted monies is the prerogative of the elected Board of County Commissioners, acting through various processes, such as the adoption of the budget for the annual Capital Improvement Program (CIP), by establishing priorities regarding capital and maintenance expenditures, by seeking and accepting various grants from other agencies, by approving design and construction standards, thereby affecting the cost to construct, and by the creation 76 Douglas County 2030 Transportation Plan November 2009
84 Chapter 7: Implementation of the Plan and approval of various Intergovernmental Agreements (IGA) and other contracts involving funds from other sources. Additionally, although the Planning Commission reviews and makes recommendations regarding development within the County, it is up to the Board of County Commissioners to require individual development related improvements, including the establishment of the responsibilities for funding and timing of development related improvements. The success of the 2030 DCTP as an element of the CMP is contingent on having adequate revenues to construct the improvements needed now, and future improvements that will serve all modes of travel identified in the Plan private passenger cars, trucks, buses, bicycles, and pedestrians. If there is insufficient transportation funding, either the land use assumptions of the CMP should be modified, the projected growth delayed beyond the target years identified, or the transportation section goals of the CMP and related development standards relaxed, as the transportation system will become overburdened. Thus resulting in increased air pollution, higher cost for users of the roadways, and reduced safety. Figure 4 in Chapter 2 identifies the existing (2010) congestion levels assuming that projects identified on the 2010 plan are funded and built. This map shows various roadways that are currently or projected to continue operating at LOS D, E, & F which need improvements even with no additional growth or added traffic. Since the transportation system has current problems, some level of funding should be allocated to solve those existing problems by improving the function and operational efficiency of the existing system, and to solve existing congestion and safety problems. Chapter 4, Roadway Vision Plan, identifies the future problems and the improvements needed mainly due to future growth. Additionally, to provide a more multi-modal transportation system, three other programs should be funded: 1) Transit recommendations in Chapter 5 with Douglas County as a transit coordinator but not as a transit provider will still require some effort and associated costs on the part of the County; 2) The second program, detailed in Chapter 6, provides for the development of a bicycle network consisting of the existing off-street trails, which are used mostly for recreation, combined with a new on-street bicycle network countywide which can be used for all types of trips. The bicycle program will also add some costs to the transportation plan for both existing needs and future growth; and 3) Lastly, the Transportation System Management (TSM) strategies and Travel Demand Management (TDM) program identified in Chapter 4 will require additional staff time, funding, and modification of some of the existing development regulations within the Douglas County Community Planning and Sustainable Development Department. Throughout the 2030 DCTP, which forecasts changes to the County expected by 2030 as development occurs in compliance with the CMP, the 20-year planning period is divided into two decades, or phases, which are , and This is done only for purposes of estimating the sequence of growth related improvement needs. These projects are included in each decade plan based upon the current best guess as to when they will be needed. Actual priorities, funding, sequence of construction and projects are created within the CIP process, not in this Plan. Major arterial and collector roadway improvements by phase are presented in Figure 34. These same improvements are presented in Figures 35, 36, and 37 for 2010, 2020, and As presented in these figures, there are 66 Douglas County roadway improvements, 17 Colorado Department of Transportation, and one E-470 project that are needed to accommodate 2030 growth without exceeding the level of service standards used by Douglas County, or in some instances where it is not deemed possible to meet those standards for LOS, without exceeding the existing level of service. Each roadway is analyzed using the afternoon rush hour, or the PM peak hour (PMPH). Also included are numerous TSM and bicycle projects. Douglas County 2030 Transportation Plan November


85 FIGURE 34: MAP OF IMPROVEMENTS BY PHASE FIGURE 34: MAP OF IMPROVEMENTS BY PHASE 78 78


86 FIGURE 35: MAP OF 2010 IMPROVEMENTS BY TYPE FIGURE 35: MAP OF 2010 IMPROVEMENTS BY TYPE 79 79


87 FIGURE 36: MAP OF 2020 IMPROVEMENTS BY TYPE FIGURE 36: MAP OF 2020 IMPROVEMENTS BY TYPE 80 80


88 FIGURE 37: MAP OF 2030 IMPROVEMENTS BY TYPE FIGURE 37: MAP OF 2030 IMPROVEMENTS BY TYPE 81 81
89 Chapter 7: Implementation of the Plan These 66 Douglas County roadway improvements, 17 Colorado Department of Transportation, and one E-470 project are also listed in Table 9 by phase. Improvements scheduled to address 2010 commitments or are expected to be completed or initiated by or soon after 2010 are projects 1A to 7B. Projects 1B to 31 are required for growth based on 2020 forecasts and projects 2B to 79 are required for Note: All project numbers throughout the Douglas County 2030 Transportation Plans are based upon their map location, not on any priorities or sequence of construction. In order to provide a planning level estimate of the cost for these improvements, unit cost estimates previously developed from recent regional transportation planning studies were used for each improvement type and length. The total estimated cost to implement all of the major improvements on Douglas County roadways required by the growth within the 2030 CMP and included in the Douglas County 2030 Transportation Plans is approximately $500 million without TSM, Transit, Bicycle or ITS/TDM, which is estimated to add another $50 million. (Note: This $550 million of needed Douglas County transportation funding does not include funding of improvements on the state and federal highway system.) Estimated costs excluding major projects are as follows: TSM $30 million ITS/TDM $10 million Bike Plan $5 million Transit $5 million ($10 million from other sources) The need for identifying funding sources for $550 million in local Douglas County transportation expenditures plus millions of dollars more for CDOT projects to improve state and federal highways is critical. Figures 38, 39, and 40 reflect congestion levels with funding provided and improvements made for the years of 2010, 2020 and The 2010 congestion condition, as presented in Figure 38, reflects approximately $51 million in local Douglas County funding is used for projects. Even with these improvements completed, there are segments, primarily on the state and federal highway system, which remain congested. Without the $51 million in local Douglas County funding, congestion would be much worse. The 2020 congestion conditions as presented in Figure 39 assumes an additional $131 million in local Douglas County expenditures have been made and in Figure 40, the 2030 congestion conditions are assuming an additional $318 million dollars in local Douglas County funding has been allocated and spent on projects, for a total of $500 million. Even if that amount of funding is provided, both figures show increased congestion levels in Douglas County, particularly on state and federal roads. These 2020 and 2030 congestion conditions reflect CDOT funding of the state and federal highways system as well. The $50 million for TSM, ITS/TDM, Bike Plan, and Transit would be used to mitigate congestion and safety problems as identified by further study and are not shown on the project maps. This would be an annual cost of $2.5 million. If local, state and federal transportation funding is not obtained soon, and growth still occurs, the congestion maps for 2020 and 2030 will be significantly worse, creating a major grid-lock on Douglas County s roadway network. Douglas County 2030 Transportation Plan November
90 Chapter 7: Implementation of the Plan TABLE 9: RECOMMENDED ROADWAY IMPROVEMENTS AND COSTS BY PHASE Imp Num Street Name From Street To Street Improvement Description Responsible Party Total Cost ($M) A Hess Rd I-25 Chambers Rd New 2-lane major arterial DC $26.0 2A Plum Creek Parkway Wolfensberger Rd I-25 New 2-lane major arterial (includes Railroad bridge) DC Castle Rock $9.0 3A Plum Creek Parkway Lake Gulch Rd Ridge Rd New 2-lane major arterial DC Castle Rock $7.0 4A Peoria St Crescent Meadow Blvd Ridgegate Pkwy/Mainstreet New 2-lane collector DC Lone Tree $1.5 5 Ridgegate Pkwy/Mainstreet I-25 Meridian Village Pkwy New 2-lane major arterial-extension of Mainstreet DC Lone Tree $6.7 6 Town Center Dr Lucent Dr Highlands Ranch Pkwy New 4-lane collector DC $1.2 Total Cost of 2010 Douglas County/Local Improvements $51.4 7A I-25 Lincoln Ave Founders Parkway Restripe 6 to 8 lanes CDOT 7B I-25 Frontage Ridgegate Pkwy/Mainstreet Castle Pines Parkway New 2-lane minor arterial CDOT 2020 Improvements 1B Hess Rd I-25 Chambers Rd Widening major arterial from 2 to 4 lanes DC $ Titan Rampart Range Rd Titan Park Cir Widening from 2 to 4 lanes DC $8.5 9 Waterton East Roxborough Park Rd Airport Road New Roadway, 2-lane minor arterial DC $ Plaza / Erickson Extension Erickson Rd US-85 New 2-lane minor arterial DC $ University Blvd Quebec St Cotton Creek Dr Widening from 4 to 6-lane major arterial DC $ Monarch Blvd McCarthur Ranch Rd Castle Pines Pkwy Widening from 2-lane minor arterial to 4-lane major arterial DC Castle Pines $ Lincoln Ave Peoria Chambers Rd Widening from 4-lane to 6-lane major arterial (including bridges) DC Lone Tree $ Lincoln Ave Chambers Rd Keystone Blvd Widening to 6-lane major arterial DC $ Pine Ln Parker Rd Pine Dr Widening collector from 2 to 4 lanes DC $ N Meadows Dr Meadows Dr US-85 New 2-lane major arterial DC Castle Rock $10.0 Prairie Hawk Dr Extension/West 17 Incorporated Area Boundary Douglas Ln/Crystal Valley Parkway New 2 lane Minor Arterial directly West of and parallel to I-25 Frontage Rd 18 Jordan Rd Main Street Hess Rd Widening from 2 to 4 lanes major arterial DC Castle Rock DC Parker DC Parker 19 Hilltop Rd Canterberry Pkwy Hilltop and Singing Hills Intersection Widening from 2 to 4 lane major arterial $ Pinery Rd Singletree Ln Thunder Hill Rd Widening collector from 2 to 4 lanes DC $ Waterton Rd West county boundary Rampart Range Rd Widening from 2 to 4 lanes where not already widened and new bridges over Platte DC $ Rampart Range Rd Titan Rd Waterton Rd Widening from 2 to 4 lanes DC $5.0 $8.0 $4.0 Douglas County 2030 Transportation Plan November
91 Chapter 7: Implementation of the Plan TABLE 9: RECOMMENDED ROADWAY IMPROVEMENTS AND COSTS BY PHASE (CONTINUED) Imp Num Street Name From Street To Street Improvement Description Responsible Party Total Cost ($M) 23 Stroh Rd State Hwy 83 / Parker Rd Preservation Trail New 2-lane minor arterial DC Parker $ Crystal Valley Pkwy I-25 Incorporated area boundary Widening from 2 to 4-lane minor arterial DC Castle Rock $1.5 Total Cost of 2020 Douglas County/Local Improvements $ C-470 West county line Quebec St Widening from 4 to 6 lane interstate CDOT 26 C-470 Quebec St I-25 Widening from 6 to 8 lanes CDOT 27 US-85 / Santa Fe Dr C-470 Titan Rd Widening 4-lane major arterial to 6-lane expressway CDOT 28 US-85 Titan Rd Just northwest of State Highway 67 Widening 2-lane major arterial to 4-lane expressway CDOT 29 US 85 South east of State Highway 67 NW of Meadows Parkway/Founders Pkwy Widening from 2-lane major arterial to 4-lane expressway CDOT 30A I-25 I-25/470 Interchange Lincoln Ave Widening from 6 to 8 lanes CDOT 30B I-25 / Lincoln Ave Construction of Urban Interchange CDOT 31 State Hwy 83 South of Bayou Gulch Rd Russellville Rd Widening major arterial from 2 to 4 lanes CDOT 2030 Improvements 2B Plum Creek Parkway Wolfensberger Rd I-25 Widen from 2 lane major to 4 lane major arterial DC Castle Rock $3.8 3B Plum Creek Parkway Lake Gulch Rd Ridge Rd Widen from 2 lane major to 4 lane major arterial DC Castle Rock $ Rampart Range Rd Blue Mesa Way Roxborough Dr Widening collector from 2 to 4 lanes DC $ Extension of Maroon Cir Meridian Blvd Lincoln Ave New collector extending from Maroon Cir to Lincoln Ave DC $ Peoria St E-470 Lincoln Ave Widening 2-lane collector to 4-lane major arterial DC $ Peoria St Lincoln Ave Extension of Ridgegate Pkwy Widening 2-lane collector to 4-lane major arterial DC $ Ridegegate Pkwy/Mainstreet I-25 Meridian Village Pkwy Widening to 4-lane major arterial DC Lone Tree $ Mainstreet Ave Meridian Village Pkwy Chambers Rd Widening 2-lane collector to 4-lane major arterial DC Lone Tree $ Chambers Rd Lincoln Ave Main Street Widening 2-lane collector to 4-lane major arterial DC $ Pine Dr County Line Rd Inspiration Rd New 4-lane collector DC Aurora $ E Parker Rd/ CR 8 Canterberry Pkwy Tomahawk Rd Widening major arterial from 2 to 4 lanes DC Parker $ Delbert Rd County Line Rd Singing Hills Rd Widening from 2-lane minor arterial to 4-lane major arterial DC $ Extension of Delbert Rd Singing Hills Rd Hilltop Rd New 4-lane major arterial DC $ Singing Hills Rd Hilltop Rd Delbert Rd Widening 2-lane minor arterial to 4-lane major arterial DC $ Todd Dr Jordan Rd Motsenbecker Rd Completing 2-lane collector extension of Todd Dr from Jordan Rd DC Parker $ Todd Dr Motsenbecker Rd Dransfeldt Rd extension New 2-lane collector (including new bridge and ROW) DC $ Dransfeldt Road extension Twenty Mile Rd Todd Dr extension New 2-lane collector-southern extension of Dransfeldt in unincorp DC Parker $ Stroh Rd Motsenbocker Rd J Morgan Blvd Widening 2-lane collector to 4-lane major arterial (includes widen bridge) DC Parker $5.0 Douglas County 2030 Transportation Plan November
92 Chapter 7: Implementation of the Plan TABLE 9: RECOMMENDED ROADWAY IMPROVEMENTS AND COSTS BY PHASE (CONTINUED) Imp Num Street Name From Street To Street Improvement Description Responsible Party Total Cost ($M) 48 Stroh Rd extension Preservation Trail Hilltop Rd New 2-lane minor arterial-extension of Stroh Rd DC $ Extension of Monarch Blvd Shoreham Cir Legue New 2-lane minor arterial DC $ Happy Canyon Rd I-25 New N/S road along Newlin Gulch New 2-lane collector-extension of Happy Canyon Rd DC $ Canyons Pkwy Hess Rd Happy Canyon Rd Extension New 4-lane minor arterial DC $ Canyons Pkwy Happy Canyon extension Crowfoot Valley New 4-lane minor arterial DC $ Crowfoot Valley Knobcone Dr (North of Founders Pkwy) Stroh Rd Widening from 2 to 4 lanes DC Parker $ N Pinery Pkwy extension New road off Crowfoot Valley Rd State Hwy 83 New 4-lane major arterial; ext of N Pinery Pkwy DC Parker $ Bayou Gulch Rd extension N Pinery Pkwy extension Vistancia Dr New 4-lane major arterial; extension of N Bayou Gulch Rd DC $ Bayou Gulch Rd Vistancia Dr State Hwy 83 Widening of 2-lane collector to 4-lane major arterial DC $ Wolfensberger Rd Plum Creek Pkwy Prairie Hawk Dr Widening from 2 to 4 lanes DC Castle Rock $ N Meadows Dr US-85 I-25 New 4-lane major arterial DC Castle Rock $ Park Street Extension Caprice Ct Liggett Rd New 2-lane collector-east and parallel to Prairie Hawk Dr DC $ Woodlands Blvd extension Unincorp portions from Black Feather Trl Unincorp portions near Whispering Oak New 4-lane minor arterial DC $ Prairie Hawk Dr Extension/ West DC Incorporated area boundary Douglas Ln Widen 2 to 4 lane minor arterial directly west of and parallel to I-25 Frontage Rd Castle Rock $ County Line Rd Private road east of Erickson Blvd Southpark Ln Widening major arterial from 2 to 4 lanes DC $ Roxborough Park Rd Titan New road south of Waterton Widening collector from 2 to 4 lanes DC $ Waterton Rd Rampart Range Rd US-85/Airport Widening minor arterial from 2 to 4 lanes DC $ S Ridge Rd Uncorp area near Appleton Wy Lake Gulch Rd Surface type improvement and change to 2-lane minor arterial DC $ Peak View Dr Wolfensberger Rd Douglas Ln Surface improvement and facility type change to 2-lane collector DC Castle Rock $ Prairie Hawk Dr Extension/ West South Castle Rock City Limits Frontage Rd Tomah Rd New 4-lane minor arterial parallel to I-25 DC $ Sky View Ln Bear Dance Dr I-25 Surface type improvement and facility change to 2-lane minor arterial DC $ Territorial Rd Skyview Ln Perry Park Ave New road-2-lane minor arterial DC $ Extension of Legue Monarch Blvd Happy Canyon Rd New 2-lane minor arterial DC $ Douglas Lane / I-25 Interchange New Interchange DC Castle Rock Developers $35.0 Total Cost of Long Range 2020 to 2030 Improvements $317.6 Douglas County 2030 Transportation Plan November
93 Chapter 7: Implementation of the Plan TABLE 9: RECOMMENDED ROADWAY IMPROVEMENTS AND COSTS BY PHASE (CONTINUED) Imp Num Street Name From Street To Street Improvement Description Responsible Party Total Cost ($M) 72 US-85 Titan Rd Just northwest of State Highway 67 Widening 4-lane 6-lane expressway CDOT 73 E-470 I-25 Parker Widening from 6 to 8 lanes CDOT 74 State Hwy 86 Enderud Rd State Hwy 83 Widening major arterial from 2 to 4 lanes CDOT 75 State Hwy 86 State Hwy 83 East county boundary Widening major arterial from 2 to 4 lanes CDOT 76 State Hwy 83 State Hwy 86 Lake Gulch Rd Widening major arterial from 2 to 4 lanes CDOT 77 I-25 North County Line I-25/C-470 Widening from 8 to 10 lanes CDOT 78 I-25 Within I-25/C-470 Interchange Widening from 6 to 8 lanes CDOT 79 I-25 Crystal Valley Pkwy South County Line Rd Widening from 4 to 6 lanes CDOT Total 2010, 2020 and 2030 Douglas County/Local Roadway Improvements $499.5 Douglas County 2030 Transportation Plan November


94 FIGURE 38: 2010 PM PEAK HOUR TRAFFIC VOLUMES AND CONGESTION DOUGLAS COUNTY FIGURE 38: 2010 PM PEAK HOUR TRAFFIC VOLUMES AND CONGESTION DOUGLAS COUNTY 87


95 FIGURE 39: 2020 PM PEAK HOUR TRAFFIC FORECASTS AND CONGESTION LEVELS FIGURE 39: 2020 PM PEAK HOUR TRAFFIC FORECASTS AND CONGESTION LEVELS 88


96 FIGURE 40: 2030 PM PEAK HOUR TRAFFIC FORECASTS AND CONGESTION LEVELS FIGURE 40: 2030 PM PEAK HOUR TRAFFIC FORECASTS AND CONGESTION LEVELS 89
97 Chapter 7: Implementation of the Plan Funding Options The existing sources of funding for roadway improvements within Douglas County are 1) CIP funds from County sales and property taxes, 2) HUTF funds from a distribution of state and federal gas taxes, 3) federal and state grants. Additionally, projects are built through the use of 4) development supplied funds, 5) intergovernmental governmental agreements, 6) Local Improvement District funding (LID) which is used only for improving roadways after development and requires a vote of the landowners affected, 7) Public Improvement District funding (PID) which is used for ongoing maintenance of a roadway and also requires a vote of the landowners, and 8) Metro Districts, which are used to both build and maintain improvements. However, using all eight funding sources together at the current funding levels is not projected to be sufficient to meet the goals of the Douglas County 2030 Transportation Plan or the CMP. Therefore, additional funding sources or changes to existing source rates need to be identified and established. Many other agencies with similar short-falls have used one or more of the following methods of funding roadway improvements: A) Implementation of additional fees and taxes, such as sales tax increases, earmarked for transportation only expenses as within a Regional Transportation Authority (RTA) (recently voter approved in El Paso County/City of Colorado Springs), or property tax increases. B) Adding or revising impact fees based on increases in traffic caused by future development, either County-wide or a set of variable fees within specific neighborhoods or sub-areas. These fees can be based upon a sub-area study of development potential and needed improvements, or they can be based upon a Transportation Impact Study provided by, or paid for by the developer. Douglas County 2030 Transportation Plan November 2009 C) Requiring construction of improvements as a condition upon development approval. This requirement is also usually based upon a Transportation Impact Study. D) User fees in the form of tolls. Douglas County is currently utilizing forms of B) and C) to fund transportation projects. Note: As indicated in Table 10, there are major issues with the transportation impact study approach associated with consistency in analysis, identified impact area, and the fact that many developments are of insufficient size to warrant a Traffic Impact Study. However, traffic impact studies are important to identify the amount of new traffic generated and evaluating impact on an area including internal circulation and local access, and identifying mitigation to off-site impacts. Each option has its benefits and drawbacks. The ultimate funding program may include more than one method. Whatever funding method or combination of methods is used, it must also provide the level of revenue necessary to provide adequate maintenance and fix existing deficiencies, as well as provide for transportation improvements needed to support Douglas County s future growth. Many jurisdictions have found that it is politically difficult to have existing residents fund transportation improvements required for future development. Whereas property tax and/or sales tax is often used for correcting existing capacity and safety deficiencies and provide a stable funding for maintenance, some form of new development-fair share funding combined with earmarked fees or taxes may be more appropriate for projects needed for growth. 90
98 Chapter 7: Implementation of the Plan TABLE 10: DEVELOPMENT APPROACHES FOR FUNDING NEW TRANSPORTATION IMPROVEMENTS Funding Method Who Pays Advantages & Disadvantages Transportation Mitigation (Per Transportation Impact Study) Developers (passed on to New Home Purchasers and industrial/commercial renters) Traffic impact studies are prepared for major development projects which identify transportation impacts from the project and recommended mitigations to offset these impacts. Whereas these studies are intended to provide a nexus between development impact and mitigation, these studies tend to address only impacts within a local area and not the cumulative impacts on other roads outside the area. These studies are often not consistent with one another and require some negotiations between applicant and staff. Smaller developments are often exempt from being required to prepare a study, yet their minor increases in traffic contributes to the cumulative traffic impacts. Transportation Impact Fees Developers (passed on to New Home Purchasers and industrial/commercial renters) Transportation Impact Fees are tools appropriate for improvements that are attributable to new growth. This tool may be particularly appropriate for constructing missing segments or widening existing arterials or collectors. Metro District or Local Improvement District Local Businesses and Property Owners Local Improvement Districts are typically used for financing smaller transportation projects which benefit a defined area. Metro Districts may acquire, construct and install streets, parking facilities, and drainage improvements. Payment is from properties included within the District. These districts may impose property taxes, fees, or charges. Taxes and fees are structured to generate sufficient revenues to pay for district programs and facilities. Douglas County 2030 Transportation Plan November
99 Chapter 7: Implementation of the Plan Key to implementing any development related transportation impact fee is that the jurisdiction should not charge new developments for existing deficiencies and that a nexus exists between new developments and the needed improvements to provide for a fair share contribution. Regulations should allow funds to be used for off-site improvements based on need and/or an adopted CIP list. A transportation impact fee, where each new development pays for a fair share of the total future transportation needs, is usually based upon a per trip basis, tied to the amount of traffic generated. This can be modified using Transportation Demand Management methods, transit development, alternative mode availability and construction, and other proven methods. The per trip basis is sometimes converted to a per unit basis, such as dwelling unit or square foot for non-residential. Metro Districts, or under certain circumstances, Local Improvement Districts (LID) may be alternatives to funding infrastructure improvements within an immediate impact area identified in a Transportation Impact Study. State Road Funding As presented in the Douglas County transportation improvement maps and tables, there are critical state and federal roadways which need improvements. The reality is that the state and federal governments have a major funding shortfall. It will be incumbent upon Douglas County to continue to lobby for these limited funds. Another alternative is to work with other jurisdictions in the development of a Regional Transportation Authority (RTA), which can provide an increase in a sales and use tax for regional improvements, including state and federal facilities. An RTA would require a majority vote of the population impacted, as it is a tax increase. Douglas County 2030 Transportation Plan November 2009 Multi-Jurisdictional Joint Roadway Funding The projected increase in traffic shown for 2020 and 2030 comes in a large part from development within incorporated area in and around Douglas County. How transportation fees are created and distributed throughout the County should be the subject of intergovernmental agreements. A single county-wide impact fee distributed to each agency based on traffic impacts as identified in the traffic model is one option. This would allow for needed improvements caused by growth both in the incorporated and unincorporated areas. A countywide pool of funds from impact fees and/or from an RTA could be established and distributed based on impacts to each jurisdiction s roadways via a joint countywide CIP agreement, with projects reviewed periodically by a board that combines each jurisdiction (20yr, 5yr & annual). Transportation Plan Implementation Actions Implementing roadway, transit, TSM, TDM and bicycle transportation improvements requires a number of actions. The following section identifies these implementation actions. Collaboration The implementation of the transportation system is not solely the responsibility of Douglas County, but will require a collaborative work effort with a large number of stakeholders. These stakeholders include the local jurisdictions of the Town of Parker, Castle Rock, Larkspur and Castle Pines North and the City of Lone Tree. Many of the critically important future transportation improvements are on state and federal roadways which will require close working relationships with the 92
100 Chapter 7: Implementation of the Plan Colorado Department of Transportation, the Denver Regional Council of Governments and the Counties of Jefferson, Arapahoe, Elbert and El Paso. Collaboration with citizen groups and organizations will also be required to implement elements of the plan such as the bicycle vision and the transit vision. It will also be important to work in a collaborative effort with the development community. Future development is important to the fiscal growth and health of Douglas County and a cooperative working relationship between the County and the developer will increase opportunities for both. It should also be noted that the traffic forecasts for the Douglas County 2030 Transportation Plan are based on state, regional and local estimates of future development. However like any forecast, actual development proposals will be different. Traffic forecasts, impacts and mitigations require a collaboration between Douglas County and the developer to review the proposed development, identify traffic impacts, and define an appropriate set of mitigations to address these impacts. Roadway Implementation Actions Transportation Funding The number one issue facing Douglas County in implementing the Douglas County 2030 Transportation Plan is to obtain a sustainable source of funding. With a doubling of population and employment forecasted by 2030, significant demands will be placed on the existing roadway infrastructure which will require mitigation. The need is immediate and every residential dwelling unit or square foot of nonresidential development approved without a funding solution will add to Douglas County 2030 Transportation Plan November 2009 the congestion and safety problems. It is critical that Douglas County initiate a comprehensive study involving all stakeholders to identify and then adopt a solution to the funding problems following the completion of the Douglas County 2030 Transportation Plan. Areas of Future Study During the development of the Roadway Vision Plan, there were four corridors that were identified that should have more detailed study not usually included in a regional transportation plan. This detailed study should more specifically analyze future developments and transportation impacts, the ability to mitigate those impacts, and analyze appropriate funding sources and project phasing. This will allow limited Douglas County transportation funds to best promote economic growth for each area. The four areas for future study are as follows: NW Douglas County: The Douglas County 2030 Transportation Plan should be refined in the general area bounded by US 85 on the East, Jefferson County on the West, Chatfield Reservoir on the North and SH 67 on the South. The study should analyze existing and future transportation problems, and include a more detailed operational analysis on key intersections. Currently the Douglas County 2030 Transportation Plan notes that US 85 should be widened to six lanes between C-470 and SH 67. Based on estimated growth along the corridor, this six-lane improvement may not be sufficient for 2030 forecasts. Options include rebuilding the Titan/US 85 interchange, adding high-occupancy vehicle lanes and transit. Identifying appropriate mitigation requirements for each key intersection and roadway, affected by proposed development will be required. 93
101 Chapter 7: Implementation of the Plan C-470/North-Central Douglas County: This major facility is a very important connection to areas north of the County, and improvements are critically needed to address both existing congestion and future congestion. A regional approach for identifying appropriate funding will be needed. Also, analysis of the functional relationships with key parallel roadways in Douglas County (County Line, Highlands Ranch Parkway, Lincoln, etc) is needed. Lincoln/Main-Ridgegate/Hess Corridor: Lincoln Avenue is currently the only non-toll east-west connection between I-25 and SH 83 connecting NE Douglas County, Lone Tree and Parker. With the recent opening of the Ridgegate interchange and the future construction of Hess Road, a large area of development opportunity will become available. Understanding future development proposals and timing of development will be important in phasing transportation improvements in this area to support future development and economic growth. Inter-connections between these roadways will significantly affect travel patterns. I-25: The interstate highway, from the northern to southern boundaries of Douglas County is vital to the transportation and economic conditions of Douglas County. Future funding for improvements along this corridor are critical and there needs to be a collaborative effort between CDOT, Douglas County and other stakeholders to identify funding for future mitigations Roadway Standards The current Douglas County 2030 Transportation Plan promotes transportation mobility through all transportation modes, including automobile, transit, and bicycle/pedestrian. An important action item is to go through those standards and cross sections and make sure that they Douglas County 2030 Transportation Plan November 2009 include opportunities for bicycling and walking where appropriate. The standards review, currently in progress, should be completed and should allow for non-traditional intersection designs (CFI, DDI, quad movements, ¾ intersections, roundabouts, etc.) and multi-modal elements. Access Management As determined in the capacity and level of service analysis, the lack of access management can seriously reduce the carrying capacity of the existing and future roadway system. Often, it is easy to argue that it is just one access, what impact could that bring? However, as one access turns into the next and the next, friction occurs, traffic flow is disrupted, capacity is reduced, and congestion increases. Developing and abiding by industry access management strategies and implementing access control plans for major corridors is crucial, starting with high LOS arterials. Intelligent Transportation Systems (ITS) & Transportation System Management (TSM) With limited funds, the federal, state, and local governments have been trying to get maximum capacity and traffic flow through operation improvements of their transportation systems. These improvements include ITS features such as signal upgrades, signal system interconnect, improved signal maintenance, use of incident detection/vms operations, and preemption/priority control for transit and emergency vehicles. Significant operational improvements can also be made through the use of projects to improve capacity and/or safety through use of a viable TSM program. These projects include auxiliary lanes at intersections, roundabouts, median modifications, and other operational improvements. 94
102 Chapter 7: Implementation of the Plan Douglas County should develop 5-year ITS & TSM plans to identify projects that will provide the greatest benefits toward improving traffic flow and reducing congestion. Codes, Standards, and Ordinances Existing codes, standards, and ordinances should be updated to provide opportunities to improve the relationship between land use and transportation. These updates should address multi-modal transportation assessments for all new proposed developments that address connections, access, and mobility for auto, transit, bicycle, and pedestrian modes. Transit Implementation Actions The Transit Vision Plan provides a guide for how rural transit services can be provided in Douglas County, effectively connect to RTD services that serve the residents of the northern portion of the County, and provide for human service agency transportation in both rural and urban parts of the County. Douglas County and each of the potential partner agencies should consider the proposed services and organization and determine their interest in participating. The final service plan and structure will be defined by those agencies interested in participating. Bicycle/Pedestrian Implementation Actions Development of Bicycle Improvement Plan Douglas County has the opportunity to go from a County with little opportunities to use bicycles for an alternative mode to a County with many options of mixed-use trails, bicycle lanes, and bicycle routes. Much of this can be done with pavement stripping and markings. To achieve this goal, Douglas County should identify what improvements can easily be made in the short-term 2010 to get a bicycle network started. An Implementation Plan should also be created for adding more bicycle lanes and shoulders as part of any roadway improvement project, including any possible change in roadway stripping, periodic street overlays, and reconstruction projects. Needed connections and new bicycle facilities should be identified in a 2020 and 2030 plan. Development of a Bicycle Map In order to promote bicycling as an alternative transportation mode, Douglas County residents will require a basic bicycle map to identify bicycling opportunities for traveling from one area to another. As mixeduse trails and bicycle lanes are completed, they should be added to a County maintained database, which is made available via the County s website. This information could also include lower volume roads, which do not have bike lanes that could be used as a bicycle route. Coordination with the bicycle community in this effort, along with publishing the bike map including a summary of the applicable State laws and common bicycle riding practices, safety and maintenance suggestions could further promote bicycle usage. Douglas County 2030 Transportation Plan November
103 Goal 7-1 Develop an efficient, multifunctional transportation network that is designed to ensure safety, promote user access and facilitate cost-effective operations and maintenance. Objective 7-1A Ensure consistency between the Transportation Plan and local and regional transportation plans. Policy 7-1A.1 - Coordinate planning and development review efforts with municipalities and other agencies to ensure integration and continuity of the transportation network. Policy 7-1A.2 - Support partnerships at the local and regional level, and between the public and private sector, to improve the transportation network. Objective 7-1B Integrate all appropriate modes of travel within the Transportation Plan. Policy 7-1B.1 - Provide a comprehensive multi-modal transportation network plan and prioritization framework within the Transportation Plan. Objective 7-1C Consider safety a major element of transportation improvements in the County. Policy 7-1C.1 - Design transportation corridors that are safe for all users and sensitive to the community context. Policy 7-1C.2 - Encourage design solutions to enhance both vehicular and non-vehicular user safety, including, but not limited to pedestrian, bicycle, and wildlife corridor grade-separated crossings, and roundabouts, where feasible, as an alternative to traffic lights. A-1 Douglas County 2030 Transportation Plan November 2009

104 Appendix A: Douglas County 2030 Comprehensive Plan Transportation Goals and Objectives Goal 7-2 Develop and maintain an efficient and safe road network in harmony with natural features and existing neighborhoods. Objective 7-2A Plan and construct an efficient road network. Policy 7-2A.1 - Consolidate and limit access points along major arterials and major collectors to maintain mobility at a high level of service. Policy 7-2A.2 - Establish the proper classification and timing for the construction of roads through the Douglas County Transportation Plan. Policy 7-2A.3 - Through the design process, ensure that collector and arterial road rights-of-way are wide enough to accommodate all identified street users and functions. These may include vehicles, transit, pedestrians, bike lanes, off-street shared use trails, landscaping and roundabouts. Traffic calming features should be included to improve safety and increase pedestrian and bicyclist safety. Policy 7-2A.4 - Ensure that land area is provided to allow adequate berming for visual relief and noise abatement, outside of the right-ofway, as necessary. Policy 7-2A.5 - Ensure developers contribute to, and mitigate, impacts to off-site transportation infrastructure. Studies should account for off-site conditions and impacts. Policy 7-2A.6 - Prior to road widening as a means to improve capacity, evaluate the costs and benefits of alternative capacity enhancement strategies. Policy 7-2A.7 - Road designs should compliment and minimize impact to natural features and landscapes. Policy 7-2A.8 - Design transportation corridor improvements to carefully mitigate impacts to, and allow coexistence with, significant open space, riparian areas, and wildlife movement corridors. Objective 7-2B Provide adequate primary, secondary, and emergency connections for subdivisions. Douglas County 2030 Transportation Plan November 2009 A-2

105 Appendix A: Douglas County 2030 Comprehensive Plan Transportation Goals and Objectives Policy 7-2B.1 - Provide connections between residential neighborhoods with collector and local roads, and provide for future road connections, where appropriate, to provide alternative travel routes. Policy 7-2B.2 - Ensure road layouts and connections support desired response requirements for emergency service and efficient school bus service. Policy 7-2B.3 - Plan major new roads to minimize negative impacts on existing neighborhoods. Policy 7-2B.4 - Evaluate requests for right-of-way vacation in light of current and future transportation needs, which may include road network modifications, multi-use trail corridors, and other public purposes. Objective 7-2C Design local roads to serve the purpose and scale of the neighborhood. Policy 7-2C.1 - Support local road designs that encourage walkable environments and foster sense of place. Policy 7-2C.2 - Design neighborhood streets to calm traffic and discourage traffic volumes in excess of adopted standards using methods such as shorter street lengths. Objective 7-2D Provide adequate and efficient transportation corridors County-wide, to reduce vehicle miles traveled and driving time. Policy 7-2D.1 - Encourage enhanced east-west roadway capacity between US-85 and the Chatfield Basin area. Goal 7-3 Support enhanced public transit in Douglas County. Objective 7-3A Facilitate an integrated transit plan as a component of the Douglas County Transportation Plan. Policy 7-3A.1 - Coordinate and support existing and future transit services provided by other agencies to fulfill service demands of County residents, including seniors and people with disabilities. Douglas County 2030 Transportation Plan November 2009 A-3

106 Appendix A: Douglas County 2030 Comprehensive Plan Transportation Goals and Objectives Objective 7-3B Incorporate transit facilities within development in urban areas. Policy 7-3B.1 - Support land development patterns and practices that strengthen and create multi-modal transportation options and transit-oriented development within the Primary Urban Area, and in the Separated Urban Areas, as appropriate. Goal 7-4 Coordinate transportation and land-use planning design, programs, and policies to reduce traffic congestion, provide alternatives to automobile use, improve air quality, and create healthy, desirable living environments. Objective 7-4B Use land-use planning to reduce travel by automobile and improve access to community resources. Policy 7-4B.1 - Ensure all new development and redevelopment incorporate bicycle and pedestrian facilities which connects community uses and destinations, including employment centers, residential areas, shopping, parks, transit facilities, schools and other community activity centers, where possible. Objective 7-4A Reduce traffic congestion through implementation of Transportation Demand Management (TDM) and land planning principles. Policy 7-4A.1 - Encourage employers to establish programs that include the use of staggered work hours that support off-peak travel, four-day work weeks, telecommuting, non typical work shifts, formal van pool or company ridesharing programs, and transit passes. Policy 7-4A.2 - Provide incentives to businesses to reduce employee commuting and automobile use, if supported by adopted TDM policies and/or programs, as described in the Transportation Plan. Policy 7-4B.2 - Encourage mixed-use development, with appropriate scale and pattern of uses, that supports a variety of travel options and which connects community uses and destinations. Douglas County 2030 Transportation Plan November 2009 A-4
107 Appendix A: Douglas County 2030 Comprehensive Plan Transportation Goals and Objectives Policy 7-4B.3 - Coordinate and provide multi-modal links with the County s regional trails system. Policy 7-4B.4 - Ensure new and existing developments promote connectivity through road and off-street path design to reduce trip lengths, provide multiple alternative travel routes between community uses and destinations, and provide alternatives to automobile use. Policy 7-5B.1 - Develop a regional framework, achieved through consensus, regarding future land-use planning surrounding Centennial Airport. Goal 7-6 Achieve compatibility between the railways, other transportation corridors, and surrounding land uses. Goal 7-5 Refine land-use compatibility within the Centennial Airport Review Area Overlay District (CARA) to ensure air and ground safety. Objective 7-5A Achieve consistency in land-use planning within the CARA. Policy 7-5A.1 - Apply CARA land-use regulations, where applicable, in addition to underlying zoning regulations, to ensure the future operation of Centennial Airport. Policy 7-5A.2 - Coordinate land-use planning with the Arapahoe County Public Airport Authority and apply principles established in the DRCOG Airport Compatible Land Use Design handbook, where appropriate. Objective 7-5B Coordinate land-use planning activities with other jurisdictions adjacent to the CARA. Objective 7-6A Eliminate all at-grade crossings involving public roads as well as private roads, where possible. Policy 7-6A.1 - Encourage grade-separated crossings for both new and existing development to enhance public safety and efficiency. Objective 7-6B Achieve land-use compatibility between the railways and adjoining land uses. Policy 7-6B.1 - Ensure all new land uses, located in the vicinity of rail lines, are compatible with railway noise, air-quality, visual, fire, and access impacts. Policy 7-6B.2 - Recognize the need for rail-related uses in the County and allow them to make effective use of rail facilities. Objective 7-6C Continue to pursue passenger commuter service. Policy 7-6C.1 - Support commuter rail that links the County with other areas across the Front Range. Douglas County 2030 Transportation Plan November 2009 A-5
108 Appendix B: Douglas County Travel Demand Model The Douglas County Travel Demand Model was based on the DRCOG TransCAD travel model (Compass 2.0 Version 95). Changes to the DRCOG travel model included traffic analysis zone (TAZ) splits, network conflation, and replacement of the modechoice with mode-split procedure. The Douglas County Travel Model also included all zone splits, networks and socio-economic data from the City of Lone Tree, and the Towns of Parker and Castle Rock, per their respective models. After making all of the updates and revisions, the Douglas County travel model was revalidated. Traffic counts from Douglas County, DRCOG and CDOT were used in the validation process. The Douglas County travel model base year was 2005, which is consistent with the DRCOG model. The validation process included centroid connector and K-factor matrix changes. Three different statistical measurements were used to quantify the validation using the traffic counts and base year model volumes. 1. VEHICLE MILES OF TRAVEL (VMT): The VMT comparison for this model is at the county level. Total Douglas County vehicle miles of travel from the model are compared to VMT from the traffic counts. This comparison is done for the links with traffic counts. Table B-1 presents the comparisons. Based on VMT, this model received a very high validation. B-1 Douglas County 2030 Transportation Plan November 2009
109 Appendix B: Douglas County Travel Model TABLE B1: VEHICLE MILES OF TRAVEL (VMT) VALIDATION All Facilities Non-Interstates VMT on Links with Counts 1,614, ,186 Count-VMT 1,551, ,531 VMT / Count-VMT SCREENLINE COMPARISON: The second validation test is the comparison of modeled volumes and observed traffic counts on screenlines. These are imaginary lines that extend across a series of roadway links that form a logical basis for evaluation of regional travel movements in the model. Screenlines can also be drawn to separate major activity areas, such as Highlands Ranch, Castle Rock, or can be drawn along freeways, natural features, or around an activity area. Screenlines used in the Douglas County transportation model are presented in Figure B1. The validation statistics are presented in Table B2. TABLE B2: SCREENLINE COMPARISON Screenline Description Traffic Model Percent Count Volume Difference A - North County Line (West) 236, ,672 0% B - North County Line (East) 123, ,473-3% C - North County Line 491, ,307 3% D - Highlands Ranch South 31,000 28,497-8% E - West of I-25 75,041 75,334 0% F - East of I-25 61,500 74,921 22% G - Parker Cordon 232, ,559-10% H - Castle Rock Cordon 185, ,813 5% I - South County Line 65,415 65,266 0% Douglas County 2030 Transportation Plan November 2009 Overall, the screenline analysis indicated that the model is very well calibrated. Most screenlines were 3% different or better between traffic counts and model volumes. The one screenline which was high is East of I- 25 which only included one roadway, Lincoln Avenue. 1. R-SQUARED VALUE: This model validation comparison compares link traffic count and model volumes. The R-squared plot for all links is presented in the following figure. Model Volume 90,000 80,000 70,000 60,000 50,000 40,000 30,000 20,000 10, ,000 20,000 30,000 40,000 50,000 60,000 70,000 80,000 90,000 Traffic Count Freew ay Non-Freew ay Based on standard model validation standards, an R-squared value greater then 0.85 is considered well calibrated. The R-squared results for all facilities is 0.90 and without freeways B-2


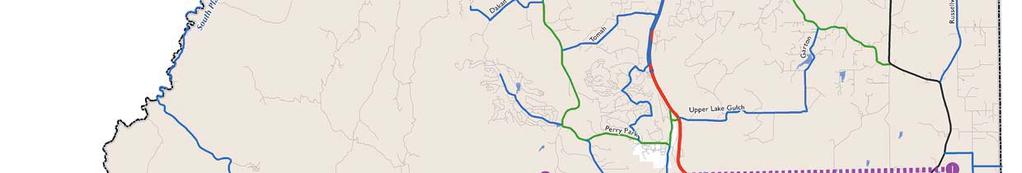

110 FIGURE B1: MODEL VALIDATION SCREENLINE MAP FIGURE B1: MODEL VALIDATION SCREENLINE MAP B-3
111 Appendix C: Level of Service Capacity Analysis The motorist is generally interested in the speed or travel time of his journey. Level of Service (LOS) is a measure by which transportation engineers and planners determine the quality of travel on a roadway. LOS measurements are typically based on traffic density, determined by the volume/capacity ratio for roadway links and average delay at intersections based on geometrics, traffic control, and volumes. As the density or volume/capacity ratio increases, the travel speed goes down. Historically, the capacity of a roadway has been based on the maximum number of vehicles a lane can accommodate in an hour by facility type. As an example, the theoretical maximum number of vehicles that can travel along a freeway segment is 2,000 to 2,200 vehicles per hour, per lane. The freeway has no intersections or access conflicts that would interfere with that stream of traffic. As the facility type changes from regional travel to local travel, the increasing number of intersections and access points creates conflicts and reduces the carrying capacity of the roadway. A typical per lane hourly capacity table for freeways, major and minor arterials, and collectors with generic assumptions are presented below. Facility Type Hourly Capacity Per Lane Freeway 2,000 Major Arterial 1,200 Minor Arterial 900 Collector 600 C-1 Douglas County 2030 Transportation Plan November 2009
112 Appendix C: Level of Service Capacity Analysis In essence, this relationship recognizes that with each lowering of facility type, the traffic control along that facility increases which results in a lower capacity. Daily capacity level of service analysis is typically used in travel demand models. However, extrapolating daily capacity levels for 2, 4 and 6 lane facilities from hourly capacity estimates per lane becomes very weak. One size does not fit all. Whereas a generalized daily capacity estimate by lane and facility type may be appropriate for regional modeling to determining the ebb and flow of traffic from one part of the region to another, it does not provide the planning level precision important for developing the Douglas County 2030 Transportation Plan. Therefore, a refined capacity volume was developed for each roadway based on parameters defined in the Highway Capacity Manual. Highway Capacity Manual The ultimate authority on defining roadway capacity and level of service is the Transportation Research Board s Highway Capacity Manual. This manual has been refined and updated for decades. The manual is divided into four parts: 1) Principles of Capacity, 2) Interstates, 3) Rural and Suburban Highways, and 4) Urban Streets. These chapters are summarized as follows: Principles of Capacity: The basic traffic flow variables identified in the Highway Capacity Manual are volume and/or rate of flow, speed and density. Freeway: Capacities are affected by characteristics including number and width of lanes, lateral clearances, free-flow speeds, grades and lane configurations. Other factors that affect capacity include percent of trucks, buses and recreational vehicles, driver population (familiarity with road). The maximum service flow rate is 2,000/ Douglas County 2030 Transportation Plan November ,300 passenger cars per hour per lane. The Highway Capacity Manual has additional evaluation methodologies for weaving areas and ramps. Rural and Suburban Highways Multi-Lane: Free-flow speed is the base for multi-lane highway capacity, which can approach freeway capacity when access points to the highway reach zero. When intersections, driveways, and signalization are introduced, the multi-lane highway capacity is reduced when compared to the freeway. Free-flow speeds, lane width and lateral clearance, median type, access points, and type are all factors which affect the flow and capacity of multi-lane highways. Rural and Suburban Highways Two-Lane: The Highway Capacity Manual recognizes that the traffic operations on two-lane, two-way highways are unique as lane-changing and passing are possible only in the face of on-coming traffic in the opposing lane. Furthermore, unlike multi-lane facilities, traffic flow in one direction influences flow in the other. The Highway Capacity Manual defines eight factors for determining a two-lane road s capacity. These are: 1) design speed, 2) lane widths, 3) shoulders, 4) passing zones, 5) vehicle mix, 6) directional split, 7) impediments to through traffic, and 8) terrain. Any reduction from the ideal condition impacts the highways capacity. Urban Streets Signalized Intersections: Traffic signals allocate time in a variety of ways, from the simplest two phase pre-timed mode to complex multi-phased actuated signals. Cycle length, phase, green time, lost time, permitted, and protected are but a few of the commonly used terms to describe a signal s operation. Capacity and level of service based on the Highway Capacity Manual is further defined for each lane group. The Highway Capacity Manual signalized level of service analysis is based on average vehicle delay. C-2
113 Appendix C: Level of Service Capacity Analysis The Highway Capacity Manual has two methods for determining level of service. The primary method is the operational analysis in which detailed information on all prevailing traffic, roadway, and signalization characteristics must be provided. The second method is for planning analysis, which only addresses capacity because it is not practical to perform detailed calculations of delay given the accuracy of the data that is generally available from travel demand models and other planning forecast methodologies. Urban Arterials: The urban arterial level of service methodology examines a segment of roadway where actual travel speed is compared to free-flow speeds. As the actual speeds drop in comparison to the free-flow speeds, the level of service drops. The Highway Capacity Manual proposes that an arterial segment be defined as at least one mile in a downtown area and two miles outside the downtown. Segments can be from signalized intersection to signalized intersection or segments grouped together. If grouped together, the average delay at the intersection needs to be included in the measurements. Urban Street Unsignalized Intersection: The unsignalized intersection analysis procedures is for analyzing two-way stop controlled intersections where vehicles approaching the primary street must stop and yield to various movement of vehicles. This procedure identifies level of service for vehicles turning right from the minor street, left from the minor street, and left from the major street to the minor street. Based on the volume of traffic to make the turn compared to the available number of gaps in the opposing movement, generates an estimated delay which correlates to level of service. Douglas County Roadway Capacity Methodology A peak hour capacity estimate was developed for each roadway segment within Douglas County, based on physical and operational characteristics, instead of a generic lookup capacity table based on roadway classifications. Whereas generic lookup tables based on functional classification are typically used in evaluating capacity and level of service, they often do not reflect the true characteristics of the roadway and they tend to mask the characteristics that reduce capacity. As an example, as Douglas County continues to grow and develop, new access points will be added to the network which will impact a roadways ability to accommodate that growing traffic. Therefore, there are two factors that affect the future traffic conditions: 1) the growth in traffic, and 2) how we accommodate access and design our roadways. The following describes seven parameters that were used to generate the roadway segment capacities, the percent adjustments made to each link based on these parameters, a resulting base year capacity map for Douglas County, and a discussion of how this methodology may be used for evaluating future year scenarios. Capacity Parameters Seven parameters based on the Highway Capacity Manual were identified for measuring the capacity of two lanes and/or four or more lane roadways. The following highlights the seven parameters and the source of the data. A map has been prepared for each of the parameters at the end of this Appendix to convey the technical data collected. Douglas County 2030 Transportation Plan November 2009 C-3
114 Appendix C: Level of Service Capacity Analysis 1. Number of Lanes (Figure C1): The primary parameter for determining the capacity of a roadway is the number of travel lanes. The majority of Douglas County roads are two lanes with some four lane segments. It should also be noted that two-lane roadways have some different operational characteristics than multi-lane roadways which affect capacity. Source: County GIS, Douglas County TransCAD Transportation Model & Aerials 2. Lane Width (Figure C2): The ideal width for a roadway is 12 feet. Roadways which have lane widths less than 12 feet impact capacity. The majority of roads within Douglas County are 12 feet, although there are some roadways with lanes as narrow as 9 feet. These narrower lane width roadways tend to be located in more rural areas of the County or along roadways with painted shoulders, in which actual pavement width is wider. Source: County Pavement Management Database 3. Shoulders (Figure C3): Shoulders provide comfort to the driver and improve safety for both motorists and bicyclists. Options are no shoulders, shoulders less than 4 feet, and shoulders over 4 feet. Roadways with shoulders have higher capacity then those without shoulders. Source: Bicycle Douglas County Field Survey and Douglas County Pavement Management Database 4. Passing Zones (Figure C4): The lack of being able to pass a vehicle, such as a slow moving truck, affects the carrying capacity of a two-lane roadway. As passing lanes increase or the percent of roadway corridor which has passing lanes, increases opportunities to pass. Two-lane roadways within Douglas County have a wide Douglas County 2030 Transportation Plan November 2009 range of passing opportunities from none to 100% of the twolane corridor. Source: Douglas County Field Survey 5. Passenger/Truck Mix (Figure C5): As the percent of trucks and large trucks increase, capacity is impacted. The Douglas County traffic model, which was based on the DRCOG regional transportation model, has a truck trip assignment module. This truck model generates truck trips by land use and trip types and assigns them to the roadway network. This truck model was used for estimating the automobile and truck mix. Source: Douglas County/DRCOG Regional Truck Model 6. Directional Split (Figure C6): The ideal directional split for maximizing capacity for a roadway is when 50% of the traffic is traveling in each direction. Typically, there tends to be a higher directional split in the a.m. for trips traveling to work and a reverse directional flow during the p.m. peak hour. This directional split factor is generated by the Douglas County traffic model, which was validated by existing traffic counts. Source: Douglas County Travel Model and Traffic Counts 7. Friction Factor (Figure C7): A freeway is the ideal roadway for providing maximum capacity. It has controlled access at interchanges and restricted access between the interchanges. As intersections and access are accommodated on Major Arterials, Minor Arterials, and Collectors, conflicts are introduced in the travel stream and the facility s carrying capacity is reduced. There are three types of interference or friction that can occur on a roadway: 1) intersections or driveways that have traffic signals to curtail through movement traffic, 2) roadways or major driveways that provide access to large developments which are C-4
115 Appendix C: Level of Service Capacity Analysis stop controlled, and 3) smaller business or residential type driveways. Because these three types of conflicts create different levels of impact to the carrying capacity of a roadway, a three-tier weighting factor was created where a major signalized intersection with another roadway or major development access was weighted at 10, a major intersection that is stop controlled a 5, and the smaller driveways a 0.5. For each roadway segment, the weighted conflicts were averaged to a conflict or friction factor per mile. Source: Based on GIS and aerials, data was collected for each roadway segment for all County roads. The number of each conflict by type were recorded for each segment and added to the GIS database. The total friction factor was then generated based on total weighted conflicts by segment length to define a uniformed conflict per mile. Douglas County Peak Hour Directional Capacity Analysis Calculation Model The methodology for determining the peak hour roadway capacity per segment was based on the spreadsheet model presented in the following table (page C-6). As presented in this table, there are ranges of measurements for each of the seven parameters identified above. Based on the TRB Highway Capacity Manual analysis, adjustments to the ideal capacity condition were identified for different conditions. As an example, the ideal lane width for a roadway is 12 feet. As the lane width decreases from 12 to 11 or 10 feet, the carrying capacity decreases to 95% and 90%, respectively, compared to the ideal condition. Because there are operational differences between two-lane and multilane roadways, there are some parameters within the table that have different values for each of the categories. As an example, the presence Douglas County 2030 Transportation Plan November 2009 and size of a shoulder impacts the capacity of a two-lane roadway more than a multi-lane roadway. The presence of passing zones and directional splits only affect two-lane roadways. The parameter adjustments were calibrated to fit an ideal high, medium, and low target. A change in the adjustment for a parameter would equally impact a roadway that was calibrated versus one that was not calibrated. Therefore, a number of iterations and trials and errors were undertaken to identify a representative set of capacity adjustments. Douglas County Peak Hour Capacity Map Data for each of the seven parameters were added to the TransCAD travel model and a capacity algorithm was added to the travel model to reflect the directional capacity analysis model. This model was applied to each of the links, yielding the Douglas County Peak Hour Capacity Map. In review of the map, the capacities look intuitive. These capacities are raw and not smoothed, meaning that there may be a roadway segment that might go from one category to another then back based on minor differences yet crossed a threshold. With future analysis, these minor differences are smoothed to reflect the overall corridors characteristics. Future Year Evaluations The peak hour capacity estimates based on the seven factors were for base year conditions. As new roadways were added, it was assumed that all new facilities will have 12-foot lanes and shoulders greater than 4 feet. Truck mix and directional split were calculated based on the travel model. Future growth will result in new intersections and access, which will in turn affect friction along the roadway and, therefore, capacity. Existing access control was assumed in future networks. Limiting access will be critical to maintaining carrying capacities. C-5
116 Appendix C: Level of Service Capacity Analysis Douglas County Peak Hour Directional Capacity Analysis Category Number Measurement Peak Hour Directional Capacity Adjustments High Median Low High Median Low High Median Low 1 Number of Lanes (Total) Number of Lanes (By Direction) Directional Capacity Ideal Conditions 1,600 3,200 4,800 1,600 1,600 1,600 3,200 3,200 3,200 4,800 4,800 4,800 2 Lane Width 12 foot 11 foot 10 foot 2 & 4 Lane combine No 3 Shoulder 4'+ 0-4' Shoulder 2 Lane Lane Passing Zones 100% 80% Lane Passenger/Large Truck Mix 100/0 99/1 98/2 97/3 96/4 95/5 2 Lane Lane Directional Split 50/50 60/40 70/30 80/20 90/10 100/0 2 Lane Calibration By Roadway Size 7 Friction Factor* Very Low Low Moderate High Conflict Score & 4 Lane * Friction Factor Calculations Conflicts By Type Per Roadway Segment Number of Conflicts Per Roadway Segment Weight Daily Target Times Driveways ,000 15,000 10,000 48,000 36,000 28,000 72,000 54,000 42,000 Conflict Weight By Type Major Intersections (Non-Signalized) 5 Divided By Major Intersections Signalized 10 Daily Capacity Estimate ( Blue Over Target - Red Under Target ) Segment Length in Miles 21,253 14,068 9,632 48,128 37,121 28,236 72,192 55,681 42,353 Equals Conflict Points Per Mile = Friction Difference 1,253 (932) (368) 128 1, , % -6% -4% 0% 3% 1% 0% 3% 1% Douglas County 2030 Transportation Plan November 2009 C-6


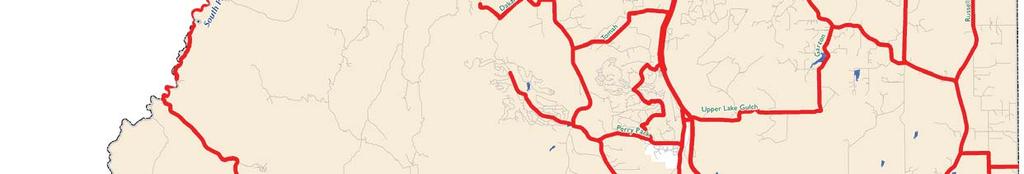
117 FIGURE C1: FACTORS WHICH AFFECT CAPACITIES NUMBER OF LANES FIGURE C1: FACTORS WHICH AFFECT CAPACITIES NUMBER OF LANES C-7


118 FIGURE C2: FACTORS WHICH AFFECT CAPACITIES LANE WIDTHS FIGURE C2: FACTORS WHICH AFFECT CAPACITIES LANE WIDTHS C-8


119 FIGURE C3: FACTORS WHICH AFFECT CAPACITIES SHOULDERS FIGURE C3: FACTORS WHICH AFFECT CAPACITIES SHOULDERS C-9


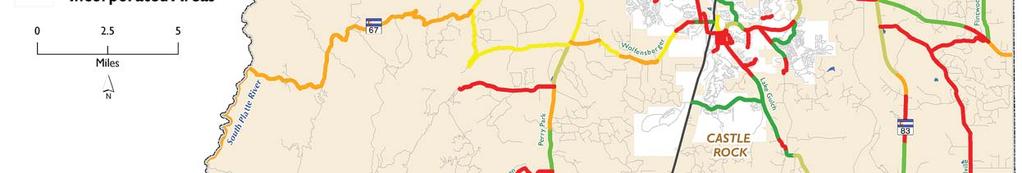
120 FIGURE C4: FACTORS WHICH AFFECT CAPACITIES PASSING ZONES FIGURE C4: FACTORS WHICH AFFECT CAPACITIES PASSING ZONES C-10


121 FIGURE C5: FACTORS WHICH AFFECT CAPACITIES CAR/TRUCK MIX FIGURE C5: FACTORS WHICH AFFECT CAPACITIES CAR/TRUCK MIX C-11


122 FIGURE C6: FACTORS WHICH AFFECT CAPACITIES DIRECTIONAL SPLIT FIGURE C6: FACTORS WHICH AFFECT CAPACITIES DIRECTIONAL SPLIT C-12


123 FIGURE C7: FACTORS WHICH AFFECT CAPACITIES FRICTION FACTORS FIGURE C7: FACTORS WHICH AFFECT CAPACITIES FRICTION FACTORS C-13


124 FIGURE C8: EXISTING PM PEAK HOUR ROADWAY CAPACITIES FIGURE C8: EXISTING PM PEAK HOUR ROADWAY CAPACITIES C-14
Chapter 6 Transportation Plan
 Chapter 6 Transportation Plan Transportation Plan Introduction Chapter 6 Transportation Plan Transportation Plan Introduction This chapter describes the components of Arvada s transportation system, comprised
3.0 Future Conditions
 3.0 Future Conditions In order to be able to recommend appropriate improvements to the transportation system of the Town, it is important to first understand the nature and volume of traffic that is expected
Regional Transportation Needs Within Southeastern Wisconsin
 Regional Transportation Needs Within Southeastern Wisconsin #118274 May 24, 2006 1 Introduction The Southeastern Wisconsin Regional Planning Commission (SEWRPC) is the official areawide planning agency
City of Wayzata Comprehensive Plan 2030 Transportation Chapter: Appendix A
 A1. Functional Classification Table A-1 illustrates the Metropolitan Council s detailed criteria established for the functional classification of roadways within the Twin Cities Metropolitan Area. Table
Chapter 5 Future Transportation
 Chapter 5 Future Transportation The Future Land Use Plan identifies the desired land use designations. The land uses desired for Crozet depend, in large part, on the success of the transportation system,
Clackamas County Comprehensive Plan
 ROADWAYS The County s road system permits the movement of goods and people between communities and regions, using any of a variety of modes of travel. Roads provide access to virtually all property. They
Solana Beach Comprehensive Active Transportation Strategy (CATS)
") Solana Beach Comprehensive Active Transportation Strategy (CATS) 3.0 Goals & Policies The Solana Beach CATS goals and objectives outlined below were largely drawn from the Solana Beach Circulation Element
Solana Beach Comprehensive Active Transportation Strategy (CATS) 3.0 Goals & Policies The Solana Beach CATS goals and objectives outlined below were largely drawn from the Solana Beach Circulation Element
SANTA CLARA COUNTYWIDE BICYCLE PLAN August 2008
 SANTA CLARA COUNTYWIDE BICYCLE PLAN August 2008 To assist VTA and Member Agencies in the planning, development and programming of bicycle improvements in Santa Clara County. Vision Statement To establish,
Transportation. Our Parker community. will develop and sustain. a safe, convenient and. efficient transportation. system incorporating
 VISION Our Parker community will develop and sustain a safe, convenient and efficient transportation system incorporating and integrating various modes of travel including automobiles, public transportation,
CITY OF COCOA BEACH 2025 COMPREHENSIVE PLAN. Section VIII Mobility Element Goals, Objectives, and Policies
 CITY OF COCOA BEACH 2025 COMPREHENSIVE PLAN Section VIII Mobility Element Goals, Objectives, and Policies Adopted August 6, 2015 by Ordinance No. 1591 VIII MOBILITY ELEMENT Table of Contents Page Number
Exhibit 1 PLANNING COMMISSION AGENDA ITEM
 Exhibit 1 PLANNING COMMISSION AGENDA ITEM Project Name: Grand Junction Circulation Plan Grand Junction Complete Streets Policy Applicant: City of Grand Junction Representative: David Thornton Address:
Circulation in Elk Grove includes: Motor vehicles, including cars and trucks
 Circulation, as it is used in this General Plan, refers to the many ways people and goods move from place to place in Elk Grove and the region. Circulation in Elk Grove includes: Motor vehicles, including
El Paso County 2040 Major Transportation Corridors Plan
 El Paso County 2040 Major Transportation Corridors Plan Connect-our-County Online Transportation User Survey Preliminary Results June 24, 2010 Years of Residence 2. How many years have you LIVED HERE?
4. ENVIRONMENTAL IMPACT ANALYSIS 9. TRANSPORTATION AND TRAFFIC
 4. ENVIRONMENTAL IMPACT ANALYSIS 9. TRANSPORTATION AND TRAFFIC 4.9.1 INTRODUCTION The following section addresses the Proposed Project s impact on transportation and traffic based on the Traffic Study
Recommended Roadway Plan Section 2 - Land Development and Roadway Access
 Recommended Roadway Plan Section 2 - Land Development and Roadway Access SECTION 2 Land Development and Roadway Access 2.1 Land Use and Access Management The Federal Highway Administration (FHWA) defines
ACTIVE TRANSPORTATION
 ACTIVE TRANSPORTATION Mobility 2040 Supported Goals Improve the availability of transportation options for people and goods. Support travel efficiency measures and system enhancements targeted at congestion
Transportation Master Plan Advisory Task Force
 Transportation Master Plan Advisory Task Force Network Alternatives & Phasing Strategy February 2016 BACKGROUND Table of Contents BACKGROUND Purpose & Introduction 2 Linking the TMP to Key Council Approved
Welcome. Background. Goals. Vision
 Welcome The formal Public Information Centre (PIC) for the Transportation Master Plan How We GO will be held in early 2017. At that time we will present the recommended transportation system for Niagara
City of Hamilton s Transportation Master Plan (TMP) Public Consultation 3 December 2015
 Public Consultation 3 December 2015") City of Hamilton s Transportation Master Plan (TMP) Public Consultation 3 December 2015 McPhail Transportation Planning Services Ltd. AGENDA 6:00 7:00 pm Viewing Boards / Q & A with the Team 7:00 7:50
City of Hamilton s Transportation Master Plan (TMP) Public Consultation 3 December 2015 McPhail Transportation Planning Services Ltd. AGENDA 6:00 7:00 pm Viewing Boards / Q & A with the Team 7:00 7:50
2.0 Existing Conditions
 20 2.0 Existing Conditions 2.1 Land Use, Future Growth Patterns, Physical Barriers Geographic Overview Sutter County s land use pattern is characterized by extensive agricultural areas, significant natural
o n - m o t o r i z e d transportation is an overlooked element that can greatly enhance the overall quality of life for the community s residents.
 N o n - m o t o r i z e d transportation is an overlooked element that can greatly enhance the overall quality of life for the community s residents. 84 Transportation CHAPTER 11 INTRODUCTION Transportation
Access Management Regulations and Standards
 Access Management Regulations and Standards Efficient highway operation Reasonable property access Concept of Access Management The way to manage access to land development while simultaneously preserving
Executive Summary Route 30 Corridor Master Plan
 Route Corridor Master Plan Project Overview The Route Corridor Master Plan is a coordinated multimodal transportation and land use plan for the entire stretch of Route through East Whiteland Township,
Sixth Line Development - Transit Facilities Plan
 Memorandum Date: November 13, 2012 To: From: c.c. Subject: Rob Freeman (Freeman Planning) Kevin Phillips Sixth Line Development - Transit Facilities Plan 33016631 This memo was prepared to review the transit
Proposed. City of Grand Junction Complete Streets Policy. Exhibit 10
 Proposed City of Grand Junction Complete Streets Policy Exhibit 10 1 City of Grand Junction Complete Streets Policy Vision: The Complete Streets Vision is to develop a safe, efficient, and reliable travel
City of Novi Non-Motorized Master Plan 2011 Executive Summary
 City of Novi Non-Motorized Master Plan 2011 Executive Summary Prepared by: February 28, 2011 Why Plan? Encouraging healthy, active lifestyles through pathway and sidewalk connectivity has been a focus
Lee s Summit Road Improvement Study Public Open House June 7, 2007 Summary of Comment Card Responses
 Lee s Summit Road Improvement Study Public Open House June 7, 2007 Summary of Comment Card Responses Introduction At the Lee s Summit Road Improvement Study Public Open House held Thursday, June 7, 2007
Appendix C. NORTH METRO STATION AREA TRAFFIC IMPACT STATEMENT 88th Avenue Station
 Appendix C NORTH METRO STATION AREA TRAFFIC IMPACT STATEMENT 88th Avenue Station Prepared for: Regional Transportation Department and URS Corporation as part of the North Metro EIS David Evans and Associates,
Chapter 7. Transportation. Transportation Road Network Plan Transit Cyclists Pedestrians Multi-Use and Equestrian Trails
 Chapter 7 Transportation Transportation Road Network Plan Transit Cyclists Pedestrians Multi-Use and Equestrian Trails 7.1 TRANSPORTATION BACKGROUND The District of Maple Ridge faces a number of unique
MOUNTAIN HOUSE SPECIFIC PLAN I 9.1 INTRODUCTION ASSUMPTIONS TRANSPORTATION FACILITIES TRANSPORTATION IMPROVEMENTS PHASING 9.
 CHAPTER NINE: TRANSPORTATION AND CIRCULATION 9.1 INTRODUCTION 9.1 9.2 ASSUMPTIONS 9.1 9.3 TRANSPORTATION FACILITIES 9.1 9.4 TRANSPORTATION IMPROVEMENTS PHASING 9.3 LIST OF FIGURES LIST OF TABLES Figure
ACTION TRANSMITTAL No
 Transportation Advisory Board of the Metropolitan Council of the Twin Cities ACTION TRANSMITTAL No. 2016-15 DATE: January 14, 2016 TO: TAC Planning Committee PREPARED BY: Steven Elmer (651) 602-1756 SUBJECT:
TRAFFIC IMPACT STUDY CRITERIA
 Chapter 6 - TRAFFIC IMPACT STUDY CRITERIA 6.1 GENERAL PROVISIONS 6.1.1. Purpose: The purpose of this document is to outline a standard format for preparing a traffic impact study in the City of Steamboat
Classification Criteria
 SCHEDULE D TO RECOMMENDED OFFICIAL PLAN AMENDMENT NO. 40 SCHEDULE C-4 Road Criteria Criteria Traffic Service Objective Land Service/Access Typical Daily Traffic Volume Flow characteristics Travel Speed
MCTC 2018 RTP SCS and Madera County RIFP Multi-Modal Project Eval Criteria GV13.xlsx
 MCTC 8 RTP SCS and Madera County RIFP Multi-Modal Project Eval Criteria GV.xlsx Madera County Transportation Commission Regional Transportation Plan / Sustainable Communities Strategy Multi-Modal Project
CONNECTING PEOPLE TO PLACES
 CONNECTING PEOPLE TO PLACES 82 EAST BENCH MASTER PLAN 07 Introduction The East Bench transportation system is a collection of slow moving, treelined residential streets and major arteries that are the
Executive Summary. September 3, 2014
 D Executive Summary September 3, 2014 Study Background and Purpose Citizens for Picture Rocks is a community advocacy group representing the Picture Rocks Fire Department, Pima County Sheriff s Department,
RESOLUTION NO ?? A RESOLUTION OF THE CITY OF NEPTUNE BEACH ADOPTING A COMPLETE STREETS POLICY
 RESOLUTION NO. 2018-?? A RESOLUTION OF THE CITY OF NEPTUNE BEACH ADOPTING A COMPLETE STREETS POLICY WHEREAS, safe, convenient, and accessible transportation for all users is a priority of the City of Neptune
Basalt Creek Transportation Refinement Plan Recommendations
 Basalt Creek Transportation Refinement Plan Recommendations Introduction The Basalt Creek transportation planning effort analyzed future transportation conditions and evaluated alternative strategies for
Planning Guidance in the 2012 AASHTO Bike Guide
 Planning Guidance in the 2012 AASHTO Bike Guide Presentation by: RJ Eldridge Peter Lagerwey August 22, 2012 WEBINAR 2: PLANNING GUIDANCE IN THE 2012 AASHTO BIKE GUIDE Today s Webinar Significant Updates
Multimodal Through Corridors and Placemaking Corridors
 68 Multimodal Through Corridors and Placemaking Corridors Corridors have different functions in a region. Some corridors are used to get smoothly and rapidly through a region or to get quickly to major
EXECUTIVE SUMMARY OF CALEDON TRANSPORTATION NEEDS STUDY
 EXECUTIVE SUMMARY OF CALEDON TRANSPORTATION NEEDS STUDY The Caledon Transportation Needs Study has been undertaken as a joint project by the Town of Caledon and the Region of Peel to determine the existing
Base Information. 1. Project Title Erie Parkway and WCR 7 Traffic Signal Project
 Part 1 Base Information 1. Project Title Erie Parkway and WCR 7 Traffic Signal Project 2. Project Start/End points or Geographic Area Provide a map with submittal, as appropriate 3. Project Sponsor (entity
5.0 Roadway System Plan
 Southwest Boise Transportation Study Page 16 5.0 Roadway System Plan The Roadway System Plan outlines roadway improvements in the Initial Study Area. It forecasts future deficiencies on the arterial system,
Tulsa Metropolitan Area LONG RANGE TRANSPORTATION PLAN
 Tulsa Metropolitan Area LONG RANGE TRANSPORTATION PLAN Indian Nations Council of Governments August 2005 CONTACTING INCOG In developing the Destination 2030 Long Range Transportation Plan, INCOG s Transportation
REGIONAL BICYCLE AND PEDESTRIAN DESIGN GUIDELINES
 REGIONAL BICYCLE AND PEDESTRIAN DESIGN GUIDELINES November 16, 2011 Deb Humphreys North Central Texas Council of Governments Bicycle and Pedestrian Advisory Committee Snapshot of the Guide 1. Introduction
Defining Purpose and Need
 Advanced Design Flexibility Pilot Workshop Session 4 Jack Broz, PE, HR Green May 5-6, 2010 Defining Purpose and Need In your agency s project development process, when do design engineers typically get
INTRODUCTION THOROUGHFARE SYSTEM CLASSIFICATIONS
 INTRODUCTION The thoroughfare plan will assist public officials in the development of a specialized system for efficient and safe movement of vehicular traffic while minimizing potential conflicts with
3.9 Recreational Trails and Natural Areas
 3.9 Recreational Trails and Natural Areas 3.9.1 Introduction Parks and other recreational facilities such as trails, bicycle routes, and open space are important community resources. This section discusses
Prepared For: Shieldbay Developments Inc. c/o Matson, McConnell Ltd. 2430A Bloor Street West Toronto, Ontario M6S 1P9.
 Prepared For: Shieldbay Developments Inc. c/o Matson, McConnell Ltd. 2430A Bloor Street West Toronto, Ontario M6S 1P9 Prepared By: URS Canada Inc. 4 th Floor, 30 Leek Crescent Richmond Hill, Ontario L4B
Pocatello Regional Transit Master Transit Plan Draft Recommendations
 Pocatello Regional Transit Master Transit Plan Draft Recommendations Presentation Outline 1. 2. 3. 4. What is the Master Transit Plan? An overview of the study Where Are We Today? Key take-aways from existing
Madison Urban Area and Dane County. Bicycle Transportation Plan Summary. September Introduction. Bicycle Plan Scope and Planning Process
 Bicycle Transportation Plan Summary Madison Urban Area and Dane County Introduction September 2000 Bicycling is an important mode of transportation in the Madison urban area and countywide that is available
I-105 Corridor Sustainability Study (CSS)
") I-105 Corridor Sustainability Study (CSS) Metro Streets and Freeways Subcommittee March 21, 2019 Gary Hamrick Cambridge Systematics, Inc. I-105 CSS Project History & Background Funded by Caltrans Sustainable
I-105 Corridor Sustainability Study (CSS) Metro Streets and Freeways Subcommittee March 21, 2019 Gary Hamrick Cambridge Systematics, Inc. I-105 CSS Project History & Background Funded by Caltrans Sustainable
BETHEL ROAD AND SEDGWICK ROAD CORRIDOR STUDY
 DRAFT PLAN City Council Meeting August 14, 2017 STUDY AREA Sedgwick Corridor State Route 160, principal arterial with Class 3 access management designation, commuter and freight route, connection to SR
Corporate. Report COUNCIL DATE: June 26, 2006 NO: C012 COUNCIL-IN-COMMITTEE. TO: Mayor & Council DATE: June 22, 2006
 Corporate NO: C012 Report COUNCIL DATE: June 26, 2006 COUNCIL-IN-COMMITTEE TO: Mayor & Council DATE: June 22, 2006 FROM: General Manager, Engineering FILE: 0410-20(MoT/Gate) SUBJECT: Surrey Response on
Preliminary Transportation Analysis
 Preliminary Transportation Analysis Goals of a Robust, Multimodal Transportation Network Safe Accessible/Connected Efficient Comfortable Context-Sensitive Motor Vehicle: Continue to analyze the data to
SECTION 1 - TRAFFIC PLANNING
 SECTION 1 - TRAFFIC PLANNING 1.1 TRAFFIC OPERATIONS 1.1.1 Roadway Functional Classification The Multnomah County Comprehensive Framework Plan s Policy 34: Trafficways and the Functional Classification
Purpose and Need. Chapter Introduction. 2.2 Project Purpose and Need Project Purpose Project Need
 Chapter 2 Purpose and Need 2.1 Introduction The El Camino Real Bus Rapid Transit (BRT) Project (Project) would make transit and other transportation improvements along a 17.6-mile segment of the El Camino
City of Charlottesville Bicycle and Pedestrian Master Plan Update
 City of Charlottesville Bicycle and Pedestrian Master Plan Update September 17, 2014 I. Welcome and meeting overview II. Project status update III. Network overview IV. Break-out groups Pedestrian Network
PEDESTRIAN ACTION PLAN
 ATTACHMENT 2 CITY OF SANTA MONICA PEDESTRIAN ACTION PLAN CITY OF SANTA MONICA PEDESTRIAN ACTION PLAN This page intentionally left blank EXECUTIVE SUMMARY CHAPTER 1 EXECUTIVE SUMMARY Setting the Stage
Highway 217 Corridor Study. Phase I Overview Report
 Highway 217 Corridor Study Phase I Overview Report November 3, 24 BACKGROUND AND OVERVIEW Study purpose The Highway 217 Corridor Study is developing multi-modal transportation solutions for traffic problems
5. RUNNINGWAY GUIDELINES
 5. RUNNINGWAY GUIDELINES These guidelines should be considered collectively when making runningway decisions. A runningway is the linear component of the transit system that forms the right-of-way reserved
Magnolia Place. Traffic Impact Analysis. Prepared for: City of San Mateo. Prepared by: Hexagon Transportation Consultants, Inc.
 Magnolia Place Traffic Impact Analysis Prepared for: City of San Mateo Prepared by: Hexagon Transportation Consultants, Inc. Updated January 4, 2010 Table of Contents 1. Introduction...1 2. Existing Conditions...6
TRANSPORTATION NEEDS ASSESSMENT
 TRANSPORTATION NEEDS ASSESSMENT A travel demand analysis was carried out to determine the operational issues and the potential benefit that adding traffic capacity would have on the road network. All the
HARRISON STREET/OAKLAND AVENUE COMMUNITY TRANSPORTATION PLAN
 HARRISON STREET/OAKLAND AVENUE Community Workshop #4: Draft Plan Review December 3, 2009 D E S I G N, C O M M U N I T Y & E N V I R O N M E N T INTRODUCTIONS Key Project Staff: Alisa Shen, Project Manager,
Chapter 5 FUNCTIONAL CLASSIFICATION
 Chapter 5 FUNCTIONAL CLASSIFICATION Functional classification is a system by which streets and roadways may be distinguished by types according to their function within the entire transportation network.
METHODOLOGY. Signalized Intersection Average Control Delay (sec/veh)
") Chapter 5 Traffic Analysis 5.1 SUMMARY US /West 6 th Street assumes a unique role in the Lawrence Douglas County transportation system. This principal arterial street currently conveys commuter traffic
Chapter 5 Traffic Analysis 5.1 SUMMARY US /West 6 th Street assumes a unique role in the Lawrence Douglas County transportation system. This principal arterial street currently conveys commuter traffic
Non-Motorized Transportation 7-1
 Non-Motorized Transportation 7-1 Transportation facilities no longer mean just accommodating a vehicle powered by a combustion engine. Pedestrian and non-motorized facilities are important modes of travel
Develop a Multi-Modal Transportation Strategy (Theme 6)
") DEVELOP A MULTI-MODAL TRANSPORTATION STRATEGY (THEME 6) WHY IS THIS THEME ADDRESSED? Develop a Multi-Modal Transportation Strategy (Theme 6) Statement of Ideal Reduce resident and visitor reliance on single
DEVELOP A MULTI-MODAL TRANSPORTATION STRATEGY (THEME 6) WHY IS THIS THEME ADDRESSED? Develop a Multi-Modal Transportation Strategy (Theme 6) Statement of Ideal Reduce resident and visitor reliance on single
South King County High-Capacity Transit Corridor Study
 HIGH-CAPACITY TRANSIT CORRIDOR STUDY South King County Corridor South King County High-Capacity Transit Corridor Study Corridor Report August 2014 South King County High Capacity Transit Corridor Report
DRAFT BUENA VISTA 2020 TRANSPORTATION PLAN
 DRAFT BUENA VISTA 2020 TRANSPORTATION PLAN DEVELOPED BY THE TRANSPORTATION PLANNING DIVISION OF THE VIRGINIA DEPARTMENT OF TRANSPORTATION IN COOPERATION WITH THE U.S. DEPARTMENT OF TRANSPORTATION, FEDERAL
4.0 Recommended Transportation Plan
 4.0 Recommended Transportation Plan The Town wants to provide a multi modal transportation system for its residents in order to provide them with options when making trips. The automobile has always been
This page intentionally left blank.
 This page intentionally left blank. COMMUNITY Coweta Community Overview Coweta Coweta, a residential community located in Wagoner County, is a suburb of Tulsa situated southeast of the metropolitan area
Welcome. The Brooklin Secondary Plan and Transportation Master Plan are collectively referred to as the Brooklin Study.
 Welcome The Town of Whitby is undertaking a study to prepare a Secondary Plan and Transportation Master Plan to guide and manage growth in the Brooklin area. The Brooklin Secondary Plan and Transportation
TRANSPORTATION ASSESSMENT
 TRANSPORTATION ASSESSMENT Traffic Modeling The mobility findings analysis for Dallas was based on the methodology of the North Central Texas Council of Government s Regional travel demand model. This model
GOAL 2A: ESTABLISH AND MAINTAIN A SAFE, CONVENIENT, AND EFFICIENT MULTI-MODAL TRANSPORTATION SYSTEM TO MOVE PEOPLE AND GOODS THROUGHOUT THE CITY.
 2. TRANSPORTATION ELEMENT The purpose of this element is to assist in establishing an adequate transportation system within the City and to plan for future motorized and non-motorized traffic circulation
Roads and Vehicular Traffic Design Principles. Roads and Vehicular Traffic Recommendations
 CIRCULATION AND PARKING roads and vehicular traffic The Campus Master Plan updates the campus transportation network through a multi-modal approach that encourages walking and biking while improving vehicular
Chapter 6: Transportation
 Chapter 6: Transportation I. INTRODUCTION The purpose of the Transportation Plan element of the Comprehensive Plan is to provide guidance to the City of North Mankato, as well as existing and future landowners
Route 7 Corridor Study
 Route 7 Corridor Study Executive Summary Study Area The following report analyzes a segment of the Virginia State Route 7 corridor. The corridor study area, spanning over 5 miles in length, is a multi
INTERMODAL TRANSPORTATION PLAN
 INTRODUCTION INTERMODAL TRANSPORTATION PLAN Effective intermodal transportation implies a public policy for actively decreasing the demand for automobile trips and consequently reducing automobile related
University of Victoria Campus Cycling Plan Terms of Reference. 1.0 Project Description
 University of Victoria Campus Cycling Plan Terms of Reference 1.0 Project Description The Campus Cycling Plan, a first for the University, will provide a comprehensive and coordinated approach to support
The Route 29 Corridor Study was initiated at the request of Virginia s Commonwealth
 CHAPTER 2: Study Background and approach The Route 29 Corridor Study was initiated at the request of Virginia s Commonwealth Transportation Board in response to requests from members of the General Assembly
Access Management Regulations and Standards for Minor Arterials, Collectors, Local Streets
 Access Management Regulations and Standards for Minor Arterials, Collectors, Local Streets September 2009 Paul Grasewicz Access Management Administrator Concept of Access Management The way to manage access
City of Wilsonville 5 th Street to Kinsman Road Extension Project
 City of Wilsonville 5 th Street to Kinsman Road Walking Tour & Neighborhood Workshop Summary Report Public Outreach Overview On July 18 th, 2017, the City of Wilsonville hosted a neighborhood walking tour
CHAPTER 7 ACCESS MANAGEMENT. Background. Principles of Access Management. Hennepin County Transportation Systems Plan (HC-TSP)
") CHAPTER 7 ACCESS MANAGEMENT Background Principles of Access Management Hennepin County Transportation Systems Plan (HC-TSP) Chapter 7 Access Management 7.1 Background Access management has become an important
CHAPTER 7 ACCESS MANAGEMENT Background Principles of Access Management Hennepin County Transportation Systems Plan (HC-TSP) Chapter 7 Access Management 7.1 Background Access management has become an important
ADOT Statewide Bicycle and Pedestrian Program Summary of Phase IV Activities APPENDIX B PEDESTRIAN DEMAND INDEX
 ADOT Statewide Bicycle and Pedestrian Program Summary of Activities APPENDIX B PEDESTRIAN DEMAND INDEX May 24, 2009 Pedestrian Demand Index for State Highway Facilities Revised: May 29, 2007 Introduction
Chapter 3 BUS IMPROVEMENT CONCEPTS
 Chapter 3 BUS IMPROVEMENT CONCEPTS The purpose of this chapter is to describe potential bus improvement strategies and potential impacts or implications associated with BRT implementation within the existing
MASTER THOROUGHFARE PLAN
 MASTER THOROUGHFARE PLAN Master Thoroughfare Plan Update November 2015 Prepared for Town of Northlake AVO 30659 11/11/2015 1201 North Bowser Road Richardson, Texas 75081 Firm Registration No. 312 MASTER
CITY OF BLOOMINGTON COMPLETE STREETS POLICY
 CITY OF BLOOMINGTON COMPLETE STREETS POLICY POLICY OBJECTIVE: The City of Bloomington will enhance safety, mobility, accessibility and convenience for transportation network users of all ages and abilities,
TRANSPORTATION TRAINING TOPICS. April 6, 2010
 TRANSPORTATION TRAINING TOPICS April 6, 2010 Roles of Transportation Providers Context and Policy Makers Division of Transportation and Traffic Other City Operations Other Transportation Operators CMA
WELCOME TO OPEN HOUSE # 1 June 14, 2017
 Langstaff Road Weston Road to Highway 7 Class Environmental Assessment Study WELCOME TO OPEN HOUSE # 1 June 14, 2017 Please sign in and join our mailing list Purpose of Open House #1 & Study Area York
Community Transportation Plan
 Community Transportation Plan Appendix A: Traffic Calming CITY OF DECATUR COMMUNITY TRANSPORTATION PLAN Appendix A: City of Decatur City-wide Residential Traffic Calming Program Process & Procedures The
West Dimond Blvd Upgrade Jodhpur Street to Sand Lake Road
 West Dimond Blvd Jodhpur St to Sand Lake CSS Transportation Project Summary Municipality of Anchorage Project # 05 005 Project Manager: John Smith, P.E. (MOA PM&E) Project Administrator: Julie Makela,
Access Management Regulations and Standards
 Access Management Regulations and Standards January 2014 Efficient highway operation Reasonable property access Concept of Access Management The way to manage access to land development while preserving
ACTIVE TRANSPORTATION/NONMOTORIZED TRANSPORTATION
 ACTIVE TRANSPORTATION/NONMOTORIZED TRANSPORTATION BACKGROUND Active transportation, also known as nonmotorized transportation, is increasingly recognized as an important consideration when planning and
Bicycle Master Plan Goals, Strategies, and Policies
 Bicycle Master Plan Goals, Strategies, and Policies Mobilizing 5 This chapter outlines the overarching goals, action statements, and action items Long Beach will take in order to achieve its vision of
Goodlettsville Bicycle and Pedestrian Plan Executive Summary
 Goodlettsville Bicycle and Pedestrian Plan July 2010 In Cooperation with the Nashville Area Metropolitan Planning Executive Organization Summary Introduction Progressive and forward thinking communities
Cherry Creek Transportation and Land Use Forum September 25, 2013 Meeting Summary
 Cherry Creek Transportation and Land Use Forum September 25, 2013 Meeting Summary I. LEAD-IN TO SMALL GROUP DISCUSSION, POLLING AND STEERING COMMITTEE/TECHNICAL TASK FORCE DISCUSSION The meeting began
City of Homewood Transportation Plan
 City of Homewood Transportation Plan Prepared for: City of Homewood, Alabama Prepared by: Skipper Consulting, Inc. May 2007 TABLE OF CONTENTS INTRODUCTION... 1 BACKGROUND INFORMATION... 1 EXISTING TRANSPORTATION
Bus Rapid Transit Plans
 Twin Cities Region Bus Rapid Transit Plans ULI Minnesota Workshop Connecting Bus Rapid Transit to the Community December 15, 2009 John Levin Director of Service Development Metro Transit Metropolitan Area
Corpus Christi Metropolitan Transportation Plan Fiscal Year Introduction:
 Introduction: The Safe, Accountable, Flexible, Efficient Transportation Equity Act: A Legacy for Users (SAFETEA-LU) has continued the efforts started through the Intermodal Surface Transportation Efficiency