Massachusetts. Strategic Highway Safety Plan
|
|
|
- Elmer Grant
- 5 years ago
- Views:
Transcription


1 Massachusetts Strategic Highway Safety Plan 2018
 to submit an updated Strategic Highway Safety Plan (SHSP) every five years, it is more than")

2 Executive Summary Introduction For the Commonwealth of Massachusetts, one life lost on our roadways or altered by a serious injury is unacceptable. While the Federal Highway Administration requires the Massachusetts Department of Transportation (MassDOT) to submit an updated Strategic Highway Safety Plan (SHSP) every five years, it is more than just a policy document required to unlock $34.7 million of federal funds for safety improvements. This is the Commonwealth s roadway safety Action Plan, crafted by a diverse cross section of government agencies, advocates, and other stakeholders who work tirelessly to keep all road and sidewalk users including but not limited to motorists, pedestrians, bicyclists, roadway workers, older and younger drivers safe on all state and municipal streets. The Commonwealth s long-range goal is towards zero deaths while the interim goals for 2022 are to reduce fiveyear average fatalities by 12% and serious injuries by 21%. This means that Massachusetts must continuously decrease annual fatalities by 17 and serious injuries by 128, so that by 2022 the five-year averages will have reduced to 320 fatalities and 2,467 serious injuries. In order to meet these targets a multidisciplinary team of policymakers, advocates and practitioners has prioritized a set of data-driven strategies associated with 14 emphasis areas (EAs) to address the causes of crashes. In addition to the strategies outlined in this plan and the specific actions outlined in the annually updated Action Plan, the SHSP is proposing that Massachusetts consider five high-leverage policies to reduce the frequency and severity of roadway fatalities. These legislative measures are high-leverage because they target frequently occurring types of crashes and address the interconnected nature of crashes such as speeding, driver distraction, and impaired driving. Hands Free: Would allow police to stop and issue citations to motorists using mobile electronic devices. Primary Seat Belt: Would enable law enforcement to stop motorists who appear to not be wearing seatbelts. Since releasing the 2013 SHSP, Massachusetts has made progress toward safer roadways. Fatality rates are below the national average and have decreased since the first SHSP was released in However, challenges have emerged over the past five years such as the Commonwealth s booming economy and population growth, making it more difficult to move the needle on roadway safety. The Commonwealth s economic success has led to more motorists and other roadway users, increasing the odds for congestion and crashes. In order to sustain significant progress toward zero deaths despite the Commonwealth s unprecedented growth, the 2018 SHSP calls for stronger fatality and serious injury targets and proposes aggressive policy and legislative interventions. Work Zone Safety: Would enable variable speed limits in work zones and increase penalties for motorists who strike roadway workers. Ignition Interlock for All Offenders: Would statutorily allow judges to order ignition interlock devices for first time Operating Under the Influence offenders. Truck Side Guards: Would require that trucks registered in Massachusetts, meeting certain criteria, have side guards. Automated Enforcement: Would give municipalities opt in authority to issue citations through the use of cameras and radar technology. i


3 Overview of the Plan The Massachusetts SHSP is developed in accordance with Federal Highway Administration requirements. Federal law requires that the SHSP be coordinated with the state Highway Safety Plan, Commercial Vehicle Safety Plan, and the Highway Safety Improvement Program. This coordination includes aligning performance measures and targets across the aforementioned plans, and the role of this SHSP is to support Massachusetts efforts by identifying EAs, establishing appropriate goals, and developing effective strategies and actions. This SHSP reflects the efforts of 250 engaged stakeholders from more than 50 agency partners who worked on 14 respective EAs that were developed through careful examination of statewide crash data. The outcome of their work is an implementation plan that includes 61 specific strategies, 283 direct actions and 5 legislative proposals to get Massachusetts closer towards zero deaths and to an interim goal of a 12% drop in five-year average fatalities and a 21% drop in five-year average serious injuries. There are four main sections of this plan: ӹӹgoal and Target Development: This section reviews the goals from the 2013 SHSP and the Commonwealth s safety performance between then and now. It describes the approaches used to analyze statewide data and to cooperatively work with diverse stakeholders to develop the plan s goals. It also highlights Massachusetts commitment to a long-term goal of zero roadway deaths and serious injuries. ӹӹpolicy Recommendations: There are a number of policy proposals that support the goals and strategies outlined in the SHSP that may be addressed legislatively. This section reviews the research supporting these recommendations. ӹӹprocess and Partners: Per Federal Highway Administration requirements, each SHSP is developed through the collaborative efforts of a diverse cross-section of practitioners and stakeholders. This section describes the steps taken to engage stakeholders, create the 14 EAs, routinely convene stakeholders and develop recommendations for strategies and actions. ӹ ӹ Implementation and Evaluation: SHSP implementation is meant to require active participation by all stakeholders, and as such, the multi-stakeholder EA teams that formulated this plan will convene regularly to track progress and measure the efficacy of ongoing efforts to execute the plan. ii

4 Table of Contents Executive Summary...i Table of Contents...iii About the Strategic Highway Safety Plan (SHSP)...1 SHSP Goals and Targets...3 Advancing Safety Through Policy SHSP Process and Partners...8 From Problem Identification to Action Plans...14 Lane Departure Crashes...17 Impaired Driving...18 Occupant Protection...20 Speeding and Aggressive Driving...21 Intersection Crashes...22 Pedestrians...23 Older Drivers...24 Motorcycle Crashes...26 Younger Drivers...27 Large Truck-Involved Crashes...29 Driver Distraction...31 Bicyclists...33 Safety of Persons Working on Roadways...34 At-Grade Rail Crossings...35 Data Sources...36 Glossary...37 Appendix A: Five-Year Action Plan (Updated Annually)...41 iii

5 About the Strategic Highway Safety Plan Every Life Counts Between 2012 and 2016, 1,820 people lost their lives and 15,662 were seriously injured on Massachusetts roadways. It is imperative that we look at each of these deaths and serious injuries as more than a statistic. We must view the loss of life as unacceptable, and work toward zero deaths and serious injuries on our roadways. By 2022 Massachusetts aims to reduce the annual five-year average fatalities and serious injuries by 12% and 21%, respectively, while working toward zero roadway fatalities. Strategic Highway Safety Planning in Massachusetts A Strategic Highway Safety Plan (SHSP) is a major component and requirement of the Federal Highway Safety Improvement Program (HSIP) (23 U.S.C. 148). As a statewide-coordinated safety plan, it provides a comprehensive framework for improving safety on all public roads. The Massachusetts SHSP was established in 2006 and updated in 2013 with the goal of reducing the frequency of fatalities and serious injuries on the Commonwealth s roadways, and a long-term vision of working toward zero roadway fatalities. The SHSP is developed through a collaboration of traffic safety professionals from many different organizations and disciplines. Each of these stakeholders has a role to play in improving safety in the Commonwealth. The Massachusetts SHSP is making a difference. Fatality rates in the state are below the national average, some of the lowest in the country, and have decreased since the first SHSP in The annual five-year average of fatalities per 100 million vehicle miles traveled (VMT) was reduced from 0.74 in 2006 to 0.64 in Yet the message is simple - despite our recent success, work remains to get to zero deaths and serious injuries. Our Blueprint for Improving Roadway Safety The SHSP is a datadriven strategic plan used to identify specific areas of emphasis and opportunities for strategies and actions that move us toward our safety goals. The SHSP was developed by a wide-ranging group of stakeholders that: Set priorities for all traffic safety partners in the Commonwealth over the next five years. Identify, implement and revise as necessary, high-level strategies and specific actions to address the identified emphasis areas (EAs). Help guide resources and funding toward the highest priorities and most effective strategies. Evaluate outcomes and monitor performance towards our goals for each EA. 1


6 The Massachusetts SHSP...by way of its Action Plans, is a living document to be updated, reviewed, and referenced on an ongoing basis....helps coordinate the safety-related activities of the diverse agency partners and safety stakeholders....establishes a common platform for approaching traffic safety in Massachusetts....complies with Federal requirements, and is data-driven to identify EAs and strategies to improve safety. Federal Requirements Related to the SHSP Federal law requires that the SHSP be coordinated with the state s Highway Safety Plan, Commercial Vehicle Safety Plan, and the Highway Safety Improvement Program. This coordination includes the alignment of performance measures and targets. The role of our SHSP is to support the state s efforts to achieve these targets by establishing appropriate goals, identifying EAs, and developing effective strategies and actions. Yet another reason we need the SHSP VMT in Massachusetts is on the rise. In 2016, there was an estimated 60.5 billion VMT an increase of nearly 8 percent since 2014, and statewide planning forecasts call for this trend to continue. With increases in VMT, there is an increased level of exposure and potential for crashes. Vision: A roadway system with zero roadway deaths and serious injuries. Mission: To work collaboratively on strategies that will reduce roadway fatalities and serious injuries. Goal: Our long-term goal is zero roadway fatalities and serious injuries. By year 2022, the SHSP interim goal is to reduce the five-year average fatalities by 12% and serious injuries by 21%. 2

 2011 to FY2015 (most recent data available) was 4,189, representing a 13% decline from FY2007-FY2011.")
7 SHSP Goals and Targets Reviewing the 2013 SHSP Goals In the 2013 SHSP, Massachusetts adopted a short-term goal to reduce fatalities and hospitalizations by 20% by Specifically, the goal was to reduce annual five-year average fatalities from 372 to 298 and annual five-year average hospitalizations from 4,834 to 3,867. Using the most recent annual average from 2012 to 2016, 364 lives were lost, representing a 2% decrease. The annual average hospitalizations from Fiscal Year (FY) 2011 to FY2015 (most recent data available) was 4,189, representing a 13% decline from FY2007-FY2011. Although the 2013 SHSP goals were not normalized by VMT, when VMT is considered there were notable reductions in the annual five-year averages for both fatality and incapacitating injury rates: The annual average fatality rate decreased by 6% from to The annual average incapacitating injury rate decreased by 19% from to A Performance Based Approach Initially, the overall trends of fatalities and serious injuries were presented to the Executive Leadership Committee (ELC) to provide a view of the state on roadway safety, and to reinforce the notion that to achieve long term goals of zero deaths and serious injuries, it will require action from every SHSP partner. Data that includes annual fatalities and serious injuries as well as fatality and serious injury rates (all calculated using five-year averages) were used to establish short-term Federallymandated performance targets for Annual Average Fatalities & Rate from Motor Vehicle Crashes The annual average (five-year rolling) of fatalities from motor vehicle crashes has remained relatively constant, while the annual average (five-year rolling) fatality VMT rate has decreased slightly in recent years, with the most recent average ( ) resulting in fatal injuries and 0.63 fatal injuries per 100 million VMT per year. 3
 resulting in 3,132 incapacitating injuries and 5.47 incapacitating injuries per 100 million VMT per year.")
8 Annual Average Incapacitating Injuries & Rate from Motor Vehicle Crashes The number and rate of incapacitating injuries from motor vehicle crashes have steadily decreased in recent years, with the most recent average ( ) resulting in 3,132 incapacitating injuries and 5.47 incapacitating injuries per 100 million VMT per year. Please note that in the Massachusetts crash system, injury severity is based on incapacitating injuries not serious injuries. This will change in 2019 based on the Federal rule for defining suspected serious injuries. The SHSP analyses completed as part of the update process are based upon incapacitating injuries. The same data was also used to establish interim goals associated with the time-frame of the current SHSP with goals ending with year Similarly, all goals are based on annual five-year rolling averages, referenced to by the ending year. To identify successes since the first SHSP in 2006, and to target current safety priorities, a data trend review was conducted. Since the first SHSP implementation, safety initiatives like strengthened enforcement of traffic laws and public education around driver behavior, along with the adoption of emerging engineering guidelines, have aligned to create a safer transportation network. Moving toward the long-term vision and 2022 goals will require a continued effort from all SHSP partners across the Commonwealth. SHSP leadership consulted with representatives from other agencies at State, local, and regional levels to set appropriate goals and strategies. This encouraged adoption and incorporation of the goals and strategies into stakeholders programs - specifically Executive Office of Public Safety & Security - Highway Safety Division (EOPSS-HSD) (required to submit targets to National Highway Traffic Safety Administration [NHTSA]), the Massachusetts Department Of Transportation (MassDOT) Planning working closely with the Metropolitan Planning Organizations (MPOs), and the Office of Performance Management and Innovation (OPMI). In addition to being data-driven and measurable, the goals and strategies are both action-oriented and time-based. Additionally the approach aligns with the Federal requirement that states set five performance targets each year for the Highway Safety Improvement Program (HSIP). The five performance targets include annual averages (five-year rolling) for the following: 1. Number of fatalities 2. Rate of fatalities per 100 million VMT 3. Number of serious injuries* 4. Rate of serious injuries per 100 million VMT* 5. Combined total number of non-motorized fatalities and non-motorized serious injuries involving a motor vehicle during a calendar year *Injury targets are now required to be based upon crashes rather than hospitalizations. In the Massachusetts crash system, the injury severity is based upon incapacitating injuries not serious injuries This will change in 2019 based upon the Federal rule for defining suspected serious injuries. 4

9 A Commitment to Our Goals Our long-term goal is simple zero roadway fatalities and serious injuries. Through the SHSP and the 14 EA Action Plans, we developed a blueprint that will help guide us toward that long-term goal. However, we have also committed to five-year goals associated with the time-frame of this SHSP. Although specific goals within each EA have not been defined, we are confident that with our commitment to crash reductions, each EA will collectively help us achieve our goals. Primary Goal: Zero roadway fatalities and serious injuries. Fatalities The annual number of fatalities in Massachusetts was relatively stable from 2013 to In 2016 there was a marked increase in these numbers (up from about 345 to 395). The immediate goal is to reverse this recent upward trend, while simultaneously aiming for: ӹӹannual average fatalities of 320 (five-year rolling) by This reflects a 12% drop and 44 additional lives saved from the 2016 annual average (five-year rolling) fatalities of 364. ӹӹannual average fatalities per 100 million VMT of 0.52 (five-year rolling) by This reflects a drop of approximately 14% from the 2016 annual average (five-year rolling) rate of 0.61 per 100 million VMT. Serious Injuries The number of incapacitating injuries decreased each calendar year between 2012 and 2016 (from 3,587 to 2,867). In 2016, the number of incapacitating injuries increased slightly to 2,980. The immediate goal is to revert the recent trend and aim for continued reductions of: ӹӹannual average (five-year rolling) serious injuries of 2,467 by This reflects a 21% drop and 665 fewer injuries from the 2016 annual average (five-year rolling) serious injuries of 3,132. ӹӹannual average (five-year rolling) serious injuries per 100 million VMT of 4.02 by This reflects a drop of approximately 23% from the 2016 annual average rate of 5.21 serious injuries per 100 million VMT. The fatality/serious injury rates are calculated using the goal and the projected VMT; MassDOT Planning projects a 0.3% annual increase in VMT. Achieving our goals will not be easy. To reach our 2022 targets, Massachusetts must continuously decrease annual fatalities by 17 and serious injuries by


10 Advancing Safety Through Policy Legislative Initiative Recognizing the impact of legislation and policy on traffic safety, many of the EA teams have engaged in an organized dialogue on legislation impacting transportation safety, both in the Commonwealth and across the country. The approach is two-fold, and includes: 1) tracking traffic safety legislation and disseminating relevant information across transportation safety stakeholders, and 2) as appropriate, supporting legislation and policy changes through data and information sharing that affects and improves transportation safety. Using the Center for Disease Control s Motor Vehicle Prioritizing Interventions and Cost Calculator for States as resources, the EA teams can estimate the effectiveness of policy-related interventions as well as the related costs. To date, the Massachusetts SHSPs have emphasized junior operator laws and graduated drivers licensing policies. As a result, the Younger Driver EA has seen a continual decrease in younger driver fatalities and incapacitating injuries. More recently, policy successes related to work zone safety and distracted driving have highlighted the potential for making policy and legislative activities a continued part of the SHSP Action Plans. In order to further build off this momentum, the multi-agency team recommends supporting legislation that addresses six policy areas where the opportunity exists to reduce the frequency and severity of roadway fatalities. We urge both the Administration and Legislature to develop and enact appropriate legislation. Several of the agencies stand ready to support efforts to draft, file and provide support for these important policies. Hands Free A hands free bill would ban the use of hand held electronic devices while driving. If passed in Massachusetts, this law would bring the Commonwealth in line with 16 other states - including the neighboring states of New Hampshire, Vermont, New York, Connecticut and Rhode Island - to allow police to stop and issue citations to drivers who use electronic devices while operating a vehicle. This law would assist police with the ability to better enforce distraction laws with the goal of reducing instances of driver distraction, which remains a substantial contributing factor to crashes. 6 Primary Seat Belt Massachusetts law only authorizes secondary enforcement of seat belt laws, which means that police officers cannot stop and ticket drivers for the sole offense of not wearing a seatbelt. Studies have found that front-seat safety belt use reduces the risk of fatal injury by 45%. Furthermore, states with Primary Enforcement Laws have 9% higher usage rates than states with Secondary laws. This factor is the impetus behind the push for a Primary Seat Belt law, which would enable law enforcement to stop motorists who appear to not be wearing seatbelts. States that have strengthened their seatbelt laws from Secondary to Primary have seen a decline in driver death rates by up to 7%. Nationwide, approximately 90% of front-seat occupants were observed wearing a seat belt in In Massachusetts, in 2018 seat belt usage rate was 81.6% one of the lowest in the nation.


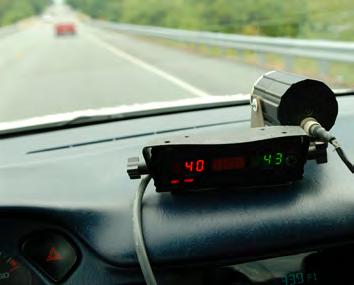
11 Work Zone Safety A work zone safety bill would support the safety of the men and women who work to maintain and improve our roadways. A comprehensive package should include the ability to post variable speed limits that are enforceable where workers are present as well as increase the penalty for motorists who hit a roadway worker or first responder in a work zone. Ignition Interlock for All Offenders An ignition interlock is a device installed in a motor vehicle to prevent a driver from operating the vehicle if the driver has been drinking. Before starting the vehicle, a driver must breathe into the device and if the driver s blood alcohol concentration (BAC) is above a pre-set limit or set point, the ignition interlock will not allow the vehicle to start [NHTSA]. Studies show that ignition interlock devices can reduce re-arrest rates for impaired driving by as much as 70%, and reduce alcohol-involved crash deaths by 15%. Though existing Massachusetts law mandates the use of ignition interlock devices for 2nd and subsequent Operating Under the Influence (OUI) offenders, no law requires the use of these devices for first offenders, and courts almost never require them. While all OUI offenders receive mandatory license suspensions of varying lengths, these suspensions are usually temporary, and some motorists with impaired driving histories continue to drive even when their licenses are suspended. Expanding the use of ignition interlock devices to cover at least some firstoffenders (for example, those granted hardship licenses) would enhance public safety and reduce recidivism, by keeping individuals with impaired judgement from getting behind the wheel. Truck Side Guards Truck side guards are vehicle-based safety devices designed to keep pedestrians, bicyclists, and motorcyclists from being run over by a large truck s rear wheels in a side-impact collision. Nearly half of bicyclists and more than one-quarter of pedestrians killed by a large truck first impact the side of a truck. Following the national side guard mandate in the UK, there was a 61 percent drop in cyclist fatalities and a 20 percent drop in pedestrian fatalities in side-impact collisions with trucks. MassDOT has committed, as part of this plan, to develop and implement a transition plan to require side guards and convex and cross-over mirrors, where appropriate, on DOT owned vehicles. In addition, legislation should be developed to address side guard requirements on other state-owned trucks as well as requirements for trucks used by private companies with municipal and/or state contracts. Automated Enforcement Automated enforcement is the use of cameras and radar technology to identify and cite vehicles for violating traffic laws, including speeding, running red lights, and bus and bicycle lane violations. Twenty-three states allow for red light cameras and 14 states allow for speed cameras, many of which grant communities the ability to optin. Over 400 U.S. communities use red light cameras and over 130 communities use cameras to enforce speed laws. In Maryland, a study showed that the proportion of drivers traveling more than 10 mph above the speed limit declined by about 70% for locations with warning signs and speed camera enforcement [Traffic Injury Prevention Journal]. Massachusetts General Law currently does not permit the use of automated enforcement. Instead a moving citation must be issued in hand to a motorist by an officer in person. Because many Massachusetts cities and towns are interested in the potential use of automated speed enforcement, legislation should be developed to give municipalities opt in authority to issue citations with the provision that such citations would not trigger points on insurance. 7

12 2018 SHSP Process and Partners The Success of the SHSP Despite recent successes, there is a need for a commitment to improve roadway safety in Massachusetts. Achieving the mission, vision, and goals of the 2018 SHSP will not be easy. Success of the SHSP depends on: Process a coordinated planning process that is data driven. Partners the various stakeholders and agencies associated with improving safety in Massachusetts. Product a compilation of 14 EAs, 61 strategies, and 283 actions providing the blueprint for improving transportation safety in the Commonwealth over the next five years. SHSP Update Process Massachusetts is committed to reducing the rate and frequency of fatalities and injuries along Massachusetts roadways. The SHSP is essential to this effort, as is the process and partners associated with its development and implementation over the next five years. Identify and engage safety stakeholders We engaged stakeholders from across Massachusetts. Participants from the 2013 SHSP update, along with new stakeholders identified by state safety leaders and others, participated in the process by offering their views and expert opinions on strategies and future action steps for the SHSP. Recruit stakeholders to participate in ELC and EA teams MassDOT Secretary Pollack invited leaders of stakeholder agencies to join the ELC, which was created with traffic safety leaders from a cross section of agencies to identify safety priorities in the State. The ELC s primary responsibility is to assist in overseeing the process, reviewing progress, and creating and implementing the 2018 SHSP. Each ELC agency/organization also identified staff to serve on EA teams. The EA team leaders acted as ambassadors that helped to identify EA team members and provide general direction. 8 Conduct stakeholder meetings The ELC met at the beginning of the SHSP update process and then later to review and approve the draft plan. Once developed, the EA teams met either as a group or with other EA teams to review data, develop strategies, and identify actions. There were more than 20 EA team meetings in the early part of 2018.

13 Complete evaluations of transportation safety, crash data, and EA strategies To ensure appropriate strategies were included in the SHSP, the ELC and EA teams reviewed the existing SHSP strategies, along with available literature on effective countermeasures. Lead agencies were identified for each strategy to ensure action steps were both identified and feasible. This lead agency buyin was also a crucial aspect of the plan s implementation approach. Implement the strategies and actions Implementation of the SHSP will require active participation by all stakeholders. The majority of implementation strategies will be multi-agency in nature, with complementary tasks and programs that were identified in each of the EAs. The EA teams will monitor the plan s implementation in order to track progress and measure efficacy. In addition, safety related data will be reviewed to help identify both progress and future needs. SHSP Leadership & Stakeholder Engagement The 2018 SHSP was led and directed by the ELC and included active participation within the EA teams by more than 250 stakeholders representing over 50 agency partners. The ELC was made up of representatives from the following agencies/organizations: Executive Office of Elder Affairs Executive Office of Health and Human Services Executive Office of Public Safety and Security - Highway Safety Division Federal Highway Administration (FHWA) Federal Motor Carrier Safety Administration (FMCSA) Massachusetts Association of Regional Planning Agencies Massachusetts Bay Transportation Authority (MBTA) Massachusetts Chiefs of Police Association Massachusetts Councils on Aging (MCOA) Massachusetts Department of Fire Services Massachusetts Department of Public Health (DPH) Massachusetts Department of Transportation (Highway, Planning, Registry of Motor Vehicles (RMV), Rail and Transit) Massachusetts Municipal Association Massachusetts State Police (MSP) National Highway Traffic Safety Administration In 2018, the SHSP update process began with a preliminary analysis of available fatal and serious injury crash data to identify trends and crash characteristics. Using the baseline data, the ELC, comprised of leadership from stakeholder agencies, reviewed current challenges and weighed potential opportunities and needs. The ELC analysis resulted in the creation of 14 EAs based on various transportation vulnerabilities that are representative of all roadway users, including pedestrians and bicyclists. 9
14 Emphasis Areas based upon average fatalities ( ) Defining the SHSP Emphasis Areas In response to the ELC analysis, 14 EAs were created for the 2018 SHSP. Narrowing in on these categories provided a foundation for targeting improvements and moving toward the longterm goals. However, to be successful, the approach must be coordinated and multidisciplinary. Lane Departure Crashes [198] For each EA team, a leader was identified to organize and coordinate activities. Impaired Driving [124] Occupant Protection [102] Speeding and Aggressive Driving [97] Intersection Crashes [96] Pedestrians [80] Older Drivers [74] Motorcycle Crashes [49] Younger Drivers [41] Large Truck-Involved Crashes [34] Driver Distraction [30] Bicyclists [10] Safety of Persons Working on Roadways [2] At-Grade Rail Crossings [1] The SHSP is a comprehensive effort across the transportation safety spectrum, including Federal, state, regional, local, nonprofit, and private sector stakeholders, and employs a datadriven, multidisciplinary approach to address the critical elements of safety engineering, education, enforcement, emergency response, legislation, and policy as well as data integration and quality. As a result, a multidisciplinary team of stakeholders was created for each of the 14 EAs, and a series of in-depth data analyses were completed. The EA teams met (from 1 to 4 times) to examine the issues, combine resources, document ongoing and future programming, and create a five-year action plan made up of strategies and actions with the goal of improving safety within their EA. Yet there is a notable overlap between the EAs. Consider as an example a scenario in which a younger driver that was speeding on a motorcycle departed the lane. Understanding the interconnected nature of crashes, the EA teams worked together to address the overlap of issues from one EA to the next. Collaboration is key to SHSP success, and the 2018 SHSP included active participation within the 14 EA teams by more than 250 stakeholders representing over 50 agency partners. Selected EAs in order of those with the highest annual fatality average to lowest. 10

15 The selected EAs are presented below in order of those with the highest five-year fatality average ( ) to the lowest. Emphasis Area Teams & Team Leaders Lane Departure Crashes Leader: Jim Danila, MassDOT - Highway Division Impaired Driving Leader: Colleen McGuire, Department of Public Health Occupant Protection Leader: Jeff Larason, Exec. Office of Public Safety and Security - Highway Safety Division Speeding and Aggressive Driving Leader: Sgt. Bill Robertson, Massachusetts State Police Intersection Crashes Leader: Jim Danila, MassDOT - Highway Division Pedestrians Leader: Jackie DeWolfe, MassDOT - Sustainable Mobility Older Drivers Leader: Michelle Ellicks, MassDOT - Registry of Motor Vehicles Motorcycle Crashes Leader: Gene Carabine, MassDOT - Registry of Motor Vehicles Younger Drivers Leader: Colleen McGuire, Department of Public Health Truck-Involved Crashes Leader: Lt. Thomas Fitzgerald, Massachusetts State Police - Commercial Vehicle Enforcement Section EA team leadership was critical for organizing their participants around common goals and priorities. Driver Distraction Leader: Sgt. Bill Robertson, Massachusetts State Police Bicyclists Leader: Jackie DeWolfe, MassDOT - Sustainable Mobility Safety of Persons Working on Roadways Leader: Ed Gincauskis, MassDOT - Highway Division At-Grade Rail Crossings Leader: Ron Nickle, Massachusetts Bay Transportation Authority 11
16 Agency Stakeholders Engaged Through the 2018 SHSP Update Process Federal Agencies Federal Highway Administration (FHWA) Federal Motor Carrier Safety Administration (FMCSA) National Highway Traffic Safety Administration (NHTSA) State Agencies Executive Office of Elder Affairs Executive Office of Health and Human Services (EOHHS) MassMobility Initiative Executive Office of Public Safety and Security - Highway Safety Division (EOPSS - HSD) Alcoholic Beverages Control Commission (MA ABCC) Massachusetts Bay Transportation Authority (MBTA) Councils on Aging (MCOA) Department of Public Health (DPH) Department of Transportation Registry of Motor Vehicles (MassDOT RMV) Department of Transportation (MassDOT) District Offices Department of Transportation (MassDOT) Highway Department of Transportation (MassDOT) Planning Department of Transportation (MassDOT) Rail Department of Transportation (MassDOT) Sustainable Mobility State Police (MSP) Health & Research Agencies Baystate Health Beth Israel Deaconess Medical Center Boston Children s Hospital Brain Injury Association of Massachusetts (BIAMA) Massachusetts General Hospital Division of Trauma Massachusetts Healthy Aging Collaborative Massachusetts Medical Society (MMS) UMass Boston Gerontology Local Government Agencies Boston Emergency Medical Services (EMS) Boston Public Health Commission (BPHC) Boston Transportation Department Greater Lynn Senior Services Nantucket Government Northbridge Department of Public Works Tewksbury Department of Public Works 12 Regional Planning & Transit Organizations Boston Region Metropolitan Planning Organization/ Central Transportation Planning Staff (CTPS) Cape Cod Commission (CCC) Central Massachusetts Regional Planning Commission (CMRPC) Franklin Regional Council of Governments (FRCOG) Merrimack Valley Planning Commission (MVPC) Metropolitan Area Planning Council (MAPC) MetroWest Regional Transit Authority Montachusett Regional Planning Commission (MRPC) Northern Middlesex Council of Governments (NMCOG) Old Colony Planning Council (OCPC) Pioneer Valley Planning Commission (PVPC) Southeastern Regional Planning and Economic Development District (SRPEDD) Law Enforcement Agencies Boston Police Department (BPD) Burlington Police Department Cambridge Police Department Massachusetts State Police Additional Stakeholders AAA Northeast AECOM American Traffic Safety Services Association New England Ashland Bike Club Charles River Wheelers Harris Miller Miller & Hanson (HMMH) Hopkinton Upper Charles Trail In Control Family Foundation Lynch Associates Mass Motor Truck Association Massachusetts Motorcycle Association Massachusetts Motorcyclists Survivors Fund McFarland and Johnson Consulting National Safety Council Pare Corporation Safe Roads Alliance Southeastern Massachusetts Motorcyclists Survivor s Fund Students Against Destructive Decisions (SADD) Toole Design Group (TDG) Transportation Resources, Information, Planning & Partnership for Seniors (TRIPPS) Tufts Health Plan Foundation WalkBike Worcester WalkBoston VHB


17 SHSP Implementation & Evaluation Each action listed in the SHSP includes the agencies that will implement or guide the implementation of that action. Annually, starting in 2019, the ELC will meet to provide leadership and oversight for the SHSP implementation process. EA teams will meet more frequently than the ELC to review progress in their specific areas. As additional data becomes available, fatality and injury performance measures will be updated. As a living document, the SHSP will be updated as needed and reviewed in conjunction with updates to Massachusetts State Transportation Improvement Program (STIP). SHSP by the Numbers 14 multidisciplinary EA teams 250 engaged stakeholders from more than 50 agency partners 61 specific strategies and 283 direct actions 1 primary goal to eliminate roadway fatalities and serious injuries in Massachusetts Highlights of the 2018 SHSP include a process for both implementing and evaluating SHSP strategies and actions, and the alignment of performance targets with Federal guidelines. 13


18 From Problem Identification To Action Plans To develop a strategic, data-driven safety plan for the Commonwealth, a wide range of statewide data sources must be used to identify existing problems and quantify their impact on the Commonwealth. Data is sourced from both relatively static inventories of roadways and drivers, and dynamic event repositories comprised of citations, crashes, and medical records. These rich data sources can be used in small and large-scale analyses to direct the effective use of funding for programming initiatives. More specifically, crash analysis allows for quantification of specific roadway attributes, person involvement, and potential causation, which in turn assists with the creation of targeted goals to address safety needs within each EA. Intersecting Efforts Although crash data analysis is conducted for each EA individually, there is often overlap. For example, many lane departure crashes are also speeding-related, and are therefore included as part of the problem quantification in both areas. In addition, although pedestrians and bicyclists have dedicated EAs, it is important to acknowledge the impact of every strategy on all road users (including users of alternative modes) within each EA. EA teams met to review all available data and to develop a five-year action plan made up of individual strategies and specific actions. For each action listed in the plan, the agencies that will implement or guide the implementation of that action are included. The SHSP Action Plan is presented in Appendix A and has also been published as a standalone document. Throughout the five-year implementation process, the SHSP 14 All injury-based goals are based upon injuries reported in crashes rather than after hospitalizations as was the case in previous versions of the SHSP. Some data, particularly serious injuries from some EAs, can not be quantified accurately due to limitations of the current crash form. Therefore, we must work to improve data quality. Action Plan will act as a collection of dynamic documents that stakeholders will update, review, and reference. The ELC will meet annually to provide leadership and oversight, and the EA teams will meet more frequently to assess needs and review progress. As a living document, the SHSP will be updated as needed. The SHSP Action Plans are intended to be living documents that will be updated, reviewed, and referenced on an ongoing basis over the five-year SHSP time frame. 14


19 Problem Identification: Data Highlights An essential first step of the SHSP update was to analyze the number of roadway fatalities over time and examine the various causes. To make decisions about programming, the EA teams looked at the trends, successes, and challenges of previous initiatives. Statewide, data serves as a rich resource for identification and justification of focus areas in roadway safety. Some notable EA-related findings are presented below. However, it is worth noting that the crash characteristics for many EAs are interrelated. Lane Departure Crashes In 2016, fatalities from lane departure crashes accounted for 50% of all motor vehicle fatalities in Massachusetts. The most frequent contributing code in fatal crashes for lane departures was exceeding the authorized speed limit. Impaired Driving In Massachusetts, almost one-third of all fatalities from motor vehicle crashes involved an alcoholimpaired driver. Although not indicative of the level of impairment, nearly 25% of deceased drivers who were given a blood test had Delta 9 THC in their system. Delta 9 THC is the psychoactive component of marijuana and only remains in the blood stream for a few hours. This percentage has increased by 15 points in the last 10 years. Occupant Protection In 2018, the Massachusetts safety belt usage rate was 81.6% one of the lowest in the nation. Men were less likely to wear safety belts than women (78% vs. 87%, respectively), and occupants of pickup trucks were also less likely to wear their safety belts, as compared to passenger cars (68% vs. 84%, respectively). Speeding & Aggressive Driving In 2016, speeding-related crashes accounted for approximately 27% of all fatal injuries in Massachusetts. Vehicle occupants in the year old age group accounted for the most fatalities (24%) in speeding-related crashes, followed by year old occupants (21%). Intersection Crashes In 2016, fatalities at intersections made up 22% of all motor vehicle fatalities in Massachusetts. The most common collision type at intersections was angle, followed by rear-end. The most severe collision types were single vehicle (which may include pedestrian crashes) and angle crashes. Pedestrians In 2016, pedestrian fatalities comprised 21% of all crash fatalities in Massachusetts, which was significantly higher than the national average of 16%. Among pedestrian crashes, 48% of crashes resulting in incapacitating or fatal pedestrian injuries occurred during darkness. Older Drivers In 2016, fatalities from crashes involving older drivers (aged 65+) made up 20.8% of all motor vehicle fatalities in Massachusetts, which was slightly higher than the national proportion of fatalities involving older drivers (19.4%). Crashes at intersections (specifically four-way and T-intersections) were more common for drivers 65 and older. 15


20 Motorcycle Crashes In 2016, motorcyclist fatalities constituted 10.8% of all motor vehicle fatalities in Massachusetts. 27% of operators in fatal motorcycle crashes had owned their motorcycle for less than one year. Younger Drivers In 2016, crash fatalities involving younger drivers between the ages of 15 and 20 made up 13% of all motor vehicle fatalities in Massachusetts, equal to the national percentage. Younger drivers between the ages of 15 and 24 had a higher proportion of crashes between 7:00 p.m. and 11:00 p.m., accounting for 15% of their crashes as compared to 12% for adults. Large Truck-Involved Crashes In 2016, fatalities resulting from crashes with large trucks made up 8.5% of all motor vehicle fatalities in Massachusetts. Crashes involving large trucks were much more severe than passenger vehicle crashes, as 7% of crashes involving a large truck or bus resulted in an incapacitating or fatal injury, as compared to only 1.8% for passenger vehicles. Driver Distraction In 2016, fatalities from crashes involving distraction comprised 8.1% of all motor vehicle fatalities in Massachusetts. Distraction-affected crashes were significantly underreported due to self-reporting of drivers and limitations on how law enforcement can investigate the cause of a crash. Cell phone-specific reported distractions made up only 9% of all reported distracted driving-related fatal crashes in Massachusetts. The majority were recorded as inattention or carelessness. Boston and Worcester accounted for 21% of fatalities due to crashes involving distracted drivers. Bicyclists In 2016, bicycle fatalities made up 2.6% of all motor vehicle fatalities in Massachusetts. Safety of Persons Working on Roadways Between 2012 and 2016, there was an average of 1.8 worker deaths per year the highest of any 5-year increment in the last 10 years. 21% of fatal and incapacitating bicyclist injuries occurred from crossing an intersection or street. At-Grade Rail Crossings As of 2016, there are 1,431 at-grade rail-crossings in Massachusetts, with 832 active at-grade rail-crossings on public roads. Between 2012 and 2016, there were two fatalities and 15 non-fatal injuries due to at-grade rail crossing crashes in Massachusetts. 16

21 Lane Departure Crashes In 2016, fatalities from lane departure crashes accounted for 50% of all motor vehicle fatalities in Massachusetts. Although lane departure crashes comprise a large percentage of Massachusetts fatalities and incapacitating injuries, annual five-year average fatalities and injuries have been declining, as shown in the figures below. When examining the driver contributing code (the responding officer s decision regarding crash causation) for all Massachusetts lane departure crashes, the codes used most frequently were driving too fast for conditions, operating vehicle recklessly, failure to keep in proper lane or running off road, and inattention. Historically, roadways with curves and high speed limits, such as those within many rural areas of Massachusetts, have been prone to lane departure crashes. State participation in existing FHWA-aligned programs is warranted in order to address the risks to safety on these rural roads. High Risk Rural Roads are defined in 23 USC 148(a)(1) as any roadway functionally classified as a rural major or minor collector or a rural local road with significant safety risks, as defined by a State in accordance with an updated State strategic highway safety plan. The most frequent contributing code in fatal crashes was exceeding the authorized speed limit, which illustrates the effect of vehicle speed on the severity of lane departure crashes. The most frequent contributing code in fatal crashes for lane departures was exceeding the authorized speed limit. Overview of Strategies Identify lane departure crashes and causes Educate safety practitioners on best practices for roadway design Incorporate safety elements into roadway design and maintenance For a complete list of the 29 actions associated with the above strategies, please refer to the Lane Departure Action Plan within the SHSP Action Plan in Appendix A. 17
22 Impaired Driving Impaired driving due to alcohol or drug use has consistently been one of the greatest threats to traffic safety in the United States. In Massachusetts, almost one-third of all fatalities from motor vehicle crashes involve an alcohol-impaired driver. In 2016, fatalities resulting from crashes involving an alcohol-impaired driver (BAC [Blood Alcohol Content] equal to or greater than 0.08) comprised 31% of all motor vehicle fatalities in Massachusetts 3% higher than the national rate of 28%. As shown in the figure below, the annual five-year average for fatalities involving an alcohol-impaired driver has remained relatively flat. The figure below illustrates the proportion of motor vehicle fatalities involving alcohol-impaired drivers compared to the national rate. It is worth noting a potential data quality issue with the above information given that current crash form precludes reporting of serious injuries from impaired driving. As a result, the data presented may be an underreporting of the actual issue. the Fatal alcohol-impaired crashes occurred most often between midnight and 3:00 a.m., with an overall higher occurrence on weekends. Male drivers were responsible for over 80% of fatal crashes involving alcohol-impairment. The young adult age group of 21 to 34 accounted for 45% of drivers in alcohol-impairment related fatal crashes. Drug-impaired driving has become a topic of increasing concern across the nation, particularly in states that have legalized medical and/or recreational-use marijuana possession, including Massachusetts. While recreational marijuana possession was legalized in Massachusetts in 2016, retail sales have not yet commenced (as of November 2018), but users can grow products for their own use and give it to others, with limitations. With this in mind, current and future trends regarding marijuana s impact on crashes need to be studied. The number of deceased drivers testing positive for cannabinoids is increasing, as is the combined presence of cannabinoids and alcohol. In Massachusetts, over 25% of deceased drivers who were given a blood test had cannabinoids in their system, while the next most frequent drugs present were narcotics and stimulants at 13% each. Although drug test results are essential for research, it is important to note that each drug type has varying time-lines of effect duration and length of time in the system, relative to when it was used. Cannabis was the drug type found most often, followed by opioids. However, cannabis can last up to 30 days in the system, while opioids only last for several days. 18 Over 25% of deceased drivers who were given a blood test had cannabinoids in their system. The next most frequent drugs present were narcotics and stimulants at 13% each.

23 Broadly, there is a need for improved roadside testing for marijuana impairment. Additionally, further studies are warranted to assess crash causations due to marijuana and other impairing substances. The percentage of motor vehicle drivers hospitalized for non-fatal crash injuries related to alcohol and/or drug intoxication is also increasing. As shown in the figure above, most recently in 2015, 21.5% of hospitalized motor vehicle drivers were alcohol or drug intoxicated (15.4% and 9.8%, respectively). For motorcyclist, 15.1% were alcohol or drug intoxicated, while 17.2% of pedestrians suffering injuries were similarly intoxicated. The percentage of adults ages 18 and over who self-reported that they had driven after excessive drinking in the past month (relative to when the survey was taken) was higher in Massachusetts (2.8%) than the rest of the U.S. (2.1%). Furthermore, the percentage of Massachusetts high school students who self-reported driving after consuming alcohol in the past month (relative to when the survey was taken) was 9.4%. Overview of Strategies Develop processes for collecting and analyzing data and research on impaired driving Enhance collaborative enforcement efforts to reduce alcohol and drug-related motor vehicle fatalities and injuries Prevent alcohol service to underage youth and intoxicated persons by enforcing alcohol beverage control laws Provide targeted information and education programs to prevent alcohol-related motor vehicle fatalities and injuries Continue the process of educating the public on the dangers and consequences of impaired driving (alcohol, other drugs, drowsy driving) For a complete list of the 25 actions associated with the above strategies, please refer to the Impaired Driving Action Plan within the SHSP Action Plan in Appendix A. 19
24 Occupant Protection Wearing a seat belt is the single most effective strategy a person can implement to reduce their chances of a fatal or serious injury in a motor vehicle crash. Nationwide, approximately 90% of front-seat occupants were observed wearing a seat belt in In 2018, in Massachusetts, the seat belt usage rate was 81.6% one of the lowest in the nation. In 2016, 44% of motor vehicle occupant fatalities were unrestrained, which was equal to the national rate and resulted in 106 lives lost. This represents 27% of all fatalities that resulted from Massachusetts crashes (including pedestrians & bicyclists) in The figure below illustrates the annual five-year averages for unrestrained occupant fatalities. Unrestrained refers to motor vehicle occupants not wearing a seat belt, children that are not in age-appropriate car seats, and motorcyclists without a helmet. Over the past 13 years, Massachusetts has seen a consistent decrease in these fatalities. Although Massachusetts has had a lower observed seat belt usage rate than the country as a whole, there has been an increase from 63% in 2004 to 82% in 2018, as shown above. As shown in the figures below, men were less likely to wear safety belts than women (78% vs. 87%, respectively), and occupants of pickup trucks were also less likely to wear their safety belts, as compared to passenger cars (68% vs. 84%, respectively). Overview of Strategies Enhance safety belt use enforcement in Massachusetts Educate the public on use of safety belts and passenger restraints For a complete list of the 21 actions associated with the above strategies, please refer to the Occupant Protection Action Plan within the SHSP Action Plan in Appendix A. 20

25 Speeding and Aggressive Driving NHTSA considers a crash to be speeding-related if any driver in the crash was charged with a speeding-related offense, or if a police officer indicated that racing, driving too fast for conditions, or exceeding the posted speed limit contributed to the crash. Aggressive driving is defined as the operation of a motor vehicle in a manner that endangers or is likely to endanger persons or property. Aggressive driving is exhibited in many different forms, including speeding excessively, changing lanes frequently without signaling, following too closely, flashing lights, driving on shoulders to pass, driving across marked barriers, shouting or gesturing at other drivers, uncontrolled anger, and stress created by traffic congestion. It is worth mentioning this may be underreported on the crash forms so the injuries presented above may be lower than the actual number. In 2016, speeding crashes accounted for approximately 27% of all fatal injuries in Massachusetts, which mirrored the national percentage. These crashes also accounted for 3% of incapacitating injuries. While the number of fatal injuries has remained relatively consistent since 2013, they increased from 92 in the year 2015 to 105 in Examining annual five-year averages for fatalities from crashes involving speeding, the figure above illustrates that while there was a decline between the average and the average, the averages have remained relatively consistent ever since. Speeding-related incapacitating injuries, as illustrated above, have remained relatively consistent from the average until now. Much like impaired driving, speeding-related crashes were more common at night and on weekends. On police-completed crash report forms, speeding or driving too fast for conditions was indicated as a contributing code for 2.5% of drivers involved in crashes. When examining these drivers by age, the 15 to 24 year old age group was significantly overrepresented (5.5%), with the proportion of speeding as a factor steadily dropping as drivers age. Overview of Strategies Enhance enforcement efforts to curb speeding and aggressive driving Improve the process of setting roadway speed limits by including travel speeds and roadway context Continue the process of educating the public on the risks associated with speeding and aggressive driving behavior For a complete list of the 22 actions associated with the above strategies, please refer to the Speeding and Aggressive Driving Action Plan within the SHSP Action Plan in Appendix A. Vehicle occupants in the 25 to 34 year old age group accounted for the most fatalities in speeding-related crashes. 21


26 Intersection Crashes In 2016, fatalities at intersections constituted 22% of all motor vehicle fatalities in Massachusetts. As shown in the figures below, the annual average for fatalities at intersections increased from to , but has since declined. The annual average for incapacitating injuries in crashes at intersections has been in steady decline since The most common collision type at intersections was angle, followed by rear-end. The most severe collision types were single vehicle and angle. Interestingly, single vehicle crashes may indicate pedestrian or bicycle involvement, as many non-motorist crashes occur at intersections. Despite their frequency, rear-end crashes accounted for few fatal intersection crashes since they are generally not as severe. Overview of Strategies Identify intersection crash locations and causes Educate safety practitioners on best practices for design Incorporate safety elements into intersection design and maintenance Educate new drivers and general population on intersection safety Enhance enforcement at intersections For a complete list of the 20 actions associated with the above strategies, please refer to the Intersections Action Plan within the SHSP Action Plan in Appendix A. 22

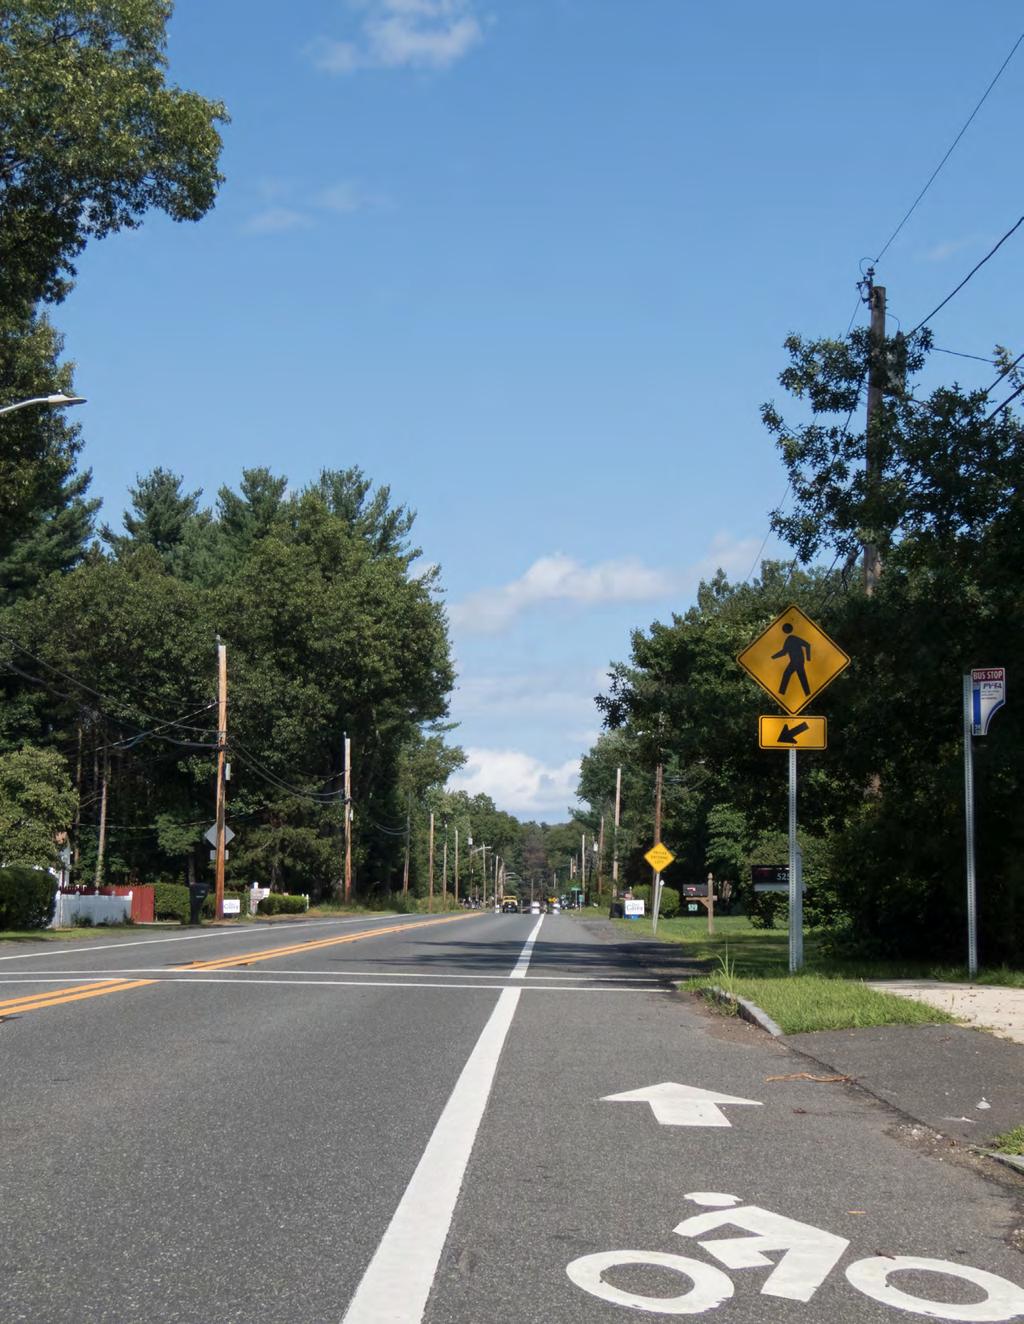
27 Pedestrians The number of pedestrians killed due to motor vehicle crashes is on the rise nationally and in Massachusetts. Nationally, the number of pedestrian fatalities increased by 22% from , with Massachusetts experiencing an increase of 7% during that time period. In 2016, pedestrian fatalities comprised 21% of all crash fatalities in Massachusetts, which was significantly higher than the national average of 16%. However, when examining the annual five-year average, the number of pedestrian deaths has remained fairly consistent between 2014 and 2016, as shown in the figure below. Annually, there has been an average of 80 pedestrian fatalities since Pedestrian incapacitating injuries in the state have also increased in recent years, mirroring national trends. A large proportion of fatal crashes involving pedestrians (21.1% for ) occurred in the urban areas of Springfield, Boston, and Worcester. Pedestrians over 55 years old were also overrepresented in these crashes, accounting for over 50% of pedestrian fatalities. Pedestrian crashes were more likely to occur in the winter months, possibly due to fewer daylight hours and poor sidewalk and roadway conditions. Males were also overrepresented, encompassing 65% of the fatalities. From , pedestrian fatalities occurred most often between 6:00 p.m. and 8:59 p.m. In total, between 2014 and 2016, over 48% of fatal and incapacitating pedestrian injuries occurred in dark lighting conditions. The most locations of these serious and fatal crashes occurred in the roadway (44%) and at a marked crosswalk (27%). Intersections without marked crosswalks and mid-block crosswalks were the third and fourth most common location of pedestrian crashes, accounting for 4.1 and 2.7 percent of all fatal and serious pedestrian crashes, respectively. There is also an established relationship between pedestrian fatalities and driver distraction. NHTSA reports that pedestrians comprised 13% of all fatalities resulting from distracted driving. The Massachusetts Safe Driving Law was enacted in 2010, prohibiting all drivers from reading, typing, or sending text messages using a hand-held electronic device capable of accessing the internet while operating a motor vehicle. Similarly, the law prohibits drivers younger than 18 from using any mobile electronic device while operating a motor vehicle. Although this is a step in the right direction, some of the challenges law enforcement encounter when trying to enforce these laws (as noted in the Distraction EA), leave pedestrians, as well as all road users, vulnerable. Overview of Strategies Incorporate pedestrian safety elements into infrastructure design and engineering Enhance pedestrian safety expertise Support municipalities in their efforts to promote pedestrian safety Increase public awareness about pedestrian safety Continue to examine and improve processes for collecting pedestrian crash data to measure and quantify fatalities and injuries In 2016, 338 pedestrians were seriously injured and 80 were killed. For a complete list of the 23 actions associated with the above strategies, please refer to the Pedestrian Action Plan within the SHSP Action Plan in Appendix A. 23


28 Older Drivers Crashes involving older drivers (ages 65 years or older) were examined using both crash report injury data and hospitalizations due to the greater risk of injury. The rates described below comprise fatalities and injuries in collisions wherein one or more motorist was an older driver. In 2016, fatalities from crashes involving older drivers constituted 20.8% of all motor vehicle fatalities in Massachusetts, which was slightly higher than the national percentage of This statistic is unable to be accurately normalized based on the high number of older people who keep their license even after they stop driving. As shown in the figures below, when examining annual five-year averages, the number of fatalities involving older drivers has been increasing, with incapacitating injuries remaining stable. In 2015, there were 494 hospitalizations and 3,267 emergency department visits resulting from drivers ages 65 and older in Massachusetts. Of the 494 hospitalizations of older drivers, 204 involved drivers between the ages of 65 and 74, and 290 involved drivers ages 75 and older. Of the 3,267 emergency department visits, 2,065 involved drivers ages 65 to 74 and 1,202 involved drivers ages 75 and older. This data shows that hospitalizations for motor vehicle crash injuries more frequently involved drivers ages 75 and older, whereas emergency department visits more frequently involved drivers between the ages of 65 and

29 Crashes at intersections were more common for older drivers (65+), specifically four-way and T intersections. Additionally, a larger proportion of older driver crashes occurred at driveways. Statewide, 17% of fatal crashes involving older drivers occurred in Worcester County, followed by Bristol and Middlesex Counties, each accounting for 13%. By day of week, older drivers were most often in fatal crashes on Fridays, while weekends had the fewest occurrences. Of the older drivers involved in fatal crashes, males were a significant majority at 65%, but this may represent the effect of self-regulation in the aging population. Importantly, 41% of all older driver fatalities were unrestrained, as compared to Massachusetts as a whole, at 43%. A larger percentage of crashes involving older drivers occurred at intersections, as compared to other adult drivers. Specifically, older drivers were overrepresented in crashes at four-way intersections (21% of crashes involving older drivers, 18% for other adults) and T intersections (19% of crashes involving older drivers, 17% for other adults). Additionally, a larger proportion of older driver crashes occurred at driveways (3.9% of all crashes) as compared to adults (2.6% of all crashes). These finding may indicate that drivers have a more difficult time with turning maneuvers as they age. Interestingly, older drivers were underrepresented at on/off ramps, which may be attributed to self-imposed limitations on highway travel. Overview of Strategies Collect and update data to improve problem identification and research to improve older driver safety programming Develop infrastructure improvements that accommodate the needs of older road users Continue updating licensing processes and procedures to address safety concerns regarding older drivers Provide education and technical assistance to the medical and legal communities on older road user impairment For a complete list of the 16 actions associated with the above strategies, please refer to the Older Driver Action Plan within the SHSP Action Plan in Appendix A. 25


30 Motorcycle Crashes Given the intrinsic danger associated with operating motor vehicles that lack a safety cage, motorcyclists comprise a particularly high-risk group. In 2016, motorcycle fatalities constituted 10.8% of all motor vehicle fatalities in Massachusetts, which was 3.3% lower than the national percentage of 14.1%. As shown in the figures below, motorcyclist fatalities and incapacitating injuries from motor vehicle crashes have remained consistent. Eighty-eight percent of operators involved in fatal motorcycle crashes were wearing a helmet, as compared to 53% nationwide. This high rate of helmet use can be attributed to Massachusetts mandatory helmet law. Males accounted for 93% of all motorcyclist fatalities. Speeding was involved in 38% of motorcyclist fatalities. Examining motorcycle crashes by age can be misleading, as there is no clear way to know how many motorcycle licenses are actually in current use. Motorcyclists in the 21 to 24 year old age group constituted 18% of fatalities. Motorcyclist fatalities most commonly occurred on weekends and in the late afternoon and early evening. Twenty-seven percent of operators in fatal motorcycle crashes owned their motorcycle for less than one year. Furthermore, 25% did not own the motorcycle they were killed on. Only 58% had a motorcycle license, 19% only had a permit, and 17% had no permit or license. Overview of Strategies Improve analysis of motorcycle crashes Increase motorcycle safety awareness Improve and enhance motorcycle safety training and communications opportunities Enhance motorcycle enforcement For a complete list of the 21 actions associated with the above strategies, please refer to the Motorcyclists Action Plan within the SHSP Action Plan in Appendix A. 27% percent of operators in fatal motorcycle crashes owned their motorcycle for less than one year. 26

31 Younger Drivers Fatalities and incapacitating injuries from crashes involving younger drivers in Massachusetts have been steadily declining. In 2016, crash fatalities involving younger drivers between the ages of 15 and 20 comprised 13% of all statewide motor vehicle fatalities. From 2011to 2016, fatalities in which a younger driver was involved declined by 3.9%. Whereas, the number of younger drivers who died in motor vehicle crashes declined by 33% in the same time-frame. State experts on the SHSP Younger Driver EA Team have expanded the definition of younger drivers through the age of 24 based on supporting evidence and current state initiatives. According to data from the Registry of Vital Records and Statistics at the Massachusetts Department of Public Health (DPH), there were 65 crash fatalities among Massachusetts residents ages 15 to 24 in 2014 (the most recent year available). Of those fatalities, 66% were motor vehicle occupants, 12% were pedestrians, and 12% were motorcyclists. There were also 16,981 injuries within this age group. Of those injuries, 88% were motor vehicle occupants, 5% were pedestrians, 4% were motorcyclists, and 2% were cyclists. Young adult occupants between the ages of 18 and 24 were nearly twice as likely as teenagers between the ages of 15 and 17 to be injured in a motor vehicle crash. Examining crashes involving younger drivers between the ages of 15 and 24 by the time of day, 15% occurred between 7:00 p.m. and 11:00 p.m., as compared to only 12% of adults during that time period. Conversely, younger drivers had a smaller percentage of crashes occurring in the morning commute hours between 7:00 a.m. and 11:00 a.m. (18%), as compared to 22% of adult driver crashes occurring during this time period. While the rate of both emergency department visits and hospital stays among younger drivers between the ages of 16 and 20 in Massachusetts has decreased over time, there has been a less significant decline among those 18 and over. Young people identified as Black or Hispanic were more likely to be injured in motor vehicle crashes than others. Furthermore, 50% of non-fatal motor vehicle crash injuries among young residents of urban areas involved Black or Hispanic young people, compared to one-third for Massachusetts as a whole. As shown in the figures below, the number of deaths and incapacitating injuries which resulted from crashes involving younger drivers between the ages of 15 and 20 has steadily declined in the past 13 years. This reflects state initiatives surrounding the Junior Operator Licensing laws and various outreach efforts. Fatalities involving unrestrained younger drivers have decreased as well, with a 38% reduction from

32 Overview of Strategies Conduct research to more effectively reduce the frequency and severity of crashes involving younger drivers Enhance enforcement efforts to reduce the frequency and severity of traffic violations by younger drivers Improve education of younger drivers, parents, and the general public For a complete list of the 15 actions associated with the above strategies, please refer to the Younger Driver Action Plan within the SHSP Action Plan in Appendix A. Younger drivers between the ages of 15 and 24 had a higher proportion of crashes between 7:00 p.m. and 11:00 p.m., accounting for 15% of crashes, as compared to 12% for adults. 28


33 Large Truck-Involved Crashes In 2016, fatalities from crashes with large trucks comprised 8.5% of all motor vehicle fatalities in Massachusetts, which is lower than the national percentage of 12.2%. A truck-involved crash is defined as a crash on a public roadway involving a heavy truck with a gross vehicle weight rating or gross combination weight rating of more than 10,000 pounds, wherein any person in the crash was injured or died or any of the motor vehicles involved were towed from the crash scene. The figure below illustrates the annual five-year average of fatalities for crashes involving large trucks, which has declined from 37.2 for the 2014 period, to 33.8 for the 2016 period. Incapacitating injuries from crashes involving large trucks have remained relatively consistent since 2012, at approximately 200 per year. The Massachusetts State Police Commercial Vehicle Enforcement Section (MSP CVES), tasked with reducing crashes involving large trucks and implementing education and enforcement initiatives, examined crash corridors for an equivalent property damage only (EPDO) crash analysis to target resources to problem areas. The map below depicts the Massachusetts commercial motor vehicle (CMVs/large trucks and buses) crash corridors by EPDO for 2014 through Massachusetts Commercial Motor Vehicle Crash Corridors by Equivalent Property Damage Only,

34 Large truck-involved crashes, while infrequent, are often more severe than passenger vehicle crashes. In 2017, 7.2% of crashes involving a large truck or bus resulted in an incapacitating or fatal injury, as compared to only 1.8% for passenger vehicles. While nearly all collision types resulted in more severe injuries when a large truck was involved, the biggest differences were noticed in fatal/ incapacitating injury rates of Head-on (22% for truck vs. 7.1% for non-truck), Angle (9.5% vs. 1.5%) and Rear-End (6.8% vs. 1%). Crashes involving large trucks were more frequent on two-way, non-divided highways on the weekdays, between the daylight hours of 7:00 a.m. and 10:59 a.m., and 11:00 a.m. and 2:59 p.m. In addition, large truck drivers between the ages of 40 and 51 were more likely to be involved in these crashes. Furthermore, the large-scale effects of a truck crash greatly impair roadway network performance. In 2016, associated costs due to delay time were in excess of $22M, in addition to the emissions and excess fuel burn cost of $1.7M. Truck-involved crashes, while infrequent, are much more severe than passenger vehicle crashes. Slightly more than 7% of crashes involving a large truck or bus resulted in an incapacitating or fatal injury, as compared to only 1.8% for passenger vehicles. Overview of Strategies Enhance motor carrier safety enforcement Improve data quality and collection Provide engineering roadway improvements Collaborate with the trucking and bus industry on programs and initiatives to improve safety and reduce crashes specific to impaired/drugged driving and possession Improve Massachusetts motor carrier systems in order to assist the MSP and RMV with enforcement and licensing issues For a complete list of the 23 actions associated with the above strategies, please refer to the Large-Truck Involved Action Plan within the SHSP Action Plan in Appendix A. 30

35 Driver Distraction According to various studies, glancing away from the roadway for longer than two seconds increases the risk of crashing by over 70%. In 2016, fatalities from crashes involving distraction comprised 8.1% of all motor vehicle fatalities in Massachusetts, which is lower than the national rate of 10%. There are, however, inherent limitations to the identification of distraction-affected crashes and their resulting injuries and fatalities. It is likely that distraction-affected crashes are significantly underreported due to the reliance on drivers self-reported prior actions, as well as law enforcement investigative limitations. The results below may not fully capture crash trends. Nationally, in 2015, there were 3,477 reported distraction-affected fatalities (10% of overall fatalities), of those 476 fatalities that involved a hand-held cell-phone (14% of all distraction-affected fatalities). In Massachusetts, from 2010 (when the data was first recorded) to 2016, there were 221 fatalities caused by motor vehicle crashes with a recorded distracted driver (8.7% of overall fatalities), with 24 of those specifically indicating driver hand-held cell phone use (10.9% of all distraction-affected fatalities) as shown in the figures below. Though media attention has focused on cell phone use in particular, a large portion of distracted driving fatalities are recorded as driver inattention or carelessness. Distraction was first captured in Fatality Analysis Reporting System (FARS) starting in 2010; therefore, the data below is limited to individual years rather than five-year averages. 31
36 According to FARS, 65% of drivers involved in distraction-affected fatal crashes were male and 35% were female. This finding is counter-intuitive to the data collected in the statewide observation survey, as shown in the figure below. The observational survey found that women were more likely than men to be talking on or manipulating (i.e. texting) their hand-held cell phone while driving. This conundrum can be accepted knowing that, statistically, males are still riskier drivers and are represented in more crashes as a whole. When examining age demographics, drivers between the ages of 21 and 29 had the most frequent involvement in distraction-affected fatal crashes, followed by the 20 years and younger age group. Overview of Strategies Educate the public on the risks associated with driver distraction Develop and deliver targeted training and education on the dangers of inattentive driving Enhance enforcement programs to reduce inattentive driving Develop processes to collect data to measure/quantify fatalities and injuries to better understand driver inattention Incorporate design elements into roadway engineering to combat inattentive and drowsy driving For a complete list of the 20 actions associated with the above strategies, please refer to the Driver Distraction Action Plan within the SHSP Action Plan in Appendix A. It is likely that distraction-affected crashes are significantly underreported due to the reliance on drivers self-reported prior actions. 32

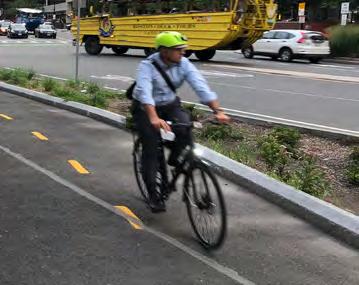
37 Bicyclists Bicycling as a means of transportation is gaining popularity in Massachusetts. The addition of bike lanes and paths to extend travel networks, as well as bike share programs, has increased the number of people using this mode of transportation. In 2016, bicycle fatalities comprised 2.6% of all motor vehicle fatalities in Massachusetts, which is slightly higher than the national percentage of 2.2. With commuter and multi-mode bicycle usage rapidly increasing, safety and planning enhancements are central to improving roadway culture and supporting bicycling for everyday trips. While bicyclist fatalities and incapacitating injuries from motor vehicle crashes constitute only a small portion of overall statewide crashes, the physical vulnerability of bicyclists on roadways reinforces this area as a principal priority. Therefore, ensuring the safety of bicyclists is imperative not only for the mitigation of bicycle-automobile conflicts, but also to encourage bicycling for transport and recreation. Massachusetts has already made significant progress toward these goals, as shown in the prioritization of Complete Streets, as well as further efforts to provide safer accommodations for bicyclists and all other roadway users. The majority of fatal and incapacitating bicyclist injuries occurred on the roadway (49%), and more occurred at intersections without a crosswalk (19%) than with a crosswalk (13%), highlighting the importance of intersection design inclusive of all roadway users. 21% of fatal and serious cyclist injuries occurred while crossing an intersection or street. Serious cyclist crashes occurred primarily during daylight hours (79%). Of the 58 serious cyclist crashes occurring in darkness, the vast majority (49/58) occurred on lighted roadways. When examining annual five-year averages, bicyclist fatalities increased with each increment since 2013, including the most recent in 2016, as shown above. The annual five-year average of cyclist incapacitating injuries due to motor vehicle crashes has also increased every year since This trend is shown in the figure above. Overview of Strategies Improve design and engineering of bicycle facilities on and off roadways Enhance bicycle safety expertise Support municipalities in their efforts to promote bicycle safety Increase public awareness about bicycle safety Integrate bicycle safety activities with other plans Incorporate changes precipitated by new directives related to healthy transportation Develop processes for collecting data to measure and quantify fatalities and injuries to better understand crashes involving bicyclists and regular crash data analysis For a complete list of the 21 actions associated with the above strategies, please refer to the Bicyclists Action Plan within the SHSP Action Plan in Appendix A. 33

38 Safety of Persons Working on Roadways Worker safety is of great concern due to the common occurrence of work-zones in high-speed traffic areas. According to the National Work Zone Safety Information Clearinghouse, there were nine worker fatalities on Massachusetts roadways between 2012 and When examining individual years, worker fatalities have fluctuated between zero and three worker deaths per year, as shown in the figure below. The 2012 to 2016 average of 1.8 worker deaths per year is the highest of any five-year increment in the past 10 years. However, due to small overall numbers, these data can be easily skewed by one or two crashes, and there is a greater risk of underreporting. Furthermore, data on workers injured as a result of a work zone crash is not sufficiently collected. The safety of workers and the traveling public is a significant priority when executing construction and related activities on roadways. The Massachusetts Traffic Incident Management (TIM) Task Force, comprised of representatives of numerous state and private agencies, has implemented many countermeasures and trainings to promote worker safety on roadways while improving methods for identifying and quantifying the problem. Overview of Strategies Continue developing and implementing practices, policies, and procedures to improve work zone and traffic incident set-ups to maximize safety Educate drivers on work zone safety issues, using unified themes across multiple agencies, in order to improve compliance with work-zone traffic controls Develop and/or improve processes for collecting data related to measuring and quantifying fatalities and injuries in order to better understand crashes involving roadway workers Educate workers on safety practices in work zones For a complete list of the 17 actions associated with the above strategies, please refer to the Safety of Persons Working on Roadways Action Plan within the SHSP Action Plan in Appendix A. Between 2012 and 2016 there was an annual average of 1.8 worker deaths per year, the highest average in the past 10 years. 34
, creating a particularly vulnerable location.")
39 At-Grade Rail Crossings At-grade rail crossings are intersections combining multiple modes of transportation with different sizes and speeds (which may include railway vehicles, automobiles, bicycles, and pedestrians), creating a particularly vulnerable location. Although the number of crashes at at-grade rail crossings are far fewer than traditional vehicular crashes, the consequences are more severe due to the weight and speed of rail equipment. At-grade rail crossing crashes jeopardize the safety of many groups of people, including vehicle occupants, pedestrians, bicyclists, rail passengers, and train crews. According to the Federal Railroad Administration, there were a total of 46 at-grade rail crossing crashes involving vehicles from 2012 to Of those crashes, there was one fatality and 18 non-fatal injuries, as shown in the figures below. One of the reasons for this impressive safety record is the safety-focused work by the Massachusetts Bay Transportation Authority (MBTA) and MassDOT Rail Division. The MassDOT Highway Division administers Federal funds under Section 130 of the Federal Surface Transportation Law to improve safety at existing public at-grade rail crossings. The purpose of the Section 130 Program is to reduce the potential for crashes, number of occurrences, and severity of hazards to motorists, bicyclists, and pedestrians at at-grade rail crossings. The MassDOT At-Grade Crossing Program focuses on improving safety at existing crossings through the installation of warning devices. The Massachusetts policy is to reduce the number of highway-rail grade crossings on public thoroughfares wherever possible. Overview of Strategies Enhance at-grade rail crossing safety Educate general public about safe crossing practices Improve data collection and analysis capabilities Improve communication and collaboration among those responsible for at-grade rail crossing safety Between 2012 and 2016 there was one fatality and 18 non-fatal injuries due to atgrade rail crossing crashes in Massachusetts. For a complete list of the 10 actions associated with the above strategies, please refer to the At-Grade Rail Crossings Action Plan within the SHSP Action Plan in Appendix A. 35

40 Data Sources 1. Federal Motor Carrier Safety Administration, Analysis and Information Online, 2016, default.aspx 2. Federal Highway Administration Research and Technology, Interactive Highway Safety Design Model: Accident Predictive Module, 1995, 3. Federal Railroad Administration, Office of Safety Analysis, query/query.aspx 4. Governors Highway Safety Association, Pedestrian Traffic Fatalities by State: 2016 Preliminary Data, org/sites/default/files/ /2017ped_final_4.pdf 5. Massachusetts Center for Health Information and Analysis, FY15 Inpatient Hospital Discharge and Outpatient Observation Stay Databases, (Analyzed by Massachusetts Department of Public Health, Injury Surveillance Program) 6. Massachusetts Department of Elementary and Secondary Education, 2015 MA Youth Risk Behavior Survey, Massachusetts Center for Health Information and Analysis, FY15 Inpatient Hospital Discharge, Outpatient Observation Stay and Emergency Department Discharge Databases (Analyzed by MA Department of Public Health, Injury Surveillance Program) 8. Massachusetts Department of Public Health, 2015 MA Behavioral Risk Factor Surveillance Survey, gov/behavioral-risk-factor-surveillance 9. Massachusetts Department of Public Health, Registry of Vital Records and Statistics, 2015 (Analyzed by Massachusetts Department of Public Health, Injury Surveillance Program) 10. Massachusetts Department of Transportation Annual Performance Report from DRAFT MassDOT Pedestrian Transportation Plan, Tracker2017.pdf 11. Massachusetts Department of Transportation, 2016 Merit Rating Board data 12. Massachusetts Department of Transportation Registry of Motor Vehicles Crash Data System 13. Massachusetts Executive Office of Public Safety and Security Highway Safety Division, Safety Belt Observation Survey and NHTSA National Survey, Massachusetts Executive Office of Public Safety and Security Highway Safety Division, FFY18 and FFY19 Highway Safety Plan, National Highway Traffic Safety Administration, Fatality Analysis Reporting System (FARS), research-data/fatality-analysis-reporting-system-fars 16. National Highway Traffic Safety Administration, Model Minimum Uniform Crash Criteria, 2017, gov/mmucc 17. National Highway Traffic Safety Administration, Traffic Safety Facts 2015, 2016, Public/Publication/ National Work Zone Safety Information Clearinghouse Source Data from FARS and Bureau of Labor Statistics, 2016, USDOT Volpe Center, Truck Side Guards Resource Page, 2018, 36

41 Glossary Advanced Roadside Impaired Driving Enforcement (ARIDE). A 2 day course offered to provide law enforcement personnel and other criminal justice professionals information in the area of drug impairment in the context of traffic safety. Aggressive Driving. A behavior in which a driver exceeded the speed limit, drove too fast for conditions, or followed too closely. At-Grade Rail Crossing. A crossing of railroad tracks with highways, pedestrian walkways, bike paths or combinations of these on the same level. ATLAS. A transformation effort underway at the RMV, replacing ALRS, focused on improving the customer service experience of residents and businesses across the Commonwealth Automated License and Registration System (ALRS). The RMV s database used to store and manage the records of all drivers and registered vehicles in Massachusetts Autonomous Vehicle. Technology installed on a motor vehicle that has the capability to drive the vehicle without the active control or monitoring by a human operator. Bicyclist. A roadway user operating a two-wheel, non-motorized vehicle. Blood Alcohol Concentration (BAC). The amount of alcohol that is present in a person s blood when tested by a law enforcement authority. CarFit. An educational program sponsored by AAA, AARP, and AOTA that offers older adults the opportunity to check how well their personal vehicles fit them. Click It or Ticket. A national campaign advocating seat belt use. Commercial Motor Vehicle. Medium or heavy trucks more than 10,000 pounds, trucks carrying hazardous material and marked with a hazardous materials placard, or those operated by a driver with an interstate carrier or an intrastate carrier commercial driver s license. Commercial vehicles include buses that carry nine or more passengers or are designed and used for the transportation of persons for compensation. Commercial Vehicle Safety Plan (CVSP). Statewide plan required by the Federal Motor Carrier Safety Administration that outlines strategies and countermeasures specifically targeting commercial vehicle safety. Complete Streets. Streets that are planned, designed, and operated consistent with surrounding community characteristics and roadway functions so that multiple modes of transportation and customers, regardless of age or ability, easily, comfortably, and safely can access and use the street. Driver Distraction. Behaviors in which the driver is distracted by an electronic communication device, such as cell phones or other electronic devices, or other external distractions; passengers in the vehicle; texting; or where the driver is inattentive. Drug Impairment Training for Educational Professionals (DITEP). Course for enabling secondary educational professionals to recognize the signs and symptoms of drug and/or alcohol impairment. 37
HSIP Project Selection Criteria
 HSIP Project Selection Criteria The purpose of the Highway Safety Improvement Program (HSIP) is to reduce the number of fatal and injury crashes by targeting high crash locations and causes. Projects,
PRELIMINARY DRAFT FIRST AMENDMENT TO VISION 2050: A REGIONAL LAND USE AND TRANSPORTATION PLAN FOR SOUTHEASTERN WISCONSIN
 PRELIMINARY DRAFT FIRST AMENDMENT TO VISION 2050: A REGIONAL LAND USE AND TRANSPORTATION PLAN FOR SOUTHEASTERN WISCONSIN ESTABLISHING TARGETS FOR FEDERAL PERFORMANCE MEASURES: HIGHWAY SAFETY SOUTHEASTERN
Figure 1. Indiana fatal collisions by young driver involvement,
 INDIANA TRAFFIC SAFETY FACTS YOUNG DRIVERS 2016 MAY 2017 ISSUE 17-C06 IN 2016: In 2016, 13.4 percent of all drivers involved in Indiana collisions were young drivers. Young drivers were involved in 105
Toward Zero Deaths: Proactive Steps for Your Community
 Est. Dec. 2014 Toward Zero Deaths: Proactive Steps for Your Community Presented by: Brian Roberts, P.E., National Association of County Engineers Marie Walsh, Ph.D., Louisiana Local Technical Assistance
Canadian Association of Chiefs of Police Association canadienne des chefs de police
 WHAT S IN THE KIT? Media Advisory Template To be used to invite the media to an event during Operation Impact. We suggest you reproduce this on your own police agency letterhead. News Release Template
Toward Zero Deaths. Regional SHSP Road Show Meeting. Virginia Strategic Highway Safety Plan. presented by
 Toward Zero Deaths Regional SHSP Road Show Meeting presented by Virginia Strategic Highway Safety Plan December 1, 2016 1 Welcome & Introductions Purpose of the Meeting Objectives & Key Outcomes Agenda»
POLICY AGENDA For Elder Pedestrian Safety
 POLICY AGENDA For Elder Pedestrian Safety Older adults and people with disabilities often have mobility, cognitive, and sensory limitations that affect their behavior as pedestrians and place them at risk
We believe the following comments and suggestions can help the department meet those goals.
 The Honorable Secretary Anthony Foxx The Secretary of Transportation United States Department of Transportation 1200 New Jersey Avenue, SE Washington, DC 20590 August 30, 2013 Dear Secretary Foxx, Thank
Mission: The mission of FARS is to make vehicle crash information accessible and useful so that traffic safety can be improved
 Mission: The mission of FARS is to make vehicle crash information accessible and useful so that traffic safety can be improved NHTSA created FARS in 1975 National Center for Statistics and Analysis (NCSA)
Occ c u c pa p n a t pro r t O ec e t c i t O i n
 Occupant Protection Occupant Protection Introduction Buckling up or being buckled in is the most effective protection during a car crash. The simple truth is that the great majority of people ejected from
SAFETY PERFORMANCE MEASURES AND TARGET SETTING. Transportation Subcommittee September 15, 2017
 SAFETY PERFORMANCE MEASURES AND TARGET SETTING Transportation Subcommittee September 15, 2017 ACTION REQUESTED No action is requested. This item is for presentation and discussion. PREVIOUS ACTION Presented
November 2, Government takes on the challenge of improving traffic safety
 November 2, 2006 Government takes on the challenge of improving traffic safety Edmonton... The Alberta government has taken on the challenge of improving traffic safety by moving ahead with a comprehensive,
Road Safety Partnership
 Cambridgeshire and Peterborough Road Safety Partnership Cambridgeshire and Peterborough Road Safety Partnership Introduction Road accidents can have a devastating impact not only for the people directly
2015 Victorian Road Trauma. Analysis of Fatalities and Serious Injuries. Updated 5 May Page 1 of 28. Commercial in Confidence
 2015 Victorian Road Trauma Analysis of Fatalities and Serious Injuries Updated 5 May 2016 Page 1 of 28 Commercial in Confidence VICROADS_n3445896_2015_Victorian_Trauma_Report_- _updated_may_2016.docx 2015
MTCF. Michigan Traffic Crash Facts FACT SHEETS
 FACT SHEETS This page left intentionally blank GENERAL FACTS The driver, the roadway, and the motor vehicle contribute in some measure to every crash. A preponderance of evidence, however, points to driver
MTCF. Michigan Traffic Crash Facts FACT SHEETS
 FACT SHEETS This page left intentionally blank GENERAL FACTS The driver, the roadway, and the motor vehicle contribute in some measure to every crash. A preponderance of evidence, however, points to driver
Keep Customers and Ourselves Safe. Mark Shelton, District Engineer. Tracker. Measures of Departmental Performance
 Keep Customers and Ourselves Safe Mark Shelton, District Engineer Tracker Measures of Departmental Performance Safety is a daily commitment for all MoDOT employees. From design and construction to operations
Lane Area Transportation Safety and Security Plan Vulnerable Users Focus Group
 Lane Area Transportation Safety and Security Plan Vulnerable Users Focus Group Agenda 1. Planning Process Review 2. What are Emphasis Areas? 3. Your Role Today 4. Data Review 5. Small group discussion
Traffic Safety Plan Traffic Safety Plan 2015
 Traffic Safety Plan 2015 Purpose Airdrie s last Traffic Safety Plan was created in 2011. The 2015 Traffic Safety Plan is a revised model of the traffic operations for the City of Airdrie. The purpose of
APPENDIX F. Safety Planning. October 2018
 APPENDIX F Safety Planning October 2018 APPENDIX F: SAFETY PLANNING October 17, 2018 ABOUT VISUALIZE 2045 & THE TPB Visualize 2045 is the federally required long-range transportation plan for the National
City of San Diego Vision Zero Draft Strategic Plan FY 2017
 City of San Diego Vision Zero Draft Strategic Plan FY 2017 Engineering Objective: To develop and implement a strategy that employs best planning, design and engineering practices. Background: Over the
Dear Fellow Nebraskans:
 Dear Fellow Nebraskans: In accordance with the provisions in the Safe, Accountable, Flexible, and Efficient Transportation Equity Act A Legacy for Users (SAFETEA LU), each state is required to develop
INFORMATION TOOL KIT
 CANADA ROAD SAFETY WEEK 2017 INFORMATION TOOL KIT Thank you for being involved in Canada Road Safety Week. With your participation, we can spread the word about this special week and why it is an important
Institute of Transportation Engineers Safety Action Plan
 I Institute of Transportation Engineers Safety Action Plan 1. Introduction 2. Intersection Crashes 3. Keep Vehicles on the Road 4. Minimize Consequences When Vehicles Leave the Road 5. School Crossing
Vision Zero Richmond Action Plan
 Vision Zero Richmond Action Plan COVER Acknowledgements This Vision Zero Action Plan was prepared by the Safe and Healthy Streets Commission and with numerous partners committed to safety in Richmond,
Reducing Fatalities and Serious Injuries on County Roads
 Reducing Fatalities and Serious Injuries on County Roads Brian C. Roberts, P.E. Executive Director National Association of County Engineers Washington, DC Housekeeping Please silence all mobile devices.
Napier City road trauma for Napier City. Road casualties Estimated social cost of crashes* Major road safety issues.
 ISSN 1176-841X July 25 Land Transport New Zealand has prepared this road safety issues report. It is based on reported crash data and trends for the 2 24 period. The intent of the report is to highlight
FLORIDA TRANSPORTATION COMMISSION HIGHWAY SAFETY REPORT CALENDAR YEAR 2008
 FLORIDA TRANSPORTATION COMMISSION HIGHWAY SAFETY REPORT CALENDAR YEAR 2008 January 15, 2010 HIGHWAY SAFETY REPORT FOR CALENDAR YEAR 2008 January 15, 2010 2 TABLE OF CONTENTS INTRODUCTION 5 STRATEGIC HIGHWAY
CDRT. Child Death Review Team Dallas County. Brief Report Traffic-related Child Deaths OVERVIEW
 Dallas County CDRT Child Death Review Team 2013 Brief Report Traffic-related Child Deaths 2006-2011 OVERVIEW In Dallas County, traffic-related injury death rates among children are typically less than
DRAFT MOVING FORWARD RHODE ISLAND BICYCLE MOBILITY PLAN 2018 PREPARED FOR PREPARED BY IN ASSOCIATION WITH
 RHODE ISLAND MOVING FORWARD BICYCLE MOBILITY PLAN 2018 PREPARED FOR PREPARED BY IN ASSOCIATION WITH T AF CHAPTER 1 D R INTRODUCTION CHAPTER 3 ARTICULATES VISION Bicycling is safe, fun and practical in
BIKE PLAN CONTENTS GATEWAY
 CONTENTS Acknowledgments...vii Great Rivers Greenway District Board of Directors... vii Great Rivers Greenway District Staff... vii Project Consultants... vii Committees... viii Citizens Advisory Committee
2003 road trauma for. Wairoa District. Road casualties Estimated social cost of crashes* Major road safety issues WAIROA DISTRICT JULY 2004
 WAIROA DISTRICT JULY 24 T he Land Transport Safety Authority (LTSA) has prepared this road safety issues report. It is based on reported crash data and trends for the 1999 23 period. The intent of the
Goal 3: Foster an environment of partnerships and collaboration to connect our communities and regions to one another.
 Non-Motorized Transportation Plan (NMTP) Draft Vision, Goal and,, Tri-County Regional Planning Commission (TCRPC) Purpose The purpose of the Tri-County Regional Planning Commission (TCRPC) Non-Motorized
Keep Customers and Ourselves Safe. Mark Shelton, District Engineer. Tracker. Measures of Departmental Performance
 Keep Customers and Ourselves Safe Mark Shelton, District Engineer Tracker Measures of Departmental Performance Safety is a daily commitment for all MoDOT employees. From design and construction to operations
City of Novi Non-Motorized Master Plan 2011 Executive Summary
 City of Novi Non-Motorized Master Plan 2011 Executive Summary Prepared by: February 28, 2011 Why Plan? Encouraging healthy, active lifestyles through pathway and sidewalk connectivity has been a focus
NYC Pedestrian Safety Study & Action Plan. NYTMC Brown Bag Lunch Presentation December 15, 2010
 NYC Pedestrian Safety Study & Action Plan NYTMC Brown Bag Lunch Presentation December 15, 2010 1 Introduction DOT Safety Goal Strategic Plan: Reduce Fatalities by 50% by 2030 From 274 (2007) to 137 (2030)
Department of Transportation
 Department of Transportation I. Internal Scan The number of older drivers in the United States will double over the next 30 years. By 2030 one in five Americans will be age 65 or older. On a licensed-driver
City of Edmonton Office of Traffic Safety
 Overview About OTS Vision 0 Key Facts Speed Management Committee and Speed Management Plan Evidence on Speed and Speeding Complaint Process Data Collection Speed Surveys Collision Review Speed Management
Road Safety Annual Report 2016 OECD/ITF Chapter 26. Morocco
 Road Safety Annual Report 2016 OECD/ITF 2016 Chapter 26 Morocco This chapter presents 2014 road safety data for Morocco along with provisional data from 2015. It looks at trends in traffic and road safety
Speed Management Action Plan
 Speed Management Action Plan National Selection Criteria Criteria Description Fatalities The number of fatalities resulting from speeding-related crashes. Percentage Compares total fatalities in each State
APPENDIX C. Systems Performance Report C-1
 APPENDIX C Systems Performance Report C-1 System Performance Report & Requirements According to the FAST Act, a long range transportation plan needs to include a system performance report and subsequent
FLORIDA STRATEGIC HIGHWAY SAFETY PLAN
 FLORIDA STRATEGIC HIGHWAY SAFETY PLAN 1 FLORIDA STRATEGIC HIGHWAY SAFETY PLAN Presenter: Joe Santos State Safety Engineer FDOT State Safety Office 2 Presentation 3/28/2017 3 FLORIDA STRATEGIC HIGHWAY SAFETY
A Strategic Highway Safety Plan. a coordinated and informed approach to reducing highway fatalities and serious injuries on all public roads.
 Introduction A Strategic Highway Safety Plan is a coordinated and informed approach to reducing highway fatalities and serious injuries on all public roads. A Strategic Highway Safety Plan is Based on
Crash Patterns in Western Australia. Kidd B., Main Roads Western Australia Willett P., Traffic Research Services
 Crash Patterns in Western Australia Kidd B., Main Roads Western Australia Willett P., Traffic Research Services Abstract Examination of crash patterns is one way of identifying key factors on which focus
Louisiana Traffic Records Data Report 2017
 Louisiana Traffic Records Data Report 2017 crashdata.lsu.edu Dr. Helmut Schneider September 2018 Overview Trends in crashes, fatalities & injuries Findings from the Occupant Protection Survey of 2018 Driving
CITY OF BLOOMINGTON COMPLETE STREETS POLICY
 CITY OF BLOOMINGTON COMPLETE STREETS POLICY POLICY OBJECTIVE: The City of Bloomington will enhance safety, mobility, accessibility and convenience for transportation network users of all ages and abilities,
The Florida Bicycle and Pedestrian Partnership Council
 The Florida Bicycle and Pedestrian Partnership Council Input to the Update of the Florida Transportation Plan March 2015 This document presents input from the Florida Bicycle and Pedestrian Advisory Council
South Carolina s Strategic Highway Safety Plan
 Target Zero South Carolina s Strategic Highway Safety Plan 215-218 March 4, 215 Dear Highway Safety Partner: The South Carolina Department of Public Safety (SCDPS) and the South Carolina Department of
Street Smart - Regional Pedestrian Safety Campaign. Hopkins Grand Rounds July 16, 2014
 Street Smart - Regional Pedestrian Safety Campaign Hopkins Grand Rounds July 16, 2014 Baltimore Metropolitan Council (BMC) Who We Are The organization of the Baltimore region s elected executives, representing
New Road Safety Strategy Aims to Ensure Canada Has World s Safest Roads
 New Road Safety Strategy Aims to Ensure Canada Has World s Safest Roads OTTAWA, January 26, 2011 The Ministers Responsible for Transportation and Highway Safety have approved a new five year Road Safety
MEMORANDUM. City Constituents. Leilani Schwarcz, Vision Zero Surveillance Epidemiologist, SFDPH
 MEMORANDUM TO: FROM: CC: City Constituents Leilani Schwarcz, Vision Zero Surveillance Epidemiologist, SFDPH Megan Wier, Co-Chair, San Francisco Vision Zero Task Force, SFDPH Commander Ann Mannix, Traffic
Proposed. City of Grand Junction Complete Streets Policy. Exhibit 10
 Proposed City of Grand Junction Complete Streets Policy Exhibit 10 1 City of Grand Junction Complete Streets Policy Vision: The Complete Streets Vision is to develop a safe, efficient, and reliable travel
VISION ZERO ACTION PLAN
 PALM BEACH Transportation Planning Agency VISION ZERO ACTION PLAN TPA Advisory Committee Meetings March 2019 PURPOSE Present the Data Analysis Key Findings and the Action Items from the Draft Action Plan
What is the problem? Transportation Safety Planning Purdue Road School. 42,636 Fatalities. Nearly 3M Injuries. Over 4M PDO crashes
 Transportation Safety Planning Purdue Road School March 29, 2006 What is the problem? 42,636 Fatalities Nearly 3M Injuries Over 4M PDO crashes $230B Cost to the Nation Trends in Motor Vehicle Fatality
road safety issues 2001 road toll for Gisborne district July 2002 Road user casualties Estimated social cost of crashes*
 GISBORNE DISTRICT road safety issues July 22 The Land Transport Safety Authority (LTSA) has prepared this Road Safety Issues Report. It is based on reported crash data and trends for the 1997 21 period.
ADDIS ABABA ROAD SAFETY STRATEGY
 ADDIS ABABA ROAD SAFETY STRATEGY (2017-2030) Feb 22, 2017 Presentation: Daniel Molla Overview Addis Ababa Capital City of Ethiopia, Seat of AU Area: 540 km 2 Population 3.4 million Road safety crises 400
TOWARDS A BIKE-FRIENDLY CANADA A National Cycling Strategy Overview
 TOWARDS A BIKE-FRIENDLY CANADA A National Cycling Strategy Overview NationalCyclingStrategFrameworkv3.indd 1 Potential for this modal shift can be found in municipalities of all sizes, in every population
FINAL PLAN APPENDIX D CITY OF BERKELEY BIKE PLAN D-1
 CITY OF BERKELEY BIKE PLAN D-1 . Proposed Programs D.1. EDUCATION This appendix presents the recommended bicycle-related programs for the City of Berkeley. The recommendations are organized in four E s:
Towards Zero: The Safest Roads in the World
 Towards Zero: The Safest Roads in the World January 2016 TABLE OF CONTENTS 1 EXECUTIVE SUMMARY...3 2 INTRODUCTION...3 3 ROAD SAFETY STRATEGY 2025...4 3.1 The Vision... 5 3.2 Strategic Objectives... 5 3.3
POLICY STATEMENT: VISION ZERO
 Overview of APBP Policy Statements POLICY STATEMENT: VISION ZERO The Association of Pedestrian and Bicycle Professionals (APBP) supports the community of professionals working to create more walkable,
Bicycle Master Plan Goals, Strategies, and Policies
 Bicycle Master Plan Goals, Strategies, and Policies Mobilizing 5 This chapter outlines the overarching goals, action statements, and action items Long Beach will take in order to achieve its vision of
Maine Highway Safety Facts 2016
 Maine Highway Safety Facts 216 216 MAINE HIGHWAY SAFETY FACTS The Bureau of Highway Safety and the Maine Department of Transportation are pleased to present the 216 edition of Maine Highway Safety Facts.
DRIVING ZERO FATALITIES TO A REALITY ILLINOIS LOCAL SAFETY INITIATIVE
 DRIVING ZERO FATALITIES TO A REALITY ILLINOIS LOCAL SAFETY INITIATIVE Priscilla Tobias, PE State Safety Engineer Illinois Dept of Transportation Illinois Stats 102 Counties 145,000 Roadway Miles 900+ Fatalities
Pedestrian Fatalities on Interstate Highways, United States, Saving lives through research and education.
 Saving lives through research and education Pedestrian Fatalities on Interstate Highways, United States, 1993-2012 September 2014 607 14th Street, NW, Suite 201 Washington, DC 20005 AAAFoundation.org 202-638-5944
Merseyside Road Safety Partnership s Annual Road Traffic Casualties Report 2015
 Merseyside Road Safety Partnership s Annual Road Traffic Casualties Report 2015 Contents 1. Overview of KSI s 2 2. Cyclists 4 3. Motorcyclists 8 4. Senior Road Users 10 5. Pedestrians 14 6. Car Drivers
Lisa Quinn Executive Director
 Transforming Injury and Violence Prevention: Innovations in Policy, Practice, and Partnerships Advocating for Prevention: Enacting and Reacting to Legislation Lisa Quinn Executive Director Feet First works
Pedestrian injuries in San Francisco: distribution, causes, and solutions
 Pedestrian injuries in San Francisco: distribution, causes, and solutions Presentation to the San Francisco Health Commission RAJIV BHATIA, MD, MPH DIRECTOR OF OCCUPATIONAL AND ENVIRONMENTAL HEALTH, SAN
CITY OF LOS ANGELES INTER-DEPARTMENTAL MEMORANDUM
 CITY OF LOS ANGELES INTER-DEPARTMENTAL MEMORANDUM Date: December 12,2011 To: Honorable City Council c/o City Clerk, Room 395, City Hall Attention: Honorable Bill Rosendahl, Chair, Transportation Committee
BICYCLING ON ROADWAYS
 Massachusetts State Police Academy Training Bulletin 2017-11 BICYCLING ON ROADWAYS Legal Update: Effective April 2017, Chapter 456 of the Acts of 2016 adds section 4D to Chapter 89 of the General Laws,
Transportation and Public Works Annual Motor Vehicle Collision Report
 Transportation and Public Works 22 Annual Motor Vehicle Collision Report Table of Contents Table of Contents.. 2 Introduction.. 3 22 Collision Summary. 4 Demographics 5 Collisions by Severity.. 5 Personal
Why Zone In on Speed Reduction?
 Learn it. Do it. Live it! SPEED REDUCTION IN THE ZONE Why Zone In on Speed Reduction? Speeding is a serious issue that plays a major role in the risk of serious injury and pedestrian fatality in a crash.
Texas Intersection Safety Implementation Plan (ISIP): Project Overview & Preliminary Findings. April 15, 2016
: Project Overview & Preliminary Findings. April 15, 2016") Texas Intersection Safety Implementation Plan (ISIP): Project Overview & Preliminary Findings April 15, 2016 2 Introductions North Central Texas Council of Governments (Dallas Fort Worth area) Capital
Texas Intersection Safety Implementation Plan (ISIP): Project Overview & Preliminary Findings April 15, 2016 2 Introductions North Central Texas Council of Governments (Dallas Fort Worth area) Capital
Alberta. Traffic Collision Statistics. Office of Traffic Safety Transportation Services Division May 2017
 Traffic Collision Statistics Office of Traffic Safety Transportation Services Division May 217 This page was intentionally left blank. 2 Table of Contents Traffic Collisions... 4 Traffic Collision Rates...
Citizens Advisory Committee March 26, 2014
 Memorandum 0..1 Citizens Advisory Committee March, 1 Citizens Advisory Committee Maria Lombardo Chief Deputy for Policy and Programming Elizabeth Sall Interim Deputy Director for Planning Vision Zero Committee
MEMORANDUM. Charlotte Fleetwood, Transportation Planner
 MEMORANDUM Date: Updated August 22, 2017 To: Organization: Charlotte Fleetwood, Transportation Planner Boston Transportation Department From: Jason DeGray, P.E., PTOE, Regional Director of Engineering
TOOLKIT STOP ON RED. National. Week August 6-12, 2017 RED-LIGHT RUNNING FACT. #StopOnRed2017 to spread the message!
 National STOP ON RED Week August 6-12, 2017 RED-LIGHT RUNNING FACT In 2015, 771 people were killed due to red-light running and an estimated 137,000 were injured. Source: IIHS TOOLKIT Learn more about
AMATS Complete Streets Policy
 AMATS Complete Streets Policy Table of Contents: Section 1. Definition of Complete Streets Section 2. Principles of Complete Streets Section 3. Complete Streets Policy Section 4. Consistency Section 5.
Ongoing Challenges with Pedestrian Safety Data May 15: 10:15AM-11:45AM. PedsCount! 2014 May 14-16, 2014 Sacramento, CA
 Ongoing Challenges with Pedestrian Safety Data May 15: 10:15AM-11:45AM PedsCount! 2014 May 14-16, 2014 Sacramento, CA David Ragland, Director, Safe Transportation Research & Education Center (SafeTREC),
Perryville TOD and Greenway Plan
 Perryville TOD and Greenway Plan Greenway Glossary Pathway: A bicycle and pedestrian path separated from motorized vehicular traffic by an open space, barrier or curb. Multi-use paths may be within the
Transportation Master Plan Advisory Task Force
 Transportation Master Plan Advisory Task Force Network Alternatives & Phasing Strategy February 2016 BACKGROUND Table of Contents BACKGROUND Purpose & Introduction 2 Linking the TMP to Key Council Approved
PALM BEACH COUNTY LOCAL ROAD SAFETY PLAN
 PALM BEACH COUNTY LOCAL ROAD SAFETY PLAN JANUARY 2019 Street View Images Google 2018 Notice This document is disseminated under the sponsorship of the U.S. Department of Transportation in the interest
Response Road Safety Strategy for New South Wales
 Response Road Safety Strategy for New South Wales 2012-2021 The Amy Gillett Foundation (AGF) welcomes the opportunity to contribute to the Road Safety Strategy for New South Wales 2012-2021 (the Strategy).
People killed and injured per million hours spent travelling, Motorcyclist Cyclist Driver Car / van passenger
 Cyclists CRASH FACTSHEET 27 CRASH STATISTICS FOR THE YEAR ENDED 31 DEC 26 Prepared by Strategy and Sustainability, Ministry of Transport Cyclists have a number of risk factors that do not affect car drivers.
TEXAS TRAFFIC SAFETY TASK FORCE. Jeff Moseley Texas Transportation Commission
 TEXAS TRAFFIC SAFETY TASK FORCE Jeff Moseley Texas Transportation Commission June 7, 2016 Fatalities and fatal crashes 2010 2015 4,000 3,500 3,417 3,407 3,536 3,533 3,000 3,061 3,067 2,782 2,803 3,037
Rebecca Szymkowski, P.E., PTOE Wisconsin Department of Transportation. ITE Midwestern District Annual Meeting June 30, 2015
 Rebecca Szymkowski, P.E., PTOE Wisconsin Department of Transportation ITE Midwestern District Annual Meeting June 30, 2015 Strategic Highway Safety Plan (SHSP) Roundabout Safety Analysis J-turn Experiences
Local Government Road Safety Summit - 9 April 2018
 Local Government Road Safety Summit - 9 April 2018 Report on outcomes The Associate Minister of Transport, Hon Julie Anne Genter held the Local Government Road Safety Summit in Wellington on 9 April 2018.
FHWA Resources for Pedestrian and Bicycle Professionals
 FHWA Resources for Pedestrian and Bicycle Professionals Charlie Zegeer, UNC Highway Safety Research Center/PBIC Libby Thomas, UNC Highway Safety Research Center Dan Nabors, Vanasse Hangen Brustlin (VHB)
CTDOT Pedestrian and Bicycle Safety Initiatives
 CTDOT Pedestrian and Bicycle Safety Initiatives 2017 Northeast Transportation Safety Conference Mark F. Carlino, P.E. Traffic Engineering Division Chief Bureau of Engineering and Construction Connecticut
RSTF Measurements and Status
 RSTF Measurements and Status Items in green text are on or ahead of target. Items in red text need attention. Objective & Measures Status November, 2011 Winter, 3/8/12 Build, Maintain, & Leverage Partnerships
CHAIR AND MEMBERS CIVIC WORKS COMMITTEE MEETING ON APRIL 25, 2016
 TO: FROM: SUBJECT: CHAIR AND MEMBERS CIVIC WORKS COMMITTEE MEETING ON APRIL 25, 2016 JOHN BRAAM, P. ENG. MANAGING DIRECTOR, ENVIRONMENTAL & ENGINEERING SERVICES AND CITY ENGINEER SCHOOL ZONE SPEED LIMIT
4. Transportation Safety
 4. Transportation Safety INTRODUCTION Safety is a key measure of the quality of the region s transportation system. In 2005, the federal legislation Safe, Accountable, Flexible, Efficient Transportation
CENTRAL ARIZONA GOVERNMENTS STRATEGIC TRANSPORTATION SAFETY PLAN FINAL REPORT
 CENTRAL ARIZONA GOVERNMENTS STRATEGIC TRANSPORTATION SAFETY PLAN FINAL REPORT JANUARY 2017 ENGINEERING ENFORCEMENT EDUCATION EMERGENCY RESPONSE This Report is subject to the provisions of 23 USC 409. Any
Living Streets Policy
 Living Streets Policy Introduction Living streets balance the needs of motorists, bicyclists, pedestrians and transit riders in ways that promote safety and convenience, enhance community identity, create
NASHUA REGIONAL PLANNING COMMISSION REGIONAL BICYCLE AND PEDESTRIAN PLAN
 NASHUA REGIONAL PLANNING COMMISSION REGIONAL BICYCLE AND PEDESTRIAN PLAN June, 2005 Prepared by the Nashua Regional Planning Commission 2005 NRPC Regional Bicycle and Pedestrian Plan- JUNE 2005 ACKNOWLEDGEMENTS
Closing Plenary Session
 TRAFFIC SAFETY CONFERENCE Closing Plenary Session June 9, 2017 Las Colinas, TX Order of Report Out June 9, 2017 Las Colinas, TX Distracted Driving Prioritized Countermeasures Countermeasure 4a Systemically
Transportation and Health Tool
 Working together to evolve the Transportation and Health Tool APHA Webinar March 22, 2016 Ann Steedly, PE Overview THT Development Context Development of Indicators Strategies, Interventions & Policies
[ Fundación PONS ] [ Fundación PONS ] [ Expertise PONS ] Investing in road safety
![[ Fundación PONS ] [ Fundación PONS ] [ Expertise PONS ] Investing in road safety](/thumbs/73/68505603.jpg "[ Fundación PONS ] [ Fundación PONS ] [ Expertise PONS ] Investing in road safety") With more than 60 years experience, PONS is a leading company in the fields of road safety and sustainable transportation planning, providing worldwide support with auditing, consultancy and training services,
With more than 60 years experience, PONS is a leading company in the fields of road safety and sustainable transportation planning, providing worldwide support with auditing, consultancy and training services,
INSURANCE INSTITUTE FOR HIGHWAY SAFETY 1005 NORTH GLEBE ROAD ARLINGTON, VA PHONE 703/ FAX 703/
 Statement before the Virginia House of Delegates Militia, Police, and Public Safety Committee Red light violations and red light cameras Stephen L. Oesch INSURANCE INSTITUTE FOR HIGHWAY SAFETY 1005 NORTH
USDOT Bicycle and Pedestrian Safety Initiative: Safer People and Safer Streets. Barbara McCann, USDOT Office of Policy
 { USDOT Bicycle and Pedestrian Safety Initiative: Safer People and Safer Streets Barbara McCann, USDOT Office of Policy 4 Steps from policy to practice Creating multi-modal streets means: 1. Change Decision-Making
Focus on Enforcement. 7/21/2017 Presentation to SFMTA Policy & Governance Committee. Joe Lapka Corina Monzón
 Focus on Enforcement Insights from research and analysis in support of San Francisco s Vision Zero plan to eliminate traffic deaths Joe Lapka Corina Monzón 7/21/2017 Presentation to SFMTA Policy & Governance