Development and Assessment of CACC for Cars and Trucks
|
|
|
- Jacob Eaton
- 5 years ago
- Views:
Transcription
1 Development and Assessment of CACC for Cars and Trucks Steven E. Shladover, Sc.D. California PATH Program University of California, Berkeley May 24,
2 Overview Cooperative ACC vs. Platooning History of CACC development and evaluation Traffic micro-simulation modeling Manual driving behavior models CACC and ACC vehicle following models based on full-scale vehicle test results Simplified network for performance assessment CACC performance based on simulation results Truck CACC system development and evaluation Experimental results Traffic simulation results 2
3 Cooperative ACC vs. Platooning Cooperative vehicle following using V2V coordination SAE Level 1 automation, but could be extended higher V2V providing information beyond sensor line of sight Enabling coordination of vehicle actions for safety, smoothness and traffic flow stability Tightly-coupled platoon First vehicle (or driver) supervises Joining/departing authorized by leader Constant clearance-gap separation Generally enables shorter gaps Cooperative ACC (CACC) Ad-hoc combination of vehicles Drivers can join or depart at will Constant time-gap separation 3
4 Long-Term Significance of CACC Studies CACC likely to be first V2V cooperative automation to be deployed (trucks first, then buses and cars) Longitudinal control performance the same as higher levels of cooperative automation (good prediction of future automation system performance) 4
5 PATH History of Relevant Prior Research Development and evaluation of closely-coupled platoon systems from (cars, trucks, buses) Caltrans-sponsored CACC development (2 Nissan FX-45s) Field testing of driver acceptance under FHWA EARP sponsorship, with Caltrans cost share Second-generation system development, under Nissan sponsorship (4 Infiniti M56s) FHWA EARP Project Using CACC to Form High-Performance Vehicle Streams (simulation results to be shown) FHWA STOL implementation of CACC on 5 Cadillac SRXs (2015) FHWA EARP Project Partially Automated Truck Platooning 5
6 Using CACC to Form High-Performance Vehicle Streams FHWA EARP Project, with Caltrans cost sharing U.C. Berkeley and TU Delft collaboration, using models from both PATH research team: Dr. Hao Liu, Dr. Xiao-Yun Lu, David Kan, Fang-Chieh Chou, Dr. Dali Wei Obtain authoritative predictions of traffic impacts of ACC and CACC at various market penetrations Realistic ACC and CACC car-following models based on experimental data Combining Berkeley and Delft micro-simulation models of traffic behavior Define strategies for managing ACC and CACC operations to achieve best traffic impacts Concentrating them in managed lanes on the left Using DSRC (VAD) vehicles as leaders even if not CACC capable themselves Active local coordination as well as ad-hoc clustering 6
7 Modeling to Predict CACC Traffic Impacts Detailed micro-simulations to represent interactions with manually driven vehicles, including lane changing Baseline manual driving models NGSIM Oversaturated Flow model (Berkeley) and MOTUS (TU Delft) Extensive enhancements to both models to represent detailed vehicle-vehicle interactions accurately NGSIM implementation in Aimsun, with SDK modules added ACC and CACC car following models derived from PATH-Nissan experiments on full-scale test vehicles Additional higher-level CACC maneuvering models 7
8 Manual Driving Model At each update interval, the driving mode is determined for each vehicle, and the speed, position and travel lane are updated based on the mode: CF: Regular car following mode LC: Lane change mode ACF: After lane changing car following mode BCF: Before lane changing car following mode RCF: Receiving car following mode YCF: Yielding (cooperative) car following mode 8
9 Manual Driving Model The structure of the manual driving model 9
10 Manual Driving Model Calibration on CA SR-99 Corridor (Sacramento) Length: 13 miles Morning peak: 6-9 AM 16 on-ramps 11 off-ramps Recurrent delay is mainly caused by high on-ramp demand On-ramps are metered The 5-minute interval vehicle count and speed data observed at reliable detectors are used as the benchmark data. Detector: not considered in calibration Detector: considered in calibration Interchange 10
11 Manual Driving Model Calibration on CA SR-99 Corridor (Sacramento) 11
12 Manual Driving Model Calibration on CA SR-99 Corridor (Sacramento) Freeway: 5-min flows of SR-99 Northbound Detector Location Cases Target Cases (post-mile) Met % Met Target Met? GEH < 5 for > 85% of k % Yes GEH < 5 for > 85% of k % Yes GEH < 5 for > 85% of k % Yes GEH < 5 for > 85% of k % Yes GEH < 5 for > 85% of k % Yes GEH < 5 for > 85% of k % Yes GEH < 5 for > 85% of k % Yes GEH < 5 for > 85% of k % Yes GEH < 5 for > 85% of k % Yes GEH < 5 for > 85% of k % Yes GEH < 5 for > 85% of k % Yes GEH < 5 for > 85% of k % Yes GEH < 5 for > 85% of k % Yes GEH < 5 for > 85% of k % Yes Overall GEH < 5 for > 85% of k % Yes ()= 2 () +() k: ID of the 5-min time interval M: simulated flow C: observed flow To get good GEH result, we must accurately model Intensity and duration of the traffic congestion Congestion due to merging, diverging and weaving traffic Peak and non-peak traffic 12
 The calibrated model")

13 Manual Driving Model Calibration on CA SR-99 Corridor (Sacramento) The calibrated model can accurately replicate the spatial and temporal characteristics of the traffic along SR99. 13
14 Manual Driving Model Calibration on CA SR-99 Corridor (Sacramento) Comparison of fundamental diagrams of simulated and field observed flow-density relationships Two sample replications at Station

15 Animation of Base Case (Manual Driving) 8400 vehicles/hour on mainline approach vehicles/hour from onramp 15
16 CACC and ACC Car-Following Models Data collected using programmed speed change profiles on first car, with three followers tracking it Simple models representing car following dynamics derived from test data using Matlab System Identification toolbox Model predictions of responses compared with test data to verify accuracy 16
 at minimum gap of 1.1 s Cooperative (V2V communication) at minimum gap of 0.")
17 Adaptive Cruise Control with and without V2V Cooperation (AACC and CACC) Autonomous (no communication) at minimum gap of 1.1 s Cooperative (V2V communication) at minimum gap of 0.6 s 17
 Cooperative (V2V")
18 Comparison of Performance Autonomous (no communication) Cooperative (V2V communication) 18
19 ACC Model F Activate ACC system Is gap <=120 m? T F Is gap <=100 m? Was in gap F T regulation mode? T Time gap distribution (from field test) sec 50% sec 20% sec 30% Speed regulation Gap regulation Speed regulation = 0.4 Gap regulation =
20 CACC Model Overview Desired time gap (DTG, sec) Number of vehicles in the preceding string (Np) Time gap (TG, sec) Desired speed (DSPD) Speed (SPD) CACC Follower True Activate CACC system Is Np < 20? AND Is TG < 2.0? False CACC Leader True Is TG> 1.5 sec? False Gap regulation Was in speed regulation mode? False Track fixed time gap 1.5 sec. True Speed regulation Track DSPD Gap regulation Track DTG *The speed is always upper bounded by driver desired speed no matter what state vehicle is in. 20
21 CACC Model Form and Parameter Values Speed regulation Gap regulation : preceding gap (m) =0.4 = +0.45! !#! = Time gap distribution from field test sec 50% sec 25% sec 10% sec 15% : driver desired time gap (sec) : subject vehicle speed (m/s) : subject vehicle speed command (m/s^2) 21


22 AACC Model Predictions and Test Results Speeds (Test above, model below) Accelerations (Test above, model below) 22
23 CACC Model Predictions and Test Results Speeds (Test above, model below) Accelerations (Test above, model below) 23
24 Additional Collision Avoidance Logic CAMP forward collision warning algorithm Compute % &'( % &'( >0? Yes No warning, continue CACC mode No Assuming the subject vehicle adopts % &'( and the preceding vehicle keeps the current acceleration, compute the minimum clearance-gap required for the subject vehicle to avoid the rear-end collision. % &'( : acceleration required for the subject driver to avoid the rear-end collision No Current gap < minimum gap? Yes Trigger alarm, switch to manual driven mode 24
25 Simple Highway Network Layout for Assessing Key Performance Trends Four-lane mainline highway, traffic generated further upstream One-lane on-ramp, volume ranging from 300 to 1200 veh/hr One-lane off-ramp, volume ranging from 5% to 20% of mainline On-ramp and off-ramp are 1.5 km apart Simulate far enough upstream and downstream to stabilize results 1.5 km 25
26 Aspects of Performance Tested in Simulation Maximum downstream throughput achievable under various conditions Travel times and delays traversing the test section Effects of variations in: ACC, CACC market penetration On-ramp and off-ramp traffic volumes Maximum allowable CACC string length Minimum gap between CACC strings Priority use of left-side managed lane Availability of automated merge/lane change coordination 26
27 Simulation Results with CACC Operations Freeway capacity increases because of CACC string operation Small probability of forming CACC strings under low CACC market penetration CACC strings are often interrupted by lane change maneuvers in the traffic stream and interactions with heterogeneous traffic Traffic management strategies are needed to help create CACC strings and maintain their operation 27
28 Simulation Results Traffic Management Traffic management strategies considered: Discretionary lane change (DLC) restriction for CACC vehicles when they are in the CACC string reducing disturbances from lane changes CACC managed lanes (ML) reducing interactions of CACC vehicles and manually driven vehicles and increasing concentration of CACC vehicles together Equipping manually driven vehicles with Vehicle Awareness Devices (VAD) creating more CACC strings under low CACC market penetration 28
29 Lane Capacity Increases for Different Strategies ML and VAD VAD Do nothing ML DLC Restriction Pipeline capacity of a 4-lane freeway without entry or exit traffic Quadratic increase of capacity as the CACC market penetration increases The ML strategy works best under the following conditions: 40% CACC with 1 ML, 60% CACC with 2 MLs, 80% CACC with 3 MLs Different strategies are best under different CACC market penetrations 29
30 Throughput Limitations as On-Ramp Volume Grows Throughput of the merging area The throughput is measured downstream from the merging area and averaged by lane Downstream throughput reduces as on-ramp traffic increases It maintains quadratic trend with CACC market penetration Ramp traffic in veh/hr/lane Mainline traffic volume equals the base case pipeline capacity shown in the previous slide 30
31 Managed Lane Throughput Advantage Time series of output flow from the merging area Mainline Input Only Mainline + Ramp Input 40% CACC with and without ML The ML strategy increases the capacity of the merging area Without ML, all freeway lanes became congested as the ramp traffic was loaded (capacity reduction) With ML, CACC vehicles concentrate in lane 4, leading to an effective use of the lane The general-purpose lanes become congested in both cases Mainline input: 9600 veh/h, on-ramp input: 1500 veh/h Lane 4 is the managed lane in the ML case Results for Lane 1 and 2 are similar to those of lane 3 31
32 Effects of Management Strategies on Throughput at Merging Section Throughput of the merging section with 40% CACC Mainline upstream input: 9600 veh/h ML and VAD strategies can increase the throughput of the on-ramp merging area ML redistributes traffic load across lanes creating more gaps in the general purpose lane VAD increases the queue discharging flow by enabling more CACC usage DLC restriction strategy has little effect because it does not change lane change behaviors of the merging traffic 32
33 Higher Exiting Traffic Impacts on Throughput Throughput of the diverging section Increase of capacity when CACC grows from 0% to 20% and off-ramp traffic > 15% When off-ramp traffic is more than 20% of mainline volume, traffic management strategy is needed to address the large exiting flow, especially for the 80% and 100% CACC market penetration cases. 33


34 Simulation Animations 40% CACC 40% CACC with ML Speed (km/h) Driving Mode In both cases: mainline input 9600 veh/h, on-ramp input 1200 veh/h 34
35 Primary Findings from CACC Simulations (1/2) If CACC string length is not limited, strings grow very long, interfering with lane changing (limit to 10 vehicles) Choose inter-string clearance gap to balance between efficient use of space and leaving gaps to permit lane changing (1.5 s looks reasonable) Performance is sensitive to assumptions about propensity of drivers to change lanes to go faster (DLC) Managed lanes improve traffic conditions only in certain cases (when CACC market penetration and number of managed lanes are well matched) 35
36 Primary Findings from CACC Simulations (2/2) Throughput improvement is quadratic with CACC market penetration With CACC gap preferences from our field test, highway throughput could increase about 50% with 100% CACC Additional throughput increases need active merge and lane change coordination 36
, with cost sharing from California Department of Transportation (Caltrans) Measuring")

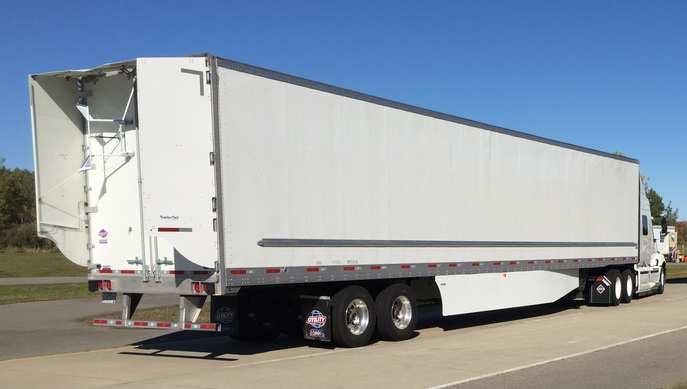
37 Development and Testing of Truck Cooperative ACC System Project sponsored by Federal Highway Administration, Exploratory Advanced Research Program (EARP), with cost sharing from California Department of Transportation (Caltrans) Measuring energy saving potential and driver preferences for different gap settings Simulating impacts on traffic and energy use in a high-volume freight corridor PATH research team: Dr. Xiao-Yun Lu, Dr. Hani Ramezani, Dr. Shiyan Yang, John Spring, David Nelson 37


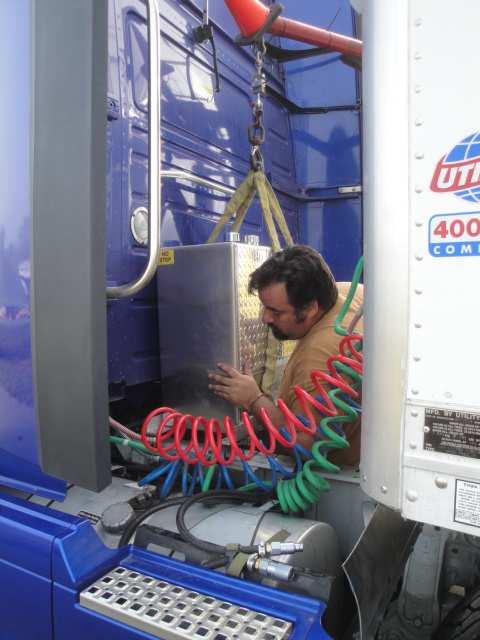
38 Cooperative Adaptive Cruise Control System Build on production Volvo ACC system Add V2V communication by 5.9 GHz DSRC Vehicle location Speed, acceleration, braking, commands Short gap settings enabled: 0.6, 0.9, 1.2, 1.5 s 57, 86, 114, mph Coordinated braking 38


39 Testing to Measure Energy Consumption International collaboration with Transport Canada and National Research Council of Canada Testing in Blainville, Quebec on 4-mile oval track SAE standard test procedure 64-mile continuous drive per run 3 runs repeated and averaged Auxiliary fuel tanks weighed on each run 39
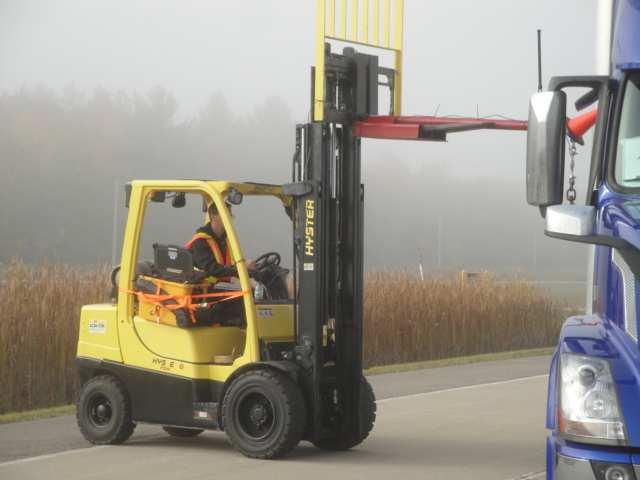
40 Testing Procedures 40
41 Testing at 0.6 s Time Gap in Blainville 41
42 Energy Savings For 3-Truck CACC String Compared to Single Truck with Standard Trailer Energy Saving with Standard Trailers, 65 mph Average Savings, Standard and Aerodynamic, compared to Standard 42
43 Main Experimental Findings With standard trailers, trucks can save 5% energy on average in a three-truck CACC string With aerodynamic trailers, these savings grow to 12-14% compared to standard-trailer solo driving Drag savings not very sensitive to time gap values from 0.6 s to 1.5 s (57 to 143 ft. at 65 mph) Lead truck saves limited energy in this range of gaps. Third truck saves the most energy Effects of short gaps and aerodynamic trailers reinforce each other Further studies are needed for shorter and longer gaps 43
 16 miles of I-710 NB, coded in Aimsun plus additional")

44 Simulating Impacts in a Congested Freight Corridor (I-710, LA-Long Beach) 16 miles of I-710 NB, coded in Aimsun plus additional features in SDK 21 off ramps & 20 on ramps Truck vehicle following models derived from truck experiment results (models will be published later) 44

45 Modeling I-710 Corridor in Aimsun Example of restricted geometric conditions Traffic direction 45

46 Modeling I-710 Corridor in Aimsun Example of a major onramp from I
47 Simulation Conditions Shortest desired gap for truck CACC: 0.6 sec 100% penetration rate for truck CACC, with cars all manual No lane change cooperation by trucks in CACC string Desired gap for trucks in manual mode : 1.5 sec Effects of desired gap & penetration rate, among other factors, will be studied 47
48 Simulation Results: Vehicle Speeds (with and without truck CACC) Average speeds at 13 detector stations Avg. Speed Improvement (mph) Speed (mph) Post Mile Manual trucks & cars Truck CACC & manual cars 48
49 Simulation Results: Total Traffic Volume 1600 Volume per lane (vphpl) % Improvement % 5% % 7% 6% 8% 8% 2% Per lane vol. (vphpl) % 3% 1% 3% 10% Post Mile Manual trucks & cars Truck CACC & manual cars 49
50 Simulation Results: Truck Speeds Avg. Speed Improvement (mph) Speed (mph) Post Mile Manual trucks & cars Truck CACC & manual cars 50
51 Simulation Results: Truck Traffic Volume 250 Total volume (truck/hr) % Improvement % 10% 9% 21% 21% 21% 21% 19% 23% 10% 4% Total volume % 35% Post Mile Manual trucks & cars Truck CACC & manual cars 51
52 Simulation Results: Network Level Summary Average travel speed increased 14.2 % for trucks (From 39.4 mph to 46.0 mph) 5.6% for cars (From 44.6 to 47.3 mph) 6.9% for all (From 43.8 to 47.1 mph) 52
53 Future Truck Simulation Studies Study operational effects of: Lower market penetration rates Longer desired gaps between trucks Aggressive lane changers Network-wide effects such as Travel time distribution Effects on complete trips Energy savings by trucks and all traffic 53
54 Concluding Comments Much to learn from full-scale testing of CACC vehicles combined with detailed simulations of traffic impacts Complementary methods for handling different effects Simulation models must be developed and used very carefully to produce realistic results Effects are subtle and require careful study V2V coordination is key to achieving traffic and energy saving benefits 54
Assessing the Traffic and Energy Impacts of Connected and Automated Vehicles (CAVs)
") Assessing the Traffic and Energy Impacts of Connected and Automated Vehicles (CAVs) Steven E. Shladover, Sc.D. (Retired from) California PATH Program University of California, Berkeley SIP-adus Workshop
Assessing the Traffic and Energy Impacts of Connected and Automated Vehicles (CAVs) Steven E. Shladover, Sc.D. (Retired from) California PATH Program University of California, Berkeley SIP-adus Workshop
Evaluation of the ACC Vehicles in Mixed Traffic: Lane Change Effects and Sensitivity Analysis
 CALIFORNIA PATH PROGRAM INSTITUTE OF TRANSPORTATION STUDIES UNIVERSITY OF CALIFORNIA, BERKELEY Evaluation of the ACC Vehicles in Mixed Traffic: Lane Change Effects and Sensitivity Analysis Petros Ioannou,
unsignalized signalized isolated coordinated Intersections roundabouts Highway Capacity Manual level of service control delay
 Whether unsignalized or signalized, isolated or coordinated, you can use TransModeler to simulate intersections with greater detail and accuracy than any other microsimulation software. TransModeler allows
ENHANCED PARKWAY STUDY: PHASE 2 CONTINUOUS FLOW INTERSECTIONS. Final Report
 Preparedby: ENHANCED PARKWAY STUDY: PHASE 2 CONTINUOUS FLOW INTERSECTIONS Final Report Prepared for Maricopa County Department of Transportation Prepared by TABLE OF CONTENTS Page EXECUTIVE SUMMARY ES-1
EVALUATION OF METHODOLOGIES FOR THE DESIGN AND ANALYSIS OF FREEWAY WEAVING SECTIONS. Alexander Skabardonis 1 and Eleni Christofa 2
 EVALUATION OF METHODOLOGIES FOR THE DESIGN AND ANALYSIS OF FREEWAY WEAVING SECTIONS Alexander Skabardonis 1 and Eleni Christofa 2 1: University of California, Berkeley, Institute of Transportation Studies,
Signal control and driver behaviour
 Signal control and driver behaviour Traffic signal conference at Teknologidagene 2017 26 th of October 2017, Clarion Hotel and Congress, Trondheim Arvid Aakre Traffic Engineering Research Centre Department
Chapter Capacity and LOS Analysis of a Signalized I/S Overview Methodology Scope Limitation
 Chapter 37 Capacity and LOS Analysis of a Signalized I/S 37.1 Overview The Highway Capacity Manual defines the capacity as the maximum howdy rate at which persons or vehicle can be reasonably expected
Lane changing and merging under congested conditions in traffic simulation models
 Urban Transport 779 Lane changing and merging under congested conditions in traffic simulation models P. Hidas School of Civil and Environmental Engineering, University of New South Wales, Australia Abstract
Automatisch rijden, het gedrag van bestuurders en verkeersstromen
 Automatisch rijden, het gedrag van bestuurders en verkeersstromen Bart van Arem EVU Symposium, 9 september 2016, Postillion Hotel Amersfoort Veluwemeer Rivium Buses (Rotterdam) 2013: DAVI on the road 2016:
7.0 FREEWAYS CONGESTION HOT SPOT PROBLEM & IMPROVEMENT PROJECT ANALYSIS & DEFINITION
 7.0 FREEWAYS CONGESTION HOT SPOT PROBLEM & IMPROVEMENT PROJECT ANALYSIS & DEFINITION 7.1 INTRODUCTION & METHODOLOGY FEASIBILITY REPORT Congestion hot spot problem locations have been assessed using the
Traffic flow optimization at sags by controlling the acceleration of some vehicles
 Traffic flow optimization at sags by controlling the acceleration of some vehicles? Bernat Goñi-Ros Delft University of Technology b.goniros@tudelft.nl TGF 15 Nootdorp (Netherlands) / 28 Oct. 2015 Characteristics
Evaluating Roundabout Capacity, Level of Service and Performance
 Roundabouts with Metering Signals ITE 2009 Annual Meeting, San Antonio, Texas, USA, August 9-12, 2009 Evaluating Roundabout Capacity, Level of Service and Performance Presenter: Rahmi Akçelik rahmi.akcelik@sidrasolutions.com
A simulation study of using active traffic management strategies on congested freeways
 Journal of Modern Transportation Volume 20, Number 3, September 2012, Page 178-184 Journal homepage: jmt.swjtu.edu.cn DOI: 10.1007/BF03325796 A simulation study of using active traffic management strategies
Core of Rosslyn Transportation Study Existing Conditions Report - Appendix. Appendix E: VISSIM Model Calibration Summary
 Core of Rosslyn Transportation Study Existing Conditions Report - Appendix Appendix E: Model Calibration Summary Core of Rosslyn Transportation Study Model Calibration Summary 5.9.218 Model Calibration
Variables influencing lane changing behaviour of heavy vehicles
 Variables influencing lane changing behaviour of heavy vehicles Sara Moridpour 1, Majid Sarvi 1, Geoff Rose 1 and Euan Ramsay 1,2 1 Institute of Transport Studies, Monash University 2 Department of Transport,
Traffic Signal Design
 Traffic Signal Design Instructor: S. M. Mahdi Amiripour m.amiripour@gmail.com 2 Introduction Intersection is an area shared by two or more roads Designated for the vehicles to turn to different directions
Simulating Street-Running LRT Terminus Station Options in Dense Urban Environments Shaumik Pal, Rajat Parashar and Michael Meyer
 Simulating Street-Running LRT Terminus Station Options in Dense Urban Environments Shaumik Pal, Rajat Parashar and Michael Meyer Abstract The Exposition Corridor transit project is a light rail project
Roundabouts in Australia: the state of the art on models and applications
 Roundabouts in Australia: the state of the art on models and applications Seminar Presentation One-day International Meeting on Roundabouts Università di Pisa - Corso di TECNICA del TRAFFICO, Livorno,
EFFICIENCY OF TRIPLE LEFT-TURN LANES AT SIGNALIZED INTERSECTIONS
 EFFICIENCY OF TRIPLE LEFT-TURN LANES AT SIGNALIZED INTERSECTIONS Khaled Shaaban, Ph.D., P.E., PTOE (a) (a) Assistant Professor, Department of Civil Engineering, Qatar University (a) kshaaban@qu.edu.qa
UFLTI Seminar. Capacity and Delay Implications of Connected and Automated Vehicles at Signalized Intersections. Alexander Skabardonis
 UFLTI Seminar Capacity and Delay Implications of Connected and Automated Vehicles at Signalized Intersections Toronto, 1959 Los Angeles, 2009 Alexander Skabardonis Gainesville, March 26, 2018 Abstract
Intersection of Massachusetts Avenue and Maple Street in Lexington Signalized Intersection and Roundabout Comparison
 Intersection of Massachusetts Avenue and Maple Street in Lexington Signalized Intersection and Roundabout Comparison Michael Wallwork, Roundabout Expert, Orange Park, Florida Tom Bertulis (MS, PE, PTOE),
BASIC FREEWAY CAPACITY STUDIES Definitions
 Definitions A freeway is a divided highway facility having two or more lanes in each direction for the exclusive use of traffic with full control of access and egress. Freeway is the only facility that
EXECUTIVE SUMMARY... vii 1 STUDY OVERVIEW Study Scope Study Area Study Objectives
 Contents EXECUTIVE SUMMARY... vii 1 STUDY OVERVIEW... 1-1 1.1 Study Scope... 1-1 1.2 Study Area... 1-1 1.3 Study Objectives... 1-3 2 EXISTING CONDITIONS... 2-1 2.1 Existing Freeway Conditions... 2-4 2.1.1
Final Technical Report RAILYARD ALIGNMENT AND BENEFITS STUDY. Appendix F: Traffic Analysis, I 280
 Final Technical Report RAILYARD ALIGNMENT AND BENEFITS STUDY Appendix F: Traffic Analysis, I 280 MEMORANDUM Date: To: From: Subject: Susan Gygi, San Francisco Planning Department Dennis Lee and Eric Womeldorff
HCM Sixth Edition. Plus More. Rahim (Ray) Benekohal University of Illinois at Urban Champaign,
 Benekohal University of Illinois at Urban Champaign,") HCM Sixth Edition What s New in the HCM Sixth Edition Plus More Rahim (Ray) Benekohal University of Illinois at Urban Champaign, 65 th Traffic Engineering and Safety Conference October 19 20, 2016 Institute
HCM Sixth Edition What s New in the HCM Sixth Edition Plus More Rahim (Ray) Benekohal University of Illinois at Urban Champaign, 65 th Traffic Engineering and Safety Conference October 19 20, 2016 Institute
Self-Organizing Signals: A Better Framework for Transit Signal Priority
 Portland State University PDXScholar TREC Friday Seminar Series Transportation Research and Education Center (TREC) 3-13-2015 Self-Organizing Signals: A Better Framework for Transit Signal Priority Peter
Traffic circles. February 9, 2009
 Traffic circles February 9, 2009 Abstract The use of a traffic circle is a relatively common means of controlling traffic in an intersection. Smaller Traffic circles can be especially effective in routing
Peloton Technology Platooning Test Nov 2013
 Michael Roeth Executive Director 6041 Stellhorn Road #15935 Fort Wayne, IN 46885 December 2, 2013 Josh Switkes CEO and Founder Peloton Technology Inc. 3553-3 Haven Avenue Menlo Park, CA 94025 Dear Josh:
Module 3 Developing Timing Plans for Efficient Intersection Operations During Moderate Traffic Volume Conditions
 Module 3 Developing Timing Plans for Efficient Intersection Operations During Moderate Traffic Volume Conditions CONTENTS (MODULE 3) Introduction...1 Purpose...1 Goals and Learning Outcomes...1 Organization
Chapter 4 Traffic Analysis
 Chapter 4 Traffic Analysis PURPOSE The traffic analysis component of the K-68 Corridor Management Plan incorporates information on the existing transportation network, such as traffic volumes and intersection
Arterial Traffic Analysis Actuated Signal Control
 Arterial Traffic Analysis Actuated Signal Control Dr. Gang-Len Chang Professor and Director of Traffic Safety and Operations Lab. University of Maryland-College Park Actuated Signal Control Fully Actuated
OBJECTIFICATION TECHNOLOGY OF PERCEIVED SAFETY & COMFORT DURING ASSISTED DRIVING
 OBJECTIFICATION TECHNOLOGY OF PERCEIVED SAFETY & COMFORT DURING ASSISTED DRIVING Erich Ramschak Dr. Jürgen Holzinger Erik Bogner AVL List GmbH erich.ramschak@avl.com ConCar-Forum Berlin 5.-6.July 2017
Basic Freeways and Multilane Highways (LOS) CIVL 4162/6162
 CIVL 4162/6162") Basic Freeways and Multilane Highways (LOS) CIVL 4162/6162 Learning Objectives Define uninterrupted facilities Determine LOS of Basic freeway segments Multilane highways Uninterrupted Flow Facilities Pure
Basic Freeways and Multilane Highways (LOS) CIVL 4162/6162 Learning Objectives Define uninterrupted facilities Determine LOS of Basic freeway segments Multilane highways Uninterrupted Flow Facilities Pure
Queue analysis for the toll station of the Öresund fixed link. Pontus Matstoms *
 Queue analysis for the toll station of the Öresund fixed link Pontus Matstoms * Abstract A new simulation model for queue and capacity analysis of a toll station is presented. The model and its software
An Investigation of Freeway Capacity Before and During Incidents
 An Investigation of Freeway Capacity Before and During Incidents Cuie Lu and Lily Elefteriadou Department of Civil and Coastal Engineering University of Florida March 4, 2011 Outline Database and Analysis
Evaluation and further development of car following models in microscopic traffic simulation
 Urban Transport XII: Urban Transport and the Environment in the 21st Century 287 Evaluation and further development of car following models in microscopic traffic simulation P. Hidas School of Civil and
I-95 Northbound at US 1 (Exit 126) Design and Study Final Report
 Design and Study Final Report") I-95 Northbound at US 1 (Exit 126) Design and Study Final Report July 2018 Prepared by: Prepared for: TABLE OF CONTENTS 1 Introduction... 1 Study Area Limits... 1 Purpose and Need of the Study... 1 Safety
I-95 Northbound at US 1 (Exit 126) Design and Study Final Report July 2018 Prepared by: Prepared for: TABLE OF CONTENTS 1 Introduction... 1 Study Area Limits... 1 Purpose and Need of the Study... 1 Safety
Introduction Roundabouts are an increasingly popular alternative to traffic signals for intersection control in the United States. Roundabouts have a
 HIGH-CAPACITY ROUNDABOUT INTERSECTION ANALYSIS: GOING AROUND IN CIRCLES David Stanek, PE and Ronald T. Milam, AICP Abstract. Roundabouts have become increasingly popular in recent years as an innovative
MEMORANDUM. Date: September 22, Don Skillingstad, Spokane Transit Authority. Yongliang Zhu, Lochner
 MEMORANDUM Date: September 22, 2014 To: Don Skillingstad, Spokane Transit Authority From: Yongliang Zhu, Lochner Re: Attachments: Median Flyer Stop Weave Analysis West Plains Transit Center IJR Project
METHODOLOGY. Signalized Intersection Average Control Delay (sec/veh)
") Chapter 5 Traffic Analysis 5.1 SUMMARY US /West 6 th Street assumes a unique role in the Lawrence Douglas County transportation system. This principal arterial street currently conveys commuter traffic
Chapter 5 Traffic Analysis 5.1 SUMMARY US /West 6 th Street assumes a unique role in the Lawrence Douglas County transportation system. This principal arterial street currently conveys commuter traffic
SIDRA INTERSECTION 6.1 UPDATE HISTORY
 Akcelik & Associates Pty Ltd PO Box 1075G, Greythorn, Vic 3104 AUSTRALIA ABN 79 088 889 687 For all technical support, sales support and general enquiries: support.sidrasolutions.com SIDRA INTERSECTION
aasidra for Roundabouts INTRODUCTION
 aasidra for Roundabouts INTRODUCTION Rahmi Akçelik Director, Akcelik & Associates Pty Ltd Adjunct Professor, Monash University Mark Besley Director, Akcelik & Associates Pty Ltd TRB Roundabout Conference
Reducing randomness: the advent of self driving cars
 Reducing randomness: the advent of self driving cars Prof Dr Ir Bart van Arem TU Delft, Faculty of Civil Engineering and Geosciences Department Transport & Planning 1 Your speaker 1982-1986 MSc, Qeueing
2009 PE Review Course Traffic! Part 1: HCM. Shawn Leight, P.E., PTOE, PTP Crawford Bunte Brammeier Washington University
 2009 PE Review Course Traffic! Part 1: HCM Shawn Leight, P.E., PTOE, PTP Crawford Bunte Brammeier Washington University sleight@cbbtraffic.com Topic Areas Highway Capacity Manual Highway Capacity Analysis
Design and Evaluation of Adaptive Traffic Control System for Heterogeneous flow conditions
 Design and Evaluation of Adaptive Traffic Control System for Heterogeneous flow conditions Tom Mathew IIT Bombay Outline 1. Heterogeneous traffic 2. Traffic Simulation 3. Traffic Signal control 4. Adaptive
Operational Comparison of Transit Signal Priority Strategies
 Operational Comparison of Transit Signal Priority Strategies Revision Submitted on: November, 0 Author: Adriana Rodriguez, E.I Assistant Engineer Parsons Brinckerhoff 0 South Orange Avenue, Suite 00 Orlando,
Defining Purpose and Need
 Advanced Design Flexibility Pilot Workshop Session 4 Jack Broz, PE, HR Green May 5-6, 2010 Defining Purpose and Need In your agency s project development process, when do design engineers typically get
Title: Modeling Crossing Behavior of Drivers and Pedestrians at Uncontrolled Intersections and Mid-block Crossings
 Title: Modeling Crossing Behavior of Drivers and Pedestrians at Uncontrolled Intersections and Mid-block Crossings Objectives The goal of this study is to advance the state of the art in understanding
Measuring and Assessing Traffic Congestion: a Case Study
 AITPM 2014 National Conference Adelaide, 12-15 August 2014 Measuring and Assessing Traffic Congestion: a Case Study Cennet Yumlu, Sara Moridpour and Rahmi Akçelik Presenter: Rahmi Akçelik sidrasolutions.com
Roundabout Design 101: Roundabout Capacity Issues
 Design 101: Capacity Issues Part 2 March 7, 2012 Presentation Outline Part 2 Geometry and Capacity Choosing a Capacity Analysis Method Modeling differences Capacity Delay Limitations Variation / Uncertainty
Roundabouts along Rural Arterials in South Africa
 Krogscheepers & Watters 0 0 Word count: 00 text + figures = 0 equivalent words including Title and Abstract. Roundabouts along Rural Arterials in South Africa Prepared for: rd Annual Meeting of Transportation
MILTON ROAD ~ MITCHAM'S CORNER PARAMICS MODEL INITIAL OPTION TESTING
 MILTON ROAD ~ MITCHAM'S CORNER PARAMICS MODEL INITIAL OPTION TESTING NOVEMBER 216 MILTON ROAD ~ MITCHAM'S CORNER PARAMICS MODEL INITIAL OPTION TESTING Cambridgeshire County Council Type of document (version)
The calibration of vehicle and pedestrian flow in Mangalore city using PARAMICS
 Urban Transport XX 293 The calibration of vehicle and pedestrian flow in Mangalore city using PARAMICS S. K. Prusty, R. Phadnis & Kunal National Institute Of Technology Karnataka, India Abstract This paper
Evaluation of the Dynamic Lane Management System at the SR-110 North / I-5 North Connector Ramp Using Paramics and TOPL
 CALIFORNIA PARTNERS FOR ADVANCED TRANSPORTATION TECHNOLOGIES INSTITUTE OF TRANSPORTATION STUDIES UNIVERSITY OF CALIFORNIA, BERKELEY Evaluation of the Dynamic Lane Management System at the SR-11 North /
Simulation of Arterial Traffic Using Cell Transmission Model
 1 Simulation of Arterial Traffic Using Cell Transmission Model Dongyan Su University of California, Berkeley 2167c Etcheverry Hall, University of California, Berkeley, CA 94720-1740 Tel: 1-510-928-8771,
Development and Evaluations of Advanced Emergency Braking System Algorithm for the Commercial Vehicle
 Development and Evaluations of Advanced Emergency Braking System Algorithm for the Commercial Vehicle Taeyoung, Lee Kyongsu, Yi School of Mechanical and Aerospace Engineering, Seoul National University
Vehicle and Occupancy data collection on I-15 HOV & GP Lanes in Salt Lake Valley, Utah
 Vehicle and Occupancy data collection on I-15 & Lanes in Salt Lake Valley, Utah Technical Report Author: Abhro Mitra (Graduate Student) Department of Civil & Environmental Engineering, 122 S. Central Campus
Introduction to Roundabout Analysis Using ARCADY
 Introduction to Roundabout Analysis Using ARCADY Toronto SimCap User Group Technical Event and ITE Toronto Section Social Event July 22, 2014 Phil Weber, P.Eng. GHD Inc. (The Home of Ourston Roundabout
Roundabout Model Calibration Issues and a Case Study
 Roundabout Model Calibration Issues and a Case Study TRB National Roundabout Conference Vail, Colorado, USA, 22-25 May 2005 Pictures modified to show driving on the right-hand side of the road Rahmi Akçelik
Comparative Study of VISSIM and SIDRA on Signalized Intersection
 Available online at www.sciencedirect.com ScienceDirect Procedia - Social and Behavioral Scien ce s 96 ( 2013 ) 2004 2010 13th COTA International Conference of Transportation Professionals (CICTP 2013)
Designing a Traffic Circle By David Bosworth For MATH 714
 Designing a Traffic Circle By David Bosworth For MATH 714 Abstract We all have had the experience of sitting in a traffic jam, or we ve seen cars bunched up on a road for some no apparent reason. The use
Washington DC Section of ITE Project Briefing
 Washington DC Section of ITE Project Briefing November 5, 2015 Renée Hamilton, VDOT, Deputy District Administrator I-66 Outside the Beltway Improvement Area Project Location Virginia 2 Purpose and Need
Motorway-to-motorway: a potential technological solution to motorway congestion
 108 Roger Higginson Principal Engineer Intelligent Transport Systems Atkins Jill Hayden Principal Engineer Intelligent Transport Systems Atkins Sukhvinder Ubhi Project Sponsor Highways Agency Motorway-to-motorway:
Appendix B: Forecasting and Traffic Operations Analysis Framework Document
 Existing Conditions Report - Appendix Appendix B: Forecasting and Traffic Operations Analysis Framework Document This document defines the methodology and assumptions that will be used in the traffic forecasting
GEARY BRT SIMULATION VISSIM Calibration and Existing Conditions Results
 GEARY BRT SIMULATION VISSIM Calibration and Existing Conditions Results Geary BRT Citizens Advisory Committee February 17, 2011 www.gearybrt.org Presentation Objectives 1. Overview of modeling process
Analysis of Weaving, Merging, and Diverging Movements CIVL 4162/6162
 Analysis of Weaving, Merging, and Diverging Movements CIVL 4162/6162 Weaving, Diverging, Merging Segments Weaving one movement must cross the path of another along a length of facility without the aid
CAPACITY, LEVEL OF SERVICE, FUNDAMENTALS OF HIGHWAY CAPACITY ANALYSIS
 CAPACITY, LEVEL OF SERVICE, FUNDAMENTALS OF HIGHWAY CAPACITY ANALYSIS 1. GENERAL Transportation facilities can be classified into two categories of flow: uninterrupted and interrupted. Uninterrupted-flow
Managed Lanes. Steve Schilke, P.E. Major Projects Unit Head District 1. Illinois Traffic Engineering and Safety Conference October 2016
 Managed Lanes Steve Schilke, P.E. Major Projects Unit Head District 1 Illinois Traffic Engineering and Safety Conference October 2016 Agenda Managed Lanes Projects I-55 (Stevenson Expressway) Express Toll
Toronto SimCap Toronto, ON, Canada, July 2014 SIDRA INTERSECTION 6. sidrasolutions.com sidrasolutions.com/forums youtube.
 Toronto SimCap Toronto, ON, Canada, July 2014 SIDRA INTERSECTION 6 sidrasolutions.com sidrasolutions.com/forums youtube.com/sidrasolutions Our company Multi-Award Winning Company 2010 Victorian Small Business
AN APPROACH FOR ASSESSMENT OF WEAVING LENGTH FOR MID-BLOCK TRAFFIC OPERATIONS
 International Journal for Traffic and Transport Engineering, 215, 5(4): 442-45 UDC: 625.739 DOI: http://dx.doi.org/1.778/ijtte.215.5(4).8 AN APPROACH FOR ASSESSMENT OF WEAVING LENGTH FOR MID-BLOCK TRAFFIC
Stanley Street/Shotover Street, Queenstown. Traffic Modelling Report
 Stanley Street/Shotover Street, Queenstown Traffic Modelling Report Stanley Street/Shotover Street, Queenstown Traffic Modelling Report Prepared By Chris Morahan Transportation Engineer/Traffic Modeller
CAPACITY ESTIMATION OF URBAN ROAD IN BAGHDAD CITY: A CASE STUDY OF PALESTINE ARTERIAL ROAD
 VOL. 13, NO. 21, NOVEMBER 218 ISSN 1819-668 26-218 Asian Research Publishing Network (ARPN). All rights reserved. CAPACITY ESTIMATION OF URBAN ROAD IN BAGHDAD CITY: A CASE STUDY OF PALESTINE ARTERIAL ROAD
Interchange Access Management
 The Kiewit Center for Infrastructure and Transportation Interchange Access Management Discussion Paper #4 by Robert Layton Kiewit -2012/05 May 2012 The Kiewit Center for Infrastructure and Transportation
Evaluation of Work Zone Strategies at Signalized Intersections
 Evaluation of Work Zone Strategies at Signalized Intersections Khaled Shaaban Qatar University/Department of Civil and Architectural Engineering, Doha, Qatar Email: kshaaban@qu.edu.qa Dina Elnashar Qatar
URBAN STREET CONCEPTS
 CHAPTER 10 URBAN STREET CONCEPTS CONTENTS I. INTRODUCTION... 10-1 II. URBAN STREETS...10-1 Flow Characteristics... 10-3 Free-Flow Speed...10-3 Running Speed... 10-3 Travel Speed... 10-4 Time-Space Trajectory...10-4
Development of an Optimal Ramp Metering Control Strategy for I-12
 Development of an Optimal Ramp Metering Control Strategy for I-12 LSU Research Team Sherif S. Ishak, Osama Osman, Saleh Mousa, Sogand Karblaieali, Peter Bakhit 2 Outline Introduction Objectives Study area
Simulated Analysis of Exclusive Bus Lanes on Expressways: Case Study in Beijing, China
 Simulated Analysis of Exclusive Bus Lanes on Expressways: Case Study in Beijing, China Simulated Analysis of Exclusive Bus Lanes on Expressways: Case Study in Beijing, China Lin Zhu, Beijing Jiaotong University
Unit 7 Speed, Travel Time and Delay Studies
 Unit 7 Speed, Travel Time and Delay Studies Introduction Speed, travel time and delay are all related measures that are common used as indicators of performance for traffic facilities Measure of Effectiveness
Subject: Solberg Avenue / I-229 Grade Separation: Traffic Analysis
 MEMORANDUM Transportation Bill Troe, AICP Jason Carbee, AICP 12120 Shamrock Plaza Suite 300 Omaha, NE 68154 (402) 334-8181 (402) 334-1984 (Fax) To: Project File Date: Subject: Solberg Avenue / I-229 Grade
DELAY, STOP AND QUEUE ESTIMATION FOR UNIFORM AND RANDOM TRAFFIC ARRIVALS AT FIXED-TIME SIGNALIZED INTERSECTIONS
 DELAY, STOP AND QUEUE ESTIMATION FOR UNIFORM AND RANDOM TRAFFIC ARRIVALS AT FIXED-TIME SIGNALIZED INTERSECTIONS Youn-Soo Kang Dissertation submitted to the Faculty of the Virginia Polytechnic Institute
Santa Clara I-280 CORRIDOR STUDY
 Santa Clara I-280 CORRIDOR STUDY OCTOBER 2017 PREPARED BY: 1.1 Background The I-280 Corridor Study within Santa Clara County is a high-level highway planning study led by the Santa Clara VTA, in partnership
A Traffic Operations Method for Assessing Automobile and Bicycle Shared Roadways
 A Traffic Operations Method for Assessing Automobile and Bicycle Shared Roadways A Thesis Proposal By James A. Robertson Submitted to the Office of Graduate Studies Texas A&M University in partial fulfillment
INTERSECTIONS AT GRADE INTERSECTIONS
 INTERSECTIONS 1 AT GRADE INTERSECTIONS INTERSECTIONS INTERSECTIONS = INTERRUPTED FACILITIES Definitions and key elements An intersection is defined as an area where two or more roadways join or cross.
Traffic: an Interplay between Models, Simulations, and Control Actions
 Traffic: an Interplay between Models, Simulations, and Control Actions Sven Maerivoet DWTC Katholieke Universiteit Leuven Department of Electrical Engineering ESAT-SCD (SISTA) Friday Seminar 05/03/2004
A Conceptual Approach for Using the UCF Driving Simulator as a Test Bed for High Risk Locations
 A Conceptual Approach for Using the UCF Driving Simulator as a Test Bed for High Risk Locations S. Chundi, M. Abdel-Aty, E. Radwan, H. Klee and E. Birriel Center for Advanced Transportation Simulation
Concurrent Monitoring, Analysis, and Visualization of Freeway and Arterial Performance for Recurring and Non-recurring Congestion
 Concurrent Monitoring, Analysis, and Visualization of Freeway and Arterial Performance for Recurring and Non-recurring Congestion For Presentation at the NATMEC 2010 Session on: Congestion Monitoring and
Evacuation Time Minimization Model using Traffic Simulation and GIS Technology
 Evacuation Time Minimization Model using Traffic Simulation and GIS Technology Daisik Danny Nam, Presenter Ph.D. Student Department of Civil and Environmental Engineering, University of California, Irvine
3 TRAFFIC CONTROL SIGNAL TIMING AND SYNCHRONIZATION
 Report No. 8 of the Transportation Services Committee Regional Council Meeting of October 20, 2011 3 TRAFFIC CONTROL SIGNAL TIMING AND SYNCHRONIZATION The Transportation Services Committee recommends:
Probabilistic Models for Pedestrian Capacity and Delay at Roundabouts
 Probabilistic Models for Pedestrian Capacity and Delay at Roundabouts HEUNGUN OH Doctoral Candidate VIRGINIA P. SISIOPIKU Assistant Professor Michigan State University Civil and Environmental Engineering
ROUNDABOUT MODEL COMPARISON TABLE
 Akcelik & Associates Pty Ltd PO Box 1075G, Greythorn, Vic 3104 AUSTRALIA info@sidrasolutions.com Management Systems Registered to ISO 9001 ABN 79 088 889 687 ROUNDABOUT MODEL COMPARISON TABLE Prepared
Ch Driving on Expressways. Characteristics of Expressway Driving. Expressway. Types of Expressways. Why do they have fewer collisions?
 Ch 11 Driving on Expressways 11.1 Characteristics of Expressway Driving Expressway Is a limited-access or controlled-access highway. Types of Expressways Interstate highways Freeways Parkways * Most of
SIMULATION-BASED CAPACITY ESTIMATION OF ARTERIAL WORKZONES
 SIMULATION-BASED CAPACITY ESTIMATION OF ARTERIAL WORKZONES By MAYANK PRAKASH JAIN A THESIS PRESENTED TO THE GRADUATE SCHOOL OF THE UNIVERSITY OF FLORIDA IN PARTIAL FULFILLMENT OF THE REQUIREMENTS FOR THE
Mathematics of Planet Earth Managing Traffic Flow On Urban Road Networks
 Mathematics of Planet Earth Managing Traffic Flow On Urban Road Networks Adrian George Manager Network Improvements Anthony Fitts Manager Signal Design Melbourne s transport demands are growing 5m people
Impact of Signalized Intersection on Vehicle Queue Length At Uthm Main Entrance Mohd Zulhilmi Abdul Halim 1,b, Joewono Prasetijo 2,b
 Impact of Signalized Intersection on Vehicle Queue Length At Uthm Main Entrance Mohd Zulhilmi Abdul Halim 1,b, Joewono Prasetijo 2,b 1,2 Smart Driving Research Center, Faculty of Civil and Environmental
Highway Capacity Manual 2010
 Exhibit 10-13 Defining Analysis Segments for a Weaving Configuration L S = Short Length, ft 500 ft 500 ft L B = Base Length, ft L WI = Weaving Influence Area, ft (a) Case I: L B L wmax (weaving segment
A New Lane-Based Model for Platoon Patterns at Closely-Spaced Signalised Intersections
 Akcelik & Associates Pty Ltd PO Box 1075G, Greythorn, Vic 3104 AUSTRALIA info@sidrasolutions.com Management Systems Registered to ISO 9001 ABN 79 088 889 687 REPRINT A New Lane-Based Model for Platoon
Chapter 7 Intersection Design
 hapter 7 Dr. Yahya Sarraj Faculty of Engineering The Islamic University of Gaza An intersection is an area, shared by two or more roads, whose main function is to provide for the change of route directions.
Sensitivity of Equilibrium Flows to Changes in Key Transportation Network Parameters
 Sensitivity of Equilibrium Flows to Changes in Key Transportation Network Parameters Sara Moridpour Department of Civil Engineering Monash University, Melbourne, Victoria, Australia 1 Introduction In transportation
1.3.4 CHARACTERISTICS OF CLASSIFICATIONS
 Geometric Design Guide for Canadian Roads 1.3.4 CHARACTERISTICS OF CLASSIFICATIONS The principal characteristics of each of the six groups of road classifications are described by the following figure
Truck Climbing Lane Traffic Justification Report
 ROUTE 7 (HARRY BYRD HIGHWAY) WESTBOUND FROM WEST MARKET STREET TO ROUTE 9 (CHARLES TOWN PIKE) Truck Climbing Lane Traffic Justification Report Project No. 6007-053-133, P 101 Ι UPC No. 58599 Prepared by: