EASTERN SHORE ALTERNATIVE TRANSPORTATION MODE STUDY FOR DISABLED, ELDERLY, LOW-INCOME, AND YOUTH POPULATION
|
|
|
- Melanie Farmer
- 5 years ago
- Views:
Transcription

1 EASTERN SHORE ALTERNATIVE TRANSPORTATION MODE STUDY FOR DISABLED, ELDERLY, LOW-INCOME, AND YOUTH POPULATION Accomack-Northampton Planning District Commission Eastern Shore of Virginia Transportation Technical Advisory Committee December 2006 Prepared in cooperation with the Virginia Department of transportation. The contents of this report reflect the views of the Accomack Northampton Planning District Commission. The Commission is responsible for the facts and the accuracy of the data presented herein. The contents do not necessarily reflect the official views or policies of the Virginia Department of transportation. This report does not constitute a standard, specification, or regulation.
2 TABLE OF CONTENTS I. INTRODUCTION...1 II. INVENTORY AND ANALYSIS...2 Transportation Workshops Inventory Patterns of Transportation Use Carpooling Working at Home, Walking, Bicycling Bus Transportation Consumers Young Transportation Consumers Senior Transportation Consumers Persons with a Disability Low-income Consumers STAR Transit III. NEEDS ASSESSMENT...8 IV. RECOMMENDATIONS...9 Land Use Bicycling and Walking STAR Transit APPENDICES APPENDIX A APPENDIX B APPENDIX C APPENDIX D APPENDIX E STAR Transit Route Maps STAR Transit Route Demand History Existing Routes Implementation Strategy for Recommended STAR Transit Routes Transit Passenger Comparisons between Existing Routes and Recommended Routes Detailed Neighborhood Maps with Recommended STAR Transit Routes Alternative Transportation Mode Study
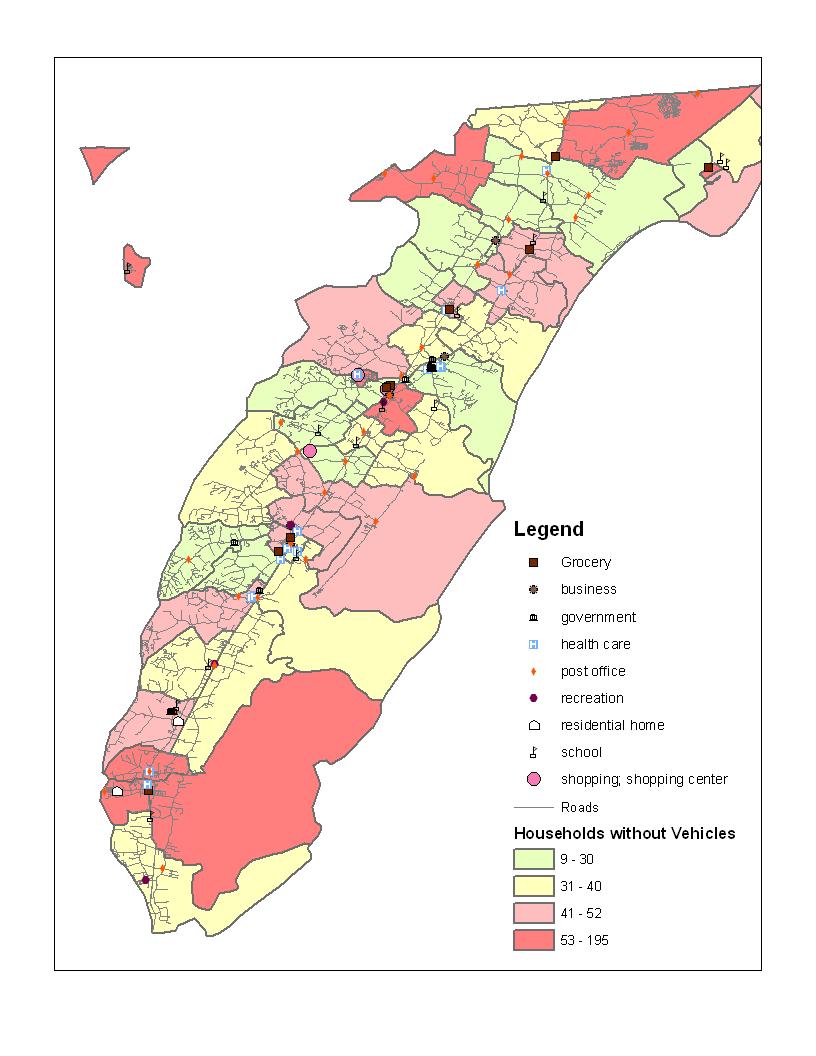
3 INTRODUCTION At the February 9, 2005 meeting of the Accomack-Northampton Planning District Commission Transportation Technical Advisory Committee, Abra Jacobs of the Center for Independent Living requested that the Committee consider transit service for persons with disabilities. In the ensuing discussion, the Committee considered this and other alternative transportation issues, adopting a motion to study these issues. At that time, a new state pilot program was available and the Committee obtained funding to conduct the study. The study focuses on transportation needs for low-income, disabled, elderly and youth populations. Northampton and Accomack were studied in detail. Census information showing population characteristics was used to determine if neighborhoods were lacking private vehicles and needed alternative transportation resources. The population characteristics looked at were vehicle count information, carpooling information, disability, age, and poverty levels. Much of this Census data is quite broad and individual neighborhoods could not be correlated well with the counts. County GIS data was used to create neighborhood indicator maps showing areas where financial resources may pinpoint exact locations where alternative transportation is needed. An inventory of major destinations was also compiled. Most of this material is provided in the appendices. Three public workshops were held and the results were used along with the study materials to make recommendations to improve transportation for elderly, youth and disabled populations in the counties. These recommendations endeavor to achieve transportation efficiency, as well as a high quality of life.
4 I. INVENTORY AND ANALYSIS By far, the dominant form of transportation is the private vehicle. On average, according to the Department of Labor Statistics 2004 Consumer Expenditures Survey, Americans spend 18.0% of their incomes on transportation, mostly in car ownership. Only shelter is a larger share of American household spending at 18.4%. Americans spend 17.0% of their incomes on car ownership while they spend on average just 1.0% on public transportation. This works out to an average cost of $4,413 per vehicle per year. The survey also shows that, on average, 88% of American households have at least one car available. Description of Activity Percent of Income Vehicle Purchase 7.8% Gasoline and Motor Oil 3.7% Other Vehicle Expenses 5.5% Source: U.S. Department of Labor Statistics, Consumer Expenditures Survey, 2004 The private vehicle is the most convenient mode of transportation in use on the Eastern Shore. However, it is not available to all people. The 2000 Census shows that 90.5% of Accomack County households have at least one car available; in Northampton County the figure is 87.4%. Alternative modes of transportation will always be needed. Transportation Workshops The Accomack-Northampton Planning District Commission held three public workshops on alternative transportation. They were held in the Accomack County on March 14, 2006, the Town of Chincoteague on April 8, 2006, and in Northampton County on April 19, Participants identified specific transportation needs on the Eastern Shore. Most of the needs focused on STAR Transit. Needs included building bus shelters in some areas, adding a demand response route to Northampton County, increasing the demand response area in Accomack County, improving connections between the buses, having longer hours of service and adding weekend service, and adding a connection across the Chesapeake Bay to Hampton Roads. Chincoteague residents added that bus service needed to be advertised on the Island. In addition to the public workshop, A-NPDC staff met with STAR Transit s manager and staff to discuss the public s concerns. Ms. Ardolino, Transit Manager, explained that there is a demand response for Northampton County called the Ruby Express but its currently not in service since there is no driver for the route. Ms. Ardolino also explained that a connection from the Eastern Shore to Hampton Roads was available for two years but the passenger numbers never made the link viable. It cost STAR Transit $60,000 a year in tolls to get across the Chesapeake Bay Bridge Tunnel three times a day. Virginia s Department of Rail and Public Transit will not subsidize that route again
5
6
7 unless Northampton County puts up 30-32% of the cost of the route. Operational issues also create difficulties for alternative transportation consumers including: lack of STAR Transit drivers, significant delays in fixed route bus pickup due to call in activity, and long load times for persons in wheelchairs also leading to delay in fixed route bus pickup. Lack of destinations also reduces demand. After the local K-Mart closed, bus trips declined drastically. Other issues were identified during the Workshops including a problem with underage driving of three wheeled mopeds on Chincoteague Island, and the need for more bicycle paths on the Eastern Shore. Inventory Staff members completed an inventory of major employers, housing facilities, major shopping facilities, schools, and recreation. Excluding post offices, there are approximately 4,100 buildings within a quarter of a mile radius of the major destinations. A quarter of a mile radius is the distance people will choose to walk instead of driving a car so long as there is a safe and convenient pathway. Including post offices there are approximately 7,700 buildings within a quarter mile of these major destinations. The inventory shows that the major concentrations of destinations are in Exmore, the Onancock-Onley-Accomac area, and Chincoteague. A new major destination is expected in Onley. This new store will likely serve as a hub of the community. Approximately 30% of all the major destinations are located in the Onley-Onancock-Accomac area. Over 5,500 people live in these Towns or within one mile of them. This represents 15% of the population of Accomack County and 11% of the population of the entire Eastern Shore. Over 4,300 live on Chincoteague Island representing 11% of Accomack County s population and a little over 8% of the population of the entire Eastern Shore. The Town of Exmore sits along the border of Accomack and Northampton County. Over 2,700 people live in the Town or within one mile. This represents 5% of the Eastern Shore s population but taking out Accomack County residents almost 17% of the population of Northampton County live in this area. Patterns of Transportation Use Based on commuter data, private vehicles are used for 77% of trips in Accomack and 71% of trips in Northampton. Carpooling, the second most common commuter option, makes up another 14% in Accomack and 16% in Northampton. The remaining choices make up 9% in Accomack and 13% in Northampton. Means Accomack Co. Percentage Northampton Co. Percentage Private Vehicle 12,503 77% 3,603 71% Carpooling 2,336 14% % Work at home 454 3% 238 5% Walk 422 3% 200 4% Bus 256 2% 109 2% Bicycle 100 1% 15 0% Source: 2000 Census, Commuting Data The data shows that the most viable alternatives to private vehicles are working at home, walking,
8 riding the bus or riding a bike. In all these cases, proximity to employment and shopping centers is critical. Carpooling. There were 3,152 people reliant on a carpool to get to work in Detailed Census information for Accomack County shows 552 people, 24% of all carpoolers, were using a carpool that held 3 or more workers. That information also shows that in Northampton County 239, 29% of all carpoolers, were using a carpool of 3 or more workers. The Homeless Intervention Program and the Housing Choice Voucher Program have both seen clients or applicants that lost their jobs due to unreliable transportation. In some cases, the cause of the problem was the driver of their carpool was sick, quit, or was unreliable. Working at Home, Walking, Bicycling. There were 1,429 people working at home, walking, or bicycling to work. These are all dependent on proximity to work. According to Goodridge 1, bicycling to work is most beneficial for those people without cars who have to travel over ½ mile to get to work. Yet according to Eno Transportation Foundation research, the average bicycle commute is 3.5 miles and takes 16 minutes. This indicates that if a commute is under ½ mile the worker, without a car, will choose to walk. Informal paths exist across and along parts of U.S. Route 13. People walk along these to local destinations. Some that were identified are along Route 13 in Nassawadox on the west side of the road. Several Route 13 crossings exist, generally these are at places where the there is residential housing on one side of the road and a convenience or general store on the other side. Bus Transit Service. STAR Transit is the only year-round bus line available in Accomack and Northampton Counties. Using the Census 2000 data, 365 people say they used a bus to get to work. STAR Transit ridership for the year 1999, the year people were asked about, shows that the average ridership per month was 3,295 trips. If 365 full-time workers used STAR Transit in 1999 for fifty weeks, the average trips per month should be around 15,000. This may indicate that the workers were using STAR Transit but were part-time, or were only employed part of the year, or they may be using a private bus, or they may only use STAR Transit one way. Transportation Consumers Transportation consumers who need alternative transportation are varied but the younger and older you are the less likely a car is available. Households that rent their dwelling and minority households are less likely to have a car available. Persons with certain disabilities also need alternative transportation. 1 Land-Use, Climatic, Demographic, and Cultural Issues Affecting Utilitarian Bicycle Travel in the Triangle, Steven Goodridge, Cary Planning and Zoning Board, 2001, 12/11/06
9
10 Young Transportation Consumers Accomack County. Persons between the ages of 15 and 24 made up 12.4% of the population in Virginia Employment Commission Population Projections for the county have this age group staying relatively stable as a percentage of population over the next 30 years. Projections indicate that this age group will make up 12.9% in 2010, 11.9% in 2020, and 12.2% in Since the population in the county is projected to grow for the next 30 years young transportation consumers will increase from 4,760 in 2000 to 5,324 in 2010, decrease to 5,311 in 2020, and increase to 5,690 in Heads of households that are under the age of 25 have a median household income of $19,688 in Accomack County. This means that half of all these households make less than $19,688 while the other half make more. This age group has the second lowest median income. The 2000 Census shows that there were 595 households in the County that were in this group and 20.2% make less than $10,000. The 2000 Census shows that 13.8% of these households have no car available. Northampton County. In 2000, there were 1,503 people between the ages of 15 and 24, representing 11.5% of the population. This age group is projected to remain generally flat at 1,522 (12.3%) in 2010, decrease to 1,304 (10.7%) in 2020, and recover to 1,435 (12.0%) in Within the county, households headed by persons under the age of 25 have the second lowest median household income at $23,875. The 2000 Census shows that there were 121 households in the County that were in this group and 10.4% make less than $10,000. The 2000 Census shows that 8.2% of these households have no car available. Senior Transportation Consumers As people age, they need more transportation options. With age comes increased disability and decreased income, both factors make private vehicle transportation difficult. In both counties, the population is aging. There are 9,160 people over the age of 65 by 2030 there will be 14,638. Accomack County. Persons over the age of 65 made up 16.7% of the population in This amounted to 6,389 people. The population projection for Accomack in 2010 swells the numbers to 7,570 (18.3%) in 2010, 9,338 (21.0%) in 2020, and 11,519 (24.8%) in Householder Age Median Income Owners without a Car Percentage without a Car Renters without a Car Percentage without a Car $19, % % $30, % %
11 35-44 $34, % % $38, % % $28, % % $25, % % 75+ $17, % % Source: 2000 Census, Accomack County Northampton County. According to the 2000 Census, there were 2,771 persons (21.2%) over the age of 65. The population projection shows that at first the older population will decline to 2,441 (19.7%) in 2010, then increase to 2,794 (22.9%) in 2020, and increase to 3,119 (26.0%) in Householder Age Median Income Owners without a Car Percentage without a Car Renters without a Car Percentage without a Car $28, % % $23, % % $25, % % $33, % % $33, % % $27, % % 75+ $16, % % Source: 2000 Census, Northampton County Persons with a Disability According to the Virginia Board for People with Disabilities, 30% of people with disabilities work while 82% of people without disabilities work. Of those persons with a disability that do not work, 26% say that they would need accessible parking or a transportation stop to work. Accomack County. The 2000 Census shows that there were 7,608 people in Accomack County with a disability. This represents 21% of the entire population. Using demographic projections from the Virginia Employment Commission and current rates of disability, the disabled population is expected to increase to 8,700 in 2010, 9,600 in 2020 and 10,400 in By 2030, people with disabilities will make up 22% of the entire population. Age Groups Percentage that have at least One Disability % % % %
12 75+ 54% Source: 2000 Census, Accomack County Northampton County. The 2000 Census shows that there were 3,148 people in Northampton County with a disability. This represents 25% of the entire population. Using demographic projections from the Virginia Employment Commission and current rates of disability, the disabled population is expected to remain steady throughout the next two decades increasing to 3,600 in According to the Virginia Employment Commission, the County will lose population across all three decades. By 2030, people with disabilities will increase to 30% of the entire population. Age Groups Percentage that have at least One Disability % % % % % Source: 2000 Census, Northampton County Low-income Consumers According to the 2000 Census, the poverty line starts at $7,990 for a single person over the age of 65 with no family. A married couple with two children must make more than $16,895 to stay above the poverty line. Car ownership is not feasible for most families living in poverty. Owning and maintaining a car is a drain of crucial financial resources for all families living in poverty. Since the average cost of owning a vehicle is $4,413 per year and the cost of maintaining a house is similar, many families have to choose between transportation and shelter. For this reason, a reliable and affordable public transit system can open opportunities to families to improve their circumstances. Type of Household Poverty Line in 2000 Census Senior who lives alone $7,990 Married Senior Citizens $10,070 Single Person $8,667 Couple with 2 Children $16,895 Single Parent with 1 Child $11,483 Single Parent with 2 Children $13,423 Grandparent with 1 Grandchild $11,440 Accomack County. There are 6,788 people living in poverty in the County. Almost 36% of folks living in poverty have less than half of the poverty amount. Northampton County. There are 2,633 people living in poverty in the County. Over 38% of folks living in poverty have less than half of the poverty amount.
13 STAR Transit STAR Transit carried its first passenger in October At the time there were two routes the red and blue and that first month, 363 trips were made on the STAR Transit buses. STAR Transit had a local high peak of 4,627 individual trips in August 2002, just months before the local K-Mart closed. Since K-Mart has closed, ridership has never recovered to levels seen before January of Currently, stores, the hospital, and the Eastern Shore Community College are the major destinations accessible by transit. The 2006 routes are presented in Appendix A and rider trip demand graphs for all the current routes are presented in Appendix B. In October 2006, the Eastern Shore Community College stopped paying for transit rides on the Green Demand Response Route. The College is also suspending its program to pay for fixed routes in January Both of these decisions may reduce ridership. STAR Transit has never recovered from K-Mart closing. Six-month moving averages show that ridership has declined to amounts not seen since the end of Operational issues hamper efforts to improve service. Specifically a lack of drivers keeps the demand response route in Northampton County from operating. Delays in bus pickup cause difficulties for transit riders dependent on the bus system. Among workers in both counties, 791 people are relying on a carpool of 3 or more people instead of the bus system.
14
15 II. NEEDS ASSESSMENT Various needs were identified during the inventory and public workshops. Members of the public who took part in the public workshops wanted more access to employment and recreation. Many of their suggestions were to increase public transportation service on the Eastern Shore. Build Bus Shelters. Transit officials and members of the public both wanted to see additional bus shelters added to the routes. The Town of Exmore downtown area was one specific site where a shelter is needed. Increase Demand Response Area in Accomack County. At the public workshops, the demand response bus route in Accomack was praised as a key means to transport people from rural areas to their destinations. Participants wanted to see the demand response area in Accomack County grow in its reach. Demand Response Route in Northampton County. The public workshops identified the need for a demand response route in Northampton County. Transit officials noted the lack of a driver to operate the route in the County. Improve Connections between Bus Lines. In interviews with STAR Transit riders and the public workshops, participants want to see improved connections between bus routes and reduced waiting times for buses. Longer Hours of Service and Weekend Service. Participants at the public workshops said that they cannot work a full workday and use the bus. It is also difficult to work and also use the bus to take care of shopping needs since the hours of service do not run outside of their regular working hours. Participants also indicated that their shopping needs could occur outside of the regular week if there were weekend service. Across the Bay Service. In the past, this route was available. However, it was not successful and was canceled due to lack of ridership. Participants did request that it be considered at the public workshops for the primary purpose of entertainment and shopping in Hampton Roads. Transit officials stated that the cost of the route and its lack of riders means that Northampton County would need to subsidize the route before it would be reconsidered. Advertise Bus Service on Chincoteague Island. Bus schedules and service were not widely advertised on the island. Since the public workshop that identified this need, local officials have put some of this information on the public access channel for the island. Lack of STAR Transit Drivers. Transit officials noted that the lack of drivers has made expansion of the bus service difficult. Delays in Fixed Routes. Bus schedules are delayed when someone calls in taking a bus off its usual fixed route. Interviews with STAR Transit riders indicated that this causes issues for persons
16 waiting along the scheduled route. Long Load Time for Persons in Wheelchairs. Transit officials noted that bus routes are also delayed by excessive load times for persons in wheelchairs. The officials estimating it takes 30 minutes to load the person in the wheelchair. Carpooling Issues. Seven hundred and ninety-one people are reliant on carpools of greater than three workers. When a driver is out sick or quits this causes major issues with other users of the carpool.
17 III. RECOMMENDATIONS After meeting with consumers of alternative transportation, transportation agencies, and local officials the following recommendations are presented. Land Use The 2000 Census shows that the Shore has 1,904 families with no vehicle and also shows areas with concentrated poverty. These occur in both rural and more developed areas. The inventory shows that most services, shopping and employers are concentrated in the towns. Land use decisions can alter the economic situation of these areas. Concentrating services, shopping, and employment in local Towns will improve the lives of persons reliant on public transportation or other alternative transportation means. Recommendation: Concentrate shopping, major employers and dense housing in areas that are already developed and can be served by public transportation. Recommendation: Wherever possible, concentrate government services in the Towns. Recommendation: Develop or redevelop school locations in close proximity to or within the Towns. Bicycling and Walking Based on the 2000 Census, 737 people walk or ride a bicycle to work. In Northampton County, the largest employers are located in the Towns of Exmore, Nassawadox, Eastville, and Cape Charles. In Accomack County, the largest employers are located in Accomac, Temperanceville, Onley, Oak Hall, and Wallops. Recommendation: Implement the adopted Eastern Shore of Virginia Bicycle Plan. Recommendation: Provide access to community properties for bicyclists and walkers. Develop bicycle facilities and sidewalks at government buildings and schools. STAR Transit Most areas of the Eastern Shore do not have enough demand to support a fixed bus route. Therefore, to get complete coverage, demand response routes are required. Generally, fixed routes are the most convenient. Promoting a fixed route connection between centers of population and major destinations will provide a good backbone for an increase in demand response coverage. There are currently four fixed routes and one demand response route. A lack of drivers has kept another demand response route from coming online. The fixed routes currently have call-ins, which can cause the bus to depart its fixed route and pick up persons at selected locations. Most of these call-ins are not used frequently. New fixed routes have been developed and are presented in Appendix C along with a strategy to implement the recommended changes. These routes were developed using detailed neighborhood maps; some of these maps are presented in Appendix E. Recommendation: STAR Transit commits to providing safe, dependable, efficient, and affordable public transportation to workers. Maintain a transit system that allows workers to
18 complete a full workday. Recommendation: STAR Transit adopts a policy requiring all new fixed routes to arrive and depart at standard repeatable times so that connections can be maintained between bus routes. Recommendation: Change the existing routes to cover distinct locations from each other. Make the routes short enough that they can be driven at standard repeatable times, create strong connections between the routes, and eliminate call-ins on fixed routes. Recommendation: Once a strong backbone of fixed routes is in place increase demand response coverage to all areas of the counties. Recommendation: Add all weather bus shelters at the transfer stops on the routes, Cape Charles, Exmore, Onley, Nelsonia and Chincoteague. Recommendation: Add all weather shelters at the most popular stops on the routes.
19 APPENDIX A STAR Transit Route Maps
20 APPENDIX B STAR Transit Route Demand History Existing Routes
21 APPENDIX C Implementation Strategy for Improved STAR Transit Service The best transit coverage of the Eastern Shore requires some fixed routes that connect major population centers and destinations with a support system of on-demand response areas. Recommended System Benefits The recommended system is based on the existing system with changes to improve service. It is designed to synch up every two hours and allow multiple repeating connections. This is to make the system more understandable to the riders. It is possible with the new system to not have a schedule and still know exactly when your bus will arrive. For example, a person who lives in Birdsnest will quickly realize that the bus going to Exmore will pass their home at 25 minutes pass the odd hours, that is 7:25, 9:25, 11:25, 1:25, 3:25 and 5:25. Other changes were made so that the buses could maintain time throughout the day. Departures are scheduled so that there will be times when the bus will need to sit at a location and wait for the departure time. This allows late buses to catch up and get back on schedule. Routes were broken apart so that a complete circuit could be completed in one hour or two. This allows the buses to come at standard repeatable times. The routes were also tweaked to maximize the number of low-income households the bus will travel by. These were determined by looking at the neighborhood indicator maps presented in Appendix E and discussions with the Section 8 Housing Choice Voucher Program staff and A-NPDC staff working with Community Development Block Grant Programs. Implementation Strategy Transfer Pass Policy. Allow transfer passes between all fixed routes for riders who desire to go to destinations on other routes. Charge one fare for the use of the entire fixed route system. Yellow Route Change. Since the Yellow Route is closest to its recommended course and two other routes also cover the same area, convert this route first. Eliminate all call-ins. Driver Policy. STAR Transit institutes a driver program to increase the number of drivers available. Divide the routes up into shifts and allow the driver pool to select which shifts they will have for the next week. Veteran drivers have first choice followed by newer drivers. Advertise for people who want part-time work including college students. As soon as enough drivers are available, institute continuous service bus routes with extended evening hours and do away with the bus service breaks for lunch. Have a relief driver drive during any lunch times needed. Northampton Demand Response Route and Red Route Change. Once the new store is built in Onley, use this location as the start and end points of the new Purple and Red routes. Start up the Northampton Demand Response Route and reroute the Red route.
22 Purple and Blue Route Changes. After the Red route and Yellow route connection is firmly established convert the Purple and Blue routes. All Weather Stops. Look for opportunities to build all weather transit stops. These stops should be constructed at the Onley Wal-mart, Nelsonia, Chincoteague, Exmore and Cape Charles. Additional Demand Response Coverage. Add additional demand response routes completing transit coverage of the Eastern Shore. Take care to use these routes to feed passengers to the fixed route system using major transit stops as destinations for passengers wherever possible. Additional Fixed Route Service. Once all areas are served, if demand warrants it, consider adding two additional fixed routes one to the Saxis-Sanford-Hallwood-Mckemie Park-Withams area and a circular in northern Northampton County and southern Accomack County that moves off of Route 13 to communities that need alternative transportation options. Weekend Service. Finally, once ridership has increased, the bus system is very efficient and funding is available consider operating the transit system during the weekend.
23 APPENDIX D Transit Passenger Comparisons between Existing Routes and Recommended Routes The following comparisons were chosen to show the equivalent difference in the two routes. The purpose of the three situations is to show how a passenger who is working with various constraints on their time would be able to use the routes. The three types of situations are relatively open-ended time frame such as a shopping trip, a flexible yet firm time frame such as an appointment, and a firm time frame such as a school class or a job.
24 Person who lives in Keller 1) who needs to visit the A-NPDC for a half-hour applicant briefing Using 2006 Routes, they have a 2:30 appointment Purple Route (no call-ins) Blue Route (no call-ins) Keller 84 Lumber 11:50 am Accomac - Courthouse 3:58 pm Transfer to Blue at Onley 12:25 pm Transfer to Red at Onley 4:40 pm Accomac - Courthouse 12:44 pm Keller Post Office 5:00 pm Waiting Time: 0:28 Travel Time: 0:54 Travel Time: 1:02 1:46 minutes early for the appointment Total Time Round Trip: 5 hours 10 minutes Or Call Green Route, Total roundtrip cost $6.00 Using the Recommended Routes, they have a 2:30 appointment Red Route Purple Route Keller 84 Lumber 1:34 pm Accomac - Courthouse 3:20 pm Transfer to Purple at Onley 1:50 pm Transfer to Red at Onley 3:41 pm Accomac - Courthouse 2:08 pm Keller Post Office 3:46 pm Waiting Time: 0:20 Travel Time: 0:34 Travel Time: 0:26 22 minutes early for the appointment Total Time Round Trip: 2 hours 12 minutes 2) who wants to shop at Fresh Pride in Onley Using 2006 Routes Red Route (no call-ins) Route (no call-ins) Keller 84 Lumber 1:13 pm Onley 2:45 pm Onley 1:22 pm Keller Post Office 2:50 pm Shopping: 1:23 Travel Time: 0:09 Travel Time: 0:05 Total Time Round Trip: 1 hour 37 minutes Using the Recommended Routes Red Route Red Route Keller 84 Lumber 1:34 pm Onley 2:41 am Onley 1:41 pm Keller Post Office 2:46 pm Shopping: 1:00 Travel Time: 0:09 Travel Time: 0:05 Total Time Round Trip: 1 hour 12 minutes
25 3) who works in Exmore at a 8 to 5 job Using 2006 Routes Purple Route Purple Route Keller Post Office 6:55 am Exmore Town Office Call in 5:04 pm Exmore Town Office 7:07 am Keller 84 Lumber 5:17 pm Travel Time: 0:12 Travel Time: 0:13 53 minutes early Total Time Round Trip: 10 hours 22 minutes Using the Recommended Routes Red Route Red Route Keller Post Office 7:46 am Exmore Town Office 5:15 pm Exmore Town Office 7:58 am Keller 84 Lumber 5:34 pm Travel Time: 0:12 Travel Time: 0:19 2 minutes early Total Time Round Trip: 9 hours 48 minutes
26 Person who lives in Exmore 1) who needs to visit the Hospital Using 2006 Routes, they choose a 9:00 one-hour appointment Red Route (no call-ins) Yellow Route (no call-ins) Exmore Town Office 8:42 am Nassawadox Hospital 11:09 am Nassawadox Hospital 8:55 am Exmore Town Office 11:35 am Waiting Time: 1:09 Travel Time: 0:13 Travel Time: 0:26 5 minutes early for the appointment Total Time Round Trip: 2 hours 53 minutes Using the Recommended Routes, they choose a 9:30 one-hour appointment Red Route Exmore Town Office 8:58 am Nassawadox Hospital 10:52 am Exmore Shore Plaza Shore Plaza Transfer for Transfer to to Red Route 11:10 am Yellow Route 9:10 am Exmore Town Office 11:15 am Nassawadox Hospital 9:19 am Waiting Time: 0:22 Travel Time: 0:21 Travel Time: 0:23 11 minutes early for appointment Total Time Round Trip: 2 hours 17 minutes 2) who wants to shop at Wal-Mart (not yet built) Using 2006 Routes Purple Route (no call-ins) Purple Route (no call-ins) Exmore Town Office 8:55 am Wal-Mart ~10:45 am Wal-Mart ~9:10 am Exmore Town Office 10:57 am Shopping: 1:35 Travel Time: 0:15 Travel Time: 0:12 Total Time Round Trip: 2 hours 2 minutes Using the Recommended Routes Red Route Exmore Town Office 9:15 am Wal-Mart ~10:41 am Wal-Mart ~9:38 am Exmore Town Office 10:58 am Shopping: 1:03 Travel Time: 0:23 Travel Time: 0:17 Total Time Round Trip: 1 hour 43 minutes
27 3) who works an 8 to 5 job in Onley Using 2006 Routes Red Route (no call-ins) Red Route (no call-ins, last run) Exmore Town Office 7:17 am Onley Fresh Pride 4:40 pm Onley Fresh Pride 7:45 am Exmore Town Office 5:13 pm Travel Time: 0:28 Travel Time: 0:26 15 minutes early Leave 20+ min early every day Total Time Round Trip: 9 hours 56 minutes Using the Recommended Routes Red Route Exmore Town Office 7:15 am Onley Fresh Pride 5:41 pm Onley Fresh Pride 7:41 am Exmore Town Office 5:58 pm Travel Time: 0:26 Travel Time: 0:17 19 minutes early Waiting Time: 0:41 Total Time Round Trip: 10 hours 43 minutes
28 Person who lives in Chincoteague 1) who needs to visit the A-NPDC Using 2006 Routes, they choose a 11:30 half-hour appointment Blue Route (no call-ins) Blue Route (no call-ins) Chincoteague Parking Lot 10:05 am Accomac - Courthouse 12:44 am Accomac - Courthouse 11:21 am Chincoteague Parking Lot 1:46 pm Waiting Time: 0:44 Travel Time: 1:16 Travel Time: 1:02 9 minutes early for the appointment Total Time Round Trip: 3 hours 41 minutes Using the Recommended Routes, they choose a 9:30 half-hour appointment Blue Route Purple Route Chincoteague Parking Lot 7:45 am Accomac - Courthouse 10:08 am Transfer to Purple at Nelsonia 8:50 am Transfer to Blue at Nelsonia 10:50 am Accomac Courthouse 9:20 am Chincoteague Parking Lot 11:45 Waiting Time: 0:08 Travel Time: 1:35 Travel Time: 1:37 11 minutes early for the appointment Total Time Round Trip: 4 hours 0 minutes 2) who wants to shop at Food Lion Plaza in Oak Hall Using 2006 Routes Blue Route (no call-ins) Blue Route (no call-ins) Chincoteague Parking Lot 10:05 am Oak Hall T s Corner 1:30 pm Oak Hall T s Corner 10:22 am Chincoteague Parking Lot 1:46 pm Shopping: 3:08 Travel Time: 0:17 Travel Time: 0:16 Total Time Round Trip: 3 hours 41 minutes Using the Recommended Routes Blue Route Blue Route Chincoteague Parking Lot 1:45 pm Oak Hall T s Corner 3:17 pm Oak Hall T s Corner 2:17 pm Chincoteague 3:40 pm Shopping: 1:00 Travel Time: 0:32 Travel Time: 0:23 Total Time Round Trip: 1 hour 55 minutes
29 3) who goes to ESCC for classes Using 2006 Routes, in time for 9 am classes Blue Route (no call-ins) Green Route (call-in) Classes ending at 3:45 Chincoteague Parking Lot 6:10 am Call In to get Green to get to Onley by 4:45 pm Transfer to Green at Onley 8:15 am Transfer to Blue at Onley 4:45 or Red if it allows dropsoffs Melfa- ESCC 8:25 am Call In Chincoteague Parking Lot 6:06 School Time: 6:30 Travel Time: 2:15 Travel Time: 2:21 5 minutes early Cost: $4.50 Cost: $4.50 Total Time Round Trip: 11 hours 56 minutes Using the Recommended Routes, in time for 8 am classes Blue Route Classes ending at 3:30 Chincoteague Parking Lot 5:45 am ESCC 3:38 pm Transfer to Purple at Nelsonia 6:50 am Transfer to Purple at Onley 3:50 pm Transfer to Red at Onley 7:41 am Transfer to Blue at Nelsonia 5:40 pm ESCC 7:44 am Chincoteague Parking Lot 5:40 pm School Time:7:30 Travel Time: 1:59 Travel Time: 2:02 16 minutes early Total Time Round Trip: 11 hours 55 minutes
30 Person who lives in Cape Charles 1) who needs to visit the Northampton Social Services Using 2006 Routes, they choose a 8:30 half-hour appointment Purple Route (no call-ins) Red Route (no call-ins) Cape Charles 8:10 am Eastville Social Services 9:12 am Eastville Social Services 8:32 am Cape Charles 9:32 am Waiting Time: 0:12 Travel Time: 0:22 Travel Time: 0:20 2 minutes late for the appointment Total Time Round Trip: 1 hours 21 minutes Using the Recommended Routes, they choose a 9:00 half-hour appointment Yellow Route Yellow Route Cape Charles 8:06 am Eastville Social Services 9:34 am Eastville Social Services 8:35 am Cape Charles 10:03 am Waiting Time: 0:04 Travel Time: 0:22 Travel Time: 0:29 25 minutes early for the appointment Total Time Round Trip: 1 hour 57 minutes 2) who wants to shop at Roses in Exmore Using 2006 Routes Purple Route (no call-ins) Purple Route (no call-ins) Cape Charles 8:10 am Exmore-Shore Plaza 11:03 am Exmore- Shore Plaza 8:50 am Cape Charles 11:42 am Shopping: 2:13 Travel Time: 0:40 Travel Time: 0:39 Total Time Round Trip: 3 hours 32 minutes Using the Recommended Routes Yellow Route Yellow Route Cape Charles 8:06 am Exmore-Shore Plaza 11:10 am Exmore- Shore Plaza 9:01 am Cape Charles 12:03 pm Shopping: 2:09 Travel Time: 0:56 Travel Time: 0:53 Total Time Round Trip: 3 hours 57 minutes
31 3) who works in Exmore at a 8 to 5 job Using 2006 Routes Red Route (no call-ins) Red Route (no call-ins) Cape Charles 6:30 am Exmore-Shore Plaza 5:21 pm Exmore- Shore Plaza 7:10 am Cape Charles 6:04 pm Waiting Time: 0:21 Travel Time: 0:40 Travel Time: 0:43 50 minutes early Total Time Round Trip: 11 hours 34 minutes Using the Recommended Routes Yellow Route Yellow Route Cape Charles 6:06 am Exmore-Shore Plaza 5:10 pm Exmore- Shore Plaza 7:01 am Cape Charles 6:03 pm Waiting Time: 0:10 Travel Time: 0:55 Travel Time: 0:53 59 minutes early Total Time Round Trip: 11 hours 57 minutes
32 APPENDIX E Detailed Neighborhood Maps with Recommended STAR Transit Routes The neighborhoods that were most likely to use the transit system are looked at in greater detail. Neighborhoods were selected by whether they had a concentration of houses without indoor plumbing and whether they had ever had a Community Development Block Grant Project. These communities generally have a large number of lower income residents. Information on the value of improvements was collected and the maps show parcels and lots where improvement value may indicate a family with limited means who may need access to transit service. The maps are ordered south to north. Cheapside is in the southern tip of Northampton County, Exmore marks the boundary between both counties, and Horntown is in northern Accomack County.
EASTERN SHORE OF VIRGINIA PEDESTRIAN FACILITIES STUDY
 EASTERN SHORE OF VIRGINIA PEDESTRIAN FACILITIES STUDY Inventory and Needs Assessment December 2017 Mason Avenue, Cape Charles Prepared by: Accomack-Northampton Planning District Commission This Page Intentionally
PUBLIC TRANSPORTATION PLAN FOR THE CITY OF GEORGETOWN
 PUBLIC TRANSPORTATION PLAN FOR THE CITY OF GEORGETOWN PRESENTATION TO CITY COUNCIL JANUARY 22, 2008 PUBLIC TRANSIT FOR THE CITY OF GEORGETOWN LOCAL SERVICE For Georgetown residents to Georgetown destinations.
1999 On-Board Sacramento Regional Transit District Survey
 SACOG-00-009 1999 On-Board Sacramento Regional Transit District Survey June 2000 Sacramento Area Council of Governments 1999 On-Board Sacramento Regional Transit District Survey June 2000 Table of Contents
City of Davenport CitiBus Public Transportation Study. April 2015
 City of Davenport CitiBus Public Transportation Study April 2015 Overview Project Background Key Findings CitiBus Service Allocation Policy Discussion 2 Project Background 3 About CitiBus Operates 17 routes
Typical Rush Hour Commute. PennyforTransportation.com
 Typical Rush Hour Commute In the News Overview of the Plan Collaborative plan with projects in every community Prioritizing connectivity and congestion relief Dedicated transportation-specific funding;
Travel and Rider Characteristics for Metrobus
 Travel and Rider Characteristics for Metrobus 040829040.15 Travel and Rider Characteristics for Metrobus: 2012-2015 Overview The Miami Dade County Metropolitan Planning Organization (MPO) conducted a series
Market Factors and Demand Analysis. World Bank
 Market Factors and Demand Analysis Bank Workshop and Training on Urban Transport Planning and Reform. Baku, April 14-16, 2009 Market Factors The market for Public Transport is affected by a variety of
Pocatello Regional Transit Master Transit Plan Draft Recommendations
 Pocatello Regional Transit Master Transit Plan Draft Recommendations Presentation Outline 1. 2. 3. 4. What is the Master Transit Plan? An overview of the study Where Are We Today? Key take-aways from existing
Guidelines for Providing Access to Public Transportation Stations APPENDIX C TRANSIT STATION ACCESS PLANNING TOOL INSTRUCTIONS
 APPENDIX C TRANSIT STATION ACCESS PLANNING TOOL INSTRUCTIONS Transit Station Access Planning Tool Instructions Page C-1 Revised Final Report September 2011 TRANSIT STATION ACCESS PLANNING TOOL INSTRUCTIONS
Title VI Fare Change Equity Analysis
 Title VI Fare Change Equity Analysis Evaluation Report Submitted to Dallas Area Rapid Transit Submitted by TranSystems June 2012 Title VI Fare Change Equity Analysis Introduction DART has proposed a schedule
Philadelphia Bus Network Choices Report
 Philadelphia Bus Network Choices Report JUNE 2018 SEPTA Table of Contents Executive Summary...7 What if transit gave us more freedom?... 8 What is this report?... 8 The main conclusions... 9 What is happening
MIDCOAST MAINE TRANSIT STUDY. In Association with: MORRIS COMMUNICATIONS
 MIDCOAST MAINE TRANSIT STUDY In Association with: MORRIS COMMUNICATIONS Public Meetings June, 2013 Project Background Four coastal towns of Knox County have agreed on the importance of a transit study
WILMAPCO Public Opinion Survey Summary of Results
 Wilmington Area Planning Council WILMAPCO Public Opinion Survey Summary of Results Prepared by: 2955 Valmont Road, Suite 300 Boulder, Colorado 80301 t: 303-444-7863 f: 303-444-1145 www.n-r-c.com Table
VI. Market Factors and Deamnd Analysis
 VI. Market Factors and Deamnd Analysis Introduction to Public Transport Planning and Reform VI-1 Market Factors The market for Public Transport is affected by a variety of factors No two cities or even
Population & Demographics
 Population & Demographics Conditions and Trends When looking at trends in the total number of people living in Windham (population) and at the characteristics of the people who live here by factors such
WALK- AND bike-friendly TURLOCK
 WALK- AND bike-friendly TURLOCK Ideas to Encourage Walking and Biking Benefits to the COMMUNITY Get Connected People who walk and bike have many more opportunities for casual interactions with friends
Appendix A-1: Purpose and Need Statement
 Appendix A-1: Purpose and Need Statement PURPOSE AND NEED STATEMENT Western & Ashland Corridors Bus Rapid Transit (BRT) Project Prepared for Chicago Transit Authority 567 West Lake Street Chicago, IL 60661
Key objectives of the survey were to gain a better understanding of:
 3 COMMUNITY INPUT Community input is an essential part of corridor studies. For the SR 87 corridor study, VTA staff conducted an extensive online survey of people living and commuting along the corridor.
Chapter 5 Future Transportation
 Chapter 5 Future Transportation The Future Land Use Plan identifies the desired land use designations. The land uses desired for Crozet depend, in large part, on the success of the transportation system,
NASHUA REGIONAL PLANNING COMMISSION REGIONAL BICYCLE AND PEDESTRIAN PLAN
 NASHUA REGIONAL PLANNING COMMISSION REGIONAL BICYCLE AND PEDESTRIAN PLAN June, 2005 Prepared by the Nashua Regional Planning Commission 2005 NRPC Regional Bicycle and Pedestrian Plan- JUNE 2005 ACKNOWLEDGEMENTS
Service Proposal for the City of Ashland, Oregon
 Rogue Valley Transportation District 3200 Crater Lake Avenue Medford, Oregon 97504-9075 Phone (541) 608-2429 Fax (541) 773-2877 Visit our website at: www.rvtd.org 2009-2011 Service Proposal for the City
Executive Summary. TUCSON TRANSIT ON BOARD ORIGIN AND DESTINATION SURVEY Conducted October City of Tucson Department of Transportation
 Executive Summary TUCSON TRANSIT ON BOARD ORIGIN AND DESTINATION SURVEY Conducted October 2004 Prepared for: City of Tucson Department of Transportation May 2005 TUCSON TRANSIT ON BOARD ORIGIN AND DESTINATION
Walking in New Zealand May 2013
 May 2013 Walking makes up 13 percent of total time travelled and 16 percent of the number of trip legs. On average women spend more time walking than men, walking 57 minutes per person per week, compared
Appendix A-K Public Information Centre 2 Materials
 Appendix A-K Public Information Centre 2 Materials Our Rapid Transit Initiative Make an impact on the future of transit Join the discussion on Rapid Transit in London You re invited to a Public Information
Transit Ridership - Why the Decline and How to Increase. Hosted by the. Virginia Transit Association
 Transit Ridership - Why the Decline and How to Increase Hosted by the Virginia Transit Association Virginia Transit Association 1108 East Main Street, Suite 1108 Richmond, VA 23219 804.643.1166 www.vatransit.com
2012 Transit Study Randolph County
 2012 Transit Study Randolph County Appendix B Technical Memorandum 2011 Transportation Survey Prepared for: Randolph County Housing Authority Country Roads Transit Submitted by: July 1, 2012 Table of Contents
Chapter 14 PARLIER RELATIONSHIP TO CITY PLANS AND POLICIES. Recommendations to Improve Pedestrian Safety in the City of Parlier (2014)
") Chapter 14 PARLIER This chapter describes the current status and future plans for biking and walking in the City of Parlier. RELATIONSHIP TO CITY PLANS AND POLICIES The Parlier General Plan is the primary
Chapter 14 PARLIER This chapter describes the current status and future plans for biking and walking in the City of Parlier. RELATIONSHIP TO CITY PLANS AND POLICIES The Parlier General Plan is the primary
Rochester Area Bike Sharing Program Study
 roc bike share Rochester Area Bike Sharing Program Study Executive Summary ~ January 2015 JANUARY 2015 8484 Georgia Avenue, Suite 800 Silver Spring, MD 20910 3495 Winton Pl., Bldg E, Suite 110 Rochester,
2018 Transportation Survey October 17, Prepared by:
 Transportation Survey October 17, Prepared by: Overview Methodology Systemwide results Strengths/Weaknesses by mode Importance of possible improvements Conclusions Methodology 500 Chittenden County residents
Dial a Ride. City of Kawartha Lakes ACCELERATING RURAL TRANSPORTATION SOLUTIONS. Case Study
 Case Study Dial a Ride City of Kawartha Lakes Rural Route Transit ACCELERATING RURAL TRANSPORTATION SOLUTIONS Information for this case study was provided by Enzo Ingribelli, Public Works Transportation
Purpose and Need. Chapter Introduction. 2.2 Project Purpose and Need Project Purpose Project Need
 Chapter 2 Purpose and Need 2.1 Introduction The El Camino Real Bus Rapid Transit (BRT) Project (Project) would make transit and other transportation improvements along a 17.6-mile segment of the El Camino
RE-CYCLING A CITY: EXAMINING THE GROWTH OF CYCLING IN DUBLIN
 Proceedings ITRN2013 5-6th September, Caulfield: Re-cycling a city: Examining the growth of cycling in Dublin RE-CYCLING A CITY: EXAMINING THE GROWTH OF CYCLING IN DUBLIN Brian Caulfield Abstract In the
CITY OF COCOA BEACH 2025 COMPREHENSIVE PLAN. Section VIII Mobility Element Goals, Objectives, and Policies
 CITY OF COCOA BEACH 2025 COMPREHENSIVE PLAN Section VIII Mobility Element Goals, Objectives, and Policies Adopted August 6, 2015 by Ordinance No. 1591 VIII MOBILITY ELEMENT Table of Contents Page Number
Summary of Feedback Received during Speak Up Broward s 22 Speakers Bureau Engagements from December 10, 2013 through April 2, 2014
 Summary of Feedback Received during Speak Up Broward s 22 Speakers Bureau Engagements from December 10, 2013 through April 2, 2014 Broward County Transit (BCT): Concerns for the safety of children particularly
Detroiters need to be able to conveniently and reliably get to work, school, church, stores, and parks.
 Environment & MOBILITY Detroiters need to be able to conveniently and reliably get to work, school, church, stores, and parks. Several surveyed challenges related to lack of mobility ranked in the top
SHORT RANGE TRANSIT PLAN: Survey Results and Analysis
 GOLD COAST TRANSIT DISTRICT SHORT RANGE TRANSIT PLAN: Survey Results and Analysis FY 2014-15 to FY 2018-19 Overview As part of the Short Range Transit Plan (SRTP) community outreach process, Gold Coast
THE 2010 MSP REGION TRAVEL BEHAVIOR INVENTORY (TBI) REPORT HOME INTERVIEW SURVEY. A Summary of Resident Travel in the Twin Cities Region
 REPORT HOME INTERVIEW SURVEY. A Summary of Resident Travel in the Twin Cities Region") THE 2010 MSP REGION TRAVEL BEHAVIOR INVENTORY (TBI) REPORT HOME INTERVIEW SURVEY A Summary of Resident Travel in the Twin Cities Region October 2013 WHAT IS THE TBI? The Travel Behavior Inventory (TBI)
THE 2010 MSP REGION TRAVEL BEHAVIOR INVENTORY (TBI) REPORT HOME INTERVIEW SURVEY A Summary of Resident Travel in the Twin Cities Region October 2013 WHAT IS THE TBI? The Travel Behavior Inventory (TBI)
Central Jersey Transportation Forum. March 2007
 Central Jersey Transportation Forum March 2007 Feasibility Analysis of BRT on Dinky Right of Way from Princeton Station to Alexander Rd. in West Windsor (west of Rt. 1) Study spurred by Princeton University's
City of Novi Non-Motorized Master Plan 2011 Executive Summary
 City of Novi Non-Motorized Master Plan 2011 Executive Summary Prepared by: February 28, 2011 Why Plan? Encouraging healthy, active lifestyles through pathway and sidewalk connectivity has been a focus
A Matter of Fairness: ROCOG s Environmental Justice Protocol. What is Mobility Limitation?
 No Person Left Behind What is Mobility Limitation? What is the Access Limitation? Environmental Justice population should be provided adequate mobility & access to meet their needs; Identify acceptable
PASSENGER SURVEY RESULTS
 ROGUE VALLEY TRANSPORTATION DISTRICT PASSENGER SURVEY RESULTS Date: December 12, 2018 Project #: 21289 To: Paige West, RVTD From: Susan Wright, PE; Molly McCormick; (Kittelson & Associates, Inc.) Subject:
Appendix C: Online Survey Comments
 Appendix C: Online Survey Comments Ideas Eagle Transit TDP Update Online Survey Comments It would be nice to be able to ride the bus to and from work to save gas and wear and tear. I would just like to
Modal Shift in the Boulder Valley 1990 to 2009
 Modal Shift in the Boulder Valley 1990 to 2009 May 2010 Prepared for the City of Boulder by National Research Center, Inc. 3005 30th Street Boulder, CO 80301 (303) 444-7863 www.n-r-c.com Table of Contents
INFRASTRUCTURE: Using the Grid to Create a more Self-Sustaining Downtown. Studio Spring 2013
 EMERGENT FUTURES The San Diego Section of the American Society of Civil Engineers (ASCE) released a new report, the 2012 San Diego County Infrastructure Report Card. Since the last San Diego Report Card
Exceeding expectations: The growth of walking in Vancouver and creating a more walkable city in the future through EcoDensity
 Exceeding expectations: The growth of walking in Vancouver and creating a more walkable city in the future through EcoDensity Melina Scholefield, P. Eng. Manager, Sustainability Group, City of Vancouver
Transportation Trends, Conditions and Issues. Regional Transportation Plan 2030
 Transportation Trends, Conditions and Issues Regional Transportation Plan 2030 23 Regional Transportation Plan 2030 24 Travel Characteristics Why Do People Travel? Over one-half of trips taken in Dane
Eliminate on-street parking where it will allow for a dedicated bus only lane %
 Traffic Dashboard Priorities Survey Responses Introduction 1) Are you familiar with bus rapid transit (BRT)? a. No, BRT is new to me. 597 23.5% b. I ve heard of BRT, but I don t know much about it. 1,136
Planning Regionally With Transit
 Planning Regionally With Transit Nathan Coats Director of Operations CTAA Expo 2015 Tampa Began 1992. Serves eastern Cache County to Preston, ID. Population- 115,000 34 bus fleet, 26 fixed route buses;
2016 Capital Bikeshare Member Survey Report
 2016 Capital Bikeshare Member Survey Report Prepared by: LDA Consulting Washington, DC 20015 (202) 548-0205 February 24, 2017 EXECUTIVE SUMMARY Overview This report presents the results of the November
The specific activities consisted of:
 Mount Olive Development Corporation (MODCO) Speak Up Broward Program for Empowering People Dates of program: May 2014 August 2014 Communities Served: 33311, 33313, and 33301 Zip Code Areas Target Audience:
Measuring Transportation: Traffic, Mobility and Accessibility
 Measuring Transportation: Traffic, Mobility and Accessibility THIS FEATURE COMPARES THREE APPROACHES TO MEASURING TRANSPORTATION SYSTEM PERFORMANCE. TRAFFIC-BASED MEASUREMENTS EVALUATE MOTOR VEHICLE MOVEMENT;
Creating walkable, bikeable and transit-supportive communities in Halton
 Creating walkable, bikeable and transit-supportive communities in Halton By presenting current research and best practices, the information in this paper is meant to support and broaden discussion on how
U.S. Bicycling Participation Study
 U.S. Bicycling Participation Study Report of findings from the 2016 survey Conducted by Corona Insights Commissioned by PeopleForBikes Released July 2017 Table of Contents Background and Objectives 3 Research
REGIONAL HOUSEHOLD TRAVEL SURVEY:
 Defining the Vision. Shaping the Future. REGIONAL HOUSEHOLD TRAVEL SURVEY: Profile Why we travel How we travel Who we are and how often we travel When we travel Where we travel How far and how long we travel
Non-motorized Transportation Planning Resource Book Mayor s Task Force on Walking and Bicycling City of Lansing, Michigan Spring 2007 pg.
 Non-motorized Transportation Planning Resource Book pg. 105 of 158 Non-motorized Transportation Planning Resource Book pg. 106 of 158 Non-motorized Transportation Planning Resource Book pg. 107 of 158
2011 Origin-Destination Survey Bicycle Profile
 TRANS Committee 2011 Origin-Destination Survey National Capital Region December 2012 TRANS Committee Members: City of Ottawa, including OC Transpo Ville de Gatineau Société de transport de l Outaouais
Central Oregon Intergovernmental Council
 Central Oregon Intergovernmental Council Regional Transit Master Plan (RTMP) Technical Advisory Committee Kick-Off Meeting May 16, 2012 Meeting Agenda Project Orientation Presentation of Survey Results
Dear City Council Members,
 From: Bob Kenyon [mailto: ] Sent: Monday, February 08, 2016 10:20 AM To: City Clerk Subject: Please prioritize Caltrain and a complete transit network Thank you for prioritizing bringing BART to San Jose
Rail Station Fact Sheet CentrePort/DFW Airport Station
 Rail Station Fact Sheet CentrePort/DFW Airport Station Station Overview CentrePort/DFW Airport Station is located by Statler Boulevard at Breezewood Drive in Fort Worth. Free shuttles connect the station
South Jersey certainly has many of quality of life issues related to transportation. In spite of being a small state, the Garden State has the 3 rd
 This presentation summarizes an on-going study of commuter rail potential in Southern New Jersey. This study examines the 3 rail alignments that have been proposed by the Delaware River Port Authority
Calgary Transit Route 302 Southeast BRT Year One Review June
 Calgary Transit Route 302 Southeast BRT Year One Review 2011 June Calgary Transit Route 302 Southeast BRT: Year One Review 2011 April Table of Contents 1.0 Executive Summary... 1 2.0 Introduction... 3
Travel Patterns and Characteristics
 DRAFT 2006 Transportation Fact Book SECTION 4 Travel Patterns and Characteristics 43 2006 Transportation Fact Book DRAFT 44 DRAFT 2006 Transportation Fact Book Why do we conduct travel surveys? The main
NEWMARKET CENTRE Mobility Hub Profile
 Mobility Hub Profile Dundas Newmarket West-Bloor Centre Anchor Hub Gateway Hub N MOBILITY HUBS: Places of connectivity between regional and rapid transit services, where different modes of transportation
Walking New Zealand Household Travel Survey September 2015
 Walking New Zealand Household Travel Survey 2011-2014 September 2015 Disclaimer: All reasonable endeavours are made to ensure the accuracy of the information in this report. However, the information is
Cabrillo College Transportation Study
 Cabrillo College Transportation Study Planning and Research Office Terrence Willett, Research Analyst, Principle Author Jing Luan, Director of Planning and Research Judy Cassada, Research Specialist Shirley
Corpus Christi Metropolitan Transportation Plan Fiscal Year Introduction:
 Introduction: The Safe, Accountable, Flexible, Efficient Transportation Equity Act: A Legacy for Users (SAFETEA-LU) has continued the efforts started through the Intermodal Surface Transportation Efficiency
The Case for New Trends in Travel
 The Case for New Trends in Travel The Future of Cities and Travel Steven E. Polzin, PhD. Center for urban Transportation Research University of South Florida October 19, 2008 Successful Strategies from
El Paso County 2040 Major Transportation Corridors Plan
 El Paso County 2040 Major Transportation Corridors Plan Connect-our-County Online Transportation User Survey Preliminary Results June 24, 2010 Years of Residence 2. How many years have you LIVED HERE?
A Selection Approach for BRT Parking Lots Nicolls Road Corridor Parking Study
 A Selection Approach for BRT Parking Lots Nicolls Road Corridor Parking Study Chirantan Kansara, P.E. Engineering Construction Design Planning 2018 ITE Northeastern District Annual Meeting Lake George,
2010 Pedestrian and Bicyclist Special Districts Study Update
 2010 Pedestrian and Bicyclist Special Districts Study Update Pedestrian and Bicyclist Special Districts Program Overview H-GAC s Special Districts Program aims to provide strategic investments in pedestrian
Proposed. City of Grand Junction Complete Streets Policy. Exhibit 10
 Proposed City of Grand Junction Complete Streets Policy Exhibit 10 1 City of Grand Junction Complete Streets Policy Vision: The Complete Streets Vision is to develop a safe, efficient, and reliable travel
Non-Motorized Transportation 7-1
 Non-Motorized Transportation 7-1 Transportation facilities no longer mean just accommodating a vehicle powered by a combustion engine. Pedestrian and non-motorized facilities are important modes of travel
Bike Share Social Equity and Inclusion Target Neighborhoods
 Bike Share Social Equity and Inclusion Target Neighborhoods Target Neighborhoods West End/Visitation Park/Academy/Hamilton Heights Wellsgoodfellow/Kingsway West The Ville/Greater Ville Kingsway East/Fountain
Data Analysis February to March Identified safety needs from reported collisions and existing travel patterns.
 Welcome! Thank you for participating in today s Valencia Bikeway Improvements workshop. Data Analysis February to March Identified safety needs from reported collisions and existing travel patterns. Initial
SMART 1 Public Meeting #1. February 24, 2016
 SMART 1 Public Meeting #1 February 24, 2016 Agenda Who is the SMTC? SMART 1 project overview Syracuse Metropolitan Transportation Council An Introduction: Who we are & what we do What is an MPO? A Metropolitan
ATTACHMENT 4 - TDM Checklist. TDM Checklist Overview
 ATTACHMENT 4 - TDM Checklist TDM Checklist Overview The proposed checklist rates developments on the degree to which they are TDM and transit supportive. Points are assigned based on the level of transit
Briefing Paper #1. An Overview of Regional Demand and Mode Share
 2011 Metro Vancouver Regional Trip Diary Survey Briefing Paper #1 An Overview of Regional Demand and Mode Share Introduction The 2011 Metro Vancouver Regional Trip Diary Survey is the latest survey conducted
THE I-79 CORRIDOR. I-79 provides motorists with connections to the following major highways: I-80, PA 358, PA 965 and PA 208.
 The I-79 Corridor Pittsburgh to Erie Regional Thruway I-79 was constructed through Mercer County in the early 1960s. The portion north of PA 965 opened in 1961 and the segment south of PA 965 the following
Thank you for this opportunity to discuss with you how we can work together to make our streets more complete.
 Thank you for this opportunity to discuss with you how we can work together to make our streets more complete. 1 2 3 Thank you for this opportunity to discuss with you how we can work together to make
Transportation Master Plan Advisory Task Force
 Transportation Master Plan Advisory Task Force Network Alternatives & Phasing Strategy February 2016 BACKGROUND Table of Contents BACKGROUND Purpose & Introduction 2 Linking the TMP to Key Council Approved
Measuring and Communicating Mobility:
 Measuring and Communicating Mobility: The District Mobility Project Stephanie Dock, District Department of Transportation TRB Transportation Issues in Major Cities Committee May 2, 2017 Deconstructing
Balboa Area Transportation Demand Management
 Balboa Area Transportation Demand Management April 2016 Presented by: Jeff Tumlin What Are We Aiming For? Transportation is not an end in itself. It is merely a means by which we support the community.
Solana Beach Comprehensive Active Transportation Strategy (CATS)
") Solana Beach Comprehensive Active Transportation Strategy (CATS) 3.0 Goals & Policies The Solana Beach CATS goals and objectives outlined below were largely drawn from the Solana Beach Circulation Element
Solana Beach Comprehensive Active Transportation Strategy (CATS) 3.0 Goals & Policies The Solana Beach CATS goals and objectives outlined below were largely drawn from the Solana Beach Circulation Element
FULL PROFILE Census, 2018 Estimates with 2023 Projections Calculated using Weighted Block Centroid from Block Groups Realm Realty Lat/Lon: 3
 FULL PROFILE 2000-2010 Census, 2018 Estimates with 2023 Projections Calculated using Weighted Block Centroid from Block Groups Realm Realty Lat/Lon: 30.0027/-90.1613 RF1 Lakeside Shopping Center Metairie,
CHAPTER 1 INTRODUCTION
 CHAPTER 1 INTRODUCTION Chapter Table of Contents THE 2017 HOUSTON BIKE PLAN 1-1 HOUSTON BIKEWAYS PROGRAM 1-2 HISTORY OF BICYCLE PLANNING IN HOUSTON 1-3 BICYCLE LEVEL OF COMFORT 1-3 EXISTING PLANS, PROGRAMS
5/7/2013 VIA . RE: University Village Safeway Expansion (P13-019)
") 5/7/2013 VIA EMAIL David Hung, Associate Planner Community Development Department, Current Planning Division City of Sacramento 300 Richards Boulevard, 3 rd Floor Sacramento, CA 95811 RE: University Village
5/7/2013 VIA EMAIL David Hung, Associate Planner Community Development Department, Current Planning Division City of Sacramento 300 Richards Boulevard, 3 rd Floor Sacramento, CA 95811 RE: University Village
Customer Satisfaction Tracking Report 2016 Quarter 1
 Customer Satisfaction Tracking Report 2016 Quarter 1 May 2016 Prepared by: NRG Research Group Project no. 317-15-1445 Suite 1380-1100 Melville Street Vancouver, BC V6E 4A6 Table of Contents Background
CONNECTING PEOPLE TO PLACES
 CONNECTING PEOPLE TO PLACES 82 EAST BENCH MASTER PLAN 07 Introduction The East Bench transportation system is a collection of slow moving, treelined residential streets and major arteries that are the
Is St. Louis Ready for a Bike Share System? May 14, 2014 Public Open House
 Is St. Louis Ready for a Bike Share System? May 14, 2014 Public Open House PRESENTATION AGENDA 2 BIKE SHARE How does it work? What are the benefits? Who would use it? Will it be safe? Would it work in
the road. connectivity facilities. or clearing trees, if
 Rural Mobility Barriers Rural Mobility Management June 2010 Report No. 13-2010 1 Introduction Mobility, as discussed in this report, focuses on how residents in rural areas move within their communities
GOLD COAST TRANSIT DISTRICT SHORT RANGE TRANSIT PLAN FY 2015 FY 2019 APPENDICES
 APPENDICES I. GCTD Ridership Data a. Fixed-Route 10 Year Ridership History b. Ridership Summary - FY 2013-14 & FY 2014-15 c. Performance Indicators By Route FY 2013-14 & FY 2014-15 d. Annual Ridership/Passengers
REPORT. RECOMMENDATION: 1. That the report on Pilot Results Free Transit for Seniors, dated October 25, 2012, from Oakville Transit be received.
 REPORT MEETING DATE: NOVEMBER 15, 2012 FROM: Oakville Transit DATE: October 25, 2012 SUBJECT: Pilot Results - Free Transit for Seniors LOCATION: Town Wide WARD: Town wide Page 1 RECOMMENDATION: 1. That
PROJECT OVERVIEW. Auburn Station Access Improvements Project
 PROJECT OVERVIEW Station Access Improvements Project Voters approved improvements to the Sounder Station in 2008 as part of the ballot measure to expand mass transit throughout the region The Sound Transit
FACTS AND FIGURES: MAKING THE CASE FOR COMPLETE STREETS IN LEE COUNTY
 FACTS AND FIGURES: MAKING THE CASE FOR COMPLETE STREETS IN LEE COUNTY Safety: Close to 5,000 pedestrians and bicyclists die each year on U.S. roads, and more than 70,000 are injured. [Mean Streets, Surface
Capital Beltway HOT Lanes - Frequently Asked Questions
 Capital Beltway HOT Lanes - Frequently Asked Questions December 20, 2007 1. What is the cost of the project? The fixed-price design-build cost is approximately $1.4 billion. 2. Why have the project costs
ECONOMIC DEVELOPMENT ELEMENT
 ECONOMIC DEVELOPMENT ELEMENT Background The Economic Development Element considers labor force and labor force characteristics, employment by place of work and residence, and analysis of the community
Berkeley Strategic Transportation Plan A-76
 Berkeley Strategic Transportation Plan A-76 Appendices 1. A Team Effort 2. Where We ve Been A-11 Berkeley Strategic Transportation Plan Alameda County Transportation Plan Alameda County will be served
WELCOME. City of Greater Sudbury. Transportation Demand Management Plan
 WELCOME City of Greater Sudbury Transportation Demand Management Plan Public Consultation Session St. Andrew s Place, Activity Hall 111 Larch Street Wednesday September 13, 2017 6:00 to 8:00 pm Welcome
Strategies to Promote the Availability of Affordable Healthy Food and Beverages
 Strategies to Promote the Availability of Affordable Healthy Food and Beverages CDC Recommended Strategies and Measurements Strategy #1: Communities Should Increase Availability of Healthier Food and Beverage
Cherry Creek Transportation and Land Use Forum September 25, 2013 Meeting Summary
 Cherry Creek Transportation and Land Use Forum September 25, 2013 Meeting Summary I. LEAD-IN TO SMALL GROUP DISCUSSION, POLLING AND STEERING COMMITTEE/TECHNICAL TASK FORCE DISCUSSION The meeting began