VI. Market Factors and Deamnd Analysis
|
|
|
- Charlene Allen
- 5 years ago
- Views:
Transcription


1 VI. Market Factors and Deamnd Analysis Introduction to Public Transport Planning and Reform VI-1


2 Market Factors The market for Public Transport is affected by a variety of factors No two cities or even neighborhoods are the same in terms of these factors Different combinations of factors generate the need for different types and levels of Public Transport service VI-2
3 Factors Affecting Market for Public Transport Travel characteristics Land use Trip maker numbers and demographics Public Transport service parameters VI-3
4 ? Why is It Important to Understand Market Factors? Helps in estimating Public Transport ridership linked to performance, revenue, financial sustainability measure of benefits Essential for planning and design Facilitates performance analysis VI-4
5 Travel Characteristics Purpose Passengers or Seats Time-of-Day Time of Day Demand (Passengers) Supply (Seats) Origin/Destination VI-5
6 Trip Purpose Impacts PT Use Non-Work Shopping, personal business, medical, recreational, religious Occasional trips 1-3 times/week Discretionary trips means users can forgo them, change timing or combine them People often travel as group, e.g., family Work/School trips Recurring (e.g., 5 days/week) Not-discretionary, more tightly scheduled Workers/students travel as individuals VI-6
7 Travel Time-of-Day Passengers or Seats Peak Morning/Afternoon Commuting Hours Higher demand/unit time High percentage of work trips More individual travel Choice and captive riders Off-Peak Midday, Evening, Weekend Hours Lower demand More non-work travel More group travel Captive riders Safety, security issues Time of Day Demand (Passengers) Supply (Seats) VI-7
8 Time-of-Day Demand Affects Bus and Facility Utilization Seats Pa assengers or Time of Day Demand (Passengers) Supply (Seats) More peak, less off-peak service operated Inefficient use of buses and facilities Low service hours/bus Low passengers/bus Unused capacity during off-peak periods There are strategies to address these problems VI-8
9 Some Areas Have Flat Demand Seats Relatively constant service operated e.g., Casablanca Passengers or Efficient use of buses and Pfacilities Time of Day Demand (Passengers) Supply (Seats) High service hours/bus High passengers/bus Capacity efficiently used during all periods VI-9
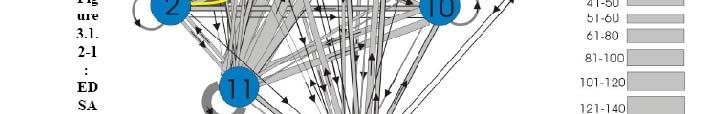
10 Urumqi, China 2006 O/D Survey Results VI-10
11 Urumqi, China VI-11


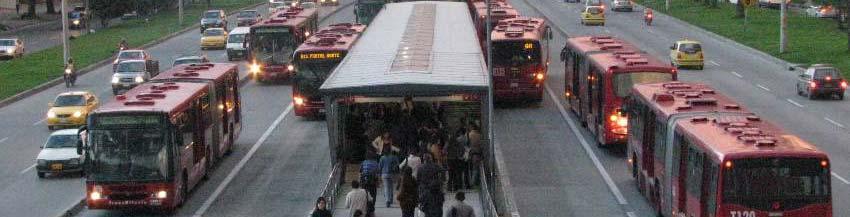
12 Manila EDSA Bus Users VI-12
13 Distance from Origin to Destination Extremely short trips (2 km) mostly made by walking Bicycles viable option up to 8-10 km Conventional bus trip lengths generally 5-10 km in developing cities Suburban rail trip length average over 10 km VI-13
14 Urumqi, China Trip Times 2006 O/D Survey VI-14
15 Intensity/Density y Land Use Residential (Origin) Activity Center (Destination) Availability of safe, secure walking environment Residential Activity Center VI-15
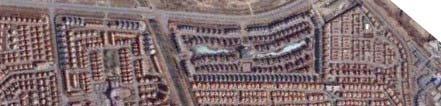
16 Origin/Destination Public transport works best for trips between: High density, walkable residential and High density walkable non-residential areas (e.g., traditional central business districts) That are arranged linearly along major arterials Traditional public transport does not serve well trips between: Low density residential areas and Low density employment areas That are arranged randomly VI-16

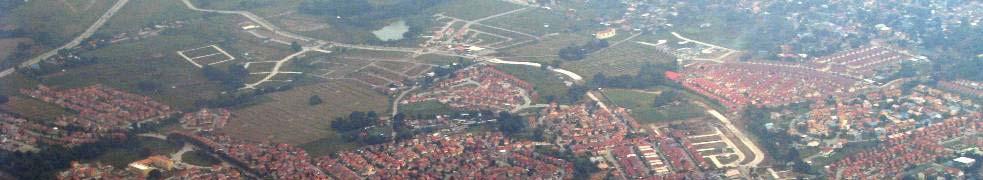
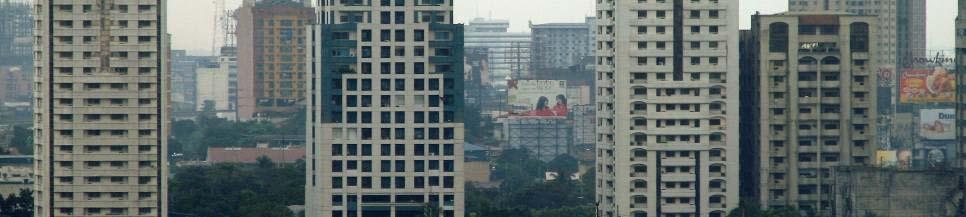
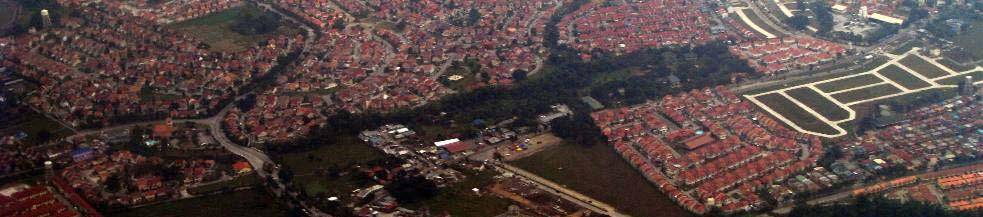
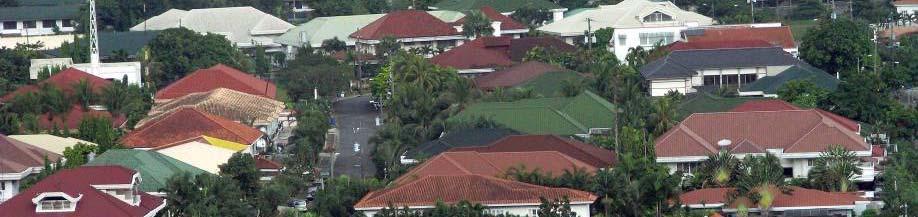
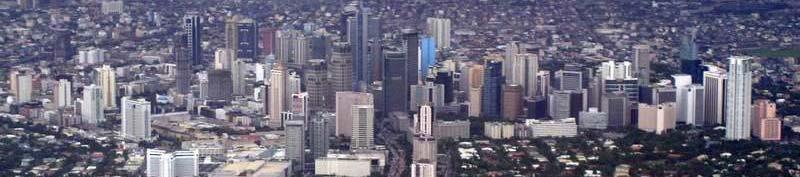
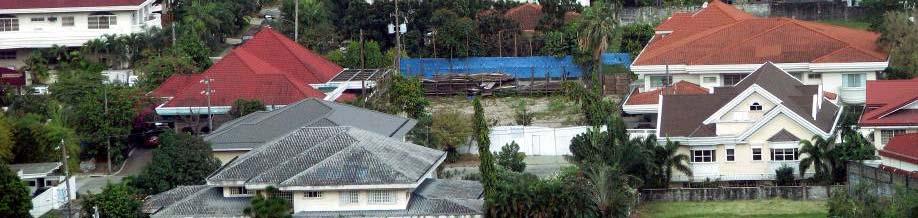
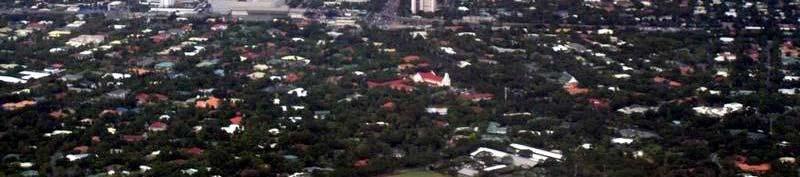
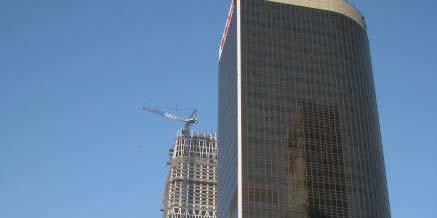
17 Land Use Variations in Manila VI-17
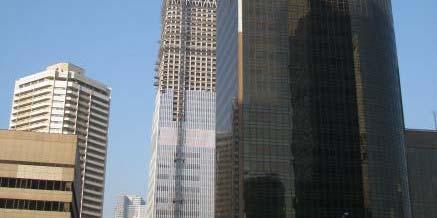
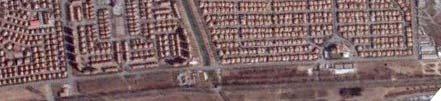

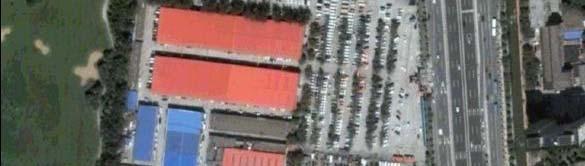
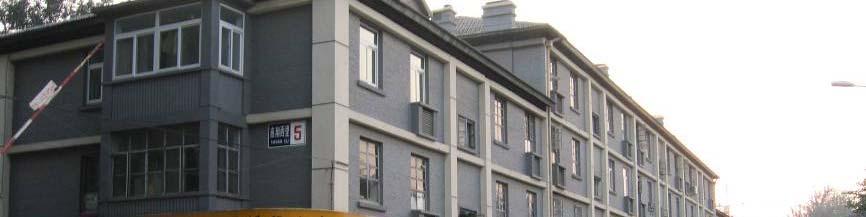
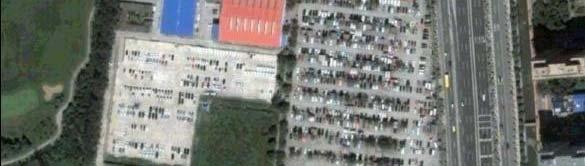
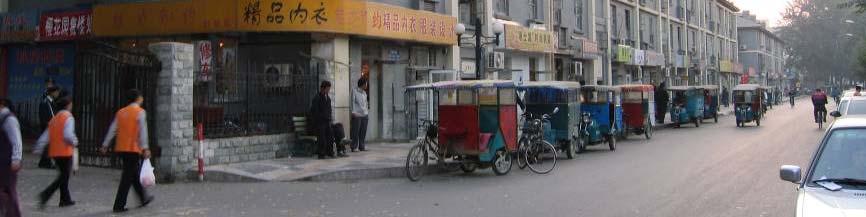
18 Land Use Variations in Beijing VI-18
19 Important Demographic Characteristics Income Gender Age Labor force/student t population VI-19
20 Low Income Affordability Income Is Most Important Demographic Factor A problem when fares > 10% to 20% of income Concessionary fares sometimes help Alternatives are walking, bicycling Medium Income Affordability is 3% to 5% of income Taxis, two-wheelers and sometimes autos are alternatives High Income Autos are an alternative VI-20


21 Bogota Travel by Income Group VI-21

 d) cities")


22 Gender Men are a larger proportion of PT riders in developing (not developed) d) cities Lower proportion of women working Higher proportion of women on weekends when non-work trips increase Religious rules Women s safety/security concerns Lighting at stops To stop/from stop VI-22
23 Gender Manila Edsa Bus Users 70% 60% 50% 40% 30% 20% 10% 0% 62.3% 37.7% Weekday 59.4% 40.6% Weekend Male Female VI-23
24 Age Majority of PT users between Workers Students Fewer older workers, students They may have money for taxis and other forms of private transport More younger travelers on weekends VI-24
25 Age Profile Manila EDSA Bus Users 25% 20% 15% 10% 5% % Age Weekday Weekend VI-25
26 Public Transport System Factors Levels and quality of PT service Travel times, reliability Comfort, amenities PT Fares Availability of safe, secure non-motorized access If affordable, availability of other options 2-, 3- and 4-wheeled taxis Private motor vehicles two-wheelers, autos VI-26
27 Levels and Quality of PT Service All travel time not the same Waiting, transferring and walking time much more onerous Reliability may be more important than average travel time Crowding a key quality factor, particularly for: Women Older people Higher income travelers with choices VI-27


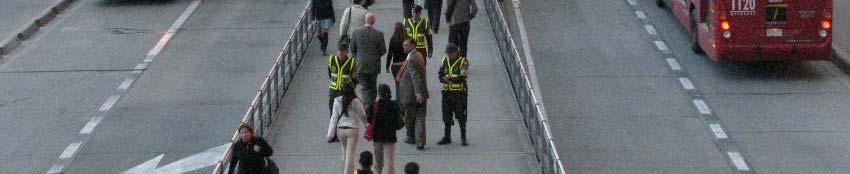
28 Availability of Safe, Secure Non-Motorized Access Pedestrian access conditions Sidewalk coverage and repair Crossings Bicycle facilities Bikeways Bicycle parking Beijing VI-28


29 Safety, Security and Traffic Management Availability and management of safe, secure access and waiting facilities are important determinant t of PT use (particularly l for women and senior citizens) Why? Pedestrians and bicycle users Large % of traffic injuries and deaths People going to/from/waiting for PT Large % of non-motorized travel deaths Perception and reality of crime VI-29
30 Passenger Information a Key Service Quality Parameter People need to be aware of options Routing Schedules Fares Many trips are non-recurring, making PT use difficult Non work Visitors Tourists A big issue in developing cities for local bus and small bus services VI-30
31 Why is Demand Estimation Needed? Ridership critical planning and design parameter Assess the passenger and revenue impacts of new services and facilities Assess the passenger and revenue impacts of service changes VI-31
32 Demand Estimation Techniques for Short-Medium Term Service Changes Similar routes method Apply existing service experience to a service change Statistical models Develop formula relating existing demand to existing service parameters Elasticity models Apply percent change to current ridership based on change in a fare or service parameter VI-32
33 Method Estimation Similar il Routes Ridership on proposed service will reflect ridership on an existing service 1. Select similar service based on (typical): Population density Generators served Service design (e.g., intervals, span) 2. Adjust ridership for differences Service levels Rider potential VI-33
34 Example of Similar Routes Problem Estimate ridership for a new route that will provide bus service between La Source (an edge town) and Orleans. Solution 1. Collect data for a similar route New Route Route 12 Population/Square Kilometer Daily Kilometers Daily Passengers? 3125 VI-34
35 Example of Similar Routes 2. Calculate ridership rate for Route 12 Ridership rate = Daily passengers / Daily kilometers = 3125 / 1800 = 1.74 passengers/km 3. Calculate l potential ti users for new route as a percent of Route 12 population density Potential (%) = Population density (New route)/ Population density (Route 12) = 15000/17000 = 88.2% VI-35
36 Example of Similar Routes 4. Estimate ridership rate for the new route Ridership rate = Route 12 ridership rate x Potential % = 1.74 passengers/km x 88.2% = 1.53 passengers/km 5. Estimate daily ridership rate for the new route Ridership rate = New route ridership rate x daily kilometers = 1.53 passengers/km x 1600 KM = 2448 passengers (or 2400) VI-36
37 Key Issues Similar Routes Method 1. Identification of key differences between existing and new route 2. Approach used to adjust for differences VI-37
38 Statistical Models r2 = 0.74 Method Estimation Based on ridership on existing routes and key service and demographic variables Ridership = B + A 1 X 1 + A 2 X A 3 X 3 1. Collect data on existing routes Socioeconomic variables e.g., income Land use variables e.g., population Service variables e.g., headway Daily ridership 2. Statistically calibrate model, develop mathematical parameters 3. Apply model VI-38
39 Example of Linear Regression Y Ridership B Population within 300 Meters of the Route X VI-39
40 e Method Elasticity Models Elasticity is the ratio of the percent change in ridership to the percent change in a transit service parameter (e.g., fares, service levels) Rider rs R Before R After Demand Curve F Before Fares F After VI-40
41 Summary Discussed factors that t affect public transport demand Described simple demand estimation approaches. Remember, understanding the market factors that influence public transport use is critical to Public Transport service planning VI-41
Market Factors and Demand Analysis. World Bank
 Market Factors and Demand Analysis Bank Workshop and Training on Urban Transport Planning and Reform. Baku, April 14-16, 2009 Market Factors The market for Public Transport is affected by a variety of
1999 On-Board Sacramento Regional Transit District Survey
 SACOG-00-009 1999 On-Board Sacramento Regional Transit District Survey June 2000 Sacramento Area Council of Governments 1999 On-Board Sacramento Regional Transit District Survey June 2000 Table of Contents
Pocatello Regional Transit Master Transit Plan Draft Recommendations
 Pocatello Regional Transit Master Transit Plan Draft Recommendations Presentation Outline 1. 2. 3. 4. What is the Master Transit Plan? An overview of the study Where Are We Today? Key take-aways from existing
Built Environment and Older Adults: Supporting Smooth Transitions Across the Life- Span. Dr. Lawrence Frank, Professor and Bombardier UBC
 Built Environment and Older Adults: Supporting Smooth Transitions Across the Life- Span Dr. Lawrence Frank, Professor and Bombardier Chair @ UBC The Hidden Health Costs of Transportation - Frank et al
PUBLIC TRANSPORTATION PLAN FOR THE CITY OF GEORGETOWN
 PUBLIC TRANSPORTATION PLAN FOR THE CITY OF GEORGETOWN PRESENTATION TO CITY COUNCIL JANUARY 22, 2008 PUBLIC TRANSIT FOR THE CITY OF GEORGETOWN LOCAL SERVICE For Georgetown residents to Georgetown destinations.
Executive Summary. TUCSON TRANSIT ON BOARD ORIGIN AND DESTINATION SURVEY Conducted October City of Tucson Department of Transportation
 Executive Summary TUCSON TRANSIT ON BOARD ORIGIN AND DESTINATION SURVEY Conducted October 2004 Prepared for: City of Tucson Department of Transportation May 2005 TUCSON TRANSIT ON BOARD ORIGIN AND DESTINATION
City of Davenport CitiBus Public Transportation Study. April 2015
 City of Davenport CitiBus Public Transportation Study April 2015 Overview Project Background Key Findings CitiBus Service Allocation Policy Discussion 2 Project Background 3 About CitiBus Operates 17 routes
Ridership Demand Analysis for Palestinian Intercity Public Transport
 Ridership Demand Analysis for Palestinian Intercity Public Transport Khaled A. Al-Sahili and Abdelmajid H. Sadeq An-Najah National University Abstract This article presents results of research to study
Intermodal Connections with Light Rail in Phoenix, AZ Wulf Grote, P.E. Director, Planning & Development
 Intermodal Connections with Light Rail in Phoenix, AZ Wulf Grote, P.E. Director, Planning & Development 12th National LRT Conference Salt Lake City, UT November 12, 2012 Outline METRO Light Rail Overview
Measuring and Communicating Mobility:
 Measuring and Communicating Mobility: The District Mobility Project Stephanie Dock, District Department of Transportation TRB Transportation Issues in Major Cities Committee May 2, 2017 Deconstructing
Integrated Corridor Approach to Urban Transport. O.P. Agarwal World Bank Presentation at CODATU XV Addis Ababa, 25 th October 2012
 Integrated Corridor Approach to Urban Transport O.P. Agarwal World Bank Presentation at CODATU XV Addis Ababa, 25 th October 2012 What is the Integrated Corridor Approach for Urban Transport Public? Why
RIDERSHIP PREDICTION
 RIDERSHIP PREDICTION Outline 1. Introduction: route ridership prediction needs and issues. 2. Alternative approaches to route ridership prediction. Professional judgement Survey-based methods Cross-sectional
Guidelines for Providing Access to Public Transportation Stations APPENDIX C TRANSIT STATION ACCESS PLANNING TOOL INSTRUCTIONS
 APPENDIX C TRANSIT STATION ACCESS PLANNING TOOL INSTRUCTIONS Transit Station Access Planning Tool Instructions Page C-1 Revised Final Report September 2011 TRANSIT STATION ACCESS PLANNING TOOL INSTRUCTIONS
Cherry Creek Transportation and Land Use Forum September 25, 2013 Meeting Summary
 Cherry Creek Transportation and Land Use Forum September 25, 2013 Meeting Summary I. LEAD-IN TO SMALL GROUP DISCUSSION, POLLING AND STEERING COMMITTEE/TECHNICAL TASK FORCE DISCUSSION The meeting began
TORONTO TRANSIT COMMISSION REPORT NO.
 Form Revised: February 2005 TORONTO TRANSIT COMMISSION REPORT NO. MEETING DATE: May 30, 2012 SUBJECT: ADDITIONAL OPERATING RESOURCE REQUIREMENTS TO MEET INCREASING TTC RIDERSHIP ACTION ITEM RECOMMENDATIONS
An Assessment of Potential Greenhouse Gas Emissions Reductions from Proposed On Street Bikeways
 An Assessment of Potential Greenhouse Gas Emissions Reductions from Proposed On Street Bikeways Through the Sustainable Bethlehem Initiative, the Town of Bethlehem has identified both the improvement of
A Selection Approach for BRT Parking Lots Nicolls Road Corridor Parking Study
 A Selection Approach for BRT Parking Lots Nicolls Road Corridor Parking Study Chirantan Kansara, P.E. Engineering Construction Design Planning 2018 ITE Northeastern District Annual Meeting Lake George,
Key objectives of the survey were to gain a better understanding of:
 3 COMMUNITY INPUT Community input is an essential part of corridor studies. For the SR 87 corridor study, VTA staff conducted an extensive online survey of people living and commuting along the corridor.
Calgary Transit Route 302 Southeast BRT Year One Review June
 Calgary Transit Route 302 Southeast BRT Year One Review 2011 June Calgary Transit Route 302 Southeast BRT: Year One Review 2011 April Table of Contents 1.0 Executive Summary... 1 2.0 Introduction... 3
Cabrillo College Transportation Study
 Cabrillo College Transportation Study Planning and Research Office Terrence Willett, Research Analyst, Principle Author Jing Luan, Director of Planning and Research Judy Cassada, Research Specialist Shirley
Philadelphia Bus Network Choices Report
 Philadelphia Bus Network Choices Report JUNE 2018 SEPTA Table of Contents Executive Summary...7 What if transit gave us more freedom?... 8 What is this report?... 8 The main conclusions... 9 What is happening
Transportation Trends, Conditions and Issues. Regional Transportation Plan 2030
 Transportation Trends, Conditions and Issues Regional Transportation Plan 2030 23 Regional Transportation Plan 2030 24 Travel Characteristics Why Do People Travel? Over one-half of trips taken in Dane
Modal Shift in the Boulder Valley 1990 to 2009
 Modal Shift in the Boulder Valley 1990 to 2009 May 2010 Prepared for the City of Boulder by National Research Center, Inc. 3005 30th Street Boulder, CO 80301 (303) 444-7863 www.n-r-c.com Table of Contents
Understanding Transit Demand. E. Beimborn, University of Wisconsin-Milwaukee
 Understanding Transit Demand E. Beimborn, University of Wisconsin-Milwaukee 1 Purpose To provide a basic understanding of transit ridership and some common misunderstandings. To explain concepts of choice
Peterborough Council on Aging
 Peterborough Council on Aging Discussion paper series #4, 2015 Transportation Transportation, including accessible and affordable public transport is a key factor influencing active aging. in particular,
Project Narrative. Albuquerque, NM. July 31, 2015
 Project Narrative Albuquerque, NM July 31, 2015 1 Project Identification As the first bus rapid transit (BRT) project in New Mexico, the Albuquerque Rapid Transit (ART) line will run through the heart
ATTACHMENT 4 - TDM Checklist. TDM Checklist Overview
 ATTACHMENT 4 - TDM Checklist TDM Checklist Overview The proposed checklist rates developments on the degree to which they are TDM and transit supportive. Points are assigned based on the level of transit
Purpose and Need. Chapter Introduction. 2.2 Project Purpose and Need Project Purpose Project Need
 Chapter 2 Purpose and Need 2.1 Introduction The El Camino Real Bus Rapid Transit (BRT) Project (Project) would make transit and other transportation improvements along a 17.6-mile segment of the El Camino
Everett Transit Action Plan. Community Open House November 16, 2015
 Everett Transit Action Plan Community Open House Everett has a great location, but getting around the city and into surrounding communities is a problem for all ages Many Voices, One Future: The Everett
Gold Team: Tempe Transportation. Group Members: Melissa Dobroski, Skylie Dosier, Jake Damle, Joseph Dean
 Gold Team: Tempe Transportation Group Members: Melissa Dobroski, Skylie Dosier, Jake Damle, Joseph Dean Outline Order of presentation: Introduction: Whats the Problem? Riding the 81 Line & Surveys Commuter
A MULTI-MODAL PUBLIC TRANSPORT SOLUTION FOR MALE, MALDIVES
 A MULTI-MODAL PUBLIC TRANSPORT SOLUTION FOR MALE, MALDIVES 11 TH CONFERENCE ON COMPETITION AND OWNERSHIP IN LAND PASSENGER TRANSPORT Delft University of Technology (The Netherlands) 20-25 September 2009
Access BART: TOD and Improved Connections. October 29, 2008
 Access BART: TOD and Improved Connections October 29, 2008 1 Access BART Study Goals Evaluate at the system-level land use and access scenarios to optimize ridership Identify station clusters that provide
Chapter 14 PARLIER RELATIONSHIP TO CITY PLANS AND POLICIES. Recommendations to Improve Pedestrian Safety in the City of Parlier (2014)
") Chapter 14 PARLIER This chapter describes the current status and future plans for biking and walking in the City of Parlier. RELATIONSHIP TO CITY PLANS AND POLICIES The Parlier General Plan is the primary
Chapter 14 PARLIER This chapter describes the current status and future plans for biking and walking in the City of Parlier. RELATIONSHIP TO CITY PLANS AND POLICIES The Parlier General Plan is the primary
Eliminate on-street parking where it will allow for a dedicated bus only lane %
 Traffic Dashboard Priorities Survey Responses Introduction 1) Are you familiar with bus rapid transit (BRT)? a. No, BRT is new to me. 597 23.5% b. I ve heard of BRT, but I don t know much about it. 1,136
HB 2017 Transit Advisory Committee. June 22, 2018
 HB 2017 Transit Advisory Committee June 22, 2018 Meeting Agenda Agenda & Public Comment Timeline Program Appeals: Streetcar, Demand Response, Fares, Electric Bus, Enhanced Transit Corridors Online Survey
WILMAPCO Public Opinion Survey Summary of Results
 Wilmington Area Planning Council WILMAPCO Public Opinion Survey Summary of Results Prepared by: 2955 Valmont Road, Suite 300 Boulder, Colorado 80301 t: 303-444-7863 f: 303-444-1145 www.n-r-c.com Table
EXECUTIVE SUMMARY... vii 1 STUDY OVERVIEW Study Scope Study Area Study Objectives
 Contents EXECUTIVE SUMMARY... vii 1 STUDY OVERVIEW... 1-1 1.1 Study Scope... 1-1 1.2 Study Area... 1-1 1.3 Study Objectives... 1-3 2 EXISTING CONDITIONS... 2-1 2.1 Existing Freeway Conditions... 2-4 2.1.1
Community & Transportation Preferences Survey
 Community & Transportation Preferences Survey Webinar: August 5, 2015 Hugh Morris, AICP, LEED Realtor.org Jennifer Dill, Ph.D. trec.pdx.edu 1 Introduction National Association of Realtors Over 1,000,000
THE 2010 MSP REGION TRAVEL BEHAVIOR INVENTORY (TBI) REPORT HOME INTERVIEW SURVEY. A Summary of Resident Travel in the Twin Cities Region
 REPORT HOME INTERVIEW SURVEY. A Summary of Resident Travel in the Twin Cities Region") THE 2010 MSP REGION TRAVEL BEHAVIOR INVENTORY (TBI) REPORT HOME INTERVIEW SURVEY A Summary of Resident Travel in the Twin Cities Region October 2013 WHAT IS THE TBI? The Travel Behavior Inventory (TBI)
THE 2010 MSP REGION TRAVEL BEHAVIOR INVENTORY (TBI) REPORT HOME INTERVIEW SURVEY A Summary of Resident Travel in the Twin Cities Region October 2013 WHAT IS THE TBI? The Travel Behavior Inventory (TBI)
PASSENGER SURVEY RESULTS
 ROGUE VALLEY TRANSPORTATION DISTRICT PASSENGER SURVEY RESULTS Date: December 12, 2018 Project #: 21289 To: Paige West, RVTD From: Susan Wright, PE; Molly McCormick; (Kittelson & Associates, Inc.) Subject:
2. Transportation in Ottawa Today and Tomorrow
 2. Transportation in Ottawa Today and Tomorrow 2.1 Transportation System Overview The City. The City of Ottawa is the largest municipality in the National Capital Region (NCR). Urban development covers
TRANSIT-ORIENTED DEVELOPMENT POLICY. City Planning and Development Department Kansas City, Missouri
 TRANSIT-ORIENTED DEVELOPMENT POLICY City Planning and Development Department Kansas City, Missouri TOD Framework Connectivity: Expand transit access, increase mobility options Integrated system of pedestrian,
2. Context. Existing framework. The context. The challenge. Transport Strategy
 Transport Strategy Providing quality connections Contents 1. Introduction 2. Context 3. Long-term direction 4. Three-year priorities 5. Strategy tree Wellington City Council July 2006 1. Introduction Wellington
Transit Workshop with MPO Board
 Transit Workshop with MPO Board Overview of Workshop What is a TDP? Historical trends Existing bus service 2028 Recent public outreach Future direction Policy Questions 1 What TDP is Not Not a budget Not
APPENDIX C Arlington Transit On-Board Survey Technical Memorandum
 APPENDIX C Arlington Transit On-Board Survey Technical Memorandum Arlington County Appendix C December 2010 TABLE OF CONTENTS 1.0 Overview of Transit Rider Survey Process... 1 2.0 Responses to Survey Questions...
Estimating Ridership of Rural Demand-Response Transit Services for the General Public
 Estimating Ridership of Rural Demand-Response Transit Services for the General Public August 2016 prepared for US DOT prepared by Jeremy Mattson North Dakota State University Upper Great Plains Transportation
Cities Connect. Cities Connect! How Urbanity Supports Social Inclusion
 Cities Connect! How Urbanity Supports Social Inclusion Todd Litman Victoria Transport Policy Institute Metropolis Toronto, Canada - 14 June 2006 Cities Connect People with people. People with jobs. People
Transit Ridership - Why the Decline and How to Increase. Hosted by the. Virginia Transit Association
 Transit Ridership - Why the Decline and How to Increase Hosted by the Virginia Transit Association Virginia Transit Association 1108 East Main Street, Suite 1108 Richmond, VA 23219 804.643.1166 www.vatransit.com
Central Oregon Intergovernmental Council
 Central Oregon Intergovernmental Council Regional Transit Master Plan (RTMP) Technical Advisory Committee Kick-Off Meeting May 16, 2012 Meeting Agenda Project Orientation Presentation of Survey Results
Typical Rush Hour Commute. PennyforTransportation.com
 Typical Rush Hour Commute In the News Overview of the Plan Collaborative plan with projects in every community Prioritizing connectivity and congestion relief Dedicated transportation-specific funding;
Dear City Council Members,
 From: Bob Kenyon [mailto: ] Sent: Monday, February 08, 2016 10:20 AM To: City Clerk Subject: Please prioritize Caltrain and a complete transit network Thank you for prioritizing bringing BART to San Jose
Traffic Safety Barriers to Walking and Bicycling Analysis of CA Add-On Responses to the 2009 NHTS
 Traffic Safety Barriers to Walking and Bicycling Analysis of CA Add-On Responses to the 2009 NHTS NHTS Users Conference June 2011 Robert Schneider, Swati Pande, & John Bigham, University of California
Free Ride Transit System 2014 On Board Passenger Survey
 Free Ride Transit System 2014 On Board Passenger Survey March 28, 2014 INTRODUCTION The last on-board passenger survey was conducted by the Breckenridge Free Ride on March 30, 2012. The 2012 survey had
TRANSIT RIDERSHIP IMPROVEMENT PROGRAM CAPITAL PROJECTS OPERATING PLANS - NEXT NETWORK TRANSIT INFORMATION TECHNOLOGY
 TRANSIT RIDERSHIP IMPROVEMENT PROGRAM CAPITAL PROJECTS OPERATING PLANS - NEXT NETWORK TRANSIT INFORMATION TECHNOLOGY VTA S NEXT NETWORK CONNECT TO BART STATIONS INCREASE RIDERSHIP IMPROVE FAREBOX RECOVERY
June 3, Attention: David Hogan City of San Mateo 330 W. 2oth Avenue San Mateo, CA 94403
 June 3, 2015 Attention: David Hogan City of San Mateo 330 W. 2oth Avenue San Mateo, CA 94403 Regarding: PA # 15-030, Bridgepointe Shopping Center 2202 Bridgepointe Parkway, APN 035-466-10 Dear David: Enclosed
Midtown Corridor Alternatives Analysis
 Midtown Corridor Alternatives Analysis Ridership Forecast Methodology and Results December 2013 Prepared by the SRF Consulting Group Team for Table of Contents Introduction... 1 Methodology... 1 Assumptions...
Corridor Advisory Group Meeting #1 June 7, 2018
 Corridor Advisory Group Meeting #1 June 7, 2018 Agenda Introductions Project Overview CAG Role and Goals for Today Existing Conditions Review Discussion and Next Steps CTA bus at Halsted and 87 th Streets
Community & Transportation Preferences Survey U.S. Metro Areas, 2015 July 23, 2015
 Community & Transportation Preferences Survey U.S. Metro Areas, 2015 July 23, 2015 Realtor.org trec.pdx.edu 1 Highlights: Generation gaps in everyday travel Only 71% of Millennials like driving (the lowest
Set of plans containing details for game day operations of the Ballpark. Plans set forth the responsibilities and the specific actions of:
 What is the TOPP? Set of plans containing details for game day operations of the Ballpark. Plans set forth the responsibilities and the specific actions of: Ballpark management, District Department of
Building a Toronto that Moves
 Building a Toronto that Moves Image courtesy of the City of Toronto Setting Election Priorities for Walking, Cycling & Public Transit Toronto is a fast-paced, dynamic city. It s a city that moves except
Application of SUTI in Colombo (Western Region)
") Application of SUTI in Colombo (Western Region) Dr Dimantha De Silva Senior Lecturer, University of Moratuwa Capacity Building Workshop on Sustainable Urban Transport Index (SUTI) 30 th & 31 st October
Application of SUTI in Colombo (Western Region) Dr Dimantha De Silva Senior Lecturer, University of Moratuwa Capacity Building Workshop on Sustainable Urban Transport Index (SUTI) 30 th & 31 st October
City of White Rock. Strategic Transportation Plan. May 16, 2005
 City of White Rock Strategic Transportation Plan May 16, 2005 1 Outline Scope of Plan & Approach Council input and direction Key issues based on existing conditions Range of strategies to consider? Next
Community Transit Solutions for the Suburbs APTA Annual Meeting Steve Fittante, New Jersey Transit Corporation September 30, 2013
 Community Transit Solutions for the Suburbs APTA Annual Meeting Steve Fittante, New Jersey Transit Corporation September 30, 2013 New Suburban Challenges Lower density development patterns Where is the
Low Carbon Mobility Plan For Indian Cities
 Low Carbon Mobility Plan For Indian Cities Data Requirement and BAU Scenario Workshop on Developing Policies and Strategies for Low Carbon Transport in India, 24-25 August, 2012 In Indian context NMT and
People killed and injured per million hours spent travelling, Motorcyclist Cyclist Driver Car / van passenger
 Cyclists CRASH FACTSHEET 27 CRASH STATISTICS FOR THE YEAR ENDED 31 DEC 26 Prepared by Strategy and Sustainability, Ministry of Transport Cyclists have a number of risk factors that do not affect car drivers.
Capital Bikeshare 2011 Member Survey Executive Summary
 Capital Bikeshare 2011 Member Survey Executive Summary Prepared by: LDA Consulting Washington, DC 20015 (202) 548-0205 June 14, 2012 EXECUTIVE SUMMARY Overview This report presents the results of the 2012
Measuring Transportation: Traffic, Mobility and Accessibility
 Measuring Transportation: Traffic, Mobility and Accessibility THIS FEATURE COMPARES THREE APPROACHES TO MEASURING TRANSPORTATION SYSTEM PERFORMANCE. TRAFFIC-BASED MEASUREMENTS EVALUATE MOTOR VEHICLE MOVEMENT;
The Impact of Placemaking Attributes on Home Prices in the Midwest United States
 The Impact of Placemaking Attributes on Home Prices in the Midwest United States 2 0 1 3 C O N S T R U C T E D E N V I R O N M E N T C O N F E R E N C E M A R Y B E T H G R A E B E R T M I C H I G A N
TRANSIT & NON-MOTORIZED PLAN DRAFT FINAL REPORT Butte County Association of Governments
 1 INTRODUCTION Maintaining a high quality of life is the essence of this plan for transit and non-motorized transportation in Butte County. Curbing greenhouse gas emissions (GHG) by reducing congestion,
Appendix A-1: Purpose and Need Statement
 Appendix A-1: Purpose and Need Statement PURPOSE AND NEED STATEMENT Western & Ashland Corridors Bus Rapid Transit (BRT) Project Prepared for Chicago Transit Authority 567 West Lake Street Chicago, IL 60661
CONTEXT SENSITIVE STREETS STANDARDS COMMITTEE
 CONTEXT SENSITIVE STREETS STANDARDS COMMITTEE February 23, 2015 Prepared by: Denise Chaplick, AICP City Jacksonville Bicycle and Pedestrian Coordinator Source: NCDOT Complete Streets Planning and Design
TRANSPORTATION & MOBILITY
 TRANSPORTATION & MOBILITY ROADWAY SYSTEM There are approximately 40 miles of roadways in Manitou Springs. For planning purposes, roadways are typically assigned a functional classification which defines
Most Important Part of any Plan
 Most Important Part of any Plan Objectives must be evaluated to determine if they have been achieved Achievement of Objectives: 10 of 13 Objectives Achieved 1 not achieved 2 not due yet Transportation
Summary Report: Built Environment, Health and Obesity
 Research and education Built Environment Edmonton Project Summary Report: Built Environment, Health and Obesity Introduction In 2007 the Canadian Institutes of Health Research and the Heart and Stroke
Location Matters: Where America Is Moving
 Location Matters: Where America Is Moving Nearly half of all American households plan to move at some point in the future. While some will move for a larger or nicer home, or perhaps to purchase a home
Land Use and Cycling. Søren Underlien Jensen, Project Manager, Danish Road Directorate Niels Juels Gade 13, 1020 Copenhagen K, Denmark
 Land Use and Cycling Søren Underlien Jensen, Project Manager, Danish Road Directorate Niels Juels Gade 13, 1020 Copenhagen K, Denmark suj@vd.dk Summary: Research about correlation between land use and
Urban planners have invested a lot of energy in the idea of transit-oriented
 DOES TRANSIT-ORIENTED DEVELOPMENT NEED THE TRANSIT? D A N I E L G. C H AT M A N Urban planners have invested a lot of energy in the idea of transit-oriented developments (TODs). Developing dense housing
Webinar- Importance of Multi- Modal Transit Connections and Fare Policy for Regional Transit Mobility & Equity
 Webinar- Importance of Multi- Modal Transit Connections and Fare Policy for Regional Transit Mobility & Equity Thomas Marchwinski Metro North RR (Previously with NJ Transit) Importance of Multi-Modal Transit
Online Open House Survey Report. December 2016
 December 216 I. OVERVIEW & OUTREACH SUMMARY Introduction Washington County evaluated long-term transportation investments and strategies as part of the Transportation Futures Study. The purpose of the
Rail Station Fact Sheet CentrePort/DFW Airport Station
 Rail Station Fact Sheet CentrePort/DFW Airport Station Station Overview CentrePort/DFW Airport Station is located by Statler Boulevard at Breezewood Drive in Fort Worth. Free shuttles connect the station
REGIONAL HOUSEHOLD TRAVEL SURVEY:
 Defining the Vision. Shaping the Future. REGIONAL HOUSEHOLD TRAVEL SURVEY: Profile Why we travel How we travel Who we are and how often we travel When we travel Where we travel How far and how long we travel
ROUTE 52 ALLENTOWN. Port Authority of Allegheny County
 ROUTE 52 ALLENTOWN Route 52 Allentown is a limited service LRT line that operates on weekdays between South Hills Junction and downtown Pittsburgh. The route serves the Allentown neighborhood and skirts
Briefing Paper #1. An Overview of Regional Demand and Mode Share
 2011 Metro Vancouver Regional Trip Diary Survey Briefing Paper #1 An Overview of Regional Demand and Mode Share Introduction The 2011 Metro Vancouver Regional Trip Diary Survey is the latest survey conducted
City of Edmonton - ETS. ETS Ridership Growth Strategy and Planning Review. Summary Report. May Excellence in Transportation Planning
 Attachment 1 City of Edmonton - ETS ETS Ridership Growth Strategy and Planning Review Summary Report May 2008 Excellence in Transportation Planning ENTRA Consultants Page i City of Edmonton ETS ETS Ridership
METRO Light Rail: Changing Transit Markets in the Phoenix Metropolitan Area
 METRO Light Rail: Changing Transit Markets in the Phoenix Metropolitan Area Abhishek Dayal, AICP Planner III, METRO Light Rail Phoenix, AZ BACKGROUND Transit in the Phoenix Region Transit services in the
Chapter 5. Principles Appropriating Process
 Chapter 5 Principles Appropriating Process New, post and other urbanism [ ] However these urbanism are perceived, they do represent different values and sensibilities. They need to be situated in time
Understanding the Market of Metro Transit's Ridership and Services and How Technology Can Help Kevin J. Krizek Ahmed M. El-Geneidy
 Understanding the Market of Metro Transit's Ridership and Services and How Technology Can Help Kevin J. Krizek Ahmed M. El-Geneidy University of Minnesota Understanding the Market of Metro Transit's
APPENDIX A LITERATURE REVIEW AND SUMMARY OF STAKEHOLDER INTERVIEWS
 APPENDIX A LITERATURE REVIEW AND SUMMARY OF STAKEHOLDER INTERVIEWS Page A-1 Revised Final Report September 2011 INTRODUCTION A literature review was conducted to identify the current body of knowledge
Measuring the Distribution and Costs of Congestion. Tim Lomax Texas Transportation Institute
 Measuring the Distribution and Costs of Congestion Tim Lomax Texas Transportation Institute http://mobility.tamu.edu The Congestion Measurement Story Travel time, variations, compare to goals WHAT? WHY?
FY2006 Budget Board Budget Committee request for information. Board Request: Detailed information on bus route 5A DC-Dulless Airport
 Board Request: Detailed information on bus route 5A DC-Dulless Airport Tracking Number: 29 Assigned to Dept/Office: OPER Contact Person: Jim Hughes Metrobus Route 5A was established in December 2000 in
HENDERSON DEVELOPMENT 213, 217, 221, 221 ½, 223 HENDERSON AVENUE and 65 TEMPLETON STREET OTTAWA, ONTARIO TRANSPORTATION OVERVIEW.
 HENDERSON DEVELOPMENT 213, 217, 221, 221 ½, 223 HENDERSON AVENUE and 65 TEMPLETON STREET OTTAWA, ONTARIO TRANSPORTATION OVERVIEW Prepared for: 2294170 Ontario Inc. February 2, 2017 117-652 Report_1.doc
the Story of the 30s & 70s Bus Lines James Hamre - WMATA
 Evaluation of a Service Restructuring: the Story of the 30s & 70s Bus Lines James Hamre - WMATA Metrorail is the second largest rail transit system in the nation 230 million annual riders 780,000 weekday
U.S. Bicycling Participation Study
 U.S. Bicycling Participation Study Report of findings from the 2016 survey Conducted by Corona Insights Commissioned by PeopleForBikes Released July 2017 Table of Contents Background and Objectives 3 Research
2015 Origin/Destination Study
 2015 Origin/Destination Study Research Report for Prepared by: March 2016 Table of Contents Summary of Findings... 7 Rider Profile... 7 Frequency of Use... 7 Transit Dependence... 7 Age... 7 Income...
Capital and Strategic Planning Committee. Item III - B. April 12, WMATA s Transit-Oriented Development Objectives
 Capital and Strategic Planning Committee Item III - B April 12, 2018 WMATA s Transit-Oriented Development Objectives Page 24 of 76 Washington Metropolitan Area Transit Authority Board Action/Information
Flyaway Bus: GIS Analysis on Current and Potential Ridership, Revenue, and Prospective Stations
 ProfessorBarry Waite & Bonnie Shrewsbury Flyaway Bus: GIS Analysis on Current and Potential Ridership, Revenue, and Prospective Stations 1. Abstract The Flyaway Bus is a long distance non-stop shuttle
MOBILITY CHALLENGES IN HILL CITIES
 MOBILITY CHALLENGES IN HILL CITIES Lalmuansanga Ralte, MCS Pvt Secretary to Minister & Under Secretary Urban Development & Poverty Alleviation Department Govt. of Mizoram DEMOGRAPHIC OVERVIEW INDIA MIZORAM
A location model for pedestrian crossings in arterial streets
 A location model for pedestrian crossings in arterial streets B. Amini¹ & H. Ghahramani² ¹Department of Civil Engineering, International University of Imam Khomeini, Iran ²Iran University of Science and
EASTERN SHORE ALTERNATIVE TRANSPORTATION MODE STUDY FOR DISABLED, ELDERLY, LOW-INCOME, AND YOUTH POPULATION
 EASTERN SHORE ALTERNATIVE TRANSPORTATION MODE STUDY FOR DISABLED, ELDERLY, LOW-INCOME, AND YOUTH POPULATION Accomack-Northampton Planning District Commission Eastern Shore of Virginia Transportation Technical
Bus Rapid Transit (BRT) sets a new global trend in public transportation
 sets a new global trend in public transportation") 01 Transportation Planning 7 International comparative study of Seoul BRT system Ko, Joonho Summary The ridership of the bus rapid transit system in Seoul is the fifth highest among 162 cities worldwide,
01 Transportation Planning 7 International comparative study of Seoul BRT system Ko, Joonho Summary The ridership of the bus rapid transit system in Seoul is the fifth highest among 162 cities worldwide,