Fuzzy Logic in Traffic Control
|
|
|
- Myron Benson
- 6 years ago
- Views:
Transcription

1 Fuzzy Logic in Traffic Control State Trafic Departement Baden Württemberg Martin Pozybill Bernhard Krause realized by INFORM Software Corporation
2 Fuzzy Logic in Components of Traffic Control Systems Weather Station Visual Range Meter Traffic Sign Gantry Road Sensor Intelligent Control Section Station Traffic Control Computer Analyse Weather Condition Traffic Detection Signal Analysis at Induction Sensors Supervise Field Equippment Incident Detection Traffic Flow Analysis
3 Vehicle Classification at Traffic Detection Sensors Required Information: Vehicle Speed and Type Evaluate Speed: Evaluate Length: v Fahrzeug = Sensorabstand / t v L Fahrzeug = v Fahrzeug / t L to Classify Vehicles in Cars and Trucks t v t L
4 Vehicle Classification at Traffic Detection Sensors Misleading: Talegating Cars are Detected as Trucks Solution: Use Car Speed as Additional Criteria L = 6 m and v = 12 km/h : Car L =14 m and v = km/h : Truck L = 8 m and v = km/h : Truck L = 8 m and v = 14 km/h : 2 Cars Implemetation: Defining Borderes is not always Plausible L = 8 m und v = 12 km/h : 2 Cars L = 8 m und v = 119 km/h : Truck Use of Multiple Criteria results in Black Box System

5 Vehicle Classification at Traffic Detection Sensors Fuzzy Logic Describe Criteria as Linguistic Variable Example Car Length: typical Car ; Long Truck ; 2 Cars ; Short Truck Example Car Speed: fast ; regular ; slow Describe Expirience as Fuzzy Rules A detected signal showing a speed of 8 km/h represents usually a truck. A detected signal showing a vehicle length of 1 meter at low speed is assumed to be a truck, at high speed is assumed to be 2 cars.
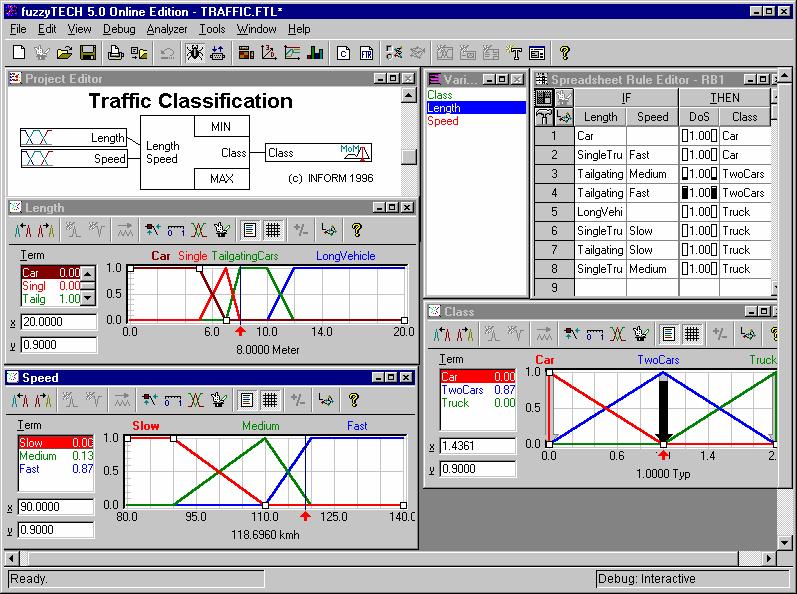
6 Vehicle Classification
7 Road Map and Traffic Detection Road Map Data Acquisition Uses existing Detection Systems Traffic: q Car, q HGV, v Car, v HGV (per time for every lane) Road Map: Distance between adjacent cross sections (= section), location of ascents, descents, entrances, exits Reduces required data volume Environmental Detection Traffic Sign Gantry Traffic Detection Local Computer Central Traffic Computer
8 8! 8 Substitute Values History Road Map Substitute Values Data Acquisition Substitute missing Data by Time-Distance Traffic Forecast use previous cross section to forecast traffic on main and exit lanes use following cross section to forecast traffic on entrance lanes use historical data when neighbor cross section not available Time Distance Forecast ➀ ➁ ➂ Detect ariving vehicles at cross section, Trace vehicles during the sector by using detected vehicle speed, calculate number of cars, that arrive at subsequent cross section for q q v v

9 Traffic Detection History Road Map Substitute Values Data Acquisition Compare Data of Neighbor Sections to Localize Incorrect Equipment Compare Neighbor Cross Sections to Check Detection for all Sections 3 2 1

10 Analyze Environmental Data Supervise Data Sequence Plausibilty of Environmental Data Road Surface and Precipitation Precipitation Type Road and Freezing Temperature Visual Range Condition Road Carpet Visual Range Wether Station Visual Range Meter Road Sensor

11 Road Condition Biological Hazard in Precibitation Intensity Sensor During heavy rainfall, the road surface must be wet. Comparing road sensor with precibitation intensity sensor detects failure. Automatical detection of road condition Avoid wrong display Initiate maintenance of local equipment
12 Temperature under Freezing Point Visual Range goes down quickly Visual Range Wrong Fog Warning caused by icing Visual Range Meter Fog occures slightly, a quick descent of visual range can be compared with other environmental data as air temperature and humidity. Automatical detection of environmental condition Avoid wrong display Initiate maintenance of local equipment
13 Environmental Condition Indicate Hail History Road Map Road Fog Environ. Substitute Values Data Acquisition Indicate Precibitation Type compare environmental data from different sensors Automatical detection of precibitation type Initiate display of traffic sign Visual Range reduced Air Temp. higher to 2 C Heavy Wind Temperature on Road Surface higher than Air Temperature Road Surface wet
14 Analyse Traffic Data Incident Detection Jam Road Fog Traffic Environ. If vehicle drivers reduce speed, a reason must be asumed. Vehicles detected at a cross section must occure at the following cross section after the time they need to pass the section. Otherwise there is an incident. Incidents (e.g. accidents) can be detected when vehicles, that have passed the previous cross section, do not occur at the following. Detection by observing the traffic behind the incident. Appliable to section with distance >4 km between observation.
15 Analyze Traffic Situation Accident on State Highway B27 Jam Road Fog Traffic Environ Accident Report Accident Time: 19:4 in Police Record, Location: B27 Direction Stuttgart between Cross Sections 6 and 7 of Control System 19:1 19:2 19:3 19:4 19:5 Traffic Volume at Cross Section 7 2: 2:1 Reason: Vehicle driving in wrong Direction Supervised Sector: 621 m Low Traffic Volume
16 Analyze Traffic Situation Accident on State Highway B27 Jam Road Fog Traffic Environ Accident Report Accident Time: 19:4 in Police Record, Location: B27 Direction Stuttgart between Cross Sections 6 and 7 of Control System 19:1 19:2 19:3 19:4 19:5 Traffic Volume at Cross Section 7 Average Speed at Cross Section 6 2: 2:1 Reason: Vehicle driving in wrong Direction Supervised Sector: 621 m Low Traffic Volume
17 Analyze Traffic Situation Accident on State Highway B27 Jam Road Fog Traffic Environ Accident Report Accident Time: 19:4 in Police Record, Location: B27 Direction Stuttgart between Cross Sections 6 and 7 of Control System 19:1 19:2 19:3 19:4 19:5 Traffic Volume at Cross Section 7 Average Speed at Cross Section 6 2: 2:1 Reason: Vehicle driving in wrong Direction Supervised Sector: 621 m Traffic Density between Cross Sections Low Traffic Volume
18 Analyze Traffic Situation Accident on State Highway B27 Jam Road Fog Traffic Environ Incident Detection :1 19:2 19:3 19:4 19:5 Average Speed at Cross Section 6 2: 2:1 Conventional Approach: Congestion Warning requires 18 Minutes Traffic Condition of Conventional System
19 Analyze Traffic Situation Accident on State Highway B27 Jam Road Fog Traffic Environ Incident Detection :1 19:2 19:3 19:4 19:5 Average Speed at Cross Section 6 2: 2:1 Fuzzy Logic Congestion Warning requires 3 Minutes Traffic Condition computed by Fuzzy Logic
20 Analyze Traffic Situation Accident on State Highway B27 Jam Road Fog Traffic Environ Accident Report Accident , 19:4 Location B 27 Direction Stuttgart in Supervized Area of Control System between Cross Sections 6 and 7 Sector Length: 621 m Low Traffic Volume 19:1 19:2 19:3 19:4 19:5 Traffic Volume at Cross Section 7 Average Speed at Cross Section 6 Conventional computed Traffic Condition 2: Required Time Fuzzy: 3 Minutes Conventional: 2:1 18 Minutes Fuzzy Logic enables More Reliable and
21 Analyze Traffic Situation Accident on State Highway B27 Jam Road Fog Traffic Environ Large Sector Length Accident , 19:4 Location: Analyze Cross Section 5 and 7 Direction Stuttgart Sector Length: 164 m Low Traffic Volume 19:1 19:2 19:3 19:4 19:5 Traffic Volume at Cross Section 7 Average Speed at Cross Section 6 Conventional computed Traffic Condition 2: Required Time for Detection: Fuzzy Logic: 2:1 3 Minutes Conventional: No Detection
22 Analyse Traffic Data Traffic Condition Jam Cond. Road Fog Traffic Environ. Usually the traffic flow is regular. Within regular traffic flow, the results evaluated at local observation points can be used to describe the traffic situation for the complete section. Use regular traffic flow to estimate the number of cars that are currently between two croos sections (real traffic density estimation). Use a subsequent calculation of arriving and departing vehicles to estimate the real traffic density in unstable traffic situations. + -

23 Map Traffic Condition to Traffic Sign Gantry Display Traffic Sign Mapping to Traffic Sign Gantry Jam Cond. Road Fog Traffic Environ. 14: 14: 14:1 14: 14:
24 Control by Variable Traffic Signs Display Traffic Sign Mapping to Traffic Sign Gantry Jam Cond. Road Fog Traffic Environ. Select Traffic Sign for Display at all Traffic Sign Gantries Fuzzy Logic Control evaluates Traffic, Road, and Visual Range Condition. Existing assignments to the available traffic signs can be used. Bounds on subsequent displays, (e.g. decreasing speed limits before detected congestion) and individual operator control of existing systems can be used. Fuzzy Traffic Control allows for more flexible and transparent control systems, that decrease maintenance and operational effort Fuzzy Traffic Control can be used on existing systems Fuzzy Traffic Control was initiated by a State Traffic Departement, responsible to operate and maintain existing traffic control systems.
25 Traffic Control by Fuzzy Logic (using variable traffic signs) State Traffic Departement Baden-Württemberg Select Traffic Sign for Display Dynamical Mapping of Traffic Situation to Traffic Sign Gantries Incidentdetection Traffic Situation Road Condition Fog Condition Traffic Analysis Environmental Analysis Check Data Plausibility Historical Data Substitute Values (Traffic and Environmetal Data) Road Map Data Aquisition (Traffic and Environmetal Data)
Successful traffic operations require precise, real-time information.
 Successful traffic operations require precise, real-time information. Every year, more and more vehicles crowd the world s roadways aggravating congestion, increasing travel times and jeopardizing safety.
UNIT V 1. What are the traffic management measures? [N/D-13] 2. What is Transportation System Management (TSM)? [N/D-14]
![UNIT V 1. What are the traffic management measures? [N/D-13] 2. What is Transportation System Management (TSM)? [N/D-14]](/thumbs/87/95571671.jpg "UNIT V 1. What are the traffic management measures? [N/D-13] 2. What is Transportation System Management (TSM)? [N/D-14]") UNIT V 1. What are the traffic management measures? [N/D-13] Some of the well-known traffic management measures are: a) Restrictions on turning movements b) One - way streets c) Tidal - flow operations
UNIT V 1. What are the traffic management measures? [N/D-13] Some of the well-known traffic management measures are: a) Restrictions on turning movements b) One - way streets c) Tidal - flow operations
Designing a Traffic Circle By David Bosworth For MATH 714
 Designing a Traffic Circle By David Bosworth For MATH 714 Abstract We all have had the experience of sitting in a traffic jam, or we ve seen cars bunched up on a road for some no apparent reason. The use
M1 Smart Motorways Junctions 32 to 35a
 M1 Smart Motorways Junctions 32 to 35a How Smart Motorways work Junctions 32 to 35a About Smart Motorways The M1 is a major strategic route connecting people, communities and businesses, carrying over
How to achieve fluid traffic
 Kanton Basel-Stadt How to achieve fluid traffic Objectives, instruments and limits of traffic management Alain Groff, Office for Mobility, Canton of Basel-Stadt Overview Some figures about Basel Tools
METHODOLOGY. Signalized Intersection Average Control Delay (sec/veh)
") Chapter 5 Traffic Analysis 5.1 SUMMARY US /West 6 th Street assumes a unique role in the Lawrence Douglas County transportation system. This principal arterial street currently conveys commuter traffic
Chapter 5 Traffic Analysis 5.1 SUMMARY US /West 6 th Street assumes a unique role in the Lawrence Douglas County transportation system. This principal arterial street currently conveys commuter traffic
THE EFFECTS OF LEAD-VEHICLE SIZE ON DRIVER FOLLOWING BEHAVIOR: IS IGNORANCE TRULY BLISS?
 THE EFFECTS OF LEAD-VEHICLE SIZE ON DRIVER FOLLOWING BEHAVIOR: IS IGNORANCE TRULY BLISS? James R. Sayer, Mary Lynn Mefford Human Factors Division University of Michigan Transportation Research Institute
Exemplary Conditional Automation (Level 3) Use Case Description Submitted by the Experts of OICA as input to the IWG ITS/AD
 Use Case Description Submitted by the Experts of OICA as input to the IWG ITS/AD") Submitted by OICA Document No. ITS/AD-06-05 (6th ITS/AD, 3 November 2015, agenda item 3-2) Exemplary Conditional Automation (Level 3) Use Case Description Submitted by the Experts of OICA as input to the
Submitted by OICA Document No. ITS/AD-06-05 (6th ITS/AD, 3 November 2015, agenda item 3-2) Exemplary Conditional Automation (Level 3) Use Case Description Submitted by the Experts of OICA as input to the
A study on the relation between safety analysis process and system engineering process of train control system
 A study on the relation between safety analysis process and system engineering process of train control system Abstract - In this paper, the relationship between system engineering lifecycle and safety
Tools for safety management Effectiveness of risk mitigation measures. Bernhard KOHL
 Tools for safety management Effectiveness of risk mitigation measures Bernhard KOHL Contents Background Tools for risk-based decision making Safety measures Illustration of methodical approach Case studies
3 TRAFFIC CONTROL SIGNAL TIMING AND SYNCHRONIZATION
 Report No. 8 of the Transportation Services Committee Regional Council Meeting of October 20, 2011 3 TRAFFIC CONTROL SIGNAL TIMING AND SYNCHRONIZATION The Transportation Services Committee recommends:
SUBJECT: I-82 Existing Conditions I-84 Boardman to Ontario Corridor Management Plan P
 720 SW Washington St. Suite 500 Portland, OR 97205 503.243.3500 www.dksassociates.com MEMORANDUM DATE: March 30, 2017 TO: FROM: Laura Slater (ODOT Project Manager) ODOT PMT Group for I-84 Region 5 Corridor
Characteristics of. Entering & Exiting High Speed Considerations
 Mod 6 Characteristics of Expressways Entering & Exiting High Speed Considerations Characteristics of an Expressway Controlled access (limited entry and exit) High speed (up to 65 mph) Divided by a barrier
Traffic safety manual for the citizens of the Sultanate of Oman.
 Traffic safety manual for the citizens of the Sultanate of Oman. A traffic safety manual designed for the citizens of Oman for the age s between 18-30. Created by: Al Balushi, Khadija April 25 th, 2014
INTRODUCTION TO SIGNAL TIMING & TRAFFIC CONTROL
 INTRODUCTION TO SIGNAL TIMING & TRAFFIC CONTROL 1 WHO ARE WE? 2 WHAT ARE WE GOING TO DO TODAY? Learn about transportation engineering and careers offered. Introduce essential concepts about signal timing.
 Siła-Nowicka, K. (2018) Analysis of Actual Versus Permitted Driving Speed: a Case Study from Glasgow, Scotland. In: 26th Annual GIScience Research UK Conference (GISRUK 2018), Leicester, UK, 17-20 Apr
Queue analysis for the toll station of the Öresund fixed link. Pontus Matstoms *
 Queue analysis for the toll station of the Öresund fixed link Pontus Matstoms * Abstract A new simulation model for queue and capacity analysis of a toll station is presented. The model and its software
Highways England Creative M Welcome. Smart motorway M6 junctions 16 to 19 public information exhibition
 Welcome Smart motorway junctions 16 to 19 public information exhibition Smart motorway junctions 16 to 19 Making the motorway better The is also part of the Highways England strategic road network connecting
Temporary Vehicle Restraint System Policy
 Temporary Vehicle Restraint System Policy Prepared By; J Wilkinson H&S Manager, Civils Prepared for: Installation of TVRS on all triio highways projects including JV s. Page 1 of 8 Contents 1.0 Introduction
M20. Upgrade to smart motorway Junctions 3 to 5
 M20 Upgrade to smart motorway Junctions 3 to 5 Junctions 3 to 5 We are improving the busy 10.5km (6.5 mile) stretch of the M20 between junction 3 near West Malling and junction 5 near Aylesford by upgrading
A SPEED-FLOW MODEL FOR AUSTRIAN -MOTORWAYS
 A SPEED-FLOW MODEL FOR AUSTRIAN -MOTORWAYS Dr. Hassan Mahdy Public Works Dept., Faculty of Engineering Ain Shams University, Cairo, Egypt. E-mail: h98417@hotmail.com ABSTRACT Conventional speed-flow models
Planning Guidance in the 2012 AASHTO Bike Guide
 Planning Guidance in the 2012 AASHTO Bike Guide Presentation by: RJ Eldridge Peter Lagerwey August 22, 2012 WEBINAR 2: PLANNING GUIDANCE IN THE 2012 AASHTO BIKE GUIDE Today s Webinar Significant Updates
Impact of Signalized Intersection on Vehicle Queue Length At Uthm Main Entrance Mohd Zulhilmi Abdul Halim 1,b, Joewono Prasetijo 2,b
 Impact of Signalized Intersection on Vehicle Queue Length At Uthm Main Entrance Mohd Zulhilmi Abdul Halim 1,b, Joewono Prasetijo 2,b 1,2 Smart Driving Research Center, Faculty of Civil and Environmental
Variables influencing lane changing behaviour of heavy vehicles
 Variables influencing lane changing behaviour of heavy vehicles Sara Moridpour 1, Majid Sarvi 1, Geoff Rose 1 and Euan Ramsay 1,2 1 Institute of Transport Studies, Monash University 2 Department of Transport,
Smart motorways: all lane running on the M25. Guidance for EEAST crews
 Smart motorways: all lane running on the M25 Guidance for EEAST crews Published April 2014 Background This month (April 2014) the Highways Agency launched its smart motorways, which make use of new technology
unsignalized signalized isolated coordinated Intersections roundabouts Highway Capacity Manual level of service control delay
 Whether unsignalized or signalized, isolated or coordinated, you can use TransModeler to simulate intersections with greater detail and accuracy than any other microsimulation software. TransModeler allows
c. continue onto the expressway and use the next exit ramp.
 Chapter 11 - Practice Questions Multiple Choice Identify the letter of the choice that best completes the statement or answers the question. 1) The exit ramp you want to use is entirely blocked by traffic.
Know your smart motorways M60/M62, Greater Manchester
 Know your smart motorways M/M62, Greater Manchester Manchester smart motorways: M junction 8 to M62 junction 20 The M and M62 are vital parts of the strategic road network in England. They provide an important
Quantitative risk assessment and risk-based decision making
 Norwegian Tunnel Safety Conference 2018 «Connecting Tunnels and Communities» Quantitative risk assessment and risk-based decision making Bernhard KOHL, ILF 18.06.2018 OUTLINE Background Tools for risk-based
The I-85 Express Lanes Project NASCIO Recognition Award Nomination
 The I-85 Express Lanes Project 2012 NASCIO Recognition Award Nomination Submitting Agency: State Road and Tollway Authority Nomination Category: Information Communications Technology Contact: Malika Reed
CIVITAS Peer to Peer Exercise in Reggio Emilia 11 November km zone: Reggio Emilia gets to know the experience of Odense and Vitoria-Gasteiz
 CIVITAS Peer to Peer Exercise in Reggio Emilia 11 November 2014 30 km zone: Reggio Emilia gets to know the experience of Odense and Vitoria-Gasteiz The City of Reggio Emilia Reggio Emilia is a medium sized
Traffic and Parking Surveys
 Australian Institute of Traffic Planning and Management www.aitpm.com AITPM Victorian Branch Technical Forum Traffic and Parking Surveys Wednesday 14 th October 2009, 5:30pm 7:00pm www.aitpm.com VicRoads
M23. Upgrade to smart motorway Junctions 8 to 10
 Upgrade to smart motorway Junctions 8 to 10 Junctions 8 to 10 About smart motorways Public information exhibitions We are improving the busy 18km (11 miles) stretch of the between junction 8 near Merstham
Upgrade to smart motorway Junctions 2 to 4
 M6 Upgrade to smart motorway Junctions 2 to 4 Junctions 2 to 4 About smart motorways Public information exhibitions We are improving the busy 13.6 miles (22km) stretch of the M6 between junction 2 at Coventry
PHANTOM JAM AVOIDANCE THROUGH IN-CAR SPEED ADVICE
 PHANTOM JAM AVOIDANCE THROUGH IN-CAR SPEED ADVICE L.C.W. Suijs Goudappel Coffeng, Traffic Management Department L.J.J. Wismans University of Twente / DAT Mobility L. Krol Goudappel Coffeng, Traffic Management
Appendix FRANCE Annecy Tunnel Courier
 Appendix 2.7 - FRANCE Annecy Tunnel Courier 1. TRANSIT TUNNEL AND ACCESS TO UNDERGROUND PARKING LOTS The Courier tunnel is located in Annecy (France), a city of about 55,000 inhabitants and the centre
Observation-Based Lane-Vehicle Assignment Hierarchy
 96 Transportation Research Record 1710 Paper No. 00-1696 Observation-Based Lane-Vehicle Assignment Hierarchy Microscopic Simulation on Urban Street Network Heng Wei, Joe Lee, Qiang Li, and Connie J. Li
Automatisch rijden, het gedrag van bestuurders en verkeersstromen
 Automatisch rijden, het gedrag van bestuurders en verkeersstromen Bart van Arem EVU Symposium, 9 september 2016, Postillion Hotel Amersfoort Veluwemeer Rivium Buses (Rotterdam) 2013: DAVI on the road 2016:
Controlled. Semi-Controlled PAGE 01 CHAPTER 12 INTERSECTIONS
 PAGE 01 CHAPTER 12 INTERSECTIONS You will cross many intersections while driving. Intersections are especially dangerous because vehicles are crossing each other s driving path. Many crashes happen at
Utilization of the spare capacity of exclusive bus lanes based on a dynamic allocation strategy
 Urban Transport XX 173 Utilization of the spare capacity of exclusive bus lanes based on a dynamic allocation strategy X. Wang 1 & Q. Li 2 1 Department of Transportation Management Engineering, Zhejiang
Parks Highway: MP Lucus Road to Big Lake Road
 2 Purpose and Need 2.1 Corridor History The Parks Highway is a 324-mile long Rural Interstate Highway that extends from its intersection with the Glenn Highway north to Fairbanks, Alaska. The Parks Highway
Situations that a B2/ALKS highway system may encounter
 Submitted by Industry Informal Document - ACSF-20-05 Situations that a B2/ALKS highway system may encounter Purpose and key messages of this document: This document aims at providing a better understanding
2002 Virginia Department of Transportation Daily Traffic Volume Estimates. Special Locality Report 209
 2002 Daily Traffic Volume Estimates Special Locality Report 209 Prepared By Mobility Management Division In Cooperation With U.S. Department of Transportation Federal Highway Administration Mobility Management
CAPACITY, LEVEL OF SERVICE, FUNDAMENTALS OF HIGHWAY CAPACITY ANALYSIS
 CAPACITY, LEVEL OF SERVICE, FUNDAMENTALS OF HIGHWAY CAPACITY ANALYSIS 1. GENERAL Transportation facilities can be classified into two categories of flow: uninterrupted and interrupted. Uninterrupted-flow
Mapping Cycle-friendliness towards a national standard
 Mapping Cycle-friendliness towards a national standard Cyclenation in collaboration with CTC would like the guidance contained in the appendices to this paper to be adopted as the national standard for
2001 Virginia Department of Transportation Daily Traffic Volumes Including Vehicle Classification Estimates where available. Jurisdiction Report 24
 Daily Traffic Volumes Including Vehicle Classification Estimates where available Jurisdiction Report 24 Traffic Monitoring Section The (VDOT) conducts a program where traffic count data are gathered from
Application for diminishing or avoiding the unwanted. effects of traffic congestion
 Application for diminishing or avoiding the unwanted effects of traffic congestion Explanation of process Traffic congestions occur mainly through lack of consideration for the driver from the traffic
TRIM Queue, Vejle N Denmark. Evaluation report
 EUROPEAN COMMISSION DIRECTORATE GENERAL ENERGY AND TRANSPORT TRIM Queue, Vejle N Denmark Evaluation report November 2009 Version 1.0 TRIM_Queue_EasyWay_Evaluation_Report_DK Updated: November 09 Document
Traffic circles. February 9, 2009
 Traffic circles February 9, 2009 Abstract The use of a traffic circle is a relatively common means of controlling traffic in an intersection. Smaller Traffic circles can be especially effective in routing
Traffic Accident Data Processing
 Traffic Accident Data Processing D o n a l d F. P e t t y Engineer of Traffic Research and Surveys Indiana State Highway Commission The following is a portion of the Highway Safety Program Standards developed
2002 Virginia Department of Transportation Daily Traffic Volume Estimates Including Vehicle Classification Estimates. Special Locality Report 261
 2002 Daily Traffic Volume Estimates Including Vehicle Classification Estimates where available Special Locality Report 261 Prepared By In Cooperation With U.S. Department of Transportation Federal Highway
Signs. signs, signals and road markings. in this chapter
 3 signs, signals and road markings in this chapter Signs regulatory signs school, playground and crosswalk signs lane use signs turn control signs parking signs reserved lane signs warning signs object
Analysis of Car-Pedestrian Impact Scenarios for the Evaluation of a Pedestrian Sensor System Based on the Accident Data from Sweden
 136 S.N. Huang, J.K. Yang Division of Vehicle Safety, Chalmers University of Technology, Göteborg, Sweden F. Eklund Automotive Safety Electronics, Autoliv Electronics AB, Linköping, Sweden Analysis of
Look Up! Positioning-based Pedestrian Risk Awareness. Shubham Jain
 Look Up! Positioning-based Pedestrian Risk Awareness Shubham Jain Does this look familiar? Pedestrians account for 14% of all traffic fatalities in the US *. In the last decade, 688,000 pedestrians injured
Traffic: an Interplay between Models, Simulations, and Control Actions
 Traffic: an Interplay between Models, Simulations, and Control Actions Sven Maerivoet DWTC Katholieke Universiteit Leuven Department of Electrical Engineering ESAT-SCD (SISTA) Friday Seminar 05/03/2004
SELECTED ROADWAY CAPACITY ANALYSIS
 CHAPTERFOUR SELECTED ROADWAY CAPACITY ANALYSIS 4.1 SELECTED ROADWAY CAPACITY ANALYSIS Introduction Capacity analysis was performed on six selected roadways within the Dearborn County study area using the
Upgrade to smart motorway Junctions 13 to 16
 Upgrade to smart motorway Junctions 13 to 16 Junctions 13 to 16 About smart motorways Public information exhibitions We are improving the busy 37.9 km (23.6 miles) stretch of the between Junction 13, just
Project Report. South Kirkwood Road Traffic Study. Meadows Place, TX October 9, 2015
 Meadows Place, TX October 9, 2015 Contents 1 Introduction... 1 2 Data Collection... 1 3 Existing Roadway Network... 2 4 Traffic Volume Development... 2 5 Warrant Analysis... 3 6 Traffic Control Alternative
City of Homewood Transportation Plan
 City of Homewood Transportation Plan Prepared for: City of Homewood, Alabama Prepared by: Skipper Consulting, Inc. May 2007 TABLE OF CONTENTS INTRODUCTION... 1 BACKGROUND INFORMATION... 1 EXISTING TRANSPORTATION
THE LANDMARK AT TALBOT PARK
 TRAFFIC IMPACT STUDY FOR THE LANDMARK AT TALBOT PARK IN NORFOLK, VA INTERMODAL ENGINEERING, P.C. OCTOBER, 200 The Landmark at Talbot Park is a proposed redevelopment of the existing apartments along the
FINAL DESIGN TRAFFIC TECHNICAL MEMORANDUM
 FINAL DESIGN TRAFFIC TECHNICAL MEMORANDUM July 2014 FINAL (SR 43) Project Development and Environment Study From State Road 60 (Adamo Drive) to I-4 (SR 400) Hillsborough County, Florida Work Program Item
TRAFFIC STUDY GUIDELINES Clarksville Street Department
 TRAFFIC STUDY GUIDELINES Clarksville Street Department 9/1/2009 Introduction Traffic studies are used to help the city determine potential impacts to the operation of the surrounding roadway network. Two
INCREASING SCHOOL-YEAR ROAD SAFETY: PROVEN STRATEGIES YOU CAN USE NOW
 INCREASING SCHOOL-YEAR ROAD SAFETY: PROVEN STRATEGIES YOU CAN USE NOW Presenter Cam Reed Territory Manager All Traffic Solutions ABOUT CAM REED Cam spent 15 years in law enforcement, most of those years
LECTUR 10 CHARACTERISTICS OF THE DRIVER, THE PEDESTRIAN, THE VEHICLE AND THE ROAD. One problem that faces traffic and transportation engineers is:
 LECTUR 10 CHARACTERISTICS OF THE DRIVER, THE PEDESTRIAN, THE VEHICLE AND THE ROAD 3.1 DRIVER CHARACTERISTICS Physiological Measurable and Usually Quantifiable Psychological Much more difficult to measure
TRAFFIC IMPACT STUDY And A TRAFFIC SIGNAL WARRANT ANALYSIS FOR A SENIOR LIVING AND APARTMENT DEVELOPMENT
 TRAFFIC IMPACT STUDY And A TRAFFIC SIGNAL WARRANT ANALYSIS FOR A SENIOR LIVING AND APARTMENT DEVELOPMENT DEERFIELD TOWNSHIP, WARREN COUNTY, OHIO Nantucket Circle and Montgomery Road () Prepared for: ODLE
Preliminary Review of the T-REX Southeast Corridor Highway and Light Rail Transit Project
 Preliminary Review of the T-REX Southeast Corridor Highway and Light Rail Transit Project DRCOG Congestion Mitigation Program White Paper 07-1 (February 16, 2007) On time and under budget! Festivities
Mobility and Congestion
 Technical Memorandum Mobility and Congestion Prepared for: Prepared by: September 25, 2013 1 Table of Contents 1. Introduction... 1 2. Congestion Forecasting Process... 1 2.1 Mobility and Congestion Terms...
Recommended Roadway Plan Section 2 - Land Development and Roadway Access
 Recommended Roadway Plan Section 2 - Land Development and Roadway Access SECTION 2 Land Development and Roadway Access 2.1 Land Use and Access Management The Federal Highway Administration (FHWA) defines
Missing no Interaction Using STPA for Identifying Hazardous Interactions of Automated Driving Systems
 Bitte decken Sie die schraffierte Fläche mit einem Bild ab. Please cover the shaded area with a picture. (24,4 x 11,0 cm) Missing no Interaction Using STPA for Identifying Hazardous Interactions of Automated
2010 Virginia Department of Transportation Daily Traffic Volume Estimates Including Vehicle Classification Estimates. Special Locality Report 172
 2010 Daily Traffic Volume Estimates Including Vehicle Classification Estimates where available Special Locality Report 172 Town of Boyce Information in this report is included in Report (Clarke County)
 http://www.itarda.or.jp/english/info36/36top.html Page 1 of 2 Introduction It is difficult to understand how someone could end up driving in the wrong direction on the highway. However, 1 in 300 accidents
Road Safety Facilities Implemented in Japan
 Road Safety Facilities Implemented in Japan 1 Road Safety Facilities 1.Guard Fence 2.Road Lighting 3.Other Road Safety Facilities 2 Road Safety Facilities 1.Guard Fence 2.Road Lighting 3.Other Road Safety
2005 Virginia Department of Transportation Daily Traffic Volume Estimates Including Vehicle Classification Estimates. Special Locality Report 324
 2005 Virginia Department of Transportation Daily Traffic Volume Estimates Including Vehicle Classification Estimates where available Special Locality Report 324 Prepared By Virginia Department of Transportation
CHAPTER 7 CIRCULATION
 CHAPTER 7 CIRCULATION A township s transportation network links its population with the surrounding communities. Transportation networks, including public and private, provide the means by which township
In the spring of 2006, national newspaper headlines screamed
 Toll vs. Nontoll: Toll Facilities Are Safer By Jeff Campbell In the spring of 2006, national newspaper headlines screamed that toll plazas were the most dangerous place on the highway. The articles were
QUEEN ELIZABETH WAY / MARTINDALE ROAD BRIDGE DEMOLITION DETOUR ANALYSIS
 QUEEN ELIZABETH WAY / MARTINDALE ROAD BRIDGE DEMOLITION DETOUR ANALYSIS Fabio Saccon, P.Eng Area Traffic Manager Bernard James Engineer in Training Martin Sneep Senior Project Manager Lance Dutchak Traffic
OP001 BUS PATROL TRAINING MANUAL
 OP001 BUS PATROL TRAINING MANUAL BUS PATROL TRAINING MANUAL GENERAL Where elementary students are transported to and from school on a school bus, School Bus Patrols should be assigned to each vehicle to
Driver Education Ch. 4: Safe Driving Rules & Regulations. Ms. Marx
 Driver Education Ch. 4: Safe Driving Rules & Regulations Ms. Marx Speed Control Speed is one of the most common contributing factors of fatal & other types of accidents School zones, business or residential
2016 Virginia Department of Transportation Daily Traffic Volume Estimates Including Vehicle Classification Estimates
 2016 Virginia Department of Transportation Daily Traffic Volume Estimates Including Vehicle Classification Estimates where available Jurisdiction Report WV West Virginia repared By Virginia Department
Attachment 2 SAMPLE TEST
 Attachment 2 SAMPLE TEST 1. As posted, you may not exceed 50 km or mph in urban areas. a. 31 mph b. 15 mph c. 25 mph d. 55 mph 2. Any government ID card holder, 21 and older, operating a four-wheeled vehicle
Welcome. Smart motorway M6 junctions 13 to 15 public information exhibition. Highways England Creative BHM18_0060_RHK
 Welcome Smart motorway M6 junctions 13 to 15 public information exhibition Smart motorways Smart motorways are a technology driven approach to the use of our motorways, increasing capacity and relieving
SCHOOL CROSSING PROTECTION CRITERIA
 CITY OF MADISON TRAFFIC ENGINEERING SCHOOL CROSSING PROTECTION CRITERIA January 2016 Adopted as Policy on August 31, 1976, by Common Council by Amended Resolution #29,540 Amended on September 14, 1976,
An Easier Commute. Learn how to use I-77 Express to save you time.
 An Easier Commute Learn how to use I-77 Express to save you time PUBLIC-PRIVATE PARTNERSHIP I-77 Express is the first-ever toll lane public-private partnership with NCDOT I-77 Mobility Partners is financing,
Unit 7 Speed, Travel Time and Delay Studies
 Unit 7 Speed, Travel Time and Delay Studies Introduction Speed, travel time and delay are all related measures that are common used as indicators of performance for traffic facilities Measure of Effectiveness
2015 Urban Mobility Scorecard. Scott Weber, Transportation Planner & Analyst James Winters, Regional Planner & Policy Analyst
 2015 Urban Mobility Scorecard Scott Weber, Transportation Planner & Analyst James Winters, Regional Planner & Policy Analyst Introduction 1. Congestion Trends 2. Compounding Problems 3. Possible Solutions
Speed Control & Limits
 Speed Control & Limits Exceeding the speed limit is a common contributing factor of fatal and other types of accidents. *25 mph* School zones, business or residential districts *55 mph* Certain state highways
2002 Virginia Department of Transportation Daily Traffic Volume Estimates. Special Locality Report 146
 Virginia Department of Transportation Daily Traffic Volume Estimates Special Locality Report 146 Prepared By Virginia Department of Transportation Mobility Management Division In Cooperation With U.S.
Roadway Classification Design Standards and Policies. Pueblo, Colorado November, 2004
 Roadway Classification Design Standards and Policies Pueblo, Colorado November, 2004 Table of Contents Page Chapter 1. General Provisions 1.1 Jurisdiction 3 1.2 Purpose and Intent 3 1.3 Modification 3
Arterial Traffic Analysis Actuated Signal Control
 Arterial Traffic Analysis Actuated Signal Control Dr. Gang-Len Chang Professor and Director of Traffic Safety and Operations Lab. University of Maryland-College Park Actuated Signal Control Fully Actuated
US 69 RELIEF ROUTE STUDY
 US 69 RELIEF ROUTE STUDY Jacksonville, Texas PUBLIC MEETING #2 May 29 th, 2018 Welcome to the public meeting for the US 69 Relief Route Study in Jacksonville. This is the second public meeting for this
2003 Virginia Department of Transportation Daily Traffic Volume Estimates. Special Locality Report 198
 2003 Virginia Department of Transportation Daily Traffic Volume Estimates Special Locality Report 198 Prepared By Virginia Department of Transportation Mobility Management Division In Cooperation With
Grip on speed. A multi-stakeholder approach to road safety
 Grip on speed A multi-stakeholder approach to road safety Authors: Erik Donkers VIA, traffic consultancy & software, The Netherlands Berry de Jong SRE (Eindhoven Urban Region), The Netherlands Polis Conference
City of Prince Albert Statement of POLICY and PROCEDURE. Department: Public Works Policy No. 66. Section: Transportation Issued: July 14, 2014
 Page: 1 of 8 1 POLICY 1.01 The City shall follow all of the specifications in the Manual of Uniform Traffic Control Devices for Canada, prepared by the National Committee of Uniform Traffic Control, and
Preventing Rear End Collisions. OSACH Safety Group Meeting April 16, 2009
 Preventing Rear End Collisions OSACH Safety Group Meeting April 16, 2009 Learning Objectives To gain background information on work related injuries as a result of rear end collisions Become familiar with
STUDY PROCESS & SCHEDULE
 STUDY PROCESS & SCHEDULE Route Centennial Bridge Study KDOT Project No. -52 KA-3229-01 STUDY OVERVIEW STUDY SCHEDULE The Kansas Department of Transportation (KDOT) has identified a future need to replace
CHAPTER 2G. PREFERENTIAL AND MANAGED LANE SIGNS
 2011 Edition - Revision 2 Page 275 Section 2G.01 Scope CHAPTER 2G. PREFERENTIAL AND MANAGED LANE SIGNS 01 Preferential lanes are lanes designated for special traffic uses such as high-occupancy vehicles
Municipality of Sofia Traffic Master Plan. Intelligent Transport Systems Strategy Andrew Walsh
 Municipality of Sofia Traffic Master Plan Intelligent Transport Systems Strategy Andrew Walsh Introduction Presentation to describe an ITS Strategy for Sofia developed as part of the Sofia Traffic Master
Evaluation of Pedestrian and Cyclist Warning Systems for Trucks
 ROAD SAFETY AND MOTOR VEHICLE REGULATIONS Evaluation of Pedestrian and Cyclist Warning Systems for Trucks Peter Burns, peter.burns@tc.gc.ca June 20, 2018 Outline Background and updated collision data Track
Traffic Signs and Signals
 CHAPTER FOUR Traffic Signs and Signals Traffic signs control traffic flow, making streets and highways safer for drivers, bicyclists and pedestrians. These signs, which are posted by the Indiana Department
JONESBORO HIGHWAY 63 HIGHWAY 18 CONNECTOR STUDY
 JONESBORO HIGHWAY 63 HIGHWAY 18 CONNECTOR STUDY Craighead County May 2007 JONESBORO HIGHWAY 63 HIGHWAY 18 CONNECTOR STUDY Craighead County May 2007 Prepared by Planning and Research Division Arkansas State