Chapter 2 Current Conditions and Settings
|
|
|
- Gerard McBride
- 6 years ago
- Views:
Transcription
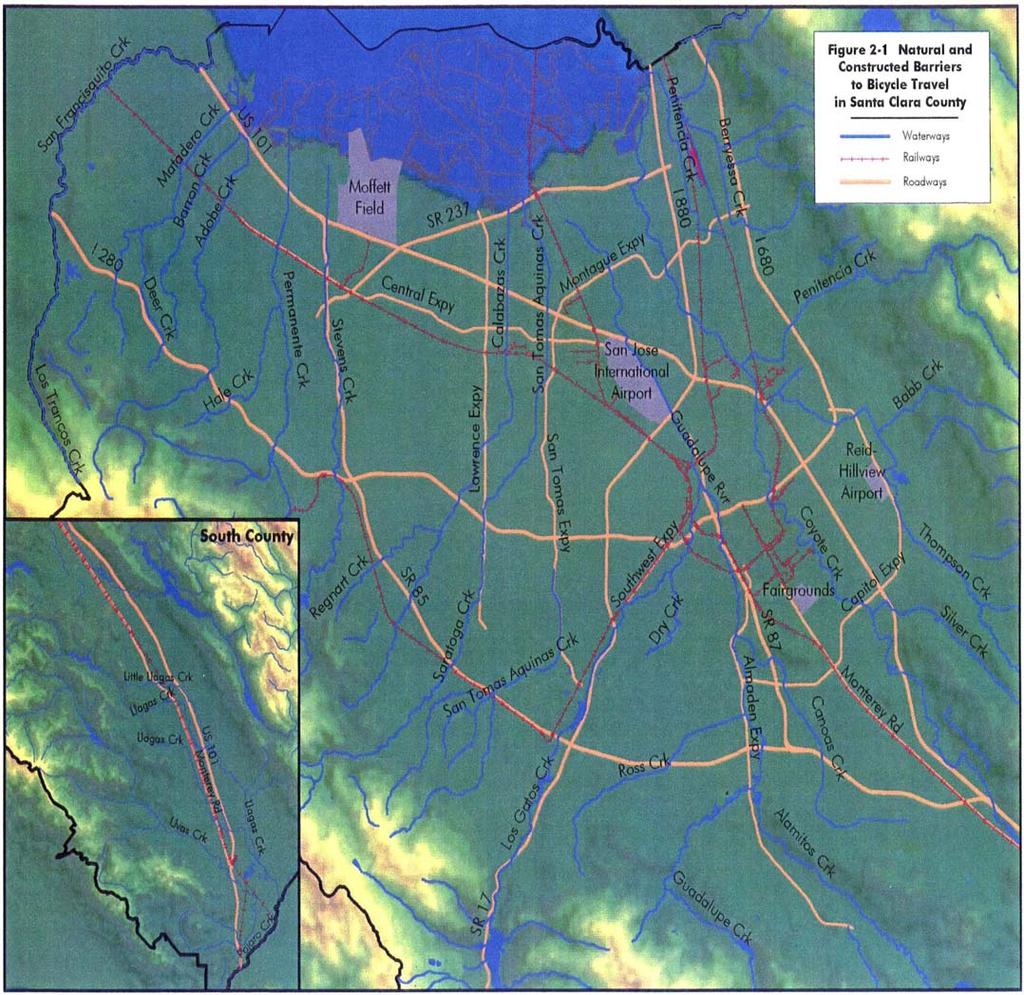
1 Chapter 2 Current Conditions and Settings PHYSICAL SETTING Santa Clara Valley is home to the Silicon Valley with roughly 4,100 high-technology firms and about 30% of the Bay Area s jobs. The north County, from Milpitas to San Jose to Palo Alto, is extensively urbanized, housing approximately 90% of the County s residents. The south county is predominantly rural, with the exception of Gilroy, Morgan Hill and the small unincorporated community of San Martin; however development and growth has accelerated in the past decade. Land development patterns in South County vary greatly, from denser mixed-use areas of older city centers to the typical suburban pattern of subdivisions and shopping malls. Geographic Setting Santa Clara County is the southernmost of the nine counties that make up the San Francisco Bay Area region. The county is bounded to the south by San Benito County, to the west by Santa Cruz County, to the east by Stanislaus County, to the north-east by Alameda County and to the north-west by San Mateo County. The key geographical feature of the County is the Santa Clara Valley bordered on the east by the Diablo Mountain Range and on the west by the Santa Cruz Mountain Range. The valley is part of a long depression within the central Coastal Ranges of California and is characterized by a relatively flat floor. From the axis of the valley, the terrain gently rises towards the east and west to the toe of the foothills, becoming increasingly steep. Consequently, only the Santa Clara Valley floor, roughly one-third of the county, is the developed or developable land. The remaining two-thirds of the County are the foothills, hills, mountains or preserved space. Natural Topographic Obstacles The natural and man-made barriers to bicycle travel in Santa Clara County are depicted in Figure 2-1. Each of these features with respect to bicycling is discussed below. The goal for the bike plan is to provide a crossing of these major barriers - via either a roadway crossing (with bicycle/pedestrian accommodations) or a bicycle/pedestrian bridge or tunnel - every half mile in developed areas. Mountains/Hills The terrain affects the ease of bicycling, but for the most part development has occurred in the valley areas of the county. Therefore, most of the non-recreational trips made by bicycle are within areas of relatively flat topography. Page 2-1
2 Creeks/Rivers Santa Clara County is fortunate to have many creeks that are still in their natural state, most of which drain to San Francisco Bay. They provide excellent opportunities for Class I trails and many have developed bicycle/pedestrian trails along parts of them, i.e. Los Gatos Creek, Stevens Creek, Calabazas Creek, San Tomas Aquino Creek, Saratoga Creek, Guadalupe River, and Coyote Creek. Many others could potentially have trails. However, creeks sometimes pose as obstacles to bicycle circulation themselves. In the worst cases, creeks have been converted to concrete flood control channels. (In some instances, creeks have been put into a culvert and completely paved over; while this eliminates the barrier for bicyclists, it ruins the natural habitat and ecosystem.) Many communities have provided bicycle and pedestrian access across creeks such as the three bridges across Adobe Creek, which forms the border between Palo Alto and Los Altos. Many more bridges are needed where creeks and rivers form barriers to bicycle and pedestrian circulation. In general, new trails and bridges would be subject to approval of the Santa Clara Valley Water District, which is in charge of water supply, flood protection and watershed management. Manmade Barriers and Obstacles Freeways In Santa Clara County, freeways are often the biggest barriers to bicycle mobility and connectivity. Expensive grade-separated roadways on bicycle/pedestrian only bridges/tunnels are the only ways to cross, resulting in a limited number of locations where bikes can cross the freeway. Cyclists are often forced to take long detours to find a grade separation to get from one side of the freeway to the other. Building bicycle/pedestrian bridges or undercrossings is expensive but necessary to restore the severed access, as well as to mitigate the long detours caused by the freeway. In addition, the freeway crossings that do exist are often difficult and intimidating whether it is an undercrossing or an overcrossing. Biking on the shoulders of the roadways going under freeways tends to be an unpleasant experience due to limited width, darkness, lack of landscaping, accumulation of litter and debris, and the proximity of traffic going at high speeds. Overpasses have the added disadvantage of grade. Both often have ramp intersections designed to accommodate high speed motor vehicle traffic without consideration of bicyclists and pedestrians. Railroads Railroad tracks pose similar barriers to bicycles as freeways, except that at-grade crossings are possible and often present. Another advantage railroad tracks have over freeways is that they are narrower, thus it is easier and cheaper to construct grade-separated crossings. Undercrossings are more viable, because they require less vertical clearance and are therefore usually less expensive than overcrossings. New at-grade crossings are by far the most economically feasible but are more difficult to get approved. Page 2-2
3 Page 2-3
, which make a good bicycle facility for experienced cyclists.")
4 Expressways Santa Clara County Roads and Airport Department (County Roads) operates and maintains 62 miles of expressways which are all open to cyclists. For the most part, the expressways have 8-foot shoulders (per HDM Table 302.1), which make a good bicycle facility for experienced cyclists. In 2003, County Roads developed the Bicycle Accommodation Guidelines (BAG) to identify consistent guidelines for all bicycles on expressway shoulders. The County is reviewing shoulder striping throughout the expressway system for potential improvements to comply with the BAG. The history of bicycle access to the expressways reflects different city preferences and changing visions for expressway operations. Until 1975, bicycles were prohibited from using all the expressways except Page Mill Expressway in Palo Alto (west of Alma Street) and Almaden, Montague and Capitol Expressways (south of Capitol Avenue) in San Jose. County Roads cooperated with various cities to repeal the prohibition of bicycles on expressways within their respective jurisdictions. First Central Expressway within Mountain View and Foothill Expressway within Palo Alto were opened to cyclists in The remainders of Foothill Expressway and Central Expressway were opened to bicyclists in In 1991, the bicycle prohibition was repealed for Lawrence Expressway and San Tomas Expressway within Sunnyvale and Santa Clara, rendering the entire expressway system open to bicycles. Page 2-4


5 ROAD AND TRAFFIC CONDITIONS Figure 2-4 Aside from the physical barriers to bicycle travel discussed above, the traffic conditions in the roadway environment intimidate many bicyclists. The perception of unsafe conditions is the dominant factor for many potential cyclists. They may lack the experience and confidence to bicycle on roads with high traffic speeds and volumes. Overall, distractions such as cell phone use have increased and driving behavior and courtesy have deteriorated, which are deterrents to bicycling. Roadway design has traditionally favored cars over bicycles and pedestrians. In situations where motorists are turning right to exit or enter a freeway or expressway, bicyclists proceeding straight through are often forced to stop and wait for cars to clear, before moving forward, since the majority of motorists are not likely to slow down for bicycles. The BTG contains recommendations on how to avoid these bike-unfriendly designs. Page 2-5

6 Collisions Countywide bicycle collision analysis has not been conducted, although it is an Action step under Policy D2 (See Appendix A). Some Member Agencies have evaluated their local bicycle collision data as part of or separately from their bicycle plans. For example, as part of its current bike plan update, the City of San Jose analyzed bicycle and pedestrian collision data from Some of the findings were as follows: the most common error made by bicyclists was riding on the wrong side of the roadway. Most of the collisions where the bicyclist was at fault involved bicyclists in the year age group. When drivers were at fault, it was mostly due to their failure to yield while making a left or right turn. Drivers at-fault were mostly in the age group. The Metropolitan Transportation Commission (MTC) conducted a study on bicycle collisions for the City of Sunnyvale and the findings are presented in the 2004 SafetyTAP report. Based on collision data analyzed for the study period, the primary collision factor for bicyclists is a right-of-way violation usually made by male motorists in the age group. The two main violations identified for rightof-way collisions are drivers executing improper turns without yielding to bicyclists and drivers/cyclists failing to yield to on-coming traffic when exiting a driveway or alley. Male motorists-at-fault account for 83% of these right-of-way collision accidents while cyclists-at-fault were found seven out of eight times to be under 16 years old. In cases where the cyclist is usually at fault, the study supports the data analyzed by San Jose and finds wrong-way riding to be the primary cause for cyclists to cause a collision accident. Figure 2-2 below shows other primary collision factors for bicyclists: Figure 2-2: Primary Collision Factors for Bicyclists Source: City of Sunnyvale 2006 Bicycle Plan, Appendix D: MTC SafetyTAP Report, 2004 Page 2-6
7 BICYCLE PLANNING DATA Bicycle Mode Splits and Trip Purposes The 2000 Census Data for bicycle mode of commute for Bay Area employed residents by County is shown in Figure 2-3. In 2000, 10,000 residents or about 1.2 % of the County s employed residents traveled to work by bicycle. This is a drop from 1.4% in the 1990 Census and 1.9 % in the 1980 Census. This drop is partially explained by the fact that commute distances have increased for Santa Clara County residents. While most counties in the Bay Area experienced similar or slightly less dramatic drops, there was one notable exception: San Francisco experienced the exact opposite trend of Santa Clara County, increasing its bike commute share from 0.6% to 2% between 1980 and While over ten thousand residents in Santa Clara County indicated that bicycling was their primary mode for traveling to work, this number reflects only a snapshot of behavior on one particular day in April. In all likelihood, the actual number of residents who bike to work on any given day during the spring and summer months is much greater, since more people bike during the warmer months. Also many people bike one or two days a week and many bike to transit or train stops, which is recorded as a transit trip not a bike trip. Figure 2-3: Bicycle Commute Share by County of Residence 2.0% 1.8% % Bi cycl e Commute Share 1.6% 1.4% 1.2% 1.0% 0.8% 0.6% 0.4% 0.2% % Alameda Contra Costa Marin Napa San Francisco San Mateo Santa Clara Solano Sonoma Region Year Bay Area Counties Source: US Census 2000 Journey to Work San Francisco Bay Area, June 2005 Page 2-7
8 The Cities of Palo Alto, Mountain View and Santa Clara have the highest rates of bicycle commuting within Santa Clara County at 5.6 %, 2.0 % and 1.5 % respectively. These cities have consistently been the leaders in bike commuting in Santa Clara County as shown in Figure 2-4. The unincorporated area of Stanford, given its high percentage of students as well as density (students per sq. mi.) has the highest bike commute rate of 40%. Figure 2-4: Bicycle Commute Share by City Bicycle Commute % by City 44.00% 42.00% 40.00% 38.00% 36.00% 34.00% 32.00% 30.00% 28.00% 26.00% 24.00% 22.00% 20.00% 18.00% 16.00% 14.00% 12.00% 10.00% 8.00% 6.00% 4.00% 2.00% 0.00% Cam pbell Cup ertino Gilroy Los Altos Los Alto s Hills Los Gatos M ilpitas Monte S ereno Morg an Hill Mountain View Pa lo Alto San Jose Santa Clara Sa ratoga St anford Sun nyvale Coun tywide Source: US Census 2000 Journey to Work San Francisco Bay Area, June 2005 Existing Bicycle Counts and Surveys Bike/Pedestrian Intersection Counts VTA conducts bike counts at 10 locations as part of its annual Monitoring and Conformance study. Bicycle count locations were selected on the basis of several criteria including: expected high-volume locations, locations where land use is planned to be intensified and bike activity increased, locations on the cross-county bicycle corridors network and locations of future bicycle corridor gap closures. Counts have been conducted at these locations for the past five years. The 5-year count data is contained in Appendix B1. Overall, counts were higher in the afternoon peak periods than in the morning peak periods 1 ; this reflects the fact that evening traffic is heavier in general, whereas morning traffic is usually lighter and consists 1 The counts are broken down into AM, Midday and PM portions during expected peak periods. AM counts occur between 9:00 and 11:00AM, Midday counts occur between 11:00AM and 1:00PM, and PM counts occur between 4:00 and 6:00PM. The counts have been tabulated for the maximum peak-hour within each two-hour count period Page 2-8
9 mostly of commute trips. Over the past 5 years, there has been a general increase in bike activity in these intersections as well as a general increase in bike counts during the afternoon peak periods. MTC also conducted bike intersection counts as part of its regional Bicycle and Pedestrian Data Collection and Analysis Project in October 2002 and The counts and locations are in Appendix B2. Trail and Bridge Counts VTA also conducted a count on the River Oaks bridge in September VTA staff and BPAC volunteers counted 500 pedestrians and bicyclists between the hours of 7am-7pm. The 12-hour data was then extrapolated to the full 24-hour day by comparing the volumes to that of the vehicle volumes on nearby Garrity Way. It is estimated that there are 800 crossings a day. The City of San Jose conducted its first ever Trail Count in September 2007 on Guadalupe River Trail, in partnership with the Friends of the Guadalupe River Park & Gardens and the Silicon Valley Bicycle Coalition. Two count stations were selected; Park Avenue where users traveling on both banks of the river were counted and Coleman Avenue where users along the west bank trail were counted. The count was conducted from 7 am to 7 pm for two days; the average 12 hour count for the three locations is plotted below in Figure 2-5. On average, there were over 750 users per day, with 65% using bicycles. Pre-paid postcards were giving to trail users as they passed the counting stations. The responses indicated that nearly 40% were commuting to and from work in North San Jose. The City plans to conduct a similar count in 2008 and anticipates an increase in the counts with the recent opening of under-crossings at Airport Parkway and Highway 101 near the Airport. Figure 2-5: Guadalupe River Trail Counts Daily Average Number of Trail Users by Location Number Bike Ped Coleman Ave Park Ave West Bank Park Ave East Bank Trail Location Source: San Jose Trail Count 2007, Page 2-9
10 Figure 2-6 shows the hourly distribution and peak hours of trail users for this trail section. Overall, pedestrians outnumber bicyclists particularly at midday, especially those who travel in the northbound direction. Figure 2-6: Guadalupe River Trail-Park Avenue Counts 35 Daily Volume of Guadalupe River Trail Users (Park Avenue) 30 Hourly Distribution Bike Northbound Bike Southbound Pedestrian Northbound AM 8:00AM 9:00AM 10:00AM 11:00AM 12:00PM 1:00PM 2:00PM 3:00PM 4:00PM 5:00PM 6:00PM 7:00PM Pedestrian Southbound Time of Day Source: San Jose Trail Count 2007, Bike Counts on Transit VTA Survey of Passengers with Bicycles As the operating agency for bus and light rail in Santa Clara County, VTA collected detailed data related to bicycle usage by transit passengers as part of the On-Board Passenger Surveys conducted in spring The survey found that 2% of all VTA passengers get to and from the bus stops and rail stations by bicycle. The average VTA cyclist-passenger bikes 15 minutes (estimated 3 miles) to get to a VTA stop or station, and then bikes 9 minutes (estimated 2 miles) after getting off VTA to reach their ultimate destination. Most bicycle-transit trips are commute trips related to work or school. Most bicyclist-passengers on VTA are concentrated in the central to northern areas of Santa Clara County. Geographic trip origin and trip destination numbers for VTA bicyclist-passengers are shown in Table 2-1. Page 2-10
11 Table 2-1: Trip Origins and Destinations of Bicycle Riders on VTA Trip Origin % Trip Destination % San Jose 55.5 San Jose 46.7 Santa Clara 9.4 Mountain View 10.8 Mountain View 5.6 Palo Alto 9.6 Milpitas 5.0 Milpitas 6.7 Sunnyvale 4.9 Santa Clara 6.2 Other 19.6 Other 20.0 Table 2-2 shows the distribution of cities of residence for the VTA cyclist-passengers. Table 2-2: Residence Locations of Bicycle Riders on VTA Residence Location % San Jose 63.8 Mountain View 10.1 Sunnyvale 6.6 Cupertino 3.7 Santa Clara 2.5 Alameda County 1.2 South County 1.0 Other 11.1 Statistics on age, ethnicity and household income of the surveyed cyclist-passengers are shown in Table 2-3. However, the most extraordinary statistic is that of the gender of cyclist-passengers, 93% were male and 7% were female. Page 2-11

12 Table 2-3: Age, Ethnicity and Household Income of Bicycle Riders on VTA Age % Ethnicity % Household Income % % White/Caucasian 42.9% < $20, % % Hispanic/Latino 36.8% $20,000 -$34, % % Black/African American 13.5% $35,000 - $49, % % Vietnamese 1.1% Other Asian/Pacific % Islander 5.0% $50,000 - $74,999 $75,000 - $99, % 13.4% > % Other 0.7% > $100, % VTA Counts of Passengers with Bicycles The percentage of passengers bringing bicycles onto VTA buses and using the bus racks has hovered at about 2% of all boardings since the year Light rail historically achieves a higher bike ridership than the buses, reaching a peak of 5% in The yearly trends are presented below in Figure The bicycle ridership survey was conducted aboard VTA light rail vehicles for a full 24-hour service day. Operators took count of bicycle boardings by use of a tally card. Data was collected in hourly increments to allow for compilation and analysis of the data for various time intervals, including hourly usage, peak and non-peak usage, and total weekday boardings. In 2005, the bus bicycle ridership survey used a new methodology and technology. The survey was conducted aboard VTA buses for a full 24-hour service day. Using the AMDT (Advanced Mobile Data Terminal) for the first time to count bicycle boardings. Last year in May 2004, there Page 2-12
13 Figure 2-7: Bus vs. Light Rail Bicycle Ridership 6.0% % Bicycle riders of total transit riders 5.0% 4.0% 3.0% 2.0% 1.0% BUS Light Rail 0.0% * Year Source: VTA Bicycle Ridership Survey, The most recent 24-hour bicycle count on board VTA vehicles was conducted in October Table 2-4 shows the results; the decrease in bicycles on board buses is explained in the footnote. About half of the bicycles are carried during the morning and afternoon peak periods, and the remaining half are carried during the nonpeak periods. Beginning in 2006, VTA began using the Automated Passenger Count (APC) system. About 30 % of the vehicle fleet (130 buses and 30 light rail cars) is equipped with APC to collect On/Off data on a daily basis; these vehicles are rotated through the system to collect data on all VTA lines. Although this gives VTA a much more current and accurate count of boarding and alightings for all the VTA lines, it does not count passengers with bicycles. were 2,583 bike boardings observed by 527 bus operators. This year, there were 1,141 bicycle boardings by 281 bus operators that rendered a reliable and representative sampling of VTA bicycle boarding passengers. It is unclear as to what caused the decline in both boardings data and operator participation. Possible causes of the decline in data collected are: (1) technical difficulties on the AMDT and (2) unfamiliarity of operators to the new data collection procedure. However, the data gathered from this study yielded an abundant amount of new information that was not available from last year s method of data collection. Specifically, each boarding event was recorded at the bus stop level using the Advanced Communications System that including: (1) bus stop location, (2) bus route. Page 2-13
14 Table 2-4: Number of Bicycle Riders Boarding VTA Buses and Light Rail (Peak & Non-Peak for a Full Service Day) Mode AM Non-Peak 12 am 6 am AM Peak 6 am 9 am Midday 9 am 3 pm PM Peak 3 pm 6 pm PM Non-Peak 6 pm 12 am Total Average Weekday Ridership % of Riders with bicycles Bus ,141 97, % Light Rail ,107 21, % System Totals ,214 % of Total 6.0% 27.3% 29.0% 21.5% 16.2% 100% % Source: VTA Light Rail Bicycle Ridership Survey, 2005 Caltrain The annual Caltrain passenger bike count was conducted in February The February counts have taken place every year since Since summer of 2004, Caltrain s overall ridership has experienced steady growth with the implementation of the Baby Bullet express train service in June This year, ridership counts have moderated yet remained strong due to no new added service and a steady stream of regular service. Bicycle usage counts have also followed a more moderate trend with 2,334 bike boardings this year. This is a 2.8% increase compared to last year s significant 22.0% increase. Table 2-5 show the top five trains and stations reported with the most bicycle activity: Table 2-5: Top Trains and Stations for Bicycle Activity Source: Key Findings Caltrain Annual Passenger Counts, February 2007 Page 2-14
15 Caltrain also conducted an online survey of bicyclist-passengers in The survey results show that roughly 10% of overall Caltrain users ride their bicycle to the station, as well as from the destination station to reach their final destination. Of the bike and Caltrain users, almost 60% travel on average 4-5 days a week as passengerbicyclist. Most of these passenger-bicyclists bring their bicycles on board which causes Caltrain to experience increased demand for on-board bicycle storage. In fact, 87% of current Caltrain passengers who arrive by bike bring their bicycles on board while the remaining 13% park their bikes at the stations. While each train has at least one bicycle car attached (some trains may have two), the capacity of bicycle storage on board will vary depending on the type of train used and the number of bicycle cars attached onto that particular model of train. As such, bicycle storage on-board can range from bikes. Such different storage capacity constraints, unfortunately leads to increasing incidences of bicycles being denied boarding on trains because the bicycle capacity becomes filled. About 42% of former and current bike and Caltrain users have reported being bumped off a train five times or more during the past year because the bicycle car was full. Overall, the survey reveals a normal commute trend for bicycles on board transit. More bicycles are carried northward in the morning, and southwards in the evening. Santa Clara County accounts for 43.4% of the bicycle boardings systemwide. The ten stations with the most boardings for 2003, 2005, 2006, and 2007 are shown in Table 2-6. For a more detailed break-down of bicycle boardings and de-boardings on northbound and southbound trains, see Appendix B3. Table 2-6: Bicycle Boardings at Caltrain Stations Station 2007 % of Total AWBR AWBR AWBR Rank AWBR Rank AWBR Rank San Francisco % Palo Alto % Mountain View % Redwood City % San Jose Diridon % Menlo Park % Hillsdale % NA Sunnyvale % California Ave % San Mateo % NA AWBR = Average Weekday Bike Ridership Source: Key Findings Caltrain Annual Passenger Counts, February 2007 Page 2-15
16 Recommended Bike Count Programs Bike Counts: o Continue with annual CMP Monitoring Program bike counts at ten intersections, AM, midday, and PM peak periods o Count bikes and pedestrians at key bridges and cordons once a year; coordinate with neighboring cities if possible o Count bikes brought on board buses and LRV once every two years; use data to assist in relieving overcrowding, see page 6-8 o Prior to a new ABC opening, assist with before bicycle and pedestrian counts, on the alternate routes Estimate Countywide mode split once every two years for journey to work and other trip purposes. Estimate bicycle and pedestrian access-to-transit mode split. Identify fund sources for these tasks. Evaluate Bicycle Collision Data annually. Page 2-16
SANTA CLARA COUNTYWIDE BICYCLE PLAN August 2008
 SANTA CLARA COUNTYWIDE BICYCLE PLAN August 2008 To assist VTA and Member Agencies in the planning, development and programming of bicycle improvements in Santa Clara County. Vision Statement To establish,
POTENTIAL SANTA CLARA COUNTY TRANSPORTATION MEASURE
 POTENTIAL SANTA CLARA COUNTY TRANSPORTATION MEASURE OVERALL DRAFT EXPENDITURE PLAN TRANSIT/Mode Shift Millions % BART to Downtown San Jose/Santa Clara* 1,400 23% Caltrain Capacity & Safety 1,014 17% Mass
Santa Clara I-280 CORRIDOR STUDY
 Santa Clara I-280 CORRIDOR STUDY OCTOBER 2017 PREPARED BY: 1.1 Background The I-280 Corridor Study within Santa Clara County is a high-level highway planning study led by the Santa Clara VTA, in partnership
2013 Annual Passenger Counts
 2013 Annual Passenger Counts Board of Directors May 2, 2013 Presentation Outline Purpose and Count Methodology 2013 Count Results Conclusions and Next Steps 2 1 Purpose of Ridership Counts Provide a measurement
Purpose and Need. Chapter Introduction. 2.2 Project Purpose and Need Project Purpose Project Need
 Chapter 2 Purpose and Need 2.1 Introduction The El Camino Real Bus Rapid Transit (BRT) Project (Project) would make transit and other transportation improvements along a 17.6-mile segment of the El Camino
2016 Annual Passenger Counts
 2016 Annual Passenger Counts Board of Directors May 5, 2016 Agenda Item 17 Presentation Outline Purpose and Count Methodology 2016 Challenges 2016 Count Results Summary Next Steps 2 1 Purpose of Ridership
2018 Annual Passenger Counts. Board of Directors September 6, 2018 Agenda Item #11
 2018 Annual Passenger Counts Board of Directors September 6, 2018 Agenda Item #11 Presentation Outline Purpose of Annual Count Count Methodology 2018 Challenges 2018 Count Results Weekday Weekend Summary
EXECUTIVE SUMMARY... vii 1 STUDY OVERVIEW Study Scope Study Area Study Objectives
 Contents EXECUTIVE SUMMARY... vii 1 STUDY OVERVIEW... 1-1 1.1 Study Scope... 1-1 1.2 Study Area... 1-1 1.3 Study Objectives... 1-3 2 EXISTING CONDITIONS... 2-1 2.1 Existing Freeway Conditions... 2-4 2.1.1
Chapter 3 Bikeway Projects Planning Methodology
 Chapter 3 Bikeway Projects Planning Methodology This chapter outlines the methodology used to identify bicycle projects that have regional or countywide significance. By its very nature, the Countywide
San Mateo County Comprehensive Bicycle and Pedestrian Plan Open House
 San Mateo County Comprehensive Bicycle and Pedestrian Plan Open House October 28, 2010 Presented to San Mateo County residents and interested parties by Lauren Ledbetter, Alta Planning + Design Matt Haynes,
FOR INFORMATION ONLY
 9 Date: August 6, 2012 Current Meeting: August 16, 2012 Board Meeting: September 6, 2012 BOARD MEMORANDUM TO: THROUGH: FROM: SUBJECT: Santa Clara Valley Transportation Authority Congestion Management Program
Key objectives of the survey were to gain a better understanding of:
 3 COMMUNITY INPUT Community input is an essential part of corridor studies. For the SR 87 corridor study, VTA staff conducted an extensive online survey of people living and commuting along the corridor.
Bike San Mateo County San Mateo County Bicycle Plan Recommendations August 30, 2010
 Policy and Procedures Develop and Implement a Complete Streets Policy to comply with DD-64-R1 and AB1358 Commencing January 1, 2011, AB1358 requires that the legislative body of a city or county, upon
Magnolia Place. Traffic Impact Analysis. Prepared for: City of San Mateo. Prepared by: Hexagon Transportation Consultants, Inc.
 Magnolia Place Traffic Impact Analysis Prepared for: City of San Mateo Prepared by: Hexagon Transportation Consultants, Inc. Updated January 4, 2010 Table of Contents 1. Introduction...1 2. Existing Conditions...6
Highway 17 Transportation Improvement Study
 Final Report Highway 17 Transportation Improvement Study prepared for Santa Cruz County Regional Transportation Commission (SCCRTC) prepared by Planning and Engineering, Inc. 1155 North First Street, Suite
TRANSPORTATION TRAINING TOPICS. April 6, 2010
 TRANSPORTATION TRAINING TOPICS April 6, 2010 Roles of Transportation Providers Context and Policy Makers Division of Transportation and Traffic Other City Operations Other Transportation Operators CMA
TABLE OF CONTENTS. Executive Summary
 Executive Summary Background... ES-1 Pedestrian Network... ES-2 Bikeway Network... ES-2 Collision History... ES-2 Public Input... ES-4 Conclusions and Recommendations... ES-4 1. Introduction and Setting
INTRODUCTION. The focus of this study is to reduce congestion and improve mobility for all modes of transportation. Figure ES-1 Study Corridor Map
 INTRODUCTION The I-280 Corridor Study is a highway planning study led by Santa Clara VTA, in partnership with the City of Cupertino and in coordination with other stakeholders in the study area. The study
BICYCLE & PEDESTRIAN ADVISORY COMMITTEE MINUTES
 BICYCLE & PEDESTRIAN ADVISORY COMMITTEE Wednesday, March 7, 2007 MINUTES 1. CALL TO ORDER The Regular Meeting of the Valley Transportation Authority (VTA) Bicycle and Pedestrian Advisory Committee (BPAC)
Blair/Williamson Intersection Expressed Needs
 Blair/Williamson Intersection Expressed Needs NORTH Blair Street is a barrier for pedestrians and bicycles Relocate Capitol City Trail crossing from Blair Street and John Nolen Drive intersection to Williamson
Parks Highway: MP Lucus Road to Big Lake Road
 2 Purpose and Need 2.1 Corridor History The Parks Highway is a 324-mile long Rural Interstate Highway that extends from its intersection with the Glenn Highway north to Fairbanks, Alaska. The Parks Highway
25th Avenue Road Diet Project A One Year Evaluation. Transportation Fund for Clean Air Project #05R07
 25th Avenue Road Diet Project A One Year Evaluation Transportation Fund for Clean Air Project #05R07 Submitted by: The San Francisco Municipal Transportation Agency Dan Provence May 22, 2009 EXECUTIVE
4. ENVIRONMENTAL IMPACT ANALYSIS 9. TRANSPORTATION AND TRAFFIC
 4. ENVIRONMENTAL IMPACT ANALYSIS 9. TRANSPORTATION AND TRAFFIC 4.9.1 INTRODUCTION The following section addresses the Proposed Project s impact on transportation and traffic based on the Traffic Study
San Tomas Expressway
 Implementation Plan San Tomas Expressway Roads and Airports Department August 19, 2003 Implementation Plan San Tomas Expressway County of Santa Clara Roads and Airports Department 101 Skyport Drive San
Lincoln Avenue Road Diet Trial
 Lincoln Avenue Road Diet Trial Data Collection Report June 1, 2015 Department of Transportation Table of Contents I. Introduction...... 3 II. Data Collection Methodology & Results...... 5 A. Traffic Volume
North Coast Corridor:
 North Coast Corridor: Connecting People, Transportation & Environment Legislative Hearing: 11.8.10 1 North Coast Corridor Region s Lifeline A Regional Strategy Mobility, Economy & Environment North Coast
Planning Guidance in the 2012 AASHTO Bike Guide
 Planning Guidance in the 2012 AASHTO Bike Guide Presentation by: RJ Eldridge Peter Lagerwey August 22, 2012 WEBINAR 2: PLANNING GUIDANCE IN THE 2012 AASHTO BIKE GUIDE Today s Webinar Significant Updates
The public outreach team included:
 1 The public outreach team included: Lauren Ledbetter (Lead VTA Project Manager), Malahat Owrang (VTA Transportation Planner), Karen Gauss (VTA Outreach Specialist) Dana Weissman (Project Manager), Katy
LAGUNA BEACH POLICE DEPARTMENT MEMORANDUM
 LAGUNA BEACH POLICE DEPARTMENT MEMORANDUM TO: FROM: Christa Johnson, Assistant City Manager Jason C. Kravetz, Captain DATE: January 16, 2015 SUBJECT: Laguna Canyon Road Collision Analysis Within the last
Chapter 2 Current and Future Conditions
 Chapter 2 Current and Future Conditions 2.1 An Overview of Ottawa s Transportation System The City of Ottawa is home to about 870,700 people. The city covers an area of 2,760 square kilometres of which
Appendix T CCMP TRAIL TRAFFIC & TRANSPORTATION DESIGN STANDARD
 Appendix T CCMP 3.3.4 TRAIL TRAFFIC & TRANSPORTATION DESIGN STANDARD 3.3.4 Trail Traffic and Transportation Design Multi-use trails have certain design standards, which vary depending on the agency that
NEPA and CEQA Transportation Operation Analysis
 3.1 Introduction Chapter 3 Transportation Operation Analysis This chapter includes a transportation analysis of the operational impacts of the following: The National Environmental Policy Act (NEPA) Alternatives
San Mateo County Comprehensive Bicycle and Pedestrian Plan
 San Mateo County Comprehensive Bicycle and Pedestrian Plan August 26, 2010 Presented to the San Mateo County BPAC by Lauren Ledbetter, Alta Planning + Design in association with: Fehr & Peers Eisen Letunic
Active Transportation Facility Glossary
 Active Transportation Facility Glossary This document defines different active transportation facilities and suggests appropriate corridor types. Click on a facility type to jump to its definition. Bike
EL CAMINO REAL BUS RAPID TRANSIT (BRT) PROJECT
 PROJECT") Agenda Item #4.2 EL CAMINO REAL BUS RAPID TRANSIT (BRT) PROJECT VTA BOARD WORKSHOP MAY 1, 2015 ABOUT THIS PRESENTATION CONTEXT Existing conditions and planning for growth WHAT IS THE PROJECT? Project alternatives
Agenda Item #4.2 EL CAMINO REAL BUS RAPID TRANSIT (BRT) PROJECT VTA BOARD WORKSHOP MAY 1, 2015 ABOUT THIS PRESENTATION CONTEXT Existing conditions and planning for growth WHAT IS THE PROJECT? Project alternatives
3.9 Recreational Trails and Natural Areas
 3.9 Recreational Trails and Natural Areas 3.9.1 Introduction Parks and other recreational facilities such as trails, bicycle routes, and open space are important community resources. This section discusses
APPENDIX W OFF-MODEL ADJUSTMENTS
 APPENDIX W OFF-MODEL ADJUSTMENTS The three-county travel demand model was used to evaluate the land use and transportation project scenarios for the Regional Transportation Plan Update. The model provided
PURPOSE AND POLICY GUIDANCE
 1 PURPOSE AND POLICY GUIDANCE The VTA Bicycle Technical Guidelines (BTG) present standards and guidance for planning, designing, operating, retrofitting and maintaining roadways and bikeways. They are
Chapter 14 PARLIER RELATIONSHIP TO CITY PLANS AND POLICIES. Recommendations to Improve Pedestrian Safety in the City of Parlier (2014)
") Chapter 14 PARLIER This chapter describes the current status and future plans for biking and walking in the City of Parlier. RELATIONSHIP TO CITY PLANS AND POLICIES The Parlier General Plan is the primary
Chapter 14 PARLIER This chapter describes the current status and future plans for biking and walking in the City of Parlier. RELATIONSHIP TO CITY PLANS AND POLICIES The Parlier General Plan is the primary
8. Collisions INTRODUCTION
 8. Collisions INTRODUCTION While traffic collisions can affect anyone, they have a disproportionate impact on bicyclists, who along with pedestrians are the most vulnerable users of the transportation
Bicycle Master Plan Goals, Strategies, and Policies
 Bicycle Master Plan Goals, Strategies, and Policies Mobilizing 5 This chapter outlines the overarching goals, action statements, and action items Long Beach will take in order to achieve its vision of
Northbound San Jose Avenue & I-280 Off-Ramp Road Diet Pilot Project
 Project Overview Fed by a two-lane Interstate-280 (I-280) off-ramp, high vehicular volumes and speeds are longstanding issues along San Jose Avenue. Residents in the surrounding neighborhoods have expressed
5. RUNNINGWAY GUIDELINES
 5. RUNNINGWAY GUIDELINES These guidelines should be considered collectively when making runningway decisions. A runningway is the linear component of the transit system that forms the right-of-way reserved
SETTINGS AND OPPORTUNITIES MOBILITY & ACCESS
 7 mobility & access how do people use el camino what is it like to drive on el camino/to park along el camino what is the pedestrian experience like what is the role of transit along the corridor what
Clackamas County Comprehensive Plan
 ROADWAYS The County s road system permits the movement of goods and people between communities and regions, using any of a variety of modes of travel. Roads provide access to virtually all property. They
General Design Factors
 Chapter 3: 3-1.0 Introduction General Design Factors Mn/DOT s goals include encouraging and accommodating safe bicycling. From a design perspective, these goals are achieved by first having an understanding
BICYCLE SAFETY OBSERVATION STUDY 2014
 County of Santa Cruz Health Services Agency BICYCLE SAFETY OBSERVATION STUDY BACKGROUND AND PURPOSE The County of Santa Cruz Health Services Agency (HSA) in conjunction with the Community Safety Coalition
St. Francis Drive through the City of Santa Fe Corridor Study
 VII. ENGINEERING AND ENVIRONMENTAL EVALUATION TRAIL CONNECTIVITY In the southern portion of the Corridor there is a lack of a sidewalk, trail or bicycle facility within the right-ofway. However, the City
APPENDIX E: Transportation Technical Report
 New Jersey Pennsylvania Lackawanna Cut-Off Passenger Rail Service Reston Project Environmental Assessment APPENDIX E: Transportation Technical Report E.1 Introduction As part of the overall environmental
Caltrain Bicycle Parking Management Plan DRAFT PROJECT SCOPE SUBMITTED TO CALTRANS FALL 2014
 Caltrain Bicycle Parking Management Plan DRAFT PROJECT SCOPE SUBMITTED TO CALTRANS FALL 2014 NOTE: The following draft scope of work was developed by Caltrain in the fall of 2014 as part of a Caltrans
MCTC 2018 RTP SCS and Madera County RIFP Multi-Modal Project Eval Criteria GV13.xlsx
 MCTC 8 RTP SCS and Madera County RIFP Multi-Modal Project Eval Criteria GV.xlsx Madera County Transportation Commission Regional Transportation Plan / Sustainable Communities Strategy Multi-Modal Project
The I-680 Southbound Express Lane
 The I-680 Southbound Express Lane ALAMEDA County Transportation Commission FY2014-15 Annual Report SUNOL SMART CARPOOL LANE JOINT POWERS AUTHORITY Table of Contents Message from the Chair...3 I-680 Southbound
SECTION 1 - TRAFFIC PLANNING
 SECTION 1 - TRAFFIC PLANNING 1.1 TRAFFIC OPERATIONS 1.1.1 Roadway Functional Classification The Multnomah County Comprehensive Framework Plan s Policy 34: Trafficways and the Functional Classification
1999 On-Board Sacramento Regional Transit District Survey
 SACOG-00-009 1999 On-Board Sacramento Regional Transit District Survey June 2000 Sacramento Area Council of Governments 1999 On-Board Sacramento Regional Transit District Survey June 2000 Table of Contents
Complete Street Analysis of a Road Diet: Orange Grove Boulevard, Pasadena, CA
 Complete Street Analysis of a Road Diet: Orange Grove Boulevard, Pasadena, CA Aaron Elias, Bill Cisco Abstract As part of evaluating the feasibility of a road diet on Orange Grove Boulevard in Pasadena,
SUMMARY OF TRANSPORTATION INVESTMENTS
 Santa Cruz County 2016 Measure D: Transportation Improvement Expenditure Plan - Approved by over 2/3 of Santa Cruz County voters on November 8, 2016 - Overview Measure D, the 2016 Transportation Improvement
Mission Bay Loop (MBL) Public Meeting
 Public Meeting") Mission Bay Loop (MBL) Public Meeting La Scuola Internazionale di San Francisco, November 18, 2014 Frequently Asked Questions 1. When would construction have to start before the SFMTA loses TIGER funds?
Mission Bay Loop (MBL) Public Meeting La Scuola Internazionale di San Francisco, November 18, 2014 Frequently Asked Questions 1. When would construction have to start before the SFMTA loses TIGER funds?
ABOUT THIS STUDY The Tenderloin-Little Saigon Community-Based Transportation Plan
 ABOUT THIS STUDY The Tenderloin-Little Saigon Community-Based Transportation Plan The Greater Tenderloin Community Study Milestones October Community based organizations (Tenderloin Housing Clinic and
Los Altos Hills Town Council - June 18, 2015 Palo Alto City Council June 22, AGENDA ITEM #2.B Presentation
 Los Altos Hills Town Council - June 18, 2015 Palo Alto City Council June 22, 2015 AGENDA ITEM #2.B Presentation Previous Presentations Los Altos Hills Town Council in May 2014 and February 2015 Palo Alto
Appendix 3 Roadway and Bike/Ped Design Standards
 Appendix 3 Roadway and Bike/Ped Design Standards OTO Transportation Plan 2040 4/20/2017 Page A3-1 Adopted Standards The adopted OTO Design Standards and Major Thoroughfare Plan are contained herein.
Corpus Christi Metropolitan Transportation Plan Fiscal Year Introduction:
 Introduction: The Safe, Accountable, Flexible, Efficient Transportation Equity Act: A Legacy for Users (SAFETEA-LU) has continued the efforts started through the Intermodal Surface Transportation Efficiency
A Survey of Planning, Design, and Education for Bikeways and Bus Routes on Urban Streets
 A Survey of Planning, Design, and Education for Bikeways and Bus Routes on Urban Streets, Community & Economic Development Agency, Transportation Services Division (510) 238-3983 bikeped@oaklandnet.com
TRANSPORTATION & MOBILITY
 TRANSPORTATION & MOBILITY ROADWAY SYSTEM There are approximately 40 miles of roadways in Manitou Springs. For planning purposes, roadways are typically assigned a functional classification which defines
Appendix E: Bike Crash Analysis ( )
") Appendix E: Bike Crash Analysis (2009-2012) Davis Bicycle Crashes Analysis 2009-2012 December 2013 Ride Walk Davis Active Transportation Program City of Davis December 2013 Prepared by: Jimmy Fong Active
Appendix E: Bike Crash Analysis (2009-2012) Davis Bicycle Crashes Analysis 2009-2012 December 2013 Ride Walk Davis Active Transportation Program City of Davis December 2013 Prepared by: Jimmy Fong Active
3.9 - Transportation and Traffic
 Transportation and Traffic 3.9 - Transportation and Traffic This section describes the potential transportation and traffic effects of project implementation on the project site and its surrounding area.
New Seward and 36 th Avenue Intersection Conceptual Design
 University of Alaska Anchorage New Seward and 36 th Avenue Intersection Conceptual Design Prepared By: Zaid S. Hussein Dana Menendez Galen Jones Civil Engineering Department Prof. Osama Abaza CE A404 Highway
6.0 PEDESTRIAN AND BICYCLE FACILITIES 6.1 INTRODUCTION 6.2 BICYCLE DEMAND AND SUITABILITY Bicycle Demand
 6.0 PEDESTRIAN AND BICYCLE FACILITIES 6.1 INTRODUCTION Bicycle and pedestrian travel along and in the vicinity of the corridor is part of the vision of Somerset and Hunterdon counties and the integrated
Travel and Rider Characteristics for Metrobus
 Travel and Rider Characteristics for Metrobus 040829040.15 Travel and Rider Characteristics for Metrobus: 2012-2015 Overview The Miami Dade County Metropolitan Planning Organization (MPO) conducted a series
VTA Development Review Program Annual Report for 2015
 VTA Development Review Program Annual Report for 2015 Web Version May 13, 2016 Presentation Outline I. Background II. Data Snapshot a. Development Review Activity for 2015 b. Select Projects Under Construction
Regional Transportation Needs Within Southeastern Wisconsin
 Regional Transportation Needs Within Southeastern Wisconsin #118274 May 24, 2006 1 Introduction The Southeastern Wisconsin Regional Planning Commission (SEWRPC) is the official areawide planning agency
ACTIVE TRANSPORTATION
 ACTIVE TRANSPORTATION Mobility 2040 Supported Goals Improve the availability of transportation options for people and goods. Support travel efficiency measures and system enhancements targeted at congestion
o n - m o t o r i z e d transportation is an overlooked element that can greatly enhance the overall quality of life for the community s residents.
 N o n - m o t o r i z e d transportation is an overlooked element that can greatly enhance the overall quality of life for the community s residents. 84 Transportation CHAPTER 11 INTRODUCTION Transportation
CONNECTING PEOPLE TO PLACES
 CONNECTING PEOPLE TO PLACES 82 EAST BENCH MASTER PLAN 07 Introduction The East Bench transportation system is a collection of slow moving, treelined residential streets and major arteries that are the
METHODOLOGY. Signalized Intersection Average Control Delay (sec/veh)
") Chapter 5 Traffic Analysis 5.1 SUMMARY US /West 6 th Street assumes a unique role in the Lawrence Douglas County transportation system. This principal arterial street currently conveys commuter traffic
Chapter 5 Traffic Analysis 5.1 SUMMARY US /West 6 th Street assumes a unique role in the Lawrence Douglas County transportation system. This principal arterial street currently conveys commuter traffic
FROM: CITY MANAGER DEPARTMENT: PLANNING AND COMMUNITY ENVIRONMENT DATE: OCTOBER 4, 2004 CMR:432:04
 TO: HONORABLE CITY COUNCIL FROM: CITY MANAGER DEPARTMENT: PLANNING AND COMMUNITY ENVIRONMENT DATE: OCTOBER 4, 2004 CMR:432:04 SUBJECT: FINANCE COMMITTEE RECOMMENDATION TO ADOPT TRANSPORTATION STRATEGIC
SANTA CLARA COUNTY I-280 CORRIDOR STUDY
 SANTA CLARA COUNTY I-280 CORRIDOR STUDY Appendix D CrowdSpot Outreach Summary SANTA CLARA VALLEY TRANSPORTATION AUTHORITY (VTA) 1-1 Introduction Background I-280 Corridor Study project used Crowdspot mapping
Dear City Council Members,
 From: Bob Kenyon [mailto: ] Sent: Monday, February 08, 2016 10:20 AM To: City Clerk Subject: Please prioritize Caltrain and a complete transit network Thank you for prioritizing bringing BART to San Jose
Chapter 5 Future Transportation
 Chapter 5 Future Transportation The Future Land Use Plan identifies the desired land use designations. The land uses desired for Crozet depend, in large part, on the success of the transportation system,
Monterey Road Complete Streets
 Monterey Road Complete Streets Complete Street Objectives Improve livability and economic vitality Enhance pedestrian environment Accommodate bicyclists safely Reduce noise and air pollution Create attractive,
CURBSIDE ACTIVITY DESIGN
 5 CURBSIDE ACTIVITY DESIGN This chapter provides design guidance for separated bike lanes adjacent to curbside activities including parking, loading and bus stops. Typical configurations are presented
SOLANA BEACH BICYCLE TRANSPORTATION PLAN SECOND ADDENDUM
 SOLANA BEACH BICYCLE TRANSPORTATION PLAN SECOND ADDENDUM Prepared by the City of Solana Beach January 2005 Introduction In June of 1993, the Solana Beach City Council adopted a Bikeway Master Plan as directed
Transportation 6. A. Transit Center Circulation and Access. 1. Transit Center Circulation
 Transportation 6 This chapter describes the transportation system in and around the Hillsdale Station Area, with a focus on the Transit Center at the relocated Hillsdale Caltrain Station. The transportation
Route 7 Corridor Study
 Route 7 Corridor Study Executive Summary Study Area The following report analyzes a segment of the Virginia State Route 7 corridor. The corridor study area, spanning over 5 miles in length, is a multi
I will attend tonight's meeting to summarize this proposal during my public comment. Thank you.
 Grossman, Rachel M From: Andrew Boone Sent: Wednesday, January 11, 2012 2:29 PM To: thprop@earthlink.net; nate.menlopark@gmail.com; Bianca.walser@gmail.com; Mshiu147@gmail.com; menlo.commish.mueller@gmail.com;
San Mateo County Bicycle and Pedestrian Advisory Committee
 San Mateo County Bicycle and Pedestrian Advisory Committee January 19, 2017 Emma Shlaes, Policy Manager About SVBC Mission Our purpose is to create a healthy community, environment, and economy through
State Highway 16/McDermott Road Kuna-Mora Road to Ada/Gem County Line
 Background State Highway 16 is the main commuter route from Gem County to the Treasure Valley. An increase in traffic and accidents on this highway have been a concern for several years, and the Idaho
4.11 Transportation and Traffic
 4.11.1 Introduction This section evaluates whether implementation of the Russian River Estuary Management Project (Estuary Management Project) would result in potential adverse impacts related to transportation
Dear Mr. Tweed: Sincerely, Min Zhou, P.E. Vice President
 December 17, 2012 Mr. Steve Tweed City of Long Beach, Department of Public Works Traffic & Transportation Bureau, 10 th Floor City Hall 333 West Ocean Boulevard Long Beach, CA 90802 Subject: Broadway and
Welcome! San Jose Avenue Open House August 25, 2015
 Welcome! San Jose Avenue Open House August 25, 2015 Vision Zero The City and County of San Francisco adopted Vision Zero San Francisco Vision Zero High Injury Network as a policy in 2014, committing an
BICYCLE & PEDESTRIAN ADVISORY COMMITTEE MINUTES
 BICYCLE & PEDESTRIAN ADVISORY COMMITTEE Wednesday, September 13, 2006 MINUTES 1. CALL TO ORDER The Regular Meeting of the Valley Transportation Authority (VTA) Bicycle and Pedestrian Advisory Committee
Grade Separated Intersection
 Grade Separated Intersection Lecture Notes in Transportation Systems Engineering Prof. Tom V. Mathew Contents 1 Overview 1 2 Classification of Intersection 2 2.1 Grade Separated Intersection...........................
Dr. Naveed Anwar Executive Director, AIT Consulting Affiliated Faculty, Structural Engineering Director, ACECOMS
 Dr. Naveed Anwar Executive Director, AIT Consulting Affiliated Faculty, Structural Engineering Director, ACECOMS Overview Highway Functions and Classifications Highway Design Components Design Control
EL CAMINO REAL BUS RAPID TRANSIT PROJECT
 EL CAMINO REAL BUS RAPID TRANSIT PROJECT Would upgrade the current 522 Rapid Bus to BRT status by making changes to El Camino Real and The Alameda that make transit FAST, FREQUENT AND RELIABLE and make
COMMUNITY MEETING AGENDA
 COMMUNITY MEETING AGENDA Welcome and Introductions SAFE Presentation Project Presentation Priorities Feedback Next Steps Q&A Santa Cruz Avenue Corridor Study 1 Santa Cruz Avenue Corridor Study Community
Bicycle - Motor Vehicle Collisions on Controlled Access Highways in Arizona
 Bicycle - Motor Vehicle Collisions on Controlled Access Highways in Arizona Analysis from January 1, 1991 to June 30, 2002 Richard C. Moeur, PE Traffic Design Manager, Northern Region Michelle N. Bina
State Highway 16 Kuna-Mora Road to Ada/Gem County Line
 Background Update! (February 2018): This project has been partially funded; see below. State Highway 16 is the main commuter route from Gem County to the Treasure Valley. An increase in traffic and accidents
PEDESTRIAN ACTION PLAN
 ATTACHMENT 2 CITY OF SANTA MONICA PEDESTRIAN ACTION PLAN CITY OF SANTA MONICA PEDESTRIAN ACTION PLAN This page intentionally left blank EXECUTIVE SUMMARY CHAPTER 1 EXECUTIVE SUMMARY Setting the Stage
Memorandum. Fund Allocation Fund Programming Policy/Legislation Plan/Study Capital Project Oversight/Delivery Budget/Finance Contract/Agreement Other:
 Memorandum Date: November 20, 2017 To: Transportation Authority Board From: Eric Cordoba Deputy Director Capital Projects Subject: 12/5/17 Board Meeting: San Francisco Freeway Corridor Management Study
METRO Light Rail: Changing Transit Markets in the Phoenix Metropolitan Area
 METRO Light Rail: Changing Transit Markets in the Phoenix Metropolitan Area Abhishek Dayal, AICP Planner III, METRO Light Rail Phoenix, AZ BACKGROUND Transit in the Phoenix Region Transit services in the
Vision Zero San Jose. Moving toward zero traffic deaths and providing safe streets for all
 Vision Zero San Jose Moving toward zero traffic deaths and providing safe streets for all SPUR San Jose April 4, 2017 Source: Vision Zero Network Vision Zero Core Principles 1. Traffic deaths are preventable