4Chapter Four. Reaching Our Destination. (Proposed Transportation Program)
|
|
|
- Jayson Dickerson
- 6 years ago
- Views:
Transcription

1 4Chapter Four Reaching Our Destination (Proposed Transportation Program) The findings from existing conditions and the feedback received from the community outreach were used to develop the proposed transportation program described in this Chapter. The transportation program is a coordinated series of actions Redwood City will follow to prioritize transportation projects to guide future transportation investments in Redwood City. As part of its transportation program, Redwood City developed a prioritization process that evaluates and tracks projects according to a series of performance measures. Transportation performance measures are used to assess the current performance of Redwood City s transportation system, demonstrate the value of multimodal transportation projects, prioritize and inform investments, and help monitor change over time. 36 4
2 RWCmoves evaluated a list of transportation projects and programs that are currently in progress or previously identified, as well as new projects and programs that emerged through the Plan development process. Projects were prioritized based on the extent to which they improve performance of the transportation system. Tier 1 and Signature Projects make up the top scoring projects based on the evaluation process. For more detailed information on the project prioritization process and results, see Appendix B. RWCmoves supports development of an updated multimodal Transportation Impact Fee (TIF) program for Redwood City that would incorporate highpriority transportation projects and programs. TIF programs provide funding for planning and construction of transportation projects needed to support traffic generated by new development. Redwood City s TIF program would generate funding for high-priority project development and construction, such as Tier 1 projects, select Tier 2 projects, and expected locally-funded portions of Signature Projects. Project Categories RWCmoves includes previously identified transportation projects and programs as well as a number of new projects and programs. New projects and programs were developed from community member and stakeholder input, as well as through the analysis of existing conditions and opportunities. Some new projects are entirely new efforts, while others are modifications of previously identified projects and programs. Based on their primary characteristics, the list of projects (see Appendix B) are organized into the following seven project categories: Active Transportation Corridors Complete Street Corridors and Placemaking Transit Access and Service Enhancements Roadway Congestion and Delay Improvements Network Gap Closure, Connectivity and Safety Transportation Technologies and Innovations Transportation Demand Management (TDM) Chapter Four: Reaching Our Destination 37
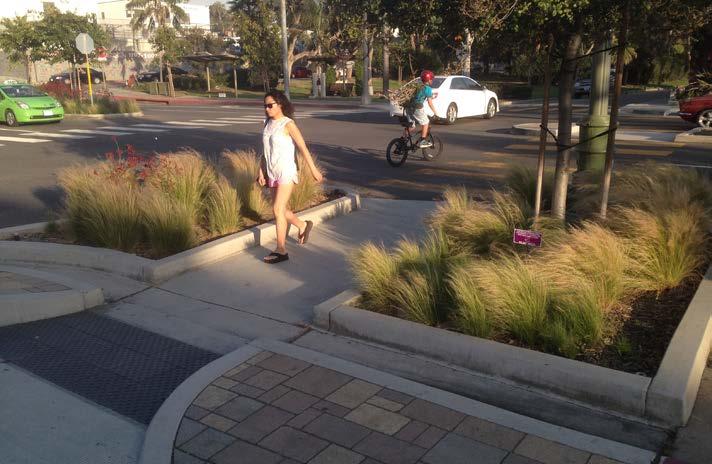
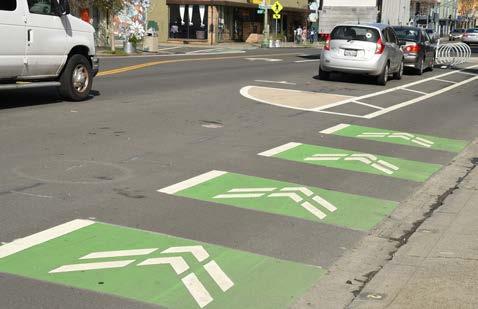
3 There are about 130 total projects included in the Plan prioritization process. Figure 11 presents the proportion of projects within each project category. The remainder of this section provides detailed descriptions of each project category and improvement measures that could be considered as part or all of a project. Figure 11: Division of Project List by Category Active Transportation Corridors 22% Transportation Demand Management (TDM) 3% Transportation Technologies and Innovations 3% Network Gap Closure, Connectivity and Safety 29% Source: Fehr & Peers, Division of Project List by Category Complete Street Corridors and Placemaking 22% Transit Accessibility and Service Enhancement 11% Roadway Congestion and Delay Improvements 10% Category 1: Active Transportation Corridors Active transportation is any self-propelled, human-powered mode of transportation, such as bicycling or walking. Safer and more comfortable corridors encourage the use of active transportation, which can improve a person s overall health. Projects labeled as Active Transportation Corridors provide convenient connections for cyclists and pedestrians along corridors throughout the City and can enhance safety. These types of projects include new or improved bicycle facilities, new or improved walking facilities, and better access to transit for active travel modes. Improved street design (wider sidewalks, low-stress bike routes, street trees, street lighting, and better access to transit) increases both the utilization of active transportation modes and spurs community interaction, which can in turn improve the health of the City s residents and increase economic activity. Figure 12 shows the general locations of the Active Transportation Corridor projects included in the Plan. 38 4
4 Figure 12: Active Transportation Corridor Projects B 101 San Francisco Bay B B M arine Pkwy A Shearwater Pkwy Redwood Shores Pkwy Farm Hill Blvd } 82 E dgewoo d Rd Brewster Ave 101 Whipple Ave Hopkins Ave Industrial Way Hudson St Alameda de l as Pulgas 8 1 Arguello St Jefferson Ave Roosevelt Ave Redwood Ave Valota Rd Virginia Ave 6 Main St Veterans Blvd } Woodside Rd Maple St Seaport Blvd Charter St El Camino Real Middlefield Rd E Bayshore Rd Broadway St Bay Rd } 82 2nd Ave 5th Ave Spring St A } 82 1 MILE Non-Location Specific Projects: MILE Redwood City Limits Parks Active Transportation Corridor Projects Figure 12 Sphere of Influence Schools Railroad Active Transportation Corridor Projects Chapter Four: Reaching Our Destination 39


")


5 Pedestrian Hybrid Beacon (HAWK Signal) Rectangular Rapid Flash Beacon (aka Lighted Crosswalk) High-Visibility Signs and Crosswalks Advanced Yield Lines Lane Reduction (aka Lane Reconfiguration) Median Refuge Island Curb Extension Reduced Curb Radii Pedestrian-Scale Lighting 40 4
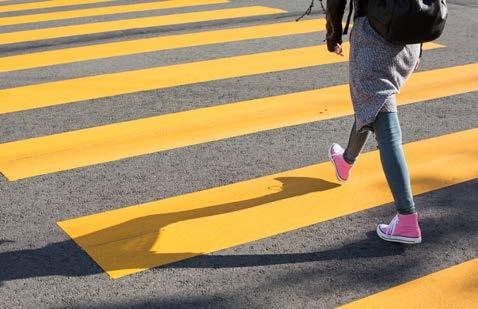
6 Pedestrian Improvement Measures Examples of pedestrian improvements that can improve the safety, comfort, and convenience of people who choose to walk include: Pedestrian Hybrid Beacon (aka HAWK Signal): Pedestrian Hybrid Beacons (PHBs), also known as High Intensity Activated Crosswalk (HAWK) Signals, are pedestrian-actuated signals that combine a beacon flasher and a traffic control signal. When actuated, PHBs displays a yellow (warning) indication followed by a solid red light. During pedestrian clearance, the driver sees a flashing red wig-wag pattern until the clearance interval has ended and the signal goes dark. Rectangular Rapid Flash Beacon (Stutter Flash): Rapid flashing LED lamps are installed on overhead signs, in advance of the crosswalk or at the crosswalk. The beacons may be push-button activated or activated with passive pedestrian detection. High-Visibility Signs and Crosswalks: High-visibility markings include a family of crosswalk striping styles including the ladder style. Highvisibility fluorescent yellow green signs are posted at crossings to increase the visibility of a pedestrian crossings. Advanced Yield Lines: Standard white yield limit lines and shark s teeth are placed in advance of marked, uncontrolled crosswalks. Lane Reduction (aka Lane Reconfiguration): Lane reductions replace the existing number of vehicle travel lanes with a combination of wider sidewalks, bicycle lanes, vehicle parking, or converting parallel parking to angled or perpendicular parking. Median Refuge Island: Raised islands are placed in the center of a street, separating opposing lanes of traffic, and have cutouts along the pedestrian path. Curb Extension: Curb extension, also known as a pedestrian bulb-out, is a traffic-calming measure meant to slow traffic and increase driver awareness of pedestrians. Reduced Curb Radii: The radius of a curb can be reduced to require motorists to make a tighter turn. It consists of an extension of the curb into the street, making the pedestrian space (sidewalk) wider. Pedestrian-Scale Lighting: Pedestrian-scale light fixtures range in height between 12 and 18 feet (to light source) and can be stand-alone or attached to taller street light fixtures (ideally of the same style). Chapter Four: Reaching Our Destination 41


")
7 Enhanced Bicycle Lane Cycle Track Bicycle Signal Protected Intersection Bicycle Boulevard Supportive Bicycle Facilities (example: bike locker) 42 4
8 Bicycle Improvement Measures Bicycle improvements that increase the safety, comfort, and convenience of people who choose to bike include: Bicycle Backbone Network: A bicycle backbone network is a system of low-stress bicycle routes that provide safe and convenient and connections throughout the City. Low-stress bicycle routes include a network of bicycle boulevards, buffered bike lanes, and cycle tracks (see definitions below) that provided designated spaces for cyclists away from streets with high vehicle volumes (3,000 vehicles per day maximum) and high vehicle speeds (above 25 mph). Enhanced Bicycle Lane: Bicycle lanes are a portion of the street that are designated by signage, striping, and pavement markings for use of bicyclists. Bicycle lanes are most appropriate on streets with more than 3,000 vehicles per day and with posted speed limits greater than 25 mph. On streets with high vehicle volumes, truck traffic, high parking turnover, or speed limits greater than 35 mph, bicycle lanes can be enhanced to further separate vehicles from bicyclists. Bicycle lanes can be enhanced by adding a painted, landscaped buffer or parking-protected buffer. Bicycle Signal: Bicycle signals are traffic control devises that should only be used at existing traffic signals or hybrid beacons. Bicycle signals generally provide additional guidance for cyclists at intersections where their needs may differ from other road users. For example, bicycle signal phases, bicycle only movements, and lead bicycle intervals at signalized intersections. Bicycle Boulevard: Bicycle boulevards, also known as greenways, are streets with low traffic volumes and speeds that are designed to accommodate bicycle travel as a priority. Many local streets with low vehicle speeds and volumes are already conducive to safe bicycling environments. These types of streets can be enhanced with a range of treatments to create bicycle boulevards. Bicycle boulevards can provide direct access to destinations, slow motor vehicle speeds, reduce motor vehicle volumes, reduce bicyclist delay, provide safe and convenient crossings, and enhance surrounding environments. Cycle Track: Cycle tracks, often referred to as Class IV bicycle facilities, are bike facilities that physically separated from motor vehicle traffic and from the sidewalk. Cycle tracks can be designed as one-way protected or two-way cycle tracks, and can be at street level, sidewalk level, or at an intermediate level. Cycle tracks are most appropriate on streets that could cause many bicyclists to feel stress from factors such as high vehicle speeds, high vehicle volumes, multiple vehicle travel lanes, high parking turnover. They can also be considered on streets with high bicycle volumes and at locations where special considerations should be given, like near transit stops to manage bicycle and pedestrian conflicts. Protected Intersection: Protected intersections use a combination of design elements to create safe and comfortable conditions for bicyclists and pedestrians. Protected intersection design elements can include: high quality bicycle waiting areas at corners, colored pavement to guide bicycle travel paths, and narrowed intersections with small curb radii to reduce vehicle-turning speeds. Protected intersections slow turning vehicles, provide good sight lines for all users, and shorten bicycle and pedestrian crossing distances. Supportive Bicycle Facilities: Supportive facilities include bicycle racks, bicycle lockers, bicycle fix-it stations, and other features that make it easier for people to use a bicycle as a common mode of travel. These types of facilities should be located at locations with high demand and in areas that are most convenient for cyclists. Chapter Four: Reaching Our Destination 43
9 Category 2: Complete Street Corridors and Placemaking California s Complete Streets Act (AB 1358) was signed into law in 2008 and mandates that complete street policies and standards be incorporated into City General Plans. The complete street concept recognizes that transportation corridors have multiple users with different abilities and mode preferences (e.g., pedestrians, bicyclists, transit riders, and drivers) that need to be accommodated. An effective transportation system allows for the use of multiple modes and offers a variety of travel options for people to move around in ways that best suit them. Complete street corridor projects can make streets safer, more comfortable and convenient for people using all travel modes. Specific improvements that could be considered as part of complete street corridor projects include the placemaking improvements listed below as well as improvements discussed in other sections, including Active Transportation Corridors, Transit Access and Service Enhancements, and Roadway Congestion and Delay Improvements. Not only do public streets facilitate the movement of people and goods, they provide places for people to congregate, sit, watch, and interact. Creating vibrant and welcoming public spaces for people to live, work, and play is known as placemaking. Placemaking improves spaces where people gather, such as streets and sidewalks, in order to generate greater activity and interaction between people. As the City continues to expand and invest in its infrastructure, improvements must also be made to enhance the streetscape realm, creating attractive environments for walking, biking, and transit to create a balanced transportation system. Figure 13 shows the locations of the Complete Street Corridor and Placemaking projects included in the Plan. Placemaking Improvement Measures Placemaking improvements that can be used to enhance the streetscape and encourage activity include: Public Art: Public art can include sculptures, fountains, murals and other forms of art that encourage people to look around and explore their surroundings. Public Seating: Seating, such as traditional park benches or parklets, provide comfortable and convenient places for people to sit and rest. Parklets, also known as street seats or curbside seating, are platforms that transform parking spaces into public seating areas and generally incorporate elements of landscaping (see description below) and/or bicycle racks. Parklets can be considered where there are narrow or congested sidewalks, or where local property owners or residents see a need to expand seating capacity in an area. 44 4


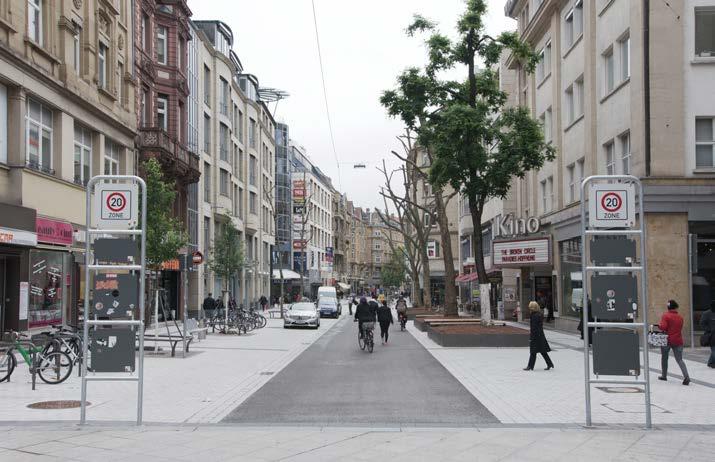
10 Public Plaza: A plaza is an open public space that serves as a place where people gather, such as a city square. Paseo: A paseo, also known as a promenade, is a public place or path designed for walking. Shared Space: Shared space is a street design that minimizes the separation of bicyclists, pedestrians, and vehicles. This can be done by removing street markings, traffic lights, traffic signs, and curbs. By creating a greater sense of place and making it unclear what travel mode has priority, drivers will reduce their speed, and in turn improve safety for all users. Landscaping: Landscaping ads to the enjoyment of a place by providing scenery, offering shade, and separating people from moving vehicles on the street. Stormwater management and native vegetation are two common landscaping treatments that help create a sense of place. Stormwater management includes bioswales, permeable pavement, and rain gardens. Native vegetation are plants that are indigenous to the area and provide habitat for wildlife. Public Art Public Seating Wayfinding: Wayfinding provides information signage about the direction, distance and sometimes travel time by mode to destinations. The signs are designed to create a sense of community, and make the destinations feel more walkable and bikeable. Public Plaza Chapter Four: Reaching Our Destination 45
11 Paseo Landscaping Shared Space Wayfinding 46 4
12 Figure 13: Complete Street Corridors and Placemaking Projects B San Francisco Bay B B M arine Pkwy A Shearwater Pkwy Redwood Shores Pkwy d Ed gewood R 101 } 82 Whipple Ave Hopkins Ave Hudson St Brewster Ave Alameda de l as Pulgas Industrial Way 32 Arguello St Jefferson Ave Roosevelt Ave Redwood Ave Valota Rd Virginia Ave Main St Veterans Blvd Maple St } 84 Seaport Blvd El Camino Real Charter St E Bay Broadway St Bay Rd Middlefield Rd shore Rd } 82 2nd Ave 5th Ave 52 Spring St A Farm Hill B 51 lvd Woodside Rd } 82 1 MILE Non-Location Specific Projects: MILE Redwood City Limits Sphere of Influence Parks Schools Railroad Complete Street Corridors and Placemaking Projects Figure 13 Complete Street Corridors and Placemaking Projects Chapter Four: Reaching Our Destination 47
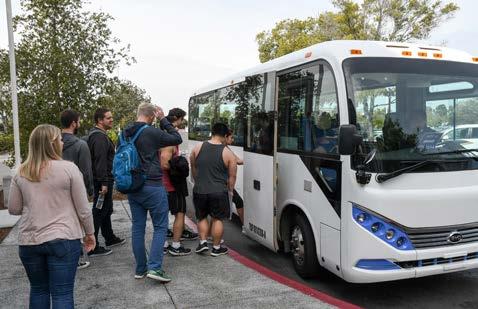
13 Category 3: Transit Access and Service Enhancements Access, performance, convenience, and comfort are key factors for improving the public transportation experience and encouraging new riders. Projects that improve transit access and service seek to enrich the round-trip experience for users of public transportation by improving the transit service directly, or by developing transit-enhanced streets. Transit enhanced streets may receive a number of design elements to improve transit performance and/or the overall user experience for people who walk and take transit. Enhancements may range from streetscape improvements that make walking safer and easier, to transit shelters, or bus priority at intersections. Just as significant, providing reliable and frequent transit service that is convenient and safe, increases roadway capacity by reducing drive-alone trips, shifts more people to transit, and integrates transit access and service investments with the identity of the surrounding street. Figure 14 shows the locations of the Transit Access and Service Enhancement projects included in the Plan. Transit Access and Service Enhancement Measures Several transit service enhancements that can increase multimodal connectivity throughout the City, and improve transit service and reliability for those who choose to take public transit include: Transit Signal Priority (TSP): TSP technology detects approaching transit vehicles to an intersection and extends green lights or shortens red lights to reduce transit delay. TSPs can increase frequency and reliability throughout the transit network, as well as reduce fuel costs and greenhouse gas emissions. Integrated Passenger Information System: Integrated passenger information system compiles traveler information from multiple transit providers into one place. Passenger information can include transit schedules and fares, real-time transit vehicle locations with estimated departure/arrival time, and wayfinding signage. Enhanced Transit Stop: Potential enhancements to transit stops include improved pedestrian access, waiting areas, shelters, seating, bicycle storage facilities, and lighting. These upgrades provide safe, comfortable, and convenient experience for passengers. Demand-Responsive Transit: Demand-responsive transit (DRT), sometimes referred to as dial-a-ride transit (DART) and flexible transport services, is a form of public transit offering flexible routing and scheduling of small/medium sized vehicles operating between origins and destinations according to passenger needs. Queue Jump Lane: Queue jump lanes (a transit only lane on the approach to a signalized intersection) allow transit vehicles to bypass traffic queues at signalized intersections. Queue jump lanes increase transit efficiency by reducing delay for buses at signalized intersections. Bus Bulbouts: Bus bulbouts are sidewalk extensions at transit stops that expand the curb space from the edge of the curb to the travel lane. Bus bulbouts reduce delay by eliminating the need for buses to pull in and out of traffic and they provide more space for amenities (i.e. bus shelters, wayfinding maps, landscaping). Bus bulbouts can also increase safety for riders as they no longer need to enter the street for boarding. Access Improvements: Access improvements make it easier to walk, bike or drive to transit stops. Examples include enhanced bike lanes, intersection treatments, park-and-ride lots, curb ramps, and crossing signals. 48 4
")


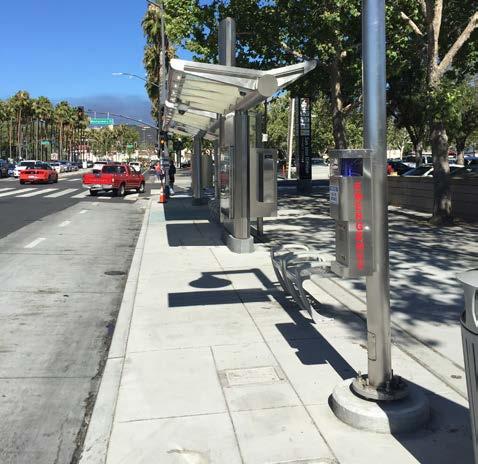
14 Transit Signal Priority (TSP) Integrated Passenger Information System Enhanced Transit Stop Demand-Responsive Transit Access Improvements Bus Bulbouts Chapter Four: Reaching Our Destination 49
15 Figure 14: Transit Access and Service Enhancement Projects B 101 San Francisco Bay B B M arine Pkwy A Shearwater Pkwy Redwood Shores Pkwy Ed gewood R Farm Hill Blvd 101 } 82 d Whipple Ave Hopkins Ave Hudson St Brewster Ave Alameda de l as Pulgas Industrial Way Arguello St Jefferson Ave Roosevelt Ave Redwood Ave Valota Rd Virginia Ave Main St Veterans Blvd Woodside Rd Maple St } 84 Seaport Blvd Charter St El Camino Real 62 E Bay Middlefield Rd shore Rd Broadway St Bay Rd } 82 2nd Ave 5th Ave Spring St 101 A } 82 1 MILE Non-Location Specific Projects: MILE Redwood City Limits Sphere of Influence Parks Schools Railroad Transit Access and Service Enhancement Projects Figure 14 Transit Access and Service Enhancement Projects 50 4

16 Category 4: Roadway Congestion and Delay Improvements Areas with high employment activity, such as Downtown, Redwood Shores, Pacific Shores, and major streets that serve regional commuters, like Woodside Road and El Camino Real, experience greater-than-average levels of peak period congestion. Additionally, congestion is the greatest when both work commute and school trips peak, though only occurring for about 20 minutes on mornings when schools are in session. These congestion and delay improvements include considerations for school traffic. In addition to the multimodal improvements identified, enhancements to directly reduce vehicle congestion and delay will improve the overall experience for all users. Enhancements may range from traffic flow improvements and turnrestrictions to make vehicles travel more efficiently along a corridor, to major intersection and interchange treatments. Improved transit access and service, TDM programs, and active transportation projects, increase person throughput and proactively help manage traffic congestion and reduce neighborhood cut-through traffic. Figure 15 shows the locations of the Roadway Congestion and Delay Improvement projects included in the Plan. Roundabouts Congestion and Delay Improvement Measures Congestion and delay improvements, which can minimize environmental impacts, include: Adaptive Signal Timing: Adaptive signal timing is a specialized form of signal timing that dynamically adjusts signal cycles and phasing in response to real-time traffic conditions. It is most effective on heavily traveled corridors to reduce delays for all modes, including transit. Adaptive signal timing can reduce levels of congestion along a major street corridor, which benefits private automobiles and transit. Signal Coordination: Coordinated signal timing manages the movement and speed of vehicles to increase vehicle throughput. Coordinated signal timing should be considered along corridors with closely spaced signalized intersections (1/4 mile or less), and where there is a desire for a seamless flow of traffic or steady speed progression along a corridor. Signal coordination also provides the opportunity to monitor congestion and adjust signal timings through a central traffic management center. Roundabouts: Roundabouts accommodate high traffic levels in a way that can be more efficient and safer than standard signals. Installing roundabouts could reduce congestion and increase safety for all modes. Roundabouts should be considered at a wide range of intersections, but perform best at intersections with similar traffic volumes in all directions, and at intersections with heavy left turning movements. School Transportation Programs: The City should coordinate with schools to reduce congestion during peak times. For example, staggered school start times, school-focused transit, and safe routes to school programs can reduce vehicle travel during peak times. Chapter Four: Reaching Our Destination 51
17 Figure 15: Roadway Congestion and Delay Improvement Projects B San Francisco Bay B B M arine Pkwy A Shearwater Pkwy Redwood Shores Pkwy Ed gewood R 101 } 82 d Whipple Ave Hopkins Ave Industrial Way Arguello St Hudson St Brewster Ave Jefferson Ave Roosevelt Ave Broadway Redwood Ave Valota Rd Virginia Ave Veterans Blvd Main St Woodside Rd Maple St } Seaport Blvd El Camino Real 71 Charter St E Bay Middlefield Rd shore Rd Broadway St Bay Rd } 82 2nd Ave 5th Ave Spring St 101 A 101 Farm Hill Blvd Alameda de l as Pulgas } 82 1 MILE Non-Location Specific Projects: MILE Redwood City Limits Sphere of Influence Parks Schools Railroad Roadway Congestion and Delay Improvement Projects Figure 15 Roadway Congestion and Delay Improvement Projects 52 4

18 Category 5: Network Gap Closure, Connectivity and Safety Safety ranks as a top priority for many in Redwood City and is an important factor in creating a multimodal and accessible transportation network. Streets that are safe and stress-free are suitable for all ages and all modes of travel. In terms of transportation, concerns for physical safety stem from traffic speeds and volumes, conflict between different modes of travel, and a lack of dedicated infrastructure. With active modes of transportation becoming part of more people s everyday behavior, connectivity and safety measures must take into account the most vulnerable users people walking and riding bikes. Enhancements may range from bicycle and pedestrian crossings across major barriers, such as US 101 and the railroad tracks, and safe routes to school programs to make walking safer and easier for children. These projects and programs can reduce congestion by making it easier and safer for people to make trips by non-driving modes. Figure 16 shows the locations of the Network Gap Closure, Connectivity, and Safety projects included in the Plan. Chapter Four: Reaching Our Destination 53


19 Network Gap Closure and Connectivity Measures Several measures that close gaps and improve connectivity in the network include: Connection to Popular Destinations: Providing bicyclists and pedestrians with convenient access to points of interest, such as schools, transit, parks, neighborhoods, and landmarks, enhances access to these popular destinations, promotes active transportation and reduces travel by vehicle. Connection to Regional Trail Network: Regional trail networks provide bicyclists and pedestrians with a low-stress travel route. Providing better access to regional trails promotes non-auto travel modes for people who choose to walk or bike and increases recreational opportunities. Connection to Regional Trail Network New or Improved Street Connection: Developing new or improved street connections increase access to destinations by expanding the potential number of routes. If implemented with active travel modes in mind, new or improved street connections can also encourage people to walk or bike by creating alternative routes that are safer or more convenient. Grade Separation: Grade separation is the process of aligning two or more travel routes, such as streets, railroad tracks, bike paths, or footpaths, at different heights (grades) so that they do not disrupt other intersecting modes of travel. Overpasses (bridges), underpasses (tunnels), or combinations of both are used for grade separations. Grade Separation 54 4

: Vision Zero is an approach to street safety where no loss of life is acceptable.")

20 Safety Measures and Programs Several measures that can increase the safety and comfort for all travel modes along streets in the City include: Safe Routes to School Program: Safe routes to school programs increase the safety and convenience of children traveling to and from school. These programs create more opportunities for children to walk or bike to school, which could have a secondary benefit of decreasing vehicle trips. High Injury Networks (HIN): Vision Zero is an approach to street safety where no loss of life is acceptable. As part of advancing Vision Zero in the City, High Injury Networks are the intersections, blocks, corridors, or community-wide locations with the highest safety issues. The HIN locations are determined using observed collision data and anticipated collision risk, and are used for recommending, designing, and funding safety countermeasures. Leading Pedestrian Intervals (LPI): A Leading Pedestrian Interval typically provides pedestrians crossing an intersection with a 3-7 second head start over vehicles traveling in the same direction. LPIs improve the visibility of pedestrians and enhance their right-of-way over turning vehicles, especially at locations with a history of pedestrian and vehicle conflicts. Safe Routes to School Program High Injury Networks (HIN) Leading Pedestrian Intervals (LPI) Chapter Four: Reaching Our Destination 55
21 Figure 16: Network Gap Closure, Connectivity and Safety Projects B 101 San Francisco Bay B B M arine Pkwy 87 A Shearwater Pkwy Redwood Shores Pkwy 94 } 82 1 MILE Ed gewood R Farm Hill Blvd } 82 d Whipple Ave Hopkins Ave Arguello St Broadway Hudson St Brewster Ave 102 Alameda de l as Pulgas 105 Non-Location Specific Projects: 106 Industrial Way 89 Jefferson Ave 93 Roosevelt Ave Redwood Ave Valota Rd Virginia Ave Veterans Blvd Main St Woodside Rd Maple St 107 Middlefield Rd } Seaport Blvd Charter St El Camino Real E Bay shore Rd Broadway St Bay Rd 96 } 82 2nd Ave 114 5th Ave Spring St 101 A 1 MILE Redwood City Limits Sphere of Influence Parks Schools Railroad Network Gap Closure, Connectivity and Safety Projects Figure 16 Network Gap Closure, Connectivity and Safety Projects 56 4

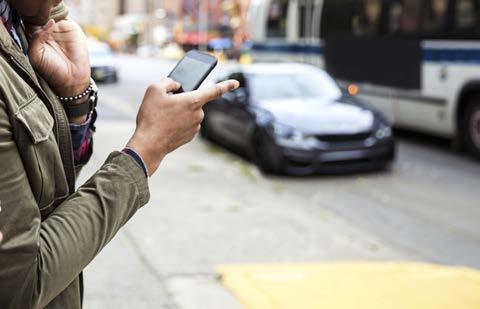
22 Category 6: Transportation Technologies and Innovations Technology is dramatically altering travel behavior and peoples relationship with streets. Increasingly, TNCs and ridematching services are using mobile technology to connect ordinary drivers with passengers needing a ride, while carsharing companies provide easy, short-term access to a private car. These innovations offer a convenient and cost-effective alternative to buying and owning a car. In the future, AV technology may remove the need for human drivers. AVs will need to be properly managed and accommodated as they are released and become more widely used on public streets. Proactively working to develop strategies for all new types of innovations will help maximize the benefits of these new technologies for the City. Chapter Four: Reaching Our Destination 57
")


23 Electric Vehicle (EV) Strategy Goods Delivery Strategy Automated Vehicle (AV) Strategy Curbspace Management Strategy 58 4
24 Transportation Technologies and Innovations Strategies Projects and programs related to transportation technologies and innovations include: Electric Vehicle (EV) Strategy: Electric vehicle (EV) is a term used to describe any car that runs on battery power that is rechargeable from the electricity grid. Developing strategies that support, educate, and encourage more EV usage in the City will help reduce the environmental impacts of vehicle travel. Automated Vehicle (AV) Strategy: A citywide AV strategy proactively manages the new technology before it becomes available on public streets. This includes, but is not limited to, developing an AV policy, designating routes or areas where AVs can or cannot operate, adopting rules to govern parking and pick-up/drop-off areas, and managing curb space. AVs, while emerging quickly, are still relatively new to the transportation field, making it difficult to determine how and where the technology will be used. Goods Delivery Strategy: Goods delivery typically refers to the process of delivering goods to predefined locations. A goods delivery strategy will regulate automated delivery services, such as robotic deliveries, and typical goods delivery systems through a proactive designation of loading/unloading zones and enforcement. A comprehensive goods delivery strategy will not only address current delivery systems but also emerging technologies like automated delivery drones, which are unmanned aerial vehicles (UAVs) that can deliver lightweight packages to local destinations. Curbspace Management Strategy: Locations for designated pick-up and drop-off curb space for private shuttle services, such as employer shuttles, and shared ride services, like Lyft, could be determined by current demand and expected future need. Curb space located adjacent to popular designations, like downtown and Redwood City Station, could also be effectively managed through strategies in flexible or scheduled use. Chapter Four: Reaching Our Destination 59

25 Category 7: Transportation Demand Management (TDM) In Redwood City, 73 percent of residents commute by driving alone. Drivealone rates add to severe delays and traffic congestion, among other problems. A variety of programs and strategies, which are collectively referred to as Transportation Demand Management (TDM), influence longterm travel behavior and can reduce the percentage of commuters who drive alone. This is accomplished by providing attractive alternatives to driving alone, raising awareness of these alternatives, and by providing incentives to use them. Per the Bay Area Air Quality Management District, all employers with 50 or more employees are required to offer commuter benefits and participate in the Bay Area Commuter Benefits Program. Building off of this, the City is developing a TDM Plan to reduce the number of residents and employees who drive alone to work. The TDM Plan will also include a framework for establishing a Transportation Management Association (TMA), which is a member-controlled, non-profit organization that provides transportation services within a specific area. The proposed TDM Plan is attached in Appendix E. 60 4

26 Shuttle Service Rideshare/Carshare Bikeshare Carpool/Vanpool Guaranteed Ride Home Bicycle Facilities Last-Mile Connection to Transit Reduced Parking Paid Parking Chapter Four: Reaching Our Destination 61
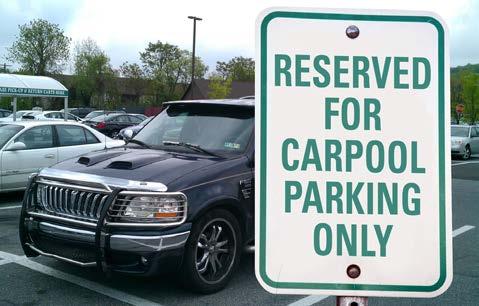
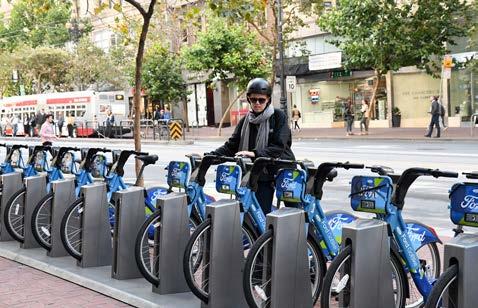
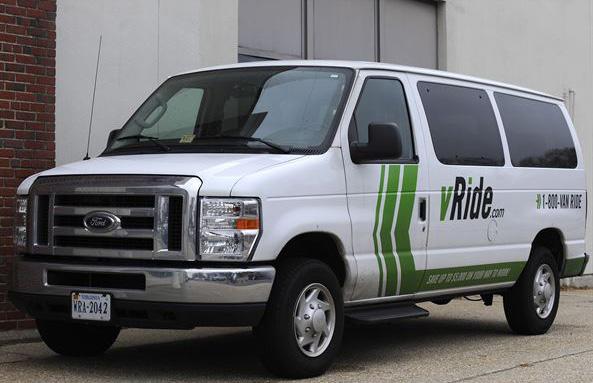
27 TDM Measures TDM programs and strategies to reduce dependence on single-occupancy vehicles include: Guaranteed Ride Home: People who choose to use transit, carpools, or vanpools are guaranteed a ride home by their employer in case of emergency or if they need to work late, which helps to reduce concerns about not having a car at work. Shuttle Service: Operation of a shuttle service to nearby rail and transit stations and possibly to midday destinations makes it easier for people to use transit to get to work. Rideshare/Carshare: People who bike or walk or use transit, carpools, or vanpools can hail a rideshare vehicle or utilize a carshare vehicle located nearby, which helps to reduce concerns and inconveniences of not having a vehicle. Bikeshare: Bikeshare is a program that allows users to pick up bicycles at one location and return it to another location within the service area. A bikeshare program provides people with bicycles and potentially bicycle helmets that can help eliminate trips made by car during the day. Carpool/Vanpool: Ride-matching programs help carpools and vanpools to form by matching drivers and passengers and providing preferential parking. These programs reduce congestion by increasing the number of people in vehicles. Bicycle Facilities (Infrastructure Improvements/Parking): Improving bicycle infrastructure by filling in gaps in the network, upgrading existing facilities, and creating a low-stress bicycle network, providing bike parking, or installing wayfinding signage helps support bicycle riders and encourages more people to travel by bicycle. Last-Mile Connection to Transit: Shuttles or rideshare services, like Lyft, can be used as a last-mile strategy to get a group of people from a major transit stop to the employer location or home, making it easier for people to use transit even if they don t live or work close to a transit station or stop. Flexible Work Hours: Employees set or modify their arrival and departure times, which can provide the flexibility people need to use alternative modes. Telecommuting: Telecommuting allows employees to work from home or other locations, including coffee shops, co-working spaces, and libraries, via telephone, , and on-line meetings. Telecommuting reduces trips made to an employer site. Reduced Parking: When combined with companion TDM measures, reduced parking discourages drive-alone commuting by limiting parking options. Paid Parking: Charging money for parking requires the user to consider the cost of driving, which includes parking, and will encourage people to use an alternative mode to driving alone. 62 4

28 Performance Measures and Prioritization Process Redwood City s transportation investments were prioritized through an assessment of relevant and preferred performance measures. Performance measures were developed based on the City s Strategic Plan, input from the City and community members, Fehr & Peers Active Transportation Performance Measures manual, and comparable cities transportation system performance measures. The prioritization process assigns each project a score (1 to 5) based on the project s ability to help achieve each performance measure. Projects with the highest scores are projects that will have the greatest impact in achieving the City s long-term mobility goals. Chapter Four: Reaching Our Destination 63
29 PERFORMANCE MEASURES AND PRIORITIZATION PROCESS Project Sources: General Plan Precise Plans Ongoing Transportation Planning Projects RWCmoves Existing Conditions RWCmoves Community Outreach 120+ Projects Project Costs: Low (up to $100k) Medium ($100k to $750k) High (more than $750k) Signature Projects Project Categories: Active Transportation Corridors Complete Street Corridors and Placemaking Transit Accessibility and Service Enhancements Roadway Congestion and Delay Improvements Network Gap Closure, Connectivity and Safety Transportation Technologies and Innovations Transportation Demand Management (TDM) Performance Measures and Performance Criteria: Increases safety for all travel modes Improves overall public health and minimizes environmental impacts Promotes attractive, well-designed streets through placemaking, public art, and improved landscaping Improves pedestrian facilities and street quality Improves bicycle facilities and street quality Improves access to transit and enhances multimodal connectivity Increases the share of people who walk, bike and take transit Increases person throughput and proactively manages traffic congestion Accommodates all users, including people with disabilities, low-income, and the young and elderly, with equal access to goods and services. Project applies current design standards and is feasible and constructible Project has a positive return on investment Qualitative score of 1-5 based on expected safety benefit Qualitative score of 1-5 based on expected health and environmental benefits, including reduced vehicle miles travelled (VMT) Qualitative score of 1-5 Score of 1-5 based on Active+ walking demand score Score of 1-5 based on Active+ bicycling demand score Score of 1-5 based on potential to improve transit ridership and improve network connectivity Score of 1-5 based on potential to increase non-auto mode split Score of 1-5 based on potential to increase person capacity and reduce person-delay Score of 1-5 based on project proximity MTC-designated Communities of Concern and Priority Development Areas Qualitative score of 1-5 based on expected project feasibility Qualitative score of 1-5 based on expected project benefits in relation to costs Total Evaluation Score 64 4
30 Projects are rated on the following 11 performance measures: Increases safety for all travel modes Improves overall public health and minimizes environmental impacts Promotes attractive, well-designed streets through placemaking, public art, and improved landscaping Improves pedestrian facilities and street quality Improves bicycle facilities and street quality Improves access to transit and enhances multimodal connectivity Increases the share of people who walk, bike and take transit Increases person throughput and proactively manages traffic congestion Accommodates all users, including people with disabilities, low-income, and the young and elderly, with equal access to goods and services. Project applies current design standards and is feasible and constructible Project has a positive return on investment The remainder of this section defines each performance measure that Redwood City will use to prioritize projects. In addition, the performance measures will also monitor the performance of the overall transportation system over time. The process for updating project rankings every 2-3 years is included in Chapter 5. Performance Measure 1: Increases Safety for All Travel Modes Projects are measured on their expected safety benefit for all travel modes. Safety ranks as a top priority for many in Redwood City and is an important factor in creating a sustainable transportation network. Vision Zero, adopted by many cities around the world, is an approach to street safety that aims to achieve a transportation system with no fatalities or serious injuries. Redwood City has not adopted an official Vision Zero policy, but will continue to evaluate safety for all modes by tracking collisions and the details surrounding them, including where they occurred, when they occurred, who was involved, and what precipitating actions led to the crash. The frequency of severe collisions or collisions involving vulnerable populations, such as children and seniors, will also be monitored. Redwood City will also consider the risk of future collisions in evaluating projects by assessing surrounding built environment and traffic conditions. Anticipated collision risk or severity reduction is often determined based on vehicle volumes and speed, as well as the frequency with which a pedestrian or bicyclist interacts with vehicles. Projects that improve safety for all travel modes will receive a higher score under this performance measure. Performance Measure 2: Improves Overall Public Health and Minimizes Environmental Impacts Projects are measured based on a project s potential to increase health and environmental benefits, and its potential to reduce vehicle miles traveled (VMT). Transportation projects and programs have the ability to influence public health outcomes through their effects on individual activity and the natural environment. Active transportation investments can promote Chapter Four: Reaching Our Destination 65
31 healthier lifestyles through increased access to physical activity and reduced exposure to pollutants. Redwood City can measure environmental impacts by tracking the average VMT by City residents. The California Governor s Office of Planning and Research (OPR) will soon require projects to assess a project s impact on the City s VMT. Projects that minimize the environmental impacts of transportation per capita will receive a higher score under this performance measure. Performance Measure 3: Promotes Attractive, Well-Designed Streets through Placemaking, Public Art, and Improved Landscaping Projects are measured based on a project s contribution to improved urban design and placemaking. Redwood City wants to create vibrant and welcoming public spaces for people to live, work, and play through transportation projects and programs. When located in public spaces, public art and events can serve as attractions that residents and visitors gather around. These relate to active transportation and the need for attractive and well-designed streets because many visitors arrive on foot or by bicycle and take part in the festivities by walking around. Projects that promote attractive and well-designed streets for people will receive a higher score under this measure. Performance Measure 4: Improves Pedestrian Facilities and Street Quality The quality of Redwood City s walking network is another measure by which the City assesses the transportation system performance. Projects that include pedestrian enhancements are measured based on the walking potential in a particular project location. Pedestrian projects are evaluated based on the Fehr & Peers Active+ walking demand score in the City (see Appendix B). The Active+ tool reports Redwood City s pedestrian demand using a geographic interface system (GIS) analysis. The pedestrian demand analysis considers existing activity levels (using Census Data), important attractors (transit, commercial corridors and districts, regional attractions, and major schools, employers and services), existing infrastructure support, and deficiencies (barriers and gaps, lack of facilities, collision rates). The Active+ tool assesses various geographic areas (i.e. street segments, intersections) in terms of their intrinsic potential to attract a specific level of walking activity. Using this approach, projects with higher walking potential in a particular project location will receive a higher score. Performance Measure 5: Improves Bicycle Facilities and Street Quality The quality of Redwood City s bicycle network is a measure by which the City assesses the transportation system performance. Projects that include bicycle enhancements are measured based on the biking potential in a particular project location. Pedestrian projects are evaluated based on the Fehr & Peers Active+ biking demand score in the City (see Appendix B). The Active+ tool reports Redwood City s bicycle demand using a GIS analysis. The bicycle demand analysis considers existing activity levels (using Census Data), important attractors (transit, commercial corridors and districts, regional attractions, and major schools, employers and services), existing infrastructure support, and deficiencies (barriers and gaps, lack of facilities, collision rates). The Active+ tool assesses various geographic areas (i.e. street segments, intersections) in terms of their intrinsic potential to attract a specific level of bicycling activity. Using this approach, projects with higher biking potential in a particular project location will receive a higher score. 66 4
32 Performance Measure 6: Improves Access to Transit and Enhances Multimodal Connectivity Evaluating pedestrian and bicycle access to transit and amenities near transit stations (first/last three-mile access) is a measure by which the City assess the transportation system performance. Identifying gaps in the multimodal transportation system helps prioritize those opportunities to improve connectivity throughout the City. The extent to which projects close gaps in the existing multimodal network, accommodate first/last three-mile access to transit, and provide links to existing trails or other facilities can also be tracked over time. Projects with the potential to increase transit ridership and improve multimodal network connectivity will receive a higher score under this measure. Performance Measure 7: Increases the Share of People Who Walk, Bike and Take Transit Mode split is an indicator of the presence and quality of bicycle, pedestrian, transit, and vehicular networks in Redwood City. Tracking travel behavior through overall volumes, ridership, and mode split in the City will be used to generate system-wide vehicle, bicycle, and pedestrian miles travelled over time. The City will incorporate mode split data into the evaluation process in order to identify multimodal projects and invest in opportunities to encourage non-auto travel modes. Under this approach, projects with the potential to increase non-auto mode splits will receive a higher score. Performance Measure 8: Increases Person Throughput and Proactively Manages Traffic Congestion Vehicular level-of-service (LOS) is often used to assess vehicular mobility. Travel times on key corridors indicates if the City is proactively managing traffic congestion. Redwood City can also work towards increasing person throughput by tracking pedestrian, bicyclist, transit and vehicular throughput and delay at key hotspots. Projects with the potential to increase person capacity and reduce person-delay will receive a higher score under this measure. Performance Measure 9: Accommodates All Users, Including People with Disabilities, Low-Income, and the Young and Elderly, with Equal Access to Goods and Services Access to transportation options is not equal across all populations. Data from MTC-designated Communities of Concern (CoC) and Priority Development Areas (PDA) are used as a metric for evaluating equity. Communities of Concern are identified by census tract according to eight disadvantage factors: minority and low-income residents, non-english language speaking and zero-car households, seniors age 75+, persons with a disability, single-parent households, and cost-burdened renters. Using this approach, scoring for equity would be based on a project s location within a CoC and/or a PDA (see Appendix B). Chapter Four: Reaching Our Destination 67
33 Performance Measure 10: Project Applies Current Design Standards and is Feasible and Constructible In keeping with the state of the practice, all improvements should apply design standards that are current at the time of the implementation. Furthermore, the feasibility and constructability of a project are important criteria to consider, because if the project or program is infeasible or difficult to construct, then it will be difficult to implement. Project feasibility can be related to right-of-way constraints, jurisdictional responsibilities, costs, and other considerations. Projects are scored based on the expected project feasibility and compliance with current standards. Generalized Project Costs Order of magnitude project costs are beneficial in identifying the largest scale transportation improvements and generating a high-level understanding on available funding need to complete the project. Estimated project costs are assigned to each project as low (up to $100,000), medium ($100,001 to $750,000) or high (more than $750,001), and Signature Projects, which are projects that include major changes to infrastructure. Figure 17 shows the proportion of projects by cost. The majority of projects and programs included as part of RWCmoves are estimated to cost below $750,000 to implement. Performance Measure 11: Project has a Positive Return on Investment Figure 17: Division of Project List by Order of Magnitude Cost Projects are evaluated on whether they will provide a positive return on investment. Project costs and benefits are qualitative estimates based on project descriptions. A future cost-benefit analysis would be required for each project to more-accurately determine expected return on investment. Under this measure, the expected project costs are weighted against project benefits. Projects with more benefits in relation to costs receive a higher score. Signature Projects 9% High: $751k+ 13% Low: Up to $100k 31% Medium: $ k 47% 68 4
34 First Cut of Tier 1 Projects and Programs Projects with the greatest impact in achieving the City s long-term mobility goals are categorized as Tier 1 Projects. Tier 1 Projects (as shown in Table 2) are organized into three categories: Top Scoring Projects, Early Investment Projects, and Neighborhood Priority Projects. These subcategories help to ensure projects considered to be Tier 1 received the highest evaluation scores, but also did not exclude projects that can be easily implemented and/or key projects dispersed and equally distributed throughout the City. Key attributes considered for each subcategory are described below. Top Scoring Projects Top Scoring Projects are the projects that received the highest evaluation scores of all RWCmoves projects. Top Scoring Projects are all projects scoring at least 48 out of 55 total points possible. RWCmoves includes four Top Scoring Projects. Early Investment Projects Early Investment Projects are those scoring at least 30 out of 55 total points, identified to be low in cost (below $100,000), applies current design standards and are feasible for construction. RWCmoves includes seven Early Investment Projects with scores ranging from 32 to 42. Neighborhood Priority Projects Neighborhood Priority Projects are key projects located outside of areas with a lot of activity, such as in a downtown area, that provide benefits to surrounding neighborhoods and the City as a whole. It is common for higher scoring projects to be located near more densely populated areas with better access to pedestrian, bike and transit facilities. To help ensure a more equitable distribution of the City s investments, Neighborhood Priority Projects were separately evaluated within each of the City s zip codes. Each zip code received two to three projects. RWCmoves includes eight Neighborhood Priority Projects with scores ranging from 36 to 41. Chapter Four: Reaching Our Destination 69
35 Table 2: RWCmoves First Cut of Tier 1 Projects and Programs Number Title Description Category Cost Range Tier 1: Top Scoring Projects Downtown Precise Plan Implementation: New Downtown Street Connections Establish plan lines for the following new street segments that would be constructed as redevelopment occurs: New lane parallel to and south of railroad tracks between Broadway and Jefferson Avenue. The El Camino Real Corridor Plan is currently developing a comprehensive plan that El Camino Real Corridor Plan consolidates the recently-rezoned areas along El Camino Real and incorporates Implementation - Short and Long community benefits, design guidelines, and streetscape improvements to address all Term Project users of the corridor. Implementation of short and long term transportation improvements would be covered under this project. 23 Bicycle Master Plan 54 Complete Streets Design Guidelines Tier 1: Early Investment Projects Fair Oaks Community School Safe Routes to School Middlefield Road (between Broadway and Winslow Street, also known as Theatre Way) Corridor Improvements 118 Crosswalk Program Develop stand alone Bicycle Master Plan for Redwood City. The Bicycle Master Plan would provide a more detailed analysis of existing conditions for bicyclists, and recommend projects and programs aimed specifically at increasing bicycle ridership in the City. Develop and regularly apply Redwood City's Complete Streets Design Guidelines. Guidelines would incorporate industry best practices, such as recommendations from the National Assocaition of City Transportation Officials (NACTO), and also be tailored to meet the City's local needs and desires. Support San Mateo County's efforts to implement recommended projects and programs at Fair Oaks Community School from the Redwood City Safe Routes to School Report (2013). Develop plans and construct Theatre Way as a permanent pedestrian street. Develop formal crosswalk program to manage and maintain crosswalks in the City, and identify policies for striping new crosswalks based on citizen requests, pedestrian demand and other City priorities. Network Gap Closure, Connectivity and Safety Complete Street Corridors and Placemaking Active Transportation Corridors Complete Street Corridors and Placemaking Network Gap Closure, Connectivity and Safety Complete Street Corridors and Placemaking Network Gap Closure, Connectivity and Safety Score (Max 55) Medium: $ k 50 Medium: $ k 49 Medium: $ k 48 Low: up to $100k 48 Low: up to $100k 42 Low: up to $100k 41 Low: up to $100k
36 Table 2: RWCmoves First Cut of Tier 1 Projects and Programs Number Title Description Category Cost Range 125 On-Street Bicycle Parking Downtown Expansion 119 Update ADA Transition Plan 69 Transit Access Improvements 79 Jefferson Avenue Operational Analysis Tier 1: Neighborhood Priority Projects 94 Holly Street Bicycle and Pedestrian Overcrossing 4 Brewster Avenue Cycle Track 5 James Street Cycle Track 38 Alameda de las Pulgas Complete Streets Project Expand on-street bicycle parking in retail areas, near important public facilities, and at various high bicycle demand locations in the Downtown area. Update the City's existing ADA Transition Plan to include all public rights of way and identify prioritization process for improving accessibility of curb ramps and sidewalks. Collect inventory, design, and construct accessibility improvements to transit stops throughout Redwood City to meet current ADA requirements. Evaluate traffic operations on Jefferson Avenue, between Veterans Boulevard and El Camino Real. Design improvements to reduce delays associated with special events, high pedestrian volumes at Broadway/Jefferson Avenue, and exiting the Jefferson Parking Garage while maintaining a high level of safety for people crossing the street. Support the City of San Carlos' project to construct a bicycle and pedestrian bridge over US 101 at, or near, Holly Street. Evaluate, design and install cycle track (Class IV) along Brewster Avenue from Main Street to Fulton. Design and install cycle track (Class IV) along James between Redwood City Station and proposed bicycle boulevard network at Elwood Street and Duane Street. Evaluate and design streetscape improvements to reduce vehicle speeds and to increase safety for people walking along and crossing the street. Transportation Demand Management (TDM) Network Gap Closure, Connectivity and Safety Transit Accessibility and Service Enhancements Roadway Congestion and Delay Improvements Network Gap Closure, Connectivity and Safety Active Transportation Corridors Active Transportation Corridors Complete Street Corridors and Placemaking Score (Max 55) Low: up to $100k 41 Low: up to $100k 40 Low: up to $100k 39 Low: up to $100k 32 High: $751k+ 43 Medium: $ k 41 High: $751k+ 41 Medium: $ k 41 Chapter Four: Reaching Our Destination 71
37 Table 2: RWCmoves First Cut of Tier 1 Projects and Programs Number Title Description Category Cost Range Hawes Community School Safe Routes to School Massachusetts Avenue Corridor Improvements Redwood Shores Parkway Corridor Improvements Design and construct "Medium" priority improvements from the Redwood City Safe Routes to School Report (2013). Improvements include installing high-visbility crosswalks and enhancing curb ramps to meet ADA requirements, upgrading bike parking, and installing roadway signage and striping. Evaluate, design, and install roadway modifications to reduce vehicle speeding and to increase safety for people crossing Massachusetts Avenue, between Woodside Road and Alameda de las Pulgas. Study potential to reduce Redwood Shores Parkway from 6 to 4 lanes, depending on volumes, to accommodate bicycle and pedestrian improvements, such as one-way separated bikeways. Consider PHB-enhanced staggered crossing at Electronic Arts office midblock desire line, in line with footpath (stagger so that pedestrians face traffic). Install marked crosswalks on 4th leg, crossing enhancements and pedestrian refuge islands at Redwood Shores Parkway/Shoreline Drive, Redwood Shores Parkway/Twin Dolphin Drive, and Redwood Shores Parkway/Electronic Arts Drive. Install Class I (potential Class IV) bike path along Redwood Shores Parkway between the Electronic Arts entrance path and Twin Dolphin Drive, and provide connection to nearby Bay Trail. Provide a Class I path and crosswalk enhancements along Twin Dolphin Drive. Consider protected intersections at Redwood Shores Parkway/Twin Dolphins Drive, Redwood Shores Parkway/Electronic Arts Drive, and Redwood Shores Parkway/ Shoreline Drive. Network Gap Closure, Connectivity and Safety Network Gap Closure, Connectivity and Safety Complete Street Corridors and Placemaking Score (Max 55) Medium: $ k 41 Low: up to $100k 41 High: $751k
38 Table 2: RWCmoves First Cut of Tier 1 Projects and Programs Number Title Description Category Cost Range 44 Bay Road and Florence Street Corridor Improvements Source: Fehr & Peers, 2017 Retime signal and install protected signal phasing (eastbound and westbound), and an additional westbound through-lane at Woodside Road/Bay Road. Study feasibility of a single lane roundabout at Bay Road/Charter Street, Bay Road/Fifth Avenue, and Bay Road/Douglas Avenue. Construct a traffic circle at Florence Street/17th Avenue. Install bulb-outs at all corners of Bay Road/Second Avenue. Install east leg high-visibility pedestrian crossing and RRFB at Bay Road/Eighth Avenue. Install Rectangular Rapid Flashing Beacon (RRFB) at east leg crosswalk at Bay Road/ Tenth Avenue. Consider proposed road closure at Bay Road/Spring Street. Stripe Class II bike lanes on eastbound Bay Road between Fourth Avenue and 15th Avenue, and on Florence Street between 15th Avenue and 17th Avenue. Install entry welcome signs at Bay Road/Second Avenue and Bay Road/Spring Street (specific location requires City s or County s process of approval). Complete Street Corridors and Placemaking Score (Max 55) Medium: $ k 36 Chapter Four: Reaching Our Destination 73

39 First Cut of Signature Projects and Programs Signature Projects include major changes to infrastructure, such as railroad grade separations, redesigned interchanges, or new transit services and stations. These projects represent some of the larger and more complex concepts identified during development of the Plan. RWCmoves includes 11 Signature Projects with scores ranging from 40 to 52, which are listed in Table 3 along with their project description, category, and cost rages. Several Signature Projects support construction for full railroad grade separations at various locations throughout the City. Due to the scale and complexity of these Signature Projects, a feasibility study would be required as a next step by the City to determine each project s practicality and evaluate potential design concepts. RWCmoves recommends two separate feasibility studies be conducted to evaluate options for full railroad grade separation in the City. The division of scope for these feasibility studies was determined based on a project s location and proximity to adjacent at-grade rail crossings. One feasibility study would review the Whipple Avenue, Brewster Avenue and Marshall Street-Broadway Railroad Grade Separation project locations, while the other would evaluate the Main Street, Chestnut Street and Maple Street Railroad Grade Separation project locations. These railroad grade separation feasibility studies are noted in Table 3 as the next step towards implementing full grade separations in Redwood City. 74 4
Moving Ahead. (Community Engagement) Chapter Three
 Chapter Three") 3 Community Chapter Three Moving Ahead (Community Engagement) engagement provided an exciting opportunity to engage Redwood City residents, workers, and business owners people who walk, bike, take transit,
3 Community Chapter Three Moving Ahead (Community Engagement) engagement provided an exciting opportunity to engage Redwood City residents, workers, and business owners people who walk, bike, take transit,
Broad Street Bicycle Boulevard Design Guidelines
 Broad Street Bicycle Boulevard Design Guidelines Building from the strategies introduced in the 2013 Bicycle Transportation Plan and community input received thus far, City Transportation Staff have identified
Proposed. City of Grand Junction Complete Streets Policy. Exhibit 10
 Proposed City of Grand Junction Complete Streets Policy Exhibit 10 1 City of Grand Junction Complete Streets Policy Vision: The Complete Streets Vision is to develop a safe, efficient, and reliable travel
Active Transportation Facility Glossary
 Active Transportation Facility Glossary This document defines different active transportation facilities and suggests appropriate corridor types. Click on a facility type to jump to its definition. Bike
Bicycle Master Plan Goals, Strategies, and Policies
 Bicycle Master Plan Goals, Strategies, and Policies Mobilizing 5 This chapter outlines the overarching goals, action statements, and action items Long Beach will take in order to achieve its vision of
Agenda. Overview PRINCE GEORGE S PLAZA METRO AREA PEDESTRIAN PLAN
 PRINCE GEORGE S PLAZA METRO AREA PEDESTRIAN PLAN May 28, 2008 Agenda Welcome and introductions Project overview and issue identification Planning context and strengths Design challenges and initial recommendations
Appendix A: Crosswalk Policy
 Appendix A: Crosswalk Policy Appendix A: Crosswalk Policy Introduction This citywide Crosswalk Policy is aimed at improving pedestrian safety and enhancing pedestrian mobility by providing a framework
APPENDIX A: Complete Streets Checklist DRAFT NOVEMBER 2016
 APPENDIX A: Complete Streets Checklist DRAFT NOVEMBER 2016 Complete Streets Checklist MetroPlan Orlando s Complete Streets Checklist is an internal planning tool for staff to further implementation of
Solana Beach Comprehensive Active Transportation Strategy (CATS)
") Solana Beach Comprehensive Active Transportation Strategy (CATS) 3.0 Goals & Policies The Solana Beach CATS goals and objectives outlined below were largely drawn from the Solana Beach Circulation Element
Solana Beach Comprehensive Active Transportation Strategy (CATS) 3.0 Goals & Policies The Solana Beach CATS goals and objectives outlined below were largely drawn from the Solana Beach Circulation Element
Caltrans Sloat Boulevard Pedestrian Safety Project Response to Community Questions, Comments & Concerns
 Caltrans Sloat Boulevard Pedestrian Safety Project Response to Community Questions, Comments & Concerns Revised: May 10, 2016 The California Department of Transportation (Caltrans) is planning various
ACTIVE TRANSPORTATION
 ACTIVE TRANSPORTATION Mobility 2040 Supported Goals Improve the availability of transportation options for people and goods. Support travel efficiency measures and system enhancements targeted at congestion
Chapter 5 Future Transportation
 Chapter 5 Future Transportation The Future Land Use Plan identifies the desired land use designations. The land uses desired for Crozet depend, in large part, on the success of the transportation system,
REGIONAL BICYCLE AND PEDESTRIAN DESIGN GUIDELINES
 REGIONAL BICYCLE AND PEDESTRIAN DESIGN GUIDELINES November 16, 2011 Deb Humphreys North Central Texas Council of Governments Bicycle and Pedestrian Advisory Committee Snapshot of the Guide 1. Introduction
Beyond First First Last Last Mile Strategies. APA National Conference April 3, 2016 Chelsea Richer, AICP Fehr & Peers
 Beyond First First Last Last Mile Strategies APA National Conference April 3, 2016 Chelsea Richer, AICP Fehr & Peers 1 Beyond First Last Mile Strategies APA National Conference Jeremy Klop, AICP, Fehr
PEDESTRIAN ACTION PLAN
 ATTACHMENT 2 CITY OF SANTA MONICA PEDESTRIAN ACTION PLAN CITY OF SANTA MONICA PEDESTRIAN ACTION PLAN This page intentionally left blank EXECUTIVE SUMMARY CHAPTER 1 EXECUTIVE SUMMARY Setting the Stage
CURBSIDE ACTIVITY DESIGN
 5 CURBSIDE ACTIVITY DESIGN This chapter provides design guidance for separated bike lanes adjacent to curbside activities including parking, loading and bus stops. Typical configurations are presented
How To Encourage More Efficient Transportation in Brazilian Cities
 How To Encourage More Efficient Transportation in Brazilian Cities Todd Litman Victoria Transport Policy Institute Presented Seminar on Discouraging The Use Of Cars São Paulo, Brazil 3 September 2013 Creating
Tonight is for you. Learn everything you can. Share all your ideas.
 Strathcona Neighbourhood Renewal Draft Concept Design Tonight is for you. Learn everything you can. Share all your ideas. What is Neighbourhood Renewal? Creating a design with you for your neighbourhood.
Chapter 2. Bellingham Bicycle Master Plan Chapter 2: Policies and Actions
 Chapter 2 Bellingham Bicycle Master Plan Chapter 2: Policies and Actions Chapter 2: Policies and Actions The Bicycle Master Plan provides a road map for making bicycling in Bellingham a viable transportation
Living Streets Policy
 Living Streets Policy Introduction Living streets balance the needs of motorists, bicyclists, pedestrians and transit riders in ways that promote safety and convenience, enhance community identity, create
PRINCE GEORGE S PLAZA METRO AREA PEDESTRIAN PLAN
 PRINCE GEORGE S PLAZA METRO AREA PEDESTRIAN PLAN May 28, 2008 Agenda Welcome and introductions Project overview and issue identification Planning context and strengths Design challenges and initial recommendations
A comprehensive assessment of transportation within Redwood City.
 A comprehensive assessment of transportation within Redwood City. Draft Plan - October 2017 ACKNOWLEDGEMENTS Forthcoming with: CDM Smith Bottomley Design & Planning Silvani Transportation Consulting Table
Bicycle Boulevards and Neighborhood Greenways
 Bicycle Boulevards and Neighborhood Greenways Traffic Safety is Improving for Everyone 90 80 70 60 50 40 30 20 10 0 PORTLAND: TOTAL TRAFFIC FATALITIES 1986-2008 1986 1987 1988 1989 1990 1991 1992 1993
EXECUTIVE SUMMARY. Vision
 Vision Walking and bicycling in Salt Lake City will be safe, convenient, comfortable, and viable transportation options that connect people to places, foster recreational and economic development opportunities,
Bicycle Facilities Planning
 Bicycle Facilities Planning Overview Types of Cyclists Purpose for Riding Types of Facilities Bike Lanes Bicycle Boulevards Cycle Tracks Intersections Signals Signing and Marking Discussion Types of Bicyclists
Watertown Complete Streets Prioritization Plan. Public Meeting #1 December 14, 2017
 Watertown Complete Streets Prioritization Plan Public Meeting #1 December 14, 2017 Goals for Public Meeting Overview of MassDOT Complete Streets Funding Program Educate the community on Complete Streets
City of Novi Non-Motorized Master Plan 2011 Executive Summary
 City of Novi Non-Motorized Master Plan 2011 Executive Summary Prepared by: February 28, 2011 Why Plan? Encouraging healthy, active lifestyles through pathway and sidewalk connectivity has been a focus
Bridgewater Complete Streets Prioritization Plan and Pedestrian Safety Assessment
 Bridgewater Complete Streets Prioritization Plan and Pedestrian Safety Assessment Presented by Luciano Rabito Manager of Complete Streets Presented to Bridgewater, MA Wednesday, April 26, 2017 6:30 P.M.
Data Analysis February to March Identified safety needs from reported collisions and existing travel patterns.
 Welcome! Thank you for participating in today s Valencia Bikeway Improvements workshop. Data Analysis February to March Identified safety needs from reported collisions and existing travel patterns. Initial
Berkeley Strategic Transportation Plan A-76
 Berkeley Strategic Transportation Plan A-76 Appendices 1. A Team Effort 2. Where We ve Been A-11 Berkeley Strategic Transportation Plan Alameda County Transportation Plan Alameda County will be served
Short-Term Enhancements Improvements to keep Austin moving. MetroRapid
 Short-Term Enhancements Improvements to keep Austin moving Long-Term Investments Projects to support our future Mobility Hubs MetroRapid MetroRail MetroExpress Commuters Connectors Circulators Project
Bicycle and Pedestrian Advisory Committee (BPAC) November 21, 2013
 November 21, 2013") Bicycle and Pedestrian Advisory Committee (BPAC) November 21, 2013 OVERALL LAND USE CONCEPT Overall Broadway Valdez District: 95.5 acres (35.1 acres right-of ways + 60.4 acres developable land) Plan Subareas:
Bicycle and Pedestrian Advisory Committee (BPAC) November 21, 2013 OVERALL LAND USE CONCEPT Overall Broadway Valdez District: 95.5 acres (35.1 acres right-of ways + 60.4 acres developable land) Plan Subareas:
Transportation Planning Division
 Transportation Planning Division Presentation Outline Study Tasks Recap of Previous Meetings Data Collected Focus Areas within Study Limits Design Principles Tool Box Recommended Concepts Schedule Moving
Oakland Pedestrian Master Plan Oakland Pedestrian Plan Draft Recommendations Chapter Outline
 EISEN LETUNIC T R A N S P O R T A T I O N, ENVIRO N M E N TA L A N D URBAN PLANNIN G MEMORANDUM To Oakland Pedestrian Plan Technical Advisory Committee & Pedestrian Advisory Group From Victoria Eisen Date
Purpose and Need. Chapter Introduction. 2.2 Project Purpose and Need Project Purpose Project Need
 Chapter 2 Purpose and Need 2.1 Introduction The El Camino Real Bus Rapid Transit (BRT) Project (Project) would make transit and other transportation improvements along a 17.6-mile segment of the El Camino
MOBILITY WORKSHOP. Joint City Council and Transportation Commission May 5, 2014
 MOBILITY WORKSHOP Joint City Council and Transportation Commission May 5, 2014 Review of General Plan M-1 Develop world-class transit system M-3 Maintain/enhance pedestrian-oriented City M-4 Create comprehensive
Transportation, Parking & Roads
 Transportation, Parking & Roads Design Carolina North as a walkable community Design the transportation system and development patterns (i.e., urban design elements such as density, building design, mix
Item to be Addressed Checklist Consideration YES NO N/A Required Description Complete Streets Guidelines
 Passaic County Complete Streets Checklist - Concept Development Project Name Item to be Addressed Checklist Consideration YES NO N/A Required Description Complete Streets Guidelines Existing Plans Have
CITY OF COCOA BEACH 2025 COMPREHENSIVE PLAN. Section VIII Mobility Element Goals, Objectives, and Policies
 CITY OF COCOA BEACH 2025 COMPREHENSIVE PLAN Section VIII Mobility Element Goals, Objectives, and Policies Adopted August 6, 2015 by Ordinance No. 1591 VIII MOBILITY ELEMENT Table of Contents Page Number
MCTC 2018 RTP SCS and Madera County RIFP Multi-Modal Project Eval Criteria GV13.xlsx
 MCTC 8 RTP SCS and Madera County RIFP Multi-Modal Project Eval Criteria GV.xlsx Madera County Transportation Commission Regional Transportation Plan / Sustainable Communities Strategy Multi-Modal Project
Pedestrian Project List and Prioritization
 To: Kyle Wagenschutz, City of Memphis CC: From: Anne Conlon and John Cock, Alta Planning + Design Date: December, 2014 Re: Project List Development (Task 3.1-3.2) and Project List Prioritization (Task
Bikeway action plan. Bicycle Friendly Community Workshop March 5, 2007 Rochester, MN
 Bikeway action plan Summary The was held on March 5, 2007 at the Rochester Mayo Civic Center. The workshop was hosted by Rochester-Olmsted County Planning Department in collaboration with the League of
Transportation 6. A. Transit Center Circulation and Access. 1. Transit Center Circulation
 Transportation 6 This chapter describes the transportation system in and around the Hillsdale Station Area, with a focus on the Transit Center at the relocated Hillsdale Caltrain Station. The transportation
Omaha s Complete Streets Policy
 Omaha s Complete Streets Policy (Adopted August 2015) VISION To create great places and enhance our quality of life, the City of Omaha will provide safe, accessible streets for all users. Complete Streets
CONNECTING PEOPLE TO PLACES
 CONNECTING PEOPLE TO PLACES 82 EAST BENCH MASTER PLAN 07 Introduction The East Bench transportation system is a collection of slow moving, treelined residential streets and major arteries that are the
Chapter 2: Standards for Access, Non-Motorized, and Transit
 Standards for Access, Non-Motorized, and Transit Chapter 2: Standards for Access, Non-Motorized, and Transit The Washtenaw County Access Management Plan was developed based on the analysis of existing
4 MOBILITY PLAN. Mobility Plan Objectives. Mobility Context. 1. Integrate with Local and Regional Transit Improvements
 Harbor Mixed Use CHAPTER Transit Corridor 4: Mobility Plan 4 MOBILITY PLAN Mobility Plan Objectives The Harbor Corridor Plan seeks to expand and improve the ways that people move along and through the
What Is a Complete Street?
 Session 5 Charleen Zimmer, AICP, Zan Associates May 5-7, 2010 What Is a Complete Street? May 2010 5-1 Not a Complete Street More of a Complete Street May 2010 5-2 Benefits of Complete Streets Safety for
Data Analysis February to March Identified safety needs from reported collisions and existing travel patterns.
 Welcome! Thank you for participating in today s Valencia Bikeway Improvements workshop. Data Analysis February to March Identified safety needs from reported collisions and existing travel patterns. Initial
NJDOT Complete Streets Checklist
 Background The New Jersey Department of Transportation s Complete Streets Policy promotes a comprehensive, integrated, connected multi-modal network by providing connections to bicycling and walking trip
CHAPTER 7.0 IMPLEMENTATION
 CHAPTER 7.0 IMPLEMENTATION Achieving the vision of the Better Streets Plan will rely on the ability to effectively fund, build and maintain improvements, and to sustain improvements over time. CHAPTER
5. RUNNINGWAY GUIDELINES
 5. RUNNINGWAY GUIDELINES These guidelines should be considered collectively when making runningway decisions. A runningway is the linear component of the transit system that forms the right-of-way reserved
Providence Downtown Transit Connector STAKEHOLDER MEETING #2. Stakeholder Meeting #1 October 24, 2016
 Providence Downtown Transit Connector STAKEHOLDER MEETING #2 Stakeholder Meeting #1 October 24, 2016 February 2017 1 AGENDA 1 DTC Goals and Expectations 2 Street Design Concepts 3 Potential Benefits and
TRANSPORTATION & MOBILITY
 TRANSPORTATION & MOBILITY ROADWAY SYSTEM There are approximately 40 miles of roadways in Manitou Springs. For planning purposes, roadways are typically assigned a functional classification which defines
El Camino Real Specific Plan. TAC/CAC Meeting #2 Aug 1, 2018
 El Camino Real Specific Plan TAC/CAC Meeting #2 Aug 1, 2018 Land Use Alternatives Goals and Tradeoffs Parks & open space Housing Retail & services Civic spaces Parking Community gathering spaces 3 Alternatives
Mission-Geneva Transportation Study Community Workshop 2 July 8, 2006
 Community Workshop 2 July 8, 2006 Small Group Workbook 1 Basic Improvements on Mission Street Streetscape. Pedestrian-scale lighting; landscaping; community art on utility boxes; more (possibly unique)
CITY OF BLOOMINGTON COMPLETE STREETS POLICY
 CITY OF BLOOMINGTON COMPLETE STREETS POLICY POLICY OBJECTIVE: The City of Bloomington will enhance safety, mobility, accessibility and convenience for transportation network users of all ages and abilities,
City of Vallejo Traffic Calming Toolbox
 City of Vallejo Traffic Calming Toolbox June 1, 2013 Final Table of Contents Introduction... 1 Non-Physical Devices... 3 High-Visibility Crosswalk... 3 In Pavement Lighted Crosswalk... 4 Rapid Flashing
1.0 EXECUTIVE SUMMARY
 1.0 EXECUTIVE SUMMARY The Active Transportation Plan is a guide to accomplish the Town s vision for developing a network of sidewalks, on-road bicycle facilities, and trails that allow for safe and convenient
MEMORANDUM. Date: 9/13/2016. Citywide Crosswalk Policy
 MEMORANDUM Date: 9/13/2016 Re: Citywide Crosswalk Policy Foreword Through the s Circulation Element and Complete Streets Policy, it is the City s goal to promote walking trips and provide safe facilities
2. Vision & Goals. Vision. Santa Rosa is a community where walking and bicycling are comfortable and convenient for people of all ages and abilities.
 2. Vision & Goals Overview The goals of the Santa Rosa Bicycle and Pedestrian Master Plan Update reflect the priorities expressed by the community throughout the public outreach phase of this Plan Update.
Board-Approved Funding Awards for Cycle 4 Active Transportation Grant Program Projects (in Order of Project Rankings) Approved on
 Approved on") CAPITAL Large Category Projects Board-Approved Funding Awards for Cycle 4 Active Transportation Grant Program Projects (in Order of Project Rankings) Approved on 07-27-18 1 La Mesa University Ave Pedestrian
CAPITAL Large Category Projects Board-Approved Funding Awards for Cycle 4 Active Transportation Grant Program Projects (in Order of Project Rankings) Approved on 07-27-18 1 La Mesa University Ave Pedestrian
Transportation Master Plan Advisory Task Force
 Transportation Master Plan Advisory Task Force Network Alternatives & Phasing Strategy February 2016 BACKGROUND Table of Contents BACKGROUND Purpose & Introduction 2 Linking the TMP to Key Council Approved
Corpus Christi Metropolitan Transportation Plan Fiscal Year Introduction:
 Introduction: The Safe, Accountable, Flexible, Efficient Transportation Equity Act: A Legacy for Users (SAFETEA-LU) has continued the efforts started through the Intermodal Surface Transportation Efficiency
Guidance. ATTACHMENT F: Draft Additional Pages for Bicycle Facility Design Toolkit Separated Bike Lanes: Two-Way to One-Way Transitions
 ATTACHMENT F: Draft Additional Pages for Bicycle Facility Design Toolkit Separated Bike Lanes: Two-Way to One-Way Transitions This treatment provides a transition from two-way separated bike lanes to one-way
Draft North Industrial Area-Wide Traffic Plan
 Summary of North Industrial and Hudson Bay Industrial Recommended Improvements Table 1. Summary of s Item Location 1 2 3 4 5 6 7 8 9 10 11 12 Millar Ave north of 51st St Super 8 Motel back lane 400 Block
A CHANGING CITY. of Edmonton, it is essential that it reflects the long-term vision of the City.
 A CHANGING CITY By the year 2040, Edmonton will be home to more than 1 million people. To accommodate growth and support a healthy and compact city, we need a new approach to development/redevelopment
DRAFT MOVING FORWARD RHODE ISLAND BICYCLE MOBILITY PLAN 2018 PREPARED FOR PREPARED BY IN ASSOCIATION WITH
 RHODE ISLAND MOVING FORWARD BICYCLE MOBILITY PLAN 2018 PREPARED FOR PREPARED BY IN ASSOCIATION WITH T AF CHAPTER 1 D R INTRODUCTION CHAPTER 3 ARTICULATES VISION Bicycling is safe, fun and practical in
El Centro Mobility Hub
 The El Centro drive shed comprises a major portion of the El Centro downtown area, which is well served by bus routes. The proposals intend to promote use of public transit through improvements and enhancements
Roadways. Roadways III.
 Introduction 97 Roadway Design Principles 98 Safe Speeds 99 Optimizing of Street Space 00 Minimum Lane Widths in the City of Boston 02 Design Features that Reduce Operating Speeds 05 Travel Lanes Transit
Southside Pilot Proposal
 To improve bicycle access and mobility to UC Berkeley, Downtown Berkeley, and the Southside area, a pilot project could include a two-way parking-protected cycle track. Turn pockets and island bus stops
Roads and Vehicular Traffic Design Principles. Roads and Vehicular Traffic Recommendations
 CIRCULATION AND PARKING roads and vehicular traffic The Campus Master Plan updates the campus transportation network through a multi-modal approach that encourages walking and biking while improving vehicular
City of Charlottesville Bicycle and Pedestrian Master Plan Update
 City of Charlottesville Bicycle and Pedestrian Master Plan Update September 17, 2014 I. Welcome and meeting overview II. Project status update III. Network overview IV. Break-out groups Pedestrian Network
Outreach Approach RENEW SF served as the primary liaison with the North Beach community; the Chinatown. Executive Summary
 Executive Summary Executive Summary The Columbus Avenue Neighborhood Transportation Study s objective is to identify changes to transportation infrastructure and policies that could enhance the livability
SAN FRANCISCO MUNICIPAL TRANSPORTATION AGENCY
 THIS PRINT COVERS CALENDAR ITEM NO. : 10.2 DIVISION: Sustainable Streets BRIEF DESCRIPTION: SAN FRANCISCO MUNICIPAL TRANSPORTATION AGENCY Adopting Conceptual Proposal for Streetscape Improvements to Broadway,
Alternative Traffic Calming Methods
 Alternative Traffic Calming Methods In-street Pedestrian Crossing Sign Cost: approximately $300 per sign not including the installation cost Advantages of in-street pedestrian crossing signs 1. Typically
Perryville TOD and Greenway Plan
 Perryville TOD and Greenway Plan Greenway Glossary Pathway: A bicycle and pedestrian path separated from motorized vehicular traffic by an open space, barrier or curb. Multi-use paths may be within the
Welcome. Background. Goals. Vision
 Welcome The formal Public Information Centre (PIC) for the Transportation Master Plan How We GO will be held in early 2017. At that time we will present the recommended transportation system for Niagara
o n - m o t o r i z e d transportation is an overlooked element that can greatly enhance the overall quality of life for the community s residents.
 N o n - m o t o r i z e d transportation is an overlooked element that can greatly enhance the overall quality of life for the community s residents. 84 Transportation CHAPTER 11 INTRODUCTION Transportation
NM-POLICY 1: Improve service levels, participation, and options for non-motorized transportation modes throughout the County.
 Transportation PRINCE WILLIAM COUNTY 2008 COMPREHENSIVE PLAN NON-MOTORIZED PLAN CONTENTS Goals, Policies, and Action Strategies Table 4 (Bike Facility Classifications and Descriptions) Table 5 (Bike Facility
City of Albert Lea Policy and Procedure Manual 4.10 ALBERT LEA CROSSWALK POLICY
 4.10 ALBERT LEA CROSSWALK POLICY PURPOSE: Pedestrian crosswalks are an integral part of our transportation infrastructure. To be effective and promote safety, marked crosswalks must be installed after
North Coast Corridor:
 North Coast Corridor: Connecting People, Transportation & Environment Legislative Hearing: 11.8.10 1 North Coast Corridor Region s Lifeline A Regional Strategy Mobility, Economy & Environment North Coast
CHAPTER 3: Vision Statement and Goals
 Davidson Walks & Rolls: Active Transportation Master Plan CHAPTER 3 Contents: Overview Vision Statement Measurable Goals Public Outreach CHAPTER 3: Vision Statement and Goals Overview The vision statement
Chapter 14 PARLIER RELATIONSHIP TO CITY PLANS AND POLICIES. Recommendations to Improve Pedestrian Safety in the City of Parlier (2014)
") Chapter 14 PARLIER This chapter describes the current status and future plans for biking and walking in the City of Parlier. RELATIONSHIP TO CITY PLANS AND POLICIES The Parlier General Plan is the primary
Chapter 14 PARLIER This chapter describes the current status and future plans for biking and walking in the City of Parlier. RELATIONSHIP TO CITY PLANS AND POLICIES The Parlier General Plan is the primary
Designing for Pedestrian Safety
 Designing for Pedestrian Safety Treatments at Unsignalized Pedestrian Crossings Presented by: Charlie Zegeer PBIC Director August 17, 2010 Crossing Crashes Part 1: General Principles 3 2 Why do people
Transportation Assessment
 Transportation Assessment Midtown Open House February 10, 2018 Overview Midtown in Focus Overview & Purpose of Today Transportation Assessment overview Summary of Transportation work to date Review & Analysis
5. Pedestrian System. Accomplishments Over the Past Five Years
 5. Pedestrian System Accomplishments Over the Past Five Years The Alamo Area Metropolitan Planning Organization (MPO) and its partner agencies recognize the importance of improving pedestrian mobility.
TRANSPORTATION TRAINING TOPICS. April 6, 2010
 TRANSPORTATION TRAINING TOPICS April 6, 2010 Roles of Transportation Providers Context and Policy Makers Division of Transportation and Traffic Other City Operations Other Transportation Operators CMA
Appendix C. TRAFFIC CALMING PROGRAM TOOLBOX
 Appendix C. TRAFFIC CALMING PROGRAM TOOLBOX PHASE I...2 Do Not Enter Sign...3 One-Way Sign...4 Turn Prohibition...5 Pavement Markings...6 Speed Monitoring Trailer...7 Neighborhood Speed Watch...8 Police
T1-A - Service Reduction (Re-sizing)
") Key T1-A Choice A Key T1-B Choice B Key T1-C Choice C Key T1-D Choice D Key T1-E Choice E Key T1-F Choice F Key Choice G T2 T1-A - Service Reduction (Re-sizing) Description This key choice would represent
Key T1-A Choice A Key T1-B Choice B Key T1-C Choice C Key T1-D Choice D Key T1-E Choice E Key T1-F Choice F Key Choice G T2 T1-A - Service Reduction (Re-sizing) Description This key choice would represent
Community Task Force July 25, 2017
 Community Task Force July 25, 2017 Welcome and Introductions Project Partners Regional Transportation District (RTD) Colorado Department of Transportation (CDOT) Denver Regional Council of Governments
Complete Streets. Designing Streets for Everyone. Sarnia
 Complete Streets Designing Streets for Everyone Sarnia Complete Streets ~ Sarnia ~ 2018 Introduction Our City is made up of a network of streets that we use to go for a walk, cycle to work, drive to the
Public Information Centre
 WELCOME Public Information Centre Father Tobin Road Lougheed Middle School - Library Wednesday November 7, 2012 7:00 p.m.to 9:00 p.m. Please sign in Neighbourhood Traffic Calming Guide Background The City
WELCOME. City of Greater Sudbury. Transportation Demand Management Plan
 WELCOME City of Greater Sudbury Transportation Demand Management Plan Public Consultation Session St. Andrew s Place, Activity Hall 111 Larch Street Wednesday September 13, 2017 6:00 to 8:00 pm Welcome
Executive Summary Route 30 Corridor Master Plan
 Route Corridor Master Plan Project Overview The Route Corridor Master Plan is a coordinated multimodal transportation and land use plan for the entire stretch of Route through East Whiteland Township,
RESOLUTION NO ?? A RESOLUTION OF THE CITY OF NEPTUNE BEACH ADOPTING A COMPLETE STREETS POLICY
 RESOLUTION NO. 2018-?? A RESOLUTION OF THE CITY OF NEPTUNE BEACH ADOPTING A COMPLETE STREETS POLICY WHEREAS, safe, convenient, and accessible transportation for all users is a priority of the City of Neptune
A Matter of Fairness: ROCOG s Environmental Justice Protocol. What is Mobility Limitation?
 No Person Left Behind What is Mobility Limitation? What is the Access Limitation? Environmental Justice population should be provided adequate mobility & access to meet their needs; Identify acceptable
TELEGRAPH AVENUE COMPLETE STREETS PLAN DRAFT FINAL PLAN
 TELEGRAPH AVENUE COMPLETE STREETS PLAN DRAFT FINAL PLAN SEPTEMBER 2014 TABLE OF CONTENTS Executive Summary...1 Project Purpose and Need...5 Analysis of Street Design Options...11 Recommended Project...17
Welcome! San Jose Avenue Open House August 25, 2015
 Welcome! San Jose Avenue Open House August 25, 2015 Vision Zero The City and County of San Francisco adopted Vision Zero San Francisco Vision Zero High Injury Network as a policy in 2014, committing an
PEDALING FORWARD. A Glance at the SFMTA s Bike Program for SFMTA.COM
 PEDALING FORWARD A Glance at the SFMTA s Bike Program for 2017-2021 SFMTA.COM INTRODUCTION About This Booklet More people from all walks of life see their bicycle as a more convenient way to get where