A comprehensive assessment of transportation within Redwood City.
|
|
|
- Lesley Haynes
- 5 years ago
- Views:
Transcription


1 A comprehensive assessment of transportation within Redwood City. Draft Plan - October 2017
2
3 ACKNOWLEDGEMENTS Forthcoming with: CDM Smith Bottomley Design & Planning Silvani Transportation Consulting
4
5
6 Table of Contents Chapter 1: The City s Envisioned Future...10 RWCmoves Vision Citywide Transportation Plan Goals RWCmoves Report Organization Chapter 2: Where Are We Starting From (Existing Conditions) Walking in Redwood City...16 Bicycling in Redwood City...18 Using Transit in Redwood City Driving in Redwood City...24 Advancing Technologies Chapter 3: Moving Ahead (Community Engagement)...30 What We Heard Key Takeaways...31 Chapter 4: Reaching Our Destination (Proposed Transportation Program)...36 Project Categories Performance Measures and Prioritization Process...63 Generalized Project Costs...68 Tier 1 Projects and Programs...69 Signature Projects and Programs Chapter 5: Where Do We Go From Here? (Action Plan/Implementation)...76 Modified General Plan Policies and Programs Street Typologies and Transportation Engineering Standards and Design Guidelines...79 Network Concept Maps Ongoing Performance Monitoring...93 Implementation Actions
7 List of Figures Figure 1: Mode Split Survey of Redwood City Apartments and Homes...15 Figure 2: Mode Split Survey of Redwood City Offices...15 Figure 3: Walking in Redwood City...17 Figure 4: Biking in Redwood City...21 Figure 5: Using Transit in Redwood City...23 Figure 6: Driving in Redwood City...25 Figure 7: Average Vehicle Delay in Redwood City...26 Figure 8: Zip Code Where Survey Respondent Live, Work or Go to School...31 Figure 9: Comparison of Survey Respondent s Stated Ethnicity to American Community Survey, Figure 10: Reaching Out to the Community...33 Figure 11: Division of Project List by Category...38 Figure 12: Active Transportation Corridor Projects...39 Figure 13: Complete Street Corridors and Placemaking Projects...47 Figure 14: Transit Access and Service Enhancement Projects...50 Figure 15: Roadway Congestion and Delay Improvement Projects...52 Figure 16: Network Gap Closure, Connectivity and Safety Projects...56 Figure 17: Division of Project List by Order of Magnitude Cost...68 Figure 18: Proposed Street Typologies Network Figure 19: Proposed Bicycle Backbone Network...91 Figure 20: Proposed Truck Routes...92 Table of Contents 7
8 List of Tables Table 1: Feedback Summary from Other Outreach Events Table 2: RWCmoves Tier 1 Projects Table 3: RWCmoves Signature Projects and Programs...75 Table 4: Recommended General Plan Policy Amendments...77 Table 5: Recommended General Plan Implementation Program Amendments...78 Table 6: Recommended Design Guidelines by Street Typologies...87 Table 7: Redwood City Transportation Monitoring Program Strategy
9 Appendices Appendix A: Existing Conditions Report Appendix B: Project Performance Measures, Prioritization Process and Results Appendix C: Outreach/Survey Details Appendix D: Mapping Results Appendix E: Transportation Demand Management (TDM) Plan (to be added) Appendix F: Transportation Analysis (TA) Guidelines (to be added) Table of Contents 9

10 1 Redwood Chapter One The City s Envisioned Future City s General Plan, adopted in 2010, outlines a bold vision for transportation in Redwood City. The General Plan differed significantly from earlier plans by shifting the focus of transportation in the City from automobile travel to one that embraced transportation in all forms walking, bicycling, riding transit, and other modes as well as travel by private automobile. In the years following adoption of the General Plan, the City has undergone substantial change. Local and regional development growth and increases in population have worsened congestion and increasingly affected neighborhoods. Caltrain ridership in Redwood City has nearly doubled in the last 5 years. Bicycle travel in the City is also at an all-time high. In response to this, in late 2016, Redwood City began development of its first-ever Citywide Transportation Plan. 10 1
11 The Citywide Transportation Plan, known as RWCmoves, establishes a new vision for transportation that builds on the foundation of the General Plan, as well as other recent City documents like the 2015 Strategic Plan. The Plan recognizes that by providing a robust transportation network for all travel modes, the City can most effectively address congestion and limit neighborhood cut-through traffic. RWCmoves also reflects a major community engagement process in the development of Citywide Transportation Plan. RWCmoves Vision The vision for the Citywide Transportation Plan tiers off the goals established in the City s General Plan. The General Plan envisions a City with a balanced, multimodal transportation network that accommodates all users. However, RWCmoves goes beyond the General Plan in recognition of the importance of improving transportation options in the City. As a result, the guiding vision for RWCmoves is to: Promote the best travel experience possible for everyone in Redwood City by creating and maintaining a multimodal, safe, and accessible transportation network. The vision allows the City to address increased traffic congestion in Redwood City and proactively manage its transportation network. As part of RWCmoves, the City identifies and prioritizes the types of projects and programs that most enhance transportation safety, mobility, equity, and Citywide Transportation Plan Goals Several goals support the RWCmoves vision of promoting mobility for all. In no particular order, the goals for RWCmoves are described below: Goal 1 Goal 2 Goal 3 Goal 4 Goal 5 Create a walking and bicycling-friendly community that provides a balanced, convenient and safe transportation system Provide seamless connections and improved street access to all areas within the City, but especially along mixed-use corridors designated in the General Plan and Citywide Transportation Plan Embrace innovation in all forms of emerging technologies, especially in ways to creatively manage congestion and the transportation system Achieve a mode split target of over 50% of all trips being by nondriving modes by 2040; most remaining automobile trips should be zero emission trips Invest in projects that support a resilient, equitable and sustainable transportation system The intent of these goals is to inform the choice of performance measures that will be used to identify and prioritize projects in the Citywide Transportation Plan. Performance measures are described in detail in Chapter 4 of this document. What does it mean to be multimodal? Multimodal means recognizing the importance of all people traveling on the street regardless of whether they are walking, biking, taking transit, driving, or traveling by any other means. access for everyone traveling in Redwood City. Chapter One: The City s Envisioned Future 11
12


13 RWCmoves Report Organization This document is organized into several chapters, each describing different elements of the Plan development and project prioritization process: Chapter 1: The City s Envisioned Future: This chapter introduces RWCmoves, and presents the vision and goals for the Plan. The Citywide Transportation Plan is intended to serve as a guiding document for the City as it seeks to improve transportation in Redwood City. It is primarily a planning and policy document and is not envisioned to approve specific transportation improvement projects or programs. Projects that are advanced under this Plan would need to undergo their own design, environmental review and approval process prior to being implemented. Chapter 2: Where Are We Starting From (Existing Conditions): This chapter describes the current state of transportation in Redwood City, ranging from existing traffic conditions to the bike network to ridership levels on local and regional transit services. Chapter 3: Moving Ahead (Community Engagement): This chapter presents an overview of the extensive community engagement process that accompanied the Plan development process. Chapter 4: Reaching Our Destination (Proposed Transportation Program): This chapter includes the proposed projects and a transportation program that will guide transportation investment in the coming years. It includes detailed descriptions of how transportation projects were identified and how they were evaluated. In addition, it presents an overview of the highest priority projects. Chapter 5: Where Do We Go From Here? (Action Plan/Implementation): This chapter discusses the process that the City will use to advance and implement projects. It covers topics of design, funding, environmental clearance, and ongoing performance monitoring. Chapter One: The City s Envisioned Future 13

14 2 Redwood Chapter Two Where Are We Starting From (Existing Conditions) City is served by a variety of transportation facilities and services that establish a foundation for a truly multimodal transportation network. The City s streets form the backbone of the transportation system and within this network, walking, bicycling, and transit facilities offer the greatest potential for increased capacity. More specifically, Redwood City has many qualities that make walking and biking an important and accessible mode of travel, including a compact city boundary, level terrain, temperate weather, and numerous destinations within walking and biking distance. Redwood City s existing transportation system helps frame the opportunities to create and maintain a balanced transportation network aimed at further improving mobility and access for all modes. Travelers in Redwood City use many different forms of transportation. The proportion of travelers taking different modes is referred to as mode split. 14 2
15 Redwood City s current commute trip mode split based on census data is shown below. HOW RWC RESIDENTS TRAVEL TO WORK (% TRIPS) Source: American Community Survey other Commute trips represent only a portion of all trips taken in Redwood City. When considering other trip purposes, such as shopping or recreational trips, there are oftentimes greater proportions of walking and bicycling trips that occur. To better understand how current trip patterns are different between residential and office land uses, person counts were conducted at several residential housing and commercial developments located throughout Redwood City. Residential housing surveys provided insight into how density of land development and availability of multimodal infrastructure influence the percentage of drive-alone trips versus other multimodal transportation options (see Figure 1). Comparison of single-family detached housing, suburban apartments, and downtown apartments showed that drive-alone rates are much higher for single-family detached housing than for suburban apartments and downtown apartments. Walking, biking, and transit rates were substantially higher for downtown apartments. This is similar for office developments in Redwood City, where drive alone rates are higher for suburban office than downtown offices, as shown in Figure 2. Figure 1: Mode Split Counts of Redwood City Residential Land Uses Single-Family Detached Housing Suburban Apartment Downtown Apartment Figure 2: Mode Split Counts of Redwood City Office Developments Suburban Office Downtown Office Bike Walk Transit Carpool TNC (Uber/Lyft) Drive Alone Bike Walk Transit Carpool TNC (Uber/Lyft) Drive Alone Chapter Two: Where Are We Starting From 15
16 Downtown residential developments and offices have more walking, biking and transit use and less drive-alone use since there are more transportation options available as compared to the rest of the City; there is also a greater mix of land uses downtown, which shortens trip length and encourages more non-auto travel options. The count results of existing Redwood City land uses show that having higher densities, mixing land uses, and investing in multimodal facilities influences how people choose to get around and overall can reduce congestion levels. Redwood City s existing transportation network is summarized by mode in the following Summary Fact Sheets (Figure 3 through Figure 6), entitled Walking, Biking, Using Transit, and Driving in Redwood City. Each Fact Sheet includes key takeaways related to current conditions, locations of existing facilities/services, travel characteristics such as percent of trips by a given mode and recent collision trends. Similar to mode split counts, vehicle trip counts were collected to better understand how many vehicle trips are currently being generated at various land uses in Redwood City. A comparison of these counts with the assumptions used to develop the Environmental Impact Reports (EIRs) for Redwood City s General Plan and Downtown Precise Plan, showed that in almost all cases vehicle trips are over-represented compared to what is actually occurring (see Appendix A). Walking in Redwood City Walking destinations in Redwood City are connected by a system of onstreet sidewalks along all major streets as shown on Figure 3. The map on Walking in Redwood City also shows pedestrian volumes at available count locations. Redwood City s downtown is a particularly attractive destination for pedestrians, with many dining, retail, and entertainment destinations. As a result, the highest levels of pedestrian activity are mostly located along Broadway in the Downtown area. Though Redwood City has a fairly robust sidewalk network, there are opportunities to improve the walking experience, in terms of comfort, convenience, and safety. Potential opportunities to support walking in the City include enhancing crosswalk treatments near schools, in Downtown Redwood City, and near job centers, improving first/last mile pedestrian facilities to provide better access to transit, and enhancing the overall experience of walking along streets through managing traffic speeds, adding landscaping, and implementing pedestrian safety improvements in key locations. 16 2
17 Main St SUMMARY FACT SHEET: Walking in Redwood City Figure 3: Walking in Redwood City B 101 San Francisco Bay B B M arine Pkwy A Shearwater Pkwy Redwood Shores Pkwy Canyon Rd Farm Hill Blvd } 82 d Ed gewood R 101 Whipple Ave Hopkins Ave Brewster Ave Arguello St Broadway Hudson St Industrial Way Jefferson Ave Alameda de l as Pulgas Roosevelt Ave Redwood Ave Valota Rd Virginia Ave Kentfield Ave Woodside Rd Veterans Blvd Maple St } 84 Seaport Blvd Charter St El Camino Real E Bay Douglas Ave Broadway St Bay Rd Middlefield Rd shore Rd } 82 2nd Ave Spring St 5th Ave Redwood City Limits Sphere of Influence 101 Parks Schools Railroad Existing Pedestrian Facilities Sidewalk Gap Pedestrian Volume A 3% of residents walk to work today Sidewalks are provided on almost all of RWC streets Most walking trips are in Downtown RWC 4% of all collisions in RWC involve pedestrians Pedestrians account for 33% of all severe traffic injuries and deaths } 82 1 MILE Redwood City has many amenities that make walking an important and accessible mode of travel, including level terrain, temperate weather, and numerous destinations that are attractive to walkers.? A key issue identified through public outreach is low visibility at pedestrian crossings Source: American Community Survey , SWITRS database, January 1, 2011-December 31, MILE 601-1,400 * Volumes shown in locations with data A key solution identified through analysis of existing conditions is to enhance pedestrian crossings Number of Pedestrain Collisions Fatal or Severe Injury Other Injury or Complaint of Pain Property Damage Only Chapter Two: Where Are We Starting From 17
18 Bicycling in Redwood City The bicycle network in Redwood City provides both dedicated and shared space for vehicles and bicycles. Figure 4 includes an overview of the existing bicycle network and bicycle volumes in the City. Most bicycle facilities in Redwood City are bicycle routes and bicycle lanes. SHARED-USE PATH (CLASS I) Completely separated right-of-way for exclusive use of bicycles and pedestrians BICYCLE LANE (CLASS II) Bike Lane Sign (Optional) On-street striped lane for one-way bike travel Not to scale Shoulder Paved Path 2 Shoulder Not to scale Sidewalk 7-8 Parking 5-6 Bike Lane Travel Lane Travel Lane 5-6 Bike Lane Sidewalk Shared-Use Paths (Class I) provide a completely separate right-ofway and are designated only for bicycle and pedestrian use. Bike paths serve corridors where there is enough right-of-way, or space, to allow them to be constructed or where on-street facilities are not appropriate due to vehicular volumes, speeds, or other roadway characteristics. Bicycle Lanes (Class II) are dedicated lanes for bicyclists generally adjacent to the outer vehicle travel lanes. These lanes have special lane markings, pavement legends, and signage. Bicycle lanes are typically five (5) feet wide. Adjacent vehicle parking and vehicle/ pedestrian cross-traffic are permitted. 18 2
19 BICYCLE ROUTE (CLASS III) Shared on-street facility Bicycle Route Signs CYCLE TRACK/SEPARATED BIKEWAY (CLASS IV) Physically separated bike lane Not to scale Sidewalk Parking Travel Lane Travel Lane Sidewalk Not to scale Sidewalk 5-7 Bike Lane Parking Travel Lane Travel Lane 5-7 Sidewalk Bike Lane 3-5 Minimum Buffer Bicycle Routes (Class III) are designated by signs or pavement markings for shared use with motor vehicles, but have no separated bike right-of-way or lane striping. Bike routes serve either to: a) provide a connection to other bicycle facilities where dedicated facilities are infeasible, or b) designate preferred routes through high-demand corridors. Cycle Tracks or Separated Bikeways (Class IV) provide a right-ofway designated exclusively for bicycle travel in a roadway and are protected from other vehicle traffic by physical barriers, including, but not limited to flexible posts, raised curbs, or parked cars. Chapter Two: Where Are We Starting From 19
20 Types of Bicyclists Most people are willing to ride bicycles for recreation, particularly on paths that are separated from vehicle traffic. People differ substantially, however, in their willingness to use bicycles for transportation. The Portland (OR) Bureau of Transportation has developed a typology of transportation cyclists which divides the adult population into four groups: Strong and Fearless: People who will ride regardless of roadway conditions, and who are willing to use streets with high traffic volumes and/or speeds, and who do not necessarily prefer to use dedicated facilities such as bicycle lanes. Strong and fearless riders comprise 5 to 10 percent of the adult population; Enthused and Confident: These bicycle riders will share street space with automobiles, especially if traffic speeds are slow and volumes are low, but prefer to use dedicated facilities such as bike lanes, bike paths, and cycle tracks. Enthused and confident riders make up approximately 5 to 10 percent of the population; Interested but Concerned: These people are unwilling to ride on streets with high volumes or speeds of vehicle traffic, even if a bike lane is provided. They may bicycle within their neighborhoods but are unlikely to commute to work via bicycle or to ride for longer distances. Interested but concerned riders may comprise up to 50 to 60 percent of the population; No Way, No How: These people are not willing, not able, or very uncomfortable riding bicycles for transportation, even on a completely separated bike path. They make up approximately one-third of the population. STRONGand FEARLESS THE FOUR TYPES OF BICYCLISTS ENTHUSEDand CONFIDENT INTERESTEDbut CONCERNED NOwayNOhow 7% 5% 51% 37% Source: Dill, Jennifer and McNeil, Nathan, Revisiting the Four Types of Cyclists The City s existing bicycle commute mode share is two percent, which indicates that the streets in Redwood City and in adjacent cities currently may not serve the interested but concerned riders. Improvements to bicycle facilities and traffic calming may help encourage a larger share of the population to ride bicycles for transportation. There is, therefore, great opportunity to build out the City s bicycle network to be comfortable for all bicyclists, including the interested but concerned population who would bike if enhanced bicycle facilities (Class I and IV) provided connection to and from schools, downtown Redwood City, neighborhoods, and job centers. 20 2
21 Main St SUMMARY FACT SHEET: Bicycling in Redwood City Figure 4: Biking in Redwood City B 101 San Francisco Bay B B M arine Pkwy A Shearwater Pkwy Redwood Shores Pkwy Canyon Rd Farm Hill Blvd } 82 d Ed gewood R 101 Whipple Ave Hopkins Ave Brewster Ave Industrial Way Arguello St Broadway Hudson St Alameda de l as Pulgas Jefferson Ave Roosevelt Ave Redwood Ave Valota Rd Virginia Ave Kentfield Ave Woodside Rd Veterans Blvd Maple St } 84 Seaport Blvd Charter St El Camino Real E Bay Douglas Ave Broadway St Bay Rd Middlefield Rd shore Rd } 82 2nd Ave 5th Ave Spring St Redwood City Limits Sphere of Influence Parks Railroad Existing Bicycle Facilities 101 Shared-Use Path (Class I) Bicycle Lanes (Class II) Pilot Bicycle Lanes (Class II) Bicycle Route (Class III) Bicycle Volume Schools A 2% of residents bike to work today Bike lanes or routes are provided on over 25% of RWC streets Most bicycle trips are in Downtown RWC and along Broadway, Brewster, and Alameda Over 15% of survey respondents stated they would be interested in biking to work if better facilities were available 5% of all collisions in RWC involve bicyclists Bicyclists account for 21% of severe traffic injuries and deaths } 82 1 MILE 1 MILE * Volumes shown in locations with data The bicycle network is an important piece of the transportation network in Redwood City. The bike network should meet the needs of all cyclists: casual recreational riders, commuters, transportationists, and enthusiasts.? A key issue identified through community outreach is the need for more bicycle facilities that "everyday riders" are comfortable using. Source: American Community Survey , SWITRS database, January 1, 2011-December 31, A key solution identified through analysis of existing conditions is to develop a citywide bicycle network that provides low stress connectivity. Number of Bicycle Collisions Fatal or Severe Injury Other Injury or Complaint of Pain Property Damage Only Chapter Two: Where Are We Starting From 21

22 Using Transit in Redwood City Caltrain and SamTrans provide transit service in Redwood City and surrounding communities. Caltrain operates 76 daily trains during the weekdays that serve Redwood City, and SamTrans currently operates 18 bus routes in the City. Caltrain operates express Baby Bullet service to San Francisco and San Jose, providing important regional transit access for Redwood City residents and employees alike. Redwood City Transit Center, the City s main bus transit hub, is located adjacent to the Redwood City Station. In addition to public bus and rail transit, a local shuttle network provides service from Caltrain to employment centers around Redwood City. A senior shuttle provides seniors with transport through the Veterans Memorial Senior Center from Casa de Redwood, Redwood Plaza Village, and seniors homes to Downtown Redwood City several times per week. Some area employers, such as Electronic Arts, Facebook, and Google, also operate private bus services for their employees that work or live in Redwood City. Existing transit services, including SamTrans bus routes, the Redwood City Station, and the shuttle network are shown on Figure 5. Although Redwood City s transit network does provide regional and local access, increasing transit frequency of service and comfort of transit stops and stations are opportunities to improve ridership and the overall quality of the transit system. 22 2
23 Main St SUMMARY FACT SHEET: Using Transit in Redwood City Figure 5: Using Transit in Redwood City } B & &KX } 82 San Francisco Bay & 295 & 57 Redwood City aims to create easier access to all types of transit. RWC is working to influence this through land use and zoning decisions, increasing connectivity for pedestrians, bicyclists, and drivers, and improving traffic operations within key corridors to facilitate bus headways.? B B Marine Pkwy &261 A Shearwater Pkwy Redwood Shores Pkwy &60 &67 San Carlos Caltrain ECR KX úûü &61 1 MILE A key issue identified through community outreach is that transit service serving local roadways, neighborhoods, and schools could be improved Source: American Community Survey & 295 &95 &73 &273 Canyon Rd &398 Farm Hill Blvd 101 } 82 d Ed gewood R &78 Whipple Ave Hopkins Ave San Carlos Caltrain ECR KX &79 Hudson St Brewster Ave &274 Alameda de l as Pulgas Industrial Way Arguello St &78 úûü Jefferson Ave Roosevelt Ave Kentfield Ave Valota Rd Redwood Ave Virginia Ave Redwood City Transit Center ECR KX Veterans Blvd &278 &270 Woodside Rd Maple St } 84 &72 Seaport Blvd El Camino Real Charter St E Bay Middlefield Rd shore Rd &286 } 82 Broadway St 1 MILE Bay Rd A key solution identified through existing conditions analysis is the opportunity to support enhanced transit service and reliability that provide connection with neighborhoods and schools &79 5th Ave Spring St Redwood City Limits Sphere of Influence Parks Railroad Transit Lines AC Transit Service 101 Schools Caltrain Lines and Stations &270 A SamTrans Express Route &296 SamTrans School-day Only Routes SamTrans Routes connecting to Caltrain Stations SamTrans Routes connecting to Menlo BART/Caltrain Park &82 Stations ECR Park & Ride Lot úûü Local Shuttle 1 MILE % of residents take transit to work today Caltrain averaged over 3,800 boardings each weekday in 2016 Caltrain ridership increased by nearly 20% from 2015 to 2016 Over 20% of survey respondents stated they would be interested in commuting by public transit Over 10% of survey respondents stated they would be interested in commuting by local shuttle Local shuttle network ridership is over 2,500 riders per month and provides connection for job centers to Caltrain stations Over 1,100 riders use the Senior Center shuttle per week DAILY CALTRAIN RIDERS IN RWC 1,870 POPULATION GROWTH 73% GROWTH 3,240 78,100 81,400 4% GROWTH Chapter Two: Where Are We Starting From 23

24 Driving in Redwood City Redwood City has a street network that provides local and regional roadway connections. Streets are classified as transit streets, bicycle boulevards, pedestrian streets, connector streets, industrial streets, boulevards, auto dominated highways, and local streets in the General Plan. Although some of Redwood City s street network is in a grid-pattern, vehicular traffic often is channelized to specific streets because many streets do not provide direct connections to regional destinations, as shown on Figure 6. Vehicle Circulation, Congestion and Cut-Through Traffic As traffic volumes have increased in the City, so has traffic congestion. Major corridors in the City, including Woodside Road and El Camino Real, regularly experience traffic congestion during weekday peaks. While some congestion is the result of local trips, there are also major regional traffic patterns that affect congestion in Redwood City as well as throughout the Bay Area. US 101 and Interstate (I) 280 are two major highways that provide connections between Redwood City and many other places in the San Francisco Peninsula and beyond. Due to their regional significance, US 101 and I-280 are used by many people during their morning and evening commutes, and typically become congested. Residents of Redwood City have expressed concerns with challenging vehicular circulation, specifically with highly congested corridors and in some cases, traffic cut-through on residential neighborhood streets. Increases in vehicle congestion on higher volume streets can lead to more cut-through traffic, as travelers, often directed by mapping applications like Waze, seek less congested routes through residential neighborhoods. Redwood City is committed to pursuing programs that discourage cut-through behavior by implementing traffic calming strategies to encourage safer and more responsible driving at lower travel speeds.
25 SUMMARY FACT SHEET: Driving in Redwood City Figure 6: Driving in Redwood City B 11% 101 } 82 San Francisco Bay Redwood City's fully developed street system allows easy movement within the City, while several larger roadways link the community to the region. The City is focused on maintaining vehicular access as it works toward a more balanced mode split with pedestrians, bicyclists, and transit.? B B Marine Pkwy 9% A Shearwater Pkwy Redwood Shores Pkwy 1 MILE 5% 5% Canyon Rd Whipple Ave Hopkins Ave Brewster Ave Key issues identified through community outreach are increased congestion and high vehicle speeds along residential streets Redwood Ave Virginia Ave Source: American Community Survey , SWITRS database, January 1, 2011-December 31, % 4% 101 } 82 d Ed gewood R Farm Hill Blvd 8% Industrial Way Arguello St Hudson St Alameda de l as Pulgas 5% Jefferson Ave Roosevelt Ave 8% Kentfield Ave Valota Rd 10% 4% Veterans Blvd Main St Woodside Rd Maple St Middlefield Rd } 84 Seaport Blvd El Camino Real 10% Charter St 6% E Bay 10% shore Rd Broadway St 1 MILE Bay Rd Spring St A key solution identified through existing conditions analysis are increased traffic calming measures to reduce traffic speeds and volumes on neighborhood streets 5th Ave 4% Redwood City Limits Sphere of Influence 101 Parks Schools Railroad xx% Trip Distribution Existing Street Network Transit Street Bicycle Boulevard Pedestrian Street Connector Street Industrial Street Boulevard Auto Dominant Higway Local Street A 1 MILE Number of Auto Collisions % of residents drive alone and 10% of residents carpool to work today Some downtown RWC roads have traffic slowdowns in the AM and PM peak hours RWC mitigates neighborhood cut-through traffic by actively responding to requests and prioritizing traffic calming measures Downtown parking supply is able to successfully accomodate the parking demand generated by use of downtown business & amenities Auto-only collisions make up over 90% of all RWC collisions Less than 1% of auto-only collisions resulted in a severe injury or death Almost 80% of RWC auto-only collisions result in property damage only Fatal or Severe Injury Other Injury or Complaint of Pain Property Damage Only Chapter Two: Where Are We Starting From 25

26 Figure 7: Average Vehicle Speed Average Speed (MPH) El Camino Real Jefferson Avenue Woodside Road Middlefield Road Redwood Shores Parkway Congestion Trends Speeds are a direct indicator of congestion levels. INRIX speed data on key streets in Redwood City were compared between 2014 and 2017, shown in Figure 7. Overall, the data shows that speeds have decreased by approximately 15 to 20 percent on El Camino Real and Jefferson Avenue, and more drastically, by approximately 40 percent on Woodside Road and Middlefield Road. Speeds have decreased slightly, by 5 percent, on Redwood Shores Parkway. Decreased speeds are a result of an increase in vehicle volumes on Redwood City streets. This trend will likely continue as more growth occurs in the City and surrounding jurisdictions, unless road capacity is managed by shifting travel behavior from drive alone trips to walking, biking, using transit and carpooling, or trips are shortened through more dense, mixed-use development. 26 2
27 Parking Parking demand is high in Redwood City in both the downtown area and in some residential neighborhoods. Parking demand in the downtown area is driven by a concentration of popular destinations and a variety of activities. In the Downtown, on-street parking is available on most blocks and public parking is available in several garages and lots. Downtown parking demand is high at lunchtime on weekdays and during evenings and on Saturdays. In 2005, the City approved a progressive parking policy that allows for downtown parking rates to be adjusted as needed. Since then, the City has monitored parking demand and supply, and made changes to its parking policies to better manage its facilities. Changes include on-street meter rates and off-street parking fees, and growth of permit programs. The Marshall Garage, the Main Street Lot, and the Sequoia Station Garage have monthly permits available for downtown employees, residents, or other regular visitors. Additional parking meter program details are included in Appendix A. The City has successfully managed parking based on the goals of the 2005 plan, but in recent years, new growth and development have increased the parking demand downtown. New commercial and residential development, as well as intensified use of older buildings, which may have fewer parking spaces, have resulted in increased traffic and more difficulty finding convenient parking for workers, residents, and visitors to downtown. The revenue generated from the metered parking program increased from approximately $1.3 million to $2.4 million from FY to FY Downtown core parking fees and Marshall permit costs were increased in August 2014, likely accounting for much of the revenue increase over the few year period. During this same time period, the overall budget for the City s parking fund increased from $2 million to $2.4 million each year, the amount of money required from the general fund to make up for the difference between budget and revenue decreased. Parking in Redwood City s residential neighborhoods is also managed by the City, through a Residential Parking Permit (RPP) Program. There are currently two active permit areas: Permit Area A located southwest of downtown, and Permit Area S located southeast of downtown around Sequoia High School shown in Figure A-40. In these RPP areas, the time limit for vehicles parked on the street without a permit is 2 hours. Residents can obtain a permit for free by providing proof that they live in a permit area. There are 506 permits issued in Area A, and Area S has 60 permits issued. Parking supply in high density residential neighborhoods is available on street and privately; on-street parking demand is possibly due to inadequate private parking supply. Chapter Two: Where Are We Starting From 27

28 Advancing Technologies Technology and innovation developments, including Transportation Network Companies (TNCs) such as Uber and Lyft, and robot delivery are increasingly changing travel behavior locally in Redwood City and regionally in the Bay Area. These advancing technologies have begun to result in new transportation issues, but they also could provide opportunities to improve mobility in Redwood City. Automated vehicles (AVs), though currently not in use in Redwood City, will also likely affect transportation in the City and regionally when implemented. Addressing how these technologies are currently affecting the transportation system, and anticipating how future technological developments will alter the transportation system further is an important focus of RWCmoves. Key transportation technologies are discussed below. Transportation Network Companies (TNCs) TNCs provide point-to-point rides through smart phone interfaces with integrated payment systems. Lyft and Uber are two of the key players in the TNC industry. Though some expect TNCs reduce vehicular miles traveled (VMT) and automobile ownership rates, the convenience and relatively low cost of TNCs could instead induce additional travel or shift trips away from low-impact transit, bicycling or walking modes. Redwood City allows TNCs to operate in the City; though impacts are currently not measured on a citywide or regional basis. Due to the increased usage currently observed in Redwood City, TNCs are most likely already decreasing parking demand, changing commute patterns by providing people with another choice in travel, and affecting curbside loading and unloading conditions. These effects are likely to become more pronounced if TNC travel becomes more popular. 28 2


29 Automated Vehicles (AVs) Robot Delivery Redwood City approved a pilot program in late 2016 to allow the use of autonomous robots, or Personal Delivery Devices (PDD), through Starship Technologies Inc., a London based company that provides autonomous delivery robots. The PDDs are permitted to use sidewalks and streets to deliver food, groceries, and packages and can carry approximately threegrocery bags worth of goods. A human controller currently follows all PDD trips. The pilot program has not published conclusions to the public. Possible benefits of the continuation of this program in Redwood City could include reduced roadway congestion, improved safety due to fewer conflicts between delivery vehicles and other modes, reduced roadway maintenance costs, and reduced greenhouse gas emissions. Possible limitations could include limits on package weights, overcrowding of sidewalk space, and potential conflicts with pedestrians, especially people with low vision. RWCmoves seeks to identify the new technologies that will likely affect goods movements in the future and includes actions the City can take to maximize the benefits while minimizing potential negative effects. Though not commonly seen in Redwood City today, automated vehicles (AVs) will likely affect the transportation system in the near future. AVs are capable of sensing their own environments in order to perform at least some aspects of safety-critical control without direct human input. Many industry professionals believe that shifting to AVs will offer some transportation benefits, including improved traffic flow, fewer traffic collisions, and enhanced mobility for vulnerable users. The potential of AVs is that travelers would no longer be concerned with traffic congestion, needing to find parking, and the financial and environmental costs associated with traffic and driving. However, the convenience of AVs could also result in more miles traveled if riders tolerate longer commutes, or if AVs make deadhead trips to look for new riders or cheap parking or are used to run errands. RWCmoves acknowledges AVs will likely need to be planned for and regulated based on the community values and provides the initial steps for how Redwood City can start proactively preparing for AVs. Chapter Two: Where Are We Starting From 29

30 3 Community Chapter Three Moving Ahead (Community Engagement) engagement provided an exciting opportunity to engage Redwood City residents, workers, and business owners people who walk, bike, take transit, and drive in the City and to understand how their experience could not only be improved but how quality of life could be transformed with a great transportation system. Public outreach to develop RWCmoves incorporated a multifaceted outreach approach aimed at engaging the broadest crosssection of the community. This approach included the following. A project website with an interactive web map provided the public opportunities to use a web map to note specific areas that were either challenging or provided positive transportation experiences. The website and web map were developed in both Spanish and English. Community Pop-Up events were held to garner widespread interest in the project and encourage residents to provide input directly or through the web map. 30 3
31 Walking audits with City staff provided the opportunity to receive input and discuss roadway improvement options at key roadway and intersection locations that are emblematic of common issues found in the City. Focus groups were held with key stakeholders and allowed for a more in-depth discussion of issues, opportunities, and feasibility for mobility improvements, and to measure public interest and willingness to use alternative modes of travel. Social media/website updates of fresh and branded material were released weekly to garner interest for the release of the public review draft of the Draft Plan. Public workshops will be held in conjunction with release of the Draft RWCmoves plan to provide information about the plan elements and to collect feedback on the list of projects and policy recommendations. Characteristics of the respondents are representative of Redwood City as a whole - respondents represented residents, employees, or students of every zip code of Redwood City, all ages, men, and women, and all ethnic backgrounds. Over 65 percent of respondents live in, approximately 30 percent work or go to school in, and approximately 3 percent are visitors of Redwood City. Respondents were also asked where they work or attend school by zip code. The highest percentage of responses were for zip code (South of Jefferson Avenue). Other zip codes that were well represented include (Downtown/East of El Camino Real), (north of Jefferson Avenue), and (Redwood Shores). A small percentage of respondents listed (North Fair Oaks). This is shown below in Figure 8. Figure 8: Zip Code Where Survey Respondent Live, Work or Go to School What We Heard Key Takeaways Reaching Out to the Community The RWCmoves project website included an interactive web map to gather detailed information about where in Redwood City people live, work, and go to school. The survey was open from March through July Over 800 responses were received, and respondents identified over 2,000 locations in the City that have some sort of transportation issue or opportunity. ZIP CODE OF SURVEY RESPONDENTS North Fair Oaks Redwood Shores North of Jefferson Downtown/ East of ECR Note: Some respondents live and work or attend school in more than one Redwood City zip code. South of Jefferson Chapter Three: Moving Ahead 31

32 Seven percent of respondents took the survey in Spanish, and the stated ethnicity of respondents approximately reflects American Community Survey census data, as shown in Figure 9 below. Figure 9: Comparison of Survey Respondent s Ethnicity to Census Data. Decline to state Community Outreach Survey Data Census Data American Indian or Alaskan Native Other Hispanic/Latino White/Caucasian Multi-ethnic Black or African American Asian Asian Indian or Pacific Islander Key takeaways from the web map survey are shown on Figure 10. The survey provided invaluable insight into the highlights and needs of the City s transportation system. The map on Figure 10 shows density of comments placed by survey respondents from low to high. In general, higher density parts of the City, such as Downtown, El Camino Real, Woodside/Broadway, and along major connector streets received more comments than residential parts of the City. 32 3
33 SUMMARY FACT SHEET: Reaching Out to the Community Figure 10: Reaching Out to the Community: Survey Responses B 101 } 82 San Francisco Bay B B Marine Pkwy A Shearwater Pkwy Redwood Shores Pkwy 1 MILE Canyon Rd 101 } 82 d Ed gewood R Whipple Ave Farm Hill Blvd Hopkins Ave Brewster Ave Industrial Way Arguello St Hudson St Alameda de l as Pulgas Jefferson Ave Roosevelt Ave Kentfield Ave Valota Rd Redwood Ave Virginia Ave Veterans Blvd Main St Woodside Rd Maple St Middlefield Rd } 84 Seaport Blvd El Camino Real Charter St E Bay shore Rd Broadway St Bay Rd 1 MILE 5th Ave Spring St 101 Redwood City Limits Sphere of Influence A Parks Schools Railroad Number of Survey Responses Low High 1 MILE? Over 1,000 visited the site, 800 provided 2,040 map responses Respondents placed 1,530 negative pins and ~500 positive pins Over 65% live in, ~30% work or go to school in, and ~3% are visitors to RWC Over 70% stated they would be interested in commuting by a different mode if better infrastructure were available Biking, public transit, and private bus/shuttle were listed as preferred alternate commute modes New or improved infrastructure was requested: 365 responses for pedestrian facilities 360 responses for auto facilities 350 responses for bicycle facilities 210 responses for transit service Positive pins were placed most frequently for walking and biking Negative pins were placed most frequently for biking and driving Downtown RWC, El Camino Real, and Woodside/ Broadway received the most comments Community engagement provided an exciting opportunity to engage residents, workers and business owners people who walk, bike, take transit and drive in the City and to understand how their experience could not only be improved but how quality of life could be transformed with a great transportation system. ZIP CODE OF SURVEY RESPONDENTS Redwood Shores North Fair Oaks North of Jefferson Downtown/ East of ECR South of Jefferson Note: Some respondents live and work or attend school in more than one Redwood City zip code. Chapter Three: Moving Ahead 33
34 Feedback received from additional community outreach events for RWCmoves, including pop up events, a walking audit, and focus groups is shown in Table 1. Participants were asked which facilities or aspects of the transportation system in Redwood City they were happy with, concerned with, and would like to see more of. Overall, feedback from outreach events indicated that across the community, there is interest in Redwood City s transportation to be more walking, biking, and transit friendly while also maintaining and improving vehicular access. There was also a particular focus on making schools safer and easier to access by all modes, and improving connections to and from Downtown Redwood City and Redwood Shores. Table 1: Feedback Summary from Other Outreach Events Outreach Type Venue/Forum No. of Participants Community Feedback Participants were pleased with Downtown Redwood City being walkable and easily bikeable Redwood City Farmers Market patrons ~100 Participants would like to see More coordination between schools and transit agencies; bus schedules aligning better with extra-curricular activities More bicycle and pedestrian only streets Pop Up Event Congestion along key roadways connecting with US 101 and I-280 Fair Oaks Community Center members 25 Participants were concerned with... Participants were pleased with Lack of bicycle parking in Downtown RWC Regular commute traffic often blocking driveways Cut-through traffic on residential streets Congestion and lack of vehicle parking in Downtown RWC Opportunities to connect existing bicycle facilities Walking Audit City staff, Police Department representatives 15 Participants would like to see Pedestrian and bicycle facilities improvements Traffic calming measures to slow speeds Landscaping and beautification Safety of school crossings 34 3
35 Outreach Type Venue/Forum No. of Participants Community Feedback Businesses & Merchants, Chamber of Commerce 6-10 Participants were pleased with Increased pedestrian and bicycle activity in downtown RWC Parking availability in downtown RWC Pedestrian and bicycle facilities improvements especially across and along major barriers in the City, such as Woodside Road, El Camino Real and Jefferson Avenue Increased accommodations for high bicycle and pedestrian activity in Downtown RWC Focus Group Seniors, Fun After 50 Group, Veterans Memorial Senior Center Participants would like to see Green bike lanes, pedestrian scrambles, separated walkway and bikeways, wayfinding Traffic signal coordination and priorities and street lighting Shuttle style service to Downtown RWC A comprehensive bicycle network Complete Streets Advisory Committee 6-10 A refined transit network throughout the City Improved access and circulation at Redwood City Station to accommodate future increases in transit demand Transit Agencies 6-10 Opportunities to connect different forms of transit, including buses, rail, ondemand transit, shuttles, streetcars and access to ferries and the Dumbarton corridor in Downtown RWC Participants were concerned with... Congestion and lack of vehicle parking in Downtown RWC Source: Fehr & Peers, Chapter Three: Moving Ahead 35
36 4Chapter Four Reaching Our Destination (Proposed Transportation Program) The findings from existing conditions and the feedback received from the community outreach were used to develop the proposed transportation program described in this Chapter. The transportation program is a coordinated series of actions Redwood City will follow to prioritize transportation projects to guide future transportation investments in Redwood City. As part of its transportation program, Redwood City developed a prioritization process that evaluates and tracks projects according to a series of performance measures. Transportation performance measures are used to assess the current performance of Redwood City s transportation system, demonstrate the value of multimodal transportation projects, prioritize and inform investments, and help monitor change over time. 36 4
37 RWCmoves evaluated a list of transportation projects and programs that are currently in progress or previously identified, as well as new projects and programs that emerged through the Plan development process. Projects were prioritized based on the extent to which they improve performance of the transportation system. Tier 1 and Signature Projects make up the top scoring projects based on the evaluation process. For more detailed information on the project prioritization process and results, see Appendix B. RWCmoves supports development of an updated multimodal Transportation Impact Fee (TIF) program for Redwood City that would incorporate highpriority transportation projects and programs. TIF programs provide funding for planning and construction of transportation projects needed to support traffic generated by new development. Redwood City s TIF program would generate funding for high-priority project development and construction, such as Tier 1 projects, select Tier 2 projects, and expected locally-funded portions of Signature Projects. Project Categories RWCmoves includes previously identified transportation projects and programs as well as a number of new projects and programs. New projects and programs were developed from community member and stakeholder input, as well as through the analysis of existing conditions and opportunities. Some new projects are entirely new efforts, while others are modifications of previously identified projects and programs. Based on their primary characteristics, the list of projects (see Appendix B) are organized into the following seven project categories: Active Transportation Corridors Complete Street Corridors and Placemaking Transit Access and Service Enhancements Roadway Congestion and Delay Improvements Network Gap Closure, Connectivity and Safety Transportation Technologies and Innovations Transportation Demand Management (TDM) Chapter Four: Reaching Our Destination 37
38 There are about 130 total projects included in the Plan prioritization process. Figure 11 presents the proportion of projects within each project category. The remainder of this section provides detailed descriptions of each project category and improvement measures that could be considered as part or all of a project. Figure 11: Division of Project List by Category Active Transportation Corridors 22% Transportation Demand Management (TDM) 3% Transportation Technologies and Innovations 3% Network Gap Closure, Connectivity and Safety 29% Source: Fehr & Peers, Division of Project List by Category Complete Street Corridors and Placemaking 22% Transit Accessibility and Service Enhancement 11% Roadway Congestion and Delay Improvements 10% Category 1: Active Transportation Corridors Active transportation is any self-propelled, human-powered mode of transportation, such as bicycling or walking. Safer and more comfortable corridors encourage the use of active transportation, which can improve a person s overall health. Projects labeled as Active Transportation Corridors provide convenient connections for cyclists and pedestrians along corridors throughout the City and can enhance safety. These types of projects include new or improved bicycle facilities, new or improved walking facilities, and better access to transit for active travel modes. Improved street design (wider sidewalks, low-stress bike routes, street trees, street lighting, and better access to transit) increases both the utilization of active transportation modes and spurs community interaction, which can in turn improve the health of the City s residents and increase economic activity. Figure 12 shows the general locations of the Active Transportation Corridor projects included in the Plan. 38 4
39 Figure 12: Active Transportation Corridor Projects B 101 San Francisco Bay B B M arine Pkwy A Shearwater Pkwy Redwood Shores Pkwy Farm Hill Blvd } 82 E dgewoo d Rd Brewster Ave 101 Whipple Ave Hopkins Ave Industrial Way Hudson St Alameda de l as Pulgas 8 1 Arguello St Jefferson Ave Roosevelt Ave Redwood Ave Valota Rd Virginia Ave 6 Main St Veterans Blvd } Woodside Rd Maple St Seaport Blvd Charter St El Camino Real Middlefield Rd E Bayshore Rd Broadway St Bay Rd } 82 2nd Ave 5th Ave Spring St A } 82 1 MILE Non-Location Specific Projects: MILE Redwood City Limits Parks Active Transportation Corridor Projects Figure 12 Sphere of Influence Schools Railroad Active Transportation Corridor Projects Chapter Four: Reaching Our Destination 39


")


40 Pedestrian Hybrid Beacon (HAWK Signal) Rectangular Rapid Flash Beacon (aka Lighted Crosswalk) High-Visibility Signs and Crosswalks Advanced Yield Lines Lane Reduction (aka Lane Reconfiguration) Median Refuge Island Curb Extension Reduced Curb Radii Pedestrian-Scale Lighting 40 4
41 Pedestrian Improvement Measures Examples of pedestrian improvements that can improve the safety, comfort, and convenience of people who choose to walk include: Pedestrian Hybrid Beacon (aka HAWK Signal): Pedestrian Hybrid Beacons (PHBs), also known as High Intensity Activated Crosswalk (HAWK) Signals, are pedestrian-actuated signals that combine a beacon flasher and a traffic control signal. When actuated, PHBs displays a yellow (warning) indication followed by a solid red light. During pedestrian clearance, the driver sees a flashing red wig-wag pattern until the clearance interval has ended and the signal goes dark. Rectangular Rapid Flash Beacon (Stutter Flash): Rapid flashing LED lamps are installed on overhead signs, in advance of the crosswalk or at the crosswalk. The beacons may be push-button activated or activated with passive pedestrian detection. High-Visibility Signs and Crosswalks: High-visibility markings include a family of crosswalk striping styles including the ladder style. Highvisibility fluorescent yellow green signs are posted at crossings to increase the visibility of a pedestrian crossings. Advanced Yield Lines: Standard white yield limit lines and shark s teeth are placed in advance of marked, uncontrolled crosswalks. Lane Reduction (aka Lane Reconfiguration): Lane reductions replace the existing number of vehicle travel lanes with a combination of wider sidewalks, bicycle lanes, vehicle parking, or converting parallel parking to angled or perpendicular parking. Median Refuge Island: Raised islands are placed in the center of a street, separating opposing lanes of traffic, and have cutouts along the pedestrian path. Curb Extension: Curb extension, also known as a pedestrian bulb-out, is a traffic-calming measure meant to slow traffic and increase driver awareness of pedestrians. Reduced Curb Radii: The radius of a curb can be reduced to require motorists to make a tighter turn. It consists of an extension of the curb into the street, making the pedestrian space (sidewalk) wider. Pedestrian-Scale Lighting: Pedestrian-scale light fixtures range in height between 12 and 18 feet (to light source) and can be stand-alone or attached to taller street light fixtures (ideally of the same style). Chapter Four: Reaching Our Destination 41


")
42 Enhanced Bicycle Lane Cycle Track Bicycle Signal Protected Intersection Bicycle Boulevard Supportive Bicycle Facilities (example: bike locker) 42 4
43 Bicycle Improvement Measures Bicycle improvements that increase the safety, comfort, and convenience of people who choose to bike include: Bicycle Backbone Network: A bicycle backbone network is a system of low-stress bicycle routes that provide safe and convenient and connections throughout the City. Low-stress bicycle routes include a network of bicycle boulevards, buffered bike lanes, and cycle tracks (see definitions below) that provided designated spaces for cyclists away from streets with high vehicle volumes (3,000 vehicles per day maximum) and high vehicle speeds (above 25 mph). Enhanced Bicycle Lane: Bicycle lanes are a portion of the street that are designated by signage, striping, and pavement markings for use of bicyclists. Bicycle lanes are most appropriate on streets with more than 3,000 vehicles per day and with posted speed limits greater than 25 mph. On streets with high vehicle volumes, truck traffic, high parking turnover, or speed limits greater than 35 mph, bicycle lanes can be enhanced to further separate vehicles from bicyclists. Bicycle lanes can be enhanced by adding a painted, landscaped buffer or parking-protected buffer. Bicycle Signal: Bicycle signals are traffic control devises that should only be used at existing traffic signals or hybrid beacons. Bicycle signals generally provide additional guidance for cyclists at intersections where their needs may differ from other road users. For example, bicycle signal phases, bicycle only movements, and lead bicycle intervals at signalized intersections. Bicycle Boulevard: Bicycle boulevards, also known as greenways, are streets with low traffic volumes and speeds that are designed to accommodate bicycle travel as a priority. Many local streets with low vehicle speeds and volumes are already conducive to safe bicycling environments. These types of streets can be enhanced with a range of treatments to create bicycle boulevards. Bicycle boulevards can provide direct access to destinations, slow motor vehicle speeds, reduce motor vehicle volumes, reduce bicyclist delay, provide safe and convenient crossings, and enhance surrounding environments. Cycle Track: Cycle tracks, often referred to as Class IV bicycle facilities, are bike facilities that physically separated from motor vehicle traffic and from the sidewalk. Cycle tracks can be designed as one-way protected or two-way cycle tracks, and can be at street level, sidewalk level, or at an intermediate level. Cycle tracks are most appropriate on streets that could cause many bicyclists to feel stress from factors such as high vehicle speeds, high vehicle volumes, multiple vehicle travel lanes, high parking turnover. They can also be considered on streets with high bicycle volumes and at locations where special considerations should be given, like near transit stops to manage bicycle and pedestrian conflicts. Protected Intersection: Protected intersections use a combination of design elements to create safe and comfortable conditions for bicyclists and pedestrians. Protected intersection design elements can include: high quality bicycle waiting areas at corners, colored pavement to guide bicycle travel paths, and narrowed intersections with small curb radii to reduce vehicle-turning speeds. Protected intersections slow turning vehicles, provide good sight lines for all users, and shorten bicycle and pedestrian crossing distances. Supportive Bicycle Facilities: Supportive facilities include bicycle racks, bicycle lockers, bicycle fix-it stations, and other features that make it easier for people to use a bicycle as a common mode of travel. These types of facilities should be located at locations with high demand and in areas that are most convenient for cyclists. Chapter Four: Reaching Our Destination 43
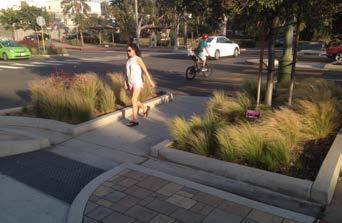
44 Category 2: Complete Street Corridors and Placemaking California s Complete Streets Act (AB 1358) was signed into law in 2008 and mandates that complete street policies and standards be incorporated into City General Plans. The complete street concept recognizes that transportation corridors have multiple users with different abilities and mode preferences (e.g., pedestrians, bicyclists, transit riders, and drivers) that need to be accommodated. An effective transportation system allows for the use of multiple modes and offers a variety of travel options for people to move around in ways that best suit them. Complete street corridor projects can make streets safer, more comfortable and convenient for people using all travel modes. Specific improvements that could be considered as part of complete street corridor projects include the placemaking improvements listed below as well as improvements discussed in other sections, including Active Transportation Corridors, Transit Access and Service Enhancements, and Roadway Congestion and Delay Improvements. Not only do public streets facilitate the movement of people and goods, they provide places for people to congregate, sit, watch, and interact. Creating vibrant and welcoming public spaces for people to live, work, and play is known as placemaking. Placemaking improves spaces where people gather, such as streets and sidewalks, in order to generate greater activity and interaction between people. As the City continues to expand and invest in its infrastructure, improvements must also be made to enhance the streetscape realm, creating attractive environments for walking, biking, and transit to create a balanced transportation system. Figure 13 shows the locations of the Complete Street Corridor and Placemaking projects included in the Plan. Placemaking Improvement Measures Placemaking improvements that can be used to enhance the streetscape and encourage activity include: Public Art: Public art can include sculptures, fountains, murals and other forms of art that encourage people to look around and explore their surroundings. Public Seating: Seating, such as traditional park benches or parklets, provide comfortable and convenient places for people to sit and rest. Parklets, also known as street seats or curbside seating, are platforms that transform parking spaces into public seating areas and generally incorporate elements of landscaping (see description below) and/or bicycle racks. Parklets can be considered where there are narrow or congested sidewalks, or where local property owners or residents see a need to expand seating capacity in an area. 44 4


45 Public Plaza: A plaza is an open public space that serves as a place where people gather, such as a city square. Paseo: A paseo, also known as a promenade, is a public place or path designed for walking. Shared Space: Shared space is a street design that minimizes the separation of bicyclists, pedestrians, and vehicles. This can be done by removing street markings, traffic lights, traffic signs, and curbs. By creating a greater sense of place and making it unclear what travel mode has priority, drivers will reduce their speed, and in turn improve safety for all users. Landscaping: Landscaping ads to the enjoyment of a place by providing scenery, offering shade, and separating people from moving vehicles on the street. Stormwater management and native vegetation are two common landscaping treatments that help create a sense of place. Stormwater management includes bioswales, permeable pavement, and rain gardens. Native vegetation are plants that are indigenous to the area and provide habitat for wildlife. Public Art Public Seating Wayfinding: Wayfinding provides information signage about the direction, distance and sometimes travel time by mode to destinations. The signs are designed to create a sense of community, and make the destinations feel more walkable and bikeable. Public Plaza Chapter Four: Reaching Our Destination 45
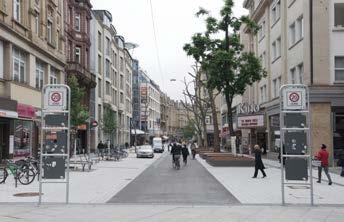
46 Paseo Landscaping Shared Space Wayfinding 46 4
47 Figure 13: Complete Street Corridors and Placemaking Projects B San Francisco Bay B B M arine Pkwy A Shearwater Pkwy Redwood Shores Pkwy d Ed gewood R 101 } 82 Whipple Ave Hopkins Ave Hudson St Brewster Ave Alameda de l as Pulgas Industrial Way 32 Arguello St Jefferson Ave Roosevelt Ave Redwood Ave Valota Rd Virginia Ave Main St Veterans Blvd Maple St } 84 Seaport Blvd El Camino Real Charter St E Bay Broadway St Bay Rd Middlefield Rd shore Rd } 82 2nd Ave 5th Ave 52 Spring St A Farm Hill B 51 lvd Woodside Rd } 82 1 MILE Non-Location Specific Projects: MILE Redwood City Limits Sphere of Influence Parks Schools Railroad Complete Street Corridors and Placemaking Projects Figure 13 Complete Street Corridors and Placemaking Projects Chapter Four: Reaching Our Destination 47
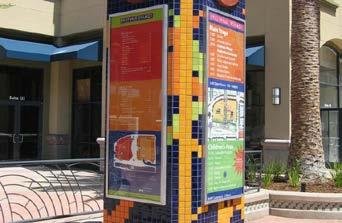
48 Category 3: Transit Access and Service Enhancements Access, performance, convenience, and comfort are key factors for improving the public transportation experience and encouraging new riders. Projects that improve transit access and service seek to enrich the round-trip experience for users of public transportation by improving the transit service directly, or by developing transit-enhanced streets. Transit enhanced streets may receive a number of design elements to improve transit performance and/or the overall user experience for people who walk and take transit. Enhancements may range from streetscape improvements that make walking safer and easier, to transit shelters, or bus priority at intersections. Just as significant, providing reliable and frequent transit service that is convenient and safe, increases roadway capacity by reducing drive-alone trips, shifts more people to transit, and integrates transit access and service investments with the identity of the surrounding street. Figure 14 shows the locations of the Transit Access and Service Enhancement projects included in the Plan. Transit Access and Service Enhancement Measures Several transit service enhancements that can increase multimodal connectivity throughout the City, and improve transit service and reliability for those who choose to take public transit include: Transit Signal Priority (TSP): TSP technology detects approaching transit vehicles to an intersection and extends green lights or shortens red lights to reduce transit delay. TSPs can increase frequency and reliability throughout the transit network, as well as reduce fuel costs and greenhouse gas emissions. Integrated Passenger Information System: Integrated passenger information system compiles traveler information from multiple transit providers into one place. Passenger information can include transit schedules and fares, real-time transit vehicle locations with estimated departure/arrival time, and wayfinding signage. Enhanced Transit Stop: Potential enhancements to transit stops include improved pedestrian access, waiting areas, shelters, seating, bicycle storage facilities, and lighting. These upgrades provide safe, comfortable, and convenient experience for passengers. Demand-Responsive Transit: Demand-responsive transit (DRT), sometimes referred to as dial-a-ride transit (DART) and flexible transport services, is a form of public transit offering flexible routing and scheduling of small/medium sized vehicles operating between origins and destinations according to passenger needs. Queue Jump Lane: Queue jump lanes (a transit only lane on the approach to a signalized intersection) allow transit vehicles to bypass traffic queues at signalized intersections. Queue jump lanes increase transit efficiency by reducing delay for buses at signalized intersections. Bus Bulbouts: Bus bulbouts are sidewalk extensions at transit stops that expand the curb space from the edge of the curb to the travel lane. Bus bulbouts reduce delay by eliminating the need for buses to pull in and out of traffic and they provide more space for amenities (i.e. bus shelters, wayfinding maps, landscaping). Bus bulbouts can also increase safety for riders as they no longer need to enter the street for boarding. Access Improvements: Access improvements make it easier to walk, bike or drive to transit stops. Examples include enhanced bike lanes, intersection treatments, park-and-ride lots, curb ramps, and crossing signals. 48 4
")


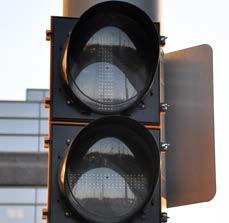
49 Transit Signal Priority (TSP) Integrated Passenger Information System Enhanced Transit Stop Demand-Responsive Transit Access Improvements Bus Bulbouts Chapter Four: Reaching Our Destination 49
50 Figure 14: Transit Access and Service Enhancement Projects B 101 San Francisco Bay B B M arine Pkwy A Shearwater Pkwy Redwood Shores Pkwy Ed gewood R Farm Hill Blvd 101 } 82 d Whipple Ave Hopkins Ave Hudson St Brewster Ave Alameda de l as Pulgas Industrial Way Arguello St Jefferson Ave Roosevelt Ave Redwood Ave Valota Rd Virginia Ave Main St Veterans Blvd Woodside Rd Maple St } 84 Seaport Blvd Charter St El Camino Real 62 E Bay Middlefield Rd shore Rd Broadway St Bay Rd } 82 2nd Ave 5th Ave Spring St 101 A } 82 1 MILE Non-Location Specific Projects: MILE Redwood City Limits Sphere of Influence Parks Schools Railroad Transit Access and Service Enhancement Projects Figure 14 Transit Access and Service Enhancement Projects 50 4

51 Category 4: Roadway Congestion and Delay Improvements Areas with high employment activity, such as Downtown, Redwood Shores, Pacific Shores, and major streets that serve regional commuters, like Woodside Road and El Camino Real, experience greater-than-average levels of peak period congestion. Additionally, congestion is the greatest when both work commute and school trips peak, though only occurring for about 20 minutes on mornings when schools are in session. These congestion and delay improvements include considerations for school traffic. In addition to the multimodal improvements identified, enhancements to directly reduce vehicle congestion and delay will improve the overall experience for all users. Enhancements may range from traffic flow improvements and turnrestrictions to make vehicles travel more efficiently along a corridor, to major intersection and interchange treatments. Improved transit access and service, TDM programs, and active transportation projects, increase person throughput and proactively help manage traffic congestion and reduce neighborhood cut-through traffic. Figure 15 shows the locations of the Roadway Congestion and Delay Improvement projects included in the Plan. Roundabouts Congestion and Delay Improvement Measures Congestion and delay improvements, which can minimize environmental impacts, include: Adaptive Signal Timing: Adaptive signal timing is a specialized form of signal timing that dynamically adjusts signal cycles and phasing in response to real-time traffic conditions. It is most effective on heavily traveled corridors to reduce delays for all modes, including transit. Adaptive signal timing can reduce levels of congestion along a major street corridor, which benefits private automobiles and transit. Signal Coordination: Coordinated signal timing manages the movement and speed of vehicles to increase vehicle throughput. Coordinated signal timing should be considered along corridors with closely spaced signalized intersections (1/4 mile or less), and where there is a desire for a seamless flow of traffic or steady speed progression along a corridor. Signal coordination also provides the opportunity to monitor congestion and adjust signal timings through a central traffic management center. Roundabouts: Roundabouts accommodate high traffic levels in a way that can be more efficient and safer than standard signals. Installing roundabouts could reduce congestion and increase safety for all modes. Roundabouts should be considered at a wide range of intersections, but perform best at intersections with similar traffic volumes in all directions, and at intersections with heavy left turning movements. School Transportation Programs: The City should coordinate with schools to reduce congestion during peak times. For example, staggered school start times, school-focused transit, and safe routes to school programs can reduce vehicle travel during peak times. Chapter Four: Reaching Our Destination 51
52 Figure 15: Roadway Congestion and Delay Improvement Projects B San Francisco Bay B B M arine Pkwy A Shearwater Pkwy Redwood Shores Pkwy Ed gewood R 101 } 82 d Whipple Ave Hopkins Ave Industrial Way Arguello St Hudson St Brewster Ave Jefferson Ave Roosevelt Ave Broadway Redwood Ave Valota Rd Virginia Ave Veterans Blvd Main St Woodside Rd Maple St } Seaport Blvd El Camino Real 71 Charter St E Bay Middlefield Rd shore Rd Broadway St Bay Rd } 82 2nd Ave 5th Ave Spring St 101 A 101 Farm Hill Blvd Alameda de l as Pulgas } 82 1 MILE Non-Location Specific Projects: MILE Redwood City Limits Sphere of Influence Parks Schools Railroad Roadway Congestion and Delay Improvement Projects Figure 15 Roadway Congestion and Delay Improvement Projects 52 4

53 Category 5: Network Gap Closure, Connectivity and Safety Safety ranks as a top priority for many in Redwood City and is an important factor in creating a multimodal and accessible transportation network. Streets that are safe and stress-free are suitable for all ages and all modes of travel. In terms of transportation, concerns for physical safety stem from traffic speeds and volumes, conflict between different modes of travel, and a lack of dedicated infrastructure. With active modes of transportation becoming part of more people s everyday behavior, connectivity and safety measures must take into account the most vulnerable users people walking and riding bikes. Enhancements may range from bicycle and pedestrian crossings across major barriers, such as US 101 and the railroad tracks, and safe routes to school programs to make walking safer and easier for children. These projects and programs can reduce congestion by making it easier and safer for people to make trips by non-driving modes. Figure 16 shows the locations of the Network Gap Closure, Connectivity, and Safety projects included in the Plan. Chapter Four: Reaching Our Destination 53


54 Network Gap Closure and Connectivity Measures Several measures that close gaps and improve connectivity in the network include: Connection to Popular Destinations: Providing bicyclists and pedestrians with convenient access to points of interest, such as schools, transit, parks, neighborhoods, and landmarks, enhances access to these popular destinations, promotes active transportation and reduces travel by vehicle. Connection to Regional Trail Network: Regional trail networks provide bicyclists and pedestrians with a low-stress travel route. Providing better access to regional trails promotes non-auto travel modes for people who choose to walk or bike and increases recreational opportunities. Connection to Regional Trail Network New or Improved Street Connection: Developing new or improved street connections increase access to destinations by expanding the potential number of routes. If implemented with active travel modes in mind, new or improved street connections can also encourage people to walk or bike by creating alternative routes that are safer or more convenient. Grade Separation: Grade separation is the process of aligning two or more travel routes, such as streets, railroad tracks, bike paths, or footpaths, at different heights (grades) so that they do not disrupt other intersecting modes of travel. Overpasses (bridges), underpasses (tunnels), or combinations of both are used for grade separations. Grade Separation 54 4

: Vision Zero is an approach to street safety where no loss of life is acceptable.")

55 Safety Measures and Programs Several measures that can increase the safety and comfort for all travel modes along streets in the City include: Safe Routes to School Program: Safe routes to school programs increase the safety and convenience of children traveling to and from school. These programs create more opportunities for children to walk or bike to school, which could have a secondary benefit of decreasing vehicle trips. High Injury Networks (HIN): Vision Zero is an approach to street safety where no loss of life is acceptable. As part of advancing Vision Zero in the City, High Injury Networks are the intersections, blocks, corridors, or community-wide locations with the highest safety issues. The HIN locations are determined using observed collision data and anticipated collision risk, and are used for recommending, designing, and funding safety countermeasures. Leading Pedestrian Intervals (LPI): A Leading Pedestrian Interval typically provides pedestrians crossing an intersection with a 3-7 second head start over vehicles traveling in the same direction. LPIs improve the visibility of pedestrians and enhance their right-of-way over turning vehicles, especially at locations with a history of pedestrian and vehicle conflicts. Safe Routes to School Program High Injury Networks (HIN) Leading Pedestrian Intervals (LPI) Chapter Four: Reaching Our Destination 55
56 Figure 16: Network Gap Closure, Connectivity and Safety Projects B 101 San Francisco Bay B B M arine Pkwy 87 A Shearwater Pkwy Redwood Shores Pkwy 94 } 82 1 MILE Ed gewood R Farm Hill Blvd } 82 d Whipple Ave Hopkins Ave Arguello St Broadway Hudson St Brewster Ave 102 Alameda de l as Pulgas 105 Non-Location Specific Projects: 106 Industrial Way 89 Jefferson Ave 93 Roosevelt Ave Redwood Ave Valota Rd Virginia Ave Veterans Blvd Main St Woodside Rd Maple St 107 Middlefield Rd } Seaport Blvd Charter St El Camino Real E Bay shore Rd Broadway St Bay Rd 96 } 82 2nd Ave 114 5th Ave Spring St 101 A 1 MILE Redwood City Limits Sphere of Influence Parks Schools Railroad Network Gap Closure, Connectivity and Safety Projects Figure 16 Network Gap Closure, Connectivity and Safety Projects 56 4

57 Category 6: Transportation Technologies and Innovations Technology is dramatically altering travel behavior and peoples relationship with streets. Increasingly, TNCs and ridematching services are using mobile technology to connect ordinary drivers with passengers needing a ride, while carsharing companies provide easy, short-term access to a private car. These innovations offer a convenient and cost-effective alternative to buying and owning a car. In the future, AV technology may remove the need for human drivers. AVs will need to be properly managed and accommodated as they are released and become more widely used on public streets. Proactively working to develop strategies for all new types of innovations will help maximize the benefits of these new technologies for the City. Chapter Four: Reaching Our Destination 57
")


58 Electric Vehicle (EV) Strategy Goods Delivery Strategy Automated Vehicle (AV) Strategy Curbspace Management Strategy 58 4
59 Transportation Technologies and Innovations Strategies Projects and programs related to transportation technologies and innovations include: Electric Vehicle (EV) Strategy: Electric vehicle (EV) is a term used to describe any car that runs on battery power that is rechargeable from the electricity grid. Developing strategies that support, educate, and encourage more EV usage in the City will help reduce the environmental impacts of vehicle travel. Automated Vehicle (AV) Strategy: A citywide AV strategy proactively manages the new technology before it becomes available on public streets. This includes, but is not limited to, developing an AV policy, designating routes or areas where AVs can or cannot operate, adopting rules to govern parking and pick-up/drop-off areas, and managing curb space. AVs, while emerging quickly, are still relatively new to the transportation field, making it difficult to determine how and where the technology will be used. Goods Delivery Strategy: Goods delivery typically refers to the process of delivering goods to predefined locations. A goods delivery strategy will regulate automated delivery services, such as robotic deliveries, and typical goods delivery systems through a proactive designation of loading/unloading zones and enforcement. A comprehensive goods delivery strategy will not only address current delivery systems but also emerging technologies like automated delivery drones, which are unmanned aerial vehicles (UAVs) that can deliver lightweight packages to local destinations. Curbspace Management Strategy: Locations for designated pick-up and drop-off curb space for private shuttle services, such as employer shuttles, and shared ride services, like Lyft, could be determined by current demand and expected future need. Curb space located adjacent to popular designations, like downtown and Redwood City Station, could also be effectively managed through strategies in flexible or scheduled use. Chapter Four: Reaching Our Destination 59

60 Category 7: Transportation Demand Management (TDM) In Redwood City, 73 percent of residents commute by driving alone. Drivealone rates add to severe delays and traffic congestion, among other problems. A variety of programs and strategies, which are collectively referred to as Transportation Demand Management (TDM), influence longterm travel behavior and can reduce the percentage of commuters who drive alone. This is accomplished by providing attractive alternatives to driving alone, raising awareness of these alternatives, and by providing incentives to use them. Per the Bay Area Air Quality Management District, all employers with 50 or more employees are required to offer commuter benefits and participate in the Bay Area Commuter Benefits Program. Building off of this, the City is developing a TDM Plan to reduce the number of residents and employees who drive alone to work. The TDM Plan will also include a framework for establishing a Transportation Management Association (TMA), which is a member-controlled, non-profit organization that provides transportation services within a specific area. The proposed TDM Plan is attached in Appendix E. 60 4

61 Shuttle Service Rideshare/Carshare Bikeshare Carpool/Vanpool Guaranteed Ride Home Bicycle Facilities Last-Mile Connection to Transit Reduced Parking Paid Parking Chapter Four: Reaching Our Destination 61
62 TDM Measures TDM programs and strategies to reduce dependence on single-occupancy vehicles include: Guaranteed Ride Home: People who choose to use transit, carpools, or vanpools are guaranteed a ride home by their employer in case of emergency or if they need to work late, which helps to reduce concerns about not having a car at work. Shuttle Service: Operation of a shuttle service to nearby rail and transit stations and possibly to midday destinations makes it easier for people to use transit to get to work. Rideshare/Carshare: People who bike or walk or use transit, carpools, or vanpools can hail a rideshare vehicle or utilize a carshare vehicle located nearby, which helps to reduce concerns and inconveniences of not having a vehicle. Bikeshare: Bikeshare is a program that allows users to pick up bicycles at one location and return it to another location within the service area. A bikeshare program provides people with bicycles and potentially bicycle helmets that can help eliminate trips made by car during the day. Carpool/Vanpool: Ride-matching programs help carpools and vanpools to form by matching drivers and passengers and providing preferential parking. These programs reduce congestion by increasing the number of people in vehicles. Bicycle Facilities (Infrastructure Improvements/Parking): Improving bicycle infrastructure by filling in gaps in the network, upgrading existing facilities, and creating a low-stress bicycle network, providing bike parking, or installing wayfinding signage helps support bicycle riders and encourages more people to travel by bicycle. Last-Mile Connection to Transit: Shuttles or rideshare services, like Lyft, can be used as a last-mile strategy to get a group of people from a major transit stop to the employer location or home, making it easier for people to use transit even if they don t live or work close to a transit station or stop. Flexible Work Hours: Employees set or modify their arrival and departure times, which can provide the flexibility people need to use alternative modes. Telecommuting: Telecommuting allows employees to work from home or other locations, including coffee shops, co-working spaces, and libraries, via telephone, , and on-line meetings. Telecommuting reduces trips made to an employer site. Reduced Parking: When combined with companion TDM measures, reduced parking discourages drive-alone commuting by limiting parking options. Paid Parking: Charging money for parking requires the user to consider the cost of driving, which includes parking, and will encourage people to use an alternative mode to driving alone. 62 4

63 Performance Measures and Prioritization Process Redwood City s transportation investments were prioritized through an assessment of relevant and preferred performance measures. Performance measures were developed based on the City s Strategic Plan, input from the City and community members, Fehr & Peers Active Transportation Performance Measures manual, and comparable cities transportation system performance measures. The prioritization process assigns each project a score (1 to 5) based on the project s ability to help achieve each performance measure. Projects with the highest scores are projects that will have the greatest impact in achieving the City s long-term mobility goals. Chapter Four: Reaching Our Destination 63
64 PERFORMANCE MEASURES AND PRIORITIZATION PROCESS Project Sources: General Plan Precise Plans Ongoing Transportation Planning Projects RWCmoves Existing Conditions RWCmoves Community Outreach 120+ Projects Project Costs: Low (up to $100k) Medium ($100k to $750k) High (more than $750k) Signature Projects Project Categories: Active Transportation Corridors Complete Street Corridors and Placemaking Transit Accessibility and Service Enhancements Roadway Congestion and Delay Improvements Network Gap Closure, Connectivity and Safety Transportation Technologies and Innovations Transportation Demand Management (TDM) Performance Measures and Performance Criteria: Increases safety for all travel modes Improves overall public health and minimizes environmental impacts Promotes attractive, well-designed streets through placemaking, public art, and improved landscaping Improves pedestrian facilities and street quality Improves bicycle facilities and street quality Improves access to transit and enhances multimodal connectivity Increases the share of people who walk, bike and take transit Increases person throughput and proactively manages traffic congestion Accommodates all users, including people with disabilities, low-income, and the young and elderly, with equal access to goods and services. Project applies current design standards and is feasible and constructible Project has a positive return on investment Qualitative score of 1-5 based on expected safety benefit Qualitative score of 1-5 based on expected health and environmental benefits, including reduced vehicle miles travelled (VMT) Qualitative score of 1-5 Score of 1-5 based on Active+ walking demand score Score of 1-5 based on Active+ bicycling demand score Score of 1-5 based on potential to improve transit ridership and improve network connectivity Score of 1-5 based on potential to increase non-auto mode split Score of 1-5 based on potential to increase person capacity and reduce person-delay Score of 1-5 based on project proximity MTC-designated Communities of Concern and Priority Development Areas Qualitative score of 1-5 based on expected project feasibility Qualitative score of 1-5 based on expected project benefits in relation to costs Total Evaluation Score 64 4
65 Projects are rated on the following 11 performance measures: Increases safety for all travel modes Improves overall public health and minimizes environmental impacts Promotes attractive, well-designed streets through placemaking, public art, and improved landscaping Improves pedestrian facilities and street quality Improves bicycle facilities and street quality Improves access to transit and enhances multimodal connectivity Increases the share of people who walk, bike and take transit Increases person throughput and proactively manages traffic congestion Accommodates all users, including people with disabilities, low-income, and the young and elderly, with equal access to goods and services. Project applies current design standards and is feasible and constructible Project has a positive return on investment The remainder of this section defines each performance measure that Redwood City will use to prioritize projects. In addition, the performance measures will also monitor the performance of the overall transportation system over time. The process for updating project rankings every 2-3 years is included in Chapter 5. Performance Measure 1: Increases Safety for All Travel Modes Projects are measured on their expected safety benefit for all travel modes. Safety ranks as a top priority for many in Redwood City and is an important factor in creating a sustainable transportation network. Vision Zero, adopted by many cities around the world, is an approach to street safety that aims to achieve a transportation system with no fatalities or serious injuries. Redwood City has not adopted an official Vision Zero policy, but will continue to evaluate safety for all modes by tracking collisions and the details surrounding them, including where they occurred, when they occurred, who was involved, and what precipitating actions led to the crash. The frequency of severe collisions or collisions involving vulnerable populations, such as children and seniors, will also be monitored. Redwood City will also consider the risk of future collisions in evaluating projects by assessing surrounding built environment and traffic conditions. Anticipated collision risk or severity reduction is often determined based on vehicle volumes and speed, as well as the frequency with which a pedestrian or bicyclist interacts with vehicles. Projects that improve safety for all travel modes will receive a higher score under this performance measure. Performance Measure 2: Improves Overall Public Health and Minimizes Environmental Impacts Projects are measured based on a project s potential to increase health and environmental benefits, and its potential to reduce vehicle miles traveled (VMT). Transportation projects and programs have the ability to influence public health outcomes through their effects on individual activity and the natural environment. Active transportation investments can promote Chapter Four: Reaching Our Destination 65
66 healthier lifestyles through increased access to physical activity and reduced exposure to pollutants. Redwood City can measure environmental impacts by tracking the average VMT by City residents. The California Governor s Office of Planning and Research (OPR) will soon require projects to assess a project s impact on the City s VMT. Projects that minimize the environmental impacts of transportation per capita will receive a higher score under this performance measure. Performance Measure 3: Promotes Attractive, Well-Designed Streets through Placemaking, Public Art, and Improved Landscaping Projects are measured based on a project s contribution to improved urban design and placemaking. Redwood City wants to create vibrant and welcoming public spaces for people to live, work, and play through transportation projects and programs. When located in public spaces, public art and events can serve as attractions that residents and visitors gather around. These relate to active transportation and the need for attractive and well-designed streets because many visitors arrive on foot or by bicycle and take part in the festivities by walking around. Projects that promote attractive and well-designed streets for people will receive a higher score under this measure. Performance Measure 4: Improves Pedestrian Facilities and Street Quality The quality of Redwood City s walking network is another measure by which the City assesses the transportation system performance. Projects that include pedestrian enhancements are measured based on the walking potential in a particular project location. Pedestrian projects are evaluated based on the Fehr & Peers Active+ walking demand score in the City (see Appendix B). The Active+ tool reports Redwood City s pedestrian demand using a geographic interface system (GIS) analysis. The pedestrian demand analysis considers existing activity levels (using Census Data), important attractors (transit, commercial corridors and districts, regional attractions, and major schools, employers and services), existing infrastructure support, and deficiencies (barriers and gaps, lack of facilities, collision rates). The Active+ tool assesses various geographic areas (i.e. street segments, intersections) in terms of their intrinsic potential to attract a specific level of walking activity. Using this approach, projects with higher walking potential in a particular project location will receive a higher score. Performance Measure 5: Improves Bicycle Facilities and Street Quality The quality of Redwood City s bicycle network is a measure by which the City assesses the transportation system performance. Projects that include bicycle enhancements are measured based on the biking potential in a particular project location. Pedestrian projects are evaluated based on the Fehr & Peers Active+ biking demand score in the City (see Appendix B). The Active+ tool reports Redwood City s bicycle demand using a GIS analysis. The bicycle demand analysis considers existing activity levels (using Census Data), important attractors (transit, commercial corridors and districts, regional attractions, and major schools, employers and services), existing infrastructure support, and deficiencies (barriers and gaps, lack of facilities, collision rates). The Active+ tool assesses various geographic areas (i.e. street segments, intersections) in terms of their intrinsic potential to attract a specific level of bicycling activity. Using this approach, projects with higher biking potential in a particular project location will receive a higher score. 66 4
67 Performance Measure 6: Improves Access to Transit and Enhances Multimodal Connectivity Evaluating pedestrian and bicycle access to transit and amenities near transit stations (first/last three-mile access) is a measure by which the City assess the transportation system performance. Identifying gaps in the multimodal transportation system helps prioritize those opportunities to improve connectivity throughout the City. The extent to which projects close gaps in the existing multimodal network, accommodate first/last three-mile access to transit, and provide links to existing trails or other facilities can also be tracked over time. Projects with the potential to increase transit ridership and improve multimodal network connectivity will receive a higher score under this measure. Performance Measure 7: Increases the Share of People Who Walk, Bike and Take Transit Mode split is an indicator of the presence and quality of bicycle, pedestrian, transit, and vehicular networks in Redwood City. Tracking travel behavior through overall volumes, ridership, and mode split in the City will be used to generate system-wide vehicle, bicycle, and pedestrian miles travelled over time. The City will incorporate mode split data into the evaluation process in order to identify multimodal projects and invest in opportunities to encourage non-auto travel modes. Under this approach, projects with the potential to increase non-auto mode splits will receive a higher score. Performance Measure 8: Increases Person Throughput and Proactively Manages Traffic Congestion Vehicular level-of-service (LOS) is often used to assess vehicular mobility. Travel times on key corridors indicates if the City is proactively managing traffic congestion. Redwood City can also work towards increasing person throughput by tracking pedestrian, bicyclist, transit and vehicular throughput and delay at key hotspots. Projects with the potential to increase person capacity and reduce person-delay will receive a higher score under this measure. Performance Measure 9: Accommodates All Users, Including People with Disabilities, Low-Income, and the Young and Elderly, with Equal Access to Goods and Services Access to transportation options is not equal across all populations. Data from MTC-designated Communities of Concern (CoC) and Priority Development Areas (PDA) are used as a metric for evaluating equity. Communities of Concern are identified by census tract according to eight disadvantage factors: minority and low-income residents, non-english language speaking and zero-car households, seniors age 75+, persons with a disability, single-parent households, and cost-burdened renters. Using this approach, scoring for equity would be based on a project s location within a CoC and/or a PDA (see Appendix B). Chapter Four: Reaching Our Destination 67
68 Performance Measure 10: Project Applies Current Design Standards and is Feasible and Constructible In keeping with the state of the practice, all improvements should apply design standards that are current at the time of the implementation. Furthermore, the feasibility and constructability of a project are important criteria to consider, because if the project or program is infeasible or difficult to construct, then it will be difficult to implement. Project feasibility can be related to right-of-way constraints, jurisdictional responsibilities, costs, and other considerations. Projects are scored based on the expected project feasibility and compliance with current standards. Generalized Project Costs Order of magnitude project costs are beneficial in identifying the largest scale transportation improvements and generating a high-level understanding on available funding need to complete the project. Estimated project costs are assigned to each project as low (up to $100,000), medium ($100,001 to $750,000) or high (more than $750,001), and Signature Projects, which are projects that include major changes to infrastructure. Figure 17 shows the proportion of projects by cost. The majority of projects and programs included as part of RWCmoves are estimated to cost below $750,000 to implement. Performance Measure 11: Project has a Positive Return on Investment Figure 17: Division of Project List by Order of Magnitude Cost Projects are evaluated on whether they will provide a positive return on investment. Project costs and benefits are qualitative estimates based on project descriptions. A future cost-benefit analysis would be required for each project to more-accurately determine expected return on investment. Under this measure, the expected project costs are weighted against project benefits. Projects with more benefits in relation to costs receive a higher score. Signature Projects 9% High: $751k+ 13% Low: Up to $100k 31% Medium: $ k 47% 68 4
69 First Cut of Tier 1 Projects and Programs Projects with the greatest impact in achieving the City s long-term mobility goals are categorized as Tier 1 Projects. Tier 1 Projects (as shown in Table 2) are organized into three categories: Top Scoring Projects, Early Investment Projects, and Neighborhood Priority Projects. These subcategories help to ensure projects considered to be Tier 1 received the highest evaluation scores, but also did not exclude projects that can be easily implemented and/or key projects dispersed and equally distributed throughout the City. Key attributes considered for each subcategory are described below. Top Scoring Projects Top Scoring Projects are the projects that received the highest evaluation scores of all RWCmoves projects. Top Scoring Projects are all projects scoring at least 48 out of 55 total points possible. RWCmoves includes four Top Scoring Projects. Early Investment Projects Early Investment Projects are those scoring at least 30 out of 55 total points, identified to be low in cost (below $100,000), applies current design standards and are feasible for construction. RWCmoves includes seven Early Investment Projects with scores ranging from 32 to 42. Neighborhood Priority Projects Neighborhood Priority Projects are key projects located outside of areas with a lot of activity, such as in a downtown area, that provide benefits to surrounding neighborhoods and the City as a whole. It is common for higher scoring projects to be located near more densely populated areas with better access to pedestrian, bike and transit facilities. To help ensure a more equitable distribution of the City s investments, Neighborhood Priority Projects were separately evaluated within each of the City s zip codes. Each zip code received two to three projects. RWCmoves includes eight Neighborhood Priority Projects with scores ranging from 36 to 41. Chapter Four: Reaching Our Destination 69
70 Table 2: RWCmoves First Cut of Tier 1 Projects and Programs Number Title Description Category Cost Range Tier 1: Top Scoring Projects Downtown Precise Plan Implementation: New Downtown Street Connections Establish plan lines for the following new street segments that would be constructed as redevelopment occurs: New lane parallel to and south of railroad tracks between Broadway and Jefferson Avenue. The El Camino Real Corridor Plan is currently developing a comprehensive plan that El Camino Real Corridor Plan consolidates the recently-rezoned areas along El Camino Real and incorporates Implementation - Short and Long community benefits, design guidelines, and streetscape improvements to address all Term Project users of the corridor. Implementation of short and long term transportation improvements would be covered under this project. 23 Bicycle Master Plan 54 Complete Streets Design Guidelines Tier 1: Early Investment Projects Fair Oaks Community School Safe Routes to School Middlefield Road (between Broadway and Winslow Street, also known as Theatre Way) Corridor Improvements 118 Crosswalk Program Develop stand alone Bicycle Master Plan for Redwood City. The Bicycle Master Plan would provide a more detailed analysis of existing conditions for bicyclists, and recommend projects and programs aimed specifically at increasing bicycle ridership in the City. Develop and regularly apply Redwood City's Complete Streets Design Guidelines. Guidelines would incorporate industry best practices, such as recommendations from the National Assocaition of City Transportation Officials (NACTO), and also be tailored to meet the City's local needs and desires. Support San Mateo County's efforts to implement recommended projects and programs at Fair Oaks Community School from the Redwood City Safe Routes to School Report (2013). Develop plans and construct Theatre Way as a permanent pedestrian street. Develop formal crosswalk program to manage and maintain crosswalks in the City, and identify policies for striping new crosswalks based on citizen requests, pedestrian demand and other City priorities. Network Gap Closure, Connectivity and Safety Complete Street Corridors and Placemaking Active Transportation Corridors Complete Street Corridors and Placemaking Network Gap Closure, Connectivity and Safety Complete Street Corridors and Placemaking Network Gap Closure, Connectivity and Safety Score (Max 55) Medium: $ k 50 Medium: $ k 49 Medium: $ k 48 Low: up to $100k 48 Low: up to $100k 42 Low: up to $100k 41 Low: up to $100k
71 Table 2: RWCmoves First Cut of Tier 1 Projects and Programs Number Title Description Category Cost Range 125 On-Street Bicycle Parking Downtown Expansion 119 Update ADA Transition Plan 69 Transit Access Improvements 79 Jefferson Avenue Operational Analysis Tier 1: Neighborhood Priority Projects 94 Holly Street Bicycle and Pedestrian Overcrossing 4 Brewster Avenue Cycle Track 5 James Street Cycle Track 38 Alameda de las Pulgas Complete Streets Project Expand on-street bicycle parking in retail areas, near important public facilities, and at various high bicycle demand locations in the Downtown area. Update the City's existing ADA Transition Plan to include all public rights of way and identify prioritization process for improving accessibility of curb ramps and sidewalks. Collect inventory, design, and construct accessibility improvements to transit stops throughout Redwood City to meet current ADA requirements. Evaluate traffic operations on Jefferson Avenue, between Veterans Boulevard and El Camino Real. Design improvements to reduce delays associated with special events, high pedestrian volumes at Broadway/Jefferson Avenue, and exiting the Jefferson Parking Garage while maintaining a high level of safety for people crossing the street. Support the City of San Carlos' project to construct a bicycle and pedestrian bridge over US 101 at, or near, Holly Street. Evaluate, design and install cycle track (Class IV) along Brewster Avenue from Main Street to Fulton. Design and install cycle track (Class IV) along James between Redwood City Station and proposed bicycle boulevard network at Elwood Street and Duane Street. Evaluate and design streetscape improvements to reduce vehicle speeds and to increase safety for people walking along and crossing the street. Transportation Demand Management (TDM) Network Gap Closure, Connectivity and Safety Transit Accessibility and Service Enhancements Roadway Congestion and Delay Improvements Network Gap Closure, Connectivity and Safety Active Transportation Corridors Active Transportation Corridors Complete Street Corridors and Placemaking Score (Max 55) Low: up to $100k 41 Low: up to $100k 40 Low: up to $100k 39 Low: up to $100k 32 High: $751k+ 43 Medium: $ k 41 High: $751k+ 41 Medium: $ k 41 Chapter Four: Reaching Our Destination 71
72 Table 2: RWCmoves First Cut of Tier 1 Projects and Programs Number Title Description Category Cost Range Hawes Community School Safe Routes to School Massachusetts Avenue Corridor Improvements Redwood Shores Parkway Corridor Improvements Design and construct "Medium" priority improvements from the Redwood City Safe Routes to School Report (2013). Improvements include installing high-visbility crosswalks and enhancing curb ramps to meet ADA requirements, upgrading bike parking, and installing roadway signage and striping. Evaluate, design, and install roadway modifications to reduce vehicle speeding and to increase safety for people crossing Massachusetts Avenue, between Woodside Road and Alameda de las Pulgas. Study potential to reduce Redwood Shores Parkway from 6 to 4 lanes, depending on volumes, to accommodate bicycle and pedestrian improvements, such as one-way separated bikeways. Consider PHB-enhanced staggered crossing at Electronic Arts office midblock desire line, in line with footpath (stagger so that pedestrians face traffic). Install marked crosswalks on 4th leg, crossing enhancements and pedestrian refuge islands at Redwood Shores Parkway/Shoreline Drive, Redwood Shores Parkway/Twin Dolphin Drive, and Redwood Shores Parkway/Electronic Arts Drive. Install Class I (potential Class IV) bike path along Redwood Shores Parkway between the Electronic Arts entrance path and Twin Dolphin Drive, and provide connection to nearby Bay Trail. Provide a Class I path and crosswalk enhancements along Twin Dolphin Drive. Consider protected intersections at Redwood Shores Parkway/Twin Dolphins Drive, Redwood Shores Parkway/Electronic Arts Drive, and Redwood Shores Parkway/ Shoreline Drive. Network Gap Closure, Connectivity and Safety Network Gap Closure, Connectivity and Safety Complete Street Corridors and Placemaking Score (Max 55) Medium: $ k 41 Low: up to $100k 41 High: $751k
73 Table 2: RWCmoves First Cut of Tier 1 Projects and Programs Number Title Description Category Cost Range 44 Bay Road and Florence Street Corridor Improvements Source: Fehr & Peers, 2017 Retime signal and install protected signal phasing (eastbound and westbound), and an additional westbound through-lane at Woodside Road/Bay Road. Study feasibility of a single lane roundabout at Bay Road/Charter Street, Bay Road/Fifth Avenue, and Bay Road/Douglas Avenue. Construct a traffic circle at Florence Street/17th Avenue. Install bulb-outs at all corners of Bay Road/Second Avenue. Install east leg high-visibility pedestrian crossing and RRFB at Bay Road/Eighth Avenue. Install Rectangular Rapid Flashing Beacon (RRFB) at east leg crosswalk at Bay Road/ Tenth Avenue. Consider proposed road closure at Bay Road/Spring Street. Stripe Class II bike lanes on eastbound Bay Road between Fourth Avenue and 15th Avenue, and on Florence Street between 15th Avenue and 17th Avenue. Install entry welcome signs at Bay Road/Second Avenue and Bay Road/Spring Street (specific location requires City s or County s process of approval). Complete Street Corridors and Placemaking Score (Max 55) Medium: $ k 36 Chapter Four: Reaching Our Destination 73

74 First Cut of Signature Projects and Programs Signature Projects include major changes to infrastructure, such as railroad grade separations, redesigned interchanges, or new transit services and stations. These projects represent some of the larger and more complex concepts identified during development of the Plan. RWCmoves includes 11 Signature Projects with scores ranging from 40 to 52, which are listed in Table 3 along with their project description, category, and cost rages. Several Signature Projects support construction for full railroad grade separations at various locations throughout the City. Due to the scale and complexity of these Signature Projects, a feasibility study would be required as a next step by the City to determine each project s practicality and evaluate potential design concepts. RWCmoves recommends two separate feasibility studies be conducted to evaluate options for full railroad grade separation in the City. The division of scope for these feasibility studies was determined based on a project s location and proximity to adjacent at-grade rail crossings. One feasibility study would review the Whipple Avenue, Brewster Avenue and Marshall Street-Broadway Railroad Grade Separation project locations, while the other would evaluate the Main Street, Chestnut Street and Maple Street Railroad Grade Separation project locations. These railroad grade separation feasibility studies are noted in Table 3 as the next step towards implementing full grade separations in Redwood City. 74 4
75 Table 3: RWCmoves First Cut of Signature Projects and Programs # Project Description Next Steps Category Cost Range Evaluation Score Railroad Grade Separation Signature Projects Whipple Avenue Railroad Grade Separation Brewster Avenue Railroad Grade Separation Marshall Street - Broadway Railroad Grade Separation Support construction of Whipple Avenue and railroad grade separation. Support construction of Brewster Avenue and railroad grade separation. Support construction of Main Street and railroad grade separation. Railroad Grade Separation Feasibility Study Network Gap Closure, Connectivity and Safety Network Gap Closure, Connectivity and Safety Network Gap Closure, Connectivity and Safety Signature Projects 46 Signature Projects 45 Signature Projects Main Street Railroad Grade Separation Chestnut Street Railroad Grade Separation Maple Street Railroad Grade Separation Support construction of Marshall Street - Broadway and railroad grade separation. Support construction of Chestnut Street and railroad grade separation. Support construction of Maple Street and railroad grade separation. Railroad Grade Separation Feasibility Study Network Gap Closure, Connectivity and Safety Network Gap Closure, Connectivity and Safety Network Gap Closure, Connectivity and Safety Signature Projects 42 Signature Projects 41 Signature Projects 41 Other Signature Projects Redwood City Transit Center: Implement Short Term Improvements Broadway Street Streetcar Project: Phase II Design and implement short to medium-term enhancements to the Redwood City Transit Center to improve bus operations and facilitate intermodal transfers. For example, provide long-term bicycle parking, such as a bike station, at Redwood City Transit Center. The Broadway Streetcar Study is currently assessing the feasibility of a Broadway Streetcar line. Next steps would include completing Environmental Clearance and Engineering Design. Proceed with Project Design Transit Accessibility and Service Enhancements Transit Accessibility and Service Enhancements Signature Projects 52 Signature Projects Long Term Vision for Downtown Transit Center and Redwood City Station Develop a long term vision and conceptual design for Downtown Transit Center and Redwood City Station that is compatible with proposed rail and Bus Rapid Transit (BRT) service on Dumbarton Corridor. Conduct Long Term Vision Study Transit Accessibility and Service Enhancements Signature Projects US 101 and Woodside Road Interchange Improvements Construct US 101 and Woodside Road interchange improvements. Secure Funding Roadway Congestion and Delay Improvements Signature Projects Commuter Ferry Service Coordinate with San Francisco Water Emergency Transportation Authority (WETA) to design, construct, and operate ferry service. Design and construct ferry service. Conduct Ferry Service Study Transit Accessibility and Service Enhancements Signature Projects 38 Source: Fehr & Peers, 2017 Chapter Four: Reaching Our Destination 75

76 5 To Chapter Five Where Do We Go From Here? (Action Plan/Implementation) advance RWCmoves transportation program, the City will need to take several implementation actions. These include General Plan Amendments to align the City s General Plan policies and programs with those identified for RWCmoves. They also include identifying a funding strategy to ensure that the City s vision for its transportation future come to fruition. Within the implementation plan is a recognition that transportation projects, technologies, and funding sources will change over time, and thus the plan should be updated every two to three years to allow the plan to evolve as the City grows. Modified General Plan Policies and Programs Redwood City s General Plan lays the groundwork for the Citywide Transportation Plan and generally includes policies and programs that support the vision and goals of RWCmoves. However, some updates to the General Plan will likely be necessary to ensure complete consistency with RWCmoves. Table 4 below, describes the primary General Plan transportation policies that should be amended as part of RWCmoves to further support its transportation goals. While Table 5 highlights major policies that should be revised, a careful review of all General Plan policies should also be conducted to incorporate any minor edits to fine-tune the policies in the General Plan. 76 5
77 Table 4: Recommended General Plan Policy Amendments 2010 General Plan Policy Number BE-25.3 BE-26.2 BE BE 29.5 BE 29.6 Policy Text Support using the concept of complete streets to design, construct, operate, and maintain City and private streets to enable safe, comfortable, and attractive access and travel for pedestrians, bicyclists, motorists, and transit users of all ages, abilities, and preferences. Develop and maintain comprehensive master plans for the citywide bicycle and pedestrian networks to identify short- and long-range policies, programs, and improvement projects that will improve walking and bicycling. Prioritize implementation of pedestrian and bicycle improvements near schools, transit, shopping, hospitals, and mixed-use areas with higher pedestrian concentrations. Support re-evaluation of the City s Level of Service (LOS) policies for motor vehicle circulation to ensure efficient traffic flow and balance multi-modal mobility goals. Develop a new Level of Service (LOS) policy for Downtown that includes the following components: Emphasis on pedestrian and bicycle access and circulation Maintenance of appropriate emergency vehicle access and response time Support for reduced vehicle miles traveled Considers, but does not deem, auto congestion Downtown to be an impact Proposed Amendment Support using the Implement a complete streets policy to design, construct, operate, and maintain City and private streets to enable safe, comfortable, and attractive access and travel for pedestrians, bicyclists, motorists, and transit users of all ages, abilities, and preferences. Develop and maintain implement a Bicycle Master Plan and Pedestrian Master Plan comprehensive master plans for the citywide bicycle and pedestrian networks to identify short- and long-range policies, programs, and improvement projects that will improve walking and bicycling. Prioritize implementation of pedestrian and bicycle improvements near schools, transit, shopping, hospitals, and mixed-use areas with higher pedestrian concentrations by updating the City s pedestrian and bicycle Active+ models every two years. Support re-evaluation of the City s Level of Service (LOS) policies for motor vehicle circulation to ensure efficient traffic flow and balance multi-modal mobility goals. Develop a new Level of Service (LOS) policy for Downtown that includes the following components: Emphasis on pedestrian and bicycle access and circulation Maintenance of appropriate emergency vehicle access and response time Support for reduced vehicle miles traveled Considers, but does not deem, auto congestion Downtown to be an impact BE 29.NEW N/A - New Policy to support General Plan and RWCmoves policies. Mobility Evaluation. Develop new guidelines that effectively evaluate mobility for all modes of transportation. The guidelines should consider the following: Remove minimum vehicular LOS standards (i.e. LOS D) as the primary measure for impact assessment Evaluate Mode Split Goals and Vehicle Miles Traveled (VMT) to assess mobility in Redwood City. Only consider vehicle and multimodal LOS operations as a means to evaluate site specific effects of added traffic and to identify potential improvements Implement the TIA Guidelines in Appendix A to evaluate the project access points, and connectivity to the existing adjacent bicycle, pedestrian, vehicle, and transit facilities. BE-31.4 Support implementation of a citywide or areawide TDM program. Support Implementation of a citywide or areawide TDM program and formation of Transportation Management Association (TMA) as outlined in Appendix E. In addition to the policies, the City s General Plan includes a number of implementing programs to support its policies. Several of the programs would also need to be amended, and new ones would need to be adopted, as part of RWCmoves implementation. The proposed amended and added programs are outlined in Table 5. As with General Plan policies, a careful review of all existing General Plan programs should be conducted to incorporate any minor edits to fine-tune the General Plan s programs. Chapter Five: Where Do We Go From Here? 77
78 Table 5: Recommended General Plan Implementation Program Amendments 2010 General Plan Program Number BE-39 BE-55 Program Text Transportation Funding Prioritization. Develop an overall policy to prioritize funding and timing for implementing transportation improvements. Consider prioritizing multimodal projects that provide the most benefit to all users. Also, account for other potential funding sources where feasible. Level of Service Policy Evaluation. Evaluate Redwood City s current Level of Service (LOS) policies for motor vehicle circulation. The evaluation shall consider the following to ensure efficient traffic flow and balance multimodal mobility goals: Maintaining LOS D or better for motor vehicles in all areas of the City, except the Downtown area as defined by the Downtown Precise Plan. In Downtown, no minimum vehicular LOS standard will be maintained but vehicular LOS will be calculated and alternate LOS standards for other travel modes will be established. Explore other areas of the City where vehicular LOS standard would either be lowered or eliminated. These areas may include gateway intersections providing access into the City, freeway ramps, or along Transit streets including the proposed streetcar corridors. Consider the effect of potential mitigation measures to improve vehicle LOS on the operations of other travel modes. Evaluate the potential for elimination of vehicle LOS as the primary measure of impact assessment for developments in parts or the entire City. Proposed Amendment Transportation Funding Prioritization. Develop an overall policy Implement the performance measures for RWCmoves to prioritize funding and timing for implementing transportation improvements. Consider prioritizing multimodal projects that provide the most benefit to all users. Also, account for other potential funding sources where feasible Level of Service Policy Evaluation. Evaluate Redwood City s current Level of Service (LOS) policies for motor vehicle circulation. The evaluation shall consider the following to ensure efficient traffic flow and balance multimodal mobility goals: Maintaining LOS D or better for motor vehicles in all areas of the City, except the Downtown area as defined by the Downtown Precise Plan. In Downtown, no minimum vehicular LOS standard will be maintained but vehicular LOS will be calculated and alternate LOS standards for other travel modes will be established. Explore other areas of the City where vehicular LOS standard would either be lowered or eliminated. These areas may include gateway intersections providing access into the City, freeway ramps, or along Transit streets including the proposed streetcar corridors. Consider the effect of potential mitigation measures to improve vehicle LOS on the operations of other travel modes. Evaluate the potential for elimination of vehicle LOS as the primary measure of impact assessment for developments in parts or the entire City. New-1 N/A - New Program to support General Plan and RWCmoves policies. Vision Zero. Adopt a Vision Zero policy and create a Vision Zero Plan to develop a framework to reduce collisions in Redwood City. New-2 N/A - New Program to support General Plan and RWCmoves policies. Curbside Management. Develop and implement curbside management strategies to allow for efficient and safe use of TNCs and other on-demand transit services. New-3 N/A - New Program to support General Plan and RWCmoves policies. On-Demand Transit Service Pilot Program. Develop and implement an on-demand responsive pilot program with service provided by a TNC vendor. New-4 N/A - New Program to support General Plan and RWCmoves policies. Automated Vehicle Management. Develop and implement automated vehicle management strategies to allow and accommodate for automated vehicle technology in ways that provide a net benefit to the public. New-5 N/A - New Program to support General Plan and RWCmoves policies. Electric Vehicle Encouragement. Develop and implement electric vehicle (EV) encouragement programs that educate and incentivize and support use of EVs. New-6 N/A - New Program to support General Plan and RWCmoves policies. Robot/Drone Delivery. Develop and implement robot and drone delivery management strategies to allow and accommodate for automated delivery technologies in ways that provide a net benefit to the public. 78 5

79 Street Typologies and Transportation Engineering Standards and Design Guidelines This section provides an update to Redwood City s street typologies and recommends modifications to the City s engineering standards to align with current best practices. Proposed Street Typology Updates To ensure a balanced, multi-modal transportation network, the Redwood City General Plan organizes streets and other transportation facilities according to typologies that consider the context and prioritize different travel modes for each street. The following updated street typologies are identified for the City as part of RWCmoves. These updated typologies build upon those identified in the current General Plan, but incorporate elements of the National Association of City Transportation Officials (NACTO) Urban Street Design Guide, which are based on the principle that streets are public spaces for people as well as roadways for traffic and transportation. Chapter Five: Where Do We Go From Here? 79
80 BOULEVARD (Through Routes) Not to scale Sidewalk 8-10 Parking or Loading 7-8 Bike Lane 5 min with 2 min buffer Travel Lane Travel Lane 11 Median 6 min Travel Lane 11 Travel Lane Bike Parking Lane or Loading 5 min 7-8 with 2 min buffer Sidewalk 8-10 Boulevard Boulevards are major roadways that typically have four to six travel lanes and accommodate larger vehicle volumes, while providing wide sidewalks and dedicated bike facilities (such as bike lanes and cycle tracks). Creating an inviting corridor for all roadway users, helps to encourage development and increases commercial activity along corridors originally solely developed for cars. These streets serve as primary routes to destination within the community or through the City. As such, Boulevards are focused on ensuring person throughput, not only for cars and trucks, but also for pedestrians and bicyclists. Design elements may include: Enhanced bike lanes or cycle tracks, including the use of green paint at potential conflict points Using lane striping and narrow lane widths to create the illusion of a more compact corridor, thereby reducing vehicle speeds, collision severity, and increasing safety for all users Refuge islands and curb bulbs to reduce crossing distance for people walking and biking Raised sidewalks and curb bulbs at crossings of frontage roads Speed limits are typically 35mph to maintain vehicle throughput Transit priority signal and other features Example Boulevards include El Camino Real, Veterans Boulevard, and Woodside Road. 80 5
81 CONNECTOR (with Parking) CONNECTOR (with Bike Lanes) Not to scale Sidewalk 8-10 Parking 7-8 Travel Lane Travel Lane Parking 7-8 Sidewalk 8-10 Not to scale Sidewalk 8-10 Bike Lane 5 min with 2 min buffer Travel Lane Travel Lane Bike Lane 5 min with 2 min buffer Sidewalk 8-10 Connector This versatile street type is true multi-purpose right-of-way designed to move vehicles of while providing good access for people biking and walking. Connectors generally have two to three travel lanes and provide on-street bicycle facilities or on-street parking, in addition to sidewalks. As right-ofway permits, Connectors may have four travel lanes and/or provide both on-street parking and on-street bicycle facilities. They provide connections to Boulevards or other major through routes in the City. Design elements may include: Accommodations for a wide variety of vehicles Using lane striping and narrow lane widths to create the illusion of a more compact corridor, thereby reducing vehicle speeds, collision severity, and increasing safety for all users Transit signaling and other features seen in transit street Speed limits not to exceed 30mph for safety of people walking and biking Landscaping and other street enhancements Chapter Five: Where Do We Go From Here? 81
82 NEIGHBORHOOD MAIN STREET Loading Zones and Bike Lanes NEIGHBORHOOD MAIN STREET Center-turn Lane and Sharrow Sidewalk 8-12 Loading 7-8 Bike Lane 5-6 Travel Lane Travel Lane Bike Lane 5-6 Parking 16 Sidewalk 8-12 Sidewalk 8-12 Loading 7-8 Travel Lane Center Turn Lane 10 Travel Lane Parking 16 Sidewalk 8-12 Neighborhood Main Street (Downtown Streets) Neighborhood Main Streets are were transportation related to commerce and higher density housing converge into a single corridor where people do business, live, and interact with each other. These streets are typically not used as through routes, but rather serve as destination corridors, with lower traffic speeds, higher pedestrian and bicycle volumes, and frequently turnover of on-street parking. Neighborhood Main Streets have narrower cross-sections that accommodate wider sidewalks and reduced travel lanes (typically two to three travel lanes). Design is focused on providing pedestrian and bicycle access from nearby parking lots/garages and transit centers to the land uses along Neighborhood Main Streets through dedicated facilities, reduced crossing distances, and traffic calming. Design elements may include: Time-limited and/or metered on-street parking to increase parking turnover and ensure availability of parking for business customers Pick up/drop off areas and very short-term parking (for example 5 to 15 minutes maximum) for parcel deliveries or TNC usage Clear wayfinding to longer-term parking On-street commercial loading areas (curbside or in center-turn lane for large vehicles) Mid-block speed humps, pinchpoints, or chicanes to reduce vehicle speeds Mid-block crosswalks to facilitate accessibility Expanded walking spaces and bike lanes Parklets, street cafes, and street furniture Enhanced landscaping and street trees Lower speed limits (20-25mph) Example Neighborhood Main Streets include Bradford Street, Main Street, Marshall Street, Stambough Street, and Winslow Street. 82 5
83 NEIGHBORHOOD Stormwater Management and Traffic Control Not to scale Sidewalk 5-10 Bioswale Travel Lane with Speed Controls 22 Parking 7-8 Sidewalk 5-10 Neighborhood Street Local streets in residential neighborhoods provide transportation space for people to access their living space, recreational opportunities through play, walking, and biking; and offer public areas for neighbors to gather and interact with each other. Designed properly, a neighborhood street can become the meeting space for a group of residents. In addition, these streets should provide easy and safe access between residential and near-by commercial areas, schools, parks, and community centers. These streets typically have two travel lanes and discourage through traffic through traffic calming. Design elements may include: Using lane striping and narrow lane widths to create the illusion of a more compact corridor, thereby reducing vehicle speeds, collision severity, and increasing safety for all users Green stormwater control, infiltration strips, bioswales, and street trees Mid-block speed humps, pinchpoints, or chicanes to reduce vehicle speeds Traffic circles at intersections to reduce vehicle speeds Stop control where appropriate Lower speed limits (15 to 25mph) Chapter Five: Where Do We Go From Here? 83
84 INDUSTRIAL STREET Loading Zones and Parking Not to scale Sidewalk 6 Parking or Loading 8 Travel Lane 12 Travel Lane 12 Parking or Loading 8 Sidewalk Industrial Street Industrial corridors are designed to serve the needs of businesses building and creating products, which requires access by larger and heavier vehicles. Common vehicles often include vans, single unit, and smaller semi-trucks. As Industrial areas tend to be spread out, workers often access them by private vehicle but accommodations should be made for those choosing to walk and bike while transit access comes along major corridors. Industrial Streets maintain medium speeds (30 to 35 mph) and have two to four travel lanes, limited bicycle facilities, and standard pedestrian facilities. Design elements may include: Sharrows and speed humps to provide minimal biking facilities while managing speed for people driving Thicker pavement sections for increased resiliency against heavy, low-speed vehicles Speed limits are typically 30 to 35 mph to maintain vehicle throughput Sidewalks on one or both sides to accommodate people walking Truck aprons to manage vehicle speed and truck turns Layover space for trucks waiting to make deliveries Swales and other surface water treatments to reduce pollution and sediments in runoff 84 5
85 Intersection Design Excess space in intersections encourages people driving to drive at speeds unsuitable to their surroundings. Utilizing excess space, whether by creating a more compact intersection or adding additional amenities, helps reduce vehicle speeds while improving access for all users. Intersections provide traffic control for vehicular flow and serve as key points for people walking and biking to cross streets. In these places where pedestrians and cyclists cross the vehicle travel space, it is pertinent that those crossing the street are given appropriate priority and visibility to drivers. Design elements may include: Protected intersections where appropriate Two aligned/directional curb ramps per crossing (eight total at a four-way intersection) Reduced radius curb to encourage slower turning speeds by people driving Closing slip lanes and removing pork-chop islands to lower speeds and increase visibility for people walking and biking Truck aprons to accommodate larger vehicle turns while encouraging drivers in smaller vehicles to treat the corner as a reduced radius curb. This typically takes the form of a radius curb to allow for movements up to WB-50 with an added 15 radius truck apron to slow passenger vehicles and smaller delivery trucks. A large corner radius (35 ) should not be used to facilitate large trucks turning from right-hand lane to right-hand lane. Restricting right turns in places of high pedestrian volume Squaring up intersections to meet at 90-degree angles where possible to reduce crossing distances and vehicle speeds Reducing curb radius with paint and flexiposts in lieu of rebuilding curb lines Public plazas, temporary spaces, pavement removal, and large street furniture (bollards, planters, etc.) in locations with excess right-of-way at non-square intersections Leading pedestrian walk interval. Pedestrian crossings activate 2 seconds before vehicle lanes receive green to give people walking and biking a chance to cross with the full attention of turning drivers. Bike boxes and green pavement treatments to delineate space for people biking Reduced cycle times to reduce waiting time and frustration for all users Pavement treatments for people walking and biking to properly define and delineate spaces Raised crosswalks Chapter Five: Where Do We Go From Here? 85
86 Proposed Recommendations and Additions to Engineering Standards The following design guides were used as reference materials: National Association of City Transportation Officials (NACTO) Urban Street Design Guide, NACTO Urban Bike Design Guide, Caltrans Highway Design Manual (HDM), Caltrans Standard Plans, and Caltrans Complete Streets as references to urban design practices. Redwood City Current Standards Redwood City s current standards typically reflect those outlined in the Caltrans HDM, Manual on Uniform Traffic Control Devices (MUTCD), or Caltrans Standard Plans and Specifications. Many of the current standards should be updated to reflect more recent guidance that reflects best practices in urban environments. Industry Standards and Best Practices Roadway infrastructure in cities is evolving by placing more emphasis on walking, bicycling, transit use on streets, creating streets that are less dominated by cars and more balanced for multiple modes. However, already developed cities present restrictions to the improvement of roads. NACTO provides recommendations on how existing streets can be improved to better accommodate pedestrians and bicyclists, allowing each mode of transportation to flow more smoothly and safely through a corridor. By improving the infrastructure of all modes of transportation, Redwood City may benefit from safer, more inviting corridors for all users. Lane Widths: Automobile lane widths are often designed within the context of the surrounding land uses, with narrower width in urban, neighborhood, and collector streets to calm traffic and provide room for improved pedestrian, bicycle, and/or transit facilities. Bike Lanes: Bike lanes are often used on wider streets or those with medium to high traffic volumes. On routes with more bicycle and/or vehicle traffic, protected bike lanes are used, which have painted or physical separation between travel lanes and bike lanes. Green-painted lanes are also used to better define bike lanes, especially at intersections. Sidewalk Widths: Wider sidewalks in urban areas or adjacent to streets with wider curb-to-curb width are used to create a friendlier pedestrian environment pedestrian space with amenities, such as benches, trees, and lighting. Design Vehicle: Current practice defines the design vehicles as delivery truck sized vehicles, which provides more design flexibility. Intersections: Compact intersections are those that accommodate all modes of transportation, including pedestrians, vehicles, and cyclists. Some features to consider include striped crosswalks, bike boxes, curb extensions and bulb outs, and signal coordination. Recommended updates to the current Design Guidelines as they relates to each of the street typologies are provided in Table 7. Industry standards and best practices for this study include designs for lane widths, bike lanes, sidewalk widths, design vehicle, grading, and intersections. Standards and practices for each of these are described below: 86 5
87 Table 6: Recommended Design Guidelines by Street Typologies Boulevard Neighborhood Main Connector Neighborhood Industrial Lane width Bicycle treatments 5 min with 2 min buffer On street with traffic calming Multi-use path or adjacent corridor/network On street with traffic calming Sharrows with traffic calming Sidewalk width Design vehicle BUS-40 SU-30 or DL-23 BUS-40 at major intersections DL-23 Varies Example Intersection treatments1 Refuge islands, bike boxes, protected intersections Curb bulbs, communityfocused crosswalks, art Refuge islands, high visibility crosswalks, reduced lane widths Curb bulbs, traffic circles, raised crosswalks Truck aprons, 4-way stops Notes: Source: CDM Smith, See intersection section for full list of treatments Chapter Five: Where Do We Go From Here? 87
88 Network Concept Maps To ensure a balanced, multi-modal transportation network, the Redwood City General Plan organizes streets and other transportation facilities according to typologies that consider the context and prioritize different travel modes for each street. Together, the typologies provide a layered network of complete streets that will accommodate all types of local transportation modes. These street network typologies should serve to guide future transportation studies and improvements, so that they consider relationships to surrounding land uses, appropriate travel speeds, and the need to accommodate multiple travel modes and various users. One of the goals of this plan it to create a walking and bicycling-friendly community that provides a balanced, convenient, and safe transportation system. To support this goal, RWCmoves will strive to implement the transportation network changes illustrated on the following pages. Figure 18 shows the proposed street typologies network, which builds off those established in the General Plan but provides additional priorities for the bicycle network. Figure 19 includes the proposed bicycle backbone network, which is in addition to the City s existing Bikeway Plan. The backbone network recognizes the need to create a low-stress bicycle network that all users of all ages and abilities would be comfortable riding. This backbone network has the potential to create a cohesive, connected bicycle network for all residents to use. Lastly, Figure 20 illustrates proposed truck routes in the City. These routes build of the network changes proposed as part of the street typologies and bicycle backbone network. The intent is to guide trucks over three tons to roadways appropriate for through travel and as close as possible to their destination. 88 5

89 Chapter Five: Where Do We Go From Here? 89
90 Figure 18: Proposed Street Typologies Network B San Francisco Bay B B A C A Shearwater Pkwy Ed gewood R 101 } 82 d Whipple Ave Hopkins Ave Brewster Ave Hudson St Industrial Way Arguello St Jefferson Ave Veterans Blvd Main St Maple St Seaport Blvd Charter St El Camino Real Bay Rd Broadway St 2nd Ave E Bayshore Rd 5th Ave Spring St 101 A 101 M arine Pkwy Redwood Shores Pkwy Farm Hill Blvd Alameda de l as Pulgas Roosevelt Ave Redwood Ave Valota Rd Virginia Ave Woodside Rd } 84 Middlefield Rd Brewster Ave } 82 Arguello St El Camino Real Winslo w St Jefferson Ave Veterans Blvd Main St Maple St C Marshall St Broadway St Middlefield Rd } 82 1 MILE 1 MILE Downtown Redwood City Proposed Street Network 1 MILE Redwood City Limits Sphere of Influence Parks Schools Railroad Proposed Street Network Neighborhood Main Street Connector Street Industrial Street Boulevard Neighborhood Street Figure 18 Proposed Street Typologies Network 90 5
91 Figure 19: Proposed Bicycle Backbone Network B San Francisco Bay B B A Shearwater Pkwy Ed gewood R 101 } 82 d Whipple Ave Hopkins Ave Brewster Ave Hudson St Industrial Way Arguello St Jefferson Ave Veterans Blvd Main St Maple St Seaport Blvd El Camino Real Charter St Bay Rd Broadway St 2nd Ave E Bayshore Rd 5th Ave Spring St 101 A 101 M arine Pkwy Redwood Shores Pkwy Farm Hill Blvd Alameda de l as Pulgas Roosevelt Ave Redwood Ave Valota Rd Virginia Ave Woodside Rd } 84 Middlefield Rd } 82 } 82 1 MILE 1 MILE Redwood City Limits Sphere of Influence Parks Schools Railroad Existing Bicycle Facilities Class I Bicycle Path Class II Bicycle Lane (Enhanced) Class III Bicycle Route Class IV Cycle Track Proposed Bicycle Facilities Class I Bicycle Path Class II Bicycle Lane (Enhanced) Class II Bicycle Lane (Pilot Project) Class III Bicycle Boulevard Class IV Cycle Track Figure 19 Proposed Bicycle Backbone Network Chapter Five: Where Do We Go From Here? 91
92 Main St Figure 20: Proposed Truck Routes San Francisco Bay B B A } Industrial Way Seaport Blvd A B Shearwater Pkwy d Ed gewood R Whipple Ave Hopkins Ave Brewster Ave Hudson St Arguello St Jefferson Ave Veterans Blvd Maple St Charter St El Camino Real Bay Rd Broadway St 2nd Ave E Bayshore Rd 5th Ave Spring St M arine Pkwy Redwood Shores Pkwy Farm Hill Blvd Alameda de l as Pulgas Roosevelt Ave Redwood Ave Valota Rd Virginia Ave Woodside Rd } 84 Middlefield Rd } 82 } 82 1 MILE 1 MILE Redwood City Limits Parks Proposed Truck Routes Figure 20 Sphere of Influence Schools Proposed Truck Routes Railroad Proposed Truck Routes 92 5
93 Ongoing Performance Monitoring Evaluating the City s success in achieving the vision and goals outlined in this document would be done through regular monitoring. Specifically, the City will establish a transportation system monitoring program for each of performance measures outlined in the previous chapter. Table 7 summarizes the strategies to evaluate each performance measure. Following the table is a detailed description of the potential monitoring strategies. Improves Safety for All Travel Modes Annually, the City should update its collision records with Statewide Integrated Traffic Records System (SWITRS) and Transportation Injury Mapping Systems (TIMS) collision data to monitor trends in: Total collisions Collisions involving pedestrians Collisions involving bicyclists Types of collisions Fatal and severe injury collisions Improves the City s Overall Public Health and Minimizes Environmental Impacts Redwood City can measure environmental impacts by tracking the average vehicle miles traveled (VMT) by City residents and employees. The California Governor s Office of Planning and Research (OPR) will soon require projects to assess a project s impact on the City s VMT. VMT could be measured through the development of a citywide travel demand model or the development of an off-model VMT measurement tool. The City should evaluate VMT every two to three years to measure success of this performance measure. Primary Collision Factors Success will be measured through reduction in collision rates for each collision metric evaluated. In addition, creating collision heat-maps could be used to understand spatial trends in collisions throughout Redwood City. Chapter Five: Where Do We Go From Here? 93
94 Table 7: Redwood City Transportation Monitoring Program Strategy Category Community, Health & Safety Improvements Transportation Infrastructure and Multimodal Network Improvements Equity Improvements Monitoring Strategy Performance Measure Level of Monitoring Data Data Source Frequency Effort Improves safety for all travel modes Collision Data SWITRS and TIMS Annually Low Improves the City s overall public health and minimizes environmental impacts Promotes attractive, well-designed streets through placemaking, public art, and improved landscaping Improves pedestrian facilities and network quality Improves bicycle facilities and network quality Improves access to transit and enhances multimodal connectivity throughout the City Vehicle Miles Traveled (VMT) Percent of completed projects that include placemaking, art, improved landscaping Citywide Model or Offmodel tool Project descriptions Every Two to three Years Every Two to three Years Pedestrian Counts Surveys Annually Low Active+ Walking Demand Score Census, transit, and land use data Every Two to three Years Bicycle Counts Surveys Annually Low Active+ Bicycle Demand Score Census, transit, and land use data Every Two to three Years Transit Ridership Caltrain and SamTrans Annually Low Increases mode split for all non-automobile travel modes Mode Split Data Surveys Increases person throughput and proactively manages traffic congestion Accommodates all users, including disabled, low-income, the young and elderly with access to the transportation system as well as to jobs, services and other destinations Project applies current design standards and is feasible and constructible Peak Period Travel Times on Major Corridors (Woodside Road, Middlefield Road, Jefferson/Farm Hill, Whipple) Map Evaluation Travel Time Surveys and volume counts Project Location Every Two to three Years Annually Every Two to three Years City Review City Review Ongoing Low High Low Medium Medium High Medium Low Feasibility and Constructability Project has a positive return on investment Compare project use to original forecasts, compare costs to original estimate City Every Two to three Years Medium Source: Fehr & Peers,
95 Promotes Attractive, Well-Designed Streets Through Placemaking, Public Art, and Improved Landscaping Annually, the City should assess the percent of completed projects that had between three and five points for this performance measure. The goal would be to meet or exceed a set threshold normalized by project cost. Improves Pedestrian Facilities & Network Quality There are two ways in which the City should evaluate its pedestrian facilities and network quality. One is through annual pedestrian counts at set locations through the City. By defining key areas to monitor pedestrian activity, the City over time can monitor increase in pedestrian activity. The assumption is that increased pedestrian network quality will result in increased pedestrian activity. Additionally, every two to three years, the City should update its Active+ maps and demonstrate a percent increase in network coverage that rates between medium and high pedestrian demand area. The premise is that as pedestrian network quality increases, so will the pedestrian demand. Improves Bicycle Facilities & Network Quality There are two ways in which the City should evaluate its bicycle facilities and network quality. One is through annual bicycle counts at set locations through the City. By defining key areas to monitor bicycle activity, the City over time can monitor increase in bicycle activity. The assumption is that increased bike network quality would result in increased bicycle activity. Additionally, every two to three years, the City should update its Active+ maps and demonstrate a percent increase in network coverage that rates between medium and high bicycle demand area. The premise is that as bicycle network quality increases, so will the bicycle demand. Improves Access to Transit and Enhances Multimodal Connectivity throughout the City A key feature to evaluating access to transit is increases in transit ridership. Annually, the City should collect ridership data from Caltrain and SamTrans to report on ridership trends over time, and compare it to regional trends. Increases Mode Split for All Non-Automobile Travel Modes Mode split is an indicator of the presence and quality of bicycle, pedestrian, transit, and vehicular networks in Redwood City. Tracking travel behavior through overall volumes, ridership, and mode split in the City will be used to generate system-wide vehicle, bicycle, and pedestrian miles traveled over time. Mode split data can be collected through surveys at driveways, key gateways into/out of the City, and even residential surveys. The City should monitor success every two to three years. Chapter Five: Where Do We Go From Here? 95
96 Increases Person Throughput and Proactively Manages Traffic Congestion Travel times on key corridors indicates if the City is effectively managing traffic congestion. Redwood City can also work towards increasing person throughput by tracking pedestrian, bicyclist, transit and vehicular throughput and delay along major corridors, including Woodside Road, Middlefield Road, Jefferson Avenue/Farm Hill Boulevard, Whipple Avenue). Accommodates All Users, Including Disabled, Low-Income, the Young and Elderly with Access to the Transportation System Annually, the City should assess the percent of comopleted projects that rank between three and five points for the Equity Score Map included in Appendix B. The goals would be to meet or exceed a set threshold normalized by project cost. Project Applies Current Design Standards and is Feasible and Constructible In keeping with the state of the practice, all improvements should apply design standards that are current at the time of the implementation. Furthermore, the feasibility and constructability of a project are important criteria for Redwood City to consider, because if the project or program is infeasible or difficult to construct, then it will be difficult to implement. Project feasibility can be related to right-of-way constraints, jurisdictional responsibilities, costs, and other considerations. Project has a Positive Return on Investment Projects are also evaluated based on if they will provide a positive return on investment. Under this measure, actual project usage and costs are compared to original forecasts and estimates. Implementation Actions The Redwood City Council, with support from City staff, would need to take the following actions to implement the RWCmoves vision along with its supporting goals, policies, programs, and projects: Adopt and environmentally clear the RWCmoves Citywide Transportation Plan Approve a General Plan Amendment to incorporate RWCmoves recommendations Update multimodal Transportation Impact Fee (TIF) program to capture unfunded Tier 1 projects, select Tier 2 projects and expected locally-funded portions of Signature Projects Seek local, regional and state grant funding to advance Tier 1 projects to the planning and design stages Update RWCmoves Project Priority List every two to three years to reflect additional project needs and priorities Monitor performance of transportation system and investment levels annually These implementation actions will allow the RWCmoves Plan to respond to City s current transportation needs and opportunities, while at the same time recognizing the changing nature of the transportation system. By doing so, the City will be well-positioned to achieve its vision of creating a multimodal, safe and accessible transportation network that provides the best travel experience possible for everyone in Redwood City. 96 5
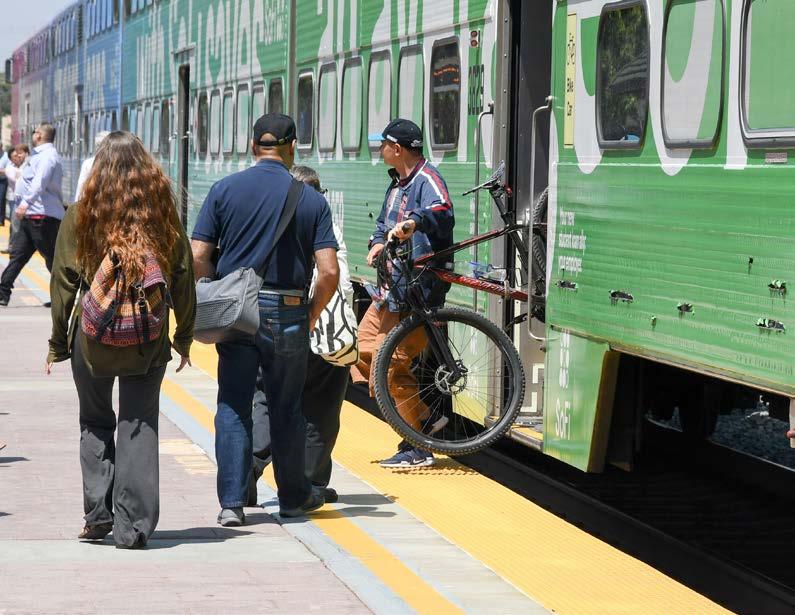
97
Moving Ahead. (Community Engagement) Chapter Three
 Chapter Three") 3 Community Chapter Three Moving Ahead (Community Engagement) engagement provided an exciting opportunity to engage Redwood City residents, workers, and business owners people who walk, bike, take transit,
3 Community Chapter Three Moving Ahead (Community Engagement) engagement provided an exciting opportunity to engage Redwood City residents, workers, and business owners people who walk, bike, take transit,
4Chapter Four. Reaching Our Destination. (Proposed Transportation Program)
") 4Chapter Four Reaching Our Destination (Proposed Transportation Program) The findings from existing conditions and the feedback received from the community outreach were used to develop the proposed transportation
4Chapter Four Reaching Our Destination (Proposed Transportation Program) The findings from existing conditions and the feedback received from the community outreach were used to develop the proposed transportation
PEDESTRIAN ACTION PLAN
 ATTACHMENT 2 CITY OF SANTA MONICA PEDESTRIAN ACTION PLAN CITY OF SANTA MONICA PEDESTRIAN ACTION PLAN This page intentionally left blank EXECUTIVE SUMMARY CHAPTER 1 EXECUTIVE SUMMARY Setting the Stage
Bicycle Master Plan Goals, Strategies, and Policies
 Bicycle Master Plan Goals, Strategies, and Policies Mobilizing 5 This chapter outlines the overarching goals, action statements, and action items Long Beach will take in order to achieve its vision of
Solana Beach Comprehensive Active Transportation Strategy (CATS)
") Solana Beach Comprehensive Active Transportation Strategy (CATS) 3.0 Goals & Policies The Solana Beach CATS goals and objectives outlined below were largely drawn from the Solana Beach Circulation Element
Solana Beach Comprehensive Active Transportation Strategy (CATS) 3.0 Goals & Policies The Solana Beach CATS goals and objectives outlined below were largely drawn from the Solana Beach Circulation Element
EXECUTIVE SUMMARY. Vision
 Vision Walking and bicycling in Salt Lake City will be safe, convenient, comfortable, and viable transportation options that connect people to places, foster recreational and economic development opportunities,
Purpose and Need. Chapter Introduction. 2.2 Project Purpose and Need Project Purpose Project Need
 Chapter 2 Purpose and Need 2.1 Introduction The El Camino Real Bus Rapid Transit (BRT) Project (Project) would make transit and other transportation improvements along a 17.6-mile segment of the El Camino
Chapter 2. Bellingham Bicycle Master Plan Chapter 2: Policies and Actions
 Chapter 2 Bellingham Bicycle Master Plan Chapter 2: Policies and Actions Chapter 2: Policies and Actions The Bicycle Master Plan provides a road map for making bicycling in Bellingham a viable transportation
AGENDA ITEM G-2 Public Works
 AGENDA ITEM G-2 Public Works STAFF REPORT City Council Meeting Date: 12/6/2016 Staff Report Number: 16-214-CC Regular Business: Approve the Oak Grove University Crane Bike Improvement Concept Plan, authorize
WALKNBIKE DRAFT PLAN NASHVILLE, TENNESSEE EXECUTIVE SUMMARY NASHVILLE, TENNESSEE
 NASHVILLE, TENNESSEE EXECUTIVE SUMMARY Executive Summary A world-class multi-modal transportation system is essential to a vibrant city and better quality of life. -Mayor Barry The WalknBike plan aims
Berkeley Strategic Transportation Plan A-76
 Berkeley Strategic Transportation Plan A-76 Appendices 1. A Team Effort 2. Where We ve Been A-11 Berkeley Strategic Transportation Plan Alameda County Transportation Plan Alameda County will be served
Kelowna On the Move. Pedestrian and Bicycle Master Plan
 Kelowna On the Move Pedestrian and Bicycle Master Plan Executive Summary April 2016 Purpose of the Plan The Pedestrian and Bicycle Master Plan identifies infrastructure, planning, and policy requirements
San Mateo County Bicycle and Pedestrian Advisory Committee
 San Mateo County Bicycle and Pedestrian Advisory Committee January 19, 2017 Emma Shlaes, Policy Manager About SVBC Mission Our purpose is to create a healthy community, environment, and economy through
Proposed. City of Grand Junction Complete Streets Policy. Exhibit 10
 Proposed City of Grand Junction Complete Streets Policy Exhibit 10 1 City of Grand Junction Complete Streets Policy Vision: The Complete Streets Vision is to develop a safe, efficient, and reliable travel
Data Analysis February to March Identified safety needs from reported collisions and existing travel patterns.
 Welcome! Thank you for participating in today s Valencia Bikeway Improvements workshop. Data Analysis February to March Identified safety needs from reported collisions and existing travel patterns. Initial
Pocatello Regional Transit Master Transit Plan Draft Recommendations
 Pocatello Regional Transit Master Transit Plan Draft Recommendations Presentation Outline 1. 2. 3. 4. What is the Master Transit Plan? An overview of the study Where Are We Today? Key take-aways from existing
City of Novi Non-Motorized Master Plan 2011 Executive Summary
 City of Novi Non-Motorized Master Plan 2011 Executive Summary Prepared by: February 28, 2011 Why Plan? Encouraging healthy, active lifestyles through pathway and sidewalk connectivity has been a focus
DRAFT MOVING FORWARD RHODE ISLAND BICYCLE MOBILITY PLAN 2018 PREPARED FOR PREPARED BY IN ASSOCIATION WITH
 RHODE ISLAND MOVING FORWARD BICYCLE MOBILITY PLAN 2018 PREPARED FOR PREPARED BY IN ASSOCIATION WITH T AF CHAPTER 1 D R INTRODUCTION CHAPTER 3 ARTICULATES VISION Bicycling is safe, fun and practical in
CONNECTING PEOPLE TO PLACES
 CONNECTING PEOPLE TO PLACES 82 EAST BENCH MASTER PLAN 07 Introduction The East Bench transportation system is a collection of slow moving, treelined residential streets and major arteries that are the
Exhibit 1 PLANNING COMMISSION AGENDA ITEM
 Exhibit 1 PLANNING COMMISSION AGENDA ITEM Project Name: Grand Junction Circulation Plan Grand Junction Complete Streets Policy Applicant: City of Grand Junction Representative: David Thornton Address:
San Mateo County Comprehensive Bicycle and Pedestrian Plan Open House
 San Mateo County Comprehensive Bicycle and Pedestrian Plan Open House October 28, 2010 Presented to San Mateo County residents and interested parties by Lauren Ledbetter, Alta Planning + Design Matt Haynes,
Cherry Creek Transportation and Land Use Forum September 25, 2013 Meeting Summary
 Cherry Creek Transportation and Land Use Forum September 25, 2013 Meeting Summary I. LEAD-IN TO SMALL GROUP DISCUSSION, POLLING AND STEERING COMMITTEE/TECHNICAL TASK FORCE DISCUSSION The meeting began
Living Streets Policy
 Living Streets Policy Introduction Living streets balance the needs of motorists, bicyclists, pedestrians and transit riders in ways that promote safety and convenience, enhance community identity, create
PEDALING FORWARD. A Glance at the SFMTA s Bike Program for SFMTA.COM
 PEDALING FORWARD A Glance at the SFMTA s Bike Program for 2017-2021 SFMTA.COM INTRODUCTION About This Booklet More people from all walks of life see their bicycle as a more convenient way to get where
Welcome. Background. Goals. Vision
 Welcome The formal Public Information Centre (PIC) for the Transportation Master Plan How We GO will be held in early 2017. At that time we will present the recommended transportation system for Niagara
Corpus Christi Metropolitan Transportation Plan Fiscal Year Introduction:
 Introduction: The Safe, Accountable, Flexible, Efficient Transportation Equity Act: A Legacy for Users (SAFETEA-LU) has continued the efforts started through the Intermodal Surface Transportation Efficiency
METROPOLITAN TRANSPORTATION PLAN OUTREACH: INTERACTIVE MAP SUMMARY REPORT- 10/03/14
 METROPOLITAN TRANSPORTATION PLAN OUTREACH: INTERACTIVE MAP SUMMARY REPORT- 10/03/14 INTRODUCTION This document summarizes the results of the online interactive mapping exercise implemented by MIG for the
Transportation Master Plan Advisory Task Force
 Transportation Master Plan Advisory Task Force Network Alternatives & Phasing Strategy February 2016 BACKGROUND Table of Contents BACKGROUND Purpose & Introduction 2 Linking the TMP to Key Council Approved
Tonight is for you. Learn everything you can. Share all your ideas.
 Strathcona Neighbourhood Renewal Draft Concept Design Tonight is for you. Learn everything you can. Share all your ideas. What is Neighbourhood Renewal? Creating a design with you for your neighbourhood.
Chapter 14 PARLIER RELATIONSHIP TO CITY PLANS AND POLICIES. Recommendations to Improve Pedestrian Safety in the City of Parlier (2014)
") Chapter 14 PARLIER This chapter describes the current status and future plans for biking and walking in the City of Parlier. RELATIONSHIP TO CITY PLANS AND POLICIES The Parlier General Plan is the primary
Chapter 14 PARLIER This chapter describes the current status and future plans for biking and walking in the City of Parlier. RELATIONSHIP TO CITY PLANS AND POLICIES The Parlier General Plan is the primary
CITY OF COCOA BEACH 2025 COMPREHENSIVE PLAN. Section VIII Mobility Element Goals, Objectives, and Policies
 CITY OF COCOA BEACH 2025 COMPREHENSIVE PLAN Section VIII Mobility Element Goals, Objectives, and Policies Adopted August 6, 2015 by Ordinance No. 1591 VIII MOBILITY ELEMENT Table of Contents Page Number
Chapter 7. Transportation. Transportation Road Network Plan Transit Cyclists Pedestrians Multi-Use and Equestrian Trails
 Chapter 7 Transportation Transportation Road Network Plan Transit Cyclists Pedestrians Multi-Use and Equestrian Trails 7.1 TRANSPORTATION BACKGROUND The District of Maple Ridge faces a number of unique
SUBJECT Memorandum of Understanding to Complete a Caltrain Grade Separation Study for the Whipple Avenue Crossing
 REPORT To the Honorable Mayor and City Council From the City Manager October 1, 2018 SUBJECT Memorandum of Understanding to Complete a Caltrain Grade Separation Study for the Whipple Avenue Crossing RECOMMENDATION
Data Analysis February to March Identified safety needs from reported collisions and existing travel patterns.
 Welcome! Thank you for participating in today s Valencia Bikeway Improvements workshop. Data Analysis February to March Identified safety needs from reported collisions and existing travel patterns. Initial
MASTER BICYCLE AND PEDESTRIAN PLAN
 VILLAGE OF NORTHBROOK MASTER BICYCLE AND PEDESTRIAN PLAN DRAFT PLAN OPEN HOUSE May 2, 2018 AGENDA 1. Community Engagement 2. Vision and Goals 3. General Structure of Plan 4. Recommendations Overview 5.
Caltrans Sloat Boulevard Pedestrian Safety Project Response to Community Questions, Comments & Concerns
 Caltrans Sloat Boulevard Pedestrian Safety Project Response to Community Questions, Comments & Concerns Revised: May 10, 2016 The California Department of Transportation (Caltrans) is planning various
Bike San Mateo County San Mateo County Bicycle Plan Recommendations August 30, 2010
 Policy and Procedures Develop and Implement a Complete Streets Policy to comply with DD-64-R1 and AB1358 Commencing January 1, 2011, AB1358 requires that the legislative body of a city or county, upon
Transportation Assessment
 Transportation Assessment Midtown Open House February 10, 2018 Overview Midtown in Focus Overview & Purpose of Today Transportation Assessment overview Summary of Transportation work to date Review & Analysis
T H E B U I L T E N V I R O N M E N T
 T H E B U I L T E N V I R O N M E N T Circulation Circulation Moving around, to, and through Redwood City is facilitated by many modes of transport: car, bus, shuttle, train, bike, electric bike/scooter,
North Coast Corridor:
 North Coast Corridor: Connecting People, Transportation & Environment Legislative Hearing: 11.8.10 1 North Coast Corridor Region s Lifeline A Regional Strategy Mobility, Economy & Environment North Coast
Perryville TOD and Greenway Plan
 Perryville TOD and Greenway Plan Greenway Glossary Pathway: A bicycle and pedestrian path separated from motorized vehicular traffic by an open space, barrier or curb. Multi-use paths may be within the
Toronto Complete Streets Guidelines
 88 90 5.1 Cycling Design Principles 92 5.2 Context-sensitive Cycling Facilities 96 5.3 Key Cycling Elements Cycling infrastructure provides choice in how people are able to move around the city. Cyclists
NM-POLICY 1: Improve service levels, participation, and options for non-motorized transportation modes throughout the County.
 Transportation PRINCE WILLIAM COUNTY 2008 COMPREHENSIVE PLAN NON-MOTORIZED PLAN CONTENTS Goals, Policies, and Action Strategies Table 4 (Bike Facility Classifications and Descriptions) Table 5 (Bike Facility
CITY OF BLOOMINGTON COMPLETE STREETS POLICY
 CITY OF BLOOMINGTON COMPLETE STREETS POLICY POLICY OBJECTIVE: The City of Bloomington will enhance safety, mobility, accessibility and convenience for transportation network users of all ages and abilities,
Multimodal Through Corridors and Placemaking Corridors
 68 Multimodal Through Corridors and Placemaking Corridors Corridors have different functions in a region. Some corridors are used to get smoothly and rapidly through a region or to get quickly to major
Moving Cambridge. City of Cambridge Transportation Master Plan Public Consultation Centre. March 7, :00 8:00 PM.
 City of Cambridge Transportation Master Plan Public Consultation Centre March 7, 2018 5:00 8:00 PM Region of Waterloo City of Cambridge Transportation Master Plan Public Consultation Centre March 7, 2018
REDWOOD CITY STREETCAR - ALTERNATIVES ANALYSIS
 REDWOOD CITY STREETCAR - ALTERNATIVES ANALYSIS The purpose of this document is to ennumerate the analysis of alternatives for a streetcar along the Broadway Corriodor of Redwood City. The six alternatives
City of Jacksonville Mobility Fee Update
 City of Jacksonville Mobility Fee Update 2017 Preliminary Analysis May 3, 2017 Carnival Cruise lines photo credit Presentation Overview Public Outreach Process Pedestrian and Bicycle Master Plan Study
1.0 INTRODUCTION 1.1 PURPOSE OF THIS REPORT
 1.0 INTRODUCTION This chapter provides an overview of the purpose, authorization and focus of this Recirculated Draft Environmental Impact Report (EIR), an identification of the Lead Agency, an outline
WELCOME. City of Greater Sudbury. Transportation Demand Management Plan
 WELCOME City of Greater Sudbury Transportation Demand Management Plan Public Consultation Session St. Andrew s Place, Activity Hall 111 Larch Street Wednesday September 13, 2017 6:00 to 8:00 pm Welcome
Outreach Approach RENEW SF served as the primary liaison with the North Beach community; the Chinatown. Executive Summary
 Executive Summary Executive Summary The Columbus Avenue Neighborhood Transportation Study s objective is to identify changes to transportation infrastructure and policies that could enhance the livability
City of Hamilton s Transportation Master Plan (TMP) Public Consultation 3 December 2015
 Public Consultation 3 December 2015") City of Hamilton s Transportation Master Plan (TMP) Public Consultation 3 December 2015 McPhail Transportation Planning Services Ltd. AGENDA 6:00 7:00 pm Viewing Boards / Q & A with the Team 7:00 7:50
City of Hamilton s Transportation Master Plan (TMP) Public Consultation 3 December 2015 McPhail Transportation Planning Services Ltd. AGENDA 6:00 7:00 pm Viewing Boards / Q & A with the Team 7:00 7:50
University of Victoria Campus Cycling Plan Terms of Reference. 1.0 Project Description
 University of Victoria Campus Cycling Plan Terms of Reference 1.0 Project Description The Campus Cycling Plan, a first for the University, will provide a comprehensive and coordinated approach to support
TRANSPORTATION MASTER PLAN Review Citywide Recommendations, Updated List and Scoring Methodology December 6, 2018
 NOTE: Due to lengthy Committee discussion and allotted meeting time, slides 12-35 were not presented at the meeting, but are provided here for reference. TRANSPORTATION MASTER PLAN Review Citywide Recommendations,
ACTIVE TRANSPORTATION
 ACTIVE TRANSPORTATION Mobility 2040 Supported Goals Improve the availability of transportation options for people and goods. Support travel efficiency measures and system enhancements targeted at congestion
SANTA CLARA COUNTYWIDE BICYCLE PLAN August 2008
 SANTA CLARA COUNTYWIDE BICYCLE PLAN August 2008 To assist VTA and Member Agencies in the planning, development and programming of bicycle improvements in Santa Clara County. Vision Statement To establish,
Key objectives of the survey were to gain a better understanding of:
 3 COMMUNITY INPUT Community input is an essential part of corridor studies. For the SR 87 corridor study, VTA staff conducted an extensive online survey of people living and commuting along the corridor.
Transportation 6. A. Transit Center Circulation and Access. 1. Transit Center Circulation
 Transportation 6 This chapter describes the transportation system in and around the Hillsdale Station Area, with a focus on the Transit Center at the relocated Hillsdale Caltrain Station. The transportation
Active Transportation Facility Glossary
 Active Transportation Facility Glossary This document defines different active transportation facilities and suggests appropriate corridor types. Click on a facility type to jump to its definition. Bike
Welcome! San Jose Avenue Open House August 25, 2015
 Welcome! San Jose Avenue Open House August 25, 2015 Vision Zero The City and County of San Francisco adopted Vision Zero San Francisco Vision Zero High Injury Network as a policy in 2014, committing an
Monterey Road Complete Streets
 Monterey Road Complete Streets Complete Street Objectives Improve livability and economic vitality Enhance pedestrian environment Accommodate bicyclists safely Reduce noise and air pollution Create attractive,
Magnolia Place. Traffic Impact Analysis. Prepared for: City of San Mateo. Prepared by: Hexagon Transportation Consultants, Inc.
 Magnolia Place Traffic Impact Analysis Prepared for: City of San Mateo Prepared by: Hexagon Transportation Consultants, Inc. Updated January 4, 2010 Table of Contents 1. Introduction...1 2. Existing Conditions...6
Broad Street Bicycle Boulevard Design Guidelines
 Broad Street Bicycle Boulevard Design Guidelines Building from the strategies introduced in the 2013 Bicycle Transportation Plan and community input received thus far, City Transportation Staff have identified
REGIONAL BICYCLE AND PEDESTRIAN DESIGN GUIDELINES
 REGIONAL BICYCLE AND PEDESTRIAN DESIGN GUIDELINES November 16, 2011 Deb Humphreys North Central Texas Council of Governments Bicycle and Pedestrian Advisory Committee Snapshot of the Guide 1. Introduction
Community Task Force July 25, 2017
 Community Task Force July 25, 2017 Welcome and Introductions Project Partners Regional Transportation District (RTD) Colorado Department of Transportation (CDOT) Denver Regional Council of Governments
Active Transportation Infrastructure Investment A Business Case
 Active Transportation Infrastructure Investment A Business Case In 2016, the Real Estate Foundation awarded the Capital Regional District a $50,000 grant for Shifting Gears: Land Use Change through Active
Bikeway action plan. Bicycle Friendly Community Workshop March 5, 2007 Rochester, MN
 Bikeway action plan Summary The was held on March 5, 2007 at the Rochester Mayo Civic Center. The workshop was hosted by Rochester-Olmsted County Planning Department in collaboration with the League of
EXECUTIVE SUMMARY... vii 1 STUDY OVERVIEW Study Scope Study Area Study Objectives
 Contents EXECUTIVE SUMMARY... vii 1 STUDY OVERVIEW... 1-1 1.1 Study Scope... 1-1 1.2 Study Area... 1-1 1.3 Study Objectives... 1-3 2 EXISTING CONDITIONS... 2-1 2.1 Existing Freeway Conditions... 2-4 2.1.1
2. Vision & Goals. Vision. Santa Rosa is a community where walking and bicycling are comfortable and convenient for people of all ages and abilities.
 2. Vision & Goals Overview The goals of the Santa Rosa Bicycle and Pedestrian Master Plan Update reflect the priorities expressed by the community throughout the public outreach phase of this Plan Update.
CITY OF CAMBRIDGE 2015 BICYCLE PLAN TOWARDS A BIKABLE FUTURE
 CITY OF CAMBRIDGE 2015 BICYCLE PLAN TOWARDS A BIKABLE FUTURE WHICH FUTURE? CAMBRIDGE MUNICIPAL POLICIES 1992: Vehicle Trip Reduction Ordinance 1998: Parking & Transportation Demand Ordinance 2002: Climate
Chapter 13 ORANGE COVE
 Chapter 13 ORANGE COVE This chapter describes the current status and future plans for biking and walking in the City of Orange Cove. RELATIONSHIP TO CITY PLANS AND POLICIES The Orange Cove General Plan
COLUMBUS AVENUE NEIGHBORHOOD TRANSPORTATION STUDY
 COLUMBUS AVENUE NEIGHBORHOOD TRANSPORTATION STUDY Pedestrian Survey Findings Survey Main Findings: Transit and walking are the main two modes used by both visitors and residents of the area, regardless
Circulation in Elk Grove includes: Motor vehicles, including cars and trucks
 Circulation, as it is used in this General Plan, refers to the many ways people and goods move from place to place in Elk Grove and the region. Circulation in Elk Grove includes: Motor vehicles, including
Active Transportation Access to Transit
 Active Transportation Access to Transit Introduction COMO Connect customers access transit service in many ways, including walking, bicycling, riding in a car and being dropped off, and directly boarding
Welcome! Public Open House on UBC s Transportation Plan
 1 Welcome! Public Open House on UBC s Transportation Plan Public open house hours: to When it comes to on-campus transportation, what do you think is working well and what are some opportunities for improvement?
CONTRA COSTA. Countywide Bicycle and Pedestrian Plan. Executive Summary. July Contra Costa Countywide Bicycle & Pedestrian Plan
 CONTRA COSTA Countywide Bicycle and Pedestrian Plan Executive Summary July 2018 i The preparation of this report has been financed through a grant from the U.S. Department of Transportation and the Federal
Goal 3: Foster an environment of partnerships and collaboration to connect our communities and regions to one another.
 Non-Motorized Transportation Plan (NMTP) Draft Vision, Goal and,, Tri-County Regional Planning Commission (TCRPC) Purpose The purpose of the Tri-County Regional Planning Commission (TCRPC) Non-Motorized
SF Transportation Plan Update
 SF Transportation Plan Update CAC Meeting #11 Existing Conditions and Future Baseline Needs Revised, Part I www.sfcta.org/movesmartsf twitter.com/sanfranciscota www.facebook.com/movesmartsf January 30,
In station areas, new pedestrian links can increase network connectivity and provide direct access to stations.
 The Last Mile Planning for Pedestrians Planning around stations will put pedestrians first. Making walking to stations safe and easy is important; walking will be a part of every rapid transit Accessible
Chapter 5 Future Transportation
 Chapter 5 Future Transportation The Future Land Use Plan identifies the desired land use designations. The land uses desired for Crozet depend, in large part, on the success of the transportation system,
North Shore Transportation Improvement Strategy
 North Shore Transportation Improvement Strategy Preliminary, Near-term Recommendation 2016 April Transportation Improvement Strategy (TIS) Comprehensive and Analytical A multi-modal transportation strategy
Executive Summary Route 30 Corridor Master Plan
 Route Corridor Master Plan Project Overview The Route Corridor Master Plan is a coordinated multimodal transportation and land use plan for the entire stretch of Route through East Whiteland Township,
Board-Approved Funding Awards for Cycle 4 Active Transportation Grant Program Projects (in Order of Project Rankings) Approved on
 Approved on") CAPITAL Large Category Projects Board-Approved Funding Awards for Cycle 4 Active Transportation Grant Program Projects (in Order of Project Rankings) Approved on 07-27-18 1 La Mesa University Ave Pedestrian
CAPITAL Large Category Projects Board-Approved Funding Awards for Cycle 4 Active Transportation Grant Program Projects (in Order of Project Rankings) Approved on 07-27-18 1 La Mesa University Ave Pedestrian
San Jose Transportation Policy
 San Jose Transportation Policy Protected Intersections in LOS Policies to Support Smart Growth Presented by: Manuel Pineda City of San Jose Department of Transportation Bay Area Map San Francisco Oakland
Rochester Area Bike Sharing Program Study
 roc bike share Rochester Area Bike Sharing Program Study Executive Summary ~ January 2015 JANUARY 2015 8484 Georgia Avenue, Suite 800 Silver Spring, MD 20910 3495 Winton Pl., Bldg E, Suite 110 Rochester,
TRANSPORTATION & MOBILITY
 TRANSPORTATION & MOBILITY ROADWAY SYSTEM There are approximately 40 miles of roadways in Manitou Springs. For planning purposes, roadways are typically assigned a functional classification which defines
MTP BICYCLE ELEMENT UPDATE. November 2017
 MTP BICYCLE ELEMENT UPDATE November 2017 TIME FOR AN UPDATE Bicycle Element adopted in July 2008 Almost 10 years old Many planned facilities have been implemented 10 years more experience in planning,
ABOUT THIS STUDY The Tenderloin-Little Saigon Community-Based Transportation Plan
 ABOUT THIS STUDY The Tenderloin-Little Saigon Community-Based Transportation Plan The Greater Tenderloin Community Study Milestones October Community based organizations (Tenderloin Housing Clinic and
Roads and Vehicular Traffic Design Principles. Roads and Vehicular Traffic Recommendations
 CIRCULATION AND PARKING roads and vehicular traffic The Campus Master Plan updates the campus transportation network through a multi-modal approach that encourages walking and biking while improving vehicular
Tulsa Metropolitan Area LONG RANGE TRANSPORTATION PLAN
 Tulsa Metropolitan Area LONG RANGE TRANSPORTATION PLAN Indian Nations Council of Governments August 2005 CONTACTING INCOG In developing the Destination 2030 Long Range Transportation Plan, INCOG s Transportation
Dear City Council Members,
 From: Bob Kenyon [mailto: ] Sent: Monday, February 08, 2016 10:20 AM To: City Clerk Subject: Please prioritize Caltrain and a complete transit network Thank you for prioritizing bringing BART to San Jose
2014 Bellingham Bicycle Master Plan
 2014 Bellingham Bicycle Master Plan Acknowledgements The City of Bellingham is honored by the commitment of the numerous community members and bicycling enthusiasts who participated in the development
Public Consultation Centre
 Region of Waterloo Transportation Master Plan Update Public Consultation Centre See the Information Package on how to contact the Project Team and complete the Comment Sheet www.regionofwaterloo.ca/en/exploring-the-region/transportation-master-plan.aspx
Proposed White Flint Separated Bike Lane Network September 2015
 Proposed White Flint Separated Bike Lane Network September 2015 Abstract This report includes a proposed separated bike lane network for the White Flint Sector Plan area. Separated bike lanes create a
2014/2015 BIKE ROUTE PLAN 83 AVENUE PROTECTED BIKE LANE
 About the Project 2014/2015 BIKE ROUTE PLAN The City of Edmonton is planning a major bike route on the south side of Edmonton. This bike route is one part of a plan to provide citizens with transportation
WELCOME Public Information Centre
 WELCOME Public Information Centre Fernforest Drive Brampton Soccer Centre Community Room #2 Tuesday January 19, 2016 6:30 p.m.to 9:00 p.m. Please sign in Neighbourhood Traffic Calming Guide Background
Appendix C 3. Bicycle / Pedestrian Planning
 Appendix C 3. Bicycle / Pedestrian Planning BICYCLE/PEDESTRIAN PLANNING 2005 Master Plan GOAL: Provide for safe and convenient bicycle and pedestrian circulation throughout the City. Develop a city-wide
May 12, 2016 Metro Potential Ballot Measure Issue Brief: Local Return
 Summary: Local return is an important revenue source for cities to maintain their local transportation infrastructure. Most cities use their local return to operate small bus systems and repave streets,
Cycling Master Plan Community Engagement Session WELCOME
 Cycling Master Plan Community Engagement Session WELCOME WHY COMMUNITIES PLAN Considering Short Term and Long Term Needs City of Lethbridge is committed to planning - to determine short term goals along
Highway 217 Corridor Study. Phase I Overview Report
 Highway 217 Corridor Study Phase I Overview Report November 3, 24 BACKGROUND AND OVERVIEW Study purpose The Highway 217 Corridor Study is developing multi-modal transportation solutions for traffic problems