TRANSPORTATION IMPACT STUDY GUIDELINES
|
|
|
- Pearl Eaton
- 6 years ago
- Views:
Transcription


1 TRANSPORTATION IMPACT STUDY GUIDELINES County of Yolo February 2010
2 TABLE OF CONTENTS 1. INTRODUCTION... 1 Project Considerations... 1 Intent of Study Guidelines... 2 General Plan Context TRIGGERS REQUIRING AN IMPACT STUDY... 4 Project Definition... 5 Trip Generation SCOPE OF THE STUDY... 8 Study Area... 8 Transportation Analysis Scenarios... 9 Transportation Analysis Time Periods Consultation with Other Jurisdictions Major Components of the Study RELEVANT POLICIES Vehicle Level of Service ANALYSIS METHODOLOGY Transportation Data Collection Multimodal Analysis Traffic Operations Analysis On-site Transportation Review Traffic Forecasts and VMT Analysis IMPACT ASSESSMENT Scenario Evaluation Significance Criteria Cumulative Impacts MITIGATION MEASURES RECOMMENDED PROCESS AND DOCUMENTATION... 34
3 APPENDICES Appendix A: Sample Trip Generation Calculations Appendix B: TIS Report Format Outline Appendix C: LOS Policies of Adjacent Jurisdictions Appendix D: Sample Site Plan Review Appendix E: Travel Demand Model Validation Tests Appendix F: Sample Household Travel Survey Appendix G: FHWA Vehicle Classification Definitions LIST OF FIGURES Figure 1: Vehicle Level of Service Thresholds By Roadway Segment LIST OF TABLES Table 1: Typical Daily Trip Generation Estimate for Common Proposed Development Types... 5 Table 2: Transportation and Circulation Elements Addressed in an Impact Study Table 3: Primary Transportation & Circulation General Plan Policies Table 4: Existing Conditions Data Collection Protocol Table 5: Analysis Parameter Recommendations Table 6: Intersection Operations Analysis Recommended Analysis Tool Table 7: Significance Criteria Table 8: Example Mitigation Measures Table A-1: Sample Estimated Project Trip Generation Table E-1: Static Validation Criteria and Thresholds... 47
4 As documented in the Yolo County General Plan, the County desires to provide a balanced transportation system that allows people multiple travel choices while minimizing environmental impacts. When it comes to potential impacts to the transportation system, the County endeavors to measure impacts to the mobility of residents and visitors across all travel modes. The County also recognizes that streets are among the most land-consuming and expensive use of public and private dollars. Streets need to be recognized as important public spaces where people connect, and as such, must accommodate all modes.
5 Section 1: Introduction 1. INTRODUCTION Transportation impact study (TIS) guidelines are routinely established by jurisdictions to assist applicants with assessing potential traffic impacts of proposed projects. The following guidelines have been developed to provide a clear and consistent technical approach to transportation impact analysis for projects within Yolo County s jurisdiction. This document establishes protocol for transportation impact studies and reports based on the current state-of-the-practice in transportation planning and engineering. The County expects these guidelines to result in studies that provide comprehensive and accurate analysis of potential transportation impacts to County facilities and services. This information is essential for decision makers and the public when evaluating individual projects. PROJECT CONSIDERATIONS What is a Transportation Impact Study? A Transportation Impact Study (TIS) evaluates the potential adverse effects of proposed projects on surrounding and supporting transportation infrastructure and services. A TIS determines if the adverse effects constitute significant impacts, and, if so, how the significant impacts can be mitigated. The following types of projects, which involve development activity in and around Yolo County and affect the County s transportation system, may require a TIS. Transportation infrastructure modification or expansion, including capital improvement projects (CIP) on county roads and state highways. Land use entitlements requiring discretionary approval by Yolo County, which includes annexations, general plan amendments, specific plans, zoning changes, conditional use permits, and tentative maps. Land use activity advanced by agencies other than Yolo County that is subject to jurisdictional review under state and federal law. Land use activity advanced by agencies other than Yolo County that is inconsistent with the County s General Plan. Section 2 identifies specific project parameters or triggers that may necessitate a TIS. 1
6 Section 1: Introduction INTENT OF STUDY GUIDELINES These guidelines address key elements required for preparing and reviewing transportation impact studies in Yolo County. This document is intended to be a resource applied in concert with professional judgment. The following major issues are addressed in this document. Situations and thresholds that commonly trigger the need for a TIS. Scope and extent of the required study. Transportation impact analysis methods. Criteria to determine if the transportation-related impacts of a proposed project are significant under the California Environmental Quality Act (CEQA). Mitigation measure requirements. Guidelines for documentation of the findings, conclusions, and recommendations. Yolo County will primarily review transportation studies and reports based on the guidelines presented in this document. However, each project is unique, and TIS guidelines are not intended to be prescriptive beyond practical. Not all criteria and analyses described in this document will apply to every project. Early and consistent communication with the Planning and Public Works Department is encouraged to confirm the type and level of analysis required on a case-by-case basis. GENERAL PLAN CONTEXT The Circulation Element of the 2030 Countywide General Plan specifically identified the development and adoption of transportation impact study guidelines that consider all modes of travel and establish clear guidance for analysis and significance criteria (Circulation Element Action CI-A2). The General Plan was updated in 2009 to guide future decisionmaking in the unincorporated areas in the County. The common vision is to remain an area of active and productive farmland and open space where communities will retain their unique identity. The vision is a balanced network of roads, trails, bike paths, and transit routes that encourages compact pedestrian- and bikefriendly neighborhoods within easy access to stores and work. 2
7 Section 1: Introduction For projects that are consistent with the General Plan, the impact analysis is generally limited to an evaluation of the project access points and connectivity to the existing adjacent bicycle, pedestrian, vehicle, and transit facilities (see Sections 2 and 3 for details). If a project is inconsistent with the General Plan, these guidelines do not apply, and a consultation with the Planning and Public Works Department is required. The General Plan vision is supported by nine guiding principles and supporting objectives, with the two most relevant listed here: Principle 5: The safest and most efficient way to move goods and people is through a variety of transportation alternatives. Principle 9: Fundamental changes are needed to secure the health, safety and prosperity of our communities against the potentially adverse effects of climate change. Section 4 contains specific references to relevant Circulation Element policies of the General Plan. 3
8 Section 2: Triggers Requiring an Impact Study 2. TRIGGERS REQUIRING AN IMPACT STUDY Unless explicitly waived by the County, a TIS is required when any one of the following conditions is met. The project has the potential to create a significant environmental impact under CEQA (check Table 7 on page 31 for a list of significance thresholds for all modes). Does my project require a transportation impact study? The proposed project has the potential to generate 100 new passenger vehicle trips per day or an equivalent number of truck trips according to the table below (see Appendix G for FHWA vehicle classification definitions). Vehicle and Truck Trip Equivalencies Vehicle Classification Description Trigger for a TIS (New Vehicle Trips Per Day ) Actions That May Be Subject to CEQA Auto 2 axles 100 Small Truck 2 axles/6 tires (includes buses) Medium Truck 3 & 4 axles 20 Large Truck 5 plus axles 5 The project requires a permit application, which is subject to discretionary approval. The project will substantially alter physical or operational conditions on a County roadway, bikeway, sidewalk, or other transportation facility. In general, a TIS is applicable for two years. After two or more years of inactivity, a TIS should be updated. In some instances, a master TIS may be prepared for a larger development. If the master TIS fully addresses development phasing and the phase or project is consistent with the intent of the larger development, specific phases will generally not require supplemental transportation impact studies. 50 Infrastructure construction Adoption of an ordinance or resolution Land use changes Funding from public agency contracts, subsidies, and loans Issuance of a lease, permit, license, certificate, or other entitlement If the proposed project includes any of the above actions, an Initial Study (IS) should be prepared to determine the appropriate environmental clearance documents, such as an Environmental Impact Report (EIR). 4
9 Section 2: Triggers Requiring an Impact Study PROJECT DEFINITION The applicant shall provide a project description that, at a minimum, includes the following: Specific land uses intended for the site. Size or intensity of the proposed development (e.g., square footage, acreage, dwelling units, tonnage, etc.). Documentation to inform the County whether the project generates 100 or more vehicle trips per day. Refer to Table 1 for typical project trip generation estimates. Documentation to inform the County whether the project will affect off-site transportation facilities or services including transit, rail crossings, roadways, bikeways, and sidewalks (see discussion of multimodal analysis on page 21 and Table 7 on page 31 for more information about potential multimodal impacts). An accurate project description will help determine if a TIS is required based on potential significant environmental impacts or trip generation. TABLE 1: TYPICAL DAILY TRIP GENERATION ESTIMATE FOR COMMON PROPOSED DEVELOPMENT TYPES Proposed Development Example (ITE Number) Single Family Detached Housing (210) 20 dwelling units General Office Building (710) 10 KSF gross floor area Specialty Retail Center (814) 5 KSF leasable area General Light Industrial (110) 10 KSF gross floor area Fast-Food with Drive-Through Window (934) 1 KSF gross floor area ITE Daily Trip Generation Nursing Home (620) 50 beds Value does not consider by-pass trips. KSF = 1,000 square feet 5
10 Section 2: Triggers Requiring an Impact Study TRIP GENERATION All applicants are required to submit a trip generation analysis that identifies the number of new daily and peak hour vehicletrips added by the proposed project. The trip generation estimation for all new or proposed development projects shall include the summation of primary trips and diverted linked trips. The following figure describes trip types relevant to trip generation and the difference between the total trips generated by the project versus new trips added by the project. How do I determine how many vehicle trips my project will generate? 6
11 Section 2: Triggers Requiring an Impact Study The estimation of new trips generated by the proposed development project may include credit for trips associated with existing uses on the site. Existing uses are those actively present on the project site at the time data is gathered for the traffic impact study. The final estimate of new daily and peak-hour trips associated with a proposed development project should represent the net contribution of the proposed project. The County will review the trip generation analysis and determine if additional analysis is required. Trip generation analysis should be primarily based on trip generation rates derived from local empirical data. Recognizing that this is not always possible, applicants may use the most recent version of the Institute of Transportation Engineers (ITE) Trip Generation 1 and recommendations provided in the Trip Generation Handbook. 2 If multiple trip generation rate sources exist, the study shall provide a comparison and use the rates that best reflect local conditions and applicable regulatory constraints. The project trip generation rate cannot be based solely on one nearby or similar land use facility. The sample used for nonstandard trip generation rates shall include at least three similar facilities in Yolo County or neighboring jurisdictions with similar characteristics. If the study involves comparable sites located in other communities, the applicant must demonstrate to the satisfaction of the County that the sites and uses to be studied are reasonably equivalent to the site and use proposed within the County. The final trip generation rates used for the project should be a weighted average of the various trip generation rates available. A tabular summary of the final trip generation rate calculation shall be provided. Appendix A provides sample trip generation calculations. Establishing Trip Generation for an Unknown Use For Projects Outside of a Specific Plan Area Option 1: In the case of shell buildings with unidentified uses or where the ultimate tenant use of the building cannot be restricted, the County Engineer will likely recommend the use of the highest traffic intensity among all permitted uses to establish traffic impacts and to calculate project impact fees. Option 2: Traffic impacts may be assessed based on a use with lower traffic intensity if the County and the developer establish a trip budget threshold. The trip budget will be monitored by the Planning Department. Additional evaluation is required if the trip budget will be exceeded by a proposed project. 1. Trip Generation, 7 th Edition, Institute of Transportation Engineers, Washington, D.C., Trip Generation Handbook, An ITE Recommended Practice, Institute of Transportation Engineers, Washington, D.C., June
12 Section 3: Scope of the Study 3. SCOPE OF THE STUDY The contents and extent of a transportation impact study depend on the location and size of the proposed development, the prevailing conditions in the surrounding area, and the technical questions being asked by decision makers and the public. How do I determine the study area? STUDY AREA Defining a study area needs to be done through a process that results in substantial evidence (facts, analysis, etc.) that supports the study area delineation. The boundary should extend as far as any potential CEQA impact might occur, including across jurisdictional boundaries. The County must approve study locations before traffic data collection and analysis commences. Careful consideration of all modes and facilities (i.e., transit, pedestrian, bicycle, vehicle, rail crossings, etc.) is required when selecting the study area boundary. The study area should be viewed as the area of influence of a specific project. The extent of the study area should be determined according to the following guidelines: The minimum study area shall include the transportation network within two miles of the project site or the network area where the project adds more than 10 peak hour trips. If the project is of statewide, areawide, or regional significance as defined in Section of the CEQA Guidelines, then the study area shall consider highways and rail facilities within 10 miles of the project site. Additional facilities may be studied based on circumstances unique to the site. Applicants should consult with the County early regarding any additional study locations based on local or site-specific issues, especially those related to agricultural vehicles, pedestrians, bicycles, rail crossings, and transit. 8
13 Section 3: Scope of the Study TRANSPORTATION ANALYSIS SCENARIOS The potential transportation analysis scenarios are listed below. Most isolated or small projects consistent with the General Plan will be required only to complete the Present Conditions analysis. Larger projects and projects near other potential development projects may be required to analyze both Present and Near-Term Conditions. The analysis of all three time periods would typically occur for specific plans. How many traffic analysis scenarios are required? PRESENT CONDITIONS Existing Conditions represented by transportation conditions for all travel modes in the study area based on recent field observations. Traffic volumes for roadway analysis should be based on recent count data. For CEQA compliance, the transportation impact analysis must include a description of the physical environmental condition in the vicinity of the project, as they exist at the time of the notice of preparation is published, or if no notice of preparation is published, at the time environmental analysis is commenced, from both a local and regional perspective (CEQA Guidelines Section 15125(a)). Existing Plus Project Conditions represented by project changes to existing transportation conditions for all travel modes in the study area. Traffic volume forecasts for roadway analysis should reflecting existing conditions plus traffic generated by the proposed project. For re-use or conversion projects, this will involve accounting for any existing use of the site that remains or will be discontinued. NEAR-TERM CONDITIONS Existing Plus Approved Projects Conditions represented by changes to existing transportation conditions for all travel modes in the study area resulting from approved projects. Traffic volume forecasts for roadway analysis should reflect existing conditions plus growth due to approved development (this scenario may be skipped if the study area has limited or no approved developments). Existing Plus Approved Projects Plus Project Conditions represented by Existing Plus Approved Projects Conditions plus changes to these conditions caused by the proposed project (this scenario may be 9
14 Section 3: Scope of the Study skipped if the study area has limited or no approved developments). FUTURE CONDITIONS (typically will be required only for specific plans) Cumulative No Project Conditions represented by transportation conditions for all travel modes in the study area reflecting all approved projects plus pending projects or expected development of other areas of the County designated for growth. In most cases, the project site will likely be vacant under this scenario. In some cases though, this scenario may need to account for any existing uses on the site that could continue and potential increases in development allowed by ministerial approvals only. Cumulative Plus Project Conditions represented by Cumulative Conditions plus changes to these conditions caused by the proposed project. This scenario needs to account for whether the project is changing any existing or planned land uses on the site. Additional analysis scenarios may be required in the traffic impact analysis dependent on project conditions and setting. For example, other scenarios may be needed to test phasing or other interim conditions, at the discretion of the County. TRANSPORTATION ANALYSIS TIME PERIODS The determination of analysis time periods will depend on the travel modes being evaluated. For non-auto travel modes, the analysis may include daily, peak period, or peak hour conditions. Final determination shall be made in consultation with County staff. For roadway analysis, General Plan Policy CI-3.4 states that, at a minimum, weekday AM and PM peak hour traffic volumes will be used in determining compliance with the vehicle level of service (LOS) standard. For recreational and other nontypical peak hour uses, weekday afternoon, weekday late evening, or weekends shall be considered. What time periods need to be analyzed? Based on the land use of the proposed project and upon consultation with County, the study shall analyze traffic operations during the peak hour of the following time periods. Weekday morning peak (7:00 9:00 AM) Weekday evening peak (4:00 6:30 PM) 10
15 Section 3: Scope of the Study For some projects, the County may substitute or require additional peak hour analysis for the following time periods. Weekday afternoon peak (2:00 4:00 PM) Friday evening peak (5:00 7:00 PM) Weekend midday peak (11:00 AM 1:00 PM) Weekend evening peak (4:00 7:30 PM) The determination of study time periods should be made separately for each proposed project based upon the peaking characteristics of project-generated traffic and peaking characteristics of the adjacent street system and land uses. The time period(s) that should be analyzed are those that exhibit the maximum combined level of project-generated traffic and adjacent street traffic. CONSULTATION WITH OTHER JURISDICTIONS If the study area overlaps with other jurisdictions, the other jurisdictions must be consulted to verify study locations and to specify the impact significance criteria that should be used in the TIS for these locations. Section of the CEQA Guidelines shall be followed as the basis for satisfying consultation requirements. In most cases, overlap will occur for roadway system analysis. Section 4 and Appendix C contain information on LOS policy thresholds for Caltrans, incorporated cities in Yolo County, and UC Davis. Roadway crossings of rail lines are another overlap area that requires coordination with the Public Utilities Commission (PUC). The focus of any analysis related to rail crossings should be on whether the current crossing complies with current design standards. MAJOR COMPONENTS OF THE STUDY The extent and complexity of a transportation impact study can vary greatly. Table 2 provides basic transportation and circulation elements that shall be acknowledged in every project requiring a TIS. Table 3 in Section 4 identifies relevant policies by each element. Specific analysis methodologies and significance criteria for each of the listed elements are described in further detail in Sections 5 and 6. Communicating the transportation impact study results is as important as the analysis itself. Effective graphics, charts, and simulations are often necessary to successfully communicate analysis results to decision makers and the public. 11
16 Section 3: Scope of the Study TABLE 2: TRANSPORTATION AND CIRCULATION ELEMENTS ADDRESSED IN AN IMPACT STUDY Elements On-site Circulation Off-Site Traffic Operations Bicycle Facilities Pedestrian Facilities and Americans with Disabilities Act (ADA) compliance Parking Neighborhood Electric Vehicles (NEV) Trucks (or other heavy vehicles) Transit Intersection Traffic Control General Plan Consistency Other Subject Areas Other Jurisdictional Requirements Evaluation Review and evaluate site access locations, driveway throat depths, size of major circulation features with respect to operations and safety, turning movement volumes at site access points, queuing at site access driveways, dimensions of truck loading areas, and emergency access. Address and accommodate pedestrian and bicycle access. See Appendix D for a sample. Study all roadway facilities using methods and procedures contained in the latest version of the Highway Capacity Manual (HCM). Identify any existing or planned bicycle facilities that may be affected by the project. Focus on maintaining or enhancing connectivity and completing network gaps. Identify any existing or planned pedestrian facilities that may be affected by the project. Focus on maintaining or enhancing connectivity, completing network gaps, and removing barriers. Disclose evaluation and documentation of project features (e.g., road widening) with likely disparate impact on pedestrians (e.g., longer crossing time). Compare the project parking plan with County standards. Review potential for NEV circulation within the study area. Identify NEV opportunities and constraints. NEVs are permitted only on streets with a posted speed limit of 35 mph or less (California Vehicle Code Section 21260). Alternatively, a separate facility (e.g., shared use path or lane) may be required. For agricultural projects, mining projects, or other projects related to goods or materials movement, identify the number of truck trips that will be generated, and design facilities necessary to accommodate truck traffic. This will generally require evaluation of the Traffic Index for existing roadways serving the project and an assessment of whether roadways meet current County design standards. Identify any existing or planned transit facilities that may be affected by the project. Focus on maintaining or enhancing connectivity and completing network gaps. For system planning, use crush load as capacity, not seated capacity. The County prefers roundabouts instead of traffic signals or all-way stop control. Evaluate unsignalized intersections located within the study to determine appropriate traffic control with or without the project. Evaluate the project against goals, polices, and actions set forth in the General Plan. Consider other subject areas on a case-by-case basis. In situations where several agencies must approve a development or are responsible for affected roadways, the applicant must contact lead and responsible agencies to determine issues to be addressed, scope of study, etc. In general, the applicant will be responsible for analyzing project impacts against appropriate jurisdictional thresholds; however, the analysis methodology will be determined by the County in compliance with CEQA and the impacts will be mitigated consistent with County standards. 12
17 Section 4: Relevant Policies 4. RELEVANT POLICIES An important aspect of a TIS is to provide sufficient information for the County to determine that a project is consistent with the General Plan and other applicable County plans. As such, individual projects must be reviewed against relevant policies contained in the General Plan or other plans such as the Congestion Management Plan. Table 3 listed the most common policies associated with each element of a TIS in an abbreviated fashion. Applicants should review the full policy statement in the General Plan. TABLE 3: PRIMARY TRANSPORTATION & CIRCULATION GENERAL PLAN POLICIES Element On-site Circulation General Plan Circulation Element Policy Policy CI-1.3 Reduce the total vehicle miles of travel (VMT) per household by making efficient use of existing transportation facilities and by providing for more direct routes for pedestrians and bicyclists Policy CI-3.8 Encourage compact development Policies CI-3.18, CI-3.19 and CI-3.20 VMT limitations and policies within Specific Plan areas Policy CC-2.16 Require sustainable design standards including: Narrow streets with a shade canopy Vertical curbs and landscape-separated sidewalk Pedestrian-scale street lighting Maximum block lengths of 600 feet North-south, east-west grid street network Parking on both sides of the street in downtown areas Parking located in the rear with 50 percent shading Convenient and secure bicycle parking in downtown areas Avoid cul-de-sacs that create pedestrian and bicycle barriers Include recharging stations, preferred parking, and incentives for alternative energy vehicles Multiple connections for all modes to integrate surrounding communities Policy CI-1.2 Preserve and continue to develop a fully-connected gridbased circulation system that distributes traffic evenly Policy CC-4.36 Encourage private roads within new development Policy CI-3.14 Incorporate roundabouts and traffic calming Project Applicability (Check here) 13
18 Section 4: Relevant Policies Element General Plan Circulation Element Policy Project Applicability (Check here) Off-Site Traffic Operations Bicycle Facilities Policy CI-1.1 Ensure future county transportation routes are consistent with the planned improvements shown in the Circulation Element Diagram Policy CI-3.9 Construct safety improvements on existing roadways Policies CC-1.12 through CC-1.16 Preserve scenic quality of rural roadways Policies CI-3.10 and CI-7.3 Prioritize improvements to farm to market corridors identified in Table CI-1 of the General Plan Policy CI-2.1 Plan for use of the roadway space by all users, including automobiles, trucks, alternative energy vehicles, agricultural equipment, transit, bicyclists, and pedestrians, as appropriate to the road classification and surrounding land uses Policy CI 3.3 Consider objectives such as minimizing impacts to the environment, reducing greenhouse gases and air pollutants, and increasing travel choices when expanding or modifying the County or State transportation network Policy CI-3.6 Incorporate complete streets Policy CI-3.7 Consider unique conditions associated with rural and agricultural areas Policy CI-3.17 Ensure emergency vehicle access Policy CI-3.14 Incorporate roundabouts and traffic calming Policy CI-3.11 Require new development to finance and construct all offsite circulation improvements necessary to mitigate a project s transportation impacts. Collect the fair share costs of all feasible transportation improvements necessary to reduce the severity of cumulative transportation impacts. Policy CI-3.12 Construct improvements prior or concurrent to need Policy CI-3.15 Fund long-term maintenance Policy CI-2.4 Comfort, convenience, and safety of bicyclists and pedestrians are as important as those same values for drivers Policy CI-5.5 Integrate bicycle, pedestrian, and transit facilities into new developments Policy CI-5.9 Maintain consistency with the Bicycle Transportation Plan Policies CI-5.11 and CI-5.19 Preserve abandoned public roads and rail corridors for bicycle and pedestrian travel Policy CI-5.12 Link bicyclists and pedestrians to other modes Policy CI-5.13 Establish pedestrian areas in conjunction with the development, redevelopment and design of mixed-use neighborhoods, schools, parks and community downtowns. Incorporate the following minimum design elements into pedestrian areas: Adequate lighting for bicycle and pedestrian access Bicycle and pedestrian connections from cul-de-sacs to adjacent streets 14
19 Section 4: Relevant Policies Element General Plan Circulation Element Policy Project Applicability (Check here) Pedestrian Facilities and Americans with Disabilities Act (ADA) compliance Parking Neighborhood Electric Vehicles (NEV) Trucks Policy CI-2.4 Comfort, convenience, and safety of bicyclists and pedestrians are as important as those same values for drivers Policy CI-5.3 Ensure compliance with the Americans With Disabilities Act (ADA) Policy CI-5.5 Integrate bicycle, pedestrian, and transit facilities into new developments Policies CI-5.11 and CI-5.19 Preserve abandoned public roads and rail corridors for bicycle and pedestrian travel Policy CI-5.12 Link bicyclists and pedestrians to other modes Policy CI-5.13 Establish pedestrian areas in conjunction with the development, redevelopment and design of mixed-use neighborhoods, schools, parks and community downtowns. Incorporate the following minimum design elements into pedestrian areas: Intersection bulb-outs to reduce walking distances across streets Pedestrian facilities at all signalized intersection approaches, including mid-street refuges, where appropriate Vertical curbs, detached sidewalks and tree-lined streets Adequate lighting for bicycle and pedestrian access Wide sidewalks in downtown areas that allow for multiple uses, including outdoor dining Grid-based street pattern Community entry points (gateways) Bicycle and pedestrian connections from cul-de-sacs to adjacent streets Policy CC-2.16 Require sustainable design standards including: North-south, east-west grid street network Parking on both sides of the street in downtown areas Parking located in the rear with 50 percent shading Convenient and secure bicycle parking in downtown areas Include recharging stations, preferred parking, and incentives for alternative energy vehicles Policy CI-4.3 Reduce dependence upon fossil fuels through infrastructure necessary to support clean alternative fuel vehicles or electric vehicles Policy CI-4.4 Support low emissions or non-polluting forms of transportation Policy CI-2.1 Plan for use of the roadway space by all users, including automobiles, trucks, alternative energy vehicles, agricultural equipment, transit, bicyclists, and pedestrians, as appropriate to the road classification and surrounding land uses Policy CI-3.7 Consider unique conditions associated with rural and agricultural areas Policy CI-3.17 Ensure emergency vehicle access Policy CI-7.2 Encourage goods movement on freeways and designated routes 15
20 Section 4: Relevant Policies Element General Plan Circulation Element Policy Project Applicability (Check here) Transit Intersection Traffic Control General Plan Consistency Other Subject Areas Other Jurisdictional Requirements Policy CI-2.3 Ensure that, wherever feasible, public transit and alternative mode choices are a viable and attractive alternative to the use of single occupant motor vehicles Policy CI-6.2 Require convenient and accessible transit stops and hubs Policy CI-6.3 Require amenities at transit stops and hubs per the Yolo County Transportation District Policy CI-6.11 Require new development to include design elements that promote transit use, such as: Locating sheltered bus stops near neighborhood focal points Locating transit routes on streets serving medium-high density development whenever feasible Linking neighborhoods to bus stops through continuous bikeways and sidewalks Providing direct bicycle and pedestrian access to transit stops, parkand-ride lots, alternative fuel stations, bicycle racks, train access (e.g., Dunnigan, Yolo, and Zamora), public docks for water taxis (Clarksburg, Elkhorn, and Knights Landing) and airport shuttles (Elkhorn) Policy CI-1.2 Preserve and continue to develop a fully connected gridbased circulation system that distributes traffic evenly Policy CI-3.14 Incorporate roundabouts and traffic calming Review other elements of the General Plan for applicable policies, especially the land use and community character element Policy CI-1.12 Monitor roadways in the Yolo County Congestion Management Program (CMP) and prepare a deficiency plan when CMP LOS thresholds are exceeded. Improving deficiencies shall focus on mitigations to the transportation system that reduce vehicle travel. Policy CI-1.4 Continue to work with other agencies to achieve timely construction of regional road improvements that are consistent with the Yolo County General Plan 16
21 Section 4: Relevant Policies VEHICLE LEVEL OF SERVICE Historically, vehicle level of service (LOS) thresholds have been the prevailing criteria applied to transportation projects. Yolo County recognizes that vehicle LOS is one performance measure that needs to be careful weighed against other County objectives to balance the preservation of community and rural values with a safe and efficient circulation system. The County s vehicle LOS standard is described in detail in the Circulation Element of the General Plan (Policies CI-3.1, CI-3.2, and CI-3.4) and is summarized to the right. Objectives or thresholds for other transportation modes have also been established and are addressed in these guidelines in Table 7 on page 31. Figure 1 (pages 18 and 19) provides an overview of LOS thresholds by roadway segment consistent with the policy and exceptions set forth in Policy CI-3.1 and CI-3.2. This figure also includes a note indicating that the Caltrans LOS threshold for one section of Interstate 5 (I-5) differs from the County s threshold. Pursuant to Policy CI-3.2.1, transportation impact studies that include this portion of I-5 must analyze both LOS thresholds. If the TIS study area extends into an adjacent jurisdiction, their LOS threshold shall be used for the impact significance criteria for analysis locations in that jurisdiction. Appendix C contains the LOS policies and thresholds for incorporated cities in Yolo County. The applicant is responsible for analyzing project impacts against appropriate jurisdictional standards; however, impacts will be mitigated consistent with County standards and the County General Plan. Applicants are required to verify LOS thresholds for study area intersections and roadways. The General Plan also states that LOS exceptions may be allowed on a case-by-case basis, where reducing the level of service threshold would result in clear public benefit. Further, individual Specific Plans and Community Area Plans have specific LOS thresholds. Applicants with a project within one of these plan areas should confirm applicable LOS thresholds with the County. Yolo County Vehicle LOS Threshold Policy Maintain LOS C or better for roadways and intersections within the unincorporated county. In no case shall land use be approved that would either result in worse than LOS C conditions, or require additional improvements to retain the required level of service, except as specified in Policy CI-3.1 of the General Plan. The intent of this policy is to consider level of service as a limit on the capacity of the County s roadways. Where roadway improvements are not needed due to the adoption of a lower level of service policy, developers shall be required to construct equivalent circulation and safety improvements for other modes of travel. Source: 2030 Countywide General Plan Policies CI-3.1 and CI
22 Co Rd 2 Rumsey Co Rd 86 * Dunnigan * * Co Rd 99W Guinda Co Rd 53 Co Rd 12A 5 Co Rd 12 Co Rd 78 Brooks Co Rd 85 Co Rd 86 Co Rd 87 Co Rd 14 Co Rd 90A Zamora Co Rd 16 Co Rd 17 Co Rd 97 Co Rd 78A Capay Co Rd 19 Co Rd 95 Yolo Co Rd 85B Esparto * Madison Co Rd 23 }þ 16 Co Rd 24 * Co Rd 94B 505 Co Rd 93 Co Rd 95 Co Rd 97 LEGEND LOS Threshold Co Rd 89 Co Rd 27 Co Rd 29 C D Co Rd 29A Co Rd 31 Co Rd 96 * E F Refer to Policy CI-3.1 for additional requirements. }þ 128 Winters Russell Blvd Russell Blvd N NOT TO SCALE N:\2009Projects\2711A_YoloCntyTISGuidelines\Graphics\GIS\MXD\fig0X_LOS_ThreshWEST.mxd Figure 1 (West) Level of Service Threshold YOLO COUNTY GENERAL PLAN
23 9W }þ 45 5 Co Rd 12 Co Rd 98A Knights Landing Co Rd 13 Zamora Co Rd 14 Co Rd 19 Co Rd 16 Co Rd 17 Co Rd 95 Co Rd 97 Yolo Co Rd 16A }þ 113 Co Rd 17 Co Rd 102 * * Co Rd 16 Co Rd 117 }þ 16 Co Rd 24 * Co Rd 94B Woodland East St 5 Co Rd 22 ** Co Rd 93 Co Rd 95 Co Rd 27 Co Rd 97 Co Rd 98 Co Rd 25A Co Rd 101 Co Rd 102 Old R i v e r Roa d Co Rd 29 Co Rd 99 }þ 113 * Co Rd 28H 29A Co Rd 31 Russell Blvd Co Rd 96 Russell Blvd Hutchison Dr Co Rd 101A Davis Co Rd tu 50 }þ 275 West Sacramento LEGEND Mace Blvd Co Rd 35 LOS Threshold South River Road C D Co Rd 104 }þ 84 E F Willow Point Rd Clarksburg Road Clarksburg Central Ave * ** Refer to Policy CI-3.1 for additional requirements. Caltrans threshold is LOS C for this section. N NOT TO SCALE Figure 1 (East) Level of Service Threshold N:\2009Projects\2711A_YoloCntyTISGuidelines\Graphics\GIS\MXD\fig0X_LOS_ThreshEAST.mxd YOLO COUNTY GENERAL PLAN
24 Section 5: Analysis Methodology 5. ANALYSIS METHODOLOGY This section provides data collection and analysis procedures for conducting transportation impact studies in Yolo County. The County is committed to equal levels of analysis for all modes of travel. The methodology presented is this section includes robust data collection and analysis techniques for pedestrian, bicycle and transit networks, in addition to vehicle circulation. TRANSPORTATION DATA COLLECTION Accurate data is essential to achieve a high level of confidence in transportation analysis results. Existing traffic conditions data shall be collected using the guidelines set forth in Table 4. TABLE 4: EXISTING CONDITIONS DATA COLLECTION PROTOCOL Data Set Peak period turning movement counts Daily traffic counts Roadway geometrics Travel time and speed Signal timing Collision data Mode split Procedure Collect data for all study intersections on a Tuesday, Wednesday, or Thursday during weeks without holidays, large special events, heavy construction, or agricultural activity (i.e., harvest season) in the study area that results in temporary travel pattern shifts. Fall or Spring days without rain and when school is in session are preferred. Care should be taken to collect data on days when schools are in session. Consult with the County to determine if adjustments are necessary to account for seasonal variation in traffic volumes. Traffic counts shall not be used if more than two years old at study initiation. If available, County counts may be used but the traffic counts must be adjusted to reflect current year traffic volumes and patterns. Bicycles and pedestrians should be included in all counts. Some projects may require vehicle classification or occupancy counts. Consult with the County on a case-by-base basis. Collect data for all study roadway segments using the parameters described above for peak period turning movement counts with the exception of collecting bicycle and pedestrian data. Establish existing geometrics from a combination of aerial photography, as-built plans, and site visits. Only as necessary. Collect data using a floating car survey. Request timing from the County and other operating agencies such as Caltrans. Verify timing in the field. Obtain Statewide Integrated Traffic Records System (SWITRS) through the local California Highway Patrol or through the following Web site: Summarize daily and peak hour mode split from study area or communities adjacent to study area. Data sources could include the Census journey-to-work survey, the SACOG household travel survey, or other available surveys. 20
25 Section 5: Analysis Methodology Data Set Transit routes and use Bicycle and pedestrian facilities Procedure Map existing transit routes and stops serving the study area and identify service hours and levels of use. Document amenities (benches, shelters, bicycle parking, etc.) available at transit stops and centers within ¼-mile of non-residential projects and a ½-mile of residential projects. Map existing bicycle and pedestrian facilities within the study area (include sidewalks, crosswalks, signal heads, push buttons, related signing and striping). Document barriers, deficiencies and high-pedestrian demand land uses including schools, parking, senior housing facilities, and transit stops or centers. Consider using evaluation tools such as or similar tools to quantify walkability. MULTIMODAL ANALYSIS Evaluate the project s potential adverse effects on transportation facilities and services related to transit, rail crossings, bicycles, and pedestrians. The evaluation could include identification of any disruption to existing facilities and services or interference with the implementation of planned facilities and services. This effort will require identifying and mapping existing facilities. Particular attention should be made to roadway or intersection widening mitigation that would increase pedestrian/bicycle crossing times or increase the potential for vehicle and pedestrian/bicycle conflicts. Consideration should also be given to how a project affects accessibility between each travel mode and the surrounding land uses. Mode split goals for walking, bicycling, and transit trips must be established for specific plan areas as part of the TIS (Policy CI-3.20 and Action CI-A6). These goals should apply to peak period and daily conditions. Monitoring mode split on a biennial basis using household travel surveys is also recommended, but the timeframe and level of survey detail should be tailored to the size and scale of the specific plan development. Any monitoring process should consider that the Census and SACOG conduct household travel surveys about every 10 years. Cooperating with these surveys could reduce time and effort as part of future monitoring. Appendix F contains a sample household travel survey. For some projects, more detailed multi-modal analysis may be required. In these cases, the methodology shall be selected in consultation with County staff and should consider new tools, procedures, and performance measures such as those listed below. Multimodal LOS The NCHRP 3-70 Multimodal Level of Service Analysis for Urban Streets, Transportation Research Board, February 2008 is proposed for inclusion in the 2010 HCM and is already available for use. Alternatively, simulation models can be used to 21
26 Section 5: Analysis Methodology measure performance (i.e., person-delay) for all modes using a transportation network. Activity Connectedness Travel time for each mode (vehicles, transit, bicycles, and walking) between the project and surrounding land uses can be used to gauge the degree of accessibility for a project. The County desires to minimize travel time to necessary destinations while minimizing unnecessary vehicle travel. Tools such as Index and Walkscore can be used to gauge this measure specifically for walking. The main idea is to evaluate activity centers and destinations around projects to ensure that walk times to necessary destinations are minimized and the walking experience is comfortable. Speed Management Desired travel speeds for each mode should be considered in project evaluation where new transportation facilities are being constructed. For urban areas, the County desires roadways to be designed for 35 miles per hour less to allow NEV use and to reduce the severity of collisions. Desired speeds for commuter bikeways and pedestrianways will depend on the surrounding context, but the intent is to minimize barriers or obstructions to bicycle and pedestrian movements. TRAFFIC OPERATIONS ANALYSIS Traffic impacts shall be analyzed using standard or state-of-thepractice professional procedures for trip generation, trip distribution, and traffic assignment, which can generally be found through organizations such as Institute of Transportation Engineers (ITE), Caltrans, Federal Highway Administration (FHWA), and American Planning Associating (APA). General Plan Policy CI-3.4 states that LOS definitions and calculation methods must be consistent with the latest edition of the Highway Capacity Manual (HCM). The HCM is published by the Transportation Research Board. The current version was published in 2000 and an update is planned for Analysis Parameters Analysis parameters (e.g., signal phasing, conflicting pedestrian volumes, etc.) for Existing and Existing Plus Project conditions shall be based on field measurements taken during traffic count collection or field observation. This typically applies to Existing Plus Approved Projects and Existing Plus Approved Projects Plus Project analysis. Evaluating Side Street Stop-Controlled Intersections In addition to reporting the worst individual movement delay, the delay for the overall intersection shall be calculated and reported. This information will allow reviewers to gauge potential impacts to individual turning movements against those for the entire intersection. 22
27 Section 5: Analysis Methodology For new study intersections and under Cumulative conditions, Table 5 provides guidance on state-of-the-practice procedures. Consult with the County regarding other analysis parameters not listed in Table 5. TABLE 5: ANALYSIS PARAMETER RECOMMENDATIONS Parameter Peak hour factor (PHF) Saturation flow rate Yellow phase All red phase Conflicting pedestrians for signalized intersections and roundabouts Traffic signal cycle lengths Heavy truck percentages Lane utilization factor Recommendation Use measured approach PHF obtained through traffic data collection. For cumulative scenarios and existing conditions where peak hour factors are not available, refer to the HCM and maintain consistency through analysis scenarios and peak hours. If a simulation model is used for analysis, the PHF should be applied over more than a 15-minute period. A field measurement of the saturation flow rate is recommended in accordance with procedure in the HCM, Chapter 16, Appendix H. For cumulative conditions, use the value recommended in the most recent HCM unless physical conditions and traffic controls warrant a change. The 2000 HCM recommends 1,900 vehicles per hour per lane. 4 seconds per phase (if traffic signal is present under existing conditions, use existing yellow phase). 1 second per phase (if traffic signal is present under existing conditions, use existing red phase). Red phase may be greater on high-speed roadways. Primarily based on existing pedestrian counts or observations. Otherwise, refer to the most current version of the HCM to determine the amount of pedestrian activations per cycle into appropriate categories. The following three categories are included in the 2000 HCM. Low pedestrian activity (near freeway interchanges/community commercial sites) 10% of the cycles are expected to have pedestrian activations Medium pedestrian activity (near community commercial sites) 25% of the cycles are expected to have pedestrian activations High pedestrian activity (in and around downtown) 50% of the cycles are expected to have pedestrian activations To determine conflicting pedestrians, assume one pedestrian per activation. Pedestrian activity must also be considered at roundabout intersections. Replicate existing cycle length and phasing (e.g., leading left turns) when possible. For new signalized locations, segment the cycle lengths into the following three categories unless other cycle lengths can be justified through the traffic operations analysis. In and around downtown limit signal cycle lengths to less than 60 seconds In and around suburban areas limit signal cycle lengths to less than 90 seconds Near freeway interchanges/regional commercial limit signal cycle lengths to less than 120 seconds Ensure that minimum pedestrian times are satisfied. Based on the existing heavy-truck percentage and adjusted to account for future planned development. In general, heavy-truck percentages should be greater on truck routes and main thoroughfares than on local streets. Minimum recommended value is 2%. If applicable, adjust lane utilization factors based on field observations. 23
28 Section 5: Analysis Methodology Analysis Tools and Methods Traffic operations analysis for state highways and local roadways shall be conducted using tools and methods approved by Yolo County. Table 6 identifies recommended analysis tools. Other tools or methods may be used upon receiving approval from the County Engineer. Special conditions related to congested conditions, state highway facilities, and roundabouts are discussed in more detail below. TABLE 6: INTERSECTION OPERATIONS ANALYSIS RECOMMENDED ANALYSIS TOOL Software/ Method FHWA Roundabout Guidelines Synchro/ SimTraffic Traffic Studies 1 Roundabouts Simulation Analysis 4 Arterial/ Interchange Operations Operations 2 Signal Coordination 3 Planning Design X Unique Geometrics X X X X X Heavily Congested Conditions Multi- Modal TRAFFIX X X HCS X X AASIDRA X X Rodel X Micro- Simulation 5 X X X X X X Notes: The most current version of analysis software (with updated software patches) should be used. 1. Refer to thresholds for identifying if a traffic study is required. 2. Appropriate for isolated intersection operations or for signal systems that are not coordinated. 3. Mandatory for coordinated signal systems to maximize vehicle progression. 4. Should be applied to analyzing operations of congested conditions or non-standard conditions where traditional analytical approaches may not be appropriate. 5. Specific software program selection should be conducted in consultation with the County and consider the types of technical questions being asked in the study and the modes to be included. 24
29 Section 5: Analysis Methodology Congested Conditions Analysts should note that the HCM recommends the use of simulation models to analyze congested conditions. Since simulation tools can simultaneously evaluate vehicle interactions across a complete network (including the interaction of multiple modes), they can provide a more complete understanding of traffic operating conditions during peak congested periods and what may happen when a specific bottleneck is modified or eliminated. State Highway Analysis In Yolo County, the analysis of state highways could include freeways and conventional highways. Freeway analysis will typically include basic freeway segments, ramp junctions, weaving sections, and ramp terminal intersections. HCM methods shall be used for basic freeway segments, ramp junctions, and ramp terminal intersections, but Caltrans has alternative analysis methods for weaving sections as defined in the Caltrans Highway Design Manual (HDM Section 504.7). The Caltrans District 3 traffic operations branch should be consulted before beginning any weaving analysis. Analyzing ramp terminal intersections should consider that these intersections are closely spaced in most cases and operate as an integrated set versus as isolated locations. Roundabout Analysis The 2000 HCM procedures do not provide complete guidance on how to evaluate roundabouts. Roundabout analysis is critical when the intersection is projected to operate at or near capacity. The flowchart on the next page provides a framework for roundabout analysis within Yolo County. The framework utilized the FHWA publication, Roundabouts: An Informational Guide. Specifically, the forecast daily volumes should be compared against the thresholds shown in Exhibits 3-1 and 3-2 of this document to identify if a roundabout is a feasible intersection treatment. If the initial check indicates that the roundabout would be near or at capacity, simulation should be used, or the roundabout should be redesigned to provide additional capacity. If the daily volumes are below the threshold and the intersection is isolated, then a macroscopic analysis may be sufficient. Queue lengths should be reviewed to ensure that they do not spill beyond available storage and interfere with overall operations. If vehicles have sufficient storage, then volume-tocapacity (V/C) ratios should be reviewed to verify that they are less than If the V/C ratios are less than 0.85, proceed with sensitivity testing to provide a level of confidence if traffic volumes increase or decrease beyond what was forecasted. 25
30 Section 5: Analysis Methodology When comparing roundabout versus signal control at a given location, long-term maintenance costs should be calculated and considered in the evaluation. Roundabout Analysis Flowchart 26
31 Section 5: Analysis Methodology ON-SITE TRANSPORTATION REVIEW A detailed site review is required for every project. Consideration should be given to the following qualitative and quantitative reviews and summarized in the TIS. Existence of any current traffic problems in the local area such as a high-accident location, non-standard intersection or roadway, or an intersection in need of a traffic signal. Applicability of context-sensitive design practices compatible with adjacent neighborhoods or other areas that may be impacted by the project traffic. Close proximity of proposed site driveway(s) to other driveways or intersections. Adequacy of vehicle parking relative to both the anticipated project demand and zoning code requirements. Adequacy of the project site design to fully satisfy truck loading demand on-site, when the anticipated number of deliveries and service calls may exceed 10 per day. Adequacy of the project site design to provide at least the minimum required throat depth at project driveways. Adequacy of the project site design to convey all vehicle types Adequacy of on-site vehicle, bicycle, and pedestrian circulation and provision of safe pedestrian paths from residential areas to school sites, public streets to commercial and residential areas, and the project site to nearby transit facilities. Project site design resulting in inadequate emergency access or response times. Appendix D includes a sample illustration of site review recommendations. 27
32 Section 5: Analysis Methodology TRAFFIC FORECASTS AND VMT ANALYSIS A fundamental requirement for establishing transportation analysis is to follow state-of-the-practice or best practice methodology. This ensures that the analysis meets environmental regulatory conditions and provides a high level of confidence in the results. For traffic volume forecasts, which will typically be performed for specific plan analysis, this means that the forecasting models being used should meet the following five criteria. The scale of the model should match that of the project. Most studies will cover local projects, meaning that they involve specific intersections, roadways, interchanges, or corridors. Therefore, locally valid travel demand models should be used to develop traffic volume forecasts. Using regional travel demand models without modification to address the scale of the project is not appropriate. The model should be calibrated and validated within the study area. The model s validation in the study area should be verified for each time period being forecast (i.e., daily, AM peak hour, PM peak hour, etc.) and for each mode being analyzed. The model validation should include static and dynamic tests. Static validation tests should include those specified in Travel Forecasting Guidelines (Caltrans, 1992), Model Validation and Reasonableness Checking Manual, (FHWA, 1997). Dynamic tests verify that the model contains an appropriate level of sensitivity related to the types of transportation network or land use changes associated with the project. Appendix E contains sample tests. The model forecasts should be adjusted to account for base year model error. Raw model volume forecasts need to be adjusted to account for differences between base year model volume estimates and base year traffic counts. The specific methodology should be based on National Cooperative Highway Research Project 255, Highway Traffic Data for Urbanized Area Project Planning and Design, Transportation Research Board, December The model s land use or socioeconomic forecasts should be tested for reasonableness. Models are used to forecast travel demand for a specific horizon year (i.e., 20 years). The land use and socioeconomic forecasts need to match the horizon year and be based 28
33 Section 5: Analysis Methodology on reasonable market conditions that reflect past and future development trends for the specific study area. A sixth criteria also applies to the specific plan areas in the Yolo County General Plan due to Policies CI-3.18 and CI-3.19, which state that vehicle miles of travel (VMT) generated by these areas shall be measured based on a travel demand forecasting model that is sensitive to built environment variables including but not limited to the 4Ds (density, diversity, design, and destinations). The intent of these policies is to recognize the influence of the built environment on vehicle trip making both in terms of vehicle trip generation and trip length. The form of the model may be a spreadsheet (see for an example), a conventional four-step travel demand model that includes the built environmental variables or uses them as a post-processor, or an activity based model (i.e., SACOG s SACSIM model) that has demonstrated sensitivity to the built environment variables. VMT is also required to be monitored for the Dunnigan Specific Plan area per Policy CI The monitoring can be performed using a household travel survey similar to that described for the mode split monitoring above (see Appendix F for sample) or through other methods approved by the County. For example, another method is to obtain odometer estimates from residents of the plan area. The odometer estimates would provide only VMT information, while the survey would provide much more detailed information about trip purposes, destinations, and use of other modes. For the Yolo County General Plan Update, a sub-area model for the County was developed using the regional SACMET model. This sub-area model is intended for County-wide analysis and did not include the 4Ds. Use of this model would likely require refinement, calibration, and validation for any local studies unless resource or schedule limitations prevent the development of a better model. In these cases, the consultant shall meet with the County to develop optional forecasting methods that are compatible with the available resources and County-approved schedule for the project analysis. 29
34 Section 6: Impact Assessment 6. IMPACT ASSESSMENT The main intent of the TIS is to determine potential transportation impacts of proposed projects. This information is essential for decision makers and the public when evaluating individual projects. This section explains what operating conditions shall be used when determining an impact. These guidelines also establish criteria for when a project impact is considered significant. Does my project result in a significant impact? SCENARIO EVALUATION Transportation impact determination for a proposed development project shall be based upon the comparison of the following scenarios using the significance criteria cited below. Existing Conditions vs. Existing Plus Project Conditions Existing Plus Approved Projects Conditions vs. Existing Plus Approved Projects Plus Project Conditions Cumulative No Project Conditions vs. Cumulative Plus Project Conditions SIGNIFICANCE CRITERIA A project impact is considered significant when it meets the criteria listed in Table 7. 30
35 Section 6: Impact Assessment TABLE 7: SIGNIFICANCE CRITERIA Elements On-Site Circulation Off-Site Traffic Operations Bicycle Facilities Pedestrian Facilities and Americans with Disabilities Act (ADA) compliance Parking Neighborhood Electric Vehicles (NEV) Trucks (or other heavy vehicles) Transit Intersection Traffic Control General Plan Consistency Other Subject Areas Other Jurisdictional Requirements Significant Impact Determination Project designs for on-site circulation, access, and parking areas fail to meet County or industry standard design guidelines. A project fails to provide adequate accessibility for service and delivery trucks on-site, including access to truck loading areas. A roadway segment or intersection operates acceptably according to Policy CI-3.1 and CI-3.2 (see Figure 1 on pages 18 and 19 above) under a no project scenario and the addition of project trips causes overall traffic operations on the facility to operate unacceptably. A roadway segment or intersection operates unacceptably according to Policy CI-3.1 and CI-3.2 (see Figure 1 on pages 18 and 19 above) under a no project scenario and the project adds 10 or more peak hour trips. A project disrupts existing or planned bicycle facilities or conflicts with adopted County nonauto plans, guidelines, policies, or standards. The project adds trips to an existing transportation facility or service (e.g., bike path) that does not meet current design standards. A project fails to provide accessible and safe pedestrian connections between buildings and to adjacent streets and transit facilities. A project disrupts existing or planned pedestrian facilities or conflicts with adopted County nonauto plans, guidelines, policies, or standards. The project adds trips to an existing transportation facility or service (e.g., sidewalk) that does not meet current design standards. A project increases off-site parking demand above that which is desired according to the County in the immediate project area. A project fails to consider NEVs in site design. A project disrupts existing or planned NEV facilities or conflicts with adopted County NEV plans, guidelines, policies, or standards. A project fails to provide safe accommodation of forecast truck traffic or temporary construction-related truck traffic. The project adds 100 daily passenger vehicle trips (or equivalent see Section 2 Vehicle and Truck Trip Equivalencies) to an existing roadway that does not meet current County design standards (e.g., structural section, horizontal and vertical curves, lane and shoulder width, etc.). A project creates demand for public transit services above the crush load capacity that is provided or planned. A project disrupts existing or planned transit facilities and services or conflicts with adopted County non-auto plans, guidelines, policies, or standards. The addition of project traffic causes an all-way stop-controlled or side street stop-controlled intersection to meet Caltrans signal warrant criteria. All intersections shall first be evaluated with roundabout intersection control. A project conflicts or creates inconsistencies with General Plan policies. For specific plans, this includes exceedance of the 44 VMT generated per household per weekday threshold established in Policies CI-3.18 and CI The construction of a project creates a temporary but prolonged impact due to lane closures, need for temporary signals, emergency vehicles access, traffic hazards to bikes/pedestrians, damage to roadbed, truck traffic on roadways not designated as truck routes, etc. The project exceeds established significance criteria thresholds for locations under the jurisdiction of other agencies. 31
36 Section 6: Impact Assessment CUMULATIVE IMPACTS Cumulative impact analysis must comply with the California Environmental Quality Act (CEQA). Land use development and infrastructure projects that are consistent with the General Plan, are expected to rely on the General Plan cumulative traffic analysis and EIR conclusions. Specific Plans will require updated cumulative traffic analysis consistent with the following definitions. The cumulative scenario is required per CEQA Guidelines Section The general definition of cumulative as a scenario is that it represents past, present, and reasonably foreseeable actions regarding land use development and the transportation network (see CEQA Guidelines Section 15355). The General Plan environmental impact report (EIR) was based on a full build out of the County s land use designations and will generally cover the cumulative traffic effects of consistent development projects. However, over time, it is likely that general plan amendments or regional growth will influence background traffic volumes. If this occurs, individual projects may be required to conduct a project-specific cumulative analysis based on the determination of the County Engineer. 32
37 Section 7: Mitigation Measures 7. MITIGATION MEASURES All significant project impacts should be mitigated consistent with the policies of the Yolo County General Plan. Under these circumstances, the applicant should meet with the County Engineer to identify mitigation measures that balance the desired vehicle LOS against other County objectives. Table 8 shows the appropriate CEQA mitigation actions for each analysis scenario. Each mitigation measure will require detailed review, often including traffic operations, to assess resulting impacts. Table 8 provides a list of common mitigation measures that may be applicable to the proposed project. TABLE 8: EXAMPLE MITIGATION MEASURES Mitigation measures may include, but are not limited to, the following examples: Roadway Capacity Expansion Traffic Control Modifications (warrants must be met) Transit Facilities Parking Facilities Pedestrian and Bicycle Facilities Land Use Changes Travel Demand Management (TDM) Optimize location of access driveway(s) Provide additional through traffic lane(s), right-turn lane(s), and left-turn lane(s) if they don t adversely impact other modes Improve sight distances at intersections and driveways to acceptable standards Provide grade separation of facilities (for very large, major developments only) Provide for yield or stop control Install roundabouts Provide coordination/synchronization of traffic signals along a corridor Provide turn-lane channelization through raised islands Restrict certain turn movements Provide bus turn-outs, bus shelters, additional bus stops, and park-and-ride lots Fund increases in transit level of service Design parking facilities to allow free-flow access to and from the street Provide off-street parking per County standards Implement shared parking among complementary land uses Provide for access to, from, and through the development for pedestrians and bicyclists Designate Class I bicycle paths, Class II bicycle lanes, and other facilities Alter density or diversity of uses to achieve vehicle trip reductions Institute flexible employee working hours where enforceable Institute preferential parking for carpools Encourage employees to use carpools and public transportation Institute Transportation Management Association (TMA) 33
38 Section 8: Recommended Process and Documentation 8. RECOMMENDED PROCESS AND DOCUMENTATION The project applicant shall retain a professional traffic engineer to conduct the transportation impact analysis. It is recommended that the applicant s consultant conduct the work in the following phased manner and seek County acceptance before initiating the next task. In some cases, review by other affected jurisdictions will be required. Transportation Study Scope of Work detailing project description, site location, analysis method, area-wide assumptions, study intersections and/or roadways, peak hours for analysis, and traffic data collection. Project Trip Generation and Trip Distribution documenting all key technical assumptions, data sources, and references. Administrative Draft Transportation Study Report prepared according to the Scope of Work, Project Trip Generation, and Trip Distribution approved by the County. The format of this report may need to be discussed with the EIR consultant to determine if an independent transportation study report is required or if the consultant should prepare a transportation and circulation section for incorporation into the EIR or Mitigated Negative Declaration. Draft Transportation Study Report addressing the County s comments on the Administrative Draft Report. Final Transportation Study Report / Response to Public Comments addressing comments from the County, Caltrans, neighboring cities, etc. The format of this report may need to be discussed with the EIR consultant. It may be a final report incorporating the comments or written responses to public comment. Appendix B contains a recommended outline for the TIS document. 34
39 Appendix A: Sample Trip Generation Calculations
40 The following table exemplifies how trip generation information and assumptions should be prepared and documented for submittal to Yolo County. TABLE A-1: SAMPLE ESTIMATED PROJECT TRIP GENERATION Daily Trip Rates Trips Land Use Size Unit Rate Trips AM Peak Hour PM Peak Hour AM Peak Hour PM Peak Hour In Out Total In Out Total In Out Total In Out Total Residential Single du , Family Apartments du Commercial Commercial ksf , Note: du = dwelling units; ksf = 1,000 square-feet 1. Trip generation based on Institute of Transportation Engineers (ITE), Trip Generation, (7 th Edition) regression equations for Single-Family Detached Housing (Land Use Code 210): Daily: Ln(T) = 0.92 Ln (X) (50% Inbound, 50% Outbound) AM Peak Hour: T = 0.70(X) (25% Inbound, 75% Outbound) PM Peak Hour: Ln (T) = 0.90 Ln (X) +.53 (63% Inbound, 37% Outbound) Where: T = trips generated, X = dwelling units, Ln = natural log 2. Trip generation based on Institute of Transportation Engineers (ITE), Trip Generation, (7 th Edition) regression equations for Apartment (Land Use Code 220): Daily : T = 6.01(X) (50% Inbound, 50% Outbound) AM Peak Hour: T = 0.49(X) (20% Inbound, 80% Outbound) PM Peak Hour: T = 0.55(X) (65% Inbound, 35% Outbound) Where: T = trips generated, X = dwelling units, Ln = natural log 3. Trip generation based on Institute of Transportation Engineers (ITE), Trip Generation, (7 th Edition) regression equations for Shopping Center (Land Use Code 820): Daily : Ln (T) = 0.65 Ln (X) (50% Inbound, 50% Outbound) AM Peak Hour: Ln (T) = 0.60 Ln (X) (61% Inbound, 39% Outbound) PM Peak Hour: Ln (T) = 0.66 Ln (X) (65% Inbound, 35% Outbound) Where: T = trips generated, X = 1,000 square-feet, Ln = natural log Source: ITE, Trip Generation, (7 th Edition), 2003; Fehr & Peers, Additional Notes: Survey data or the most recent version of ITE should be used to calculate trip generation. Pass-by reductions should be considered for commercial uses where applicable. For mixed use developments, internalization should be considered. Internalization can be calculated using ITE s Trip Generation Handbook.
41 Appendix B: TIS Report Format Outline
42 1. Introductory Items Front Cover/Title Page signed and sealed by a registered California Civil or Traffic Engineer Table of Contents, List of Figures, and List of Tables Executive Summary 2. Introduction/Background Project description Project sponsor/contact info Type and size of development Site plan (include proposed driveways, roadways, traffic control, parking facilities, emergency vehicle access, and internal circulation for vehicles, bicyclists, and pedestrians) Location map (include major streets, study intersections, and neighboring zoning and land uses) 3. Existing Conditions Existing roadway system within project site and surrounding area Location and routes of nearest public transit system serving the project Location and routes of nearest pedestrian and bicycle facilities serving the project Figure of study intersections with peak hour turning movement counts, lane geometries, and traffic control Map of study area showing ADT of study roadways Table of existing peak hour average vehicle delay and LOS 4. Existing Plus Project Conditions Table of trip generation for project Figure/map of trip distribution (in percent) Maps of study area with applicable peak hour turning movements (Project Only and Existing Plus Project) Table of Existing and Existing Plus Project intersection peak hour average vehicle delay and LOS
43 Traffic signal and other warrants Findings of project impacts Mitigation measures for project impacts (include a map showing physical mitigation) Scheduling and implementation responsibility of mitigation measures Impacts of mitigation measures 5. Existing Plus Approved Projects Conditions Table of trip generation for approved project(s) Figure and/or table of approved projects trip distribution (in percent) Map of study area with applicable peak hour turning movements (Approved Projects Only and Existing Plus Approved) Table of intersection peak hour average vehicle delay and LOS Traffic signal and other warrants 6. Existing Plus Approved Projects Plus Project Conditions Similar content to Existing Plus Project Conditions 7. Cumulative and Cumulative Plus Project Conditions Map of study area with Cumulative No Project peak hour turning movements Map of study area with Cumulative Plus Project peak hour turning movements Table of Cumulative and Cumulative Plus Project intersection peak hour average vehicle delay and LOS Traffic signal and other warrants Findings of project impacts Mitigation measures for project impacts (include a map showing physical mitigation) Scheduling and implementation responsibility of mitigation measures Impacts of mitigation measures
44 8. Construction Impacts 9. Phasing Impacts (for large projects only) 10. Appendices List of references List of authors Traffic counts Technical calculations for all analyses signed and sealed by a registered California Civil or Traffic Engineer
45 Appendix C: LOS Policies of Adjacent Jurisdictions
46 City of Davis General Plan (Adopted May 2001) Unless preempted by the County Congestion Management Plan, Level of Service E for automobiles is sufficient for arterials and collectors (both intersection and segment operations) during peak traffic hours (e.g., rush hour). Level of Service D for automobiles is sufficient for arterials, collectors, and major intersections during non-peak traffic hours. (See Glossary and Definitions for definition of Major Intersections. ) Neighborhood plans or corridor plans can allow for a level of service of F at peak times if approved by the City Council. LOS F is acceptable during peak hours in the Core Area. The reasons for adopting the new standards include: High LOS standards to achieve low levels of congestion are not necessarily linked to urban vitality and quality of life. The reduced standards would be consistent with community objectives of avoiding road widenings, which would be unacceptable in terms of community character. High LOS standards make infill development more difficult because infill uses the capacities of streets and may cause traffic volumes to approach the capacities of streets. Allowing higher levels of congestion may encourage alternative modes of transportation. City of West Sacramento General Plan (Adopted December 2004) The City shall endeavor to maintain a Level of Service C on all streets within the city, except at intersections and on roadway segments within one-quarter mile of a freeway interchange or bridge crossing of the Deep Water Ship Channel, barge canal, or Sacramento River, where a Level of Service D shall be deemed acceptable. City of Winters General Plan (Adopted May 1992) The City shall endeavor to maintain a Level of Service C or better, as defined by the 1985 Highway Capacity Manual or subsequent revisions, on all streets and intersections within the city. City of Woodland General Plan (Adopted December 2002) The City shall develop and manage its roadway system to maintain LOS C or better on all roadways, except within one-half mile of state or federal highways and freeways and within the Downtown Specific Plan area. In these areas, the City shall strive to maintain LOS D or better. Exceptions to these level of service standards may be allowed in infill areas where the City finds that the improvements or other measures required to achieve the LOS standards are unacceptable because of the right-of-way needs, the physical impacts on surrounding properties, and/or the visual aesthetics of the required improvement and its impact on community character. Caltrans See Figure 1. University of California at Davis LOS D is the minimum acceptable LOS according to the 2003 Long Range Development Plan Final EIR.
47 Appendix D: Sample Site Plan Review
48
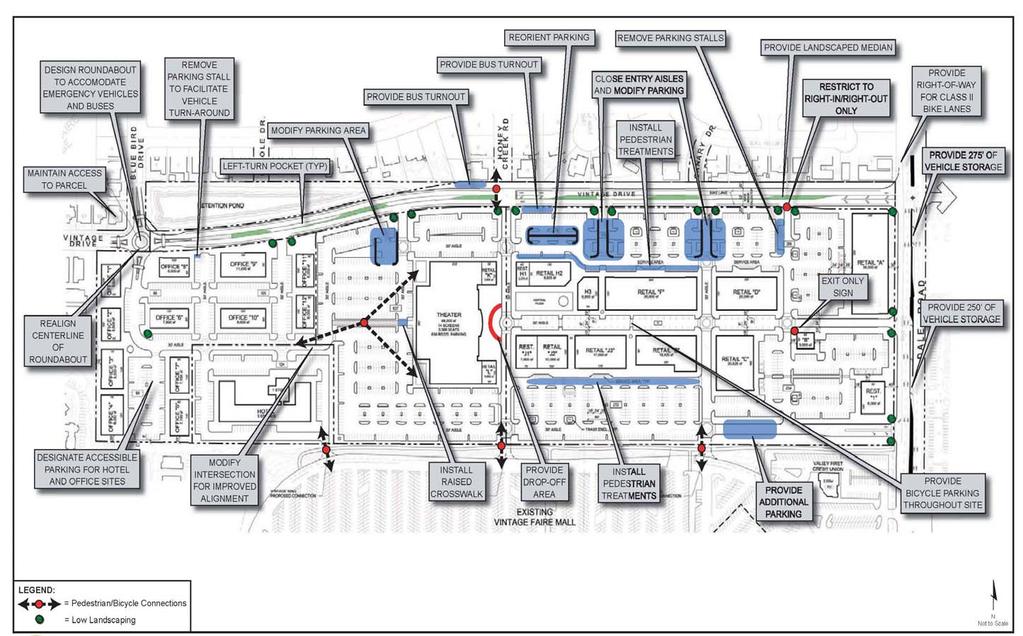
49
50 Appendix E: Travel Demand Model Validation Tests
51 As noted in the TIS guidelines, the model validation should include both static and dynamic tests. Static validation tests compare the model s base year traffic volume estimates to traffic counts using the statistical measures listed below and the threshold criteria contained in Table E-1 as specified in the Travel Forecasting Guidelines, Caltrans, Volume-to-Count Ratio is computed by dividing the volume assigned by the model and the actual traffic count for individual roadways model-wide. Percent of Links Within Caltrans Deviation Allowance the deviation is the difference between the model volume and the actual count divided by the actual count. Correlation Coefficient estimates the correlation between the actual traffic counts and the estimated traffic volumes from the model. Percent Root Mean Square Error (RMSE) is the square root of the model volume minus the actual count squared divided by the number of counts. It is a measure similar to standard deviation in that it assesses the accuracy of the entire model. TABLE E-1: STATIC VALIDATION CRITERIA AND THRESHOLDS Validation Item Criteria for Acceptance 1 Percent of links with volume-to-count ratios within Caltrans deviation allowance At Least 75% Correlation Coefficient At Least 0.88 Percent Root Mean Squared Error (RMSE) Below 40% Notes: 1 Travel Forecasting Guidelines, Caltrans, Dynamic validation determines a model s sensitivity to changes in land uses and/or the transportation system. These tests are recommended in the Model Validation and Reasonableness Checking Manual (Travel Model Improvement Program, FHWA, 1997). The results of dynamic validation tests are inspected for reasonableness in the direction and magnitude of the changes. Dynamic validation can include the following model sensitivity tests, as appropriate given the specific type of project under analysis. Add lanes to a link Add a link Delete a link Change link speeds Change link capacities Add 100 households to a TAZ Add 1,000 households to a TAZ Add 5,000 households to a TAZ Add 10,000 households to a TAZ Review of the dynamic validation tests should indicate changes to the model volumes have occurred in the appropriate direction and magnitude.
52 Appendix F: Sample Household Travel Survey
53 2003 Travel Diary Study TRAVEL SURVEY INSTRUCTIONS THE MATERIALS This packet contains: a) a cover letter and these instructions b) a Travel Diary c) an overflow sheet, if needed to record more trips than fit on the Travel Diary d) a Household Travel Survey e) a postage paid return envelope. Please review the materials briefly before continuing to read the instructions. If any materials are missing, please call Lee or Rachel of the National Research Center, Inc. at , and materials will be mailed to you. YOUR TRAVEL DIARY DAY The day selected for you to record your travel on the enclosed Travel Diary is SUNDAY, SEPTEMBER 28, You should keep your travel diary on this day regardless of weather or number and type of activities you have planned. IMPORTANT: You should not change your travel behavior just because you are keeping this diary. If you were going to take the car, take the car. If you were planning to go by bus, go by bus. Don t let the fact that you are recording your travel influence how or whether you go places. Honest responses of your travel behavior for a single day whether your travel is typical or unusual are needed for this study to be reliable. Please record all trips whether you are a passenger, driver or pedestrian. If you will be out of town or have a problem with the day you have been assigned, you may complete the diary on the same day of the next week (on Sunday, October 5th). However, if you must do this, please contact Lee or Rachel at as soon as possible to let us know of the change in your travel diary day. COMPLETING THE TRAVEL DIARY The travel diary is the 8½ x 11 card included in this packet. You should take this card with you on Sunday, your assigned travel diary day. On it you will report every trip you make, beginning at 12:01 am (that is, right after midnight of the previous day) until 12:00 midnight Sunday. Sample WHAT IS A TRIP? A trip is a one-way journey that takes you further than one city block (about 200 yards) from your original location. Examples of trips include: 1) You take your car to work 6 miles away 2) You walk 2 blocks to the grocery store 3) You carpool with another person 12 blocks to the Park-n-Ride (bus pick-up) 4) You ride your bike 2 miles along the Boulder Creek for enjoyment 5) You jog along the Mesa Trail for exercise 6) You take the bus to Denver for a concert. Examples of what does NOT count as a trip include: 1) You walk across the hall to use the photocopier; 2) You drive to the next building (less than 200 yards away) for a business meeting; 3) You skateboard across the street to the neighbor's house. A round trip counts as two trips. For example: 1) You drive to the grocery store and back. Record two trips on your diary. 2) You go for a half-hour jog or bike ride. (This is counted as two trips because you leave home on the first leg of the trip and return home on the second leg. Your destination is your halfway point.) (continued on reverse side)
54 What if you don't make any trips during the day assigned to you? There is a box on the Travel Diary form you can check if you make no trips on your assigned travel day. Please check this box, and complete the Household Survey. It is important that we get an accurate picture of travel patterns within Boulder, including the number of people who make no trips. What if you make more than 9 trips during the day assigned to you? The Travel Diary allows you to record up to 9 trips. If you take more than this number on your assigned day, please use the overflow sheet. If you make more trips than can be recorded on the Travel Diary and overflow sheet, call the National Research Center, and they will either record your trips over the phone, or send you more overflow sheets. What if you work a job that requires frequent travel on the day assigned to you? If you work a job that requires you to make many trips during the 24-hour period (e.g., cab driver, pizza delivery driver, sales person), please call the National Research Center. Lee or Rachel will give you special instructions for completing your Travel Diary. What about trips with multiple stops? Record each leg of the trip. An example: You walk with your 8-year old to school, then catch the bus to downtown Boulder to shop, then return home, stopping to pick up a prescription at the drugstore. This would be counted as four trips. Outbound from your home the destination is the school. The next destination is downtown. Inbound back to your home, record first the stop at the drugstore, and then your home. What about walking to a bus stop (or other trips with changes of travel mode)? Please record every leg of a trip, even when it is just to change travel modes. For example, if you drive to the Park-n-Ride (1 mile), then take the bus to Denver (25 miles) and then walk 5 blocks to work, all three of those trips should be recorded on the Travel Diary form. The purpose of the first two trips would be to change travel mode, while the third would be work commute. What about bus transfers? Stops only to transfer from one bus to another do not count as separate trips. EXAMPLE OF A COMPLETED TRAVEL DIARY Jane Smith drove from her home at 3523 N. 16th Street to work at CU, first dropping her 9 year old daughter at University Hill Elementary School. At noon, Jane walked to the Hill for lunch (5 blocks from the building on campus where she works). After work, Jane picked up her daughter and drove home. She jogged for two miles in her neighborhood before dinner. When dinner was over, Jane and her family rode their bikes to the Willow Springs Shopping Center for ice cream. Sample The Travel Diary example on the next page shows how Jane s form would be completed. Please note the following: 1. Jane s travel to work with her daughter is counted as two trips; the first is with her daughter to the elementary school -- this trip is designated as drive a passenger ; the second is from the school to work. 2. Although Jane is going to a school (CU), it is for the purpose of work, and is designated as a work commute trip. 3. Jane records her trip (walking) to lunch as well as her trip from lunch back to work (two trips). Her trip back to the school is recorded as work commute, because she is returning to her workplace, although she did not come straight from home. 4. After work, Jane s trip to pick up her daughter (even though the daughter is not in the car) is designated as a trip to drive a passenger. 5. Jane counts her jog in the neighborhood as two trips, even though she made no stops between leaving home and returning home. Jogging and running are considered walking for the purposes of this travel diary. 6. When the family rides their bikes to the shopping center for an ice cream, this is a snack and is designated as social/recreation rather than eating a meal. The INSTRUCTIONS FOR COMPLETING THE TRAVEL DIARY on the reverse side of the example diary give more detailed information about completing your diary form. Please contact Lee or Rachel at National Research Center, Inc. at if you have any other questions. Thank you very much for your participation in this study.
 Sample")
55 EXAMPLE OF A COMPLETED TRAVEL DIARY (See previous page for descriptions of Jane s travel on her assigned day.) Sample
, you may just write \"SAME\" however be sure to include the Nearest Cross Streets.")
56 Please remember to fill in the date of the day you complete the travel diary! Record the location at which you are beginning your travel for the day. If it is your home (the same address as in the information box), you may just write "SAME" however be sure to include the Nearest Cross Streets. Please list the address, building or nearest intersection to the location you are going. You do not need to determine the precise address of every location if you can name an intersection, or a building, which is common enough to be recognized (e.g., "Crossroads Mall"). Please try to keep good estimates of the start and end times. These are the start and end times of the TRIP, not of the reason you are making the trip. For example, if you go to the store, please record the time you left for the store (trip start time), and then the time you arrived at the store (trip end time). When you leave the store, please record the time you left the store (trip start time), and then the time you arrived at your next destination (trip end time). The time you leave the store is not the trip end time of the first trip; we are only interested in the duration of the actual trip to the store, not how much time was spent at the store. Instructions for Completing the Travel Diary Go Home: A trip from some other location to your usual place of residence. Personal Business: Travel which is made to obtain services, not products. (E.g. bank, post office, doctor, auto repair.) Shopping: Travel to shop or to purchase products. School: Travel by a student to college or school. Travel by a teacher or other employee to the school where employed should be classified as a work commute trip. If you are driving a student to school, the trip should be classified as "drive a passenger. Work Commute: Travel to or from your workplace. Other Work/business: Travel done for work, to someplace other than the workplace. (E.g., sales calls, trips to purchase office supplies for work.) Social/Recreation: Trips made when no business is transacted. (E.g., parties, participatory sports, cultural or athletic events, church activities, visits to friends.) Eat a Meal: Examples include going to a restaurant, going to a friend's house for dinner, or home from work for lunch. Stops for snacks or refreshments should be classified as "social/recreation". Drive a Passenger: Use this category for trips or stops to pick up or deliver someone to a specific location. (E.g., taking a friend to the store, picking up a child from school.) Change Travel Mode: If you drive your car, walk more than one block, or ride your bike to catch the bus, this is a "change travel mode" trip. However, if you transfer from one bus to another, it should not be included in this category because you traveled in buses without changing travel modes. (Be sure to record all the routes you used to make the trip.) Other: Any trip you make which does not seem to fit in the categories listed should be put in the "other" category. Please list what the trip purpose was in the blank provided. Also, if you have a question as to where to put a certain trip because you can't decide between two categories, list it in the "other" category. Sample If you did not make any trips in the 24- hour period, you should indicate so by checking this box. Please make sure you have filled out your name, address and the diary date assigned to you; you do not need to complete the rest of the diary. Please include yourself as one of the adults if you are in a vehicle! You can record the number of blocks instead of miles if it is easier, but PLEASE write in "blocks" on your form, so we don't mistake it for miles. If you are in a vehicle with an odometer, please check it at the beginning and end of each trip you make. Be careful if you select "car or light truck", because there are two answers for this category -- passenger or driver. If you use one of these categories, please also fill in the number of adults and children in the vehicle (including yourself as one of the adults). "Large commercial truck" refers to large trucks used by businesses for commercial purposes.
Circulation in Elk Grove includes: Motor vehicles, including cars and trucks
 Circulation, as it is used in this General Plan, refers to the many ways people and goods move from place to place in Elk Grove and the region. Circulation in Elk Grove includes: Motor vehicles, including
TRAFFIC STUDY GUIDELINES Clarksville Street Department
 TRAFFIC STUDY GUIDELINES Clarksville Street Department 9/1/2009 Introduction Traffic studies are used to help the city determine potential impacts to the operation of the surrounding roadway network. Two
TRAFFIC IMPACT STUDY CRITERIA
 Chapter 6 - TRAFFIC IMPACT STUDY CRITERIA 6.1 GENERAL PROVISIONS 6.1.1. Purpose: The purpose of this document is to outline a standard format for preparing a traffic impact study in the City of Steamboat
CITY OF COCOA BEACH 2025 COMPREHENSIVE PLAN. Section VIII Mobility Element Goals, Objectives, and Policies
 CITY OF COCOA BEACH 2025 COMPREHENSIVE PLAN Section VIII Mobility Element Goals, Objectives, and Policies Adopted August 6, 2015 by Ordinance No. 1591 VIII MOBILITY ELEMENT Table of Contents Page Number
Magnolia Place. Traffic Impact Analysis. Prepared for: City of San Mateo. Prepared by: Hexagon Transportation Consultants, Inc.
 Magnolia Place Traffic Impact Analysis Prepared for: City of San Mateo Prepared by: Hexagon Transportation Consultants, Inc. Updated January 4, 2010 Table of Contents 1. Introduction...1 2. Existing Conditions...6
SECTION 1 - TRAFFIC PLANNING
 SECTION 1 - TRAFFIC PLANNING 1.1 TRAFFIC OPERATIONS 1.1.1 Roadway Functional Classification The Multnomah County Comprehensive Framework Plan s Policy 34: Trafficways and the Functional Classification
Exhibit 1 PLANNING COMMISSION AGENDA ITEM
 Exhibit 1 PLANNING COMMISSION AGENDA ITEM Project Name: Grand Junction Circulation Plan Grand Junction Complete Streets Policy Applicant: City of Grand Junction Representative: David Thornton Address:
Clackamas County Comprehensive Plan
 ROADWAYS The County s road system permits the movement of goods and people between communities and regions, using any of a variety of modes of travel. Roads provide access to virtually all property. They
Corpus Christi Metropolitan Transportation Plan Fiscal Year Introduction:
 Introduction: The Safe, Accountable, Flexible, Efficient Transportation Equity Act: A Legacy for Users (SAFETEA-LU) has continued the efforts started through the Intermodal Surface Transportation Efficiency
CHAPTER 4 TRANSPORTATION IMPACT STUDY TABLE OF CONTENTS
 CHAPTER 4 TRANSPORTATION IMPACT STUDY TABLE OF CONTENTS Section Title Page 4.1 Introduction... 4-1 4.1.1 General... 4-1 4.1.2 Applicant Responsibility... 4-1 4.1.3 Capacity and Safety Issues... 4-1 A.
NM-POLICY 1: Improve service levels, participation, and options for non-motorized transportation modes throughout the County.
 Transportation PRINCE WILLIAM COUNTY 2008 COMPREHENSIVE PLAN NON-MOTORIZED PLAN CONTENTS Goals, Policies, and Action Strategies Table 4 (Bike Facility Classifications and Descriptions) Table 5 (Bike Facility
Proposed. City of Grand Junction Complete Streets Policy. Exhibit 10
 Proposed City of Grand Junction Complete Streets Policy Exhibit 10 1 City of Grand Junction Complete Streets Policy Vision: The Complete Streets Vision is to develop a safe, efficient, and reliable travel
AMATS Complete Streets Policy
 AMATS Complete Streets Policy Table of Contents: Section 1. Definition of Complete Streets Section 2. Principles of Complete Streets Section 3. Complete Streets Policy Section 4. Consistency Section 5.
A Traffic Operations Method for Assessing Automobile and Bicycle Shared Roadways
 A Traffic Operations Method for Assessing Automobile and Bicycle Shared Roadways A Thesis Proposal By James A. Robertson Submitted to the Office of Graduate Studies Texas A&M University in partial fulfillment
Complete Street Analysis of a Road Diet: Orange Grove Boulevard, Pasadena, CA
 Complete Street Analysis of a Road Diet: Orange Grove Boulevard, Pasadena, CA Aaron Elias, Bill Cisco Abstract As part of evaluating the feasibility of a road diet on Orange Grove Boulevard in Pasadena,
RESOLUTION NO ?? A RESOLUTION OF THE CITY OF NEPTUNE BEACH ADOPTING A COMPLETE STREETS POLICY
 RESOLUTION NO. 2018-?? A RESOLUTION OF THE CITY OF NEPTUNE BEACH ADOPTING A COMPLETE STREETS POLICY WHEREAS, safe, convenient, and accessible transportation for all users is a priority of the City of Neptune
4.0 TRAFFIC IMPACT STUDIES
 SECTION 4 4.0 TRAFFIC IMPACT STUDIES 4.1 TRAFFIC IMPACT STUDY REQUIREMENTS The City has established Traffic Impact Study (TIS) requirements for the purpose of ensuring that both the quantitative and qualitative
Solana Beach Comprehensive Active Transportation Strategy (CATS)
") Solana Beach Comprehensive Active Transportation Strategy (CATS) 3.0 Goals & Policies The Solana Beach CATS goals and objectives outlined below were largely drawn from the Solana Beach Circulation Element
Solana Beach Comprehensive Active Transportation Strategy (CATS) 3.0 Goals & Policies The Solana Beach CATS goals and objectives outlined below were largely drawn from the Solana Beach Circulation Element
Roadway Classification Design Standards and Policies. Pueblo, Colorado November, 2004
 Roadway Classification Design Standards and Policies Pueblo, Colorado November, 2004 Table of Contents Page Chapter 1. General Provisions 1.1 Jurisdiction 3 1.2 Purpose and Intent 3 1.3 Modification 3
ACTIVE TRANSPORTATION
 ACTIVE TRANSPORTATION Mobility 2040 Supported Goals Improve the availability of transportation options for people and goods. Support travel efficiency measures and system enhancements targeted at congestion
Vision: Traditional hamlet with an attractive business/pedestrian friendly main street connected to adjacent walkable neighborhoods
 N D. Focus Area II Vision: Traditional hamlet with an attractive business/pedestrian friendly main street connected to adjacent walkable neighborhoods Transit Road Focus Area II is located in the Hamlet
CITY OF BLOOMINGTON COMPLETE STREETS POLICY
 CITY OF BLOOMINGTON COMPLETE STREETS POLICY POLICY OBJECTIVE: The City of Bloomington will enhance safety, mobility, accessibility and convenience for transportation network users of all ages and abilities,
Chapter 4 Traffic Analysis
 Chapter 4 Traffic Analysis PURPOSE The traffic analysis component of the K-68 Corridor Management Plan incorporates information on the existing transportation network, such as traffic volumes and intersection
3.16 TRANSPORTATION, CIRCULATION, AND PARKING Regulatory Setting Environmental Setting ROADWAY SYSTEM
 3.16 TRANSPORTATION, CIRCULATION, AND PARKING This section assesses the potential for implementation of the Orchard Park Redevelopment component of the 2018 LRDP to result in impacts related to transportation,
SANTA CLARA COUNTYWIDE BICYCLE PLAN August 2008
 SANTA CLARA COUNTYWIDE BICYCLE PLAN August 2008 To assist VTA and Member Agencies in the planning, development and programming of bicycle improvements in Santa Clara County. Vision Statement To establish,
Bridge Street Corridor Study Report
 Bridge Street Corridor Study Report Prepared for: Prepared by: BRIDGE STREET CORRIDOR STUDY REPORT PREPARED FOR: CITY OF ARROYO GRANDE COMMUNITY DEVELOPMENT DEPARTMENT 300 EAST BRANCH STREET ARROYO GRANDE,
5.0 Roadway System Plan
 Southwest Boise Transportation Study Page 16 5.0 Roadway System Plan The Roadway System Plan outlines roadway improvements in the Initial Study Area. It forecasts future deficiencies on the arterial system,
Executive Summary Route 30 Corridor Master Plan
 Route Corridor Master Plan Project Overview The Route Corridor Master Plan is a coordinated multimodal transportation and land use plan for the entire stretch of Route through East Whiteland Township,
TOWN OF PORTLAND, CONNECTICUT COMPLETE STREETS POLICY
 TOWN OF PORTLAND, CONNECTICUT COMPLETE STREETS POLICY I. VISION, GOALS & PRINCIPLES VISION To improve the streets of Portland making them safer and more accessible for all users including pedestrians,
City of Novi Non-Motorized Master Plan 2011 Executive Summary
 City of Novi Non-Motorized Master Plan 2011 Executive Summary Prepared by: February 28, 2011 Why Plan? Encouraging healthy, active lifestyles through pathway and sidewalk connectivity has been a focus
This chapter describes the proposed circulation system and transportation alternatives associated with
 5.0 Circulation 5.1 OVERVIEW This chapter describes the proposed circulation system and transportation alternatives associated with West Landing, and summarize the information contained in the Existing
4. ENVIRONMENTAL IMPACT ANALYSIS 9. TRANSPORTATION AND TRAFFIC
 4. ENVIRONMENTAL IMPACT ANALYSIS 9. TRANSPORTATION AND TRAFFIC 4.9.1 INTRODUCTION The following section addresses the Proposed Project s impact on transportation and traffic based on the Traffic Study
Moving Cambridge. City of Cambridge Transportation Master Plan Public Consultation Centre. March 7, :00 8:00 PM.
 City of Cambridge Transportation Master Plan Public Consultation Centre March 7, 2018 5:00 8:00 PM Region of Waterloo City of Cambridge Transportation Master Plan Public Consultation Centre March 7, 2018
Route 7 Corridor Study
 Route 7 Corridor Study Executive Summary Study Area The following report analyzes a segment of the Virginia State Route 7 corridor. The corridor study area, spanning over 5 miles in length, is a multi
CHAPTER 16 PEDESTRIAN FACILITIES DESIGN AND TECHNICAL CRITERIA TABLE OF CONTENTS
 CHAPTER 16 PEDESTRIAN FACILITIES DESIGN AND TECHNICAL CRITERIA TABLE OF CONTENTS Section Title Page 16.1 General... 16-1 16.1.1 AASHTO Reference... 16-1 16.1.2 ADA Requirements... 16-1 16.2 Sidewalks...
Traffic Impact Study. Westlake Elementary School Westlake, Ohio. TMS Engineers, Inc. June 5, 2017
 TMS Engineers, Inc. Traffic Impact Study Westlake Elementary School Westlake, Ohio June 5, 2017 Prepared for: Westlake City Schools - Board of Education 27200 Hilliard Boulevard Westlake, OH 44145 TRAFFIC
TRANSPORTATION TRAINING TOPICS. April 6, 2010
 TRANSPORTATION TRAINING TOPICS April 6, 2010 Roles of Transportation Providers Context and Policy Makers Division of Transportation and Traffic Other City Operations Other Transportation Operators CMA
Berkeley Strategic Transportation Plan A-76
 Berkeley Strategic Transportation Plan A-76 Appendices 1. A Team Effort 2. Where We ve Been A-11 Berkeley Strategic Transportation Plan Alameda County Transportation Plan Alameda County will be served
Anne Arundel County BICYCLE, PEDESTRIAN, TRANSIT ASSESSMENT GUIDELINES
 Anne Arundel County BICYCLE, PEDESTRIAN, TRANSIT ASSESSMENT GUIDELINES December 2018 TABLE OF CONTENTS I. Executive Summary 3 II. When Is A Bicycle Pedestrian Transit Assessment (BPTA) Required? 4 III.
Traffic Impact Memorandum. May 22, 2018
 BISHOP PROFESSIONAL DEVELOPMENT BUILDING Proposed Land-use Change & Parking Modification 3601 SW 31st Street Topeka, Kansas 66614 CFS Project No. 185077 Traffic Impact Memorandum May 22, 2018 Prepared
TABLE OF CONTENTS TABLE OF CONTENTS... I APPENDICES... III LIST OF EXHIBITS... V LIST OF TABLES... VII LIST OF ABBREVIATED TERMS...
 TABLE OF CONTENTS TABLE OF CONTENTS... I APPENDICES... III LIST OF EXHIBITS... V LIST OF TABLES... VII LIST OF ABBREVIATED TERMS... IX 1 INTRODUCTION... 1 1.1 Project Overview... 1 1.2 Analysis Scenarios...
2025 Comprehensive Plan for the City of Temple Terrace Florida. Mobility Element. Adopted by City Council June 30, 2009
 2025 Comprehensive Plan for the City of Temple Terrace Florida Mobility Element Adopted by City Council June 30, 2009 Effective Date September 22, 2009 GOAL 2: To protect and promote the quality of life
COUNTY OF YOLO BICYCLE TRANSPORTATION PLAN
 COUNTY OF YOLO BICYCLE TRANSPORTATION PLAN Bicycle Routes and Priorities Prepared by the Yolo County Transportation Advisory Committee In accordance with the California Streets and Highways Code Section
Living Streets Policy
 Living Streets Policy Introduction Living streets balance the needs of motorists, bicyclists, pedestrians and transit riders in ways that promote safety and convenience, enhance community identity, create
Chapter 2: Standards for Access, Non-Motorized, and Transit
 Standards for Access, Non-Motorized, and Transit Chapter 2: Standards for Access, Non-Motorized, and Transit The Washtenaw County Access Management Plan was developed based on the analysis of existing
NEIGHBORHOOD TRAFFIC CALMING POLICY
 NEIGHBORHOOD TRAFFIC CALMING POLICY I. PURPOSE The City of Kent continually strives to strengthen and protect its neighborhoods by improving the quality of life in residential areas. Traffic conditions
General Plan Circulation Element Update Scoping Meeting April 16, 2014 Santa Ana Senior Center, 424 W. 3rd Street, Santa Ana, CA 92701
 General Plan Circulation Element Update Scoping Meeting April 16, 2014 Santa Ana Senior Center, 424 W. 3rd Street, Santa Ana, CA 92701 Meeting Agenda 1. Purpose of Scoping Meeting 2. Project Overview 3.
Highway 111 Corridor Study
 Highway 111 Corridor Study June, 2009 LINCOLN CO. HWY 111 CORRIDOR STUDY Draft Study Tea, South Dakota Prepared for City of Tea Sioux Falls Metropolitan Planning Organization Prepared by HDR Engineering,
Bicycle Master Plan Goals, Strategies, and Policies
 Bicycle Master Plan Goals, Strategies, and Policies Mobilizing 5 This chapter outlines the overarching goals, action statements, and action items Long Beach will take in order to achieve its vision of
TRANSPORTATION ANALYSIS REPORT US Route 6 Huron, Erie County, Ohio
 TRANSPORTATION ANALYSIS REPORT US Route 6 Huron, Erie County, Ohio December 12, 2012 Prepared for: The City of Huron 417 Main Huron, OH 44839 Providing Practical Experience Technical Excellence and Client
ADOT Statewide Bicycle and Pedestrian Program Summary of Phase IV Activities APPENDIX B PEDESTRIAN DEMAND INDEX
 ADOT Statewide Bicycle and Pedestrian Program Summary of Activities APPENDIX B PEDESTRIAN DEMAND INDEX May 24, 2009 Pedestrian Demand Index for State Highway Facilities Revised: May 29, 2007 Introduction
CITY MANUALS AND STANDARDS REVIEW
 GEORGETOWN SIDEWALK MASTER PLAN CITY MANUALS AND STANDARDS REVIEW RESOURCES AND STANDARDS As part of the Master Plan process, a review and evaluation of current City documents and policies relevant to
Chapter 7. Transportation. Transportation Road Network Plan Transit Cyclists Pedestrians Multi-Use and Equestrian Trails
 Chapter 7 Transportation Transportation Road Network Plan Transit Cyclists Pedestrians Multi-Use and Equestrian Trails 7.1 TRANSPORTATION BACKGROUND The District of Maple Ridge faces a number of unique
D.13 Transportation and Traffic
 This section addresses transportation and traffic issues and impacts related to the Proposed Project. Section D.13.1 provides a description of the affected environment for the Proposed Project. Applicable
Multimodal Analysis in the 2010 Highway Capacity Manual
 Multimodal Analysis in the 2010 Highway Capacity Manual It s not just cars anymore! Jamie Parks, AICP HCAT Conference May 9-10, 2011 Multimodal LOS in the 2010 HCM History and background Overview of methods
This document may be reprinted or extracted without permission, provided credit to the City of Pasadena Department of Transportation
 TRANSPORTATION IMPACT ANALYSIS CURRENT PRACTICE & GUIDELINES Prepared by: Transportation Complete Streets Division Department of Transportation 20150925 This document may be reprinted or extracted without
INTRODUCTION THOROUGHFARE SYSTEM CLASSIFICATIONS
 INTRODUCTION The thoroughfare plan will assist public officials in the development of a specialized system for efficient and safe movement of vehicular traffic while minimizing potential conflicts with
List of Attachments. Location Map... Site Plan... City of Lake Elsinore Circulation Element... City of Lake Elsinore Roadway Cross-Sections...
 List of Attachments Exhibits Location Map... Site Plan... City of Lake Elsinore Circulation Element... City of Lake Elsinore Roadway Cross-Sections... Existing Lane Geometry and Traffic Controls... Existing
Omaha s Complete Streets Policy
 Omaha s Complete Streets Policy (Adopted August 2015) VISION To create great places and enhance our quality of life, the City of Omaha will provide safe, accessible streets for all users. Complete Streets
Mission Street Medical Office Development
 reet Medical Office Development Traffic Impact Analysis Prepared for: Palo Alto Medical Foundation February 23, 2012 Hexagon Office: 7888 Wren Avenue, Suite B121 Gilroy, CA 95020 Hexagon Job Number: 11RD11
APPROVE A RESOLUTION ADOPTING A COMPLETE STREETS POLICY
 STAFF REPORT MEETING DATE: September 13, 2016 TO: FROM: City Council Bob Brown, Community Development Director Russ Thompson, Public Works Director Patrick Filipelli, Management Analyst 922 Machin Avenue
CITY OF WEST KELOWNA COUNCIL POLICY MANUAL
 CITY OF WEST KELOWNA COUNCIL POLICY MANUAL Page 1 of 7 DEPARTMENT: Engineering Services SUBJECT: Traffic Calming Policy (Revised June 6, 2017) Policy Statement: The provision of traffic calming measures
Proposed White Flint Separated Bike Lane Network September 2015
 Proposed White Flint Separated Bike Lane Network September 2015 Abstract This report includes a proposed separated bike lane network for the White Flint Sector Plan area. Separated bike lanes create a
EXECUTIVE SUMMARY... vii 1 STUDY OVERVIEW Study Scope Study Area Study Objectives
 Contents EXECUTIVE SUMMARY... vii 1 STUDY OVERVIEW... 1-1 1.1 Study Scope... 1-1 1.2 Study Area... 1-1 1.3 Study Objectives... 1-3 2 EXISTING CONDITIONS... 2-1 2.1 Existing Freeway Conditions... 2-4 2.1.1
Multimodal Through Corridors and Placemaking Corridors
 68 Multimodal Through Corridors and Placemaking Corridors Corridors have different functions in a region. Some corridors are used to get smoothly and rapidly through a region or to get quickly to major
METHODOLOGY. Signalized Intersection Average Control Delay (sec/veh)
") Chapter 5 Traffic Analysis 5.1 SUMMARY US /West 6 th Street assumes a unique role in the Lawrence Douglas County transportation system. This principal arterial street currently conveys commuter traffic
Chapter 5 Traffic Analysis 5.1 SUMMARY US /West 6 th Street assumes a unique role in the Lawrence Douglas County transportation system. This principal arterial street currently conveys commuter traffic
3.9 - Transportation and Traffic
 Transportation and Traffic 3.9 - Transportation and Traffic This section describes the potential transportation and traffic effects of project implementation on the project site and its surrounding area.
3.9 - Traffic and Transportation
 Sacramento LAFCo - Incorporation of Arden Arcade Traffic and Transportation 3.9 - Traffic and Transportation 3.9.1 - Summary This section describes the existing traffic and transportation conditions and
Madison Urban Area and Dane County. Bicycle Transportation Plan Summary. September Introduction. Bicycle Plan Scope and Planning Process
 Bicycle Transportation Plan Summary Madison Urban Area and Dane County Introduction September 2000 Bicycling is an important mode of transportation in the Madison urban area and countywide that is available
PEDESTRIAN ACTION PLAN
 ATTACHMENT 2 CITY OF SANTA MONICA PEDESTRIAN ACTION PLAN CITY OF SANTA MONICA PEDESTRIAN ACTION PLAN This page intentionally left blank EXECUTIVE SUMMARY CHAPTER 1 EXECUTIVE SUMMARY Setting the Stage
APPENDIX A: Complete Streets Checklist DRAFT NOVEMBER 2016
 APPENDIX A: Complete Streets Checklist DRAFT NOVEMBER 2016 Complete Streets Checklist MetroPlan Orlando s Complete Streets Checklist is an internal planning tool for staff to further implementation of
7/23/2017 VIA . Michael Hanebutt City of Sacramento Community Development Department 300 Richards Boulevard, 3 rd Floor Sacramento, CA 95811
 7/23/2017 VIA EMAIL Michael Hanebutt City of Sacramento Community Development Department 300 Richards Boulevard, 3 rd Floor Sacramento, CA 95811 RE: 65 th Street Apartments (DR17-220) Dear Mr. Hanebutt:
Technical Memorandum TRAFFIC IMPACT STUDY. RIDLEY ROAD CONVENIENCE STORE Southampton County, VA. Prepared for: Mr. David Williams.
 Technical Memorandum TRFFIC IMPCT STUDY RIDLEY ROD CONVENIENCE STORE Southampton County, V Prepared for: Mr. David Williams By: Charles Smith, P.E., PTOE EPR Charlottesville, V July 2014 1 TBLE OF CONTENTS
Contents. Champaign-Urbana Mass Transit District Stop Placement Guidelines
 Contents Champaign-Urbana Mass Transit District Introduction... 1 Stop Spacing... 2 Rural... 2 Low Density Suburban... 2 General Urban... 2 Urban Core... 2 Operational Safety... 3 Stop Placement... 4 Nearside
TRAFFIC IMPACT STUDY And A TRAFFIC SIGNAL WARRANT ANALYSIS FOR A SENIOR LIVING AND APARTMENT DEVELOPMENT
 TRAFFIC IMPACT STUDY And A TRAFFIC SIGNAL WARRANT ANALYSIS FOR A SENIOR LIVING AND APARTMENT DEVELOPMENT DEERFIELD TOWNSHIP, WARREN COUNTY, OHIO Nantucket Circle and Montgomery Road () Prepared for: ODLE
Improve the livability of our streets by
 Pedestrian and Traffic Calming Policy March 2018 2 of 6 Neighborhood Traffic Calming Policy The City of Aspen continually strives to protect multimodal function while maintaining a high standard of safety.
5/31/2016 VIA . Arwen Wacht City of Sacramento Community Development Department 300 Richards Blvd., 3 rd Floor Sacramento, CA 95811
 5/31/2016 VIA EMAIL Arwen Wacht City of Sacramento Community Development Department 300 Richards Blvd., 3 rd Floor Sacramento, CA 95811 RE: El Pollo Loco (P16-028) Dear Ms. Wacht: WALKSacramento has reviewed
5/7/2013 VIA . RE: University Village Safeway Expansion (P13-019)
") 5/7/2013 VIA EMAIL David Hung, Associate Planner Community Development Department, Current Planning Division City of Sacramento 300 Richards Boulevard, 3 rd Floor Sacramento, CA 95811 RE: University Village
5/7/2013 VIA EMAIL David Hung, Associate Planner Community Development Department, Current Planning Division City of Sacramento 300 Richards Boulevard, 3 rd Floor Sacramento, CA 95811 RE: University Village
TRAFFIC IMPACT ANALYSIS
 TRAFFIC IMPACT ANALYSIS FOR THE CHAMPAIGN UNIT#4 SCHOOL DISTRICT PROPOSED HIGH SCHOOL (SPALDING PARK SITE) IN THE CITY OF CHAMPAIGN Final Report Champaign Urbana Urbanized Area Transportation Study 6/24/2014
CONNECTING PEOPLE TO PLACES
 CONNECTING PEOPLE TO PLACES 82 EAST BENCH MASTER PLAN 07 Introduction The East Bench transportation system is a collection of slow moving, treelined residential streets and major arteries that are the
Chapter 5 Future Transportation
 Chapter 5 Future Transportation The Future Land Use Plan identifies the desired land use designations. The land uses desired for Crozet depend, in large part, on the success of the transportation system,
HARRISON STREET/OAKLAND AVENUE COMMUNITY TRANSPORTATION PLAN
 HARRISON STREET/OAKLAND AVENUE Community Workshop #4: Draft Plan Review December 3, 2009 D E S I G N, C O M M U N I T Y & E N V I R O N M E N T INTRODUCTIONS Key Project Staff: Alisa Shen, Project Manager,
Overview. Existing Conditions. Corridor Description. Assessment
 Overview A study of the 23 rd Street corridor was undertaken to document the existing conditions, analyze traffic operations, and recommend remedies for deficient situations Although 23 rd Street is frequently
Town of Bethlehem. Planning Assessment. Bethlehem Town Board
 Town of Bethlehem US 9W Corridor Transportation Planning Assessment Presented e to: Bethlehem Town Board June 2009 Overview Study Background Route 9W Corridor Conditions and Improvements Selkirk Bypass
Develop a Multi-Modal Transportation Strategy (Theme 6)
") DEVELOP A MULTI-MODAL TRANSPORTATION STRATEGY (THEME 6) WHY IS THIS THEME ADDRESSED? Develop a Multi-Modal Transportation Strategy (Theme 6) Statement of Ideal Reduce resident and visitor reliance on single
DEVELOP A MULTI-MODAL TRANSPORTATION STRATEGY (THEME 6) WHY IS THIS THEME ADDRESSED? Develop a Multi-Modal Transportation Strategy (Theme 6) Statement of Ideal Reduce resident and visitor reliance on single
Non-Motorized Transportation 7-1
 Non-Motorized Transportation 7-1 Transportation facilities no longer mean just accommodating a vehicle powered by a combustion engine. Pedestrian and non-motorized facilities are important modes of travel
2.0 LANE WIDTHS GUIDELINE
 2.0 LANE WIDTHS GUIDELINE Road Engineering Design Guidelines Version 2.0.1 May 2018 City of Toronto, Transportation Services City of Toronto Page 0 Background In early 2014, Transportation Services initiated
VILLAGE OF NILES TRAFFIC CALMING POLICY
 INTRODUCTION There is increasing interest across the country in developing new strategies to reduce the speed and amount of traffic in residential neighborhoods. Measurement of speeds, traffic volumes,
Recommended Roadway Plan Section 2 - Land Development and Roadway Access
 Recommended Roadway Plan Section 2 - Land Development and Roadway Access SECTION 2 Land Development and Roadway Access 2.1 Land Use and Access Management The Federal Highway Administration (FHWA) defines
Project Report. South Kirkwood Road Traffic Study. Meadows Place, TX October 9, 2015
 Meadows Place, TX October 9, 2015 Contents 1 Introduction... 1 2 Data Collection... 1 3 Existing Roadway Network... 2 4 Traffic Volume Development... 2 5 Warrant Analysis... 3 6 Traffic Control Alternative
City of Wayzata Comprehensive Plan 2030 Transportation Chapter: Appendix A
 A1. Functional Classification Table A-1 illustrates the Metropolitan Council s detailed criteria established for the functional classification of roadways within the Twin Cities Metropolitan Area. Table
10/30/2012 VIA
 10/30/2012 VIA EMAIL David Hung, Associate Planner Community Development Department, Current Planning Division City of Sacramento 300 Richards Blvd., 3 rd Floor Sacramento, CA 95811 RE: The Cannery On-Site
Stakeholder Meeting Handouts. January 2013
 January 2013 Stakeholder Meeting Handouts The Case FOR Parking Minimum Requirements Reduce street congestion around the development site Avoid parking spillover Create orderly development patterns Anticipate
REGIONAL BICYCLE AND PEDESTRIAN DESIGN GUIDELINES
 REGIONAL BICYCLE AND PEDESTRIAN DESIGN GUIDELINES November 16, 2011 Deb Humphreys North Central Texas Council of Governments Bicycle and Pedestrian Advisory Committee Snapshot of the Guide 1. Introduction
This page intentionally left blank.
 This page intentionally left blank. COMMUNITY Coweta Community Overview Coweta Coweta, a residential community located in Wagoner County, is a suburb of Tulsa situated southeast of the metropolitan area
Traffic Impact Analysis (TIA) Process and Procedures Manual. September 2017
 Process and Procedures Manual. September 2017") Traffic Impact Analysis (TIA) Process and Procedures Manual Post Office Box 664 101 Huntersville-Concord Road Huntersville, NC 28070 Phone 704-766-2220 Fax 704-992-5528 www.huntersville.org (c) 2017, Town
Traffic Impact Analysis (TIA) Process and Procedures Manual Post Office Box 664 101 Huntersville-Concord Road Huntersville, NC 28070 Phone 704-766-2220 Fax 704-992-5528 www.huntersville.org (c) 2017, Town
MCTC 2018 RTP SCS and Madera County RIFP Multi-Modal Project Eval Criteria GV13.xlsx
 MCTC 8 RTP SCS and Madera County RIFP Multi-Modal Project Eval Criteria GV.xlsx Madera County Transportation Commission Regional Transportation Plan / Sustainable Communities Strategy Multi-Modal Project
Appendix C 3. Bicycle / Pedestrian Planning
 Appendix C 3. Bicycle / Pedestrian Planning BICYCLE/PEDESTRIAN PLANNING 2005 Master Plan GOAL: Provide for safe and convenient bicycle and pedestrian circulation throughout the City. Develop a city-wide
Caltrans Sloat Boulevard Pedestrian Safety Project Response to Community Questions, Comments & Concerns
 Caltrans Sloat Boulevard Pedestrian Safety Project Response to Community Questions, Comments & Concerns Revised: May 10, 2016 The California Department of Transportation (Caltrans) is planning various
TABLE OF CONTENTS. Executive Summary
 Executive Summary Background... ES-1 Pedestrian Network... ES-2 Bikeway Network... ES-2 Collision History... ES-2 Public Input... ES-4 Conclusions and Recommendations... ES-4 1. Introduction and Setting