Product P1. Briefing Paper: Toward a BEST PRACTICE MODEL. for Managed Lanes. in Texas
|
|
|
- Edwina Potter
- 5 years ago
- Views:
Transcription

1 Product P1 Briefing Paper: Toward a BEST PRACTICE MODEL for Managed Lanes in Texas

2 1 BRIEFING PAPER: TOWARD A BEST PRACTICE MODEL FOR MANAGED LANES IN TEXAS by Ginger Goodin Division Head, Planning Texas A&M Transportation Institute Stacey Bricka Research Scientist Texas A&M Transportation Institute Chris Pourteau Senior Research Editor Texas A&M Transportation Institute Robert Benz Research Engineer Texas A&M Transportation Institute Mark Burris Associate Research Engineer Texas A&M Transportation Institute Marcus Brewer Associate Research Engineer Texas A&M Transportation Institute Nick Wood Assistant Transportation Researcher Texas A&M Transportation Institute and Tina Geiselbrecht Associate Research Scientist Texas A&M Transportation Institute Product P1 Project Project Title: Evaluation of the I-10 Katy Freeway Managed Lanes Performed in cooperation with the Texas Department of Transportation and the Federal Highway Administration TEXAS A&M TRANSPORTATION INSTITUTE College Station, Texas Published: September

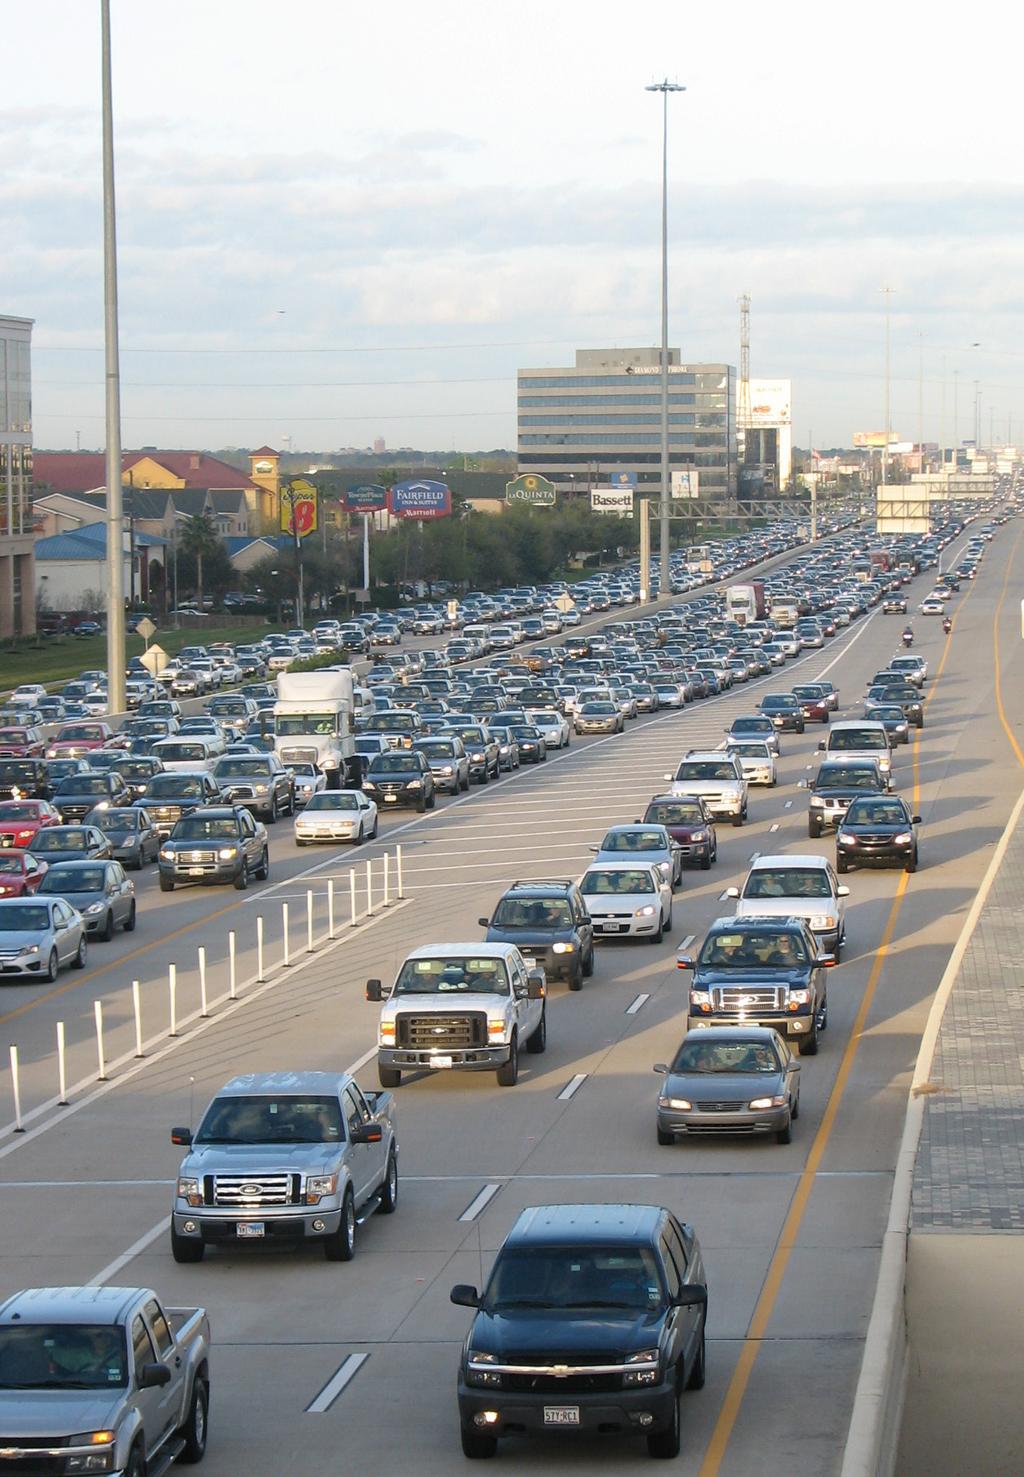
3 2 Over the past two decades, agencies have increasingly implemented managed lanes (MLs) to mitigate growing urban traffic congestion in the United States. Multiple operating projects representing a combination of HOV-to-HOT conversions and constructed lanes exist nationally, with more projects soon to be implemented. Three of Texas four major metropolitan regions currently envision networks of managed lanes in their long-range regional transportation plans. Though lessons learned from existing ML facilities have advanced the practice of implementing new facilities, no one-size-fits-all strategy exists. Each region/corridor exhibits unique characteristics that require implementing agencies to adapt previous experiences to their own environments. Nevertheless, studying the development of the Katy Freeway Managed Lanes (KML) on I-10 in Houston, Texas, has yielded valuable insights that can benefit agencies implementing managed lanes in the future. The KML (see Figure 1) became fully operational in Also called the Katy Tollway, the KML is the first operational, multilane managed facility in Texas. It is also the first variably priced operation in the state since the implementation of the QuickRide program on US 290 and I-10 high-occupancy vehicle (HOV) lanes in Houston more than 10 years ago.
4 Wilcrest 3 THE KML FACILITY Tolling Plaza Entrance Managed Lanes Exit TEXAS 6 General Purpose Lanes HOV Lanes 8 Addicks Park & Ride 10 Eldridge Dairy Ashford Kirkwood Gessner Figure 1. The 12-mile Long KML Facility, Including Tolling Plazas and General Purpose, Managed, and HOV Lanes. Source: HCTRA website.
5 4 In a unique partnership with The Harris County Toll Road Authority (HCTRA) and the Metropolitan Transit Authority of Harris County (METRO), the Texas Department of Transportation (TxDOT) developed the project in an innovative delivery process that comprised funding, operating, and maintaining the facility. Constructed within the center of the existing Katy Freeway during the major reconstruction effort, the KML has grown from a one-lane reversible, bus-only lane to a four-lane toll facility. This project s development tracks with the evolution of managed lanes theory, making it an ideal candidate for best practices assessment. Understanding how the KML was successfully implemented provides an opportunity for TxDOT and its partnering agencies across the state to facilitate developing other projects based on those lessons learned Wirt Northwest Transit Center Old Katy Rd. 10 Bunker Hill Chimney Rock Antoine Silber N. Post Oak
6 5

7 6 Project , Katy Freeway: An Evaluation of a Second-Generation Managed Lanes Project, represents a comprehensive evaluation of the KML. Researchers created a framework for evaluating the KML that yields best-practice recommendations comprising 10 distinct operational areas: Congestion and travel time. Safety. Enforcement. Maintenance. Toll and pricing. Access design. Lane separation. Operational policy. Public attitudes and perceptions. Project delivery. This white paper provides: 1 A history and operational description. A summary of each of the operational areas listed above. 2 3 Findings and conclusions for the KML as a step toward establishing best practices for managed lanes in Texas.
8 7 The KML: History and Opera HOV Opens: 4.7 mi. 4+ Operations 3+ Operations: 6.4 mi. 2+ operations Extend to SH 6: 11.6 mi. 3+ A.M. Peak Hr. Weekend Operations Start Eastern Extension: 12.3 mi. 3+ P.M. Peak Hr. Motorcycles Allowed End Weekend Resume Weekend Expand Addicks PNR Figure 2. The Development of the KML over Time. The 1980s 1990s Figure 2 shows the development of the KML over time. METRO originally conceived an HOV lane on the Katy Freeway west of I-610 in 1982, when TxDOT was planning a pavement repair project to begin the following year. METRO suggested transforming the proposed repairs into a new construction project to convert the interior shoulders into a single, reversible bus lane. Leveraging their close working relationship, METRO and TxDOT finished the conversion in 30 months at a total project cost of $12 million ($28 million in 2011 dollars). At first restricted to authorized buses and vanpools, the Katy Freeway HOV Lane opened in Between 1984 and 1987, METRO systematically relaxed authorization to include 4+ carpools, 3+ carpools, and finally 2+ carpools. By 1988, however, the facility had exceeded capacity, so METRO began raising occupancy requirements during peak travel times through Traffic volumes steadily decreased on the facility. In 1998, via implementation of the QuickRide program, METRO allowed 2+ carpools to use the Katy HOV lane during peak periods for a fee of $2 per trip. Studies of the policy showed that while HOV-2 demand was modest
9 8 tional Summary HOT - Quick Ridge Begins Downtown Connector: 1.9 mi. Diamond Lanes: 6.3 mi. Expand Addicks PNR Katy Construction Starts Expand Kingsland PNR Grand Parkway PNR Added 2+2way HOV Opens HOT Katy Tollway Opens and infrequent, the pricing program was able to influence travel decisions significantly, with half of the HOV-2 carpools formed from single-occupancy vehicle (SOV) trips in the general purpose lanes. In 1995, TxDOT evaluated the Katy Freeway corridor. With maintenance costs at four times the average expressway segment in Texas and inadequate to carry the 200,000 vehicles of daily demand present at the time officials determined its design was obsolete. A major investment study identified the local community s mobility needs and considered a wide range of investments across multiple travel modes to accommodate them. When METRO allowed 2+ carpools to use the facility for a fee, studies showed that variable pricing can substantially change motorists mode choice and travel-time decision behavior.
10 and Beyond: Building a Better Mouse Trap Creation of the KML gave birth to the first tri-party agreement to operate toll lanes on an Interstate Highway in the United States. FHWA HCTRA TxDOT Ultimately, in 2003, construction began on an alternative providing two special-use lanes in each direction from I 610 to SH 6. Also, additional general-purpose lanes (GP lanes) in each direction on the corridor (with auxiliary lanes at major interchanges) were built, as were additional continuous frontage roads. The improvements were designed to accommodate future growth and travel demand. Creating the KML gave birth to the first tri-party agreement to operate toll lanes on an Interstate Highway in the United States. HCTRA assumed responsibility for financing, constructing, operating, and maintaining the managed lanes, while the generalpurpose lanes remained under TxDOT s jurisdiction. A later pact with METRO allowed transit vehicles to use the tollway for free to further promote mobility on the corridor. Some of the key traits of the innovative tri-party agreement were: Having a shared operating agreement. TxDOT would own and maintain the general-purpose lanes and frontage roads. HCTRA would own and operate the managed lanes. Financing ML construction on an interstate through a county-based toll operator. Until this agreement, most ML projects were basic HOV-to-HOT lane conversions and did not set primary financial goals for operation. Using open road electronic tolling. No manned toll booths were planned for the KML. All tolling would be accomplished via overhead gantries equipped with electronic toll equipment. Observation booths are included in the KML but are for electronic equipment and for an operator to do visual occupancy observation, not toll collection. Construction finished in Originally planned as HOT-3+, but six months prior to opening the facility, the KML s occupancy requirement was lowered to allow 2+ carpools to travel for free because the toll agency believed the managed lanes could handle the additional volume. The KML became fully operational in 2009, when a detailed operating plan was signed by the three principal operating agencies: TxDOT, HCTRA, and METRO.
11 10 Facility Administration With help from the HCTRA Incident Management Center (IMC), which operates independently of the Houston TranStar system (managed by TxDOT, HCTRA, METRO, and the City of Houston), HCTRA became responsible for actively managing incidents within the tolled managed lanes. An operating committee composed of the three principals and chaired by TxDOT reviews procedures related to the operations, safety, incident management, and scheduled maintenance or closure events of the KML. The committee produces a quarterly operations report providing an overview of data elements from the parent agencies. Closure requests of the general-purpose or managed lanes due to special events have to be provided to the operating committee at least one week before the event. Facility Operations As of 2012, KML volumes neared 2,200 vehicles per hour. HCTRA designed a toll-rate structure that sustains the movement of vehicles (without intermittent adjustment for six months following the change). The fee structure is a time-of-day pricing scheme that varies by day of week, time of day, and direction of travel similar to the 91 Express Lanes in Orange County, California. During peak periods, the inside lane is designated as an HOV lane as indicated by a dynamic-message sign that displays HOV only overhead at each of the toll plazas. SOVs and commercial vehicles travel on the outside managed lane during peak periods. HOVs use the managed lanes toll free but only during peak periods (from 6 to 11 A.M. eastbound and 2 to 8 P.M. westbound) in both directions. DEFINITIONS Time-of-day pricing refers to setting the toll rate on a time-based schedule, with higher fixed rates during peak periods. Peak period refers to the time of day (e.g., 6 a.m. to 10 a.m.) when traffic volume is at its highest point. Off-peak period refers to the time of day (e.g., 11 a.m. to 2 p.m.) when traffic volume is lower than the peak period. In late 2012, HCTRA changed the orientation of the lane striping at the Eldridge Toll Plaza to give space between the designated HOV and toll lanes. The former layout had only a lane line between the HOV and toll lanes, and HCTRA decided to create a large, 12-foot buffer between the lanes to discourage last-minute lane jumping. HCTRA also wanted to move the HOV lane closer to the enforcement area to increase passenger cab visibility, which would allow officers to better observe vehicle occupancy and detect potential violators more accurately. The buffer between the HOV and toll lanes is viewed as a pilot project, and if it is effective for operations, will be applied to both the Wirt and Wilcrest Toll Plazas. HOVs are not required to have transponders to use the managed lanes. To enforce compliance with HOV requirements, law enforcement personnel position their vehicles on a wide inside shoulder at the tolling plazas to manually observe traffic.
12 11 KML Project Design Features $ million construction cost as part of the larger reconstruction project for the Katy Freeway 12-mile 4 8 managed lanes total 2 in each direction 3 entrances per direction 3 corridor from SH 6 to I-610 general purpose lanes total 4 in each direction 18- to 20-foot buffer with white pylons spaced at 10-foot intervals separates the managed and general-purpose lanes tolling plazas with electronic gantries (both directions) and occupancy observation booths Provides separate access ramps for the Addicks Park and Ride Lot and the Northwest Transit Center Unique Features of the KML Though there are a number of shared characteristics with other ML facilities in the United States, the KML possesses distinguishing characteristics, including: Generous lane, shoulder, and buffer widths, along with the addition of general-purpose capacity to the freeway that enhances non-toll travel in the corridor. Unique and varied access configurations, including one direct ramp from a park-and-ride facility and a project terminus into a concurrentflow HOV lane. An unusual path to implementation relying on a public-public partnership model and very active involvement of project champions. Absence of a formal concept of operations and late adjustments to the tolling and HOV occupancy policies, which had no detrimental effect on operations at opening. While these characteristics limit, to some extent, generalizing the KML developmental experience, valuable insights into how projects achieve success become evident.

 Traffic Volumes.")
13 12 Congestion and Travel Time Researchers tracked and analyzed historical trends in traffic volume, travel time, and transit usage within the KML s HOV and managed lanes. Traditionally with these kinds of studies the peak hour or peak period in the peak direction is evaluated. However, since there was significant growth in volume and travel-time savings in the KML s off-peak direction, that direction was evaluated as well. Figure 3 shows the historical trend, by vehicle type, for peak direction traffic volumes. Figure 3. Quarterly KML Daily Peak-Direction (Eastbound A.M. and Westbound P.M.) Traffic Volumes. Note: Construction occurred from 2003 to 2008, causing a dip in volume during 2008.

14 13 Generally speaking, peakdirection traffic volumes have more than doubled both in the peak hour and the peak period since the KML opened in 2009, with HOV volumes increasing slightly in the peak periods. However, it is the toll lane that has seen the majority of traffic volume growth. Thus, a toll increase aimed at mitigating congestion and facilitating better lane balance between HOV and toll users was instituted on September 8, Specifically, the KML has seen the following trends since it opened: Increasing travel times reflect increasing traffic volumes. AM and PM peak-hour travel times have increased. Both AM and PM travel-time differences (managed lanes versus general-purpose lanes) have increased in both the AM and PM peak hours but have increased most significantly in the PM peak period. Off-peak-direction traffic volumes have increased in the PM peak period. The HOV volume is almost as high as the peak-direction HOV volume on other HOV facilities. The facility has experienced congestion at a few merge locations. In the eastbound direction at the Addicks Park and Ride Lot T-ramp, the short merge distances from the T-ramp to the managed lanes contribute to congestion as buses about one bus every five minutes in the morning peak hour attempt to merge into traffic. As of the writing of this document, HCTRA is evaluating alternatives to alleviate this congestion. In the westbound direction, modifications to the managed lanes have improved the merge operations west of the North Post Oak entry ramp.

15 14 Safety Traffic safety is always a concern with a new type of facility. In the case of the KML, HCTRA contracts with the Harris County Constable, which provided enforcement and incident response to patrol the KML. The research team used TxDOT s Crash Record Information System (CRIS) data to determine crash trends for the managed lane and the generalpurpose lanes before and after the implementation of the facility. Figure 4. TxDOT s Crash Record Information System (CRIS).

16 15 Traffic volume often reflects the economy s health. The KML is home to more than 78,000 employees and 300 energy companies. Thus, the economic downturn is a significant context for understanding this analysis. Contextual Factors Reconstruction of the KML affected the roadway geometrics, traffic operations, and responsibilities among operating agencies. The changes affected the number of motorists who could use the managed lane, refocused enforcement priorities, and had other operational impacts. Other factors impacting the analysis of safety on the KML included 1) diversion of traffic from other corridors (US 290, Westpark Toll Road, and other arterial facilities) and 2) the economic downturn of More specifically regarding the economic downturn, it is worth mentioning that traffic volume often reflects the economy s health. In , Houston had just over 4 percent unemployment, a statistic which almost doubled by In , unemployment flattened after reaching a high of 8.9 percent and eventually started to decline, remaining above 7 percent. Also noteworthy is that the KML spans the Energy Corridor (SH 6 to Dairy Ashford Road), the third largest employment center in the region and home to more than 78,000 employees. Several of the largest international energy companies in the world and 300 multinational, national, and local companies are located in the corridor. Thus, the economic downturn, compounded by federal energy policies and the British Petroleum Deepwater Horizon explosion, is a significant context for understanding our findings. Analysis Results CRIS data show a lower-corridor crash rate due to improved geometrics and a reduction in congestion. In general, the newer design implemented in 2009 has proven safer than the older design when looking at the entire corridor. The same crash patterns occur, with rear-end crashes being the most frequent followed by side-swipe crashes and object-struck crashes. Researchers found a lower-corridor crash rate due to improved geometrics and a reduction in congestion. Comparing the HOV lane to the new KML shows the crash rates about equal. The original Katy HOV lane had high congestion, narrow geometrics, reversible flow, and fewer lanes. The new KML design has four lanes, more ingress/egress locations, and a very wide (22 foot) buffer area for recovery and crash avoidance. The HOV crash patterns appear consistent with the overall crash patterns. More consistent data reporting from police and operating agencies could provide more accurate detail on crash location, object struck, and collision type. Current crash data retention policies limited our team in the amount of data and types of analyses we could conduct. Improving reporting policies and procedures should facilitate a more conclusive analysis for future research.

17 16 Enforcement Researchers studied enforcement of the KML before and after the implementation of the managed lanes. The team conducted interviews and site visits to determine how the METRO Police Department and Harris County Constable Precinct 5, both responsible for facility enforcement at different times, approach their duties. We also compiled monthly HOV citation and toll violation statistics to measure driver compliance. Prior to October 2008, METRO personnel enforced traffic laws on the Katy Freeway HOV lane. Once major construction was completed, Harris County Constable Precinct 5 took over. A special toll road division within Precinct 5 handles citations on the managed lanes. The goal of the toll road division is primarily to facilitate the flow of traffic while providing security for users. Officers enforce all traffic laws on the managed lanes and provide disabled motorist assistance when necessary. A significant finding was the difference in prioritizing enforcement goals between the METRO Police Department (when monitoring the HOV lane) and Precinct 5 (when monitoring the managed lanes). METRO emphasized the enforcement of vehicle occupancy requirements, whereas Precinct 5 prioritizes maintaining mobility within the managed lanes. However, METRO did recognize that their officers should not impede the flow of traffic, and Precinct 5 makes every attempt to balance mobility with enforcement. The number of citations issued by type for each agency underscores these distinct approaches to enforcement policy. Overall, the monthly number of citations issued was sporadic, with low and high monthly totals being reported by each agency. METRO issued more citations for failing to meet vehicle occupancy requirements, whereas Precinct 5 issued more citations for speeding compared to, say, toll evasion. Specifically, HOV citations represented 54 percent of all METRO citations, and toll evasion citations represented 16 percent of all Precinct 5 citations. Lane jumping is one possible explanation for fewer citations by Precinct 5. Lane jumping occurs when users merge at the last second from the HOV lane to the toll lane when officers are present, potentially to avoid a higher fine.
 that motorists must exert to accomplish the driving task.")
18 17 DEFINITIONS Gore area refers to a triangular piece of the roadway where a road merges or splits at an entrance or exit ramp. Driver workload refers to the required effort (physical and mental) that motorists must exert to accomplish the driving task. Maintenance Researchers interviewed maintenance supervisors from TxDOT, HCTRA, and METRO regarding activities and costs. Prior to implementation of the KML, TxDOT owned the Katy HOV lane but METRO operated it, with maintenance responsibilities split between the two. When KML opened, HCTRA took over maintenance. Ongoing facility maintenance is critical when actively managing a tolled facility. Besides normal roadway maintenance, breakdown of other components of the facility dynamic message signs, traffic flow monitoring sensors and systems, closed-circuit television, and the tolling infrastructure can significantly impact mobility, enforcement, and of course commuter safety. The reverse is also true. For example, all agencies interviewed mentioned that active lane use enforcement can reduce the number of pylon hits and subsequent replacement. More generally regarding enforcement: providing consistent enforcement and having the physical space to conduct enforcement activities were cited as helping to reduce maintenance and operational issues.
19 18 The interviews revealed that the most intensive maintenance activity, other than sweeping and debris pickup, is delineator replacement. The use of pylons ($30 per unit, furnished and installed) on the KMLs provide insight to possible enhancements to existing and future facilities using them, including: Pylons are one of the highercost and higher-intensity system maintenance items, and one of the items maintenance crews most often deal with. Entry and exit gore areas typically have higher hit rates. Pylon hits in gore areas are attributed to driver workload (when making a decision) and distracted driving. Enhanced enforcement can reduce pylon hits. Though agencies originally thought contrast markings could reduce entrance and exit location pylon hits, they observed no actual reduction in hits. Managed lanes typically have a lower per-lane maintenance cost due to fewer sideof-the-road maintenance items such as mowing, sign repair, and sign replacement. The public expects that tolled facilities, including managed lanes, have a higher standard with regard to appearance, maintenance, and operations. A buffer width spacing as small as 2 to 3 feet (which translates to 8 to 12 inches from the pylon to the edge line) reduces maintenance and replacement. Experience indicates that wider buffer spacing further reduces maintenance requirements. Shorter, wider, and thicker profile pylons were reported to be more durable. Raised pavement markings or profile markings might reduce pylon hits by enhancing the tactile and visual conspicuity of the pylon-treated area. ML-related sign messaging, size, and placement are critical to safe operations and adequate warning time for helping motorists make appropriate decisions. The use of pylons can reinforce messages displayed through other signage methods (but are not a replacement for effective signing schemes) in areas where drivers make decisions. Retroreflective pavement marking tape is prone to edge curl if little to no traffic runs over it to keep it adhered to the pavement. This can be an issue around pylons, since less traffic runs over the tape near the pylons. Street sweepers can significantly damage tape markings that curl. Thus, agencies should consider using traditional paint or thermoplastic markings during application. Horizontal signing can reinforce the lane assignment at entrance and exit locations, especially in areas were horizontal curvature can distort the lane/sign relationship.

20 19 Tolling and Pricing Researchers used the substantial number of traffic sensors on the Katy Freeway (equipped in both the general-purpose and managed lanes) to conduct a comprehensive analysis of managed lane use. The team assessed the number and percentage of Katy Freeway trips made on the KML, the conditions contributing to managed lane use, and the revenues deriving from managed lanes and travel-time savings. Figure 5 shows toll rates on the KML prior to September After September 2012, toll rates increased.

21 Figure 5. Toll Rates Prior to September 2012 on the KML Used for Analysis (per the KML Website). 20
22 21 After travel-time savings (or traveling for free in carpools), survey respondents cited most often the following reasons for using the KML: Less stress. Safer commute (perceived). Absence of trucks. Tollway lane users were broken into four categories: Exclusive (daily): those who only used tollway lanes. Frequent (2-3 times per week): Those whose trips in the tollway lanes comprised between 50 percent and 99 percent of their Katy Freeway travel. Occasional (once per week): those whose trips in the tollway lanes comprised between 5 percent and 50 percent of their Katy Freeway travel. Rare (once per month): those whose trips in the tollway lanes comprised between 0.01 percent and 5 percent of their Katy Freeway travel. Based on all trips on the Katy Freeway (KML and GP trips) the percentage of trips taken by day of week and time of day were significantly different for the members of these four groups. However, there were few patterns to these differences. One of the few clear differences between the four groups was that the exclusive users were more often traveling during a weekday at peak times in the peak direction (7 to 9 AM eastbound and 5 to 7 PM westbound) than other groups, likely commuting to and from work. However, even for exclusive KML travelers, only 24 percent of trips were during the peak-period peak direction and, thus, 76 percent of exclusive KML drivers traveled in the non-peak period. This implies a tendency to use the tolled KML more often in the peak period, but also suggests plenty of use of this lane during other periods. Thus travelers are finding value in the lane for not just travel time savings, but also (according to the survey) reduced stress, feeling safer, and the absence of trucks on the KMLs. 15% 12% PERCENT OF TRAVELERS BY FREQUENCY OF ROAD USE 16% Exclusive (100% of trips) Frequent (50-99% of trips) 57% Occasional (6-49% of trips) Rare (0.01-5% of trips)
 and the GP lanes. The dollar benefits shown here represent the total amount from 8.29 million trips. Westbound travelers saved more time on average than eastbound travelers.")
23 22 Travel Time Savings of the Tollway The team estimated the amount of travel time saved by vehicles on the KML based on the travel-time difference between the tollway lanes (not including the HOV lane) and the GP lanes. The dollar benefits shown here represent the total amount from 8.29 million trips. Westbound travelers saved more time on average than eastbound travelers. Both directions combined saved 270,393 total hours. Using TxDOT s value of $20.99 per passenger car hour travel-time savings estimate, the toll lane saved travelers $5,675,547 in travel-time savings in Researchers also determined that revenues from the toll and HOV lanes combined exceeded $7 million in The revenue exceeding the estimated value of travel-time savings indicates that the $20.99 per hour figure greatly underestimates the value travelers are placing on the use of the toll lanes. The team used actual tolls and travel-time savings from paying customers to estimate more accurate figures of $59.07 per hour for the users of the toll lane for SOVs and $77.80 per hour for the users of the toll lane for HOVs. Using these figures yields a higher total benefit dollar amount of $15.97 million per year. (Note: This value only represents the benefit from travel-time savings and ignores other benefits like reduced emissions and reduced vehicle operating costs.) Time and Money Commuters saved $5,675,547 in the toll lane in 2011 (using TxDOT s value of travel time savings of $20.99 per passenger car hour). Revenues equaled $7,025,185 (combining the toll and HOV lanes).
24 23 Access Design Findings indicate that the design of the access points sufficiently accommodates the expected demand of drivers entering and exiting the KML. REVIEWED 1,033 managed lane access maneuvers Researchers focused on four direct-merge access ramps (the most common ramp type on the KML) along the portion of the corridor between the I-610 interchange (and the Post Oak Park and Ride Lot access) and the boundary between HOV/toll operations to HOV-only lanes. The team also evaluated access points at either end of the corridor and the direct-connect ramp at the Addicks Park and Ride Lot facility. Study considerations included traffic volumes in the managed lanes and GP lanes, elapsed time to complete the maneuvers, position of vehicles within the access ramps, and peak versus non-peak comparative performance. The team reviewed 1,033 managed lane access maneuvers from 20 hours of peak and non-peak periods. Of those, 801 maneuvers took place on the direct-merge access ramps, and 232 occurred at the western entrance to the facility at the end of the diamond-lane section. Researchers also reviewed 37 cross-facility weaving maneuvers beginning at the managed lane exit ramp at Echo Lane. Findings indicate that the design of the access points sufficiently accommodates the expected demand of drivers entering and exiting the KML.
25 24 Direct-Merge Ramps Access-point design meets expected demand at the sites studied, even during peak periods. Maneuvering to the managed lanes from the Addicks Park and Ride Lot T ramp proved most sensitive to peakperiod traffic, due in part to traffic entering the ramp in platoons following release by the traffic signal at the park-and-ride facility. Single lane changes typically required between 1 and 3 seconds, while drivers completed entire access maneuvers within 10 to 25 seconds. Most vehicles entered and exited the access points within the dotted line road markings, though some vehicles began maneuvering early or late, which occurred more frequently during peak periods. Cross-Facility Weaving Approximately 7,200 feet separates the ML exit at Echo Lane and the Katy Freeway exit to the Sam Houston Tollway, plus an additional 1,400 feet usable by drivers maneuvering early or late. Traveling from one access point to the other requires six to seven lane changes, which conforms to recommended design guidelines. Of 200 vehicles observed at the ML exit at Echo Lane, 37 completed a cross-facility weaving maneuver to exit to the Sam Houston Tollway. All but three of those 37 vehicles (one in the peak period and two in the non-peak period) completed their lane changes in less than 7,800 feet. The high rate of completed lane changes, combined with the moderate to high speeds of completed maneuvers, indicate that the design distance at this location is sufficient to accommodate these maneuvers. Due to the additional distance traveled between the two ramps, typical overall elapsed times were around 2.0 minutes for peak-period maneuvers and 1.4 minutes for non-peak-period maneuvers. A high proportion of weaving vehicles entered the GP lanes early from the ML exit (particularly in the peak period). However, the distribution of elapsed times and position of final maneuvers was not much different from vehicles that exited within normal distance. Single lane changes typically require 1 to 3 seconds Drivers complete entire access maneuvers 10 to 25 seconds

26 25 Funnel Operations The KML s entrance at the boundary of the diamond lane section adds a through lane to the existing lane, making the entrance ramp proper very short; vehicles entering from the GP lanes do not need to merge. Thus, only initial lane changes were studied. Traffic operations at the funnel proved unremarkable. Volumes (between 250 and 300 vehicles every 15 minutes ) in the left GP lane remained fairly constant throughout peak and non-peak periods; however, the number of peak-period vehicles in the diamond lane and the number of access maneuvers increased approximately five-fold compared to the non-peak period. Given the consistent volumes and elapsed times, combined with a nearly 100 percent normal rate of ramp positioning, the design of this access point is sufficient to accommodate the expected demand.
 or added fee (in the form of a toll) for their use.")
27 26 Lane Separation Lane separation usually relates to separating a preferential lane (e.g., HOV, HOT, or managed lanes) from GP lanes. The preferential lanes typically offer travel-time or congestion-relief benefits and have some kind of restriction (based on occupancy) or added fee (in the form of a toll) for their use. Each type of lane separation device has its advantages and disadvantages. When determining which type to deploy, designers should consider cost of construction, operational flexibility, enforcement and safety impacts, and maintenance. Researchers focused the evaluation on concrete traffic barriers (CTBs) used on the Katy Freeway before versus pylon separation types used after. Pylons enhance or emphasize and thus aid in compliance with pavement markings. They are widely used on preferential lanes to aid in compliance with the double white line indicating not to cross. CTBs physically prevent vehicle encroachment, protect an immovable object, or separate two facilities in close proximity. Barriers are used, for example, to prevent encroachment down steep slopes or into buildings, bridges, or pedestrian facilities. Table 1 shows a comparison of pylons to barriers in terms of design/ operational, incident management, and maintenance considerations.
28 27 Feature Barriers Pylons Design/Operational Considerations ROW/Buffer Width End Treatment Sight Distance 4-foot minimum Requires crash attenuator Perceived limitation Vehicle Encroachment None High potential Congestion Driver Perception Lane Compliance Enforcement (Lane Line Violation) Ease of Enforcement Managed lane not affected by GP lane congestion Feeling of safety, sometimes confined Excellent No lane line violation Occupancy dependent on width 1.5-foot minimum (maintenance is exponential) None required but higher maintenance at entrance Perceived improvement no walls to present obstruction Managed lane affected by GP lane congestion, difference in speed, and ability to cross over into the GP lanes Potential false feeling of safety, open feeling Dependent on buffer width, enforcement, and other factors Roving difficult and potentially costly Occupancy dependent on width Installation Cost High $16/linear foot Low $3/linear foot Crash Protection Incident Management Vehicles are physically separated from GP lanes None Motorist Breakdown Dependent on width Dependent on width Emergency Vehicle Limited access Very accessible Roadside Assistance Vehicle Limited access Very accessible Major Incident Maintenance Lane Closure Cost Worker Safety Annual Maintenance Cost Crash Cost Limited access cannot get traffic into or out of managed lane Typically annually and may not be required High limited maintenance and protected by CTB Low barrier alignment annually if portable CTB Dependent on severity Very accessible can get traffic into and out of managed lane Higher cost dependent on buffer width/frequency Low higher need for maintenance and no barrier protection Moderate/high dependent on how close vehicles are to buffer, in terms of striking distance Dependent on severity could go through pylons and hit median CTB Table 1. Trade-Offs between Concrete Traffic Barriers (CTBs) and Pylons.

29 28 When comparing pylons to CTBs, some key highlights are clear: ROW (buffer space) and associated maintenance are two of the largest life-cycle deployment costs that can greatly influence the analysis and decision of which treatment to choose. ROW and maintenance are directly related. This study demonstrated the correlation between buffer space and maintenance replacement. Designers might consider other trade-offs regarding pylons versus CTBs: o Incident management. o Cost of enforcement. o Consistency of design in the region and state (driver expectancy). o Future flexibility. Many of the variables are site specific and can drastically change the cost of the design depending on the site. Designers should evaluate the needs of their specific project to determine the benefits and costs of the proposed treatments.
30 29 Operational Policy Researchers examined the development of the KML from before it had managed lanes to its current configuration. They also looked at potential future tolling and HOV policies. The KML: History and Operational Summary portion of this document covers the essential history and development of the KML; this section focuses on policy evolution and future possibilities. POLICY EVOLUTION a major investment study commissioned by TxDOT a memorandum of understanding (MOU) including TxDOT, Harris County, and METRO a tri-party agreement including TxDOT, Harris County, and FHWA
31 30 Policy Evolution Changes in tolling and HOV policies took place gradually. Shown in the following list, new agreements and studies conducted over time charted the course for policy development: 1997: a major investment study commissioned by TxDOT. 2002: a memorandum of understanding (MOU) including TxDOT, Harris County, and METRO. March 2003: a tri-party agreement including TxDOT, Harris County, and FHWA. May 2003: a traffic and revenue study. 2007: an evaluation of pricing options. 2007: Harris County Commissioners Court meetings during which policies were finalized. The HOV policy remained relatively consistent throughout much of the process. Policies consistently recommended or assumed commuters meeting the HOV-3+ requirement would freely use the toll road and those meeting the HOV-2 standard would pay. In the end, public pressure helped to influence the selection of the HOV policy. The public s influence is evident because many of the documents prior to the public s will being known consistently describe an HOV policy different than the one finally selected. By contrast, the tolling policy changed multiple times, evolving from a general idea about using tolling as a strategy to generate revenue and manage demand, to time-of-day pricing, to dynamic pricing, and finally back to time-of-day pricing. The final pricing structure resulted from a site visit to the SR 91 Express Lanes in San Diego, California. This visit led HCTRA to decide that simplicity in tolling was best, so the agency selected time-of-day pricing. a traffic and revenue study an evaluation of pricing options Harris County Commissioners Court meetings during which policies were finalized
32 31 Potential Future Policies If congestion increases over time on the KML, HCTRA might consider various strategies to increase mobility on the corridor. Table 2 highlights these potential strategies. Potential Strategy Characteristics and Notes Uses sensors on the roadway to detect congestion. Introduce dynamic pricing Changes the price at regular intervals to charge a rate commensurate with the traffic level. Discussed as an option in the 2007 pricing evaluation document. Increase toll rates Increase occupancy requirements for HOVs beyond 2+ Develop an automatic system that adjusts both tolling and HOV operations using performance measures and benchmarks Manages the demand on the roadway by reducing the number of motorists willing to use the priced option on the road. Represents a strategy HCTRA has already used on the Katy Freeway Managed Lanes (effective 9/7/12). Manages demand by reducing the number of vehicles eligible to use the facility for free. Requiring HOV-3+ was discussed extensively prior to the KML opening, but public resistance kept it from happening. Would trigger rate changes (based on pre-approved policies) once an established threshold, such as traffic volume or speed, is exceeded. Policy shifts could be flexible enough to allow different vehicle types or occupancy requirements (e.g., requiring HOV-2 to pay). Since the policy changes would be pre-approved, individual rate fluctuations would not require a referendum or policy discussion prior to implementation. Table 2. Future Policy Strategies for Consideration.
33 32 Public Attitudes and Perceptions In 2012, the research team assessed the public s attitude and perceptions of the KML by surveying Katy Freeway travelers. Advertised by online and traditional media, the survey was available via the Internet between August 15, 2012, and September 19, 2012, and resulted in a total of 1,067 responses. Researchers also interviewed those involved with, or instrumental in, developing the KML and ongoing operations of the KML. Summary of Survey Results Most respondents (58 percent) had used the managed lanes at least once. In terms of how they used the lanes, few differences were evident between SOVs and carpools. The two groups even had similar reasons for using (or not using) the managed lanes. Cost was the most-often cited reason for not using the managed lanes (even though the managed lanes are free for carpoolers during most of the day). The next most-cited reasons were: 1) Not enough travel time savings. 2) The respondent avoiding tolls whenever possible. The main reasons cited for using the managed lanes were: 1) Less stress. 2) Safer Commute. 3) Avoidance of trucks. Most travelers who used the managed lane for their most recent trip perceived an average travel time savings of over 10 minutes (well above the actual average travel-time savings of just under 4 minutes). As has been the case on other facilities in the nation, it was likely that the survey s respondents have a perception that was skewed by the difference in speeds. Modeling Lane Choice Using Survey Results The research team developed models of lane choice using the survey data. Based on these models, respondents had an average value of time of $20.80/hour and a value of reliability of $2.20/hour. These are much lower results than those from the actual usage of the Katy managed lanes, where the average value of time was close to $60/hour. The likely reason for this disparity is that travelers sometimes pay for very small travel-time savings in reality but would not answer that way on a stated-preference survey question. For example, some paid trips on the KML occurred when the trip on the KML was only a handful of seconds faster than on the GPs.
34 33 Project Delivery The overriding sentiment to do something about the Katy Freeway was the common motivator among agencies involved, key stakeholders, and the driving public. A complex environment of multiple public agencies, stakeholders, and a public dissatisfied with a congested freeway shaped the development of the KML. This environment required close collaboration and coordinated efforts to reconstruct the Katy Freeway. Several agency agreements helped manage this complicated relationship. The process can be divided into three distinct periods: 2002 and earlier: before the formalized agreements to 2009: the project development period to 2012: the project implementation and operation period. Project Philosophy: Finding Common Cause Staff at all agencies were challenged to define and develop the processes that enabled the project to move forward. This out-of-the-box attitude and a willingness to overcome obstacles were characteristic of how the project developed. The overriding sentiment to do something about the Katy Freeway was the common motivator among agencies involved, key stakeholders, and the driving public. This shared cause helped influence those involved to work together, find solutions, and build a better mouse trap through ground-breaking agreements, innovative strategies, and creative thinking. Table 3 outlines issues and lessons learned from the KML case.
35 34 Lesson Learned Account for Conflicting Visions Find Stakeholders and Project Champions Establish Agreements to Define Roles Build in Flexibility Agree on a Lead Agency Maintain Strong Working Relationships Description Each agency and/or stakeholder had a unique project vision and carried a certain responsibility to address that vision. Each group had objectives and goals, and occasionally those conflicted. Stakeholders and project champions can have powerful influence, and this can come in handy in mitigating conflicts and pushing projects through to completion. For example, when an agency threatened to stall the project on principle, stakeholders mediated the dispute; when the project ran short of funding, stakeholders brought HCTRA onto the team as a financial partner. As identified by several interviewees, though difficult to establish, interagency agreements enabled agencies to cooperate and collaborate. Initial agreements, such as memoranda of understanding, served as a framework to develop subsequent, more detailed agreements. Guided by these agreements, the operating committee helped resolve conflicts in a timely fashion. Not all events are foreseeable, and changes to the initial agreements acknowledged this. Supported by the framework establishing the working relationships, agencies had to learn to adapt to dynamic circumstances. Several interviewees emphasized how vital this was to the project s success. Coordination problems sometimes occurred. TxDOT would occasionally step in as the lead agency and make unilateral decisions to help resolve thorny issues and move the process move forward. Respecting the other agencies involved proved vital to success. Interviewees acknowledged that trusting each other and knowing they could challenge one another s ideas helped them maintain an open perspective and craft creative solutions that served the project s long-term best interests. Table 3. Project Delivery Lessons Learned.
36 35 The KML: Lessons Learned for Future Efforts The four-lane KML, constructed within the center of the reconstructed Katy Freeway, is viewed as a second-generation ML project, representing features not applied in earlier HOV to HOT lane conversions. Beyond the facility s unique operating characteristics described in the earlier sections, TxDOT partnered with other local entities on the project to create an innovative delivery process for funding, operating, and maintaining the managed lanes. Researchers focused on four primary areas to determine best practices: 1) Traffic performance. 2) Public perception. 3) Users (e.g., trip characteristics). 4) System operations (e.g., finance, enforcement, safety, customer service, and incident management). Table 4 summarizes their findings about each of these areas as it relates to the KML. In terms of future research, further examination of signing, carpooling, transit, and economic impacts could yield more recommendations for best practices. 4 PRIMARY AREAS 1) Traffic performance 2) Public perception 3) Users 4) System operations
37 36 In the Area of Here s What We Learned from the KML Managed-lane volumes have doubled over time. Some congestion has emerged on the GP lanes despite the freeway s expansion. This is partly attributed to latent demand and partly to growth in the energy corridor. Traffic Performance Travel-time savings are approximately 5 minutes (morning) and 14 minutes (afternoon) in peak directions, an advantage over the GP lanes that has increased as volumes have grown. Managed lane off-peak speeds ran consistently at 70 mph but dropped to a low of 52 mph (morning peak) and 50 mph (afternoon peak). Both speeds correspond to the GP lanes most-congested travel periods. Off-peak volumes are growing at a rapid rate on the managed lanes. Public Perception Travelers use managed lanes to save time, reduce stress, and avoid congestion. They avoid managed lanes due to cost and limited travel time savings compared to the expense. Most ML travelers estimated travel-time savings at more than twice the actual time saved. Over 80 percent of the half million ML commuters used them for 60 or fewer trips annually (slightly more than one ML trip per week). Approximately 11 percent used the managed lanes more than twice per week. Just over 3 percent used the managed lanes for all trips. Users A small portion of commuters even use the managed lanes when no travel-time savings occur. In 2011, 1.1 percent of toll-lane trips occurred when the managed lanes operated at a lower-average speed than the GP lanes. Some 49 percent of ML users surveyed changed their usual freeway access point to reach the managed lanes. Improved geometric design and reduced congestion helped reduce crashes from crashes (pre-construction) to 57.3 crashes (post-construction) per million vehicle-miles. The KML s various access types have proven sufficient to handle the expected demand of drivers entering and exiting the lanes. System Operations Using a wide 20-foot buffer and plastic delineators, most KML sections were built assuming ideal conditions for effectively separating traffic flowing simultaneously and in the same direction. Attributed to the wide buffer, pylon hits and needed replacements are less frequent (averaging 25 percent replaced per year) compared to other ML projects. Enforcement operations have evolved, both institutionally and operationally, to ensure a balance between deterring cheaters and enforcing laws at the cost of disrupting traffic flow. All agencies interviewed agree: active enforcement of lane use and having the physical space to conduct enforcement activities help to reduce maintenance and operational issues. Table 4. Best Practices from Studying the KML.
TOWARD A BEST PRACTICE MODEL FOR MANAGED LANES IN TEXAS
 TOWARD A BEST PRACTICE MODEL FOR MANAGED LANES IN TEXAS by Ginger Goodin Division Head, Mobility Management Texas A&M Transportation Institute Stacey Bricka Research Scientist Texas A&M Transportation
Technology and the Changing Face of Tollways
 Technology and the Changing Face of Tollways Harris County Toll Road Authority Lisa Castañeda, PE, Assistant Director ITS Texas 2009 November 12, 2009 Topics Growth and Evolution of Tollways in Houston
Managed Lanes: A Popular and Effective Urban Solution. Ed Regan Presented by Susan Buse
 Managed Lanes: A Popular and Effective Urban Solution Ed Regan Presented by Susan Buse Overview of Managed Lanes First ML: SR 91 Orange County, CA 1996 Today About 23 Operating Projects in 9 States Basic
The Future of All Electronic Tolling Brian Patno Raytheon ITS Texas October 26, 2012
 The Future of All Electronic Tolling Brian Patno Raytheon ITS Texas October 26, 2012 Copyright 2012 Raytheon Company. All rights reserved. Customer Success Is Our Mission is a registered trademark of Raytheon
METHODOLOGY. Signalized Intersection Average Control Delay (sec/veh)
") Chapter 5 Traffic Analysis 5.1 SUMMARY US /West 6 th Street assumes a unique role in the Lawrence Douglas County transportation system. This principal arterial street currently conveys commuter traffic
Chapter 5 Traffic Analysis 5.1 SUMMARY US /West 6 th Street assumes a unique role in the Lawrence Douglas County transportation system. This principal arterial street currently conveys commuter traffic
Washington DC Section of ITE Project Briefing
 Washington DC Section of ITE Project Briefing November 5, 2015 Renée Hamilton, VDOT, Deputy District Administrator I-66 Outside the Beltway Improvement Area Project Location Virginia 2 Purpose and Need
Regional Transportation Needs Within Southeastern Wisconsin
 Regional Transportation Needs Within Southeastern Wisconsin #118274 May 24, 2006 1 Introduction The Southeastern Wisconsin Regional Planning Commission (SEWRPC) is the official areawide planning agency
Sketch Level Assessment. of Traffic Issues. for the Fluor Daniel I-495 HOT Lane Proposal. Ronald F. Kirby
 Sketch Level Assessment of Traffic Issues for the Fluor Daniel I-495 HOT Lane Proposal Ronald F. Kirby Director of Transportation Planning National Capital Region Transportation Planning Board (TPB) Metropolitan
CHAPTER 2G. PREFERENTIAL AND MANAGED LANE SIGNS
 2011 Edition - Revision 2 Page 275 Section 2G.01 Scope CHAPTER 2G. PREFERENTIAL AND MANAGED LANE SIGNS 01 Preferential lanes are lanes designated for special traffic uses such as high-occupancy vehicles
Managed Lanes. Steve Schilke, P.E. Major Projects Unit Head District 1. Illinois Traffic Engineering and Safety Conference October 2016
 Managed Lanes Steve Schilke, P.E. Major Projects Unit Head District 1 Illinois Traffic Engineering and Safety Conference October 2016 Agenda Managed Lanes Projects I-55 (Stevenson Expressway) Express Toll
2.2 TRANSIT VISION 2040 FROM VISION TO ACTION. Emphasize transit priority solutions STRATEGIC DIRECTION
 TRANSIT VISION 2040 FROM VISION TO ACTION TRANSIT VISION 2040 defines a future in which public transit maximizes its contribution to quality of life with benefits that support a vibrant and equitable society,
An Easier Commute. Learn how to use I-77 Express to save you time.
 An Easier Commute Learn how to use I-77 Express to save you time PUBLIC-PRIVATE PARTNERSHIP I-77 Express is the first-ever toll lane public-private partnership with NCDOT I-77 Mobility Partners is financing,
Active Transportation Facility Glossary
 Active Transportation Facility Glossary This document defines different active transportation facilities and suggests appropriate corridor types. Click on a facility type to jump to its definition. Bike
Toll Rate Public Hearing
 Toll Rate Public Hearing I-77 Express Toll Rate Hearing September 13, 2018 AGENDA AND HOUSEKEEPING Speaker Signup Bathrooms/Exits Facebook Live Introductions Thanks and Recognition 6:30-6:35 6:35-6:55
The I-680 Southbound Express Lane
 The I-680 Southbound Express Lane ALAMEDA County Transportation Commission FY2014-15 Annual Report SUNOL SMART CARPOOL LANE JOINT POWERS AUTHORITY Table of Contents Message from the Chair...3 I-680 Southbound
DRAFT. The HOV/HOT Alternative: Working Paper #3
 Portland Area Mainline Needs Assessment DRAFT The HOV/HOT Alternative: Working Paper #3 The feasibility of an HOV/HOT lane on the Maine Turnpike HNTB Corporation Original: April 2018 Revised: June 2018
Congestion Management Report
 Congestion Management Report F.E. EVERETT TURNPIKE (NORTH), MERRIMACK Segment Length: 7.0 miles Daily Traffic Volumes: 60,000-69,000 Analysis Period: May 2015 Number of Traffic Signals: 0 Number of travel
WHAT IFS: Over the course of
 WHAT IFS: Over the course of the 422plus Project certain questions have arisen multiple times at meetings, briefings and on-line at the website. Most of these questions start with WHAT IF. WHAT IF vehicle
PEDESTRIAN ACTION PLAN
 ATTACHMENT 2 CITY OF SANTA MONICA PEDESTRIAN ACTION PLAN CITY OF SANTA MONICA PEDESTRIAN ACTION PLAN This page intentionally left blank EXECUTIVE SUMMARY CHAPTER 1 EXECUTIVE SUMMARY Setting the Stage
The I-85 Express Lanes Project NASCIO Recognition Award Nomination
 The I-85 Express Lanes Project 2012 NASCIO Recognition Award Nomination Submitting Agency: State Road and Tollway Authority Nomination Category: Information Communications Technology Contact: Malika Reed
AMATS Complete Streets Policy
 AMATS Complete Streets Policy Table of Contents: Section 1. Definition of Complete Streets Section 2. Principles of Complete Streets Section 3. Complete Streets Policy Section 4. Consistency Section 5.
Transportation Master Plan Advisory Task Force
 Transportation Master Plan Advisory Task Force Network Alternatives & Phasing Strategy February 2016 BACKGROUND Table of Contents BACKGROUND Purpose & Introduction 2 Linking the TMP to Key Council Approved
NEIGHBORHOOD TRAFFIC CALMING POLICY
 NEIGHBORHOOD TRAFFIC CALMING POLICY I. PURPOSE The City of Kent continually strives to strengthen and protect its neighborhoods by improving the quality of life in residential areas. Traffic conditions
In the spring of 2006, national newspaper headlines screamed
 Toll vs. Nontoll: Toll Facilities Are Safer By Jeff Campbell In the spring of 2006, national newspaper headlines screamed that toll plazas were the most dangerous place on the highway. The articles were
Purpose and Need. Chapter Introduction. 2.2 Project Purpose and Need Project Purpose Project Need
 Chapter 2 Purpose and Need 2.1 Introduction The El Camino Real Bus Rapid Transit (BRT) Project (Project) would make transit and other transportation improvements along a 17.6-mile segment of the El Camino
Agenda. Overview PRINCE GEORGE S PLAZA METRO AREA PEDESTRIAN PLAN
 PRINCE GEORGE S PLAZA METRO AREA PEDESTRIAN PLAN May 28, 2008 Agenda Welcome and introductions Project overview and issue identification Planning context and strengths Design challenges and initial recommendations
MnPASS System Today and the Future
 MnPASS System Today and the Future April 2010 By Nick Thompson Minnesota Department of Transportation Topics Minnesota s Current and Future MnPASS High Occupancy Toll Systems Overview of the MnPASS System
Priced Managed Lanes in America. October 2013
 Priced Managed Lanes in America October 2013 1 Priced Managed Lanes What are they? Where are they? Why do them? When to do them? Common issues Lessons learned What are Priced Managed Lanes? The subset
2009 URBAN MOBILITY REPORT: Six Congestion Reduction Strategies and Their. Effects on Mobility
 2009 URBAN MOBILITY REPORT: Six Congestion Reduction Strategies and Their Effects on Mobility David Schrank Associate Research Scientist and Tim Lomax Research Engineer Texas Transportation Institute The
2. Context. Existing framework. The context. The challenge. Transport Strategy
 Transport Strategy Providing quality connections Contents 1. Introduction 2. Context 3. Long-term direction 4. Three-year priorities 5. Strategy tree Wellington City Council July 2006 1. Introduction Wellington
Figure 3B-1. Examples of Two-Lane, Two-Way Marking Applications
 Figure 3B-1. Examples of Two-Lane, Two-Way Marking Applications A - Typical two-lane, two-way marking with passing permitted in both directions B - Typical two-lane, two-way marking with no-passing zones
Roadways. Roadways III.
 Introduction 97 Roadway Design Principles 98 Safe Speeds 99 Optimizing of Street Space 00 Minimum Lane Widths in the City of Boston 02 Design Features that Reduce Operating Speeds 05 Travel Lanes Transit
Truck Climbing Lane Traffic Justification Report
 ROUTE 7 (HARRY BYRD HIGHWAY) WESTBOUND FROM WEST MARKET STREET TO ROUTE 9 (CHARLES TOWN PIKE) Truck Climbing Lane Traffic Justification Report Project No. 6007-053-133, P 101 Ι UPC No. 58599 Prepared by:
405 Express Lanes General Information & Frequently Asked Questions
 The questions and answers below provide current information on the project to improve Interstate 405 (I-405) in Orange County from State Route 73 to Interstate 605. Why are improvements needed on I-405?
MUTCD Part 6G: Type of Temporary Traffic Control Zone Activities
 MUTCD Part 6G: Type of Temporary Traffic Control Zone Activities 6G.01 Typical Applications Each temporary traffic control (TTC) zone is different. Many variables, such as location of work, highway type,
Highway 217 Corridor Study. Phase I Overview Report
 Highway 217 Corridor Study Phase I Overview Report November 3, 24 BACKGROUND AND OVERVIEW Study purpose The Highway 217 Corridor Study is developing multi-modal transportation solutions for traffic problems
MoPac South: Impact on Cesar Chavez Street and the Downtown Network
 MoPac South: Impact on Cesar Chavez Street and the Downtown Network Prepared by: The University of Texas at Austin Center for Transportation Research Prepared for: Central Texas Regional Mobility Authority
ECONOMY PEOPLE ENVIRONMENT
 Report Back on Local Transit Improvements May 29, 2013 ECONOMY PEOPLE ENVIRONMENT Intro Council Requested Report Back Topics Progress on Planning for Broadway Subway False Creek Bridges Local Transit Improvements
M-58 HIGHWAY ACCESS MANAGEMENT STUDY Mullen Road to Bel-Ray Boulevard. Prepared for CITY OF BELTON. May 2016
 M-58 HIGHWAY ACCESS MANAGEMENT STUDY Prepared for CITY OF BELTON By May 2016 Introduction Missouri State Highway 58 (M-58 Highway) is a major commercial corridor in the City of Belton. As development has
Subject: Use of Pull-off Areas in Work Zones Page: 1 of 13. Brief Description: Guidance for the use and placement of pull-off area in work zones.
 6 - G2 Subject: Use of Pull-off Areas in Work Zones Page: 1 of 13 MdMUTCD REF. NO. None Date Issued: 09/09 Effective Date: 09/09 Brief Description: Guidance for the use and placement of pull-off area in
North Coast Corridor:
 North Coast Corridor: Connecting People, Transportation & Environment Legislative Hearing: 11.8.10 1 North Coast Corridor Region s Lifeline A Regional Strategy Mobility, Economy & Environment North Coast
State Road & Tollway Authority Georgia 400 Demolition Project Frequently Asked Questions
 State Road & Tollway Authority Georgia 400 Demolition Project Frequently Asked Questions 1. When will toll collection end? Toll collection is scheduled to end on Friday, November 22, weather permitting.
5. RUNNINGWAY GUIDELINES
 5. RUNNINGWAY GUIDELINES These guidelines should be considered collectively when making runningway decisions. A runningway is the linear component of the transit system that forms the right-of-way reserved
Operational Comparison of Transit Signal Priority Strategies
 Operational Comparison of Transit Signal Priority Strategies Revision Submitted on: November, 0 Author: Adriana Rodriguez, E.I Assistant Engineer Parsons Brinckerhoff 0 South Orange Avenue, Suite 00 Orlando,
DEFINITIONS Activity Area - Advance Warning Area Advance Warning Sign Spacing Advisory Speed Approach Sight Distance Attended Work Space
 DEFINITIONS Activity Area - that part of a TTC zone activity area where the work actually takes place. It consists of the work space, traffic space and one or more buffer spaces. Advance Warning Area -
Capital Beltway HOT Lanes - Frequently Asked Questions
 Capital Beltway HOT Lanes - Frequently Asked Questions December 20, 2007 1. What is the cost of the project? The fixed-price design-build cost is approximately $1.4 billion. 2. Why have the project costs
NORTH HOUSTON HIGHWAY IMPROVEMENT PROJECT DRAFT NEED AND PURPOSE
 NORTH HOUSTON HIGHWAY IMPROVEMENT PROJECT DRAFT NEED AND PURPOSE APPROVED BY FHWA: JULY 2010 UPDATED: OCTOBER 2011 Section 1 Need for and Purpose of Proposed Action Per Council on Environmental Quality
Defining Purpose and Need
 Advanced Design Flexibility Pilot Workshop Session 4 Jack Broz, PE, HR Green May 5-6, 2010 Defining Purpose and Need In your agency s project development process, when do design engineers typically get
Chapter 2. Bellingham Bicycle Master Plan Chapter 2: Policies and Actions
 Chapter 2 Bellingham Bicycle Master Plan Chapter 2: Policies and Actions Chapter 2: Policies and Actions The Bicycle Master Plan provides a road map for making bicycling in Bellingham a viable transportation
Congestion Reducing Activities. Toby Carr GDOT Director of Planning April 10, 2014
 Congestion Reducing Activities Toby Carr GDOT Director of Planning April 10, 2014 GDOT Performance Dashboard Congestion Congestion Relief Strategies 511 HEROS RTOP Highway Emergency Response Operators
University Hill Transportation Study Technical Memorandum Alternatives Modeling and Analysis May 2007
 Technical Memorandum May 2007 Syracuse Metropolitan Transportation Council Edwards and Kelcey with Wallace Roberts and Todd Alta Planning and Design CONTENTS SECTION ONE- INTRODUCTION...1 SECTION TWO-
100 Most Congested Roadways in Texas
 100 Most Congested Roadways in Texas 2017 EXECUTIVE SUMMARY In response to increased roadway congestion throughout the state, in 2009 the Texas Legislature mandated that the Texas Department of Transportation
Managed Lanes: A National Perspective Managed Lane Strategies
 Managed Lanes: A National Perspective Managed Lane Strategies Use the following control strategies to manage a lane(s) to provide a reliable transportation option: Eligibility/occupancy Access control
3 TRAFFIC CONTROL SIGNAL TIMING AND SYNCHRONIZATION
 Report No. 8 of the Transportation Services Committee Regional Council Meeting of October 20, 2011 3 TRAFFIC CONTROL SIGNAL TIMING AND SYNCHRONIZATION The Transportation Services Committee recommends:
Geometric and Trafc Conditions Summary
 2 Geometric and Trafc Conditions Summary m, RETHNKNG -94 APPENDX T2 GEOMETRC AND TRAFFC CONDTONS SUMMARY ntroduction This memorandum summarizes the geometric and traffic conditions within the Rethinking
CHAPTER 1 STANDARD PRACTICES
 CHAPTER 1 STANDARD PRACTICES OBJECTIVES 1) Functions and Limitations 2) Standardization of Application 3) Materials 4) Colors 5) Widths and Patterns of Longitudinal Pavement Marking Lines 6) General Principles
City of Elizabeth City Neighborhood Traffic Calming Policy and Guidelines
 City of Elizabeth City Neighborhood Traffic Calming Policy and Guidelines I. Purpose: The City of Elizabeth City is committed to ensure the overall safety and livability of residential neighborhoods. One
Overview of 64 Express Lanes. Secretary of Transportation Aubrey Layne April 12, 2017
 Overview of 64 Express Lanes Secretary of Transportation Aubrey Layne April 12, 2017 2 More Choices for Motorists Coming December 2017 Purpose and Use Our purpose is two-fold: Reduce congestion by making
100 Most Congested Roadways in Texas
 100 Most Congested Roadways in Texas 2018 Report EXECUTIVE SUMMARY In response to increased roadway congestion throughout the state, in 2009 the Texas Legislature mandated that the Texas Department of
Highway 17 Transportation Improvement Study
 Final Report Highway 17 Transportation Improvement Study prepared for Santa Cruz County Regional Transportation Commission (SCCRTC) prepared by Planning and Engineering, Inc. 1155 North First Street, Suite
Part-time Shoulder Use Guide
 1 Part-time Shoulder Use Guide FHWA Guide AASHTO SCOD, Baltimore, MD June 2016 DOTs Face Increasing Challenges 2 Performance Based Practical Design 3 PBPD is a decision making approach that helps agencies
Northern Virginia Express Lanes Design Challenges and Solutions. IBTTA Maintenance and Roadway Operations Workshop June 25, 2018
 Northern Virginia Express Lanes Design Challenges and Solutions IBTTA Maintenance and Roadway Operations Workshop June 25, 2018 Virginia Express Lanes Overview 60 miles of managed lanes (4 projects) Long
Off-road Trails. Guidance
 Off-road Trails Off-road trails are shared use paths located on an independent alignment that provide two-way travel for people walking, bicycling, and other non-motorized users. Trails specifically along
Transform 66 Project February 4, 2016 Partnering Conference Michigan Department of Transportation American Council of Engineering Companies
 Transform 66 Project February 4, 2016 Partnering Conference Michigan Department of Transportation American Council of Engineering Companies Susan Shaw, PE, CCM, DBIA Megaprojects Director Northern Virginia
OVERVIEW OF METHODOLOGY
 I N T R O D U C T I O N The Orange County Transportation Authority () is the county transportation commission responsible for planning, funding and delivering transportation improvements in Orange County
Texas Intersection Safety Implementation Plan Workshop JUNE 2, 2016
 Texas Intersection Safety Implementation Plan Workshop JUNE 2, 2016 Why Intersection Safety? A small part of overall highway system, but Each year roughly 50% of all crashes estimated 3 million involve
November 2, Government takes on the challenge of improving traffic safety
 November 2, 2006 Government takes on the challenge of improving traffic safety Edmonton... The Alberta government has taken on the challenge of improving traffic safety by moving ahead with a comprehensive,
EXECUTIVE SUMMARY... vii 1 STUDY OVERVIEW Study Scope Study Area Study Objectives
 Contents EXECUTIVE SUMMARY... vii 1 STUDY OVERVIEW... 1-1 1.1 Study Scope... 1-1 1.2 Study Area... 1-1 1.3 Study Objectives... 1-3 2 EXISTING CONDITIONS... 2-1 2.1 Existing Freeway Conditions... 2-4 2.1.1
1.3.4 CHARACTERISTICS OF CLASSIFICATIONS
 Geometric Design Guide for Canadian Roads 1.3.4 CHARACTERISTICS OF CLASSIFICATIONS The principal characteristics of each of the six groups of road classifications are described by the following figure
Public Information and Participation Comments
 Two public meetings were held in December. The first meeting was December 6, 2011 at Mary Ellen Henderson Middle School and had 36 public attendees. The second meeting was on December 14, 2011 at the Arlington
Section 3A.04 Colors. Section 3B.10 Approach Markings for Obstructions
 Section 3A.04 Colors Markings shall be yellow, white, red, or blue, or purple. The colors for markings shall conform to the standard highway colors. Black in conjunction with one of the above colors shall
Proposed Action, Purpose and Need Technical Memorandum
 Proposed Action, Purpose and Need Technical Memorandum MoPac (State Loop 1) Intersections, Austin District From North of Slaughter Lane to South of La Crosse Avenue CSJ: 3136-01-015 Travis County, Texas
Corridor Advisory Group and Task Force Meeting #10. July 27, 2011
 Corridor Advisory Group and Task Force Meeting #10 July 27, 2011 1 Agenda Recap CAG/TF #9 Public Meeting #2 Summary Single Mode Alternatives Evaluation Results Next Steps 2 3 CAG/TF #9 Recap CAG /TF #9
Main-McVay Transit Study: Phase 2 Options Definition and High Level Constraints Evaluation
 Main-McVay Transit Study: Phase 2 Options Definition and High Level Constraints Evaluation APRIL 2016 A collaborative study between: For Additional Information or to Comment If you would like additional
City of Wayzata Comprehensive Plan 2030 Transportation Chapter: Appendix A
 A1. Functional Classification Table A-1 illustrates the Metropolitan Council s detailed criteria established for the functional classification of roadways within the Twin Cities Metropolitan Area. Table
CHAPTER 7 ACCESS MANAGEMENT. Background. Principles of Access Management. Hennepin County Transportation Systems Plan (HC-TSP)
") CHAPTER 7 ACCESS MANAGEMENT Background Principles of Access Management Hennepin County Transportation Systems Plan (HC-TSP) Chapter 7 Access Management 7.1 Background Access management has become an important
CHAPTER 7 ACCESS MANAGEMENT Background Principles of Access Management Hennepin County Transportation Systems Plan (HC-TSP) Chapter 7 Access Management 7.1 Background Access management has become an important
Mobility and Congestion
 Technical Memorandum Mobility and Congestion Prepared for: Prepared by: September 25, 2013 1 Table of Contents 1. Introduction... 1 2. Congestion Forecasting Process... 1 2.1 Mobility and Congestion Terms...
Economics of Highway Spending and Traffic Congestion. Todd Litman Victoria Transport Policy Institute Presented Strong Towns Webinar 3 February 2016
 Economics of Highway Spending and Traffic Congestion Todd Litman Victoria Transport Policy Institute Presented Strong Towns Webinar 3 February 2016 Motor Vehicle Travel is Peaking Annual Vehicle Mileage
Road Safety Audit Report: Interstate 516
 Road Safety Audit Report: Interstate 516 Interstate 516 from Veterans Pkwy to Montgomery St. (State Route 420 from Veterans Pkwy to City Street 115207) Table of Contents Introduction Road Safety Audit
GIVING GEORGIANS A CHOICE TO KEEP MOVING
 GIVING GEORGIANS A CHOICE TO KEEP MOVING I-85 Express Lanes Annual Performance Report FISCAL YEAR 2014 (JULY 1, 2013 JUNE 30, 2014) EEP OVING VISION AND MISSION Enhancing mobility in Georgia by providing
SUMMARY OF TRANSPORTATION INVESTMENTS
 Santa Cruz County 2016 Measure D: Transportation Improvement Expenditure Plan - Approved by over 2/3 of Santa Cruz County voters on November 8, 2016 - Overview Measure D, the 2016 Transportation Improvement
1. Operate along freeways, either in regular traffic lanes, in high-occupancy vehicle (HOV) lanes, or along the shoulders.
 lanes, or along the shoulders.") Most decisions about whether or not to use transit involve time and cost, and most transit services are slower than travel by private vehicle. However, when transit is faster or nearly as fast as travel
Most decisions about whether or not to use transit involve time and cost, and most transit services are slower than travel by private vehicle. However, when transit is faster or nearly as fast as travel
Access Location, Spacing, Turn Lanes, and Medians
 Design Manual Chapter 5 - Roadway Design 5L - Access Management 5L-3 Access Location, Spacing, Turn Lanes, and Medians This section addresses access location, spacing, turn lane and median needs, including
DEPARTMENT OF ENVIRONMENTAL SERVICES. North Harrison Street (Lee Highway to Little Falls Road) Comparative Analysis. Prepared for:
 Comparative Analysis. Prepared for:") DEPARTMENT OF ENVIRONMENTAL SERVICES North Harrison Street (Lee Highway to Little Falls Road) Comparative Analysis Prepared for: Arlington County Department of Environmental Services 2100 Clarendon Boulevard,
DEPARTMENT OF ENVIRONMENTAL SERVICES North Harrison Street (Lee Highway to Little Falls Road) Comparative Analysis Prepared for: Arlington County Department of Environmental Services 2100 Clarendon Boulevard,
INTRODUCTION THOROUGHFARE SYSTEM CLASSIFICATIONS
 INTRODUCTION The thoroughfare plan will assist public officials in the development of a specialized system for efficient and safe movement of vehicular traffic while minimizing potential conflicts with
The Safe System Approach
 There are very few areas of public discussion and sentiment which generate as much consensus as road safety. Everyone wants safer roads for all users, and road safety is a key priority for governments,
A Federal Perspective on Congestion Pricing. Wayne Berman Federal Highway Administration July 8, 2010
 A Federal Perspective on Congestion Pricing Wayne Berman Federal Highway Administration July 8, 2010 Overview Background on Congestion Pricing Benefits and Experiences of Pricing Case Study Miami I-95
MEMORANDUM. Charlotte Fleetwood, Transportation Planner
 MEMORANDUM Date: Updated August 22, 2017 To: Organization: Charlotte Fleetwood, Transportation Planner Boston Transportation Department From: Jason DeGray, P.E., PTOE, Regional Director of Engineering
Congestion Management in Singapore. Assoc Prof Anthony TH CHIN Department of Economics National University of Singapore
 Congestion Management in Singapore Assoc Prof Anthony TH CHIN Department of Economics National University of Singapore anthonychin@nus.edu.sg Introduction 2 Introduction and What is Traffic Congestion?
APPENDIX A: Complete Streets Checklist DRAFT NOVEMBER 2016
 APPENDIX A: Complete Streets Checklist DRAFT NOVEMBER 2016 Complete Streets Checklist MetroPlan Orlando s Complete Streets Checklist is an internal planning tool for staff to further implementation of
ENHANCED PARKWAY STUDY: PHASE 2 CONTINUOUS FLOW INTERSECTIONS. Final Report
 Preparedby: ENHANCED PARKWAY STUDY: PHASE 2 CONTINUOUS FLOW INTERSECTIONS Final Report Prepared for Maricopa County Department of Transportation Prepared by TABLE OF CONTENTS Page EXECUTIVE SUMMARY ES-1
MCTC 2018 RTP SCS and Madera County RIFP Multi-Modal Project Eval Criteria GV13.xlsx
 MCTC 8 RTP SCS and Madera County RIFP Multi-Modal Project Eval Criteria GV.xlsx Madera County Transportation Commission Regional Transportation Plan / Sustainable Communities Strategy Multi-Modal Project
Key objectives of the survey were to gain a better understanding of:
 3 COMMUNITY INPUT Community input is an essential part of corridor studies. For the SR 87 corridor study, VTA staff conducted an extensive online survey of people living and commuting along the corridor.
INDEX. Geometric Design Guide for Canadian Roads INDEX
 Acceleration lane, see Lanes, Acceleration Access, 8.1 Access Management and Functional Classification 8.2 Access Management by Design Classification 8.3 Access Configuration 8.4 Building Set-Back Guidelines
THE FUTURE OF THE TxDOT ROADWAY DESIGN MANUAL
 THE FUTURE OF THE TXDOT ROADWAY DESIGN MANUAL Kenneth Mora, P.E. (Design Division) 10/10/2017 Table of contents 1 2 Reduction in FHWA design controlling criteria Innovative Intersection Guidance 3-7 8-42
City of Novi Non-Motorized Master Plan 2011 Executive Summary
 City of Novi Non-Motorized Master Plan 2011 Executive Summary Prepared by: February 28, 2011 Why Plan? Encouraging healthy, active lifestyles through pathway and sidewalk connectivity has been a focus
4. ENVIRONMENTAL IMPACT ANALYSIS 9. TRANSPORTATION AND TRAFFIC
 4. ENVIRONMENTAL IMPACT ANALYSIS 9. TRANSPORTATION AND TRAFFIC 4.9.1 INTRODUCTION The following section addresses the Proposed Project s impact on transportation and traffic based on the Traffic Study
ROADSOADS CONGESTION HAMPTON SYSTEMYSTEM MANAGEMENT. Part II Roadway Congestion Analysis Mitigation Strategies and Evaluation
 HAMPTON ROADSOADS CONGESTION MANAGEMENT SYSTEMYSTEM Part II Roadway Congestion Analysis Mitigation Strategies and Evaluation Presented by: Dwight Farmer, PE Deputy Executive Director, Transportation April
Alberta Infrastructure HIGHWAY GEOMETRIC DESIGN GUIDE AUGUST 1999
 Alberta Infrastructure HIGHWAY GEOMETRIC DESIGN GUIDE AUGUST 1999,1'(; A ACCELERATION Data on acceleration from stop D-29 Effects of grade D-35 Intersections D-97, D-99 Lanes D-97, F-5, F-7, F-15, F-21,
Pocatello Regional Transit Master Transit Plan Draft Recommendations
 Pocatello Regional Transit Master Transit Plan Draft Recommendations Presentation Outline 1. 2. 3. 4. What is the Master Transit Plan? An overview of the study Where Are We Today? Key take-aways from existing