The SCOOT Urban Traffic Control System
|
|
|
- Martin Carter
- 5 years ago
- Views:
Transcription

1 The SCOOT Urban Traffic Control System 1
2 Contents Introduction of SCOOT SCOOT System Architecture The SCOOT Traffic Model The SCOOT Signal Optimiser Several New Functions Discussion: Deficiencies of SCOOT 2
3 What is SCOOT? The Split Cycle Offset Optimization Technique (SCOOT), is an online signal timing optimizer. It was developed in 1973 by the Transport Research Laboratory in the United Kingdom It has been implemented into realworld application since
4 Development of SCOOT Early 1980 s Early work - developed off-line software (TRANSYT) to calculate optimum signal settings for a signal network. Based on TRANSYT, SCOOT has been continuously developed as an on-line signal control system at early 1980 s. Version 3.1 included bus priority, database facilities and incident detection. Version 4.2 added estimates of the emission of pollutants. Version 4.5 enabled the bus priority to differentiate between different buses. (e.g. : to give more priority to late buses.) Now MC3 has enabled the Kernel software to safely use data supplied by packet switched communications systems, provided a congestion supervisor and increased the priority available to buses by allowing state skipping where it is appropriate. 4
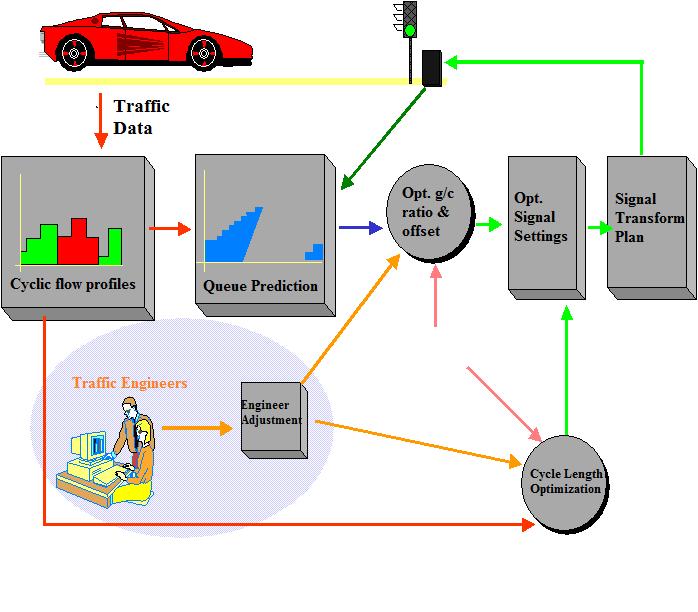
5 Introduction SCOOT: it is designed for general application within a computerized Urban Traffic Control System. Methodology: it is a method of coordination that adjusts the signal timings in frequent, small increments to match the latest traffic situation. Traffic Model: data from vehicle detectors are analyzed by an online computer which contains programs that calculate traffic flows, predicted queues. Optimisers: three optimizers which are adapting the amount of green for each approach (Split), the time between adjacent signals (Offset), and the time allowed for all approaches (Cycle Length). 5
6 System Architecture 6
7 How the SCOOT Works? Upstream Detectors r te n e C l tro n o C m y s te S On-line Traffic Model Up-stream Cycle Flow Profile Down stream Predict Requirement l a e R d e liz tra n e C r te u p m o C e im -T Signal Optimiser Signal Timing Plan Local Controller 7
8 SCOOT Traffic Model Both SCOOT and TRANSYT employ the traffic model to predict the delay and stops caused by particular signal settings; In the case of TRANSYT, the model is off-line and it predicts the average delays that resulted from specified average flows; The SCOOT model is on-line that the predictions of delay are re-calculated every few seconds from the latest measurements of traffic behaviors 8
9 SCOOT Traffic Model 1. Vehicle Detection 2. Cycle Flow Profile 3. Prediction of Queues 4. Congestion 5. Measurement of Travel Behavior 9
10 Vehicle Detections The vehicle detectors are placed at the upstream of the stop-line; The detectors are located as far upstream as possible from the stopline; Normally, the distance between detector and stop-line is larger than the maximum potential queue length; If the actual queue length is larger than the distance, then the system would get the warning of congestion, and the corresponding function would be effective; For the specific bus priority control, a set of bus detectors should be installed. 10
11 Cyclic Flow Profiles (CFP) The data from detectors are stored in the SCOOT system as the form of Cyclic Flow Profiles. The profile patterns tend to be repeated and coupled with new data in a cyclic sequence to avoid large random fluctuation in the profile. The cycle flow profiles contain the information needed to decide how best to coordinate adjacent pair of signals and cause the signal optimiser to search for a new best timing. 11

12 CFP Example (1) Profile A shows that most of the traffic crosses the detector as a dense platoon during the first half of the signal cycle time; Traffic platoon Without other considerations, a good progression could be achieved by ensuring that the downstream signals remain green while the platoon crosses the stop-line. 12


13 CFP Example (2) Profile B shows no marked tendency for traffic to travel in platoons; Profile C shows that traffic has formed two distinct platoons within each signal cycle. In this case, the green time at the downstream may be arranged to give progression to either the first or second platoon. 13
14 Prediction of Queues The cruise time is used to predict when the vehicle flows that are recorded in the profile are likely to reach the stop line. Vehicle arrivals at the stop line during the red time are added onto the back of queue, which usually continuous to grow in the next green time until the queue clear. Vehicle discharges from the front of the queue at the specified saturation rate 14
15 Prediction of Queue Time Now Flow Current CFP Travel Distance Detector Data 0 1 Cylcle Flow adds to the back of the queue Cruise speed Saturation Flow Rate Actual queue Predicted queue Red Time Now Green Past Future 15
16 Prediction of Queue It will be apparent that these predictions of queue lengths cannot be completely accurate. The prediction errors may become serious and so various validations have been incorporated into SCOOT. As long as the validation has been accepted, the queue model could be used continuously if the traffic condition is stable in the future. 16
17 Congestion Widespread congestion may occur when the queue grow in length and extend backwards into its upstream junction. The traffic model measures the proportion of cycle time that the detector is occupy by a queue, moreover, the optimiser use this information to reduce the likelihood of queue blocking the upstream junction. 17
18 Measures of Traffic Behavior To estimate current size of queue at link with the control area. From these estimates, SCOOT calculates an average value for the sum of the queues; this value is used as a measure of the inefficiency of traffic movement and is called Performance Index (PI). The SCOOT optimiser continuously searches for signal settings that make the PI as small as possible. 18
19 Measures of Traffic Behavior The total number of stops can be weighted and summed with the average queue into the PI. The proportion of a cycle time that vehicles are stationary over detectors can be weighted and summed into the PI (indicate congestion). 19
20 Measure of Traffic Behavior The degree of saturation is defined as the ratio of the average flow to the maximum flow which can be pass through the intersection from a particular approach and calculated by the traffic model. Traffic model measure average travel demand (the sum of the average flows across all the detectors in the area) and the average value of PI. If a large increase in PI without much change in the demand, it suggests that abnormal event, such as accident, has occurred. 20
21 SCOOT Signal Optimiser The system contains a set of parameters that control all the signals settings in the area. If this set of parameters unchanged, then the associated signals will be controlled by a fixed time plan. However, in normal operations, the optimiser makes frequent changes by small alternations to the parameters so as to adapt the fixed time plan to variations in the traffic behavior. 21
22 SCOOT Signal Optimiser A few seconds before each stage change, it estimate every junction whether it is better to make change earlier, latter, or as scheduled. To implement the alternation to minimize the max DS on the approach of that junction. Calculation is to take account of current queue length, approach congestion measurement and minimum green time constrains. 22
23 SCOOT Signal Optimiser The sequence of installing process: fix time plan, split optimiser, offset optimiser, cycle time optimiser. 23
24 SCOOT Signal Optimiser Signal Optimiser Minimization Max. DS Approach Calculation Parameters Current Queue Length Constrain Minimum Green Time Approach Congestion Measure Sequence 1. Fix Time Plan 2. Split Opt. 3. Offset Opt. 4. Cycle Opt. 24
25 Split Optimiser A few seconds (5 secs) before each stage change at every SCOOT intersection is scheduled to occur, the optimizer estimates whether it is better to make the change earlier or later; Any one decision by the optimizer may alter a scheduled stage change time by no more than a few seconds (Maximum allowed changed time) The signal optimizer will minimize the maximum degree of saturation on the approaches at each intersection. 25
26 Split Optimiser Change of green duration: Temporary change (e.g. 4 secs): it is made to the change of green durations to take account of the cycle-by-cycle random traffic variations. Permanent change (e.g. 1 sec): it is made to the stored values of green duration so that longer term trends in the traffic demands can be followed. Over a period of several minutes, the proportions of green time can be completely revised by SCOOT to meet a new pattern of traffic flows. 26
27 Split Optimiser Each junction will be threaded by the split optimiser independently and performed more frequently than other optimisers. For example, in a network of 50 junctions with an average of 3 stages per junction, there will be 150 decisions per cycle. If some decisions are missed, then the split plan will remain unchanged. 27
28 Split Optimiser Cycle by Cycle Junction Independent Stage Specification Missing Decision Making Decision No Change As Schedule Stage Change Early Stage Change Latter Temporary Change Account Cycle by Cycle Account Each Temporary Change Permanent Change Random Variation Flow Change Stage Value After Several Minutes Follow Long Term Traffic Demand 28
29 Split Optimiser(example) 95% 90% 55% 90% Without Optimization With Optimization Based on the CFP data, the degree of saturation at major road and minor road would be 95% and 55% follow the scheduled. 2. With the objective of minimize the maximum degree of saturation, a temporary change are made to increase the green duration of major road by 4 secs and reduce the green time of minor road; 3. The corresponding degrees of saturation achieved a balance and both are changed to 90%. 29
30 Offset optimiser At each intersection, the offset optimizer make the offset decision once every cycle. Since the offset of one intersection is altered relative to adjacent intersection, the offset between an adjacent pair of intersections may alter twice per cycle. Decisions are taken during a predetermined stage within every cycle time. 30
31 Offset optimiser To use cycle flow profile information to estimate overall traffic progression in those street which are immediately upstream and downstream. To compare the sum of PI : scheduled offset / occurring earlier or latter. Offset optimiser are modified when congestion occur: to improve the coordination on shorter street at the expense of longer street, since the longer street has a larger queue storage space to prevent potential spillback. 31

32 Offset optimizer How the offset optimizer operate? The offset decisions at A~E are influenced only by the movements represented in the mini-area. Offset decision are taken once per cycle for each mini-area ; Totally new signal offsets may evolve where timing alterations accumulate over several cycles of the signals. 32
33 Offset Optimiser Estimation Each Junction Cycle by Cycle Decision Comparision Cycle Flow Profile Inform. Schedule & Early & Latter All Adjacent Junction Minimum Sum of PI Change Relative Offset Congestion Adjacent Prevent Spillback Log Street Fine Space for Queue Amend All Stage Change Times After Several Cycle Evolve New Offset Plan 33
34 Cycle Length Optimiser The signal controlled intersections are grouped into sub areas which have pre-set boundaries. All signals within a sub area are operated by SCOOT on a common Cycle Length. Also, some intersections can be operated on one half of the common cycle time of the sub-are; this is referred to as double-cycling and is of particular value for signal controlled pedestrian crossings. 34
35 Cycle Length Optimizer Constraints: The cycle length would be re-optimized in increments of a few seconds at interval of not less than 2.5 minutes; Each sub-ease is independent of other sub-areas, between preset upper and lower bounds; The lower bound is determined by the considerations of safety, pedestrian crossing time and min green time (30-40 secs); The upper bound is set to give maximum traffic capacity but without unduly long red times ( secs). 35
36 Cycle Length Optimizer In SCOOT, the cycle length will increase when the traffic demand is increasing: Traffic Demand Time Cycle Length 36
37 Cycle Length Optimizer Optimization Strategy Optimized interval: mins; Cycle Length increment: 4s, 8s, 16s, 32s (depends on the length of scheduled cycle); Objective: to provide maximum traffic capacity of the intersection; Optimization Method: the cycle length is incremented or decremented to ensure that the most heavily loaded intersection operates at a maximum degree of saturation of about 90%. 1) if all stop-lines are less than 90% saturated, the CL decreased; 2) if the degree of saturation exceeds 90%, SCOOT will increase the cycle length to increase the capacity. 37
38 Cycle Time Optimiser Common Cycle Length Operate 90% DS DS < 0.9 DS > 0.9 Cycle Time Reduce; Demand Fix; Capacity Decrease Cycle Time Increase; Demand Fix; Capacity Increase DS Increase DS Decrease DS Critical Intersection = 0.9 Minor Intersection < 0.9 Mini Area Save Delay System DS 0.9 Single & Double CL Decision Lower Bound Upper Bound * Pedestrian Crossing * Minimum Green New Cycle Plan Implement within 2.5 Min * Traffic Capacity 38
39 CL Optimizer (Example) CL: 96; s: 87% CL: 52; s: 43% Most heavily loaded intersection CL: 52; s: 43% Scheduled Cycle Length CL: 64; s: 55% CL: 100 s: 92% CL: 104; s: 85% CL: 52; s: 25% Most heavily loaded intersection CL: 104; s: 25% Optimized Cycle Length CL: 104; s: 32% CL: 104 s: 90% 39
40 Control with users adjustment Sometimes, the users may not satisfy with the optimized result and want to adjust the optimization process to face some particular issues. For example: to optimize the signal along an arterial, traffic engineers prefer to provide the arterial flows a better level of service. Then, a higher weight is given to the corresponding directions. SCOOT Result 90% 90% Adjusted by engineer 95% 70% 70% 70% 85% 50% 40
41 Congestion Management SCOOT includes functions to deal with the occurrence of congestion: It will automatically move the offset to these congestion directions, to provide the congestion movements with a larger green band. Gating facility is also used to limit the flow of traffic into a particularly sensitive area by restraining traffic on user specified roads. 41
42 Congestion Management Upstream Control Strategy Restrict traffic Sensitive Area At the upstream, the gating facility is used to limit the traffic flows into the sensitive area Downstream Control Strategy Sensitive Area Vehicle discharge At the downstream, a proper signal settings is provided to discharge vehicles ASAP. 42

43 Bus Priority 43
44 Bus Detection The SCOOT allows for buses to be detected either by selective vehicle detectors, i.e. using bus loops and transponders on buses, or by an automatic vehicle location (AVL) system. The best location for detection will be a compromise between the need for detection as far upstream as possible and the need for accurate journey time prediction. Bust detectors need to be located downstream of any bus stops, as SCOOT does not attempt to model the bus dwelling time. 44
45 Priority Techniques Priority can be given to individual buses: extension to prevent a bus being stopped at the start of red and recalls to start the bus green earlier than normal. In SCOOT MC3, intermediate stages between the current stage and the bus stage can be skipped. Differential priority allows different levels to be given to certain buses, e.g., limited priority to late buses and high priority to very late buses, but no priority to those ahead of schedule. Controlled by user set parameters to prevent the priority causing undesired extra delay to other vehicles. 45
, it will receive an extension of green time. 46")
46 Bus Priority If a bus is detected towards the end of Stage 1 (Orange), it will receive an extension of green time. 46
")
47 Bus Priority If bus is detected during a red period, it will receive a recall (the stage 2 and 3 are shorten so that stage 1 starts earlier) 47

48 Bus Priority If the bus is detected during a red period, the following stage 3 would be skipped so that the stage 1 starts earlier. 48
49 Applications Over 50 cities allover the world have implemented SCOOT into applications. In North America: Anaheim, California, USA Santiago, California, USA Oxnard, California, USA Minneapolis, Minnesota, USA Red Deer, Alberta, Canada Toronto, Ontario, Canada 49
50 Deficiencies of SCOOT Due to the limitation of local controllers, SCOOT cannot skip phase or change the phase sequence. The objective function is not sufficient for use in various traffic conditions. SCOOT does not provide good results to deal with congestions, especially for those caused by incidents. 50
51 References Introductions: Hunt, P. B. A Traffic Responsive Method of Coordinating Signals. Report No. LR1014. Transport and Road Research Laboratory, Crowthorne, Berkshire, England, Greenough, J.C. and W.L. Kelman. Metro Toronto SCOOT: Traffic Adaptive Control Operation. ITE Journal, Vol. 58, No. 5, May Jhaveri, C.S., J. Perrin and P.T. Martin. SCOOT: An Evaluation of Its Effectiveness Over a Range of Congestion Intensities. Presented at the 82nd Annual Meeting of the Transportation Research Board, Washington, D.C., January TRB, National Research Council, Washington, DC, SCOOT - The World's Leading Adaptive Traffic Control System. Peek Traffic Limited, Siemens Traffic Controls and TRL Limited. Accessed April 27,
52 References Algorithm and Functions Hunt PB, Robertson DI, Bretherton RD, Royle MC. The SCOOT on-line traffic signal optimisation technique. Traffic Engineering and Control, Vol 23, Issue NO. 4., Ian Day, Siemens Ag, Ron Whitelock. SCOOT - Split, Cycle & Offset Optimization Technique. Transportation Research (1998) Dennis I. Robertson and David Bretherton. Optimizing Networks of Traffic Signals in Real Time The SCOOT Method. IEEE Transaction on vehicular technology, Vol. 40, NO.1, R D Bretherton, M Bodger and N Baber. SCOOT Managing Congestion Communications and Control. Proceedings of ITS World Congress. San Francisco (2005). Hansen, B.G., P. T. Martin, and H. J. Perrin SCOOT real-time adaptive control in a CORSIM simulation environment. Transportation Research Record National Research Council, Washington, D.C. p
53 References Updated Versions Bretherton, R.D., and G.T. Bowen. Recent enhancements to SCOOT - SCOOT version 2.4. Paper presented at the 3rd IEE International Conference on Toad Traffic Control Bretherton, R.D. Current developments in SCOOT: Version 3. Transportation Research Record National Research Council, Washington, D.C. Bretherton R D and G T Bowen. Latest Developments in SCOOT SCOOT version 3.1 proceedings IEE 6th International Conference on Road Traffic Control. London (April 1996). Bretherton R D, K Wood and G T Bowen. SCOOT Version 4. Proceedings IEE 9th International Conference on Traffic monitoring and control. London (April 1998). Siemens Traffic Controls Ltd., Peek Traffic Ltd. and TRL Ltd. Bus Priority in SCOOT, 2001, accessed June 12,
54 References Materials Provided by the Company Advice Leaflet 1: The SCOOT Urban Traffic Control System Advice Leaflet 2: Congestion Management in SCOOT Advice Leaflet 3: SCOOT control of pedestrian facilities Advice Leaflet 4: Bus Priority in SCOOT 54
55 References Other Evaluation Papers Mazzamatti, M.V., D.V.V.F. Netto, L.M. Vilanova and S.H. Ming Benefits gained by responsive and adaptive systems in São Paolo. Paper presented at the IEE Road Transport Information and Control, Conference Publication No Taale, H., W. C. M. Francis and J. Dibbits The second assessment of the SCOOT system in Nijmegen. Paper presented at the IEE Road Transport Information and Control, Conference Publication No Quan, B.Y., J.C. Greenough, and W.L. Kelman The Metropolitan Toronto SCOOT demonstration project. Paper presented at the 72nd Annual Meeting of the Transportation Research Board at Washington, D.C. Peck, C., P.T.W. Gorton, D. Liren The application of SCOOT in developing countries. Paper presented at the 3rd International IEE Conference on Road Traffic Control at London, U.K. p Chandler, M.J.H., and D.J. Cook Traffic control studies in London: SCOOT and bus detection. Paper presented at the PTRC Annual Summer Meeting at Seminar M, P269. p
SCOOT: Basic Principles
 SCOOT: Basic Principles Steve Holder Atkins Transportation Consultancy IHE Professional Certificate in Traffic Signal Control This presentation should assist you with the following competences; Competence
Bus priority in SCOOT
 Traffic Advisory Leaflet 8/00 December 2000 Bus priority in SCOOT Introduction This leaflet should be read in conjunction with TAL 7/99. It expands some of the information provided in the general guidance
Self-Organizing Signals: A Better Framework for Transit Signal Priority
 Portland State University PDXScholar TREC Friday Seminar Series Transportation Research and Education Center (TREC) 3-13-2015 Self-Organizing Signals: A Better Framework for Transit Signal Priority Peter
Mathematics of Planet Earth Managing Traffic Flow On Urban Road Networks
 Mathematics of Planet Earth Managing Traffic Flow On Urban Road Networks Adrian George Manager Network Improvements Anthony Fitts Manager Signal Design Melbourne s transport demands are growing 5m people
Improving the Bus Network through Traffic Signalling. Henry Axon Transport for London
 Improving the Bus Network through Traffic Signalling Henry Axon Transport for London Improving the Bus Network through Traffic Signalling Introduction Transport for London (TfL) operates the most frequent
Arterial Traffic Analysis Actuated Signal Control
 Arterial Traffic Analysis Actuated Signal Control Dr. Gang-Len Chang Professor and Director of Traffic Safety and Operations Lab. University of Maryland-College Park Actuated Signal Control Fully Actuated
SIDRA INTERSECTION 6.1 UPDATE HISTORY
 Akcelik & Associates Pty Ltd PO Box 1075G, Greythorn, Vic 3104 AUSTRALIA ABN 79 088 889 687 For all technical support, sales support and general enquiries: support.sidrasolutions.com SIDRA INTERSECTION
Design and Evaluation of Adaptive Traffic Control System for Heterogeneous flow conditions
 Design and Evaluation of Adaptive Traffic Control System for Heterogeneous flow conditions Tom Mathew IIT Bombay Outline 1. Heterogeneous traffic 2. Traffic Simulation 3. Traffic Signal control 4. Adaptive
RESPONSIVE ROUNDABOUTS MYTH OR REALITY
 RESPONSIVE ROUNDABOUTS MYTH OR REALITY Andy Poole WSP UK Three White Rose Office Park Millshaw Park Lane Leeds LS11 0DL andy.poole@wspgroup.com Keywords: Traffic signals, optimisation, micro-simulation,
Demonstration of Possibilities to Introduce Semi-actuated Traffic Control System at Dhanmondi Satmasjid Road by Using CORSIM Simulation Software
 Paper ID: TE-043 746 International Conference on Recent Innovation in Civil Engineering for Sustainable Development () Department of Civil Engineering DUET - Gazipur, Bangladesh Demonstration of Possibilities
Design and Evaluation of Adaptive Traffic Control System for Heterogeneous flow conditions. SiMTraM & CosCiCost2G
 Design and Evaluation of Adaptive Traffic Control System for Heterogeneous flow conditions SiMTraM & CosCiCost2G Tom Mathew IIT Bombay Outline 1. Heterogeneous traffic 2. Traffic Simulation 3. Traffic
ROUNDABOUT MODEL COMPARISON TABLE
 Akcelik & Associates Pty Ltd PO Box 1075G, Greythorn, Vic 3104 AUSTRALIA info@sidrasolutions.com Management Systems Registered to ISO 9001 ABN 79 088 889 687 ROUNDABOUT MODEL COMPARISON TABLE Prepared
3 TRAFFIC CONTROL SIGNAL TIMING AND SYNCHRONIZATION
 Report No. 8 of the Transportation Services Committee Regional Council Meeting of October 20, 2011 3 TRAFFIC CONTROL SIGNAL TIMING AND SYNCHRONIZATION The Transportation Services Committee recommends:
CALIBRATION OF THE PLATOON DISPERSION MODEL BY CONSIDERING THE IMPACT OF THE PERCENTAGE OF BUSES AT SIGNALIZED INTERSECTIONS
 CALIBRATION OF THE PLATOON DISPERSION MODEL BY CONSIDERING THE IMPACT OF THE PERCENTAGE OF BUSES AT SIGNALIZED INTERSECTIONS By Youan Wang, Graduate Research Assistant MOE Key Laboratory for Urban Transportation
Chapter Capacity and LOS Analysis of a Signalized I/S Overview Methodology Scope Limitation
 Chapter 37 Capacity and LOS Analysis of a Signalized I/S 37.1 Overview The Highway Capacity Manual defines the capacity as the maximum howdy rate at which persons or vehicle can be reasonably expected
Simulation of Arterial Traffic Using Cell Transmission Model
 1 Simulation of Arterial Traffic Using Cell Transmission Model Dongyan Su University of California, Berkeley 2167c Etcheverry Hall, University of California, Berkeley, CA 94720-1740 Tel: 1-510-928-8771,
Chapter 5 5. INTERSECTIONS 5.1. INTRODUCTION
 Chapter 5 5. INTERSECTIONS 5.1. INTRODUCTION Intersections are the physical component of the roadways where two highways intersect. They are the most complex element of roadways, since it requires more
Junction Design with Traffic Signals
 Junction Design with Traffic Signals Wednesday March 2 nd 2016 Overview Introduction Context Conventional Approach Sustainable Approach Analysis Design Summary Introduction What are Traffic Signals? Purpose
Module 3 Developing Timing Plans for Efficient Intersection Operations During Moderate Traffic Volume Conditions
 Module 3 Developing Timing Plans for Efficient Intersection Operations During Moderate Traffic Volume Conditions CONTENTS (MODULE 3) Introduction...1 Purpose...1 Goals and Learning Outcomes...1 Organization
An Analysis of Reducing Pedestrian-Walking-Speed Impacts on Intersection Traffic MOEs
 An Analysis of Reducing Pedestrian-Walking-Speed Impacts on Intersection Traffic MOEs A Thesis Proposal By XIAOHAN LI Submitted to the Office of Graduate Studies of Texas A&M University In partial fulfillment
Operational Comparison of Transit Signal Priority Strategies
 Operational Comparison of Transit Signal Priority Strategies Revision Submitted on: November, 0 Author: Adriana Rodriguez, E.I Assistant Engineer Parsons Brinckerhoff 0 South Orange Avenue, Suite 00 Orlando,
ROUNDABOUT MODEL COMPARISON TABLE
 Akcelik & Associates Pty Ltd PO Box 1075G, Greythorn, Vic 3104 AUSTRALIA www.sidrasolutions.com Management Systems Registered to ISO 9001 ABN 79 088 889 687 ROUNDABOUT MODEL COMPARISON TABLE Prepared by
Traffic Signal Optimization Project (Hosman Road) (Future Coordinated Corridor)
 (Future Coordinated Corridor)") Onondaga County Department of Transportation Traffic Signal Optimization Project (Hosman Road) (Future Coordinated Corridor) Prepared for: Syracuse Metropolitan Transportation Council 126 North Salina
Onondaga County Department of Transportation Traffic Signal Optimization Project (Hosman Road) (Future Coordinated Corridor) Prepared for: Syracuse Metropolitan Transportation Council 126 North Salina
EVALUATION OF ADAPTIVE AND FIXED TIME TRAFFIC SIGNAL STRATEGIES: CASE STUDY OF SKOPJE
 EVALUATION OF ADAPTIVE AND FIXED TIME TRAFFIC SIGNAL STRATEGIES: CASE STUDY OF SKOPJE Daniel Pavleski, MSc student Faculty of Technical Sciences St. Kliment Ohridski University - Bitola, Blvd 1st May,
Modifications to the Incremental Queue Accumulation Method for Complex Left Turn Phasing
 J. Basic. Appl. Sci. Res., 1(3)252-259, 2011 2010, TextRoad Publication ISSN 2090-424X Journal of Basic and Applied Scientific Research www.textroad.com Modifications to the Incremental Queue Accumulation
SPRUCING UP YOUR ITS. Sheffield City Council - August Brent Collier Stephanie Cooper Ben Hallworth
 SPRUCING UP YOUR ITS Sheffield City Council - August 2017 Brent Collier Stephanie Cooper Ben Hallworth 1 CONTENTS SPRUCING UP YOUR ITS... 1 Introduction... 3 SPRUCE Background... 3 Architecture... 4 Strategies...
Aspects Regarding Priority Settings in Unsignalized Intersections and the Influence on the Level of Service
 Aspects Regarding Priority Settings in Unsignalized Intersections and the Influence on the Level of Service Dumitru Ilie, Matei Lucian, Vînatoru Matei, Racilă Laurențiu and Oprica Theodor Abstract The
Modeling vehicle delays at signalized junctions: Artificial neural networks approach
 Journal of Scientific & Industrial Research Vol. 65, July 2006, pp. 558-564 Modeling vehicle delays at signalized junctions: Artificial neural networks approach Y Sazi Murat* and Özgür Baskan Civil Engineering
Capacity and Performance Analysis of Roundabout Metering Signals
 Capacity and Performance Analysis of Roundabout Metering Signals TRB National Roundabout Conference Vail, Colorado, USA, 22-25 May 2005 Pictures modified to show driving on the right-hand side of the road
Actuated Signal Timing Design CIVL 4162/6162
 Actuated Signal Timing Design CIVL 4162/6162 Session Objective Explain terms related to actuated signals Explain why and where actuated signals are used Determine detector locations given traffic conditions
Arterial Traffic Analysis Some critical concepts. Prepared by Philip J. Tarnoff
 Arterial Traffic Analysis Some critical concepts Prepared by Philip J. Tarnoff Agenda Fundamentals Signal timing concepts Actuated signal controllers Developing timing plans Types of signal control First
Introduction to Roundabout Analysis Using ARCADY
 Introduction to Roundabout Analysis Using ARCADY Toronto SimCap User Group Technical Event and ITE Toronto Section Social Event July 22, 2014 Phil Weber, P.Eng. GHD Inc. (The Home of Ourston Roundabout
Special Provisions for Left Turns at Signalized Intersections to Increase Capacity and Safety
 Journal of Advanced Transportation, Vol. 31, No. 1, pp, 95-109 Special Provisions for Left Turns at Signalized Intersections to Increase Capacity and Safety Bu-Yong Shin Heavy left-turns at intersections
Traffic Signals. Part I
 Traffic Signals Part I Part I The Islamic University of Gaza Civil Engineering Department Traffic Engineering (Optional Course) ECIV 5332 Instructor: Dr. Yahya Sarraj Associate Prof. in Transportation
Travel Time Estimation on a Signalised Urban Networks using Cumulative Plots
 Travel Time Estimation on a Signalised Urban etworks using Cumulative Plots Ashish Bhaskar LAVOC EPFL Ashish.bhakar@epfl.ch Phone: 41216932341 Dr. Edward Chung LAVOC EPFL edward.chung@epfl.ch Phone: 41216932343
How to achieve fluid traffic
 Kanton Basel-Stadt How to achieve fluid traffic Objectives, instruments and limits of traffic management Alain Groff, Office for Mobility, Canton of Basel-Stadt Overview Some figures about Basel Tools
Traffic Signal Design
 Traffic Signal Design Instructor: S. M. Mahdi Amiripour m.amiripour@gmail.com 2 Introduction Intersection is an area shared by two or more roads Designated for the vehicles to turn to different directions
Synchro Studio 8. Overview. By Ioannis Psarros
 Synchro Studio 8 Overview By Ioannis Psarros What is Synchro? Software for signal optimization Developed by Trafficware Optimization can be applied to: Cycle lengths Splits Offsets Source: http://bikewalklee.blogspot.com
Controlling Traffic by Designing Signal at Intersection of Vidisha Sachin Jat 1 Mr. S.S. Goliya 2 Sachin Nagayach 3 Rohit Gurjar 3
 IJSRD - International Journal for Scientific Research & Development Vol. 3, Issue 05, 2015 ISSN (online): 2321-0613 Controlling Traffic by Designing Signal at Intersection of Vidisha Sachin Jat 1 Mr. S.S.
Transit Signal Priority: Help or Hype? Peter G. Furth Northeastern University
 Transit Signal Priority: Help or Hype? Peter G. Furth Northeastern University Transit Signal Priority Help or Hype? Zurich: nearly zero traffic delay and impeccable punctuality for trams Portland, San
An Evaluation of Signalized Intersection System Analysis Techniques Walter J. Freeman, P.E., Kien Y. Ho, P.E., Elizabeth A. McChesney, E.I.T.
 An Evaluation of Signalized Intersection System Analysis Techniques Walter J. Freeman, P.E., Kien Y. Ho, P.E., Elizabeth A. McChesney, E.I.T. A system of signalized intersections is a critical element
A REAL-TIME SIGNAL CONTROL STRATEGY FOR MITIGATING THE IMPACT OF BUS STOPS ON URBAN ARTERIALS
 A REAL-TIME SIGNAL CONTROL STRATEGY FOR MITIGATING THE IMPACT OF BUS STOPS ON URBAN ARTERIALS Celeste Chavis 1, and Eleni Christofa 2 1 Department of Transportation and Urban Infrastructure Studies, Morgan
CONDUITS DST-Tel Aviv-Yafo Case Study
 CONDUITS DST-Tel Aviv-Yafo Case Study Introduction The city of Tel Aviv-Yafo is the nucleus of the Tel Aviv metropolitan area and serves as the financial and cultural centre of Israel. With a population
MEASURING PASSENGER CAR EQUIVALENTS (PCE) FOR LARGE VEHICLES AT SIGNALIZED INTERSECTIONS
 FOR LARGE VEHICLES AT SIGNALIZED INTERSECTIONS") MEASURING PASSENGER CAR EQUIVALENTS (PCE) FOR LARGE VEHICLES AT SIGNALIZED INTERSECTIONS Md. Mizanur RAHMAN Doctoral Student Graduate School of Engineering Department of Civil Engineering Yokohama National
MEASURING PASSENGER CAR EQUIVALENTS (PCE) FOR LARGE VEHICLES AT SIGNALIZED INTERSECTIONS Md. Mizanur RAHMAN Doctoral Student Graduate School of Engineering Department of Civil Engineering Yokohama National
Bus Speed Control System
 Oct. 16 th, 2015 Research Update Bus Speed Control System Hyeonmi Kim INTRODUCTION BUS Bunching stops stops stops stops 2 2 2 2 1 1 1 1 8:00 8:15 8:30 time 8:00 8:15 8:30 time 8:00 8:15 8:30 time 8:00
1.3.4 CHARACTERISTICS OF CLASSIFICATIONS
 Geometric Design Guide for Canadian Roads 1.3.4 CHARACTERISTICS OF CLASSIFICATIONS The principal characteristics of each of the six groups of road classifications are described by the following figure
Saturation flow mathematical model based on multiple combinations of lane groups
 València, Universitat Politècnica de València, 2016 DOI: http://dxdoiorg/104995/cit201620164254 Saturation flow mathematical model based on multiple combinations of lane groups Ilie Dumitru Assoc Prof,
PERFORMANCE EVALUATION OF AT GRADE INTERSECTIONS AND IMPROVEMENT USING SIGNAL COORDINATION
 83 PERORMANCE EVALUATION O AT GRADE INTERSECTIONS AND IMPROVEMENT USING SIGNAL COORDINATION Naveen Kumar R 1 and Dr.M.S.Nagakumar 2 1 Student, Department. of Civil Engineering, R.V.College of Engineering,
DERIVATION OF A SIGNAL TIMING SCHEME FOR AN EXTERNALLY SIGNALIZED ROUNDABOUT
 DERIVATION OF A SIGNAL TIMING SCHEME FOR AN EXTERNALLY SIGNALIZED ROUNDABOUT Paper Presented at the Annual Sessions of the Institute of Engineers, Sri Lanka Dr. Amal S. Kumarage, Senior Lecturer Dr. J.M.S.J.
Impacts of Bus Priority in Coordinated Traffic Signals
 Available online at www.sciencedirect.com Procedia Social and Behavioral Sciences 16 (2011) 578 587 6 th International Symposium on Highway Capacity and Quality of Service Stockholm, Sweden June 28 July
Tokyo: Simulating Hyperpath-Based Vehicle Navigations and its Impact on Travel Time Reliability
 CHAPTER 92 Tokyo: Simulating Hyperpath-Based Vehicle Navigations and its Impact on Travel Time Reliability Daisuke Fukuda, Jiangshan Ma, Kaoru Yamada and Norihito Shinkai 92.1 Introduction Most standard
Global Journal of Engineering Science and Research Management
 SIMULATION AND OPTIMZING TRAFFIC FLOW AT SIGNALIZED INTERSECTION USING MATLAB Dr Mohammed B. Abduljabbar*, Dr Amal Ali, Ruaa Hameed * Assist Prof., Civil Engineering Department, Al-Mustansiriayah University,
Bus Priority at Traffic Signals Evaluating Strategy Options
 Bus Priority at Traffic Signals Bus Priority at Traffic Signals Evaluating Strategy Options Fraser McLeod and Nick Hounsell University of Southampton, United Kingdom Abstract This article compares different
A New Lane-Based Model for Platoon Patterns at Closely-Spaced Signalised Intersections
 Akcelik & Associates Pty Ltd PO Box 1075G, Greythorn, Vic 3104 AUSTRALIA info@sidrasolutions.com Management Systems Registered to ISO 9001 ABN 79 088 889 687 REPRINT A New Lane-Based Model for Platoon
Strategies to Re capture Lost Arterial Traffic Carrying Capacities
 Strategies to Re capture Lost Arterial Traffic Carrying Capacities Chalap K. Sadam, P.E. and Albert L. Grover, P.E. Over the years, many arterials that were initially designed to carry tens of thousands
3 ROADWAYS 3.1 CMS ROADWAY NETWORK 3.2 TRAVEL-TIME-BASED PERFORMANCE MEASURES Roadway Travel Time Measures
 ROADWAYS Approximately 6 million trips are made in the Boston metropolitan region every day. The vast majority of these trips (80 to percent, depending on trip type) involve the use of the roadway network
Self-Organizing Traffic Signals Using Secondary Extension and Dynamic Coordination Rules
 Self-Organizing Traffic Signals Using Secondary Extension and Dynamic Coordination Rules Burak Cesme (corresponding author) Department of Civil and Environmental Engineering Northeastern
Queue analysis for the toll station of the Öresund fixed link. Pontus Matstoms *
 Queue analysis for the toll station of the Öresund fixed link Pontus Matstoms * Abstract A new simulation model for queue and capacity analysis of a toll station is presented. The model and its software
Evaluating Roundabout Capacity, Level of Service and Performance
 Roundabouts with Metering Signals ITE 2009 Annual Meeting, San Antonio, Texas, USA, August 9-12, 2009 Evaluating Roundabout Capacity, Level of Service and Performance Presenter: Rahmi Akçelik rahmi.akcelik@sidrasolutions.com
Unit 7 Speed, Travel Time and Delay Studies
 Unit 7 Speed, Travel Time and Delay Studies Introduction Speed, travel time and delay are all related measures that are common used as indicators of performance for traffic facilities Measure of Effectiveness
A simulation study of using active traffic management strategies on congested freeways
 Journal of Modern Transportation Volume 20, Number 3, September 2012, Page 178-184 Journal homepage: jmt.swjtu.edu.cn DOI: 10.1007/BF03325796 A simulation study of using active traffic management strategies
Operational Ranking of Intersections: A Novel Prioritization Methodology
 Operational Ranking of Intersections: A Novel Prioritization Methodology Reza Omrani, Ph.D. Transportation Engineer CIMA+ 3027 Harvester Road, Suite 400 Burlington, ON L7N 3G7 Reza.Omrani@cima.ca Pedram
ENHANCED PARKWAY STUDY: PHASE 2 CONTINUOUS FLOW INTERSECTIONS. Final Report
 Preparedby: ENHANCED PARKWAY STUDY: PHASE 2 CONTINUOUS FLOW INTERSECTIONS Final Report Prepared for Maricopa County Department of Transportation Prepared by TABLE OF CONTENTS Page EXECUTIVE SUMMARY ES-1
Analysis of Unsignalized Intersection
 International Journal of Constructive Research in Civil Engineering (IJCRCE) Volume 2, Issue 1, 2016, PP 30-36 ISSN 2454-8693 (Online) www.arcjournals.org Analysis of Unsignalized Intersection B.Ramkumar
MUTCD Part 6G: Type of Temporary Traffic Control Zone Activities
 MUTCD Part 6G: Type of Temporary Traffic Control Zone Activities 6G.01 Typical Applications Each temporary traffic control (TTC) zone is different. Many variables, such as location of work, highway type,
Volume-to-Capacity Estimation of Signalized Road Networks for Metropolitan Transportation Planning
 Volume-to-Capacity Estimation of Signalized Road Networks for Metropolitan Transportation Planning Hao Xu (Corresponding Author) Research Associate Department of Civil & Environmental Engineering Texas
LYNNWOOD ROAD ARTERIAL STUDY The effect of intersection spacing on arterial operation
 LYNNWOOD ROAD ARTERIAL STUDY The effect of intersection spacing on arterial operation A J Joubert*, S L Burnett**, and T Ueckermann* *PWV Consortium, PO Box 1109, Sunninghill 2157 **Gautrans, Gauteng Department
Appendix B: Forecasting and Traffic Operations Analysis Framework Document
 Existing Conditions Report - Appendix Appendix B: Forecasting and Traffic Operations Analysis Framework Document This document defines the methodology and assumptions that will be used in the traffic forecasting
ANALYSIS OF SIGNALISED INTERSECTIONS ACCORDING TO THE HIGHWAY CAPACITY MANUAL FROM THE POINT OF VIEW OF THE PROCESSES APPLIED IN HUNGARY
 2nd Int. Symposium in Civil Engineering 1998 Budapest ANALYSIS OF SIGNALISED INTERSECTIONS ACCORDING TO THE HIGHWAY CAPACITY MANUAL FROM THE POINT OF VIEW OF THE PROCESSES APPLIED IN HUNGARY István Styevola
Modeling Signalized Traffic Intersections Using SAS Simulation Studio. Leow Soo Kar
 Modeling Signalized Traffic Intersections Using SAS Simulation Studio Leow Soo Kar Department of Financial Mathematics and Statistics Sunway University 1 Contents Introduction. Case study. SAS Simulation
A detailed evaluation of ramp metering impacts on driver behaviour
 Transportation Research Part F 10 (2007) 61 75 www.elsevier.com/locate/trf A detailed evaluation of ramp metering impacts on driver behaviour J. Wu a,b, *, M. McDonald a, K. Chatterjee a a Transportation
Planning Committee STAFF REPORT March 7, 2018 Page 2 of 4 The following MTSOs are being used across the five subregions: Intersection Level of Service
 Planning Committee STAFF REPORT Meeting Date: March 7, 2018 Subject Summary of Issues Recommendations Financial Implications Options Attachments Changes from Committee Review Draft 2017 Multimodal Transportation
Simulating Street-Running LRT Terminus Station Options in Dense Urban Environments Shaumik Pal, Rajat Parashar and Michael Meyer
 Simulating Street-Running LRT Terminus Station Options in Dense Urban Environments Shaumik Pal, Rajat Parashar and Michael Meyer Abstract The Exposition Corridor transit project is a light rail project
Assessing the Traffic and Energy Impacts of Connected and Automated Vehicles (CAVs)
") Assessing the Traffic and Energy Impacts of Connected and Automated Vehicles (CAVs) Steven E. Shladover, Sc.D. (Retired from) California PATH Program University of California, Berkeley SIP-adus Workshop
Assessing the Traffic and Energy Impacts of Connected and Automated Vehicles (CAVs) Steven E. Shladover, Sc.D. (Retired from) California PATH Program University of California, Berkeley SIP-adus Workshop
QUEUE LENGTH AND DELAY ESTIMATION AT SIGNALIZED INTERSECTIONS USING DETECTOR DATA
 QUEUE LENGTH AND DELAY ESTIMATION AT SIGNALIZED INTERSECTIONS USING DETECTOR DATA Helen Thomas, Masters student, Department of Civil Engineering, IIT Madras, Chennai Anusha S.P., Doctoral student, Department
Roundabouts along Rural Arterials in South Africa
 Krogscheepers & Watters 0 0 Word count: 00 text + figures = 0 equivalent words including Title and Abstract. Roundabouts along Rural Arterials in South Africa Prepared for: rd Annual Meeting of Transportation
On-Road Parking A New Approach to Quantify the Side Friction Regarding Road Width Reduction
 On-Road Parking A New Regarding Road Width Reduction a b Indian Institute of Technology Guwahati Guwahati 781039, India Outline Motivation Introduction Background Data Collection Methodology Results &
Does Combining Transit Signal Priority with Dedicated Bus Lanes or Queue Jump Lanes at Multiple Intersections Create Multiplier Effects?
 Does Combining Transit Signal Priority with Dedicated Bus Lanes or Queue Jump Lanes at Multiple Intersections Create Multiplier Effects? Long T. Truong, Graham Currie, Mark Wallace, and Chris De Gruyter
Roundabouts in Australia: the state of the art on models and applications
 Roundabouts in Australia: the state of the art on models and applications Seminar Presentation One-day International Meeting on Roundabouts Università di Pisa - Corso di TECNICA del TRAFFICO, Livorno,
EXAMINING THE EFFECT OF HEAVY VEHICLES DURING CONGESTION USING PASSENGER CAR EQUIVALENTS
 EXAMINING THE EFFECT OF HEAVY VEHICLES DURING CONGESTION USING PASSENGER CAR EQUIVALENTS Ahmed Al-Kaisy 1 and Younghan Jung 2 1 Department of Civil Engineering, Montana State University PO Box 173900,
Operational Performance Comparison between Three Unconventional Intersection Designs: Left-turn Bypass, Diverging Flow and Displaced Left-turn
 Ninth LACCEI Latin American and Caribbean Conference (LACCEI 2011), Engineering for a Smart Planet, Innovation, Information Technology and Computational Tools for Sustainable Development, August 3-5, 2011,
Effects of Traffic Signal Retiming on Safety. Peter J. Yauch, P.E., PTOE Program Manager, TSM&O Albeck Gerken, Inc.
 Effects of Traffic Signal Retiming on Safety Peter J. Yauch, P.E., PTOE Program Manager, TSM&O Albeck Gerken, Inc. Introduction It has long been recognized that traffic signal timing can have an impact
Conversation of at Grade Signalized Intersection in to Grade Separated Intersection
 IJIRST International Journal for Innovative Research in Science & Technology Volume 2 Issue 05 October 2015 ISSN (online): 2349-6010 Conversation of at Grade Signalized Intersection in to Grade Separated
Queue Jump Lane, Transit Signal Priority, and Stop Location: Evaluation of Transit Preferential Treatments using Microsimulation
 Queue Jump Lane, Transit Signal Priority, and Stop Location: Evaluation of Transit Preferential Treatments using Microsimulation Burak Cesme (corresponding author) AECOM 1 Wilson
ISTTT20 Tutorials. Traffic Management and Control. A. Traffic Signal Control Introduction
 ISTTT20 Tutorials Traffic Management and Control A. Traffic Signal Control Introduction Prof. Nathan H. Gartner University of Massachusetts Lowell, MA, USA NHGartner,UML, July 2013 Module Objectives: Describe
TRANSIT SIGNAL PRIORITY The Toronto Experience
 TRANSIT SIGNAL PRIORITY The Toronto Experience July 27, 2004 July 27, 2004 1 Warning This presentation contains graphic images depicting serious violations to the coordination of traffic signals and may
TABLE OF CONTENTS 1. INTRODUCTION 2. TRAFFIC ENGINEERING FUNDAMENTALS 9. SYSTEM CONTROL 3. DATA COLLECTION 4. SIGNAL PHASING 10. SPECIAL OPERATIONS
 TABLE OF CONTENTS 1. INTRODUCTION 2. TRAFFIC ENGINEERING FUNDAMENTALS A. Volume, Demand, and Capacity 2-1 B. Performance Measures 2-7 C. Critical Lane Volume Analysis 2-9 3. DATA COLLECTION 4. SIGNAL PHASING
Indiana Traffic Signal Hi Resolution Data Logger Enumerations
 Purdue University Purdue e-pubs JTRP Data Papers 11-2012 Indiana Traffic Signal Hi Resolution Data Logger Enumerations James R. Sturdevant INDOT, jsturdevant@indot.in.gov Timothy Overman INDOT Eric Raamot
Influence of Vehicular Composition and Lane Discipline on Delays at Signalised Intersections under Heterogeneous Traffic Conditions
 Influence of Vehicular Composition and Lane Discipline on Delays at Signalised Intersections under Heterogeneous Traffic Conditions R.V. Yogesh Kumar, A. Gowri and R. Sivanandan Centre of Excellence in
Blocking time reduction for level crossings using the genetic algorithm
 Computers in Railways X 299 Blocking time reduction for level crossings using the genetic algorithm Y. Noguchi 1, H. Mochizuki 1, S. Takahashi 1, H. Nakamura 1, S. Kaneko 1 & M. Sakai 2 1 Nihon University,
Traffic Academy: IJS & IMS FAQ/RULES OF THUMB
 FAQ/RULES OF THUMB HCS intersection analysis criteria See LDM Figure 401-14aE Cycle lengths between 60 to 120 seconds No impractical phases, i.e., 1 second green time Yellow + All Red must be no less than
Optimizing The Operations of Closely Spaced Traffic Signals. Gordon E. Meth, P.E., PTOE ITE District 1 Annual Meeting May 21, 2004
 Optimizing The Operations of Closely Spaced Traffic Signals Gordon E. Meth, P.E., PTOE ITE District 1 Annual Meeting May 21, 2004 Closely Spaced Signals - The Challenges According to many sources, minimum
HIGHWAY CAPACITY MANUAL 2010: NEW SIGNALIZED INTERSECTION METHODOLOGY. James A. Bonneson, Ph.D., P.E.
 HIGHWAY CAPACITY MANUAL 2010: NEW SIGNALIZED INTERSECTION METHODOLOGY James A. Bonneson, Ph.D., P.E. Texas Transportation ti Institute t Housekeeping 2 All participant phone lines are muted to avoid distractions
Webinar: Exploring Pedestrian Responsive Traffic Signal Timing Strategies in Urban Areas
 Portland State University PDXScholar TREC Webinar Series Transportation Research and Education Center (TREC) 1-29-2015 Webinar: Exploring Pedestrian Responsive Traffic Signal Timing Strategies in Urban
Congestion Evaluation Best Practices
 Congestion Evaluation Best Practices Todd Litman Victoria Transport Policy Institute Presented International Transportation and Economic Development Conference 10 April 2014 Congestion Indicators Indicator
Arterial Performance Evaluation on an Adaptive Traffic Signal Control System
 Available online at www.sciencedirect.com Procedia Social and Behavioral Sciences 16 (2011) 230 239 6 th International Symposium on Highway Capacity and Quality of Service Stockholm, Sweden June 28 July
EFFICIENCY OF TRIPLE LEFT-TURN LANES AT SIGNALIZED INTERSECTIONS
 EFFICIENCY OF TRIPLE LEFT-TURN LANES AT SIGNALIZED INTERSECTIONS Khaled Shaaban, Ph.D., P.E., PTOE (a) (a) Assistant Professor, Department of Civil Engineering, Qatar University (a) kshaaban@qu.edu.qa
Traffic Engineering and Operations for BRT in Los Angeles
 Traffic Engineering and Operations for BRT in Los Angeles NACTO BRT Running Way Workshop #2 June 29, 2010 By: Kang Hu, PE, PTOE Chun Wong, PE LADOT s s Involvement in BRT LADOT has partnered with LA Metro
INTERCHANGE RAMP TERMINALS
 CHAPTER 26 INTERCHANGE RAMP TERMINALS CONTENTS I. INTRODUCTION...26-1 Types of Interchanges...26-1 Diamond Interchanges...26-1 Partial Cloverleaf Interchanges...26-1 Influence of Interchange Type on Turning
Gap Acceptance Cycles for Modelling Roundabout Capacity and Performance
 15th Scientific and Technical Conference Transport Systems Theory and Practice Department of Transport Systems and Traffic Engineering, Faculty of Transport, Silesian University of Technology, Katowice,