Integrated Mobility Plan for Gurgaon Manesar Urban Complex
|
|
|
- Elvin Price
- 5 years ago
- Views:
Transcription
1 Department of Town and Country Planning (DTCP), Government of Haryana December 2010 Integrated Mobility Plan for Gurgaon Manesar Urban Complex Support Document
2 5 th Floor A Wing, IFCI Tower Nehru Place New Delhi
3 TABLE OF CONTENTS 1 PRIMARY DATA COLLECTED Traffic Surveys Conducted Survey Schedule Road Network Inventory Screen - line Volume Counts Cordon Volume Counts & RSI Surveys Road Side Interview Surveys Occupancy Intersection Classified Volume Counts Speed and Delay Surveys On- street Parking Surveys Off - Street Parking Surveys Pedestrian Crossing Count Surveys Pedestrian Count Along the road Pedestrian Count Across the road Household Travel Surveys DEVELOPMENT PLAN FOR GMUC LIST OF PROPOSED SPECIAL ECONOMIC ZONES IN GURGAON DISTRICT PROPOSED MAJOR EMPLOYMENT CENTERS IN GMUC POPULATION AND EMPLOYMENT PROJECTION FOR HORIZON YEARS Aggressive Scenario Moderate Scenario Realistic Scenario DEVELOPMENT OF URBAN TRANSPORT DEMAND MODEL Base Year Model Development ENVIRONMENTAL ASSESSMENT... 89
4 LIST OF TABLES Table 1.1 Traffic Survey Schedule... 3 Table 1.2 Type of Carriageway... 7 Table 1.3 Equivalency factors for Various Types of Vehicles on Urban Roads... 8 Table 1.4 Summary of Screenline Counts... 9 Table 1.5 Summaries of Cordon Counts Table 1.6 Morning Peak and Evening Peak Observed at Outer cordon Points Table 1.7 Composition of Traffic plying on Outer Cordon points (24 Hrs) Table 1.8 Sample Size for Outer Cordon Points Table 1.9 (a) Trip Frequencies by location on Outer Cordon Points Table 1.9 (b) Trip Frequencies by modes on Outer Cordon Points Table 1.10 Purpose of Journey on Outer Cordon Points Table 1.11 Average Occupancy by vehicle type on Outer Cordon Points Table 1.12 Percentages of Trips Originating and Destining between Sectors Table 1.13 Speeds along Roads in the Study area during peak hours Table 1.14 Speeds along Roads in the Study area during off-peak hours Table 1.15 PCE Values Adopted for Various Vehicle Types Table 1.16 Parking Accumulations Table 1.17 Location-wise Parking Durations of Vehicles Parked Table 1.18 Summaries of Parked Vehicles Table 1.19 Peak Parking Demand estimated at off- street parking survey locations Table 1.20 Peak Pedestrian Count along the roads Table 1.21 Peak Pedestrian crossings across the roads Table 1.22 Distribution of Household size Table 1.23 Distribution of Average Household Income Table 1.24 Average Vehicle Ownership Table 1.25 Mode Share Observed (All modes) Table 1.26 Motorised mode share Table 1.27 Average Trip Length Table 1.28 Average trip purpose Table 2.1 Proposed Land Use Distributions for GMUC (2021) Table 5.1 Projected Population and Employment under Aggressive Scenario Table 5.2 Projected Population and Employment under Moderate Scenario Table 5.3 Projected Population and Employment under Realistic Scenario Table 6.1 Study area zoning (Including Delhi zones) Table 6.2 Summary of Estimated Base Year (2008) (Delhi & Gurgaon) Peak hour Travel Demand Table 6.3 Base year peak hour travel demand in Gurgaon Table 6.4 Results of Observed OD Validation on Screen lines Table 6.5 Base Year Observed OD Validation on Outer Cordon Locations Table 6.6 Trip Characteristics: Do Nothing Table 6.7 Base Year (2008) Transport Characteristics on Major roads Table 6.8 Population and Employment Table 6.9 Calibrated Mode Choice Parameters Table 7.1 Estimated Vehicle Emission/Day in Gurgaon for 2009 (in tonnes) Table 7.2 Estimated Vehicle Emission/Day in Gurgaon for 2031 (in tonnes) under Do- minimum scenario Table 7.3 Estimated Vehicle Emission/Day in Gurgaon for 2031 (in tonnes) with IMP
5 LIST OF FIGURES Figure 1.1 Roads covered in Road Network Inventory... 6 Figure 1.2 Screen line Count Locations... 8 Figure 1.3 Cordon Count and RSI Locations Figure 1.4 Composition of Vehicles Crossing Outer Cordon Points (24 Hrs) Figure 1.5 Average Trip Frequency across Outer Cordon Point Figure 1.6 Average Occupancy by vehicle type across Outer Cordon Point Figure 1.7 Peak Hour turning movement at Lt. Atul Kataria Chowk Figure 1.8 Peak Hour turning movement at IFFCO Chowk Figure 1.9 Peak Hour turning movement at Basai Chowk Figure 1.10 Peak Hour turning movement at Fountain Chowk Figure 1.11 Peak Hour turning movement at Sheetala Mata Mandir Chowk Figure 1.12 Peak Hour turning movement at Bhagat Singh Chowk Figure 1.13 Peak Hour turning movement at Rajiv Gandhi Chowk Figure 1.14 Peak Hour turning movement at Sukhrali Chowk Figure 1.15 Peak Hour turning movement at Shankar Chowk Figure 1.16 Peak Hour turning movement at Bhaktavar Singh Chowk Figure 1.17 Peak Hour turning movement at Sikanderpur Chowk Figure 1.18 Peak Hour turning movement at NH8- Manesar Industrial Estate Road Chowk Figure 1.19 Hourly-wise Parking Accumulation Figure 1.20 Parking Duration of Vehicles Parked Figure 1.21 Average Composition of Parked Vehicles Figure 1.22 Pedestrian Crossing count locations Figure 1.23 Distribution of Household size Figure 1.24 Distribution of Monthly Household Income Figure 1.25 Mode-wise Trip Length Figure 1.26 (a) Trip length frequency distribution Figure 1.26 (b) Trip length frequency distribution by time Figure 2.1 Land Use Distribution (2021) Figure 6.1 Methodology for Travel Demand Modelling Figure 6.2 Study Area Zoning Map Figure 6.3 Base Year Study Area Road Network Figure 6.4 Transit Network in the Study Area Figure 6.5 Base Year Flow/Capacity Diagram for peak hour traffic... 85
6 Support Document of IMP: Part - 1 A-1
7 1 Primary Data Collected 1.1 Traffic Surveys Conducted In any transport planning exercise, data collection is the cornerstone and is the very foundation on which rests the super structure. The following surveys were undertaken to develop/update the traffic and transportation data for the study: 1. Road network inventory surveys 2. Screen line volume counts 3. Junction turning counts 4. Cordon count and OD surveys 5. Speed and delay surveys 6. On-street parking surveys 7. Off- street parking surveys 8. Pedestrian count along the roads 9. Pedestrian count crossing roads/ junctions 10. IPT passenger interview surveys 11. Cyclist interview surveys 12. Inter city & local Bus passenger count and OD for both boarding and alighting passengers 13. House hold interview surveys 14. Topo surveys 1.2 Survey Schedule Schedule for these surveys is presented in Table 1.1. A-2
8 Table 1.1 Traffic Survey Schedule Sl. No. Type of survey Duration Locations Date 1. Road network inventory About 210 kms within the study area 28 th May th May Speed- delay surveys Peak & off-peak hours NH 8 MG road Old Gurgaon road Sohna road Khandsa road Railway road Basai road Pataudi road Faridabad road Jharsa road Palam Vihar road Sushkant Lok road Subash Chandrabose Marg Sheetla Matha Mandir Marg Lt. Atul Katariya Mar 28 th May th May On NH8 near Hero Honda Chowk 30 th May On Khandsa road 2 nd June Screen line Volume Count 16 hrs 3. On Pataudi road 3rd June IFFCO Chowk: 4th June Rajeev Chowk: 4th June Fountain Chowk 4th June Bhagat Singh Chowk 5th June Sukrali Chowk: 5th June Lt Atul Katariya Chowk 6th June Sheetla Mata Marg Chowk: 6th June Basai Chowk 9th June Bhaktavar Singh Chowk 9th June NH8 Manesar Industrial estate Chowk 9th June Shankar Chowk 27 th June Junction turning counts 16 hrs 5. Cordon RSI+ Volume Count 24 hrs 12. Sikanderpur Chowk 30 th June On NH8 towards Delhi 10 th June On MG road 10 th June On Faridabad road 11 th June On Sohna road 11 th June On NH8 towards Rewari 16 th June On Pataudi road 12 th June 08 A-3
9 Sl. No. Type of survey Duration Locations Date 7. On Basai road 13 th June On Daulathabad road 13 th June On Najafgarh road 17 th June On Old Gurgaon road 17 th June Pedestrian Count (along the road) 12 hrs 1. Fountain Chowk 17 th June In front of Bus stand 17 th June Old Gurgaon road between Palam Vihar road and Karterpuri Marg 18 th June MG road between Faridabad road and Nathupur road 18 th June MG road between Faridabad road and IFFCO Chowk 18 th June Sheetla Mata Mandir Marg 18 th June Sethi Chowk 18 th June Vishwakarma Road 30 th June IFFCO Chowk 17 th June Fountain Chowk 17 th June Sheetla Mata Mandir Chowk 17 th June Rajiv Chowk 18 th June Sukhrali Chowk 18 th June Sethi Chowk 18 th June Near Bus stand 18 th June Pedestrian Count (across the road) 12 hrs 8. NH 8 DLF mall 18 th June Prakash Puri Chowk 23 rd June Shankar Chowk 27 th June On-street parking survey 12 hrs 9. Off-street parking survey 12 hrs 1. Railway station road 19th June New Railway road (near HUDA Shopping Complex) 19th June New Railway road (near New Colony) 19th June Fountain Chowk 19th June Around Sethi Chowk 19th June Netaji Subash Marg (near Unitech Business Centre/Cyber Park) 19th June MG road (between PVR mall and Bristol) 19th June On Vishwakarma road 2nd July Railway station 19th June Near Power Grid 19th June 08 A-4
10 Sl. No. Type of survey Duration Locations Date 3. Near Mini Secretariat 19th June Off-street of Vishwakarma road 2nd July 08 1.Jaipur road near Rajeev Chowk 24th June 08 2.Sohna road near Rajeev Chowk 24th June 08 3.IFFCO Chowk 24th June 08 4.At Bus stand 25th June 08 5.Atul Katariya Road 25th June 08 6.Sukrali Chowk 25th June 08 7.Old Gurgaon road near Kapar Shera 26th June 08 8.Near Basai Junction (2 locations) 25th June Inter city & local Bus passenger count + OD (both boarding and alighting) 12 hrs 9.Near Manesar Chowk 26th June Old Gurgaon road near Palam Vihar road 26th June IPT passenger interview survey 500 samples 21st June Cyclist interview survey 500 samples 23rd June th June th July HHI surveys 3000 samples About 10 Kms, including Junctions: 10 Nos. Road stretches : 5kms 14. Topo Surveys Bus terminal & railway station Findings of various surveys are presented below. 2nd week of August A-5

11 1.3 Road Network Inventory Objective of the Survey: Road network inventory has been aimed at developing the network database with the existing features of roadway sections covering the study area. Conduct of the Survey: For all major road sections in the study area, inventory surveys has been undertaken to create a road network database. Inventories of the following facilities were undertaken as part of the task: Road Section length Effective Road width Median width and type Quality of riding surface Adjoining Land use and available access control Intersection Facilities Availability of pedestrian Facilities Parking Facilities present along the road Traffic Control Measures Data Entry and Analysis: The road network attribute data collected from the field has been integrated with the network database. The database has been used in developing the base year network facilitating both qualitative and quantitative evaluation of the present sufficiency of road networks vis-à-vis existing standards and usage pattern. Key Outputs: Road transport Network database of the study area. The road network covered in the survey is presented in Figure 1.1. Figure 1.1 Roads covered in Road Network Inventory A-6
12 Salient features of the road network in the study area are presented below. Road Length Covered: The survey covered about 220 kms of the road length in the study area. Type of Carriageway: The share various types of road carriageways are presented in Table 1.2. Majority of roads in the study area have two lane carriageways (58%). NH8 expressway is the eight lane road passing through the study area, which constitute 10% of the total road length. Table 1.2 Type of Carriageway Type of carriageway Length (Km) % 8 Lane Lane Lane Lane Total Availability of median: Medians are available for about 45% of roads in the study area, while 55% of roads don t have median for directional segregation of traffic. Availability of Footpath: Footpath is not present on majority of roads in the study area. About 25% of roads are with walk able foot path. Foot Path Present 23% Street Light Absent 78% Present 22% Availability of street light: It is seen that street Absent 77% Light is available only on 22% of roads in Gurgaon. 1.4 Screen - line Volume Counts Objective of the Survey: These surveys were conducted at identified screen line locations for 16 hours covering morning and evening peak hours, which have been used for validation of the urban travel demand model. A screen line is identified to validate the existing traffic between Gurgaon and Manesar in the model. Hence three locations are selected on the roads connecting Gurgaon and Manesar. They area: On NH8 expressway between Gurgaon and Manesar On Khandsa road between Gurgaon and Manesar On Pataudi road between Gurgaon and Manesar A-7

13 Conduct of the Survey: Manual traffic counts have been carried out on a typical working day at all the identified locations. At each identified station, both directional counts were carried out by vehicle type. I.e. cars, jeeps, vans, buses, trucks, MAVs, LCVs, tractors, motorized two wheelers and three wheelers, and slow moving vehicles. Data Entry and Analysis: The traffic data collected from the field has been scrutinized and processed. The Passenger Car Unit (PCU) values recommended by Indian Roads Congress (IRC) for urban roads were used in the analysis. The screen line count locations are presented in Figure 1.2. Key Outputs Peak Hour Volume at the survey stations (Veh/Hr. and PCU/Hr) Traffic by Vehicle type and hourly distribution of Traffic Figure 1.2 Screen line Count Locations Vehicles counted were converted to Passenger Car Units (PCU) by adopting equivalent PCUs. The PCUs corresponding to urban roads as per IRC: is used and the PCU values adopted is given in Table 1.3. Table 1.3 Equivalency factors for Various Types of Vehicles on Urban Roads Equivalent PCU Factors for Urban Roads Vehicle Type Vehicle Composition <5% >10% Two Wheelers Passenger Cars/ Pick Up Vans Auto Rickshaw Light Commercial Vehicle Truck or Bus A-8
14 Vehicle Type Equivalent PCU Factors for Urban Roads Vehicle Composition MAV Cycle Cycle Rickshaw Cart (Source: IRC: ) The 16 hours traffic volumes (16 Hours) at screen- line locations are presented in Table 1.4. These count data was used to validate the base year transport model developed for the study area. Table 1.4 Summary of Screenline Counts No. Location Vehicles PCUs 1 On NH 8 near Hero Honda Chowk On Khandsa road between Gurgaon and Manesar On Pataudi road between Gurgaon and Manesar Cordon Volume Counts & RSI Surveys Outer Cordon: is the boundary of the study area, i.e.; the Gurgaon- Manesar Urban Complex, along which, ten locations have been selected. The directional classified volume count surveys were conducted for 24 hours across these points. RSI Surveys: The main objective of the survey is to derive the passenger and freight travel pattern by road. These surveys were aimed at analyzing the traffic movement between the study area and other parts outside. Scope of the Survey: The scope of the survey includes conducting interviews at all outer cordon and two inner cordon points for 24 hours along with the classified traffic counts. Conduct of the Survey: Interviews were carried out on a sample basis on a typical working day by stopping the vehicles with the help of police. The objective was to achieve minimum sample coverage of 10 percent spread across various categories of vehicles. Classified volume counts were carried out along with the interviews in order to facilitate adjustment for sampling, or to calculate expansion factors. The information collected includes origin and destination of trip, occupancy, trip purpose, frequency and in the case of goods vehicles their type of material transported. Data Entry and Analysis: A zone system has been developed to code the origin and destination of the trips. The collected data has been coded and processed to eliminate all illogical data and entry errors. The data has been processed and expanded to total traffic using the expansion factors for each vehicle type. The outer cordon count and RSI survey are: A-9


15 On NH8 towards Delhi On MG road On Faridabad road On Sohna road On NH8 towards Rewari On Pataudi road On Basai road On Daulathabad road On Najafgarh road On Old Gurgaon road The inner cordon points are: on MG road at IFFCO Chowk and at Rajeev Chowk on Sohna road The RSI survey locations are presented in Figure 1.3. Figure 1.3 Cordon Count and RSI Locations Key Outputs Mode-wise trip matrices Occupancy level by vehicle type Trip frequency and purpose Trip pattern A-10
16 The summary of the data collected for 24 hours is presented in Table 5 and the peak hour details is also shown in the Table 1.5. Table 1.5 Summaries of Cordon Counts Sl. No. Location Peak Hour Total Vehicles (24 Hrs) Share of Time PCU Vehicles PCU Peak Traffic (%) 1 On NH8 towards Delhi 6.30 PM- 7.30PM % 2 On MG road 7.00 PM PM % On Faridabad road 8.45am am % On Sohna road 10.00am-11.00am % On NH8 towards 6.15 PM PM % Rewari On Pataudi road AM AM % On Basai road 8.00 AM AM % On Daulathabad 6.00 PM PM % road On Najafgarh 6.45pm-7.45pm % road On Old Gurgaon 7.15 PM PM % road Total for all locations On an average, about 3, 00,000 lakhs vehicles are entering and exiting Gurgaon, including NH8 expressway. The total daily traffic accounts about 3.8 lakhs PCU. Maximum vehicles entering/exiting through NH 8 (from Delhi side), followed by Mehrauli- Gurgaon road and NH8 from Rewari side. The traffic on NH8 towards Rewari and on Sohna road are found to be more equally distributed throughout the day, hence the peak hour share is less. Composition of Traffic plying at the outer Cordon Points is presented in Table 1.7. Passenger vehicles form the major share at all locations, which varies between 67% on NH8 towards Rewari and 95% on MG road. Share of commercial/goods vehicles varies from 3% to 35%. Commercial vehicles are found high on NH8, on Old Gurgaon road, Sohna road, etc. On an average, daily about 40,000 commercial/goods vehicles are entering and exiting the study area. The morning peak and evening peak traffic observed is presented in Table 1.6. A-11
17 Table 1.6 Morning Peak and Evening Peak Observed at Outer cordon Points Location Peak Peak hour Peak value (PCU) On NH 8 towards Delhi Morning Peak Evening Peak On MG Road Morning Peak Evening Peak On Faridabad road Morning Peak Evening Peak On Sohna road Morning Peak Evening Peak On NH 8 towards Rewari On Pataudi road On Basai Road On Daulathabad Road On Najafgarh Road On Old Gurgaon Road Morning Peak Evening Peak Morning Peak Evening Peak Morning Peak Evening Peak Morning Peak Evening Peak Morning Peak Evening Peak Morning Peak Evening Peak Table 1.7 Composition of Traffic plying on Outer Cordon points (24 Hrs) Vehicles % Sl. No. 1 Location Passenger Vehicles Goods Vehicles SMVs Total Passenger Vehicles Goods Vehicles SMVs Total On NH8 towards Delhi On MG road On Faridabad road On Sohna road On NH8 towards Rewari On Pataudi road On Basai road On Daulathabad road On Najafgarh road On Old Gurgaon road Total Average composition of vehicle types crossing outer cordon points is presented in figure 1.4. Car traffic is maximum, followed by two wheelers and trucks. A-12
18 Trucks 6% LCV 4% Auto Rickshaws 2% MAV 2% Two Wheelers 24% Tractors 1% SMVS 2% Standard Bus 4% Mini Bus 1% Van 1% Car 52% Share Auto 1% Figure 1.4 Composition of Vehicles Crossing Outer Cordon Points (24 Hrs) 1.6 Road Side Interview Surveys Surveys had been conducted at ten locations on outer cordon and at two inner cordon points for 24 hours. The details of the locations had been dealt in the earlier section. Zoning System Adopted The study area and other influencing areas are broadly classified into two regions, say, area within Gurgaon- Manesar Urban Complex (GMUC) and area outside GMUA. The entire study area comprises of a total of 157 zones, out of which 1 to 145 zones are within GMUC and rest 12 zones are areas outside of GMUC. Sample Size The collected data was coded, processed and expanded to total traffic using the expansion factors for each vehicle type. Average sample size obtained for various categories of vehicles for the O-D survey across outer cordon locations are given in Table 1.8. The sample covered is adequate as per the norms of minimum 10% samples for urban areas. Table 1.8 Sample Size for Outer Cordon Points Location Truck MAV LCV Car AR TW On NH8 towards Delhi 10% 12% 12% 10% 49% 10% On MG road 11% 14% 18% 11% 25% 12% On Faridabad road 12% 29% 10% 20% 32% 13% On Sohna road 11% 17% 19% 12% 15% 18% On NH8 towards Rewari 10% 11% 11% 10% 10% 10% On Pataudi road 18% 14% 11% 11% 11% 10% On Basai road 23% 50% 11% 10% 17% 11% On Daulathabad road 13% 24% 12% 11% 28% 10% On Najafgarh road 11% 21% 13% 21% 24% 12% Old Gurgaon Road 11% 95% 28% 13% 18% 11% Average 13% 29% 15% 13% 23% 12% A-13
19 Trip Frequency The detailed trip frequency distribution is shown in the following Figure. Analysis of the trip frequency shows that the majority of trips are daily trips, which shared 62% of the total trips followed by alternate day trips and weekly trips having a frequency of 17% and 11% respectively. Table 1.9 shows the trip frequency at all locations across outer cordon points. Weekly 11% Fortnightly 4% Monthly 4% Occasionally 2% Alternate Day 17% Daily 62% Figure 1.5 Average Trip Frequency across Outer Cordon Point Table 1.9 (a) Trip Frequencies by location on Outer Cordon Points Frequency of the Trip Location Name Alternate Daily Day Weekly Fortnightly Monthly Occasionally Total On NH8 towards Delhi 70% 20% 7% 2% 1% 0% 100% On MG road 73% 17% 8% 1% 1% 0% 100% On Faridabad road 73% 15% 9% 2% 1% 0% 100% On Sohna road 44% 18% 17% 8% 6% 7% 100% On NH8 towards Rewari 42% 18% 15% 10% 5% 10% 100% On Pataudi road 68% 11% 17% 1% 2% 1% 100% On Basai road 54% 26% 13% 0% 7% 0% 100% On Daulathabad road 64% 19% 2% 3% 10% 2% 100% On Najafgarh road 67% 13% 8% 6% 5% 1% 100% Average 62% 17% 11% 4% 4% 2% 100% Mode Table 1.9 (b) Trip Frequencies by modes on Outer Cordon Points Alternate Daily Day Weekly Fortnightly Monthly Occasionally Total Truck 56% 23% 11% 7% 2% 1% 100% MAV 51% 18% 14% 10% 6% 1% 100% LCV 67% 18% 12% 2% 1% 0% 100% Car 63% 12% 10% 7% 6% 2% 100% AR 65% 13% 11% 6% 3% 2% 100% TW 81% 13% 3% 2% 1% 0% 100% A-14
20 The higher daily trips observed at locations on roads connecting Gurgaon with Delhi, as people residing in Delhi comes daily to Gurgaon for working and business purpose. When comparing the trip frequency by mode, maximum daily trips are made by two wheelers. Purpose of Journey Analysis on purpose of journey revealed that the work trips constitute more with 61% followed by business trips of 30% and others 9%. The trip purpose at all the locations across outer cordon points is shown in Table Table 1.10 Purpose of Journey on Outer Cordon Points Location Name On NH8 towards Delhi Purpose of the Trip Social & Work Business Education Tourism Others Total Recreation 63% 24% 7% 1% 5% 0% 100% On MG road 56% 41% 2% 0% 1% 0% 100% On Faridabad road 59% 27% 8% 0% 2% 4% 100% On Sohna road 67% 20% 5% 2% 4% 2% 100% On NH8 towards Rewari 59% 27% 2% 2% 8% 2% 100% On Pataudi road 66% 29% 1% 1% 3% 0% 100% On Basai road 59% 36% 1% 0% 4% 0% 100% On Daulathabad road 62% 34% 1% 0% 1% 2% 100% On Najafgarh road 63% 28% 3% 2% 2% 2% 100% Old Gurgaon Road 58% 32% 3% 2% 2% 3% 100% Average 61% 30% 3% 1% 3% 2% 100% The work trips are predominant at all the points on outer cordon locations of the total trips, which is the typical travel characteristic of urban areas. Tourism trips are observed on NH 8, since the roads leads to Jaipur. 1.7 Occupancy Analysis on occupancy of the vehicles revealed that the average occupancy of car is 2.0, which of two-wheeler is 1.3 and the average occupancy of auto is 2.8. Distribution of average occupancy based on vehicle type has been shown in the Figure 1.6. Table 1.11 shows the average occupancy at all the locations across outer cordon points. A-15
21 Average Occupancy Integrated Mobility Plan for Gurgaon- Manesar Urban Complex Car Auto TW Truck MAV LCV Vehicle Type Figure 1.6 Average Occupancy by vehicle type across Outer Cordon Point Table 1.11 Average Occupancy by vehicle type on Outer Cordon Points Location Name Average Occupancy by Vehicle Type Car Auto TW Truck MAV LCV On NH8 towards Delhi On MG road On Faridabad road On Sohna road On NH8 towards Rewari On Pataudi road On Basai road On Daulathabad road On Najafgarh road Old Gurgaon Road Average Trip Characteristics: The zones had broadly classified into two major sectors for analyzing the trip characteristics. They are; Zones within GMUC Zones 1 to 145 Outside GMUC Zones 146 to 157 The trip characteristics analysis of the outer cordon points revealed that more than 70% of commercial vehicle trips and about 50% of passenger trips are between external zones to external zones. Table 1.12 shows the percentage of trips between the sectors. It is seen that external trips (E-E category in the Table) is significant at all major corridors. These demands for ring roads connecting all major corridors outside the city to segregate through traffic bound between places outside Gurgaon from local traffic. Since a bypass is present on NH 8, development of bypasses or ring roads connecting other roads could be thought off. A-16
22 Table 1.12 Percentages of Trips Originating and Destining between Sectors Location Commercial Vehicles Passenger Vehicles E-E E-I & I-E Total E-E E-I & I-E Total On NH8 towards Delhi On MG road On Faridabad road On Sohna road On NH8 towards Rewari On Pataudi road On Basai road On Daulathabad road On Najafgarh road Old Gurgaon Road Average (E to E = Trips between External Zones to External Zones and I- E = Trips between Internal Zones & External Zones) 1.8 Intersection Classified Volume Counts Objectives: Surveys were conducted at critical intersections identified within the study area. The data help in identifying the traffic issues at the intersection, critical movements, etc. Scope of Survey: Counting of vehicles classified by the type of vehicles at the selected locations for 16 hours. The locations are: 1. IFFCO Chowk 2. Rajeev Chowk 3. Fountain Chowk 4. Bhagat Singh Chowk 5. Sukhrauli Chowk 6. Lt Atul Katarya Chowk 7. Sheetla Mata Marg Chowk 8. Basai Chowk 9. Bhaktawar Singh Chowk (Sector 39, 45) 10. NH8 Manesar Industrial estate Chowk 11. Shankar Chowk 12. Sikanderpur Chowk The locations are presented in Figure A-17
23 Conduct of the Survey: Manual traffic counts were carried out on a typical working day. Data Entry and Analysis: The traffic data collected from the field were scrutinized and processed. The Passenger Car Unit (PCU) values recommended by Indian Roads Congress (IRC) for urban roads will be used in the analysis. Key Outputs Peak Hour Volume at the intersections (Veh/Hr. and PCU/Hr) Peak hour turning movement by vehicle type A-18
24 Lt. Atul Katariya Chowk: The four arm junction on Old Gurgaon road connects Sheetla Mata Mandir Chowk, Palam Vihar road, Sukhrali Chowk and Fountain Chowk. It is an uncontrolled intersection. Facility for safe pedestrian crossing is not present, but foot path present on all arms. The peak hour traffic is observed about 11,000 PCU constituted about 8600 vehicles. Major movements occurring at this junction are straight movement on Old Gurgaon road. Peak hour turning movement is presented in Figure 1.7. Intergrated Mobility Plan for Gurgaon-Manesar Urban Complex Classified Turning Volume Count Survey Location: Atul Kataria Chowk Peak Hour Peak Hour Volume (Nos.) Date: 6/6/2008 Peak Volume in PCU From From Sheetla Matha Mandir Standard Bus Palam Vihar Standard Bus Mini Bus Mini Bus Van Van Shared Auto Shared Auto Cars Cars Two Wheeler Towards Two Wheeler Auto Rikshaw Auto Rikshaw Trucks Palam Vihar Trucks MAV MAV LCV LCV Tractors Tractors Cycles Cycles Carts Carts Cycle Rickshaw Cycle Rickshaw Total Vehicles Total Vehicles Total PCU Total PCU Towards Sheetla Matha Mandir Towards Sukhrauli Chowk From Fountain Chowk From Sukhrauli Chowk Standard Bus Standard Bus Mini Bus Mini Bus Van Van Shared Auto Shared Auto Cars Towards Cars Two Wheeler Fountain Two Wheeler Auto Rikshaw Chowk Auto Rikshaw Trucks Trucks MAV MAV LCV LCV Tractors Tractors Cycles Cycles Carts Carts Cycle Rickshaw Cycle Rickshaw Total Vehicles Total Vehicles Total PCU Total PCU Figure 1.7 Peak Hour turning movement at Lt. Atul Kataria Chowk A-19
25 IFFCO Chowk: It is a 4 legged signalized intersection between Mehrauli -Gurgaon road and NH 8. It is the main access to Gurgaon from NH 8 (Delhi side) and carries heavy traffic throughout day time, especially during peak hours. During peak hours, signal cycle time exceeds even beyond 5 minutes and vehicles need to wait for long time. Maximum hourly traffic observed at this junction is about PCU between 7.15 PM and 8.15 PM. Major turning movements occurring at this junction are between Delhi side and towards Sukrali Chowk and Sikanderpur Chowk side. Peak hour turning movement is presented in Figure 1.8. Cars and two wheelers are main component in the junction traffic. Heavy pedestrian movement is happening, both along and across the arms of the junction. Intergrated Mobility Plan for Gurgaon-Manesar Urban Complex Classified Turning Volume Count Survey Location: IFFCO Chowk Peak Hour Peak Hour Volume (Nos.) Date: 4/6/2008 Peak Volume in PCU From From Sukhrali Chowk Standard Bus Shankar Chowk Standard Bus Mini Bus Mini Bus Van Van Shared Auto Shared Auto Cars Cars Two Wheeler Two Wheeler Auto Rikshaw Auto Rikshaw Trucks Towards Shankar Chowk Trucks MAV MAV LCV LCV Tractors Tractors Cycles Cycles Carts Carts Cycle Rickshaw Cycle Rickshaw Total Vehicles Total Vehicles Total PCU Total PCU Towards Sukhrali Chowk Towards Sikanderpur Chowk From Hero Honda Chowk From Sikanderpur Chowk Standard Bus Standard Bus Mini Bus Mini Bus Van Van Shared Auto Shared Auto Cars Cars Two Wheeler Two Wheeler Auto Rikshaw Towards Hero Auto Rikshaw Trucks Honda Chowk Trucks MAV MAV LCV LCV Tractors Tractors Cycles Cycles Carts Carts Cycle Rickshaw Cycle Rickshaw Total Vehicles Total Vehicles Total PCU Total PCU Figure 1.8 Peak Hour turning movement at IFFCO Chowk A-20
26 Basai Chowk: The four arm junction connects Pataudi road, Basai road, Railway station road and Fountain Chowk. It is an uncontrolled intersection with no marking, signs and pedestrian facilities. The peak hour traffic is observed about 4,800 PCU. The movements from Basai road and Pataudi road to Fountain Chowk are found significant. Peak hour turning movement is presented in Figure 9. Intergrated Mobility Plan for Gurgaon-Manesar Urban Complex Classified Turning Volume Count Survey Location: Basai Chowk Peak Hour Peak Hour Volume (Nos.) Date: 9/6/2008 Peak Volume in PCU From From Basai Road Standard Bus Railway Road Standard Bus Mini Bus Mini Bus Van Van Shared Auto Shared Auto Cars Cars Two Wheeler Two Wheeler Auto Rikshaw Auto Rikshaw Trucks Towards Railway road Trucks MAV MAV LCV LCV Tractors Tractors Cycles Cycles Carts Carts Cycle Rickshaw Cycle Rickshaw Total Vehicles Total Vehicles Total PCU Total PCU Towards Basai Road Towards Fountain Chowk From Pataudi Road From Fountain Chowk Standard Bus Standard Bus Mini Bus Mini Bus Van Van Shared Auto Shared Auto Cars Cars Two Wheeler Two Wheeler Auto Rikshaw Towards Auto Rikshaw Trucks Pataudi Road Trucks MAV MAV LCV LCV Tractors Tractors Cycles Cycles Carts Carts Cycle Rickshaw Cycle Rickshaw Total Vehicles Total Vehicles Total PCU Total PCU Figure 1.9 Peak Hour turning movement at Basai Chowk A-21
27 Fountain Chowk: The three arm junction connects Railway Station road, Basai Chowk, and IFFCO. Bus stand, market, hospitals, Park and lot of commercial activities are concentrated around the junction, making the junction very busy with vehicular and pedestrian traffic. Another junction is also located very near to this junction. Major movement at this junction is the turning movements between IFFCO Chowk arm and Sadar Bazaar road arm. Peak hour traffic observed at this junction is about 7100 PCU, constituted from 5800 vehicles between 7.30 pm and 8.30 pm. Bus traffic is present on Sadar Bazaar road. Peak hour turning movement is presented in Figure Intergrated Mobility Plan for Gurgaon-Manesar Urban Complex Classified Turning Volume Count Survey Location: Fountain Chowk Date: 4/6/2008 From New Railway Road Standard Bus 1 - Mini Bus 1 - Van - - Shared Auto - - Cars Two Wheeler Auto Rikshaw 6 8 Trucks 3 - MAV - - LCV 2 - Tractors - - Cycles Carts - - Cycle Rickshaw Total Vehicles Total PCUs 1, Peak Hour Peak Hour Volume (Nos.) Peak Volume in PCU Towards New Railway Road Towards Bus stand From Sadar Bazar Road From IFFCO Chowk Standard Bus - 32 Standard Bus - 34 Mini Bus - 9 Mini Bus - 14 Van - 4 Van - - Shared Auto - 2 Shared Auto - - Cars Cars Two Wheeler Two Wheeler Auto Rikshaw Auto Rikshaw Trucks - 2 Trucks - - MAV - - Towards Sadar Bazar MAV - - LCV - 20 Road LCV 4 7 Tractors - - Tractors - 4 Cycles Cycles Carts - - Carts - - Cycle Rickshaw Cycle Rickshaw Total Vehicles 64 1,861 Total Vehicles 833 2,322 Total PCUs 74 2,319 Total PCUs 939 2,678 Figure 1.10 Peak Hour turning movement at Fountain Chowk A-22
28 Sheetla Mata Mandir Chowk: The three arm junction on Sheetla Matha Mandir road connects Prakash Puri Chowk, Lt. Atul Kataria Chowk and Fountain Chowk. It is an uncontrolled intersection. Since the Mandir is located close to this junction, heavy pedestrian movement is also occurring. A Foot Over Bridge is provided across Matha Mandir road near the junction. Maximum hourly traffic is observed between 7.30 pm and 8.30 pm with 4954 PCU from 4741 vehicles. Peak hour turning movement is presented in Figure Intergrated Mobility Plan for Gurgaon-Manesar Urban Complex Classified Turning Volume Count Survey Location: Date: 6/6/2008 Shetla Mata Mandir Chowk From Prakash Puri Chowk Standard Bus 3 7 Mini Bus - - Van 2 - Shared Auto Cars Two Wheeler Auto Rikshaw 7 23 Trucks 35 1 MAV 3 - LCV Tractors 4 1 Cycles Carts - - Cycle Rickshaw Total Vehicles 1, Total PCUs 1, Peak Hour Peak Hour Volume (Nos.) Peak Volume in PCU Towards Baba Prakash Puri Chowk Towards Atul Katariya Chowk From Fountain Chowk From Atul Katariya Chowk Standard Bus 12 4 Standard Bus 9 2 Mini Bus - - Mini Bus 2 - Van - 2 Van 9 - Shared Auto 17 9 Shared Auto 37 3 Cars Cars Two Wheeler Two Wheeler Auto Rikshaw Auto Rikshaw Trucks - 8 Trucks 40 - MAV - - Towards Fountain MAV 3 - LCV 7 18 Chowk LCV 72 4 Tractors 1 2 Tractors 7 4 Cycles Cycles Carts - - Carts - - Cycle Rickshaw 4 33 Cycle Rickshaw Total Vehicles Total Vehicles 1, Total PCUs Total PCUs 1, Figure 1.11 Peak Hour turning movement at Sheetala Mata Mandir Chowk A-23
29 Bhagat Singh Chowk: The three arm junction connects Palam Vihar, Railway Road and Sheetla Mata Mandir Chowk. It is an uncontrolled intersection without pedestrian crossing. The peak hour traffic is observed about 4000 PCU, from 3000 vehicles. Traffic movement along Palam Vihar road and Sheetla Matha Mandir Marg are found high. Peak hour turning movement is presented in Figure Intergrated Mobility Plan for Gurgaon-Manesar Urban Complex Classified Turning Volume Count Survey Location: Date: Baba Prakash Puri Chowk 5/6/2008 Peak Hour From Palam Vihar Standard Bus 13 1 Mini Bus - - Van Shared Auto Cars Two Wheeler Auto Rikshaw Trucks 22 7 MAV 3 3 LCV Tractors 10 5 Cycles Carts 1 1 Cycle Rickshaw Total Vehicles Total PCUs Peak Hour Volume (Nos.) Peak Volume in PCU Towards Palam Vihar Towards Sheetla Matha Mandir From Railway Road From Sheetla Matha Mandir Standard Bus 9 10 Standard Bus 8 15 Mini Bus 4 4 Mini Bus 2 2 Van 8 5 Van 1 3 Shared Auto Shared Auto Cars Cars Two Wheeler Two Wheeler Auto Rikshaw Auto Rikshaw Trucks 2 4 Trucks 1 26 MAV - - MAV 1 3 LCV 6 5 Towards Railway Road LCV 9 7 Tractors 4 5 Tractors 5 9 Cycles Cycles Carts - - Carts - - Cycle Rickshaw Cycle Rickshaw Total Vehicles Total Vehicles Total PCUs Total PCUs Figure 1.12 Peak Hour turning movement at Bhagat Singh Chowk A-24
30 Rajiv Gandhi Chowk: The four arm junction on Sohna road across NH8 expressway connects Gurgaon and Sohna. It is a manually controlled intersection with no signals. The junction caters to heavy traffic as it acts as the entry point of Gurgaon from Sohna side and a major access to the NH8 expressway. Hence both the straight and turning movements are critical. The peak hour traffic is observed about 11, 600 PCU from about 8500 vehicles between 9.00 am and am. Bus and truck movement at the junction is found high. Intergrated Mobility Plan for Gurgaon-Manesar Urban Complex Classified Turning Volume Count Survey Location: Rajiv Gandhi Chowk Peak Hour Peak Hour Volume (Nos.) Date: 4/6/2008 Peak Volume in PCU From From Hero Honda Chowk Standard Bus Nehru Stadium Standard Bus Mini Bus Mini Bus Van Van Shared Auto Shared Auto Cars Cars Two Wheeler Two Wheeler Auto Rikshaw Auto Rikshaw Trucks Towards Nehru Stadium Trucks MAV MAV LCV LCV Tractors Tractors Cycles Cycles Carts Carts Cycle Rickshaw Cycle Rickshaw Total Vehicles Total Vehicles Total PCU Total PCU Towards Hero Honda Chowk Towards Rao Tula Ram Chowk NH 8 NH 8 From Sohna From Rao Tula Ram Chowk Standard Bus Standard Bus Mini Bus Mini Bus Van Van Shared Auto Shared Auto Cars Cars Two Wheeler Two Wheeler Auto Rikshaw Towards Auto Rikshaw Trucks Sohna Trucks MAV MAV LCV LCV Tractors Tractors Cycles Cycles Carts Carts Cycle Rickshaw Cycle Rickshaw Total Vehicles Total Vehicles Total PCU Total PCU Figure 1.13 Peak Hour turning movement at Rajiv Gandhi Chowk A-25
31 Sukhrali Chowk: The four arm junction on Mehrauli- Gurgaon road connecting four major junctions such as, Lt. Atul Katariya Chowk, Fountain Chowk, IFFCO Chowk and Rao Tula Ram Chowk. It is an uncontrolled intersection with no signals and carrying heavy traffic throughout the day. The peak hour traffic is observed between 7.00 pm and 8.00 pm with about 11,400 PCU, constituted by about 9300 vehicles. At this junction all movements are found high. Peak hour traffic details are presented in Figure Intergrated Mobility Plan for Gurgaon-Manesar Urban Complex Classified Turning Volume Count Survey Location: Sukhrali Chowk Date: 5/6/2008 Peak Hour Peak Hour Volume (Nos.) Peak Hour Volume in PCU From From Fountain Chowk Lt. Atul Katariya Chowk Standard Bus Standard Bus Mini Bus Mini Bus Van Van Shared Auto Shared Auto Cars Cars Two Wheeler Two Wheeler Auto Rikshaw Auto Rikshaw Trucks Towards Lt. Atul Katariya Chowk Trucks MAV MAV LCV LCV Tractors Tractors Cycles Cycles Carts Carts Cycle Rickshaw Cycle Rickshaw Total Vehicles Total Vehicles Total PCU Total PCU Towards Fountain Chowk Towards IFFCO Chowk From Rao Tula Ram Chowk Standard Bus Standard Bus Mini Bus Mini Bus Van Van Shared Auto Shared Auto Cars Cars Two Wheeler Towards Rao Two Wheeler Auto Rikshaw Tula Ram Auto Rikshaw Trucks Chowk Trucks MAV MAV LCV LCV Tractors Tractors Cycles Cycles Carts Carts Cycle Rickshaw Cycle Rickshaw Total Vehicles Total Vehicles Total PCU Total PCU From IFFCO Chowk Figure 1.14 Peak Hour turning movement at Sukhrali Chowk A-26
32 The three arm junction connects IFFCO Chowk, Atlas Chowk and Moulsari Avenue. It is the main access to DLF city phase III from NH8 (Delhi side), hence with heavy traffic during peak hours. It is an uncontrolled intersection. Pedestrian crossing is very high at this junction, but no facilities available for safe crossing. Turning count conducted at this junction indicated that maximum hourly traffic using the junction is about 10,100 PCU occurred between 6.30 pm and 7.30 pm. Share of car in the traffic stream is found very high due to the location of IT/BPO offices in the DLF area. The turning movement from/to DLF Phase III side (Moulsari Avenue arm) is found very high. Peak hour traffic details are presented in Figure Intergrated Mobility Plan for Gurgaon-Manesar Urban Complex Classified Turning Volume Count Survey Location: Shankar Chowk Date: 27/06/08 From IFFCO Chowk Standard Bus Mini Bus 20 1 Van Shared Auto Cars Two Wheeler Auto Rikshaw Trucks 3 - MAV - - LCV 29 - Tractors 1 - Cycles 7 23 Carts - - Cycle Rickshaw 3 29 Total Vehicles 1, Total PCUs 1, Peak Hour Peak Hour Volume (Nos.) Peak hour Volume in PCU Towards IFFCO Chowk NH8 Towards Atlas Chowk NH8 From From Moulsari Avenue Atlas Chowk Standard Bus 9 29 Standard Bus Mini Bus 8 11 Mini Bus 7 - Van 23 4 Van Shared Auto 6 21 Shared Auto 63 - Cars 616 1,360 Cars 634 2,410 Two Wheeler 236 1,315 Two Wheeler Auto Rikshaw 3 36 Auto Rikshaw Trucks Trucks 1 26 MAV - - Towards Moulsari MAV 3 3 LCV - - Avenue LCV 21 - Tractors - 10 Tractors - 1 Cycles Cycles 12 3 Carts - - Carts - 25 Cycle Rickshaw Cycle Rickshaw Total Vehicles 977 2,930 Total Vehicles 1,247 2,844 Total PCUs 986 2,704 Total PCUs 1,275 2,902 Figure 1.15 Peak Hour turning movement at Shankar Chowk A-27
33 Bhaktavar Singh Chowk (Subash Chowk): It is major four arm junction on Bhaktavar Singh road in the South city areas in the sectors 39, 40, 45 and 45. The arms of this junction lead to Jharsa road, Unitech Trade Center, Bindapur side and Sohna road. The two arms of the junction are formed by Bhaktavar Singh road (towards Unitech Trade Center and Sohna road side) and major traffic movement takes place in this direction. At present, the junction traffic not as high as developments in the area are only in the initial stage. Maximum hourly traffic observed at this junction is about 5,300 PCU observed between am and am. Peak hour traffic details are presented in Figure Intergrated Mobility Plan for Gurgaon-Manesar Urban Complex Classified Turning Volume Count Survey Location: Subash Chowk Peak Hour Peak Hour Volume (Nos.) Date: 9/6/2008 Peak Volume in PCU From From Sohna side Standard Bus Jarsa side Standard Bus Mini Bus Mini Bus Van Van Shared Auto Shared Auto Cars Cars Two Wheeler Two Wheeler Auto Rikshaw Auto Rikshaw Trucks Towards Jarsa Trucks MAV MAV LCV LCV Tractors Tractors Cycles Cycles Carts Carts Cycle Rickshaw Cycle Rickshaw Total Vehicles Total Vehicles Total PCU Total PCU Towards Sohna Towards Unitech From Bindapur From Unitech Standard Bus Standard Bus Mini Bus Mini Bus Van Van Shared Auto Shared Auto Cars Cars Two Wheeler Two Wheeler Auto Rikshaw Towards Auto Rikshaw Trucks Bindapur Trucks MAV MAV LCV LCV Tractors Tractors Cycles Cycles Carts Carts Cycle Rickshaw Cycle Rickshaw Total Vehicles Total Vehicles Total PCU Total PCU Figure 1.16 Peak Hour turning movement at Bhaktavar Singh Chowk A-28
34 Sikanderpur Chowk: This is a major four- arm junction on Mehrauli road. Two arms of the junction are formed by Mehrauli road itself and other two arms by Faridabad road and Vishwakarma road (Nathupur side). The junction is made one way for certain movements. Vehicles are not allowed to enter the junction from Vishwakarma road and not permitted to exit to Mehrauli side arm. The peak hour traffic is found about 8000 PCU, from 7500 vehicles. The turning movement from Nathupur side is found very high due to the merging of two movements, i.e.; From Vishwakarma road and IFFCO Chowk side. Peak hour traffic details are presented in Figure Intergrated Mobility Plan for Gurgaon-Manesar Urban Complex Classified Turning Volume Count Survey Location: Sikanderpur Chowk Peak Hour Peak Hour Volume (Nos.) Date: 4/6/2008 Peak Volume in PCU From From IFFCO Chowk Standard Bus Nathupur Standard Bus Mini Bus Mini Bus Van Van Shared Auto Shared Auto Cars Cars Two Wheeler Two Wheeler Auto Rikshaw Auto Rikshaw Trucks Towards Nathupur Trucks MAV MAV LCV LCV Tractors Tractors Cycles Cycles Carts Carts Cycle Rickshaw Cycle Rickshaw Total Vehicles Total Vehicles Total PCU Total PCU Towards IFFCO Chowk Towards Mehrauli From Faridabad From Mehrauli Standard Bus Standard Bus Mini Bus Mini Bus Van Van Shared Auto Shared Auto Cars Cars Two Wheeler Two Wheeler Auto Rikshaw Towards Auto Rikshaw Trucks Faridabad Trucks MAV MAV LCV LCV Tractors Tractors Cycles Cycles Carts Carts Cycle Rickshaw Cycle Rickshaw Total Vehicles Total Vehicles Total PCU Total PCU Figure 1.17 Peak Hour turning movement at Sikanderpur Chowk A-29
35 NH8- Manesar Industrial Estate Road Chowk: The junction on NH8 is a three arm junction formed between NH 8 and Manesar industrial estate. The traffic on NH8 is very high. Also the truck traffic from/to the industrial estate is high, creating conflicts and delay for both through traffic and turning traffic. It is found that hourly maximum traffic moving at the junction is about 14,000 PCU constituted by about 7500 vehicles. The share of commercial vehicles in the traffic is about 25%. About 50% of the traffic is bound from/to Manesar industrial area. Peak hour traffic details are presented in Figure Intergrated Mobility Plan for Gurgaon-Manesar Urban Complex Classified Turning Volume Count Survey Location: IMT Chowk on NH 8 Date: 9/6/2008 From Delhi Standard Bus Mini Bus 21 5 Van 6 - Shared Auto Cars Two Wheeler Auto Rikshaw Trucks MAV LCV Tractors Cycles 5 2 Carts 1 - Cycle Rickshaw - 3 Total Vehicles Total PCUs 1,813 1,682 Peak Hour Peak Hour Volume (Nos.) Peak Volume in PCU Towards Delhi Towards Jaipur From From Industrial Estate Jaipur Standard Bus Standard Bus Mini Bus Mini Bus 24 - Van Van 18 9 Shared Auto Shared Auto Cars Cars Two Wheeler Two Wheeler Auto Rikshaw Auto Rikshaw Trucks Trucks MAV Towards Industrial MAV LCV Estate LCV Tractors Tractors 68 9 Cycles Cycles 5 5 Carts - - Carts - - Cycle Rickshaw 9 - Cycle Rickshaw - - Total Vehicles 1,237 1,715 Total Vehicles 2, Total PCUs 2,019 3,032 Total PCUs 4, Figure 1.18 Peak Hour turning movement at NH8- Manesar Industrial Estate Road Chowk A-30
36 1.9 Speed and Delay Surveys The survey has been conducted using moving car observer method during peak and off- peak hours. The results observed during peak hours are presented in Table Following observations could be made from the survey. Average journey speed observed on roads in the study area (excluding the expressway) is about 23 kmph, while average running speed is about 25 kmph. Minimum journey speed is recorded on Railway Station road i.e.; 14 kmph during peak hours. The delays on traffic flow are mainly due to Junction delay, un- controlled pedestrian movement, improper location of bus stops, bad road condition etc. The results corresponding to off-peak hours is Presented in Table The journey speed and running speed during off-peak hours is 27 kmph and 30 kmph respectively. Table 1.13 Speeds along Roads in the Study area during peak hours Distan Running Journey Sl. Road Name From To ce Speed Speed No. (Kms.) (KMPH) (KMPH) 1 NH 8 Atlas Chowk Rao Tula Ram Chowk Rao Tula Rajiv Gandhi Ram Chowk Chowk Rajiv Gandhi Hero Honda Chowk Chowk Hero Honda Manesar Chowk Chowk 2 3 Mehrauli- Gurgaon Road Gurgaon- Faridabad Road Fountain Chowk IFFCO Chowk The Bristol Chowk The Bristol Chowk Dela y in Min. Remarks Toll plaza IFFCO Chowk The Bristol Chowk Nathupur Road Chowk Haryana Border Junction delay at IFFCO CHOWK and Fountain Chowk and bus stops Traffic regulation due to Metro constructio n, Heavy pedestrian movement along the road Commercia l activities along the road & parking of vehicles along the road A-31
37 Sl. No. 4 Road Name From To Old Gurgaon Road 5 Basai Road 6 Sohna Road Fountain Chowk Atul Katariya Chowk Palam Vihar Road Fountain Chowk Basai Chowk Rajiv Gandhi Chowk 7 Pataudi road Basai Chowk 8 Khandsa road Sethi Chowk 9 Railway road 10 New Railway road Railway station HUDA Shopping Complex Sethi Chowk HUDA Shopping Complex Atul Katariya Chowk Palam Vihar Road Distan ce (Kms.) Running Speed (KMPH) Journey Speed (KMPH) Dela y in Min Kapar Shera Basai Chowk Gurgaon Boundary Islampur Police Station Gurgaon Boundary Up to Khandsa HUDA Shopping Complex Sethi Chowk Rajiv Gandhi Chowk Fountain Chowk Sheetla Matha Mandir Marg Remarks Markets, Junction delay and bus stops Bad road condition, Pedestrian movement along the road, junction delay and bus stops Junction delay, parking of vehicles near Fountain Chowk and bus stops Poor road condition, 2L UD carriagewa y 2L UD carriagewa y and bus stops Poor road condition, 2L UD carriagewa y Pedestrian crossing, vehicle parking near Sethi Chowk & Bad road condition Vehicle parking, pedestrian movement & commercial activities Parking of vehicles along the road Pedestrian crossing 12 Lt. Atul Katariya Road Pedestrian A-32
38 Sl. No. Road Name From To Distan ce (Kms.) Running Speed (KMPH) Journey Speed (KMPH) Dela y in Min. Remarks crossing 13 Palam Vihar road Bad road condition 14 Jharsa Road Bad road condition & junction delay 15 Ch Bhaktavar Singh Road Bad road 16 Satpaul Mittal Road condition due to 17 Vikas Marg constructio 18 Major Somnath road n activities 19 DLF Golf Course Road happening on the 20 Arya Samaj road sides of the roads. Average Speed (KMPH) excluding expressway Table 1.14 Speeds along Roads in the Study area during off-peak hours Running Journey Sl. Distance Road Name From To Speed Speed No. (Kms.) (KMPH) (KMPH) 1 NH 8 Atlas Chowk Rao Tula Ram Chowk Rao Tula Ram Rajiv Gandhi Chowk Chowk Rajiv Gandhi Hero Honda Chowk Chowk Hero Honda Chowk Manesar Chowk Mehrauli- Gurgaon Road Fountain Chowk IFFCO Chowk IFFCO Chowk The Bristol Chowk The Bristol Chowk Nathupur Road Chowk Gurgaon- Faridabad Road The Bristol Chowk Haryana Border Old Gurgaon Road Fountain Chowk Atul Katariya Chowk Atul Katariya Chowk Palam Vihar Road Palam Vihar Road Kapar Shera Basai Road Fountain Chowk Basai Chowk Sohna Road Basai Chowk Rajiv Gandhi Chowk Gurgaon Boundary Islampur Police Station A-33
39 Sl. No. Road Name From To 7 Pataudi road Basai Chowk Gurgaon Boundary Distance (Kms.) Running Speed (KMPH) Journey Speed (KMPH) Khandsa road Sethi Chowk Up to Khandsa Railway road Rly station 10 New Railway road HUDA Shopping Complex Sethi Chowk HUDA Shopping Complex HUDA Shopping Complex Sethi Chowk Rajiv Gandhi Chowk Fountain Chowk Sheetla Matha Mandir Marg Lt. Atul Katariya Road Palam Vihar road Jharsa Road Ch Bhaktavar Singh Road Satpaul Mittal Road Vikas Marg Major Somnath road DLF Golf Course Road Arya Samaj road Average Speed (KMPH) excluding expressway On- street Parking Surveys Parking survey was conducted for a period of 12 hrs continuously at nine identified locations/stretches. Survey data were analysed and the findings such as accumulation of vehicles and duration of parking were worked out. The Parking Car Equivalents (PCE) adopted for different vehicle types for the analysis are given in Table Table 1.15 PCE Values Adopted for Various Vehicle Types Sl. No. Vehicle Category PCE 1 Car Two Wheelers Bus Trucks LCV Auto Rickshaws (IPT) 0.5 A-34
40 PCE Integrated Mobility Plan for Gurgaon- Manesar Urban Complex Sl. No. Vehicle Category PCE 7 Cycle 0.1 (Source: Parking Requirement Study for Chennai Metropolitan Area, 2003) The terms used are explained below. Parking Accumulation: Number of vehicles parked in an area at any specific moment constitutes the parking accumulation. Hourly Variation: The data analysis indicates that the parking demand exists uniformly through out the day with slightly higher demand during the evening period from to The demand for parking begins at around and lasted till hours. Figure 1.19 shows the hourly parking accumulation at all the locations Time Figure 1.19 Hourly-wise Parking Accumulation The important parking characteristic of each location is presented in Table 1.16 All these road stretches have significant parking alongside, reducing road capacity by utilizing the road space. It is seen that parking is severe on MG road, near Cyber Park and Vishwakarma road. Table 1.16 Parking Accumulations No. Location Peak PCE 1 Cyber Park near HUDA Shopping Complex 30 3 Fountain Chowk 54 4 Sethi Chowk 86 5 Railway Station road 25 6 Vishwakarma Road 80 7 New Railway road (near New Colony) 26 8 MG road 181 Parking Duration: Detailed analysis of the data has indicated that there is no significant variation in terms of duration of parking at all locations except at Cyber Park, MG road and Vishwakarma road. Cyber Park area comprises mainly offices, where long term parking is high. On MG road and on Vishwakarma road, long term parkers are more due to the mixed land use of offices and commercial. Other locations, short term parkers are high due to commercial land use. Figure shows the duration of vehicles parked at all the survey locations. A-35
41 Cyber Park near HUDA Shopping Complex Foutain Chowk Sethi Chowk Railway Station road Vishwakarma Road New Railway road (near New Colony) MG road Integrated Mobility Plan for Gurgaon- Manesar Urban Complex 100% 80% % 60% 40% 20% 0% Location Upto 0.5 Hour Hours 1-2 Hours 2-3 Hours > 3 Hours Figure 1.20 Parking Duration of Vehicles Parked More than 80% of the vehicles are parked less than one hour. Short term parkers are more at commercial areas. The percentage of parking duration at different locations is shown in Table Cyber Park Table 1.17 Location-wise Parking Durations of Vehicles Parked near HUDA Shopping Complex Fountain Chowk Sethi Chowk Railway Station road Vishwakarma Road New Railway road (near New Colony) MG road Upto 0.5 Hour 30% 77% 82% 84% 69% 55% 85% 63% Hours 10% 11% 16% 14% 18% 14% 8% 11% 1-2 Hours 4% 7% 2% 2% 4% 4% 4% 6% 2-3 Hours 1% 2% 0% 0% 4% 5% 2% 4% > 3 Hours 55% 3% 0% 0% 5% 22% 1% 16% Total number of parked vehicles during the count period is presented in Table About 11,000 vehicles are observed parked on various locations in Gurgaon. LCV parking is observed on Railway station road. Maximum parking is observed on MG road, accounts about 3600 vehicles in a day. Table 1.18 Summaries of Parked Vehicles No. Location Auto Car TW Bus LCV Total 1 Cyber Park near HUDA Shopping Complex Fountain Chowk Sethi Chowk Railway Station road Vishwakarma Road New Railway road (near New Colony) MG road Total A-36
42 Composition of Parked Vehicles: The average composition of vehicles parked at all the locations is shown in Figure Cars shared the majority of the total vehicles parked, which shared 53% of the total vehicles. Two wheelers and auto rickshaw shared 25% and 23% respectively, buses and trucks shared a negligible share of the total vehicles parked. TW 24.47% Bus 0.04% LCV 0.08% Auto 22.73% Car 52.68% Figure 1.21 Average Composition of Parked Vehicles 1.11 Off - Street Parking Surveys Peak parking demand estimated at the off-street parking survey locations are presented in Table It is observed from the 12 hour count that the demand is almost equally distributed throughout day time. Table 1.19 Peak Parking Demand estimated at off- street parking survey locations Auto Sl. No. Location Car TW Cycles Van Bus Total PCE Rickshaw 1 Railway station Near Power Grid Near Mini Secretariat Off-street of Vishwakarma road Pedestrian Crossing Count Surveys Objective of the Survey: The objective of the survey is to identify locations for safe pedestrian crossing. The survey locations are as follows: 1. IFFCO Chowk 2. Fountain Chowk 3. Sheetla Mata Mandir Chowk 4. Rajiv Chowk A-37

43 5. Sukhrali Chowk 6. Sethi Chowk 7. Near Bus stand 8. MG road near Sahara Mall 9. Prakash Puri Chowk 10. Shankar Chowk 11. Vishwakarma Chowk The locations are presented in Figure Output: Peak hour pedestrian crossing at all locations. Figure 1.22 Pedestrian Crossing count locations 1.13 Pedestrian Count Along the road Pedestrian count along the road has been carried out at 9 locations in the study area. Summary of the count details are presented in Table Bus stand road, Sardar Bazaar road, Vishwakarma road and MG road are the locations with high pedestrian movement. The survey has been carried out on a working day; the numbers will be much higher on weekends, especially on MG road and Vishwakarma road. A-38
44 Table 1.20 Peak Pedestrian Count along the roads Sl. No. Location Peak Hour Peak Volume 1 Sardar Bazaar Road (near Fountain Chowk) In front of Gurgaon Bus stand Old Gurgaon Road MG Road (B/w Faridabad road and Nathapur Road) MG Road (B/w Faridabad & IFFCO Chowk) Mata Mandir Road Sohna Road ( near Sethi Chowk Vishwakarma Road Khandsa Road Pedestrian Count Across the road Peak hour pedestrian crossing (both directions) at the selected eleven locations is presented in Table IFFCO Chowk, Rajeev Chowk, Sethi Chowk and road in front of bus stand are the locations with high pedestrian crossing across the road. Table 1.21 Peak Pedestrian crossings across the roads Sl. No Location Name Peak Hour Peak Hour Count (Both directions) 1 IFFCO Chowk Fountain Chowk Sheetla Mata Mandir Chowk Rajiv Chowk Sukhrali Chowk Sethi Chowk Near Bus stand Vishwakarma road Prakash Puri Chowk Shankar Chowk MG road Household Travel Surveys Objective of the Survey: The house hold survey provides data for describing the travel patterns in the study area and travel preferences of its residents. This provides data to support the core parts of the travel demand forecasting model. The scope of the surveys includes: A-39
45 To cover a sample size 3000 households in the study area Collection of data on socio-economic characteristics, household members and their travel diary. Conduct of the Survey: The survey questionnaire comprises of three sections, a) Socioeconomic datasheet, b) Household member characteristic datasheet, and c) the travel diary of each individual member of the household. The travel diary section requests information for all trips made by each person in the household for the previous day. This information includes the time of the trip, the trip purpose, the address of the trip starting, ending place and the mode of travel. While the interviewers have been trained in the details of how to collect the survey data, the forms are designed to be self-explanatory and to minimize the chances of miscoding or omitting data. Sampling Technique: Samples were collected from the designated traffic analysis zones in the study area using stratified random sampling technique. The samples cover all types of income groups including LIGs. The survey covered all the wards of municipal council of Gurgaon and all other villages/ areas located in the Gurgaon- Manesar Urban complex. The samples covered from each ward/zone have been presented in the Annexure in the Inception report. Data Analysis: The household travel survey sample data thus collected were expanded to represent the entire population. Corrections for non-response has been developed based on the data on the number of contacts needed to generate a household response. The household survey has been used to estimate mode splits and mode choice model parameters. The trip diary information provides descriptive information about current mode choices. Combined with network information about available mode options, this information can also be used as revealed preference data to estimate parameters of a mode choice model. Various findings are as follows. Household Size: The distribution of household size is presented in Table 1.22 and in Figure The average household size observed is Table 1.22 Distribution of Household size Household Size Percentage >5 13 A-40
46 < to to to to to >35000 Household (%) House hold (%) Integrated Mobility Plan for Gurgaon- Manesar Urban Complex 30% 25% 20% 15% 10% 5% 0% >5 Household Size Figure 1.23 Distribution of Household size Household Income: The distribution of monthly household income is presented in Table 1.23 and in Figure The average monthly household income is observed as Rs. 11,000/. Table 1.23 Distribution of Average Household Income Household Income /Month (Rs.) Percentage < % 2000 to % 5000 to % to % to % to % > % 45% 40% 35% 30% 25% 20% 15% 10% 5% 0% Household Income Figure 1.24 Distribution of Monthly Household Income A-41
47 Vehicle Ownership: Average vehicle ownership is presented in Table Table 1.24 Average Vehicle Ownership Vehicle Type Ownership Car 0.24 TW 0.41 Cycle 0.15 Total 0.81 Total Mode Share: Mode share including NMT is shown in Table Table 1.25 Mode Share Observed (All modes) Mode Mode share (Percentage) Walk 23 Pedal cycle 8 Cycle Rickshaw 2 Scooter/MC 30 Car/van/jeep 21 Auto 9 STU/Private bus 7 Motorised Mode Share (%) is presented in Table Table 1.26 Motorised mode share Mode Mode share (%) Scooter/MC 45 Car/van/jeep 31 Auto 13 STU/Private bus 11 Average Trip Length: Average trip length for all modes is observed from HHI is 7.1 Kms. Table 1.27 Average Trip Length Mode Trip length (Kms) Walk 2 Pedal cycle 3 Cycle Rickshaw 3 Scooter/MC 9 Car/van/jeep 10 Auto 7 Taxi 6 STU/Private bus 16 A-42
48 Trips (Nos) Above 30 Trips (Nos) Walk Pedal cycle Cycle Rickshaw Scooter/MC Car/van/jeep Auto Taxi STU/Privatebus Average Trip length (km) Integrated Mobility Plan for Gurgaon- Manesar Urban Complex Mode Of Travel Figure 1.25 Mode-wise Trip Length Trip Length Frequency Distribution: Trip length frequency distribution is presented in Figure Trip length frequency distribution Trip length (km) Figure 1.26 (a) Trip length frequency distribution TLFD by time Time (in Minutes) Figure 1.26 (b) Trip length frequency distribution by time A-43
49 Purpose of Trip: Average trip purpose observed is as given in Table Table 1.28 Average trip purpose Purpose Of Trip Percentage Work 63 Education 8 Business 12 Social / Recreation 9 Personal & others 8 A-44
50 Support Document of IMP: Part- 2 A-45
 Land Use Category Area (excluding Distribution New Towns) Ha % Residential 14,930 40.33 Commercial 1,404 3.")
51 2. Development Plan for GMUC The distribution of proposed land use is illustrated Table 2.1 & Figure 2.1. Table 2.1 Proposed Land Use Distributions for GMUC (2021) Land Use Category Area (excluding Distribution New Towns) Ha % Residential 14, Commercial 1, Industrial 5, Traffic and Communication 4, Public Utilities Public and Semi Public Use( 1, Open spaces 2, Special Zone Defense Land SEZ 4, Existing Town Village Abadies Total 37, Source: Development Plan for GMUC (2021) Figure 2.1 Land Use Distribution (2021) Residential: In order to cater the estimated population of 43 Lakh, an area of 14,930 hectares has been reserved for residential purpose. The Haryana Urban Development Authority and A-46
52 licensed colonizers have already developed residential area of 8,000 hectors in various residential sectors. The aforesaid residential areas developed in public and private sector can accommodate a population of 20 Lakh. The existing town and village s abadies falling within the urbansable area also accommodate a population of 2 Lakh. The additional residential area proposed in the development plan would cater to the balance residential demand of the 20 lakhs. The residential areas proposed in the Development Plan is being developed on neighborhood concept by making provision of all communities facilities and services within the sectors on a planned average net residential density of 200 persons per hectare. Commercial: The area reserved for the commercial activity is around 1,404 hectors in the development plan. Out of which Haryana Urban Development Authority has developed 480 hectors of land. The new commercial areas propose in the Development Plan shall be developed in the form of big commercial malls and corporate commercial complexes. In addition, the commercial belts with a width of 200 meters have also been provided along selected roads. Industrial: The demand for developed industrial plots/ land in Gurgaon-Manesar Urban Complex is increasing day by day. In order to cope with the demand of software industries, Auto mobile industries and other pollution free high tech industries; an area of 5,441 hector has been reserved for industrial use. The Haryana State Industrial Development Corporation and Haryana Urban Development Authority have already developed an area of 1,246 hectares in the said complex. The new industrial areas have been proposed along express highway adjacent to IMT Manesar. Transport and Communication: The new road links between Delhi Metropolitan City and said Complex have been proposed as mentioned bellow 90 meter wide road link between Vasanth Kunj in Delhi to Mehrauli road in Gurgaon. 90 meter wide road link from Andheria Mor in Delhi to Gurgaon Faridabad road in Gurgaon through Mandi and Gwal Pahari. 150 meter wide road link between Dwraka residential complex of Delhi to Palam Vihar of Gurgaon. 150m wide northern peripheral road 90m wide southern peripheral road. Extension of DMRC metro lines (1) Sushant Lok Phase I and (2) Dwaraka line to Manesar and upto the KMP corridor. In the new urbanisable area, the width of the roads, have been proposed as 75 meters and 60 meters. Haryana Urban Development Authority has already developed an Auto Market in sector A-47
53 10 in an area of 16 hectares. A Transport Nagar has also been developed by HUDA, in an area of 28 hectors in Sector 33. A Transport Nagar and container depot have been proposed adjoining the Delhi Rewari Railway Line. A Mass Rapid Transit System Corridor along the 150 m wide northern link to Delhi extending from Dwaraka in Delhi has been proposed in the Final Development plan 2021, extending up to inter State Bus Terminal Proposed near village Kherki Daula. The area shown under inter State Bus Terminal is approximately 400 acres, which can be very appropriately used for inter State Bus Terminal cum Mass Rapid Transit System Depot. Another MRTS Corridor has been proposed along Mehrauli Road, 60 meters road of sector 28 29, the same is proposed to be extended upto the 90 meters link road (proposed to Delhi via, Gwal Pahari), and then further along the side 90 meters road upto the Inter State Bus Terminal, thereby completing the MRTS Loop and then extending then onwards to Manesar. Public Utilities: An area of approximately 564 hectares has been proposed for public utilities in sectors 100, 101 and 107 to meet out the future need of the proposed population. Public and Semi-Public: In order to cater the institutional demand of 43 Lakh population, an area of 1,630 hectares has been proposed for public and semi public uses out of which an area of 135 hectares have already been developed by HUDA. Open Space: A 900 meter wide strip of land around the ammunition Depot has to be kept free from urbanization under the provision of the works of Defense Act, 1903 (Act 7 of 1903). Provision of green belts along Delhi-Jaipur Highway, Railway line and Badshahppur Nallah has also been made o meet any eventually of their possible widening in future. Large open spaces have been proposed near village Basai, Dhanwapur, Medawas and following greens in other residential areas. Special Zone: Special Zone shall include recreation and entertainment, Commercial, Group Housing and Institutional uses. Agricultural Zone: A sizeable area has been reserved as agricultural zone. This zone however will not eliminate the essential building development within this area such as the extension of existing villages, contiguous to Abadi Del, if undertaken under a project approved or sponsored by government and other ancillary and allied facilities necessary for the maintenance and improvement of the area as an agricultural area. A-48
54 Support Document of IMP: Part - 3 A-49
55 3. List of Proposed Special Economic Zones in Gurgaon District List of Special Economic Zones notified after coming into force of the SEZ Act as on 11th August 2008 S.No. 1 Name of the Developer Uppal Developer Private Limited Location State Type Gurgaon, Haryana HR Multi servcies Area (hectares) DLF Limited Gurgaon, Haryana HR IT/ITES M/s DLF Cyber City Developers Ltd. M/s. Orient Craft Infrastructure Ltd. Dr. Fresh health Pvt.Ltd Selecto systems pvt. Ltd Luxor Cyber City Pvt. Ltd. Gurgaon, Haryana HR IT/ITES Gurgaon, Haryana HR Textiles Gurgoan Haryana HR IT / ITES Main Mathura Road Faridabad Haryana HR IT / ITES 3.34 Gurgaon, Haryana HR IT/ITES Parsvnath SEZ Limited Gurgaon, Haryana HR IT/ITES Suncity Haryana SEZ Developers Pvt. Ltd. Metro Valley Business Park Private Limited Reliance Haryana SEZ Limited GHI Finlease and Investment Ltd. 13 Gurgaon Infospace Ltd Canton Buildwell Pvt. Ltd. Unitech Realty Projects Ltd. Raheja Haryana SEZ Developers Pvt. Ltd. Ascendant Estates Private Limited Ansal SEZ Projects Limited Ansal Kamdhenu Engineering SEZ Limited Perpetual Infracon Private Limited Jhund Sarai and Bhangrola villages, Gurgaon, Haryana Gurgaon-Faridabad Road, Opp. Ansals Valley View Apartments, Gurgaon, Haryana Villages Mohammadpur Jharsa, Narishpur, Garouli Khurd and Harsau, Haryana Village Bhondsi, Tehsil-Sohna, Gurgaon, Haryana Village Dundahera, District Gurgaon, Haryana Village Gwal Pahari, Tehsil Sohna, District-Gurgaon, Haryana Village Tikri, Tehsil and District Gurgaon, Haryana Villages Hamirpur, Khetawas, Wazirpur, Saidpur, District, Gurgaon, Haryana Bondsi, Tehsil, Sohna, District Gurgaon, Haryana Badshapur Village (District Gurgaon), Gurgaon-Sohna Road, Haryana Village Bhagan, Tehsilganaur(Sonepat) and Village Kurar Ibrahimpur, Tehsil- Sonepat on National Highway, Haryana Sector-81, Villages Budena & Faridabad, District Faridabad, Haryana HR IT HR IT HR Multi Services HR IT/ITES HR IT/ITES HR IT/ITES HR IT/ITES HR Engineering Notification number and Date 680(E) dt. 31st Aug' (E) dt. 6th Dec.'06 580(E) dt. 13th April'07 578(E) dt. 13th April'07 593(E) dt. 13th April'07 589(E) dt. 13th April'07 680(E) dt. 13th April'07 dt. 23rd August, 07 dt. 18th October, 07 Dt. 6th November 2007 Dt.14th November 07 Dt.3rd December 07 Dt. 3rd December 07 Dt.17th December, 07 Dt.9th January, 2008 Dt.10th March, 08 HR IT/ITES nd May, 2008 HR IT/ITES Dt. 15th May, 2008 HR Enginering Dt.7th July 08 HR IT/ITES Dt.14th July 08 A-50
56 Support Document of IMP: Part - 4 A-51
57 4. Proposed major employment centers in GMUC IMT Manesar: Industrial Modal Township Manesar has developed by Haryana State Industrial Infrastructure Development Corporation (HSIIDC). HSIIDC divided industrial area into seven sectors in which first sector is belongs to residential development, second sector belongs to commercial and rest of other sectors belongs to industrial development. In the CMP report the industrial area is divided into five zones starts from 121 to 125. The estimated present and future employment is shown as bellow. Zones Population Employment Population Employment Population Employment ,164 16,648 2,662 19,978 3,031 24, ,875 17,790 2,034 21,348 2,151 26, ,283 45,414 2,924 54,497 3,397 67, ,160 35,515 2,654 42,618 3,019 52, ,756 2,000 3,954 3,900 4,839 4,836 Rheja Engineering SEZ : The project is spread over 268 acres approx. (104 hectares) at most premium location in Gurgaon adjoining Manesar & very near to International Airport abetting Freight Corridor and KMP Global Corridor which is strategic location close to the capital of India. The estimated employment is illustrated below. Zones Population Employment Population Employment Population Employment ,531 25, ,280 29, ,147 DLF Cyber SEZ: The modern and well planned work spaces of Buildings lend a distinctive appeal to this aesthetically designed architectural wonder. Spread over 26 million Sq. ft approx sellable area, the building has four interconnected blocks, each block offering an intelligent IT/ITES SEZ workplace to new age professionals. Benchmarked to global standards, the smartly designed work spaces will be instrumental in transforming your work life to a considerable extent. The time schedule to complete the DLF Cyber SEZ will be around 2011 and the estimated employment as follows. Zones Population Employment Population Employment Population Employment Aggressive ,670 80,000 11, ,000 16, , ,714 50,000 8,485 72,500 11,879 89, ,825 82,000 4, ,900 5, , ,534 48,433 2,787 70,228 3,902 87,083 A-52
58 Zones Population Employment Population Employment Population Employment Moderate 25 2,670 40,000 11,672 58,000 16,674 71, ,714 25,000 8,485 36,250 11,879 44, ,825 41,000 4,208 59,450 5,891 73, ,534 24,217 2,787 35,114 3,902 43,542 IREO SEZ: The land is identified for ORION SEZ towards Faridabad Road with the extension of area around 300 acres. It is purely IT/ ITES type of SEZ. The total estimated employment is around 15,000 by This SEZ is considered in external zone towards south. The expected population and employment projected under the two scenarios is presented below. SEZ Population Employment Population Employment Population Employment Aggressive Scenario Reliance H SEZ* 19,778 88, ,636 2,011, ,515 2,313,671 DLF SEZ 121, , , , , ,000 Raheja Haryana SEZ 30,351 15,000 45,527 50,000 60,703 57,500 Uppal SEZ 1, ,454 2,694 3,271 3,098 Emmar MGF 81,299 40, , , , ,020 IREO SEZ** 21, ,399 24, ,609 Total 256, , ,322 3,101, ,801 3,566,929 Moderate Scenario Reliance H SEZ* 19,778 88, , , ,515 1,146,703 DLF SEZ 121, , , , , ,500 Raheja Haryana SEZ 30,351 7,500 45,527 25,000 60,703 28,750 Uppal SEZ 1, ,454 1,347 3,271 1,549 Emmar MGF 81,299 20, ,949 66, ,599 77,010 IREO SEZ** 10, ,700 12, ,804 Total 254, , ,488 1,541, ,335 1,772,316 Realistic Scenario Reliance H SEZ* , ,292 DLF SEZ , ,000 Raheja Haryana SEZ ,211 7,902 Uppal SEZ Emmar MGF ,780 20,090 IREO SEZ** , ,292 A-53
59 SEZ Population Employment Population Employment Population Employment Total , ,000 Source: Analysis Note: * First phase development till 2011 population and employment is included in zone no 116 Note: ** Population and Employment is considered in external Zone. A-54
60 Support Document of IMP: Part - 5 A-55
61 5. Population and Employment Projection for Horizon Years Various assumptions taken in the projection of population and employment is also presented below. 5.1 Aggressive Scenario In this scenario, the ultimate population is considered as projected in the Development Plan by the Town and Country Planning Department and estimated population in 2021 is around 43 Lakh. The population projection for 2031 is estimated based on the growth rate adopted by the National Capital Region Report during 2011 to The projected population for GMUC is presented in Table 5.1. While there is no estimations for employment in the Development Plan 2021, however, as per the Development Plan 2021 the total area will be developed under industrial and special economic zones is 10,011 hectors in GMUC. HUDA has already developed 1,246 hectors of industrial area and DLF SEZ with private participation. It is estimated that around 13 Lakh employment will be generated within GMUC by Year Table 5.1 Projected Population and Employment under Aggressive Scenario Projected Population in GMUC Projected Employment in GMUC Projected population SEZs Adjacent to GMUC Nos. Projected Employment SEZs Adjacent to GMUC Total Population Total Employment 2001* 416, ** 1,664, ,521 1,664, , ** 2,637,932 1,207, , ,987 2,872,624 1,472, *** 4,333,175 1,898, ,301 3,099,911 4,934,476 4,998, ** 5,836,991 2,353, ,770 3,564,898 6,634,760 5,918,643 Note: *- census, **-Analysis, ***-Department of Town and Country Planning Projections Source: Development plan 2021 & Analysis Assumption for Population Projection: (i) Base year population (2008) is calculated based on the domestic electric connections (Source from Haryana Electricity Department, in GMUC area) multiplied with the average household size arrived by primary surveys. (ii) As projected by DTCP, 43 Lakh considered for 2021; (iii) 100 Percent of investments will be advent during 2008 to 2021; (iv) Pace of developments will be getting reduced and Infrastructure saturation will be reaching by 2021, so population growth will come down for subsequent decade; A-56
62 (v) A lower growth rate assumed for population growth for the period of 2021 to 2031 is 35 percent as per NCR Report projected during 2011 to Assumption for Employment Projection: (vi) Present Employment estimated based on the primary and secondary data collation; (vii) Commercial and industrial employment is estimated based on the Development Plan for future; (viii) Surrounding upcoming SEZs are considered with phase wise development with regards to population and employment; (ix) The major developments are envisaged during 2001 and 2021 and as a result, the employment growth rate is expected to be proportionally high during this period; (x) 15 Percent of SEZs area will be allocated for residential and for residential area 200 persons per hectors is adopted; (xi) 50 percent of employees will be residing at GMUC and working at outside SEZs; (xii) Workforce participation ratio is assumed around 45 during 2011 to 21 and it will slow down to 40 percent during 2021 to Moderate Scenario As per the estimations of water supply through Western Yamuna Canal, groundwater availability and water recycling opportunities, the future population is estimated around 37 lakhs in GMUC. The additional population will be expected from industrial developments in Gurgaon Manesar Urban Complex and upcoming surrounding SEZs like Reliance, Raheja, Uppal, IREO and DLF etc. The population projections for 2031 are estimated based on the growth rate adopted by the National Capital Region Report during 2011 to The projected population for GMUC under this scenario is presented in Table 5.2. While there is no estimations for employment in the Development Plan 2021, however, as per the Development Plan 2021 the total area will be developed under industrial and special economic zones is around 10,011 hectors in GMUC. HUDA has already developed 1,246 hectors of industrial area and DLF SEZ with private participation. It is estimated around 11 Lakh employment will be generated within GMUC by A-57
63 Year Table 5.2 Projected Population and Employment under Moderate Scenario Projected Population in GMUC 2001* 416,681 Projected Employment in GMUC Projected population SEZs Adjacent to GMUC Nos. Projected Employment SEZs Adjacent to GMUC Total Population Total Employment 2008** 1,664, ,521 1,664, , ** 2,285,932 1,076, , ,994 2,520,624 1,209, *** 3,701,175 1,709, ,488 1,541,145 4,291,663 3,250, ** 5,001,991 2,119, ,335 1,772,316 5,787,325 3,891,932 Note: *- census, **-Analysis, ***-Department of Town and Country Planning Projections Source: Development plan 2021 & Analysis Assumption for Population Projection: (xiii) Base year population (2008) is calculated based on the domestic electric connections (Source from Haryana Electricity Department, in GMUC area) multiplied with the average household size arrived by primary surveys. (xiv) As projected by Water Supply Department, 37 Lakh considered for 2021; (xv) 70 Percent of investments will be advent during 2008 to 2021 (in GMUC and surrounding area) ; (xvi) Pace of developments and Infrastructure saturation will be reaching by 2031; (xvii) Population growth rate is assumed for the period of 2021 to 2031 is 35 percent as per NCR Report projected during 2011 to Assumption for Employment Projection: (xviii) Present Employment estimated based on the primary and secondary data collation; (xix) (xx) (xxi) (xxii) Commercial and industrial employment is estimated based on the Development Plan for future; 50 percent of surrounding upcoming SEZs are considered with phase wise development with regards to population and employment; 90 percent of development with regards to population and employment within GMUC 15 Percent of SEZs area will be allocated for residential and for residential area 200 persons per hectors is adopted. (xxiii) 50 percent of employees will be residing at GMUC and working at outside SEZs (xxiv) Workforce participation ratio is assumed around 45 during 2011 to 21 and it will slow down to 42 percent during 2021 to A-58
64 5.3 Realistic Scenario Given the prevalent economic meltdown it is assumed that the very ambitious plans of the private sector are limited to the master plan the present approved plans and only a population of 37 lakhs by the year 2031 is planned. It is assumed that that roughly 15% of the SEZs will happen and may gradually pick pace beyond The planned developments coming within the purview of the Development plan have been considered for establishing the future growth rate. The projected population and employment is presented in Table 5.3. Year Table 5.3 Projected Population and Employment under Realistic Scenario Projected Population in GMUC Projected Employment in GMUC Projected population SEZs Adjacent to GMUC Projected Employment SEZs Adjacent to GMUC Nos. Total Population Total Employment 2001* ** ** *** ** 4,080,621 1,401, , ,688 4,312,490 1,849,673 Note: *- census, **-Analysis, ***-Department of Town and Country Planning Projections Source: Development plan 2021 & Analysis Assumption for Population Projection: Base year population (2008) is calculated based on the domestic electric connections (Source from Haryana Electricity Department, in GMUC area) multiplied with the average household size arrived by primary surveys. As projected by Water Supply Department, 37 lakh considered for 2031 for area within GMUC; 15 Percent of investments will be advent during 2021 to 2031 (in GMUC and surrounding area) ; Pace of developments and Infrastructure saturation will pick up pace beyond 2031 Assumption for Employment Projection: Present Employment estimated based on the primary and secondary data collation; Commercial and industrial employment is estimated based on the Development Plan for future; 15 percent of surrounding upcoming SEZs are considered with phase wise development with regards to population and employment; 50 percent of development with regards to population and employment within GMUC A-59
65 15 Percent of SEZs area will be allocated for residential and for residential area 200 persons per hectors is adopted. Zone-wise Projections under Aggressive Scenario Zones Population Employment Population Employment Population Employment Population Employment ,197 1,468 24,028 1,762 26,084 2,114 33,075 2, ,633 1,907 21,369 2,288 22,704 2,746 31,786 3, ,464 1,398 29,129 1,678 31,261 2,014 43,198 2, ,858 2,116 24,033 2,539 25,122 3,047 32,088 3, , ,015 1,076 20,208 1,291 23,143 1, , , , , ,182 2,390 45,054 2,868 49,728 3,442 59,449 4, ,677 2,089 21,100 2,507 23,525 3,008 23,950 3, ,812 3,046 79,090 3,655 83,585 4, ,509 5, ,896 1,320 76,833 1,584 80,086 1, ,908 2, ,594 4,954 56,069 5,945 68,759 7,134 99,107 8, ,942 8,074 45,208 9,689 49,715 11,627 58,728 14, ,654 11,276 12,572 13,531 13,543 16,237 14,514 20, ,760 1,972 28,607 2,366 29,172 2,839 29,737 3, ,876 2,955 49,595 3,546 53,529 4,255 67,776 5, , , , , , , ,694 1,122 17,281 1, ,520 18,100 35,238 31,720 36,586 38,064 39,730 47, ,915 2,770 13,453 9,324 15,471 11,189 16,798 13, ,457 3,444 22,761 11,133 24,278 13,360 26,772 16, , ,307 1,105 28,844 1,326 36,055 1, ,697 1,993 24,478 2,392 30,373 2,870 39,019 3, ,264 3,450 59,393 4, ,477 4, ,267 6, ,807 29,749 97,127 5, ,305 8, ,812 10, ,471 6,670 80,000 11, ,000 16, , ,763 26,982 14,345 4,785 31,272 6,939 43,781 8, ,997 32,066 55,867 7, ,015 11,207 97,518 13, ,998 43,442 20,367 12,827 44,401 18,600 62,161 23, , ,826 1,579 3,339 11,895 3,750 14, ,208 8,303 10,790 9,964 23,523 11,957 32,932 14, ,578 1,817 19,531 2,180 42,577 2,616 59,608 3, ,037 3,309 6,118 3,971 8,279 4,765 9,359 5,909 A-60
66 Zones Population Employment Population Employment Population Employment Population Employment ,743 5,014 16,093 6,017 16,442 7,220 23,019 8, ,842 5,158 12,502 9,190 18,393 13,028 22,748 16, , ,787 3,482 8,150 6,178 10,512 7, ,188 3,093 11,567 9,712 11,834 11,654 14,100 14, ,079-12,884 7,140 13,689 8,568 14,494 10, ,605 3,747 35,492 4,496 40,816 5,395 57,142 6, ,279 2,097 32,532 2,516 45,545 3,019 63,763 3, ,245 1,868 15,828 2,242 34,505 2,690 48,307 3, ,815 2,797 33,113 3,356 72,186 4, ,060 4, ,961 18,664 49,831 57, ,449 69, ,767 85, ,539 20,586 66,044 60, ,977 72, ,568 89, ,427 1,318 17,524 1,582 18,621 1,898 20,718 2, ,342 2,066 38,873 2,479 79,114 2, ,851 3, ,247 2,115 40,168 2,538 87,566 3, ,593 3, ,672 1,349 49,129 1, ,101 1, ,941 2, ,512-11, , , ,530 5,518 31,700 6,622 69,105 7,946 96,747 9, ,938 3,216 35,932 3,859 78,331 4, ,664 5, ,101 2,734 28,722 3,281 60,716 3,937 84,359 4, ,512 14,629 46,023 17,555 91,835 21, ,690 26, ,604 7,855 17,673 9,426 38,528 11,311 53,939 14, ,437 1,495 8,499 1,794 18,528 2,153 25,940 2, ,260 3,419 9,467 4,103 20,637 4,924 28,892 6, ,775 14,016 28,932 16,819 63,072 20,183 88,301 25, ,859 4,970 36,510 5,964 79,592 7, ,429 8, ,299-31, , ,267-18, , ,328-7, , , ,193 1,110 38,070 1, ,041 1,500 39,330 1,800 55,062 2, ,775-12, , , , ,746 1,025 2,876 1, ,289 1,590 39,869 1,908 55,817 2, ,000 14,853 54,874 17, ,456 21, ,097 26, ,030-28, , ,883-23, , A-61
67 Zones Population Employment Population Employment Population Employment Population Employment ,660 15,986 9,192 34,849 11,030 48,788 13, ,458-57, , ,165 2,533 35,019 3,040 48,952 3, , , ,520 1,154 1,661 1, , ,798 1,940 23,540 2,328 32,956 2, ,254 4,379 3,540 7,255 5,247 8,706 6,508 10, , , , , , , , , , ,681 1,050 42,905 1,260 60,067 1, , ,829 1,097 11,192 1,316 14,416 1, , , , , ,200-7, , , , ,614 1,680 41,460 2, , ,793 2,040 37,511 2, , ,417 2,264 36,983 2, , , , , ,699 1,106 12,852 1,327 26,054 1,592 35,809 1, ,000-3,028-3, , , ,000 1,144 3, , , , ,802 1, ,485-20, , ,455-24, , ,522 1,255 20,298 1,506 44,250 1,807 61,950 2, , , , , ,100-12,176-24, , ,050-2, ,700-1,795-2,012 3,050 2,173 3, ,879-6, ,860-21,495-30, , ,278 1, , , , , , ,282 2,185 28,342 2,622 32,762 3,146 43,370 3, , ,749 1,108 23,139 1,330 31,276 1,649 A-62
68 Zones Population Employment Population Employment Population Employment Population Employment ,500 1,268 10,809 1,522 12,088 1,826 15,157 2, ,025 1,183 13,650 1,420 16,043 1,704 21,785 2, ,200 2,089 21,490 2,507 24,356 3,008 31,236 3, , , , , , , , , , , , , , , , , , , , , , , , , , , ,448-19,778 88,112 32, ,734 42, , ,603-20,531-25, ,280 29, , ,533 2,664 34,930 3,197 37,106 91,948 38, , ,648 2,023 4,331 2,428 7,201 2,914 9,322 3, ,178 1,200 10,266 1,440 11,909 1,728 13,124 2, ,800 12,207 2,164 16,648 2,662 19,978 3,031 24, ,810 13,158 1,875 17,790 2,034 21,348 2,151 26, ,850 36,178 2,283 45,414 2,924 54,497 3,397 67, ,900 27,929 2,160 35,515 2,654 42,618 3,019 52, ,880-2,756 2,000 3,954 3,900 4,839 4, ,576-14,691-17,629-21, ,520-15,424-18,509-22, ,000 3,837 13,699 4,604 16,933 5,525 19,322 6, ,000 6,413 74,247 7, ,696 9, ,279 11, , ,501 1,044 4,756 1,253 5,683 1, , , , , ,763 15,296 10,671 18,355 11,739 22,026 16,434 27, ,401 16,989 11,853 20,387 13,038 24,464 18,254 30, ,095 7,057 7,301 8,468 8,031 10,162 11,244 12, ,157 7,457 7,714 50,000 8,485 72,500 11,879 89, ,698 3,825 82,000 4, ,900 5, , ,449 2,534 48,433 2,787 70,228 3,902 87, ,925 1,226 7,110 2,672 8,532 3,741 10, ,532 5,723 38,667 6,295 56,067 8,814 69,523 A-63
69 Zones Population Employment Population Employment Population Employment Population Employment ,072 6,909 7, ,449 7, ,451 11, , ,286 8,290 8,576 9,948 9,434 11,938 13,207 14, ,650 4,111 22,136 1,521 24,583 2,206 32,900 2, ,876 1,483 9,443 1,780 10,072 2,136 14,101 2, ,908 1,563 16,416 1,876 17,510 2,251 20,794 2, ,636 2,011, ,515 2,313, , , , , , , ,351 15,000 45,527 50,000 60,703 57, , ,454 2,694 3,271 3, ,299 40, , , , ,020 IREO 21, ,399 24, ,609 1,664, ,521 2,872,624 1,472,992 4,934,476 4,998,097 6,634,760 5,918,643 Zone-wise Projections under Moderate Scenario Zones Population Employment Population Employment Population Employment Population Employment ,197 1,468 24,028 1,762 26,084 2,114 33,075 2, ,633 1,907 21,369 2,288 32,704 2,746 41,786 3, ,464 1,398 25,129 1,678 41,261 2,014 53,198 2, ,858 2,116 24,033 2,539 35,122 3,047 42,088 3, , ,015 1,076 20,208 1,291 23,143 1, , , , , ,182 2,390 45,054 2,868 59,728 3,442 69,449 4, ,677 2,089 21,100 2,507 33,525 3,008 38,950 3, ,812 3,046 75,090 3,655 83,585 4, ,509 5, ,896 1,320 56,833 1,584 80,086 1, ,908 2, ,594 4,954 52,069 5,945 68,759 7,134 99,107 8, ,942 8,074 45,208 9,689 49,715 11,627 58,728 14, ,654 11,276 12,572 13,531 13,543 16,237 14,514 20, ,760 1,972 28,607 2,366 29,172 2,839 29,737 3, ,876 2,955 41,595 3,546 53,529 4,255 67,776 5, , , , , , , ,694 1,122 32,281 1, ,520 18,100 35,238 31,720 46,586 38,064 54,730 47, ,915 2,770 13,453 9,324 22,471 11,189 26,798 13, ,457 3,444 22,761 11,133 24,278 13,360 26,772 16,566 A-64
70 Zones Population Employment Population Employment Population Employment Population Employment , ,307 1,105 28,844 1,326 36,055 1, ,697 1,993 24,478 2,392 30,373 2,870 39,019 3, ,264 3,450 59,393 4,140 99,477 4, ,267 6, ,807 29,749 97,127 5, ,305 8, ,812 10, ,471 2,670 40,000 11,672 58,000 16,674 71, ,763 26,982 10,345 4,785 31,272 6,939 43,781 8, ,997 32,066 35,867 7, ,015 11,207 97,518 13, ,998 43,442 16,367 12,827 44,401 18,600 62,161 23, , ,826 1,579 3,339 11,895 3,750 14, ,208 8,303 7,790 9,964 23,523 11,957 32,932 14, ,578 1,817 19,531 2,180 42,577 2,616 59,608 3, ,037 3,309 6,118 3,971 8,279 4,765 9,359 5, ,743 5,014 16,093 6,017 16,442 7,220 23,019 8, ,842 5,158 12,502 9,190 18,393 13,028 22,748 16, , ,787 3,482 8,150 6,178 10,512 7, ,188 3,093 11,567 9,712 11,834 11,654 14,100 14, ,079-12,884 7,140 13,689 8,568 14,494 10, ,605 3,747 35,492 4,496 40,816 5,395 57,142 6, ,279 2,097 32,532 2,516 45,545 3,019 63,763 3, ,245 1,868 15,828 2,242 34,505 2,690 48,307 3, ,815 2,797 30,113 3,356 72,186 4, ,060 4, ,961 18,664 19,831 57,710 88,449 69, ,767 85, ,539 20,586 62,044 60, ,977 72, ,568 89, ,427 1,318 17,524 1,582 18,621 1,898 20,718 2, ,342 2,066 38,873 2,479 69,114 2,975 88,851 3, ,247 2,115 40,168 2,538 77,566 3, ,593 3, ,672 1,349 49,129 1,619 67,101 1,943 99,941 2, ,512-11, , , ,530 5,518 31,700 6,622 54,105 7,946 76,747 9, ,938 3,216 35,932 3,859 58,331 4,631 69,664 5, ,101 2,734 28,722 3,281 45,716 3,937 64,359 4, ,512 14,629 46,023 17,555 71,835 21,066 85,690 26, ,604 7,855 17,673 9,426 29,528 11,311 44,939 14, ,437 1,495 8,499 1,794 14,528 2,153 29,940 2, ,260 3,419 9,467 4,103 16,637 4,924 23,892 6, ,775 14,016 28,932 16,819 43,072 20,183 68,301 25,027 A-65
71 Zones Population Employment Population Employment Population Employment Population Employment ,859 4,970 36,510 5,964 69,592 7,157 81,429 8, ,299-31, , ,267-14, , ,328-7, , , ,193 1,110 28,070 1, ,041 1,500 29,330 1,800 45,062 2, ,775-12, , , , ,746 1,025 2,876 1, ,289 1,590 19,869 1,908 35,817 2, ,000 14,853 34,874 17,824 54,456 21,389 91,097 26, ,030-18, , ,883-13, , ,660 11,986 9,192 24,849 11,030 33,788 13, ,458-37, , ,165 2,533 20,019 3,040 28,952 3, , , ,520 1,154 1,661 1, , ,798 1,940 8,540 2,328 17,956 2, ,254 4,379 3,540 7,255 5,247 8,706 6,508 10, , , , , , , , , , ,681 1,050 32,905 1,260 45,067 1, , ,829 1,097 11,192 1,316 14,416 1, , , , , ,200-7, , , , ,614 1,680 31,460 2, , ,793 2,040 17,511 2, , ,417 2,264 26,983 2, , , , , ,699 1,106 8,852 1,327 21,054 1,592 30,809 1, ,000-3,028-3, , , ,000 1,144 3, , , , ,802 1, ,485-16, , ,455-4, , ,522 1,255 13,298 1,506 24,250 1,807 41,950 2,241 A-66
72 Zones Population Employment Population Employment Population Employment Population Employment , , , , ,100-12,176-19, , ,050-2, ,700-1,795-2,012 3,050 2,173 3, ,879-6, ,860-12,495-15, , ,278 1, , , , , , ,282 2,185 24,342 2,622 32,762 3,146 43,370 3, , ,749 1,108 23,139 1,330 31,276 1, ,500 1,268 6,809 1,522 12,088 1,826 15,157 2, ,025 1,183 9,650 1,420 16,043 1,704 21,785 2, ,200 2,089 17,490 2,507 24,356 3,008 31,236 3, , , , , , , , , , , , , , , , , , , , , , , , , , , ,448-19,778 88,112 32, ,734 42, , ,603-20,531-25, ,280 29, , ,533 2,664 34,930 3,197 37,106 91,948 38, , ,648 2,023 4,331 2,428 7,201 2,914 9,322 3, ,178 1,200 10,266 1,440 11,909 1,728 13,124 2, ,800 12,207 2,164 16,648 2,662 19,978 3,031 24, ,810 13,158 1,875 17,790 2,034 21,348 2,151 26, ,850 36,178 2,283 45,414 2,924 54,497 3,397 67, ,900 27,929 2,160 35,515 2,654 42,618 3,019 52, ,880-2,756 2,000 3,954 3,900 4,839 4, ,576-14,691-17,629-21, ,520-15,424-18,509-22, ,000 3,837 13,699 4,604 16,933 5,525 19,322 6,851 A-67
73 Zones Population Employment Population Employment Population Employment Population Employment ,000 6,413 44,247 7,696 92,696 9, ,279 11, , ,501 1,044 4,756 1,253 5,683 1, , , , , ,763 15,296 10,671 18,355 11,739 22,026 16,434 27, ,401 16,989 11,853 20,387 13,038 24,464 18,254 30, ,095 7,057 7,301 8,468 8,031 10,162 11,244 12, ,157 7,457 7,714 25,000 8,485 36,250 11,879 44, ,698 3,825 41,000 4,208 59,450 5,891 73, ,449 2,534 24,217 2,787 35,114 3,902 43, ,925 1,226 7,110 2,672 8,532 3,741 10, ,532 5,723 38,667 6,295 56,067 8,814 69, ,072 6,909 7, ,449 7, ,451 11, , ,286 8,290 8,576 9,948 9,434 11,938 13,207 14, ,650 4,111 22,136 1,521 24,583 2,206 32,900 2, ,876 1,483 9,443 1,780 10,072 2,136 14,101 2, ,908 1,563 16,416 1,876 17,510 2,251 20,794 2, , , ,515 1,146, , , , , , , ,351 7,500 45,527 25,000 60,703 28, , ,454 1,347 3,271 1, ,299 20, ,949 66, ,599 77,010 IREO 10, ,700 12, ,804 Total 1,664, ,521 2,520,624 1,209,782 4,291,663 3,250,516 5,787,325 3,891,932 A-68
74 Zone-wise Projections under Realistic Scenario Zones Population Employment Population Employment Population Employment Population Employment ,197 1,468 14,775 1,512 15, ,784 31,607 2, ,633 1,907 8,013 1,964 9, ,318 18,698 3, ,464 1,398 14,208 1,440 16, ,699 32,679 2, ,858 2,116 14,237 2,179 15, ,571 30,651 3, , , , ,090 27,942 1, , , , , ,182 2,390 24,967 2,462 29, ,905 59,282 4, ,677 2,089 16,845 2,152 17, ,539 35,988 3, ,812 3,046 38,639 3,137 43, , ,509 5, ,896 1,320 47,553 1,360 50, , ,613 2, ,594 4,954 47,999 5,103 55, , ,619 8, ,942 8,074 27,180 8,316 29, ,813 58,868 14, ,654 11,276 12,572 11,614 13, ,705 27,086 19, ,760 1,972 20,693 2,031 21, ,397 42,516 3, ,876 2,955 26,386 3,044 29, ,592 58,706 5, , , , , , , , ,388 1, ,520 18,100 35,238 18,743 36, ,117 73,171 31, ,915 2,770 8,072 4,853 8, ,727 17,489 8, ,457 3,444 8,093 5,547 8, ,545 17,197 9, , , , ,120 10,817 1, ,697 1,993 16,617 2,053 17, ,423 34,217 3, ,264 3,450 21,597 3,554 22, ,194 45,895 6, ,807 29,749 49,021 5,938 51, , ,853 8, ,471 2,668 40,000 2, ,000 16,674 59, ,763 26,982 6,148 4,785 6, ,742 13,320 7, ,997 32,066 26,711 7,729 27, ,275 97,518 11, A-69
75 Zones Population Employment Population Employment Population Employment Population Employment ,998 43,442 10,184 12,827 11, ,393 22,404 19, , ,426 1, ,683 2,055 3, ,208 8,303 7,553 8,552 8, ,091 16,185 14, ,578 1,817 5,859 1,872 6, ,209 12,695 3, ,037 3,309 6,118 3,408 8, ,021 16,557 5, ,743 5,014 16,093 5,164 16, ,094 32,885 8, ,842 5,158 12,502 5,313 13, ,269 26,285 10, , , , ,489 16,299 2, ,188 3,093 11,567 3,186 11, ,759 23,667 5, ,079-12,884 1,140 13, ,345 27,378 1, ,605 3,747 10,648 3,859 11, ,554 23,070 6, ,279 2,097 7,808 2,160 8, ,549 16,917 3, ,245 1,868 4,748 1,924 5, ,270 10,288 3, ,815 2,797 7,947 2,881 8, ,400 17,219 4, ,961 18,664 12,076 20,538 13, ,235 26,140 34, ,539 20,586 18,012 21,517 19, ,390 39,026 36, ,427 1,318 4,841 1,358 6, ,602 12,650 2, ,342 2,066 13,297 2,128 14, ,511 28,298 3, ,247 2,115 8,732 2,178 9, ,570 19,211 3, ,672 1,349 13,647 1,389 15, ,639 30,023 2, ,512-11, , , ,530 5,518 8,453 5,684 9, ,707 19,020 9, ,938 3,216 7,985 3,312 8, ,908 17,966 5, ,101 2,734 9,643 2,816 10, ,323 21,294 4, ,512 14,629 20,703 15,068 22, ,780 44,782 25, ,604 7,855 7,069 8,091 7, ,547 15,906 13, ,437 1,495 2,833 1,540 3, ,817 6,374 2, ,260 3,419 3,787 3,522 4, ,156 8,520 5, ,775 14,016 9,258 14,436 10, ,034 20,831 24,529 A-70
76 Zones Population Employment Population Employment Population Employment Population Employment ,859 4,970 14,604 5,119 16, ,040 32,859 8, ,937-9, , ,167-5, , ,080-2, , , , ,152 1, ,276 1,500 12, ,770 24,807 2, ,609-3, , , , , ,876 1, ,430 1,590 12, ,876 25,147 2, ,000 14,853 49,622 15,299 50, , ,869 25, ,030-13, , ,883-11, , ,660 15,986 7,890 16, ,310 33,970 13, ,458-28, , ,165 2,457 17, ,899 23,954 4, , , , ,661 1, , ,798 1,878 11, ,216 22,946 3, ,254 4,379 3,540 6,510 5, ,682 10,493 11, , , , , , , , , , , , ,063 85,809 1, , , , ,110 22,384 1, , , , , ,200-7, , , , , ,677 59,228 2, , , ,036 53,587 2, , , ,260 52,833 1, A-71
77 Zones Population Employment Population Employment Population Employment Population Employment , , , , ,699 1,106 12,852 1,139 26, ,344 52,107 1, ,000-3,028-3, , , , , , ,860 1, ,485-20, , ,455-24, , ,522 1,255 20,298 1,293 44, ,526 61,950 2, , , , , ,100-12,176-24, , ,700-1,795-2, , , ,860-21, , , ,278 1, , , , , , ,282 2,185 28,342 2,251 32, ,656 65,524 3, , , , ,122 46,278 1, ,500 1,268 10,809 1,306 12, ,541 24,175 2, ,025 1,183 13,650 1,218 16, ,437 32,086 2, ,200 2,089 21,490 2,152 24, ,539 48,712 3, , , , , , , , , , , , , , , , , , , , , , A-72
78 Zones Population Employment Population Employment Population Employment Population Employment , , , , , ,448-19,778 4,000 32, ,720 65,433 6, ,603-20,531-25, ,280 29,151 43, ,533 2,664 34,930 2,744 37, ,350 38,715 73, ,648 2,023 4,331 2,084 7, ,459 9,322 3, ,178 1,200 10,266 1,236 11, ,458 13,124 2, ,800 12,207 2,164 12,573 2, ,836 3,031 21, ,810 13,158 1,875 13,553 2, ,993 2,151 23, ,850 36,178 2,283 39,263 2, ,330 3,397 66, ,900 27,929 2,160 28,767 2, ,945 3,019 48, ,880-2,756-3, ,500 4,839 2, ,576-10,893-12,854-18, ,520-4,656-5,494-7, ,000 3,837 13,699 3,952 16, ,663 19,322 6, ,000 6,413 74,247 6, , , ,279 11, , , , ,057 5,683 1, , , , , ,763 15,296 5,336 15,755 11, ,591 16,434 26, ,401 16,989 5,927 17,499 13, ,649 18,254 29, ,095 7,057 3,651 7,269 8, ,577 11,244 12, ,157 7,457 3,857 25,000 8, ,000 11,879 37, ,698 1,913 41,000 4, ,200 5,891 61, ,449 1,267 24,217 2, ,060 3,902 36, ,925 1,226 6,103 2, ,202 3,741 10, ,532 2,862 38,667 6, ,400 8,814 57, ,072 6,909 5, ,099 7, ,518 11, , A-73
79 Zones Population Employment Population Employment Population Employment Population Employment ,286 8,290 6,861 8,539 9, ,076 13,207 14, ,650 4,111 11,128 1,521 24, ,826 32,900 2, ,876 1,483 3,777 1,527 10, ,802 14,101 2, ,908 1,563 6,566 1,610 17, ,900 20,794 2, , , , , ,211 7, ,780 20,090 Total 1,664, ,521 1,708, ,829 2,240,360 1,024,229 4,312,490 1,849,673 A-74
80 Support Document of IMP: Part - 6 A-75

81 6. Development of Urban Transport Demand Model 6.1 Base Year Model Development The main purpose of the Urban Travel Demand Model is to predict the travel patterns and modal shares under different land-use and transport Scenarios. From the urban planner point of view, Gurgaon region has a high influence in travel from the Delhi region. So the study area has been considered as Delhi. The urban demand model developed for Delhi and Noida - Greater Noida, developed as part of another study, has been updated by adding Gurgaon area. Travel Demand models can be used for testing different scenarios without actually implementing projects. For example, one can see the impact of adding a mass transport use like a metro or BRT etc. Similarly impact on transportation network due to changes in the land use patterns can be analyzed. The broad framework for the transport modeling for Delhi Gurgaon area is given in Figure 6.1. Figure 6.1 Methodology for Travel Demand Modelling Several software programs are available for developing travel demand models. The Delhi Gurgaon transport model has been developed using TransCAD (a state-of-the-art Travel Demand Modeling software). A-76

82 Model Structure The model is based on a conventional 4-stage transport model approach. It includes: Trip Generation calculating the number of origins and destinations for each zone. Model Input Road network inventory Trip Distribution attaching the origins and Public Transportation Details destinations for complete trips. Planning variables by zones Mode Choice determining the mode for each trip Trip End Information (TW, car, auto, Public transport). Assignment assigning passengers to their respective highway and transit networks. The highway (road) network with all the major road and some key minor roads. The transit system would be built with the existing public transport system in all its forms i.e. bus and rail, Minibuses and shared auto with their routes, frequency, fare structure etc. Calibration Trip ends (derived from the Trip end models) will be used to build base year trip matrices by mode using distribution functions from past information. Distribution function is adjusted until assigned flows compare well with observed flows. These base year trip matrices are checked for their accuracy by assigning distributed trips by mode on the road network. The assigned traffic across the screen lines are compared with the observed traffic. Once the model is calibrated, it can be used to predict the future travel patterns under different land use transport scenarios. The model is responsive to: Street congestion, travel costs, availability of competing transport modes including other Public Transport systems and the growth of the city. Model Outputs Trip distribution and Mode split equations Traffic flow Ridership and Revenue estimate for various system options Identification of suitable public transport System A-77
83 Generalized costs that include out of pocket costs i.e. fare, vehicle operating cost etc. and perceived user costs such as value of travel time, cost of waiting time for transit etc., The economic development of the region. A comprehensive data on economic development in the form of land-use and transport development proposals will be collected. The model focuses on morning journey to work peak period conditions. Peak period models provide much more accurate indications of directional travel patterns during design conditions than do daily models. However, the daily traffic forecasts can be estimated using peak to day expansion factor which is obtained from the traffic survey. From the surveys it was observed that the city morning peak hour is during 9.15 AM to AM. So the model was built for this duration. Planning Period Year 2008 is taken as the base year. Demand forecasting on the network and on any proposed mass transit system is required over a 25 year period. In order to analyze the travel demand in the study area and estimate the likely traffic patronage on any proposed system, all relevant data have been collated for the base year 2008, the horizon year 2031 and the two intermediate years (2011 & 2021). Modes The modes that are modeled in the study include two wheeler, car, auto rickshaw and public transport. The non- motorized transport and commercial vehicles were considered as a preload. The following sections detail out the Travel Demand Model developed for the project. Study Area Zoning The zoning has followed the ward boundaries in the Delhi Noida Greater Noida - Gurgaon area. Table 6.1 below presents the zones system for the study area. Figure 6.2 represents the zoning system. Table 6.1: Study area zoning (Including Delhi zones) Sl. No Sub Area No of Zones 1 Delhi Noida Greater Noida 40 3 Gurgaon External zones 11 Total 404 A-78
84 Network Development Transport network developed for the model comprises of two components, Highway Network for vehicles Transit Network for public transport system i.e. buses, rail, metro and any new public transportation system. Each of the networks is described in detail below Figure 6.2 Study Area Zoning Map Highway Network The coded highway network for the study area represents the nodes (intersections) and links between them. Connectivity between the network and zones is provided through centroid connectors. Based on the network inventory, each link has been assigned attributes such as: number of lanes; divided or undivided carriageway; encroachments; availability of footpaths etc. Identified road network for the city area is given in Figure 6.3. A-79
85 Road length : 2220Km No of nodes : 2753 Centroids : 393 No of links : 3700 Figure 6.3 Base Year Study Area Road Network Transit Network The transit network represents the connectivity, headways, speeds and accessibility of transit services. In Gurgaon, local minibuses and shared auto rickshaws are plying on the main corridors. So, Delhi Gurgaon bus transport system, minibus transport system and shared auto transport system is included in the model s transit network. The transit routes are specified as those using the transport links and having stops/stations at determined locations. The access to the stops/stations from zone centroids and other nodes is provided either by existing highway links or by defining exclusive walk links. The distance between the bus stop/stations is assumed between 500m to 1000m in the public transport assignment. Figure 6.4 presents the transit network for the study area. A-80

86 Figure 6.4 Transit Network in the Study Area Currently, about 681 bus routes and 23 shared auto routes are operated in the entire Delhi- Gurgaon area. Information on the same was collected and coded in to the system. Fare structure and frequency for each of these services are also included. Base Year Travel (2008) Pattern We have synthetic trips using trip distribution and mode choice models from past studies. The trip matrices have significantly updated using fresh household survey and roadside interview. The external trips for the car, two wheeler, auto and public transport were constructed based on the O-D survey conducted at the outer cordon. The trip matrices thus derived were then compared with the passenger trip rates for study area derived from the household interview data. The results of the travel demand estimation for base year and trip rate analysis is summarized in the Table 6.2. A-81
87 Table 6.2: Summary of Estimated Base Year (2008) (Delhi & Gurgaon) Peak hour Travel Demand Per-capita Trip rate 1.55 Motorised Trip rate 1.06 Sl. No Mode Internal Trips External Trips Total Trips 1 TW Passengers Car Passengers Auto Passengers Public Transit Passengers Total The base year peak hour travel demand for Gurgaon area alone is presented in the following Table 6.3. Table 6.3: Base year peak hour travel demand in Gurgaon Sl. No Mode Trips Percentage 1 Car Passengers % 2 TW Passenger % 3 Auto Passenger % 4 Public Transit Passenger* % (* - Public transit includes Local Minibuses and IPT) Assignment and Observed O-D Validation Base year mode wise matrices developed were then assigned on the network. The assigned volume on the network was compared with the observed volume on the screen lines adopted for the study area. Screen lines running on physical barriers were selected judiciously. The selected screen lines are Line bisecting Manesar and Gurgaon area and Sohna road Railway station road Classified volume count survey was carried out at the crossing points across these Screen lines. The comparison of assigned flows with the traffic volume observed at the two screen lines are presented in Table 6.4. A-82
88 Table 6.4 Results of Observed OD Validation on Screen lines Mode Observed Assigned % difference Observed Assigned % difference Screen line 1 (Line Bisecting Gurgaon and Manesar) TW % % Car % % Auto Rickshaw % % PT passengers % % Screen line 2 (Sohna Road Railway station Road) TW % % Car % % Auto Rickshaw % % PT passengers % % Point validation has been done for the important outer cordon locations and is presented in the Table 6.5. Percentage difference of observed with the assigned are within an acceptable limit of ±15%. Table 6.5 Base Year Observed OD Validation on Outer Cordon Locations Location Observed Assigned % difference Cordon locations (in trips) NH 8 (towards Rewari) % Zatakaria road % Faridabad road % Pataudi road % Daurauli road % Bahchada chowk % NH 8 (towards Delhi) % Old Gurgaon road % Base Year Results: The traffic characteristics of the study area in terms of average network speed, average trip length volume to capacity ratio, vehicle distance travelled, total passenger hours etc. is given in Table 6.6. The Delhi- Gurgaon movement of traffic is also shown below. A-83
89 Table 6.6 Trip Characteristics: Do Nothing Trips Assigned (Peak hour) : Trips Assigned- TW (Peak Hour) : (44%) Trips Assigned- Car (Peak Hour) : (34%) Trips Assigned-Auto rickshaw (Peak Hour) : (10%) Trips Assigned- PT (Peak Hour) :15617 (12%) Average network speed (major corridors) : 21.59Kmph Average Trip length Total passenger kms Total passenger hours Total vehicle kms Total Vehicle hours : 8.10 kms : pass-kms : 6174 pass-hrs : veh-kms : veh-hrs Delhi Gurgaon movement Trips Assigned (Peak hour) : Trips Assigned for Delhi-Gurgaon movement : Trips Assigned- TW (Peak Hour) : 9649 (15%) Trips Assigned- Car (Peak Hour) : (50%) Trips Assigned-Auto rickshaw (Peak Hour) : 0 (0%) The volume to capacity ratio for the major roads, average journey speed and the passengers per hour per direction (all modes) is presented in Table 6.7. Traffic flow/capacity for major road network in the base year is presented in Figure 6.5. Table 6.7 Base Year (2008) Transport Characteristics on Major roads Average Network Speed Sl. no Name of the Road V/C Ratio (kmph) 1 Old NH Pataudi road Basai road Mehrauli road Faridabad road Sohna road Palam Vihar road Khandsa road A-84
90 Figure 6.5 Base Year Flow/Capacity Diagram for peak hour traffic Calibration Trip Generation: Trip end models were calibrated by relating the trip produced from and attracted to the zones with the Land use. Table 6.8 presents the base year population and employment for the study area. Table 6.8 Population and Employment Sub area Population Employment Delhi Noida- Greater Noida Gurgaon TOTAL The calibrated trip end models are presented below. Productions: Attractions: TP = 1.08 * Population R2 = 0.88 TA = 1.78 * Employment R2 = 0.82 A-85
91 Trip Distribution A combined gravity (distribution) model formulation was calibrated. The base year trip ends, zone-to-zone cost skims derived from the highway and transit networks were used to calibrate the gravity model. The equation for the distribution function is as follows: Tij =Ai Oi Bj Dj Fij Where O Trip Productions D Trip Attractions A & B are balancing factors F Deterrence Function Fij = acbij e - ccij a, b and c are the calibration function C is the generalized cost of travel between zones The parameters for the deterrence function were calibrated. It was found that the combined Gamma function fitted best for the study area. The combined Gamma function follows the form: Fij = acbij e - ccij The calibrated parameters for the deterrence function (Gamma Function) are provided in the Table below. A B C Mode Choice A multinomial mode choice model of the following form shown below is calibrated in order to split the trips among the modes, public transport, car, and two Wheeler and Auto rickshaws. The public transport assignment module shall achieve the modal split among the publictransport modes i.e., Bus, Shared auto and Rail. Utility functions (VM) for each mode were calibrated using the disaggregate person trip and mode choice data derived from the observed o-d, travel time and travel cost for each individual. V M = α TT M +βtc M Where, TTM - Travel Time by Mode M TCM - Travel Cost by Mode M A-86
92 α and β are modal calibration parameters The information on the alternate modes, i.e., travel time and travel cost, available to user, was generated from the time and cost skims obtained in public transport and highway assignment procedures. The calibrated parameters are given in Table 6.9. Table 6.9 Calibrated Mode Choice Parameters Mode α β Two Wheeler Car Auto Public Transport It may be seen that as anticipated the public transport modal share reduces from the current level of 12% in 2008 to 5% in There is more than threefold increase in the vehicle kilometers, ie; from 0.7 million to 2.6 million during the period of resulting in drastic reduction in speeds from 18km/hr to 10 km/hr during the peak hour. Delhi-Gurgaon trips during peak hour have almost doubled (1.1 lakhs to 2.4 lakhs) in the same period which is essentially being met with three major roads and one metro line form Delhi- Gurgaon that is ending at Sushant Lok and three proposed roads under this scenario. A-87
93 Support Document of IMP: Part - 7 A-88
94 No. of Vehicles Integrated Mobility Plan for Gurgaon- Manesar Urban Complex 7. Environmental Assessment The rapid growth of the Indian economy has had a large amount of stress on the environment, particularly on the quality of air. As the economy and the population continue to grow, the demand for motorized vehicles and fuel will increase, as well. Liquid fuel consumption in the transport sector accounted for about 30% of our total petroleum products consumption. Motor Vehicle Population in Gurgaon The vehicle population in Gurgaon shows a tremendous growth during the past few years. During past four years, vehicle registration has marked a growth rate more than 20% per annum. Particularly personal modes have registered a very high growth rate, cars are growing at 30% rate, while two wheelers at 22%. Due to the absence of public transport in Gurgaon, IPT modes are adding more in the Total AR TW Car vehicle population. It is imperative that in Gurgaon, on an average 250 vehicles are Year getting registered daily, in which two wheelers and cars constitute about two- third. Also the floating population of vehicles from neighboring places, especially from Delhi is huge. The existence of old vehicles along with high growth in the recent past really impacted the pollution level in Gurgaon. Existing Vehicle Emissions The estimated vehicle emission load in Gurgaon for 2009 is presented in Table 7.1. The daily emission constitutes about 15 tonnes of pollutants. Table 7.1 Estimated Vehicle Emission/Day in Gurgaon for 2009 (in tonnes) Veh. Type TSP SO2 NOX CO HC Pb Total Car Whlr Auto Bus Commercial vehicles Total Note: based on emission factors provided by NPCB A-89
95 Emission under Do- minimum The advancement in technology in the Indian automobile industry has gone a long way and has introduced advanced emissions and energy efficient vehicles, including hybrids and electric cars in India. Several Indian companies have begun work on hybrid vehicles three-wheelers with hybrid propulsion, range extender hybrid truck prototypes, etc. hence it is assumed that emissions reduce in the future due to better technology vehicles. This intervention indicates only a slightly higher increase in the emission by 2031 than 2009, though the trips are expected increase three folds. Anticipated emission from vehicles under do- minimum situation 2031 is presented in Table 7.2. Table 7.2: Estimated Vehicle Emission/Day in Gurgaon for 2031 (in tonnes) under Do- minimum scenario Veh. Type TSP SO2 NOX CO HC Pb Total Car Whlr Auto Bus Commercial vehicles Total Assumption: Vehicular emissions reduce due to better technology vehicles Emission with the IMP Interventions The proposed IMP for Gurgaon approach to reduce air pollution would include reducing the number of vehicles on the road, by enhancing the public transport system with more buses and Mass Transport System, along with efficient traffic management measures. This would ensure better traffic flow and thus higher speeds and the emissions are expected to reduce to half. Details are presented in table 7.3. Table 7.3 Estimated Vehicle Emission/Day in Gurgaon for 2031 (in tonnes) with IMP Veh. Type TSP SO2 NOX CO HC Pb Total Car Whlr Auto Bus Commercial Vehicles Total A-90
96 Department of Town and Country Planning (DTCP), Government of Haryana December 2010 Integrated Mobility Plan for Gurgaon Manesar Urban Complex Final Report
97 5 th Floor A Wing, IFCI Tower Nehru Place New Delhi
98 TABLE OF CONTENTS Chapter 1 INTRODUCTION... 1 Chapter 2 VISION AND OBJECTIVES The Vision Objectives... 4 Chapter 3 TRANSPORT GOAL Snapshots- Today Transport Characteristics and issues Transport Indicators Snapshot Tomorrow Population Development Plan Outline Development Plan Transport Proposals Employment Transport Demand Mobility Plan Goals Stake Holder Meeting Chapter 4 MOBILITY PLAN STRATEGIES Land Use and Transport Strategy Development of Mobility Corridors Aggressive: Option 1_ Ring Aggressive: Option II_ Grid Network Moderate and Realistic Strategy Public /Mass Transit Strategy Higher Order Mass Transit System Strategy Non- Motorized Transport Strategy Freight Management Strategy Traffic Management Intersection Redesign Installation of Traffic Control Devices Traffic Signs and Markings Parking Management Travel Demand Management Strategy... 34
99 Chapter 5 MOBILITY PLAN Mobility Corridor Plan Corridor Development Flyovers/Underpass Plan Public Transport/Mass Transport Plan Introduction of Bus System BRT Based Public Transport Plan High Speed High Capacity Mass Transit System Plan Mass Transport Plan under Moderate Scenario Mass Transport Plan under Aggressive Scenario Complementary Proposals Non- Motorized Transport Plan Install Footpaths Install Bi-cycle Lanes Passenger Terminal Plan Frieght Management Plan Development of RoBs/RuBs Traffic Management Measures Intersection Redesign Road Improvements Footpath cum Drain Safe Pedestrian Crossing Facilities Bicycle Lanes On- Street Parking Management Off- street Parking Facilities Bus Transport Traffic Management for Market Area Regulation of Cycle Rickshaws Regulation of Auto rickshaws Enforcement IMP Outcome Chapter 6 INVESTMENT PROGRAMME Cost Estimation Phasing Funding Options Project Profile Chapter 7 INSTITUTIONAL FRAMEWORK Present Institutional Set-Up Issues with the Present Institutional Set up Proposed Institutional Framework... 99
100 Chapter 1 Introduction 1
101 The Integrated Mobility Plan (IMP) for Gurgaon-Manesar Urban Complex (GMUC) seeks to create an integrated land use transport plan keeping in view the objectives of the National Urban Transport Policy (NUTP). The IMP will aim to guide all investments to happen in accordance with the plan so that an overall mobility vision is not lost. The Mobility Plan will emphasize movement of people and goods and not just motor vehicles, and hence will give priority to public transit and non-motorized modes. It is anticipated that by 2031, the population within GMUC will be about 43 Lakhs, which will be about 3 times higher than the present population. The proposed SEZs in and around GMUC are expected to generate huge employment in the area. This would further increase the population if these SEZs will come up within the stipulated time. The peak hour motorised transport demand estimated for 2031 is about 3.7 Lakhs, which is currently only 1.3 Lakhs. The impact of this high demand on the transport infrastructure of GMUC will be huge and critical. Plans are made and a number of projects are underway by various agencies/institutions responsible for planning and implementing transport projects for GMUC. This IMP will help to have an integrated approach to improve the transportation infrastructure in Gurgaon with co-ordination and streamlining of activities of different agencies. This report apart from formulating a transport improvement roadmap for the future includes suitable transport investment program for GMUC including short, medium and long- term projects that fits into the Mobility Plan. While the IMP reaches out into the future (20 year horizon) with growth and fluctuations seen in our fast growing economy, the fundamentals of the IMP need to be revised at least every five years, if not earlier. While for our planning, we have considered a horizon year employment in the region as 18.5 Lakhs, if the economy has its way this will be 59 Lakhs as can be seen from our Optimistic Land use Scenario. 2
102 Chapter 2 Vision and Objectives 3
103 2.1 The Vision The mobility plan seeks to move people, not vehicles. By emphasizing the pre-eminence of public transport and goods transport and integrating the land use with transport networks, with encouraging non-motorised transport it seeks to achieve the objectives of the NUTP in GMUC. The IMP vision for transport in GMUC ensures that the GMUC will have a high class sustainable and efficient transport infrastructure that will meet the needs of the economic developments that are proposed in the area. To ensure that the Gurgaon - Manesar Urban Complex will have a high class sustainable and efficient transport infrastructure that will meet the needs of the economic developments proposed in the area 2.2 Objectives Gurgaon has developed as an industrial, IT, BPO and commercial hub. Multinational companies, large business houses, foreign investors, Non-Resident Indians (NRI) are continuing to invest in Gurgaon. Rapid urbanization, population growth, growing economy and emerging employment opportunities in the region have placed an enormous demand for quality in transport infrastructure. Apart from being plagued by huge gaps in infrastructure to serve the current population, GMUC faces common challenges like deficient public transport, traffic congestion, deteriorating roads, pollution, etc. The objective of the Integrated Mobility Plan is to develop a transportation vision, set goals and objectives based on the defined vision and develop specific actions in the form of short, medium and long term transportation improvement proposals that will achieve the To develop a transportation vision, set goals and objectives based on the defined vision and develop transportation proposals that will achieve the transportation vision transportation vision for the area. In order to attain the vision, the mobility plan seeks to make public transport facilities available to all residents within a reasonable distance from their homes, work places and other destination points. It also seeks to encourage greater use of non-motorized modes by making their use safer. Recognizing that GMUC is a rapidly growing area and travel demand is expected to grow, there is no escape from having to decongest some of the highly choked areas and intersections. This is being suggested 4
104 because long idling of motor vehicles at crowded junctions and corridors adds to pollution and unnecessary use of an imported fuel and also global warming. The estimated daily vehicular emission in Gurgaon is about 15 tones currently. If the situation continues by 2031, this will increase to 18 tones, even with better technology vehicles. The emission estimated is presented in Part 7 of the Support Document of the IMP. In order to address the existing and envisaged mobility situation in 2031 and to fulfill the vision stated above, the following objectives need to be achieved: Integration of land use and transport-connectivity between the areas of activities within the GMUC Accessibility within and outside GMUC Better connectivity with Delhi Increased use of Public Transit Improved non-motorized and pedestrian facilities Improved safety of travel Reduction in pollution National Urban Transport Policy The National Urban Transport Policy (NUTP) has been formulated by the Ministry of Urban Development in 2006 to transform the current urban transport system into a safe, convenient and efficient transportation system across all urban areas in India. The objectives of the NUTP are: Integrating land use and transport planning Priority to the use of public transport Integrated public transit system Pedestrian facilities and pathways Non -Motorized Vehicle Traffic Parking and Freight management Capacity building Pollution Reduction The IMP essentially will suggest various actions that lead towards the vision guided by the general objectives of the NUTP. 5
105 Chapter 3 Transport Goal 6


106 3.1 Snapshots- Today GMUC has witnessed tremendous urbanization since the past two decades, due to public- private participation in land development, automobile industries, IT and BPO industry. The advantages that GMUC has are its proximity to Delhi, to the International Airport and the Delhi- Jaipur national highway - NH8. This has encouraged huge real estate development along this highway and other main arteries connecting Delhi with Gurgaon. The establishment of Maruti Udyog Ltd. in the early eighties and its ancillary units such us Mark Auto, Bharat Seats, Machino Plast and others in the mid-eighties marked a new era of industrialization in Gurgaon. Further, private developers have already embarked on developing residential colonies with high-rise buildings which have added a new dimension to the pattern of urban growth in GMUC. The residential development in the period , mainly took place on the northern side of the Defense area southwestern and south-eastern side of the town. Further, the growth has also taken place in a dispersed fashion. The trend in 1990 s has exhibited a faster pace of population growth in GMUC as the skilled and semi-skilled work force moved from Delhi to Gurgaon. The main development during this period took Household Interview Surveys indicated that Per Capita Trip Rate is 1.2 Average Trip Length is 7 KM Personalized Mode Share is 60% Walk-Cycle Mode (NMT) Share is 33% place on the south-eastern, south-western and in various pockets developed by colonizers. 7
107 Gurgaon has grown mainly along NH8. The growth of the residential colonies, industrial areas, hotels, shopping malls, golf course and corporate houses reveal that Gurgaon can be compared to any modern city of today. There are many other economic drivers of GMUC. The city has emerged as the third biggest IT centre in the country and holds 10 percent share in the country s software exports. Call centers and BPOs employ roughly 2 Lakh (0.2 Mn) people. A number of SEZs/ employment centers are expected to come up in GMUC. These developments are expected to generate huge employment opportunities in Gurgaon in the future and the impact on the transport infrastrucutre will be massive. Hence it is vital to adopt innovative approaches to develop GMUC in a systematic and coordinated manner, the seriousness of urban problems due to sudden population rise has been accelerating and threatening the urban-environmental conditions in GMUC. In order to prepare the mobility plan for GMUC to cater to the transport demand for the next twenty years, the mobility issues of the present system has been elicited. This has been carried out based on primary surveys and secondary data collected as part of the study, the details of which are presented in Part 1 of the Support Document of the IMP Transport Characteristics and issues The important transport characteristics and issues in Gurgaon that leads to traffic problems and inefficient mobility of people are the following: Public Transport GMUC lack proper organised public transport for local/intra -city transport. As an initiative by the Government, 40 CNG buses have been introduced recently for intra-city movement and on Delhi-Gurgaon route. About 100 private mini buses are operated from Gurgaon bus stand to various towns/villages in the vicinity such as Najafgar, Bahadurpura, Maruti Udyog, IMT Manesar, Pataudi, etc. About 125 interstate buses are operated between Gurgaon and various States/cities daily. Six- seater auto rickshaws are operating on many routes in the city. Vehicle ownership of residents in Gurgaon is 0.81 Gurgaon has very minimal public transport hence very high usage of personalized modes 8


108 The operations of these auto rickshaws are not organised and lack designated locations for parking and stopping. Road Infrastructure The present road network of GMUC constitutes about 220 kms of roads. 58% of roads in GMUC are two lane roads, leading heavy traffic congestion on the streets in GMUC. Unorganized and haphazard parking and encroachment on roads leads to further reduction in road capacity. Street lights are available only on 20% of roads in Gurgaon. Water logging is acute on roads. Proper marking and signage are absent on many roads. Many roads lack good riding surface. 8 lane roads: 10% 6 lane roads: 5% 4 lane roads: 27% 2 lane roads: 58% Traffic Speed and Delay Surveys indicated low operating speeds during peak hours. Traffic volume counts indicated several oversaturated juntions and links. Journey speed is found to be low on Basai road, Railway road, Mehrauli- Gurgaon road, etc. Delays on traffic flow are mainly due to junction delay, uncontrolled pedestrian movement, improper location of bus stops and bad road condition. 9


109 Intersections Junction Turning count surveys indicated that several junctions are congested during peak hours, especially those on the NH 8 expressway. IFFCO Chowk, Rajeev Gandhi Chowk, Sukrali Chowk, Shankar Chowk and NH8 Manesar Industrial Estate Chowk have very high peak hour traffic in the order of 10,000 PCU. IFFCO Chowk is the only signallised junction in GMUC, but is operating without a pedestrian phase though pedestrian movement/crossing is very high. Except Lt. Atul Kataria Chowk, all other junctions lack proper foot path. All junctions lack markings and signage and safe pedestrian crossing facilities. Non-Motorized Transport Facilities The share of non- motorised vehicles (NMVs) on Gurgaon roads varies between 5% and 20% during peak hours No separate lanes available for NMVs which forces them to share the main stream and leads to unsafe traffic conditions on the roads Limited pedestrian crossing facility is NMV facilities non- existent in Gurgaon available in GMUC. Roads with usable footpath are significantly lower than 23% and pedestrians are forced to walk on the carriageway on many roads Foot path is not available throughout the road length and is unusable on many roads. Footpaths are also encroached by hawkers and vendors or with obstructions like transformers and trees. Parking Parking demand is huge in Gurgaon, but off-street facilities are absent Vehicles are parking on streets haphazardly interfering with the traffic 10
110 Safety Parking survey on roads indicated that more than 80% of the vehicles are parked for short period (less than one hour). Short- term parkers are predominant at commercial areas. About vehicles are parked on various roads in Gurgaon on a normal working day with maximum parking on M.G. road. Fatal accidents account to about half of the total accidents recorded. Number of accidents are increasing at the rate of 6% per annum. Accident prone locations include major junctions like IFFCO Chowk, Sukhrali Chowk, Rajeev Chowk, Manesar Chowk, etc. Bus Terminals Interstate and local mini buses are operated from the bus terminal located near Fountain Chowk, is in the heart of the city. The area available for the terminal is limited. The entrance and exit of the terminal are narrow. Access roads leading to the bus terminal are narrow and encroached by parkers, hawkers and shop keepers. Inadequate facilities are available within the bus terminal in terms of bus bays, boarding alighting platforms and circulation area. No parking space present for two wheelers, cars, auto rickshaws, which are found, parking around Fountain Chowk area. Through traffic The Origin- destination surveys conducted at the outer cordon locations revealed that through traffic (bound between places outside of GMUC) is significant on all major transport corridors. More than 70% of commercial vehicle trips and about 50% of passenger trips are bound between places beyond GMUC. Ring roads/bypasses are absent forcing through traffic to use Gurgaon roads. Truck Movement About 13% of vehicles crossing the outer cordon points of the study area, which constitutes about 40,000 vehicles, are goods vehicles in which about three- fourth of goods vehicles move between places outside of Gurgaon. On an average, about 5000 trucks enter and leave Manesar industrial area daily. 11

111 About 900 trucks enter and leave Gurgaon in a day from/to other industries in GMUC. Even with such huge demand, truck terminals are not present in Gurgaon. During day time, these vehicles are parked along roads near industries, which is a traffic hazard. The mobility issues of these trucks/trailers also a concern in Gurgaon. Other Issues Connectivity with New Delhi: The three roads connecting Delhi and Gurgaon are the NH8 expressway, MG road and Old Gurgaon road. As per the count conducted on these three roads, the daily PCU on these road sections between Delhi and Gurgaon is in the order of 1.3 lakhs, 0.7 lakhs and 0.5 lakhs respectively. This is only bound to increase in the future. At present considerable thought and work is going on to increase throughput. Delhi Metro Extension to Gurgaon: Plans to extend the Delhi Metro from Ambedkar Colony in New Delhi to Sushant Lok in Gurgaon (Phase 1: 14.5 kms) have now been formally approved by both Delhi and Haryana Governments. The construction work is moving at a fast pace and the metro is expected to be fully functional by Gurgaon will have stations on this line at Garden Estate, Sikanderpur, DT City Center, IFFCO Chowk and Sushant Lok. DMRC in the revised master plan- 2021, has proposed a metro link connecting Sushant Lok station with Dwaraka line (sector 21) as part of Phase III. The DLF Rail link, a 3 Km link between Sushant Lok station and DLF city is also cleared for construction. New road proposals: The development plan proposes a number of new roads to improve the mobility between Delhi and Gurgaon- Manesar Urban complex Connectivity between Gurgaon and Manesar: The connectivity between Gurgaon and Manesar is also critical as both the areas are expected to grow together. There are three roads, connecting Gurgaon and Manesar. They are, NH8, Khandsa road and Pataudi road. But currently, the connectivity is provided mainly by the expressway. The road condition of the other two roads is poor. Currently, mini buses are operating between Gurgaon and 12
112 Manesar to meet the public transport need of the people. The truck traffic also uses these roads to access Manesar Transport Indicators A set of performance indicators has been developed for GMUC and are presented here. These indicators are adopted from Study on Traffic and Transportation Policies and Strategies in Urban Areas in India, 2008, a study carriedout by the Ministry of Urban Development. The values of the indicators have been estimated from the primary and secondary data collected as part of the present study Transport Indicators Network Speed (Average Journey Speed) 23 kmph Public Transport Mode Share (PT Trips/Total Motorised Trips) - 10% Walkability (Footpath Length /Road Length) 23% Cyclability (Cycle path Length /Road Length) - 0% Fatality Index (No. of Fatalities/Lakh Population) - 18 IPT Index (Registered IPT Vehicles/Lakh Population) Non-Motorized Travel Index (% of NMT Trips in Total Trips) - 33% Non Motorized Parking Index (Parkable Road Length/Road Length) - 18% 13
 to develop industrial infrastructure, have boosted up the industrial sector in Gurgaon.")
113 3.2 Snapshot Tomorrow Gurgaon has emerged as a prominant industrial, IT, BPO and commercial hub. The integrated approach in the Industrial Policy of Govt. 1999) to develop industrial infrastructure, have boosted up the industrial sector in Gurgaon. There are around 260 large and medium scale industrial units and 8000 small-scale units spread over an area of 370 sq km. In addition to the city of Gurgaon, IMT Manesar also has been developed as a satellite industrial town. Types of major industries in Gurgaon are: Engineering and Automobile Chemicals and Pharmaceuticals Plastic and Rubber Leather and Leather Products Textile and handloom Readymade garments Food Processing and Agro based Electrical, Electronics and telecommunication Information Technology & BPO Industry Growth of Manesar: Manesar has become the home to global industrial units and now an integrated part of the millennium city, it's a mega-city in the making. With the commercial and residential hub in Gurgaon and the industrial base in Manesar, the entire district is expected to gain an upper hand over Noida in the National Capital Region. Managed by Haryana State Industrial and Infrastructural Development Corporation (HSIIDC), the industrial area is spread over 5,000 acres. Manesar is located on the intersection of NH-8 and the proposed Kundli-Palwal-Manesar Expressway; it is extremely well connected to both Delhi and Gurgaon. Under the integrated development plan, the residential sectors in Manesar has increased from one to four to allow the staff to stay around the industrial units and be able to simply walk to office. For developers also, Manesar has become a hot destination. 14
 Global Corridor and prposed developments along the corridor Development of Special Economic Zones (SEZs): Major SEZs are proposed around Gurgaon- Manesar area are")
114 Haryana Government has taken many initiatives to boost the economic growth of the region. Some of the major ones are described below. Kundli- Manesar- Palwal (KMP) Global Corridor and prposed developments along the corridor Development of Special Economic Zones (SEZs): Major SEZs are proposed around Gurgaon- Manesar area are Reliance Haryana SEZ (RHSEZ), Raheja SEZ, DLF Cyber SEZ, Raheja Engineering SEZ, Uppal SEZ, Emmar MGF SEZ, DLF SEZ, IREO SEZ, etc The proposed DLF Cyber city is expected to generate about 5 lakh and the RHSEZ about 23 lakh employment. 3.3 Population Population growth in the GMUC has recorded a natural growth till 1991 (135,884). Since 1991, public sector and licensed colonizers in private sector provided the thrust for achieving planned development and high population growth rates. As per census- 2001, the population was 4.2 lakhs. The estimated population for 2008, based on secondary sources for GMUC is about 16 Lakh. Density Pattern 2008 In 2001, the population density of GMUC was 1,124 persons/ sq. km. The density of the zones varies with land use such as proximity to the transport corridors, commercial centers and prime residential areas. As per the estimated population from secondary sources, the present population density has increased to about 4,400 persons/ sq. km. 15

115 3.4 Development Plan Outline The department of Town and Country Planning Department of Haryana State prepared the final development plan for Gurgaon - Manesar Urban Complex which has been approved in February The Development Plan controls the developments in GMUC area till An outline of the Development Plan is given in Part 2 of the Support Document of the IMP. As per the Development Plan 2021, the GMUC will accommodate a population of 43 lakhs. Major contributors of population growth will be the proposed world class industry specific parks and special economic zones. Density Pattern 2021 Development Plan Development Plan Transport Proposals The Development Plan prepared by the Govt., has proposed a number of transport proposals to cater to the increased transport demand. The proposals include: 90m wide road link between Vasant Kunj in Delhi and Mehrauli road in Gurgaon. 90m wide road link from Andheria Mor in Delhi to Gurgaon- Faridabad road in Gurgaon through Mandi and Gual Paheri. 16
116 150m wide road between Dwaraka to Palam Vihar in Gurgaon. 150m wide northern peripheral road and 90m wide southern peripheral road. Extension of DMRC metro lines (1) Sushant Lok Phase I and (2) Dwaraka line to Manesar and upto the KMP corridor. 3.5 Employment Gurgaon- Manesar Urban Complex is expecting a tremendous growth in employment in the next two decades. The various employment centers that are expected to generate massive employment in GMUC are: IMT Manesar: 5000 acres DLF Cyber SEZ: 20,000 acres Phase I development of RHSEZ Town center proposed by IREO SEZ in sectors 58, 59 and 61: 300 acres Raheja Engineering SEZ: 268 acres Uppal SEZ: 270 acres Emmar MGF: 13,400 acres Raheja Haryana SEZ: 5,000 acres If all these ambitious SEZs in and around GMUC will see the light of day within the stipulated time, they are expected to generate a total employment of about 50 lakhs, which is higher than the projected resident population of GMUC. Three landuse scenarios have been adopted to estimate the future travel demand of GMUC, which are explained in the next Chapter. The list of notified SEZs in Gurgaon district are presented in Part 3 of the Support Document of the IMP. 3.6 Transport Demand Based on a growth scenario called as Realistic (details are presented in the next chapter), the transport situation, with minimum intervention is shown for the year 2031 as predicted by the Transport Demand Model developed for this specific purpose. (Demand Model development is presented in Part 6 of the Support Document to this IMP). This scenario assumes that the present facilities will continue with the DMRC Delhi- Gurgaon line upto Sushant Lok Phase I and KMP corridor implemented. It also assumes that the three proposed roads to connect Delhi and Gurgaon in the Development Plan will be constructed. 17
117 It is predicted that PT share will decline further to one-third by The transport system in GMUC will be under tremendous pressure unless suitable measures be undertaken to improve mobility. The situation predicted is one that is not sustainable and in an event on not doing anything even achieving realistic projections will not happen. Peak Hour Motorised Transport Demand ( Do- minimum under realistic scenario) Mode Total (motorised) Trips Nos./% (2009) (34%) (44%) (10%) (12%) Trips Nos./% (2031) (36%) (46%) (14%) (4%) Speed (KMPH) Mobility Plan Goals The transport situation will only continue to worsen if appropriate measures are not taken. Do- minimum forecasts show network speeds of 11 kmph in 2031, a really serious and unsustainable situation. The Goals have been defined based on the Vision and the objectives of this IMP. The goals were set in consultation with GMUC and the Stakeholders. The mobility strategies (addressed in the subsequent chapter) developed will aim at attaining these goals. The goals set for Gurgaon is illustrated below. 18
118 2031 Transport Indicators Indicators Do Nothing Benchmark Average Journey Speed 11 Kmph 30 kmph Public Transit Share (motorised) 4% 70% Walkability (Footpath Length / Road Length 5-10% 100% Cyclability (Cycle path Length / Road Length 0% 30-50% Fatality Index (Fatalities/ Lakh Population) 20+ Reduce by 50% On- Street Parking Index 30-50% 0-5% Non-Motorized Travel Index 15-20% 30-50% Emissions/hr (per square km) 5 kg Reduce by 50% 3.8 Stake Holder Meeting A meeting has been conducted with the objective of bringing together the decision-makers and stakeholders to elicit their views and opinion on the mobility plan vision and the proposals in the Draft Mobility Plan. Appropriate suggestions from the stake- holders have been included in the Final IMP. Important proposals from stake holders are as follows: Provision of Vehicular Subways in front of MGF Mall and Lifestyle Mall, Sector Master Plan Road and 55/56 T point, Iffco Chowk, South City Chowk, Sector 31 T point, Rajiv Chowk, DLF SEZ, In front of Infinity Tower and Cyber Green, Shankar Chowk, Hero Honda Chowk, Islampur, Badshahpur, Bhondsi, etc. Providing Pedestrian Subways at Cyber City Sector Road, Badshahpur, Islampur, DT City Centre, Sahara Mall, Hero Honda Chowk, Mahavir chowk, Agrasen chowk, Dakkhana (Post Office) Chowk, Sohna Chowk. Provision of Parking Lots at Jail Ground, Goushala ground, In front of hotel Gruvi, Sikanderpur power station, Rehdi market - jail ground, Nehru park. Providing Bus shelters/ bays on major roads. Improve drainage system to avoid water logging on main roads. Removal of Illegal hoardings and ban Mobile Display vans. Strict enforcement to control cycle rickshaws, road side vendors and hand carts. Provision of road markings and signage. Closure of median openings at critical locations. 19
119 Signalization at major intersections. To set up multi-level parking lots at three main city areas near the mini Secretariat, the Sector-29 commercial complex and on Kaman Sarai on Sohna road. To develop seven multi-level parking lots at Sectors 10, 29, 43, 47, 48, 52 and the City Centre before Commonwealth Games
120 Chapter 4 Mobility Plan Strategies 21
121 Solutions for GMUC transport improvements cannot be achieved by a single strategy. The mobility goals for GMUC will need to be addressed through a multipronged approach. The following strategies need to be adopted in tandem to meet the various goals set for GMUC. I. Land Use and Transport Strategy II. Mobility Corridor Strategy III. Public Transit Strategy IV. Non-Motorized Transport Strategy V. Freight Management Strategy VI. Traffic Engineering Measures VII. Travel Demand Management Strategy The complex transport situation needs a multi pronged approach All the listed strategies are equally important and the order of listing does not imply priority. Each of the broad strategies includes sub- strategies of immense importance. The strategies when implemented through specific projects shall fulfill the goals and objectives of the IMP. The sections below discuss these strategies. 4.1 Land Use and Transport Strategy Considering the anticipated growth in GMUC in the future, the expected population and employment has been projected under three scenarios namely, Aggressive scenario, Moderate scenario and Realistic scenario. In the Aggressive scenario, all proposed SEZs are expected to come up within the stipulated time, while Moderate scenario assumes a lesser growth of the SEZs, compared with the Aggressive scenario. The Realistic scenario assumes a very low growth keeping in view the global economic meltdown. Aggressive Moderate Realistic All proposed developments in and around GMUC will see light in the stipulated time GMUC Population projected for 2021 is in accordance with projections by revised DP and additional 6 lakhs in the nodes around GMUC Only 50% of the developments will see light in the stipulated time GMUC Population projections are accordance with projections by Water Supply Dept. and additional 6 lakhs in the nodes around GMUC 15% of proposed growth nodes (outside GMUC) would only happen keeping in view the economic meltdown GMUC Population projected for 2021 that is 43 lakhs would happen only in
122 Population and employment projected under the three mentioned scenarios are presented below. The major employment centers and the expected population and employment in GMUC area in the future under the three scenarios are presented in Part 4 of the Support Document of the IMP. Various assumptions made under the three scenarios and the zonewise population and employment projections are detailed in Part 5 of the Support Document of the IMP. Scenario Population Aggressive 4,934,000 6,635,000 Moderate 4,292,000 5,787,000 Realistic 2,241,000 4,312,000 Employment Aggressive 4,998,000 5,919,000 Moderate 3,251,000 3,892,000 Realistic 1,024,000 1,850,000 The work participation ratio under aggressive scenario is worked out to be above 1.0, while that has come down to 0.75 and and 0.45 for moderate and realistic scenarios respectively. In all cases, the ratio is higher than the national average and hence the corresponding travel demand will be huge. 4.2 Development of Mobility Corridors By designating certain roads as mobility corridors, the transport corridors get priority for increasing the throughput as well as congestion would then be focused and appropriate solutions would be identified. Experience indicates that as speeds of public transport vehicle reduce, travel times increase to such an extent that commuters look for personalized modes of travel. In addition to the user travel preferences the road design and operations also have a bearing on traffic congestion. Congestion results in lower speeds for all vehicles and more so for public transport vehicles. In essence, a mobility corridor maximizes throughput of people focusing on mass transport and NMT, rather than vehicular traffic In essence, a mobility corridor maximizes throughput of people focusing on mass transport and NMT, rather than vehicular traffic 23
123 The mobility corridor plan is supplemented with an extensive bi-cycle network that is both interconnected and continuous that reinforces and feeds into the public transport corridors. As it is of utmost importance that every road must have a walkable and usable footpath and no separate footpath plan is provided. For an efficient passenger dispersal system from the public transport corridors, at-grade/grade separated pedestrian crossings are planned. In order to improve the mobility of the corridors and pave way for the public transport corridors an effective parking management plan that complements the corridor plan is identified. The above strategy is sought to be implemented through the following broad approach: Identification of a number of trunk mobility corridors along which low/medium/high capacity public transport systems would be considered based on a scientific and detailed alternatives analysis. The mass transport system to be integrated with the DMRC proposed plans. This will enhance the connectivity with Delhi. Providing alternative routes to bypass certain area. For this purpose, ring Priority for through traffic Interconnected Signals Min. 4 ln, Des. 6-8 ln Continuous Footpath & cycle lanes Restricted on-street parking Strategic paid off-street parking Service lanes Turning lanes PT corridors Bus bays FOB/Subways Inner Ring & Outer ring corridors have been suggested to enable the core city area to be bypassed. Providing bypass routes for long distance commuter and truck traffic so that they do not have to travel through the city roads. Providing network/systems to connect the newly developing areas in and around GMUC. Providing a network of dedicated cycle tracks, footpaths and safe pedestrian crossings. Providing flyovers/under passes in heavily congested junctions/intersections to reduce idling traffic. The framework for the urban transport network strategy has been evolved for the three scenarios separately for Aggressive, Moderate and Realistic scenarios in the following manner: 24


124 4.2.1 Aggressive: Option 1_ Ring In this scenario, we assumed that all SEZs proposed will see light of day and hence the pressure on the network will be even more intense. Consequently, the mobility network has been developed considering the following: Improvement of existing transport network Connectivity to Delhi and to the newly developing areas in GMUC. Connectivity to Delhi, to the newly developing areas in GMUC and two ring roads such as Inner ring and Outer ring to connect various areas in GMUC. Connectivity to Delhi, to the newly developing areas, two ring roads and strong connectivity to the proposed developments outside GMUC. 25
.")
125 4.2.2 Aggressive: Option II_ Grid Network Another option of development of a network is in the Grid Manner. This has been tested under Aggressive scenario'. The two options have been tested using the transport demand model and a comparison has been made (year 2021). Option 1 (with ring development) is found better performing than option 2 (with grid network). The ring network is generally adopted as the preferred network development approach. Mode Ring Option Grid Option Total (motorised) peak hour trips Speed (KMPH) (12%) (18%) (5%) (65%) (14%) (19%) (7%) (60%)
126 4.2.3 Moderate and Realistic Strategy In the moderate strategy, the very ambitious plans of the private sector are limited to the present approved plans and only an employment of 32 lakhs by the year 2021 is planned, while in the realistic scenario assumes only 10 lakhs employment by 2021 taking into account the global economic meltdown. Mobility corridors which essentially serve on public transport corridors based on the demand warrant have been considered for establishing: Improvement of existing transport network. Connectivity to Delhi and to the newly developing areas in GMUC. Connectivity to Delhi, to the newly developing areas in GMUC and two ring roads such as Inner ring and Outer ring to connect various areas in GMUC. Connectivity to Delhi, to the newly developing areas, two ring roads and connectivity to the proposed developments outside GMUC. The phasing of the mobility plan have considered the development of the strategy based on the moderate land use with the clear direction that along with the moderate developments in the realistic scenario being approved and the systems selected need upgradation. 27
127 The transport demand as predicted by the model for the year 2021 under the two scenarios is presented below. Mode Moderate scenario (14%) (21%) (7%) Realistic scenario (15%) (18%) (6%) (58%) (61%) Total (motorised) peak hour trips Speed (KMPH)
 is generally very high.")
128 4.3 Public /Mass Transit Strategy Volume to capacity ratios on the major roads connecting Delhi to Gurgaon (MG road and Old NH road) has already crossed 1 and need urgent attention. Also the predicted volume to capacity ratios of major corridors within Gurgaon (realistic scenario- 2031) is generally very high. Road Realistic scenario V/C Ratio at Level of service C Speed (Kmph) Old NH Pataudi Road Basai Road MG Road Faridabad Road Sohna Road Khandsa Road Operating buses in the kind of a congested network will be very difficult. However, to meeta norm of 20 buses per lakh population, GMUC will require about 300 buses. The requirement of mass transport system has been tested with the transport demand for 2011, 2021 and It is expected that the Passenger per Hour per Direction (PPHPD) in the transit network, along many of the major corridors, would be more than PPHPD. Bus augmentation alone will not be able to cater to the increased public transit load. The strategy for Public Transport improvement hence will be: Introduction of an organised bus transport immediately. Higher Order Mass Transit System in the future Introduction of bus transport on existing corridors Higher Order Mass Transit System for the future Higher Order Mass Transit System Strategy Public transport corridors for BRT/LRT/Mono-Rail or Metro are presented here. These corridors can be on existing transport network system either at grade or grade separated, depending upon the right-of-way (RoW) available. Various parameters such as performing capacity, geometric constrains, capital & operating costs, alternative 29
129 analysis etc. would determine the mass transit option on a corridor. Comparison of different types of transit systems is presented below. It provides a preliminary guidance in deciding upon the type of system to be selected for a city. Transit Mode Commuter Rail Metro Monorail ROW Options Station Spacing (Km) Vehicles Exclusive ROW General railroad Mixed traffic Exclusive ROW Grade separated Exclusive ROW Grade separated Light Rail Transit Exclusive ROW Semi-exclusive Mixed traffic lanes Bus Rapid Transit Exclusive ROW Semi-exclusive Mixed traffic lanes 3 to to to to 1.5 Locomotive with set of passenger coaches High platform cars operating in multiple car trains sets High platform cars operating in multiple car trains sets, electric propulsion Articulated, double articulated low floor, can operate in multiple car sets, electric propulsion Seated Capacity per car per car per car per car Standard, articulated or double articulated, low floor or high platform, diesel, diesel/hybrid propulsion or ETB 40 standard 65 articulated 85 double art. Average Speed kmph kmph kmph kmph kmph Passenger throughput > 40,000 PPHPD Up to 40,000 PPHPD Up to 20,000 PPHPD Up to 20,000 PPHP Up to 8000 PPHPD Min. Curve Radius App O & M Cost per km App Capital Cost per km (2008 Rates) Implemented Cities (International) Implemented Cities (India) 50m 40m 75m 25m 13m Lakh Lakh Lakh - MRL Lakh Crores 200 Crores Crores 100 Crores 15 Crores Moscow, Jakarta, Johannesburg, Buenos Aires Mumbai, Chennai, Kolkata, Hyderabad Bangkok, Kuala Lampur, Mexico City, Cairo Tokyo, Kuala Lampur, Sydney, Seattle Delhi, Kolkata - - Istanbul, Taipei, Leeds, Bogota, Hongkong, Shangha Curitiba, Kuala Lampur Pittsburgh, Adelaide Indore, Pune, Delhi, Ahmadabad 30


130 4.4 Non- Motorized Transport Strategy Though the Non- motorised transport (NMT) trips in Gurgaon is significant, the facilities are totally inadequate. NMT strategies focuses on the following: Provide footpath on entire road network and cycle lanes on mobility corridors Provide adequate walkway widths. Maintain foot path surfaces. Prevent vendors, pavement dwellers, vehicle parking and other uses from blocking footpath. Establish connected walking networks. Bicycle lane on all mobility corridors Foot path on entire road network of GMUC. Create bicycle lanes, where bicycles composition is high and on mobility corridors. Integrate cycling with transit. Provide bicycle parking/rickshaw stands. Address security concerns of pedestrians and cyclists Develop /encourage bike rentals/sharing 31

131 4.5 Freight Management Strategy The industrial growth of Gurgaon and Manesar area and the development of KMP corridor demand a suitable freight management strategy for GMUC. Various strategies of increasing the efficiency of freight and commercial transport in Gurgaon include: Route management of cargo Movement between Manesar and Airport Develop Freight Terminals. Use of small and medium size vehicles with modern emission controls in the central city areas. Restricted delivery times in central business districts (8 AM -8 PM prohibition) 4.6 Traffic Management Traffic Engineering and Management must be given high priority in Gurgaon. The strategies are intended to improve the traffic situation without extensive investments. Key measures include: Intersection redesign Traffic control devices Traffic signs and markings Parking management Area Traffic Control (ATC) and ITS, etc Intersection Redesign Road intersections present not only safety problems as accident rates are usually higher at intersections than at other sections of the road. But the capacity and efficiency of the road network is dictated by the intersections. Significant capacity enhancement could be achieved by redesigning the junctions by proper channalization, turning restrictions and phasing. It is imperative that all intersections need to be optimised and maintained at optimum throughput levels. 32


132 4.6.2 Installation of Traffic Control Devices Traffic Signals Will have the following advantages: Provide for the orderly movement of traffic. Increase the traffic-handling capacity of the intersection. Reduce the frequency and severity of certain types of accidents, especially right-angle collisions. Are used to interrupt heavy traffic at intervals to permit the pedestrians to cross the road. As a strategy, every important junction in GMUC must be provided with traffic signals Traffic Signs and Markings Proper signs must be installed at appropriate locations. All the traffic signs should be facilitated as per the guidelines provided in IRC publication Code of Practice for Road Signs. One of the key deficiencies observed on GMUC roads are the absence of road markings. Road markings are not only a very important safety device, but also serve in beautifying the road. Another key element that must be given appropriate importance is street furniture. It includes benches, bollards, post boxes, phone boxes, streetlamps, street lighting, traffic lights, traffic signs, bus stops, dust bins, taxi stands, public lavatories and fountains and memorials Parking Management One of the visible problem that one beholds when visiting Gurgaon is heavy and haphazard on-street parking. Following measures could be adopted to improve the situation: Parking bays should be marked properly Auto rickshaw parking need to be provided at designated locations In order to handle the parking issue on a medium/long time frame, multi-storied parking lots are essential. 33


133 4.7 Travel Demand Management Strategy Planning of higher order transport systems on the mobility corridors may increase the anticipated public transport share in the order of about 60 percent. To further increase public transport modal shares additional demand management interventions can be implemented. The most common strategies widely used across the globe and are potential candidates to be used in Gurgaon are described briefly. They are: Congestion Pricing Parking Control Congestion Pricing: Congestion pricing refers to road pricing used as a mobility management strategy to reduce traffic congestion. Congestion pricing requires time-variable tolls, with higher charges during peak periods and lower or nonexistent when roads are non-congested. Cordon pricing, area wide licensing policy and parking charges are means by which congestion pricing can be enforced. Road pricing should be implemented in conjunction with improved transportation options, so consumers have viable alternatives. Congestion pricing needs to be used strategically in the core business areas in the study area. Congestion Source: Parking Control: Demand Management through restricted parking supply or imposing restriction of vehicles in core areas like Sadar Bazaar area, MG Road area etc using methods such as odd or even number plate entries on certain days will discourage use of private vehicles and increase public transit share. 34
134 Chapter 5 Mobility Plan 35
135 C:\WINDOWS\Deskto p\cept LOGO ( bw).jpg KASTURBHAI LALBHAI CAMPUS, UNIVERSITY ROAD, NAVRANGPURA, AHMEDABAD PHONE : FAX : Integrated Mobility Plan for Gurgaon- Manesar Urban Complex Based on the aforementioned framework of the plan and the strategy for achieving the vision under realistic scenario, mobility plan elements are summarized as follows: I. Mobility Corridor Plan II. Public Transport/ Mass Transport Plan III. Non- Motorized Transport Plan IV. Flyovers/Under pass Plan V. Passenger and Commercial Terminal Plan VI. Traffic Management plan VII. Travel Demand Management plan VIII. Road maintenance & Management Plan The plan elements are detailed in the following sections. 5.1 Mobility Corridor Plan The proposed mobility corridor plan consists of radial road network complemented with circumferential roads to form a radial and ring pattern of the road network. Two circumferential rings have been envisaged in the study area. The mobility corridors cover about 200 kms of road network The first ring would utilize the existing Mobility Corridor (6 lane) sections of the road and encircle the core area. Traffic not CYCLE PARKING 750 PATH destined to the core 6000 SERVICE LANE 3000 PARKING 750 FOR TRUCKS/ UTILITIES/ GREEN AREA 7000 CARRIAGEWAY 2500 FOOTPATH 250 Shyness Strip 7000 MEDIAN BUS LANES 2500 FOOTPATH 250 Shyness Strip 7000 CARRIAGEWAY 3000 PARKING 750 FOR TRUCKS/ UTILITIES 6000 SERVICE LANE 2250 PARKING/ 750 DRAIN C P area can utilize this AS SUBMITTED IN REPORT 1 (CORRIDOR IDENTIFICATION AND ASSESSMENT) 60M ROW BUS LANE CARRIAGE WAY CYCLE TRACK PEDESTRIAN PATHWAY Inner ring to bypass the core area thereby relieving congestion in the old city and vicinity. The second ring would be an outer ring. The proposed Northern C L OF ROAD TYPICAL SECTION FOR 30M ROW ROAD WITH MEDIAN BUS LANES 1.5% 1.5% PEDESTRIAN PATHWAY/ PARKING/ DRAIN DRAIN connecting link linking the two at the Delhi side. 36 Shyness Strip Shyness Strip KERB & KERB & INLET / OUTLET INLET / OUTLET KERB & INLET PARALLEL CARRIAGEWAY FOOTPATH Mobility MEDIAN BUS Corridor LANES FOOTPATH (8 lane) CARRIAGEWAY PARALLEL PARKING/ PARKING/ UTILITIES UTILITIES AS SUBMITTED IN WORKING PAPER ON ROADWAY DESIGN 40M ROW peripheral road and Southern Peripheral road in the Development Plan with a new C L OF ROAD CENTRE FOR ENVIRONMENTAL PLANNING AND TECHNOLOGY 1.5% 1.5% PEDESTRIAN PARKING/ PATHWAY/ DRAIN DRAIN
136 The mobility corridors cover about 200 kms of road network. The proposed mobility corridor network is presented below. Proposed Mobility Corridors 5.2 Corridor Development The road network in GMUC proposed for improvement is presented below. The network includes the mobility corridors also. The existing network consists about 340 km, which needs widening in the future. New links constitutes about 250 km, which need to be developed during various phases. The road network to be developed is presented below. Based on DP (2021) network Total road Length kms Existing Links -340 Kms New Links -250 Kms 37

137 Future Road network of GMUC 5.3 Flyovers/Underpass Plan It is important to recognize that in a developing economy and more so in a city like Gurgaon, which is facing rapid population growth, travel demand will only increase. This means that the number of vehicles is unlikely to go down compared to present levels. However, initiatives that work towards channelizing the growing demand towards public transport and non-motorized modes will go a long way in slowing down the rate of vehicular growth. Any effort at building grade separated cross-over must be simultaneously accompanied by vastly improved public transport and NMT infrastructure. It is therefore, recommended that if flyovers are taken up at any intersection, they must be preceded by a thorough evaluation of alternative options and only after all such options have been carefully analyzed should a flyover be considered. 38
138 The possible alternatives to relieving the congestion at a traffic junction are the following: 1. Reducing the number of traffic light phases. 2. Restricting the right turns at the junction by suitably re-routing through indirect right turns or U-turns. 3. Widening the intersection throat to increase the approach capacity. 4. Coordination of traffic lights on an adjacent intersection to allow minimal haltage along with a mobility corridor. It is only after all the above options are considered and found inadequate that flyovers should be thought of. In addition, the IRC warrants for provisioning of grade-separated also need to be checked. It would be necessary to prepare feasibility studies for each of them taking into account the discussions above and a full perspective the flyover s impact on the mobility corridor that it lies on. Based on the present traffic analysis and proposed network mobility, 23 grade separated junctions are proposed. The locations are given below. 1.IFFCO Chowk 2.Rajiv Gandhi Chowk 3.Shankar Chowk 4.Sikanderpur Chowk 5.Manesar Chowk 6.Hero Honda Chowk 7.Sethi Chowk 8.Outer ring road with Sohna road 9.Outer ring road with NH8 road (2 junctions together) 10.Outer ring road with Pataudi road 11. Outer ring road with Basai road 12. Outer ring road with Old Gurgaon road 13. Outer ring road with NH Outer ring road with MG road 15. Outer ring road with Faridabad road 16. Outer ring road with road to Sushant Lok PH III 17. Outer ring road with sector 56,57, 61 and Outer ring road with sector 50,57, 65 and Outer ring road with sector 70,71, 75 and Outer ring road with sector 83, Outer ring road with sector 88 and Outer ring road with sector 103,104, 105 and
139 23. Outer ring road with sector 2,23, and 111 HUDA proposes that the Northern Periphery Road (NPR) and Southern Periphery Road (SPR) should be signal free corridor (ie; the outer ring road as proposed in the IMP). Additionally, a number of flyovers are proposed by HUDA. They are also considered as candidate locations for grade separators. The additional locations are: 1. Junction of sector 29 and 27/43 2. Junction of sector 27/28 and DLF phase 1 3. Junction of sector 27/43/42 and DLF phase 1 4. Junction of sector 43/42/53 and Junction of sector 49/50/65 and 66 on Outer ring road (SPR) 6. Junction of sector 69/70/71 and 72 on Outer ring road (SPR) 7. Junction of sector 33/38/47 and Junction of sector 38/39/46 and Junction of sector 45/46/51 and Junction of sector 74A/76A and NH8 11. Junction of sector 74A/74/76A and 75 on Outer ring road (SPR) 12. Junction of sector 77/78/83 and 82A 13. Junction of sector 81A/82A/78 and Junction of CPR and Outer ring road (NPR) 15. Junction of sector 101/102/103 and 104 on Outer ring road (NPR) 16. Junction of sector 105/106/109 and 110 on Outer ring road (NPR) 17. Junction of sector 110/110A/112 and 113 on Outer ring road (NPR) 18. Junction of Manesar sector 1/1A with NH8 The proposed facility is presented in Project Profile section of Chapter 6. As already stated, the construction of flyovers/underpasses will be undertaken after a detailed feasibility study at each location. 40
140 5.4 Public Transport/Mass Transport Plan Introduction of Bus System As no organised public transport is available in Gurgaon (though Govt. has initiated with 40 CNG buses), presently served mainly by intermediate public transport like mini buses and shared Auto, as a start up solution, bus corridors (bus based mixed traffic public transport) are planned in the city connecting major economic centers. Current requirement of Bus fleets: 300 Provision of bus shelters and bus bays Public Transport Scenario Mode Trips Nos.% Calibrated urban transport model is used to simulate the traffic characteristics under this scenario for the year It may be seen that as anticipated the public transport modal share increases from 10% to 24% under this scenario. Based on this it would require a fleet of at least 300 buses in (29%) (38%) (9%) (24%) Total (motorised) peak hour trips Speed (KMPH)
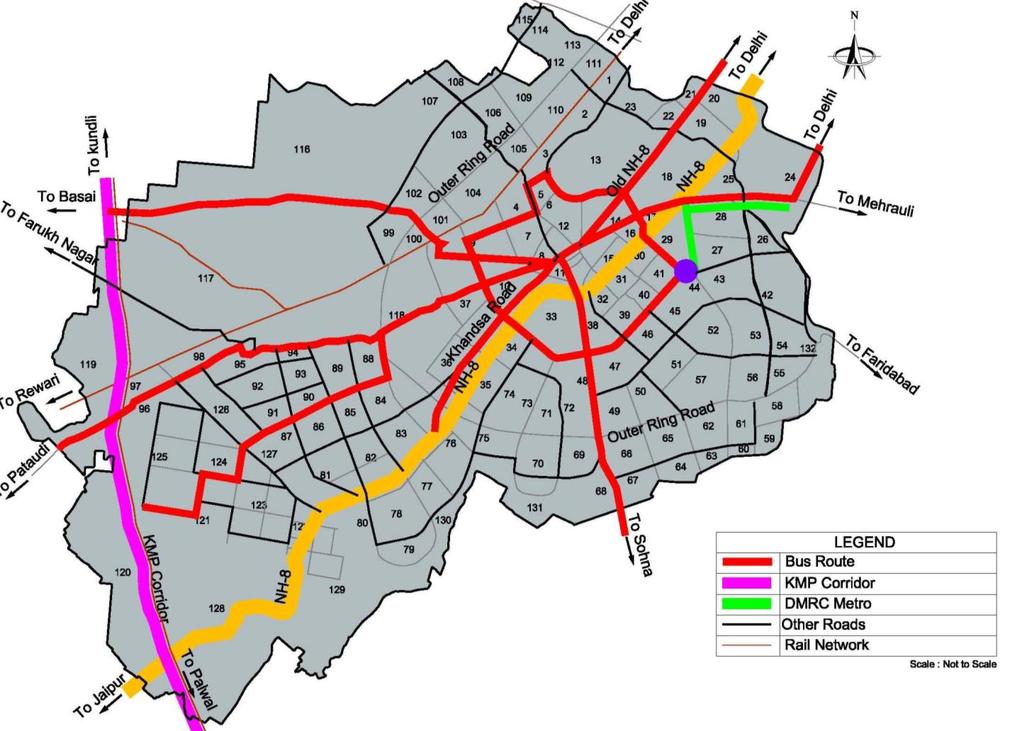
141 42
142 5.4.2 BRT Based Public Transport Plan The traffic flows of the corridors, future growth centers and the transport model were used to identify various public transport corridors. PPHPD on major corridors under realistic scenario is presented below. Name of the road Transit PPHPD Inner Ring Road 7500 Old NH Khandsa road 8900 Palam Vihar road 8600 Mehrauli Road Manesar road 9100 Sohna road 8800 The six routes thus identified (except Mehrauli road), adding up to about 74 km in length as listed below are recommended for BRT operations. Though Mehrauli road has the highest PPHPD, no BRT is proposed on this road as metro (DMRC) is under construction and will be operational by Identified BRT Corridors- Length (in Sl. No 2011 Kms) 1 Inner Ring Road 25 2 Old NH8 9 3 Khandsa Road 5 4 Palam Vihar road 6 5 Manesar road 19 6 Sohna road 10 Total 74 Trip characteristics under BRT plan for 2011 is presented below. Implementation of BRT on these corridors will increase the PT share further to 30%. 43
 peak hour trips 148100 Speed (KMPH) 25 BRT Routes Proposed for 2011")
143 Public Transport Scenario: BRT Mode (28%) (35%) (7%) (30%) Total (motorised) peak hour trips Speed (KMPH) 25 BRT Routes Proposed for
144 5.4.3 High Speed High Capacity Mass Transit System Plan The PPHPD predicted for various major corridors by the model for 2021 is presented below. Name of the road Transit PPHPD: 2021 Inner Ring Road Old NH Khandsa road Palam Vihar road Mehrauli Road Manesar road Sohna road Golf Course road In addition to low capacity (BRT) corridors, possible medium (LRT/monorail) and high capacity/high speed Mass Transit System (Metro), are recommended for implementation on appropriate corridors. The criteria for selecting the corridors are: Public Transport PPHPD Total trips Right of Way Mobility Corridor Connectivity to Delhi Connectivity to growth centers Type of Transit System for various systems is presented below. Name of the road Inner Ring Road Old NH8 Khandsa road Palam Vihar road Mehrauli Road Manesar road Sohna road Golf Course road Type of Transit System Low/Medium Capacity Low/ medium Capacity High Capacity Low/ medium Capacity High Capacity Low/ medium Capacity Low/ medium Capacity Low/ medium Capacity Mehrauli road has the highest PPHPD, which require high capacity system. The DMRC metro will be able to cater to the higher demend on this road. 45

145 Mass Transport Plan under Realistic scenario A comparison of the traffic on mobility corridors in GMUC under do- nothing scenario and with the mass transport projects recommended in IMP is presented below. The proposed mass transit options will reduce about 25% to 40% of traffic on these corridors. These mobility corridors are proposed with minumum 6 lane carriageway width for traffic on the road and will be able to cater to the estimated traffic demand on the road. 46
146 Do- nothing Road In Vehicles TW Car AR Bus Mass Transit PPHPD Khandsa road upto KMP corridor Inner ring road Old NH Golf course road Sohna road Mehrauli road Manesar Road Khandsa road upto KMP corridor Realistic Strategy In Vehicles TW Car AR Bus Mass Transit PPHPD Type of Transit System High Capacity Inner ring road Low/ Medium Capacity Old NH Low/ Medium Capacity Golf course road Low/ Medium Capacity Sohna road Low/ Medium Capacity Mehrauli road High Capacity Manesar Road Low/ Medium Capacity 47
147 The urban transport model was used to forecast the travel characteristics under this option and the results are shown below. The suggested transport plan with mass transit systems would augment the public transport share from 24% in 2009 to 61% in The proposed mass transport scenario is presented below. Public Transport Scenario: Mass transit Mode (15%) (18%) (6%) (61%) Total (motorised) peak hour trips Speed (KMPH)
148 5.4.4 Mass Transport Plan under Moderate Scenario The mass transport plan developed under Moderate scenario is presented below. Mass Transport Plan under Moderate scenario 49

149 5.4.5 Mass Transport Plan under Aggressive Scenario The mass transport plan developed under Aggressive scenario is presented below. Mass Transport Plan under Agressive scenario Complementary Proposals There are other complimentary projects/proposals that must be implemented in tandem to the public transport corridors towards a successful public transport system that meets the objectives and goals of the mobility plan: Augmentation and strengthening of feeder service network Integrate parking with public transit/mass transit terminals by way of park and ride structures 50
150 Identify and locate multi -modal terminals for safe, faster and convenient inter-modal transfers Appropriate vehicle and terminal design Safe, faster and convenient pedestrian dispersal system Bicycle access to the public transport terminals Public transport friendly tax structure Use of Intelligent Transport System (ITS) technology Signal prioritization for public transport vehicles It is important that the above mentioned actions must not be treated in isolation but a systems approach be adopted. 5.5 Non- Motorized Transport Plan As part of NMT plan, to ensure more and safe NMT trips, following measures are suggested. Provision of foot path Safe pedestrian crossing facilities (at grade and grade-separated) and Non- motorised vehicles lanes Install Footpaths The road network proposed with foot path is presented below. Foot path corridors include the proposed mobility corridors also in the GMUC. It is proposed to have foot path on about 500 kms of road length in GMUC. 51
151 Proposed Foot Path Plan About 500 kms of road network is proposed for foot path installation. 52
152 5.5.2 Install Bi-cycle Lanes Several trips upto a trip length of 3-4KM are made through bi-cycle. To encourage and cater to cycling trips, dedicated bi-cycle lanes must be provided on strategic routes. Cycle lanes to be provided on all roads that have high share of bi-cycle traffic as well as on those roads that constitutes the draw area for the proposed mobility corridors. Development of this network must be integrated along with public transport network improvements. The cycle master plan layout is shown below. The cycle tracks are proposed in about 210 km of road. About 210 kms of road network is proposed with bi-cycle lane installation. Proposed Bi-cycle plan 53
153 Typical cross section of 3 lane four lane and 6 lane road with cycle tracks and foot path is presented below. 54
.")
154 5.6 Passenger Terminal Plan To cater to the higher public transport demand in future, following recommendations are made: Shift the present bus terminal to the city outskirts. The inter-state and inter-city services are proposed from the terminal along with the inter- modal transfer facility proposed in the Development Plan on outer ring road near NH8 (sector 83). This facility will have city bus terminal also. Additional city bus terminals are propsed along with two inter- modal transfer terminals proposed in HUDA Sector 29 and in sector 121. The HUDA sector 29 bus stand is proposed in 3 acres. Feasibility study for bus stand development at sector 29 is going on. Proposed bus terminal locations 55
155 Since these terminals are proposed along with inter-modal transfer facilities, provision for parkand-ride system will be available. The proposed bus terminal locations are presented below. 5.7 Frieght Management Plan Truck terminals are proposed in Gurgaon at: near Maruti Udyog near Old Gurgaon road (sector 19), and two locations in Manesar (one along the Outer ring road (sector 88), and another location in sector 128). Major benefits of the terminal are the reduction in truck traffic on city roads and roads and market yards. The truck terminals also serve as job-growth and economic catalyst for the area. The proposed truck terminal locations are presented below. Proposed truck terminal locations 56
156 Cargo Movement between Manesar and Airport: NH8 is the main corridor connecting Manesar and the airport which will continue to serve in the future also. The two toll plazas on NH8 section between Manesar and airport have facility to accommodate MAVS. Manesar is located between NH 8 and the proposed KMP corridor. Hence connectivity to the airport is also possible through the KMP corridor in future. It is recommended to include proper connectivity to airport from NH8 and KMP corridor in the airport master plan. Impact of Proposed KMP Corridor on Commercial Vehicle Movement: OD survey conducted at the toll plaza on NH8 section near Manesar revealed that about 10,000 commercial vehicles are crossing the toll plaza in a day. About 20% of these vehicles are bound between Gurgaon and places south to Gurgaon, while 10% bound from/to Delhi and remaining 70% is bound from/to places outside of NCR. This 70% traffic, bound from/to places beyond NCR, might shift to the proposed KMP Corridor from the NH8 in the future. Also the Delhi bound traffic may shift to the KMP as Delhi is connected with KMP through various NHs and SHs. To study the true impact, a detailed study is needed by comparing the benefits and costs (including toll) on both NH 8 and KMP. 5.8 Development of RoBs/RuBs Gurgaon has its railway station located at the extreme corner of the city and hence the patronage of intercity commuters is negligible. Gurgaon residents mostly depend on railway stations in Delhi or Faridabad (on Delhi-Mumbai/Chennai track) for long-distance travel. There are eight local passenger trains passing through Gurgaon daily. These trains have stops in Gurgaon. Based on the information collected from the railway in Gurgaon, about 1500 passengers are commuting through these local trains daily. A new railway station on Basai road is under planning. There are three level crossings present on Delhi-Mumbai/Chennai track. But they are located at the outskirt of the city and with less traffic crossing at the level crossings. This excludes the RoB under construction on Basai road. Elimination of these level crossings will be considered in the long- term perspective. 5.9 Traffic Management Measures Following recommendations are made as part of short-term traffic engineering measures: Intersection redesign Development of footpath cum drains Pedestrian crossing facilities Parking management 57
157 Public Transport Plan Bicycle lanes Existing Market traffic improvement Regulation of Auto rickshaws Cycle rickshaw regulation Enforcement The proposals made in these areas are presented below Intersection Redesign Topo survey was done on the major junctions to assess the present features of the junctions. As part of primary data collection, junction count were carried out for 11 junctions and peak hour junction turning count details are presented in Support Document of IMP Part 1. It was observed that the junctions lack proper traffic management measures. The issues in management and recommendations specific to each junction are presented below. All traffic movements avaialble at the junctions have been retained after the improvements also. Similar improvements need to be provided at other critical junctions on major corridors. List of the junctions require similar improvemnts are presented in Project profile Section of Chapter 6. In general, the benefits accruing from these improvements are: o o o o Improved discipline at the intersections by streamlining of traffic Impartial right of way for traffic entering the intersections by way of signalization Reduced waiting time for vehicles resulting in time savings, vehicle operating costs and Improved speed on the downstream sides of the intersections 1. IFFCO Chowk: The junction is a 4-arm junction on NH8 formed by the intersection of the service roads on NH8 with M-G Road. The intersection is controlled by a four phased signal. Most of the approaches are three lanes. Just 300m east of the junction is another T-junction formed on NH8. The junction is designed with the following improvements; Restriction of through and right turn movements from the north-west approach (approach from Sukhrali Chowk i.e., southbound direction). Only the left turn movements are 58
158 allowed from this approach. The restricted movements are handled indirectly through the intersection east of the approach. Closure of selected U-turns Improved design of the channelising islands for the left turn traffic from NH8 into M-G Road on the south side of the intersection. Installation of pedestrian crosswalks Designation of Auto Parking Stand within the large channelising island. Improved phase and cycle lengths for the signal to account for the reduction in the signal phases. Improved signages All these improvements can be accommodated within the existing right of way and consequently no land acquisition is envisaged at this time. The intersection can continue to operate as signalized traffic junction until a grade separation alternative is implemented. The improvement measures recommended for the Junction is presented below. 59
159 2. Matha Mandir Junction: The junction is a 3-arm junction near the Mata Mandir. The junction is formed by the intersection of Atul Kataria Road and Road from Fountain Chowk. The intersection is unsignalized. Atul Kataria approach is a 4-lane wide approach whereas the Bus-Adda Road is 2-lane approach. The issues at this junction are narrow approach, improper turning radius, absence of signs and markings, etc. The junction is designed with the following improvements: Widening of the approaches at the intersection area to increase capacity Installation of a channelizing island for left turning traffic towards Mata Mandir Installation of a non-motorized lanes Installation of pedestrian crosswalks Improved turning radius for the traffic movements Restriction of parking at the intersection area. Improved signages These improvements can be accommodated within the existing right of way and consequently no land acquisition is envisaged. The junction warrants signals and recommended to upgrade to signallised junction in the near future. The improvement measures recommended for the Junction is presented below. 60
160 3. Prakashpuri Chowk: The junction is a 4-arm junction on Railway Station Road. The intersection is unsignalized with a traffic circle. Most of the approaches are two way with two lane approaches. The west side of the south approach has a 3.5 m wide service lane opening into the intersection area. The junction is designed with the following improvements: Widening of the approaches to the traffic circle to increase capacity Increased circling carriageway width Installation of a non-motorized lane on the approaches Installation of pedestrian crosswalks Improved turning radius for the traffic movements Improved signages These improvements can be accommodated within the existing right of way and consequently no land acquisition is envisaged at this time. The intersection can continue to operate as an unsignalized traffic junction but with police control during peak hours. The improvement measures recommended for the Junction is presented below. 61
161 4. Fountain Chowk: The junction is a 4-arm junction on Gurgaon Bus Stand road. The junction is a very wide junction with very large channelizing islands. Traffic from the bus stand can only turn left on to Old Delhi Road. The junction has large number of pedestrians and vehicles using the junction. 6-Seater auto rickshaw (share auto) stand exists on the west side of the junction. Traffic from New Railway Station Road currently turn left only and must make a U-turn at Fountain Chowk to go towards Basai Chowk. The junction is designed with the following improvements Installation of one-way traffic circulation around the Fountain Chowk island Widening of the approaches around the Fountain Chowk to increase capacity Utilization of extension of the New Railway Road south of Sadar Bazaar Road to form a part of the one-way traffic circulation Installation of one-way traffic circulation for the traffic arriving from Basai Chowk. Installation of non-motorized lanes Installation of pedestrian crosswalks Improved turning radius for the traffic movements Relocation of share auto parking stands so they do not interfere with intersection operations Provision of wider footpaths on the bus stand side of the junction Improved signages and Improved opportunities for U-turns Redirect Delhi & Mehrauli destined buses from the bus stand towards Mata Mandir Chowk so that the intersection congestion will be reduced. Also the signal warrant analysis shown that the junction warrants signals for traffic control. These improvements can be all accommodated within the existing right of way and consequently no land acquisition is envisaged at this time. The improvement measures recommended for the Junction is presented below. 62
162 5. Bhagat Singh Chowk: The junction is a T-junction on Atul Kataria (Mata Mandir) Road with a traffic circle. The junction is a very wide junction with very large channelizing islands. Traffic movements between Mata Mandir Road and road leading to Prakash Puri Chowk are major traffic movements. Road approaches of these two roads are wider compared to the other leg. There is a service road on the south side of the junction. The service road has an opening leads to unregulated traffic weaving between Mata Mandir road and service road traffic movements. The junction is designed with the following improvements. Installation of traffic roundabout instead of a traffic circle Widening of the approaches to the roundabout to increase capacity Increased circling carriageway width Installation of a channelizing island near the service road opening for regulation of traffic movements Installation of a non-motorized lane in the north side of the intersection Installation of pedestrian crosswalks Improved turning radius for the traffic movements Improved signages The recommended improvements can be accommodated within the existing right of way and consequently no land acquisition is envisaged. The intersection will continue to operate as an unsignalized traffic junction but with a roundabout. The improvement measures recommended for the Junction is presented below. 63
163 6. Manesar Chowk: The junction is a 3-arm junction on NH 8 at the entrance to Manesar Industrial Estate. The junction is formed by the intersection of NH8 and the industrial access road. The intersection is unsignalized. Currently large number of commercial vehicles access the industrial estate through the intersection. NH8 approach is a 4-lane wide and the industrial access road approach is a 6- lane. The traffic bound to the estate from both Jaipur and Gurgaon side is high and due to absence of separate lane for turning, the through traffic on NH 8 is getting ndelayed for long time. The junction is designed with the following improvements Installation of continuous through movement lane for NH8 towards Jaipur direction Installation of a right tuning lane on NH8 for vehicles turning right into the industrial complex Installation of an acceleration lane/slip lane for right tuning lane from industrial access road onto NH8 Reduction in the large channelizing islands to accommodate the right turning lane on NH8 Increase in the weaving length on the access road at the nose of the channelizing islands. Improved signages These improvements can be accommodated within the existing right of way and consequently no land acquisition is envisaged. The intersection warrants signals for better traffic management. The improvement measures recommended for the Junction is presented below. 64
164 7. Basai Chowk This four arm junction connects Pataudi road, Basai road, Railway station road (Madan Puri road) and Sadar Bazaar road. It is an uncontrolled intersection with no marking, signs and pedestrian facilities. All the approaches are two way and with two lane width. Medians are present on Sadar Bazaar road approach, Pataudi road approach and Basai road approach, but placed improper manner. Electric poles are located in the carriageway, obstructing the traffic movement. The junction is designed with the following improvements Realignment of median on Sadar Bazaar road approach Extension of median on approaches on Sadar Bazaar road and Pataudi road and Basai road. Installation of median on Madan Puri road. Relocation of electric poles from the carriageway Provision of foot path and cycle path on all arms Improved signages and markings These improvements can be accommodated within the existing right of way and consequently no land acquisition is envisaged at this time. The intersection warrants signals for better traffic management. The improvement measures recommended for the Junction is presented below. 65
165 8. Rajiv Gandhi Chowk The four arm junction on Sohna road across NH8 expressway. It is a police controlled intersection with no signals. Medians are present to regulate traffic on Sohna road approaches and fenced medians are present under the NH8 flyover. An island is provided at the centre of the junction. The following traffic management measures are proposed: Shortening of medians along NH 8 to provide sufficient carriage way width. Resizing of central island for better turning radius Channalising islands and realignment of medians on Sohna road Realignment of approach road towards Gurgaon Realignment of approach road towards Gurgaon requires certain extent of land acquisition. The junction warrants signal for better traffic control. The improvement measures recommended for the Junction is presented below. 66
166 9. Sethi Chowk The junction is a 4-arm junction formed on Old Railway Road and Basai Road. The junction is designed with the following improvements; Restriction of through and right turn movements from the east approach of Basai Road (approach from Fountain Chowk i.e., westbound direction). Only the left turn movement is allowed from this approach. Installation of pedestrian crosswalks Provision of NMT Lane. Improved signages These suggested improvements can be accommodated within the existing right of way and consequently no land acquisition is envisaged. The intersection can continue to operate as unsignalized traffic junction but with police control at peak hours. The improvement measures recommended for the Junction is presented below. 67
167 5.9.2 Road Improvements The proposed improvements come under the following major heads: Pavement strengthening Provision of paved shoulder Provision of signs and markings The roads (about 200 Kms) proposed for road improvement. The suggested improvements are proposed within the avaialble RoW. 68
168 9.3 Footpath cum Drain It is expected that approximately 200KM of road length would be provided with footpath. The road network proposed for construction/improvement of footpath cum drain is shown below. A Detailed Project Report for each road is recommended to provide the exact location and design of the footpath cum drain on each road. Roads Proposed for construction/improvement of footpath 69

169 5.9.4 Safe Pedestrian Crossing Facilities Pedestrians safe crossing facilities include at- grade facilities like zebra crossings, pedestrian signals, etc and grade separated facilities such as Foot Over Bridges, subways, etc. As volumes of pedestrian and traffic increase, grade separated facilities are warranted instead of at grade facilities. At junctions on major roads, zebra crossings are proposed. It is proposed that in front of every school and bus stand, at least one zebra crossing with pedestrian signals (flashing type) is proposed across the road. In addition to the pedestrian crossing facilities recommended at the junctions (Refer section 5.8.1), crossing facilities are required at few locations on NH 8 expressway also. Locations of safe crossing facilities proposed are presented below. 70
170 Locations Proposed for Safe Pedestrian Crossing Facilities Bicycle Lanes Roads proposed with Cycle paths are presented below. Cycle path is proposed at all junctions crossing these roads also. The total road length proposed with cycle path constitutes about 100 Kms of the present road network. These bi-cycle lanes are proposed within the avaialble RoW. Roads Proposed for Cycle paths On- Street Parking Management The following recommendations are made regarding the parking management for Gurgaon City: Restrict parking on major carriageways of roads with service roads, such as on MG road (between IFFCO Chowk and Vishwakarma road), New railway road (between HUDA Shopping Complex and Sadar Bazaar road), Golf Course Road (between Gymkhana Club 71
171 and Ashoka Crescent road), etc, with allowing one side parking on the service roads. Parking could be allowed on possilbe side roads of these main roads. Parking restriction is proposed on Sadar Bazaar road to ease traffic congestion. Designated parking lots should be proposed on one side of o o o o o o o o o o Railway road (between Railway station and HUDA Shopping complex), Khandsa road (between Hira Nagar and Udyga Vihar Phase VI), Pataudi road (between Basai Chowk and Himgiri Public School), Basai road (between Sethi Chowk and Krishan Nagar), Bus stand road (between Fountain Chowk and Matha Mandir Chowk), Jharsa road (between NH 8 and HSIDC Housing Complex), Sohna road (between Rajiv Gandhi Chowk and Islampur), Arya Samaj road (between Fire station and Cremation Ground), Vikas Marg (between May Field Gardens and Girls School) and Sushant Lok road (between DLF Golf Course and Sun City). Parking should be restricted on the other side of these roads. Parking can be provided in stretches out of green belts provided along the side of roads. At all major intersections, vehicles should not be allowed to park within about 50m of the junction if feasible Introduce paid parking facility on the parking zones No parking for buses, commercial vehicles and other vehicles anywhere on major roads within the city limits Parking should not be permitted in front of the driveways from the houses and other buildings. Introduce paid parking schemes with a view to discourage long term parkers as well as to regulate parking. Integrate parking with public/mass transport terminals and stations by way of park- andride facilities. This could be implemented at the stations on Phase I of DMRC metro extension, which is under construction. According to DMRC officials, parking space will be available at HUDA City Centre, IFFCO Chowk, MG Road, Sikanderpur and Guru Dronacharya metro stations. The HUDA City Centre metro station will have a parking space of 6,500 sq. m. and the other four metro stations will have parking space of 5,950 sq. m. (IFFCO Chowk), 876 sq. m. (MG Road), 1,577 sq. m. (Sikanderpur) and 4,572 sq. m. (Guru Dronacharya). The no of Parking spaces (ECS) is given in table below: 72
172 S.no Station name No. of car parking spaces (ECS) 1. HUDA City Centre IFFCO MG Road Sikanderpur Guru Dronacharya 140 Designate parking areas for autos and cycle rickshaws near terminals, markets, offices, commercial areas, etc. The roads proposed for on-street parking management is presented below Roads proposed for On-street Parking Management 73
173 The recommended parking policies would help to manage parking on the roads to enable smooth traffic flow for a short duration. In order to handle the issue on a long time frame, multi-storied parking lots are essential Off- street Parking Facilities Maximum hourly parking demand observed at various locations surveyed in Gurgaon are presented below. Location Peak Demand (PCE) On-street Cyber Park 126 near HUDA Shopping Complex 30 Fountain Chowk 54 Sethi Chowk 86 Railway Station road 25 Vishwakarma Road 80 New Railway road (near New Colony) 26 MG road 181 Off-street Near Mini Secretariat 42 Near Power Grid 47 Off-street of Vishwakarma road 55 (PCE- Parking Car equivalents) Based on the parking demand observed and the proposals by the Corporation and HUDA, off-street parking sites are proposed at the following locations in Gurgaon. They are: On MG road (either near DT city center/ MGF metroploiton mall, Sahara Mall, Bristol Chowk, Sikanderpur chowk or neelkanth hospital) On Vishwakarma road near Erricson In Sector 29 (Near Power Grid/ Kingdom of dreams) In Sec 15 (Near Mini Secretariat) Present Bus terminal site Near Cyber Park In sectors 10, 43 (near genpact), 48(near sohna road), 47, 52 (near Ardee city) and the HUDA City Centre (near Fortis chowk). These locations are proposed to implement immediately. In addition to these, 8 such facilities are also proposed in the new areas of GMUC, but proposed to develop in later stage and the exact locations to be identified later. 74
174 To identify their exact locations, Pre feasibility studies need to be conducted so as to identify suitable sites for creating off street parking facilities some of them would be in form of multilevel parking Bus Transport Immediate implementation of local public transport is essential for Gurgaon. Hence it is recommended starting organised bus operations through major corridors of Gurgaon. Bus shelters: It is proposed to have bus stops at every 500m distance in the CBD area and about 1kms distance for other areas. The proposed bus corridors with bus stop locations (about 160 nos.) proposed for construction of bus shelters are shown below. Bus stop locations proposed with bus shelters 75
175 Bus Route Plan: As a short-term plan, the buses are proposed to operate from the present bus stand located near Fountain Chowk. The bus stand currently accommodates the mofussil buses also. When the new bus operations start, the approach roads to the bus stand, especially Sadar Bazaar road and Fountain Chowk will be very congested. In order to handle the situation, rerouting of the buses from/to the bus stand is recommended. It is proposed to use Lt Atul Katariya road or Matha Mandir road, instead of Sadar Bazaar road for all buses accessing and starting from the bus stand. Buses towards Delhi side can use the Bus stand road and continue through Lt Atul Katariya road and either NH8/ Old Gurgaon road/mg road/ Palam Vihar road. While buses towards Jaipur, Sohna, Pataudi, Basai and Khandsa can use Bus stand road and then Matha Mandir road (left turn), Railway road to access the respective road. This routing will not only regulate the services but also relieve congestion from the core city area. The proposed bus routing is presented below. Bus Routing from the Bus stand Mobility Issues of BPO Industries: The proposed bus transport plan include public transport services on all major roads in Gurgaon. In normal case, the buses will operate till 10pm in the 76

176 night. Since Gurgaon accommodate large umber of BPO industries, which work in the night also, the mobility of these employees in the night is an issue. It is recommended to run the transport services in the night to the BPO areas. It is also suggested that the BPO industries to provide shuttle services to the nearest bus stop in the night also. Some private companies have made tie up with Haryana Roadways for services Traffic Management for Market Area Gurgaon market is located in the heart of the city, due to which Sadar Bazaar road and the surrounding area is getting choked. In order to relieve the market area from congestion, it is proposed to provide one- way street system. Also it is proposed to restrict on-street parking on Sadar Bazaar Road. The roads proposed as one ways should have at least 5.5m width. Traffic Mangement Proposal at Market Area 77
177 Regulation of Cycle Rickshaws In Gurgaon, the citizens have to use cycle-rickshaw to commute from one location to other because of poor bus service and six-seater service. Travelling by cycle rickshaw is not safe, especially in the following locations due to the absence of separate NMV lanes: Crossing at intersections with heavy traffic. Roads having sharp turns. In order to encourage and regulate cycle rickshaws in Gurgaon, the following suggestions are made: Fare of cycle rickshaws and registration of the vehicles must be regulated similar to auto rickshaws. Enforce cycle rickshaws to use the NMV lanes. They must also be provided with parking stations at bus stand, railway terminal and near commercial areas Regulation of Auto rickshaws To offset the absence of public transport services, 3- seater auto services must be encouraged and regulated. They must be provided with appropriate parking stands at the following locations. Near Fountain Chowk near IFFCO Chowk On MG road On Vishwakarma road On Railway station road Eight seater autos must be slowly phased out as public transport is floated Enforcement Strict enforcement equally matters with providing sufficient road infrastructure / furniture for safe and better traffic management when it comes to safe driving habits. Educating the drivers to follow and respect the traffic rules is also important. Traffic police is regulating traffic at critical junctions in Gurgaon. After the junction improvements are made and a few junctions signalized, the police could be used for the enforcement actively. If deemed necessary, the department should be strengthened. The traffic police division should also be provided with enough numbers of necessary equipments like speed 78
178 radar guns, patrol vehicles etc. for better enforcement. Spot fines for the traffic offenders would also be a deterrent and would ensure better road discipline Road Maintenance and Management Plan Despite best efforts of concerned authorities aimed at improving the urban road network the roads continue to exist below desired standards. However urban roads could be maintained and managed at a very high level of serviceability using modern techniques of Road Maintenance Management System (RMMS), supported be a systematic Road Information System (RIS). This will help to evaluate the existing condition of the roads and to suggest needed improvement measures for the roads so that cost-effective modern technologies can be used to provide higher level of serviceability by applying regular and timely maintenance. RMMS is a tool to facilitate the road network asset management at rural and urban levels within the study area. As an asset management tool, RMMS require a strong data base (Road Information System) to be collected, maintained and managed scientifically by using the latest techniques like GIS. RMMS is characterized by: Creation of a database on road inventory, road condition, traffic, geographic data, demographic and socio-economic parameters; Finalization of performance standards for necessary maintenance activities; Create the cost data base in respect of various regions for the network; Data base on budgetary support available for maintenance; Design a maintenance model to make predictions with respect to short, medium and longterm frames Generate various scenarios of maintenance within the given constraints of funding and predict the level of service achieved within these constraints Priorities the investment needs Ensure the available recourses are put into optimum use, and Centralized outputs of the proposed maintenance management system to decide the state level planning, prioritization and optimization for network Benefits and Impact The proposed traffic management measures include redesign of 22 intersections, development of foot path cum drain for 200 kms of roads, cycle lanes for 100 kms, grade separations for junctions, introduction of local bus services, on-street and off- street parking facilities, etc. The overall benefits emanating from these management measures include enhanced 79
179 safety of traffic, NMT including pedestrians, reduced waiting time at intersections, proper segregation of parking from traffic to enable smooth traffic flow, etc. The improvements proposed cover the old areas and new developing areas within GMUC. It is proposed to organise parking facilities within GMUC, including designated on- street parking facilities and multistoreyed parking sites at critical areas. Suggested pedestrian facilities include provision of footpath and safe crossing measures at critical mid blocks including and junctions and in front of educational institutions, bus stand, etc. Introduction of public transport with designated bus stops will decline the usage of private modes to an extend, which will enhance better safety and better environment in GMUC. The proposed improvements at juncitons, both grade separations and redesign, benefit in reduction in accidents and waiting time. However, a detailed Traffic Impact Asessment study with respect to the proposed improvements is recommended to quantify the benefits in detail IMP Outcome The travel demand forecast for 2031 for the realistic strategy is given below. With the proposed IMP strategies, the share of personal modes will decline to 33% from 82%, while the public transport share will increase to 61% from 4% in the Do- minimum scenario. The average network speed is projected to be as 31KMPH, from a lower speed of 11KMPH. Another important outcome is the reduction in vehicular emissions. The peak hour emission is expected to decrease from 5kg/sqkm to 2.1kg/sqkm. Peak Hour Trips with IMP: 2031 Mode Total (motorised) Trips Nos. Trips % Speed (kmph) Emissions (Kg/sqkm)
180 Chapter 6 Investment Programme 81
181 6.1 Cost Estimation The mobility plan elements discussed in the previous sections were considered in the estimation of block cost estimate for implementing the elements in the future. The rates are assumed based on consultants experience on similar studies in the past. The approximate capital cost, excluding land acquisition, for implementing the mobility plan is about Rs. 15,000 Crores. Major share of the investment is for developing public/mass transport systems. 6.2 Phasing The investment is phased into three periods, such as , and The first period ( ) is basically focus on the traffic management measures and implementation of bus transport. It is essential to implement buses immediately and the travel demand requires BRT implementation by Hence these two components are added in Phase 1 itself. Majority of the developments including SEZs proposed in and around GMUC are expected to complete by The development of the main metro connecting Gurgaon with Delhi (which is included DMRC 2021 plan), in the second phase. Other mass transit systems are proposed to develop in the third phase. Break up of the cost estimate is presented below. Rs. In Crores No Item Quantity Unit Rate Cost Bus Fleet 300 No Junction Improvement Major 6 No Minor 16 No Bus shelters 160 No Carriageway widening with SMV lanes 200 Km Foot path cum drain 200 Km Traffic & Pedestrian Management measures 200 Km Flyovers/Underpasses 15 No Pedestrian Crossing Facilities (grade separated) 8 No Off-street Parking sites 12 No BRT 74 KM Total
182 Metro (DMRC) 25 Km BRT 16 Km Road Widening (2 lane to 4 lane) 200 Km Road Widening (2 lane to 6 lane ) 50 Km New Links (6 lanes) 50 Km New Links (8 lanes) 50 Km Flyovers/Underpasses 16 No Inter- modal transfer facilities+ Mofussil bus terminal 1 No Off-street Parking sites 4 No Total Metro 25 Km Road Widening (2 lane to 4 lane) 90 Km New Links (6 lanes) 50 Km New Links (8 lanes) 100 Km Flyovers/Underpasses 10 No Inter- modal transfer facilities 2 No Off-street Parking sites 4 No Truck terminals 3 No RoBs 3 No RAAS & RMMS LS 5 5 Total 6581 Grand Total (rounded off) Funding Options To meet the transport needs of the future, investment requirements will increase to levels three to four times higher in real terms from the present levels. The financing of this level will be a massive task. While the government will continue to be a major source of funds for infrastructure, internal generation of resources JNNURM Funding for Urban Transport Improvement State Govt. Assistance HUDA, Gurgaon Corporation, HSIIDC (Manesar) Private Entrepreneurs Like SEZ developers coming forward for funding in the transport infrastructure sector by the sector itself will have to increase. Pricing of transport services and reduction in the costs 83
183 will have to play a much bigger role than in the past. A larger role of the private sector such as SEZ developers (eg: proposed LRT by DLF in DLF Cyber city) is also visualized. In a maze of subsidies and social service obligations public sector transport has lost the importance of commercial operations. Urban transport Policy of the Ministry of Urban Development clearly indicates the areas and levels of possible government support in planning to implementation of urban transport components. There are certain areas of urban transport components that different stakeholders can participate so that the required funding and responsibilities can be shared with suitable coordination and regulation mechanism. The following funding sources are visualised: State/Central Govts. HUDA, Gurgaon Corporation, HSIIDC (Manesar) Multilateral funding agencies Private participation ( BOT/ Annuity/ Sponsorship) including SEZ developers 6.4 Project Profile A profile sheet presenting details of each project has been prepared and presented below. Projects are classified as short- term, medium term and long -term projects based on their sustainability. Short- term projects are those sustainabille upto 5 years (eg; junction improvement, on-street parking management, etc), while those sustainable for 5-10 years are considered as medium term projects (flyovers, pedestrian subways, etc) and those sustainable for more than 10 years are grouped under long- term projects (eg; mass transport projects). Possible way of revenue generation for various projects also included in the profile sheet. It is proposed to carry out a cost- benefit analysis at the DPR stage of individual projects, especially for mass transport projects. Short- term projects are further categorised as those need to be implemented immediately The block cost estimated for such projects is about Rs. 543 Crores. Details are presented below. It is recommended to carry out a feasibility study before execution of the projects. Projects recommended for Immediate Implementation Block Cost (Rs. In Crores) Bus Fleet 150 Junction Improvement 3.1 Bus shelters 24 Carriageway widening with NMV lanes 200 Foot path cum drain 90 Traffic & Pedestrian Management measures (signs and markings) 8 Pedestrian Crossing Facilities (grade separated) 8 Off-street Parking sites 60 84
184 Total Block Cost

185 Project No: 1 Project Title: Intersection Redesign Project Category: Traffic Management Project Type: Short- term project No. of Intersections: 20 Locations: Major Improvements 11. Basai Chowk 1. IFFCO Chowk 12. Sethi Chowk 2. Fountain Chowk 13. Signature tower Chowk 3. Bhagat Singh Chowk 14. Subhash Chowk 4. Manesar Chowk 15. Junction of sectors 27, 43, 44 and Sikanderpur Chowk 16. Hero Honda Chowk 6. Kapshera Chowk on Old Gurgaon road 17. Islampur Chowk on Sohna road Minor Improvements 18. Vishwakarma Chowk 7. Shankar Chowk 19. Junction of sectors 43, 42 and Matha Mandir Junction 20. AIT Chowk ( junc. of sectors 56, 53 and 54) 9. Prakashpuri Chowk 21. Junction at sectors 23, 27, 47 and Rajiv Gandhi Chowk 22. Park Plaza Detailed Description: Intersection improvement measures are suggested by utilizing the existing right of way or limiting land acquisition to the bare minimum. Improvements suggested at the major junctions as part of short term measures include redesign of intersections by providing proper corner and turning radius, channelizers or division islands, signs, lane markings, lighting, landscaping, pedestrian crosswalks, non-motorised lanes, footpath, flaring approaches towards intersections, restricting parking, relocation of bus stop and auto stand, resizing of median, central island, channelizing islands, etc. Similar improvements need to be extended to a number of critical junctions on major corridors. Implementation period: PPP Potential: Sponsorship Possible revenue: Advertisements Approximate capital cost (Rs.): 2.9 Crores Potential Benefits: Intersection improvement measures suggested will reduce traffic conflicts and delay at junctions, ensure smooth traffic maneuvering, enable safe pedestrian movements and crossing and improve traffic safety with minimum cost. 86
186 Project No: 2 Project Title: Foot path cum Drain Project Category: Pedestrian Management Project Type: Long-term Length: 200 Km Location: Existing roads in GMUC Approximate capital cost (Rs.): 90 Crores Detailed Description: Most of the roads in Gurgaon lack walkable foot path and drainage facilities which results in water logging in many areas. It is recommended to provide continuous pedestrian foot-cum-drain network. Minimum width proposed is 1.5 m, preferable to be with 2-3m. Implementation period: PPP Potential: Annuity Possible revenue: Advertisements Potential Benefits: Segregation of vehicular traffic from pedestrian traffic will Improve pedestrian safety. 87
187 Project No: 3 Project Title: Carriageway Pedestrian Crossing widening Facilities with Bicycle Lanes Project Category: Traffic Management Project Type: Traffic Short- term Management No. Length: of Pedestrian 200 Km Crossing Facilities : Location: Grade separated:8 Existing road network in Gurgaon At grade: 40 Approximate capital cost (Rs.): 200 Crores Location: Approximate capital cost (Rs.): Detailed Across Description: NH 8 expressway 8 Crores At major junctions like Fountain Chowk, Sethi Chowk, Basai Chowk, etc The proposed improvements on the roads include: Detailed Description: Pavement strengthening Proposed Provision safe crossing of paved facilities shoulder for pedestrians include at-grade facilities like zebra crossing, pedestrian signals, etc and grade separated facilities such as Foot over Bridges, Cross section subways, improvements etc. It is proposed to provide zebra crossing with pedestrian Provision signals of (flashing signs and type) markings front of institutions/hospitals and bus stand. Pedestrian crossing facilities are also required at few locations on NH-8 expressway. Implementation period: PPP Potential: 50% Nil Potential Benefits: Potential Proper Benefits: pedestrian Better crossing roads improve facilities safety, reduces reduce delay fuel to vehicles and consumption pedestrians, and conflict improve between quality of vehicles urban environment and pedestrians and improves pedestrian safety 88
 In Sector 15 (Near Mini Secretariat) Present bus terminal site Near Cyber Park In Sectors 10, 43, 47, 48, 52 and City Centre")
188 Project No: 4 Project Title: Off-Street Parking Facilities Project Category: Parking Management Project Type: Medium -term No. Off-Street Parking Sites: 20 Location: On M.G. Road On Vishwakarma road near Erickson In Sector 29 (Near Power Grid) In Sector 15 (Near Mini Secretariat) Present bus terminal site Near Cyber Park In Sectors 10, 43, 47, 48, 52 and City Centre Additional 8 locations in the new developing areas. Detailed Description: Development of multi-storeyed parking sites are proposed at 12 locations in Gurgaon. The locations include proposals by the Corporation and HUDA. Additionally, 8 more locations are included in the new areas to develop in later stage in Phase 2 and Phase 3. Approximate capital cost (Rs. In Crores): 60 Implementation period: PPP Potential: BoT Possible revenue: Parking charges, Advertisements, Commercial area developments Potential Benefits: When the project will be implemented, it is possible to ban parking on the roads in the vicinity. This will improve the traffic circulation on the roads in the surrounding vicinity. 89
189 Project No: 5 Project Title: Fly Overs/Underpasses Project Category: Traffic Management Project Type: Medium- term No. of Flyovers/Underpasses: 16 Location: Approximate capital cost (Rs.): 820 Crores Detailed Description: Detailed Description: 1. IFFCO Chowk 2. Rajiv Gandhi Chowk 3. Shankar Chowk 4. Sikanderpur Chowk 5. Manesar Chowk 6. Hero Honda Chowk 7. Sethi Chowk 8. Outer ring road with Sohna road 9. Outer ring road with NH8 road (2 junctions together) 10. Outer ring road with Pataudi road 11. Outer ring road with Basai road 12. Outer ring road with Old Gurgaon road 13. Outer ring road with NH Outer ring road with MG road 15. Outer ring road with Faridabad road 16. Outer ring road with road to Sushant Lok PH III 17. Outer ring road with sector 56,57, 61 and Outer ring road with sector 50,57, 65 and 62 90
190 19. Outer ring road with sector 70,71, 75 and Outer ring road with sector 83, Outer ring road with sector 88 and Outer ring road with sector 103,104, 105 and Outer ring road with sector 2,23, and Junction of sector 29 and 27/ Junction of sector 27/28 and DLF phase Junction of sector 27/43/42 and DLF phase Junction of sector 43/42/53 and Junction of sector 49/50/65 and 66 on Outer ring road (SPR) 29. Junction of sector 69/70/71 and 72 on Outer ring road (SPR) 30. Junction of sector 33/38/47 and Junction of sector 38/39/46 and Junction of sector 45/46/51 and Junction of sector 74A/76A and NH8 34. Junction of sector 74A/74/76A and 75 on Outer ring road (SPR) 35. Junction of sector 77/78/83 and 82A 36. Junction of sector 81A/82A/78 and Junction of CPR and Outer ring road (NPR) 38. Junction of sector 101/102/103 and 104 on Outer ring road (NPR) 39. Junction of sector 105/106/109 and 110 on Outer ring road (NPR) 40. Junction of sector 110/110A/112 and 113 on Outer ring road (NPR) 41. Junction of Manesar sector 1/1A with NH8 91
191 Project No: 6 Project Title: Introduction of Bus Transport Project Category: Public Transport Project Type: Long-term Fleet: 300 Nos. Bus bays: 160 Nos. Location: Approximate capital cost (Rs.): 174 Crores Detailed Description: Immediate implementation of local public transport is essential for Gurgaon. Hence it is recommended starting organised bus operations through major corridors of Gurgaon. Bus shelters: It is proposed to have bus stops at every 500m distance in the CBD area and about 1kms distance for other areas. Implementation period: PPP Potential: BoT Possible revenue: Bus Fare and Advertiseme Advertisement at bus bays Potential Benefits: Organised public transport will improve the mobility needs of people in Gurgaon. It is a sustainable environmental friendly means of transport. Also will reduce the usage of personal modes on the roads. 92
192 Project No: 7 Project Title: Implementation of Low/Medium capacity Mass transport system (BRT) Project Category: Public/Mass Transport Project Type: Long-term Length: 90Kms Location: Inner Ring Road Old NH8 Khandsa Road Palam Vihar road Mehrauli road Pataudi road Sohna road Golf Course road ( ) Detailed Description: Bus rapid transit (BRT) system is proposed on selected roads in GMUC. Approximate capital cost (Rs.): 1080 Crores Implementation period: , PPP Potential: BoT Possible revenue: Fare, Advertisements, commercial area development and parking at stations. Potential Benefits: It is a faster, sustainable and environmental friendly means of transport. It will also reduce the usage of personal modes on the roads. 93
193 Project No: 8 Project Title: Road network Improvement Project Category: Mobility Corridor Development Project Type: Long- term Length: Widening: 340 Km New Links: 250 Km Location: Approximate capital cost (Rs.): 2580 Crores Detailed Description: Widening: 340 Kms 2 lane to 4 lanes: 290 Kms 2 lane to 6 lanes: 50 Kms New Links: 150 Kms 6 lanes: 100Kms 8 lane: 150Kms Implementation period: , , PPP Potential: Annuity Possible revenue: Toll and Land development along the corridors Potential Benefits: Development of road network will improve connectivity and accessibility within and outside of GMUC. Also will boost up the economic developments along the corridors. 94
194 Project No: 9 Project Title: Implementation of High capacity Mass transport system Project Category: Public/Mass transport Project Type: Long- term Length: 50 Kms Corridors: DMRC master plan (2021) corridor Along Khandsa road and NH 8 upto KMP corridor Detailed Description: High capacity mass transport systems (Metro) are proposed on two corridors in GMUC. Approximate capital cost (Rs.): Crores Implementation period: , PPP Potential: BoT Possible revenue: Fare, Advertisements and Commercial area development and parking at stations. Potential Benefits: It is a faster, sustainable and environmental friendly means of transport. It will also reduce the usage of personal modes on the roads. 95
195 Project No: 10 Project Title: Inter modal transfer facilities Project Category: Public /Mass Transport Project Type: Long- term Nos.: 3 Location: Detailed Description: The inter modal transfer facilities are proposed with: Inter-state and inter-city and city bus services are proposed with the terminal along with inter- modal transfer facility proposed in the Development Plan on outer ring road near NH8 (sector 83). Two additional inter- modal transfer terminals are proposed in Sector 29 and sector 121 with city bus terminals. These inter-modal transfer facilities would have park-and-ride system. Implementation period: , PPP Potential: BoT Possible revenue: Advertisements and Commercial area development and parking Approximate capital cost (Rs.): 31 Crores Potential Benefits: They will facilitate organised services of public transport and mass transport system. It will encourage passengers to use public/mass transport by having park- and ride facilities, which will increase the patronage on mass transit and thereby reduce traffic on the roads. 96
196 Project No: 11 Project Title: Development of Truck terminals Project Category: Commercial Terminal Plan Project Type: Long- term Nos: 3 Locations: near Maruti Udyog near Old Gurgaon road (sector 19), and two locations in Manesar (one along the Outer ring road (sector 88), and another location in sector 128). Detailed Description: Approximate capital cost (Rs.): 30 Crores Elimination of the rail crossings by providing RoBs/RuBs. Implementation period: PPP Potential: BoT Possible revenue: Parking Fee Potential Benefits: The project is intended to organize/manage commercial traffic in the town in a better way. This proposal will help to avoid haphazard parking of trucks on the roads. Also it will add economic benefits to the surrounding area. 97
197 Project No: 12 Project Title: Rail over Bridge Project Category: Other transport plans Project Type: Long- term Nos: 3 Location: At three level crossings in GMUC, located outside of city Approximate capital Cost (Rs.) : 30 Crores Detailed Description: The truck terminals proposed at these three locations are proposed to h of 3000 truck parking spaces and with ancillary facilities. Implementation period: PPP Potential: Annuity Possible revenue: toll collection Potential Benefits: Enable continuous traffic movement. 98
198 Chapter 7 Institutional Framework 99
199 The section analyse the present setup of institutional framework in Gurgaon, the issues pertaining to the present setup and proposed frame work. 7.1 Present Institutional Set-Up The following agencies are currently involved in planning, implementing and managing traffic and transport infrastructure of GMUC. Directorate of Town and Country Planning, Haryana (DTCP): This is the nodal agency responsible for the Strategic Regional and Transportation Planning in the Urban Complex. It has the overall responsibility of preparing and implementing development plans in the Area. It functions as an apex body in preparing and implementing development programs in areas such as housing, slum improvement, traffic and transportation and infrastructure development. The Haryana Urban Development Authority (HUDA): It is a statutory body of Haryana Govt. was constituted under the Haryana Urban Development Authority Act, 1977 to take up the planned development of urban areas and it functioned under the support of the Town & Country Planning Dept. The main functions of Haryana Urban Development Authority are as under:- To promote and secure development of urban areas with the power to acquire, sell and dispose off property, both movable and immovable ; To acquire, develop and dispose land for residential, industrial and commercial purpose ; To make available developed land to Haryana Housing Board and other bodies for providing houses to economically weaker sections of the society ; and To undertake building works. The development of major infrastructure services in the Gurgaon- Manesar urban complex include master water supply, master sewerage system, master storm water drainage, northern peripheral road, southern peripheral road and other major external roads and major horticultural works will be under taken by this Authority. Corporation of Gurgaon: Gurgaon has been upgraded to a Municipal Corporation recently. The Corporation is responsible for planning and implementation of economic and social development plans, basic urban amenities and facilities and urban infrastructure within the area under Municipal Corporation. 100
200 Haryana State Industrial and Infrastructure Development Corporation (HSIIDC): HSIIDC was setup in 1967 for promoting medium and large scale industries so as to ensure balanced regional development of Haryana, by acting as an institutional entrepreneur and a financial institution. HSIIDC serves as the single most important platform for providing services in the following areas:- Providing financial assistance by way of term loans, equipment refinance/equipment leasing and working capital. Infrastructural development in the State of Haryana. Performing Agency functions on behalf of the State Government/ IDBI/SIDBI Performing Agency functions for entrepreneurs and established industries for enhancement of capacity/modernisation. This agency is responsible for the infrastructure development of industrial estate of Manesar. Traffic Police: Traffic police is the foremost agency managing traffic in Gurgaon. The jurisdiction of Gurgaon Police is almost synonymous with the Corporation. Other Organisations: In addition, the Government organisations directly or indirectly related to transportation in the GMUC are Department of Highways, Haryana State Road Transport Corporation, RTO, etc. Stakeholders like SURGE are also active in traffic management in Gurgaon. 7.2 Issues with the Present Institutional Set up There are a number of prestigious organizations/institutions involved in planning, implementation and enforcement of Traffic and transport infrastructure in Gurgaon. In many tasks, role of various agencies is overlapping. But there is no organised public transport for intra city movements in Gurgaon. Private operators are running mini buses to various neighboring villages. 6- seater autos and cycle rickshaws are also active for local transport, but not in an organised way at all. There is no enforcement/restriction in the movement of commercial vehicles also. There is no agency/organization responsible for managing the above transport in Gurgaon. Due to the multiplicity of institutions has resulted in fragmentation of functional responsibilities, lack of local resources, paucity of financial resources and lack of 101
201 privatization strategy for the sector, as a whole. This calls for developing and maintaining an integrated transport system by an appropriate authority. In order to have an integrated approach to improve the transportation infrastructure in Gurgaon and to utilize the available infrastructure facilities and resources for development efficiently, proper coordination and streamlining the activities of different agencies, there is need for a statutory organization. 7.3 Proposed Institutional Framework Realizing the importance of an integrated approach to the problem of Urban Transport, the national Transport Committee set up in 1980 by Government of India thought of having a Unified Metropolitan in Transport Authority (UMTA) for every major urban area to ensure that not only the planning and operation of all transport modes are integrated but transport development is clearly interlinked with the development as a whole. This approach was subsequently incorporated into the National Urban Transport Policy (NUTP) issued by the Government of India, in the Ministry of Urban Development. UMTA should be a statutory body, created by on Act of parliament as an enabling body. Besides, it should have professionals as members. All the above mentioned agencies involved in planning, implementation and enforcement of transport in GMUC should have members in UMTA. The UMTA will look into both the planning and execution aspects of all the projects and recommend the priority with each of these projects should be taken up. All the transport and infrastructure projects will be look into by this body. All urban transport related projects need to be approved by the UMTA for funding (State / Central) to be available to them. Apart from deciding the finance for the project, the body will take a call as to which member agency will implement a particular project. The authority will advise all the local bodies regarding the execution of transport projects. It should have adequate transport planning expertise also in order to study and prepare perspective plans for transport and related infrastructure. It should be responsible for undertaking and updating all transport studies, including mobility plans in every 3-5 years. The UMTA is also responsible as a regulatory authority, where it will adopt /set performance standards for bus, roadways, transit etc. It will also have bus/ Vehicle operating standards. Also UMTA would be responsible for developing integrated plans for the Infrastructure of focusing on the Transport, Sewerage, Water, Storm water drainage, Electrical and Communications requirements. This would ensure concurrent development and efficient use of resources. 102
202 To Summarize, UMTA should have the following responsibilities: 1. Regulatory Setting norms/ Standards / Guidelines Traffic Service levels TSM Guidelines 2. Planning Land use transport integration QA/QC for comprehensive mobility Plans Updation of Master plans 3. Funding Project Approval State/Central fund sanctioning and channeling 4. Co-Ordination Co-ordination with other Urban Infrastructure departments. 103
203 Executive Summary Background The Gurgaon- Manesar Urban Complex (GMUC) extends to an area of 370 sq. km comprising of Gurgaon Corporation, Haryana Urban Development Area and Haryana State Industrial and Infrastructural Development Corporation (HSIIDC) area in Manesar. GMUC has witnessed tremendous urbanization since the past two decades, due to public- private participation in land development, automobile industries, IT and BPO industry. Population growth in the GMUC has recorded a natural growth till 1991(1.36 lakhs), while it has grown to 4.16 lakhs by The estimated population for 2008, based on secondary sources for GMUC is above 10 Lakh even with conservative estimates. Its proximity to Delhi, to the International Airport and the Delhi-Jaipur national highway - NH8 has made GMUC attractive for both industrial and residential development. Haryana Government has taken many initiatives to boost the economic growth of the region. Some of the major initiatives are: Kundli- Manesar- Palwal (KMP) Global Corridor and proposed developments along the corridor Development of Special Economic Zones (SEZs): Major SEZs are proposed in and around Gurgaon- Manesar area include Reliance Haryana SEZ (RHSEZ), Raheja SEZ, DLF Cyber SEZ, Raheja Engineering i
204 SEZ, Uppal SEZ, Emmar MGF SEZ, DLF SEZ, IREO SEZ, etc. The proposed DLF Cyber city in Gurgaon is expected to generate an employment of about 5 lakh by 2011 and the RHSEZ about 23 lakh. Rapid urbanization, population growth, growing economy and emerging opportunities in the region have placed an enormous demand for quality civic infrastructure. Apart from being plagued by huge gaps in infrastructure to service the current population, Gurgaon faces other common challenges like, traffic congestion, deteriorating roads, pollution and a strain on civic supplies. Some of the major problems Gurgaon faces is the inadequate connectivity with Delhi, poor local network, lack of public transport, facilities for truck parking, non motorised vehicles and pedestrian, lack of off-street parking facilities, congested junctions and links, etc. It is anticipated that by 2031, the population within GMUC will be about 43 Lakhs, even under a conservative estimate, which will be about 3 times higher than the present population. The proposed SEZs in and around GMUC are expected to generate huge employment in the area. The peak hour motorised transport demand estimated for 2031 is about 3.7 Lakhs, which is currently only 1.3 Lakhs. The impact of this high demand on the transport infrastructure of GMUC will be huge and critical. Vision The mobility plan seeks to move people, not vehicles. By emphasizing the pre-eminence of public transport and goods transport and integrating the land use with transport networks, with encouraging non-motorised transport it seeks to achieve the objectives of the National Urban Transport Policy (NUTP) in GMUC. The Integrated Mobility Plan vision for transport in GMUC ensures that the GMUC will have a high class sustainable and efficient transport infrastructure that will meet the needs of the economic developments that are proposed in the area. To ensure that the Gurgaon - Manesar Urban Complex will have a high class sustainable and efficient transport infrastructure that will meet the needs of the economic developments proposed in the area Objectives The objective of the Integrated Mobility Plan (this study) is to develop a transportation vision, set goals and objectives based on the defined vision and develop specific actions in the form of short, medium and long term transportation improvement proposals that will achieve the transportation ii
205 vision for the area. The Mobility Plan will emphasize the movement of people and goods, not just motor vehicles, and so will give due priority to public transit, travel demand management and nonmotorized modes. In order to address the existing and envisaged mobility demand in 2031 and to fulfill the vision stated above, the following objectives need to be achieved: Integration of land use and transport-connectivity between the areas of activities within the GMUC Accessibility within and outside GMUC Better connectivity with Delhi Increased use of Public Transit Improved non-motorized and pedestrian facilities Improved safety of travel Reduction in pollution Study Approach A detailed traffic inventory was made through the collection of the following data: Road network inventory surveys Screen line volume counts Junction turning counts Cordon count and OD surveys Speed and delay surveys On-street parking surveys Off- street parking surveys Pedestrian count along the roads Pedestrian count crossing roads/ junctions IPT passenger interview surveys Cyclist interview surveys Inter city & local Bus passenger count and OD for both boarding and alighting passengers House hold interview surveys Topo surveys iii
206 A conventional four stage transportation model has been calibrated to help in transport forecast. It includes: Trip Generation calculating the number of origins and destinations for each zone. Trip Distribution attaching the origins and destinations for complete trips. Mode Choice determining the mode for each trip (TW, car, auto, Public transport). Assignment assigning passengers to their respective highway and transit networks. The highway (road) network with all the major roads and some key minor roads. The economic development of the study area in terms of population and employment growth is translated to the model for forecasting. Based on the growth trends, three scenarios were considered to project population and employment. They are, Aggressive scenario, Moderate scenario and Realistic scenario. In the Aggressive scenario, all proposed SEZs are expected to come up within the stipulated time, while Moderate scenario assumes a lesser growth of the SEZs, compared with the Aggressive scenario. The Realistic scenario assumes a very low growth keeping in view the global economic meltdown. For the IMP recommendations, we used the Realistic Scenario. Aggressive Moderate Realistic Optimistic Scenario All proposed developments in and around GMUC will see light in the stipulated time GMUC Population projected for 2021 is in accordance with projections by the final Developemnt Plan and additional 6 lakhs in the nodes around GMUC Moderate Scenario Only 50% of the developments will see light in the stipulated time GMUC Population projections are accordance with projections by Water Supply Dept. and additional 6 lakhs in the nodes around GMUC Realistic Scenario 15% of proposed growth nodes (outside GMUC) would only happen keeping in view the economic meltdown GMUC Population projected for 2021 that is 43 lakhs would happen only in The work participation ratio under aggressive scenario is worked out to be above 1.0, while that has come down to 0.75 and 0.45 for moderate and realistic scenarios respectively. In all cases, the ratio is higher than the national average and hence the corresponding travel demand will be huge. While for our planning, we have considered a horizon year employment in the region as 18.5 Lakhs, if the economy has its way this will be 59.2 Lakhs as can be seen from the Optimistic Scenario. iv


207 The calibrated model has been used to forecast travel demand for the horizon period. The urban network strategy has been evolved by testing two options of Grid and Ring network. Ring network is found better performing than grid and is generally adopted as the preferred network development approach. The model has been run under Do- minimum interventions in 2031 and under various public transport strategies for various horizon years. Existing Scenario GMUC virtually lacks organized public transport for local/intra -city transport encouraging higher usage of personal modes. The public transport share in total trips is minimum (10% of total trips), while personallised mode share has 60% and Non Motorised Vehicles and walk trips constitute 30%. The present road network constitutes about 220 kms, in which 58% are two lane roads, leading heavy traffic congestion on the streets. Traffic volume counts indicated several oversaturated junctions, many on NH 8 such as IFFCO Chowk, Rajeev Gandhi Chowk, Shankar Chowk and NH8 Manesar Chowk. Speed Surveys indicated a very low operating speed of 22 KMPH. Street lights are available only on 20% of roads. Water logging is acute on roads. Roads with usable footpath are significantly lower than 23%. No separate lanes are available for NMVs. Parking demand is huge, but off-street facilities are absent. About vehicles are parked on various roads in Gurgaon. Accidents are increasing at the rate of 6% per annum. Accident prone locations include major junctions. The estimated daily vehicular emission is about 15 tones currently. The Origin- destination surveys conducted at the outer cordon locations revealed that through traffic (bound between places out side of GMUC) is significant on all major transport corridors. More than 70% of commercial vehicle trips and about 50% of passenger trips are bound between places beyond GMUC. Ring roads/bypasses are absent forcing through traffic to use Gurgaon roads. About 13% of vehicles crossing the outer cordon points of the study area, which constitutes about 40,000 vehicles, are goods vehicles of which about three- fourth of goods vehicles have no business in Gurgaon. v
208 Even with such huge demand, truck terminals are not present in Gurgaon. During day time, these vehicles are parked along roads near industries, which is a traffic hazard. The mobility issue of these trucks/trailers are also become a concern in GMUC. Approach The above strategy is sought to be implemented through the following broad approach: Implementation of an organized public transport system as an initiative to enhance the mobility and suitable mass transport system for future. Identification of a number of trunk mobility corridors along which low/medium/high capacity public transport systems would be considered based on a scientific and detailed alternatives analysis. The mass transport system to be integrated with the DMRC proposed plans. This will enhance the connectivity with Delhi. Providing alternative routes for bypassing the core city area. For this purpose, the ring corridor has been suggested to enable the core city area to be bypassed. An outer ring also has been suggested using portions of Peripheral roads recommended in the Development Plan Providing a network of dedicated cycle tracks, footpaths and safe pedestrian crossings. Providing flyovers/under passes in heavily congested junctions/intersections for better management of traffic. Provision of off-street parking facilities and management of on-street parking. Provision of truck terminals, bus terminals and intermodal transfer facilities Better traffic management measures including junction improvements, on-street parking management, etc. Special attention towards road safety Introduction of physical and fiscal measures that would discourage the use of personal motor vehicles. Integrated plan for cycle rickshaws and share autos. Reform and strengthen the institutional arrangements for planning, managing and regulating the transport infrastructure in GMUC. vi

209 Mobility Plan Strategies Solutions for GMUC transport improvements cannot be achieved by a single strategy. The mobility goals for GMUC will need to be addressed through a multipronged approach. The following strategies need to be adopted in tandem to meet the various goals set for GMUC. I. Land Use and Transport Strategy II. Mobility Corridor Strategy III. Public Transit Strategy IV. Non-Motorized Transport Strategy V. Freight Management Strategy VI. Traffic Engineering Measures VII. Travel Demand Management Strategy The land use and Transport strategy for GMUC has been evolved based on the Development Plan prepared by DTCP, Haryana. IMP has identified a number of trunk mobility corridors along which low/medium/high capacity public transport systems that need to be considered. Volume to capacity ratios on the major roads connecting Delhi to Gurgaon (MG road and Old NH road) has already crossed 1 and need urgent attention. Also the predicted volume to capacity ratio of major corridors is generally high. Operating buses in the kind of a congested network will be very difficult. However as an initiative, introduction of bus transport is recommended with a current requirement of 300 buses. This will increase the current PT share from 10% to 24%. To cater to the future demand, in addition to BRT corridors, possible medium (LRT/monorail) and high capacity/high speed Mass Transit System (Metro), are recommended on appropriate corridors. The suggested transport plan for 2021 with mass transit systems would augment the public transport share to 61%. Two ring roads (inner and outer) have been proposed to segregate Gurgaon bound traffic from through traffic. Non- motorized transport (NMT) trips in Gurgaon is significant, but the facilities are totally inadequate. vii
IDENTIFICATION OF BLACKSPOT REGION ALONG ANANDAPURAM TO ANAKAPALLI STRECH VIA SH-38
 IDENTIFICATION OF BLACKSPOT REGION ALONG ANANDAPURAM TO ANAKAPALLI STRECH VIA SH-38 S.Naveen Kumar 1,O.Ganesh Kumar 2,K.Swetha 3 1,2,3 Assistant Professor,Department of Civil Engineering, Sai Ganapathi
1. Introduction. 2. Survey Method. Volume 6 Issue 5, May Licensed Under Creative Commons Attribution CC BY
 A Study on Performance of an Urban Arterial Corridor Guggilla Raju 1, Rontala Ashwini 2 1 Assistant Professor, Department of Civil Engineering, GCET 2 Assistant Professor, Department of Civil Engineering,
[Swetha*, 5(2): February, 2016] ISSN: (I2OR), Publication Impact Factor: 3.785
![[Swetha*, 5(2): February, 2016] ISSN: (I2OR), Publication Impact Factor: 3.785](/thumbs/74/69747294.jpg "[Swetha*, 5(2): February, 2016] ISSN: (I2OR), Publication Impact Factor: 3.785") IJESRT INTERNATIONAL JOURNAL OF ENGINEERING SCIENCES & RESEARCH TECHNOLOGY ESTIMATION OF PASSENGER CAR UNIT FOR HETROGENEOUS TRAFFIC IN VISAKHAPATNAM Dadi.Vasavi Swetha * * Civil Department, Diet College,
IJESRT INTERNATIONAL JOURNAL OF ENGINEERING SCIENCES & RESEARCH TECHNOLOGY ESTIMATION OF PASSENGER CAR UNIT FOR HETROGENEOUS TRAFFIC IN VISAKHAPATNAM Dadi.Vasavi Swetha * * Civil Department, Diet College,
TRAFFIC STUDY AND DESIGN OF TRAFFIC SINGNAL AT IDENTIFIED INTERSECTIONS IN MANSAROVAR, JAIPUR
 TRAFFIC STUDY AND DESIGN OF TRAFFIC SINGNAL AT IDENTIFIED INTERSECTIONS IN MANSAROVAR, JAIPUR 1 Baldev Mathur, 2 Mr. Deepak Mathur 1, M.Tech. Scholar,department of civil engineering (Transportation Engineering),Kautilya
PLANNING FOR SUSTAINABLE PEDESTRIAN INFRASTRUCTURE NALIN SINHA INITIATIVE FOR TRANSPORTATION & DEVELOPMENT PROG. (ITD), DELHI
, DELHI") PLANNING FOR SUSTAINABLE PEDESTRIAN INFRASTRUCTURE NALIN SINHA INITIATIVE FOR TRANSPORTATION & DEVELOPMENT PROG. (ITD), DELHI India s Road Network 5 million kms: Total road length 2.6 mn kms: Surfaced
PLANNING FOR SUSTAINABLE PEDESTRIAN INFRASTRUCTURE NALIN SINHA INITIATIVE FOR TRANSPORTATION & DEVELOPMENT PROG. (ITD), DELHI India s Road Network 5 million kms: Total road length 2.6 mn kms: Surfaced
Cairo Traffic Congestion Study Phase 1
 Cairo Traffic Congestion Study Phase 1 Final Report November 2010 This report was prepared by ECORYS Nederland BV and SETS Lebanon for the World Bank and the Government of Egypt, with funding provided
Multimodal Interpretation and Analysis of Traffic Survey Data
 Multimodal Interpretation and Analysis of Traffic Survey Data Sitesh Kumar Singh 1, Ankit Bansal 2 M.Tech, Department of Transportation Engineering, Final Year, Lovely Professional University, Punjab,
MOBILITY CHALLENGES IN HILL CITIES
 MOBILITY CHALLENGES IN HILL CITIES Lalmuansanga Ralte, MCS Pvt Secretary to Minister & Under Secretary Urban Development & Poverty Alleviation Department Govt. of Mizoram DEMOGRAPHIC OVERVIEW INDIA MIZORAM
Development of Saturation Flow Rate Model for Heterogeneous Traffic at Urban Signalized Intersection
 Development of Saturation Flow Rate Model for Heterogeneous Traffic at Urban Signalized Intersection T. B. Rajgor 1, Prof. A. K. Patel 2, Prof. (Dr.) P. J. Gundaliya 3 1 P.G. Student, Civil Engineering
TRAFFIC IMPACT ASSESSMENT IN VIJAYAWADA AT JUNCTION, COMMERICAL AND INDUSTRIAL AREA
 Volume: 06 Issue: 03 Mar 2019 www.irjet.net p-issn: 2395-0072 TRAFFIC IMPACT ASSESSMENT IN VIJAYAWADA AT JUNCTION, COMMERICAL AND INDUSTRIAL AREA 1MRS.KAJA SRI BINDU, 2 VADLAPATLA NAVYA, 3 VELLANKI JASWANTH,
TRAFFIC SURVEYING AND ANALYSIS
 TRAFFIC SURVEYING AND ANALYSIS Mr. Udit Batra 1 Mr. Mandar V. Sarode 2 1 Assistant Professor, 2 Assistant Professor Civil Engineering Dept., Civil Engineering Dept., GNIEM, Nagpur GNIEM, Nagpur Maharashtra.
Route User Intercept Survey Report
 Route User Intercept Survey Report Hills Road, Cambridge Fieldwork: October 2016 Report published: December 2016 1 About Sustrans Sustrans makes smarter travel choices possible, desirable and inevitable.
Delay analysis due to Road side activities at Urban Arterial Road of Rajkot city
 Delay analysis due to Road side activities at Urban Arterial Road of Rajkot city Rita Bhanushali 1, Prashant Lakkad 2, Mayank Kanani 3 1Final year M.E Student, Civil Engineering Department, Atmiya Institute
Complete Street Analysis of a Road Diet: Orange Grove Boulevard, Pasadena, CA
 Complete Street Analysis of a Road Diet: Orange Grove Boulevard, Pasadena, CA Aaron Elias, Bill Cisco Abstract As part of evaluating the feasibility of a road diet on Orange Grove Boulevard in Pasadena,
Analysis of Unsignalized Intersection
 International Journal of Constructive Research in Civil Engineering (IJCRCE) Volume 2, Issue 1, 2016, PP 30-36 ISSN 2454-8693 (Online) www.arcjournals.org Analysis of Unsignalized Intersection B.Ramkumar
BRT Corridor Shastri Park Karawal Nagar Yamuna Vihar Mori Gate Gandhi Nagar
 Delhi Integrated Multi Modal Transit System Ltd. BRT Corridor Shastri Park Karawal Nagar Yamuna Vihar Mori Gate Gandhi Nagar Presentation to Governing Body UTTIPEC DDA March,2011 NARELA BRT PHASE II PUTHKHURD
Chapter 2 Current and Future Conditions
 Chapter 2 Current and Future Conditions 2.1 An Overview of Ottawa s Transportation System The City of Ottawa is home to about 870,700 people. The city covers an area of 2,760 square kilometres of which
CAPACITY AND DYNAMIC PASSENGER CAR UNIT ESTIMATION FOR HETEROGENEOUS TRAFFIC STREAM OF URBAN ARTERIALS: A CASE STUDY OF INDIAN METROPOLIS
 1 2 3 4 5 6 7 8 9 10 11 12 13 14 15 16 17 18 19 20 21 22 23 24 25 26 27 28 29 30 31 32 33 34 35 36 37 38 39 40 41 42 43 44 45 46 47 CAPACITY AND DYNAMIC PASSENGER CAR UNIT ESTIMATION FOR HETEROGENEOUS
Tulsa Metropolitan Area LONG RANGE TRANSPORTATION PLAN
 Tulsa Metropolitan Area LONG RANGE TRANSPORTATION PLAN Indian Nations Council of Governments August 2005 CONTACTING INCOG In developing the Destination 2030 Long Range Transportation Plan, INCOG s Transportation
Intersection Improvement in Udaipur: A Demonstration of Passive Junction Design Solutions
 Intersection Improvement in Udaipur: A Demonstration of Passive Junction Design Solutions Implemented by Supported by In Association with City Partner Table of Contents Introduction 3 Context 3 Approach
Transportation Model for Burgas
 Inception Report April 2009 Transportation Model for Burgas Inception report Executive Summary: Main findings Daily Modal split in major corridors is in favor of car (59% of all trips) Average number of
WHITE PAPER: TRANSIT SERVICE FOR SOUTH SHAGANAPPI
 9/27/2012 TRANSIT PLANNING WHITE PAPER: TRANSIT SERVICE FOR SOUTH SHAGANAPPI 2012 Calgary Transit 1 Table of Contents Purpose... 3 Area of Change... 3 Background... 3 Access to destinations... 5 Connecting
HENDERSON DEVELOPMENT 213, 217, 221, 221 ½, 223 HENDERSON AVENUE and 65 TEMPLETON STREET OTTAWA, ONTARIO TRANSPORTATION OVERVIEW.
 HENDERSON DEVELOPMENT 213, 217, 221, 221 ½, 223 HENDERSON AVENUE and 65 TEMPLETON STREET OTTAWA, ONTARIO TRANSPORTATION OVERVIEW Prepared for: 2294170 Ontario Inc. February 2, 2017 117-652 Report_1.doc
A MULTI-MODAL PUBLIC TRANSPORT SOLUTION FOR MALE, MALDIVES
 A MULTI-MODAL PUBLIC TRANSPORT SOLUTION FOR MALE, MALDIVES 11 TH CONFERENCE ON COMPETITION AND OWNERSHIP IN LAND PASSENGER TRANSPORT Delft University of Technology (The Netherlands) 20-25 September 2009
Low Carbon Mobility Plan For Indian Cities
 Low Carbon Mobility Plan For Indian Cities Data Requirement and BAU Scenario Workshop on Developing Policies and Strategies for Low Carbon Transport in India, 24-25 August, 2012 In Indian context NMT and
TRAFFIC SURVEY AND ANALYSIS
 CHAPTER 3: TRAFFIC SURVEY AND ANALYSIS 3.1 Introduction (1) Survey Background and Objectives The study area including Dhaka city and its environs called Dhaka Metropolitan Area has been rapidly urbanized
The Limassol SUMP Planning for a better future. Apostolos Bizakis Limassol, May 16, th Cyprus Sustainable Mobility and ITS conference
 The Limassol SUMP Planning for a better future Apostolos Bizakis Limassol, May 16, 2017 5 th Cyprus Sustainable Mobility and ITS conference Αbout Limassol Αbout Limassol The second largest city in Cyprus
Decongestion Strategies for Delhi Roads
 PWD, Delhi 1 Presented By: Sh.Manoj Kumar(CPM); Sh.Ravi Kant (S.E); Sh.A.K.Agrawal (S.E) Public Works Department - GNCTD Agendas Main Challenges in Delhi Population, Land, Multiplicity of Authorities,
95 th Street Corridor Transportation Plan. Steering Committee Meeting
 95 th Street Corridor Transportation Plan Steering Committee Meeting August 11, 2014 PROJECT OBJECTIVES Develop a Transportation and Economic Plan for the 95 th Street Corridor Improve public transit efficiency
Volume Studies CIVL 4162/6162
 Volume Studies CIVL 4162/6162 Lesson Objectives Define critical parameters of interest in traffic volume studies Compute and interpret hourly, daily, weekly, and monthly adjustment factors Collect intersection
ADOT Statewide Bicycle and Pedestrian Program Summary of Phase IV Activities APPENDIX B PEDESTRIAN DEMAND INDEX
 ADOT Statewide Bicycle and Pedestrian Program Summary of Activities APPENDIX B PEDESTRIAN DEMAND INDEX May 24, 2009 Pedestrian Demand Index for State Highway Facilities Revised: May 29, 2007 Introduction
Estimation of Passenger Car Unit value at Signalized Intersection
 2016 IJSRSET Volume 2 Issue 2 Print ISSN : 2395-1990 Online ISSN : 2394-4099 Themed Section: Engineering and Technology Estimation of Passenger Car Unit value at Signalized Intersection Ankit N Mahidadiya*,
HORN PROHIBITED NO PARKING NO STOPPING STRAIGHT PROHIBITED NO ENTRY
 UNIT III 1. What are the various types of traffic signs? [N/D-13] Traffic signs give timely warning of hazardous situations when they are not self - evident. The various types of traffic signs are: a)
Manila-Quezon City. My City Initiative Delhi. A Safety Analysis. a project by World Vision India
 Manila-Quezon City A Safety Analysis My City Initiative Delhi a project by World Vision India Safetipin, in collaboration with World Vision India, conducted safety audits in Lalbagh and Madanpur Khadar.
Preliminary Transportation Analysis
 Preliminary Transportation Analysis Goals of a Robust, Multimodal Transportation Network Safe Accessible/Connected Efficient Comfortable Context-Sensitive Motor Vehicle: Continue to analyze the data to
Welcome. The Brooklin Secondary Plan and Transportation Master Plan are collectively referred to as the Brooklin Study.
 Welcome The Town of Whitby is undertaking a study to prepare a Secondary Plan and Transportation Master Plan to guide and manage growth in the Brooklin area. The Brooklin Secondary Plan and Transportation
Guidelines for Providing Access to Public Transportation Stations APPENDIX C TRANSIT STATION ACCESS PLANNING TOOL INSTRUCTIONS
 APPENDIX C TRANSIT STATION ACCESS PLANNING TOOL INSTRUCTIONS Transit Station Access Planning Tool Instructions Page C-1 Revised Final Report September 2011 TRANSIT STATION ACCESS PLANNING TOOL INSTRUCTIONS
VRU Safety & Traffic Calming Measures in Urban & Rural Areas
 VRU Safety & Traffic Calming Measures in Urban & Rural Areas 2 What is Traffic Calming? Road engineering approaches aimed at bringing the design of the road in accordance with the desired speeds of the
Overhead Pedestrian Crossings Economic Evaluation through Vehicle Operating Cost and Travel Time Savings
 OUSL Journal (2014) Vol 7, (pp77-94) Overhead Pedestrian Crossings Economic Evaluation through Vehicle Operating Cost and Travel Time Savings K. M. G. N. S. Kumara, V. K. M. Pinnagoda and K. S. Weerasekera
AHMEDABAD BUS RAPID TRANSIT SYSTEM (ART)
") F O R D I S C U S S I O N AHMEDABAD BUS RAPID TRANSIT SYSTEM (ART) WORKING PAPER - 5 TRAFFIC VOLUME CHARACTERISTICS JUNCTION MANAGEMENT FEBRUARY 2006 Gujarat Infrastructure Development Board () Ahmedabad
F O R D I S C U S S I O N AHMEDABAD BUS RAPID TRANSIT SYSTEM (ART) WORKING PAPER - 5 TRAFFIC VOLUME CHARACTERISTICS JUNCTION MANAGEMENT FEBRUARY 2006 Gujarat Infrastructure Development Board () Ahmedabad
UNIT V 1. What are the traffic management measures? [N/D-13] 2. What is Transportation System Management (TSM)? [N/D-14]
![UNIT V 1. What are the traffic management measures? [N/D-13] 2. What is Transportation System Management (TSM)? [N/D-14]](/thumbs/87/95571671.jpg "UNIT V 1. What are the traffic management measures? [N/D-13] 2. What is Transportation System Management (TSM)? [N/D-14]") UNIT V 1. What are the traffic management measures? [N/D-13] Some of the well-known traffic management measures are: a) Restrictions on turning movements b) One - way streets c) Tidal - flow operations
UNIT V 1. What are the traffic management measures? [N/D-13] Some of the well-known traffic management measures are: a) Restrictions on turning movements b) One - way streets c) Tidal - flow operations
Subject: Solberg Avenue / I-229 Grade Separation: Traffic Analysis
 MEMORANDUM Transportation Bill Troe, AICP Jason Carbee, AICP 12120 Shamrock Plaza Suite 300 Omaha, NE 68154 (402) 334-8181 (402) 334-1984 (Fax) To: Project File Date: Subject: Solberg Avenue / I-229 Grade
guide to a phased approach TRIPP
 complete street development guide to a phased approach TRIPP development phases Existing 00 months 00 crores/km Phase 0 months 0 crores/km Phase 09 months 0 to 08 crores/km Phase months 07 to crores/km
Protected Bike Lanes in San Francisco Mike Sallaberry SFMTA NACTO Workshop - Chicago IL
 Protected Bike Lanes in San Francisco Mike Sallaberry SFMTA 10 14 2011 NACTO Workshop - Chicago IL San Francisco 2 nd Highest Density in the U.S. 47 square miles Mild Climate Market Population ~810,000
Synchronization of Signalized Intersection from Rasoma to High Court in Indore District
 International Journal of Scientific and Research Publications, Volume 6, Issue 4, April 2016 112 Synchronization of Signalized Intersection from Rasoma to High Court in Indore District Vijay Rane *, H.S.
WELCOME TO OPEN HOUSE # 1 June 14, 2017
 Langstaff Road Weston Road to Highway 7 Class Environmental Assessment Study WELCOME TO OPEN HOUSE # 1 June 14, 2017 Please sign in and join our mailing list Purpose of Open House #1 & Study Area York
Traffic and Transport Safety TABLE 9.5.7: LOCATION OF MAJOR PARKING PLACES IN UDAIPUR CITY TABLE 9.5.8: MODE WISE ACCIDENT TREND IN UDAIPUR
 TABLE 9.5.7: LOCATION OF MAJOR PARKING PLACES IN UDAIPUR CITY SI No. Stretch Link Length (m) Existing Parking Demand in ECS 1 Patel Chowk to Choraha 1600 291 2 Udaipol Choraha to Surajpol Choraha 530 158
Improvement of pedestrian safety and traffic flow regulation at the railway junction, Kandy
 J.Natn.Sci.Foundation Sri Lanka 2013 41 (3): 259-270 DOI: http://dx.doi.org/10.4038/jnsfsr.v41i3.6060 RESEARCH ARTICLE Improvement of pedestrian safety and traffic flow regulation at the railway junction,
EMBARQ India Public bicycle sharing scheme for Mysore station locations
 EMBARQ India www.embarqindia.org Public bicycle sharing scheme for Mysore station locations Table of Contents Table of Contents... 2 Background... 3 Overview... 3 Transport situation in Mysore... 3 Heritage
SANTA CLARA COUNTYWIDE BICYCLE PLAN August 2008
 SANTA CLARA COUNTYWIDE BICYCLE PLAN August 2008 To assist VTA and Member Agencies in the planning, development and programming of bicycle improvements in Santa Clara County. Vision Statement To establish,
Urban Street Design and Development
 Urban Street Design and Development Ashok Bhattacharjee, Advisor, Clean Air and Sustainable Mobility, Centre for Science and Environment CSE Workshop on Safe Access and Parking - Lytton Hotel, Kolkata
EXECUTIVE SUMMARY OF CALEDON TRANSPORTATION NEEDS STUDY
 EXECUTIVE SUMMARY OF CALEDON TRANSPORTATION NEEDS STUDY The Caledon Transportation Needs Study has been undertaken as a joint project by the Town of Caledon and the Region of Peel to determine the existing
Proposed White Flint Separated Bike Lane Network September 2015
 Proposed White Flint Separated Bike Lane Network September 2015 Abstract This report includes a proposed separated bike lane network for the White Flint Sector Plan area. Separated bike lanes create a
Appendix B: Forecasting and Traffic Operations Analysis Framework Document
 Existing Conditions Report - Appendix Appendix B: Forecasting and Traffic Operations Analysis Framework Document This document defines the methodology and assumptions that will be used in the traffic forecasting
SAFETY EVALUATION OF AN UNCONTROLLED
 SAFETY EVALUATION OF AN UNCONTROLLED INTERSECTION USING SURROGATE SAFETY MEASURES By S. Shekhar Babu Research scholar (Ext) IITB Asso Prof CME Pune Prof. P. Vedagiri Asst Prof Dept of civil Engg IIT Bombay
Influence of Vehicular Composition and Lane Discipline on Delays at Signalised Intersections under Heterogeneous Traffic Conditions
 Influence of Vehicular Composition and Lane Discipline on Delays at Signalised Intersections under Heterogeneous Traffic Conditions R.V. Yogesh Kumar, A. Gowri and R. Sivanandan Centre of Excellence in
COMPUTER AIDED MODELING OF MIXED TRAFFIC FLOW AT URBAN UNCONTROLLED INTERSECTIONS
 COMPUTER AIDED MODELING OF MIXED TRAFFIC FLOW AT URBAN UNCONTROLLED INTERSECTIONS V. Thamizh Arasan 1 and B. Muni Chandra 2 ABSTRACT Modeling of road traffic at the intersections will enable comprehensive
An Evaluation of Rotary Intersection: A Case Study of Prabhat Square Raisen Road Bhopal
 An Evaluation of Rotary Intersection: A Case Study of Prabhat Square Raisen Road Bhopal 1 Rakesh Kumar Chhalotre 2 Dr. Y. P. Joshi 1 M.E. Student, 2 Professor 1,2 Department of Civil Engineering 1,2 Samrat
APPENDIX A: Complete Streets Checklist DRAFT NOVEMBER 2016
 APPENDIX A: Complete Streets Checklist DRAFT NOVEMBER 2016 Complete Streets Checklist MetroPlan Orlando s Complete Streets Checklist is an internal planning tool for staff to further implementation of
EXECUTIVE SUMMARY: TRANSIT-ORIENTED DEVELOPMENT IN SMITHS FALLS, ONTARIO; A COMPARISON BETWEEN TWO SITES
 EECUTIVE SUMMARY: TRANSIT-ORIENTED DEVELOPMENT IN SMITHS FALLS, ONTARIO; A COMPARISON BETWEEN TWO SITES Topic and Purpose In 2007, the Mayor of Ottawa s Task Force on Transportation suggested adding a
TRAFFIC IMPACT ANALYSIS
 TRAFFIC IMPACT ANALYSIS FOR THE CHAMPAIGN UNIT#4 SCHOOL DISTRICT PROPOSED HIGH SCHOOL (SPALDING PARK SITE) IN THE CITY OF CHAMPAIGN Final Report Champaign Urbana Urbanized Area Transportation Study 6/24/2014
Travel Patterns and Characteristics
 DRAFT 2006 Transportation Fact Book SECTION 4 Travel Patterns and Characteristics 43 2006 Transportation Fact Book DRAFT 44 DRAFT 2006 Transportation Fact Book Why do we conduct travel surveys? The main
Dunedin One Way System (SH1) Cycle Survey Report
 Cycle Survey Report") Dunedin One Way System (SH1) Cycle Survey Report Report produced March 2014 (based on traffic surveys undertaken December 2013, and January & February 2014) 1 Preamble This report provides cycle count
Dunedin One Way System (SH1) Cycle Survey Report Report produced March 2014 (based on traffic surveys undertaken December 2013, and January & February 2014) 1 Preamble This report provides cycle count
Sixth Line Development - Transit Facilities Plan
 Memorandum Date: November 13, 2012 To: From: c.c. Subject: Rob Freeman (Freeman Planning) Kevin Phillips Sixth Line Development - Transit Facilities Plan 33016631 This memo was prepared to review the transit
APPENDIX H EXISTING TRAFFIC CONDITIONS ANALYSIS
 APPENDIX H EXISTING TRAFFIC CONDITIONS ANALYSIS MEMO : Peter Steacy, P.Eng. Date: December 3, 2014 : Ian Borsuk, P.Eng. Job No.: 3414015-000 Subject: City of Ottawa O-Train Extension Planning & EA Study
Research Offices in India. Delhi, Kolkata, Mumbai, Lucknow, Chennai, Bangalore, and. Hyderabad. TNS INDIA Pvt. Ltd
 Research Offices in India Delhi, Kolkata, Mumbai, Lucknow, Chennai, Bangalore, and Hyderabad TNS INDIA Pvt. Ltd 1 ROAD USER SATISFACTION SURVEY OUR EXPERIENCE TNS INDIA Social Research Division Assessment
Light rail transit in Mysore: complimenting land use and transport
 Sustainable Development, Vol. 2 949 Light rail transit in Mysore: complimenting land use and transport G. Ghosh Sky Group, India Abstract Most Indian cities are low-rise urban trails and require medium
A STUDY ON GAP-ACCEPTANCE OF UNSIGNALIZED INTERSECTION UNDER MIXED TRAFFIC CONDITIONS
 A STUDY ON GAP-ACCEPTANCE OF UNSIGNALIZED INTERSECTION UNDER MIXED TRAFFIC CONDITIONS S.Siva Gowri Prasad 1, Ramesh Surisetty 2, Suresh Kumar ch 3 1 Assistant professor, Department, of Civil Engineering,
WHY AND WHEN PEDESTRIANS WALK ON CARRIAGEWAY IN PRESENCE OF FOOTPATH? A BEHAVIORAL ANALYSIS IN MIXED TRAFFIC SCENARIO OF INDIA.
 WHY AND WHEN PEDESTRIANS WALK ON CARRIAGEWAY IN PRESENCE OF FOOTPATH? A BEHAVIORAL ANALYSIS IN MIXED TRAFFIC SCENARIO OF INDIA. Sobhana Patnaik, Mukti Advani, Purnima Parida. There are reasons for walking
2. Context. Existing framework. The context. The challenge. Transport Strategy
 Transport Strategy Providing quality connections Contents 1. Introduction 2. Context 3. Long-term direction 4. Three-year priorities 5. Strategy tree Wellington City Council July 2006 1. Introduction Wellington
Feasibility Report for Kumharon Ka Bhatta with an Alternative Intersection Improvement: Case Study from Udaipur
 Feasibility Report for Kumharon Ka Bhatta with an Alternative Intersection Improvement: Case Study from Udaipur Implemented by Supported by In Association with City Partner Table of Contents Introduction
Traffic Improvement for Urban Road Intersection, Surat
 Traffic Improvement for Urban Road Intersection, Surat Sharukh Marfani 1, Dharmkumar Shihora 2, Chirag Kanthariya 3, Harshal Kansara 4 1Assistant Professor, Civil Engineering Department, F.E.T.R, Bardoli,
Copenhagen Cycling Map. Red Lines Cycling facilities
 Copenhagen Cycling Map Red Lines Cycling facilities Copenhagen Cycling Facilities Design Approaches Transportation without Pollution Copenhagen s Strategy Where Cycling is one of the top key activities
CITY OF OTTAWA ROADWAY MODIFICATION APPROVAL UNDER DELEGATED AUTHORITY
 RMA-2015-ATM-038 CITY OF OTTAWA ROADWAY MODIFICATION APPROVAL UNDER DELEGATED AUTHORITY DATE: April 22, 2015 SUBJECT Approval of Roadway Modifications Recommended through an Area Traffic Management Study
1.5 On this basis it is fundamental that the Transport Strategy for the site focuses on the following key criteria,
 1.0 Introduction 1.1 The Transport Assessment has been prepared on behalf of Eon and Roger Bullivant Ltd in respect of the proposed mixed use sustainable urban extension of Drakelow Park. 1.2 The methodology
Public Event 1 Community Workshops
 Public Event 1 Community Workshops Nov. 24 & Dec. 3, 2016 Welcome Workshop Purpose We re looking to you for ideas and insights to help guide future transportation infrastructure planning in the Park Lawn
EFFECTS OF TRANSIT SIGNAL PRIORITY ON BUS RAPID TRANSIT SYSTEM. Sahil Chawla, Shalini Sinha and Khelan Modi
 EFFECTS OF TRANSIT SIGNAL PRIORITY ON BUS RAPID TRANSIT SYSTEM Sahil Chawla, Shalini Sinha and Khelan Modi PRESENTATION STRUCTURE INTRODUCTION AIM / OBJECTIVES STUDY APPROACH LITERATURE REVIEW MODEL DEVELOPMENT
Urban Transport Service Level Benchmarking in Urban Transport for Indian Cities
 Urban Transport Service Level Benchmarking in Urban Transport for Indian Cities Ahmedabad Bhubaneswar Hubli-Dharwad Kohima Mysore Surat An Initiative of the, Government of India Presented by Prof. H.M.
GIS Based Non-Motorized Transportation Planning APA Ohio Statewide Planning Conference. GIS Assisted Non-Motorized Transportation Planning
 The Purpose of GIS Assisted Network GIS Assisted Non-Motorized Transportation 2011 APA Ohio Statewide Conference Friday, 10:45 AM to Noon Focus on near-term projects wwwgreenwaycollabcom The purpose of
Cynemon - Cycling Network Model for London
 1 MARCH 2017 Cynemon - Cycling Network Model for London Aled Davies TfL Planning 2 Background Investment in cycling has increased significantly in recent years We need robust appraisal to justify cycling
Augmenting the Transit Capacity of Delhi by Renewal of the Sub-Urban Railway
 DOI: 10.15415/cs.2015.22009 Augmenting the Transit Capacity of Delhi by Renewal of the Sub-Urban Railway Nisar Khan Faculty of Architecture & Ekistics, Jamia Millia Islamia, New Delhi - 110025, India Email:
CITY OF ALPHARETTA DOWNTOWN MASTER PLAN TRAFFIC EVALUATION
 CITY OF ALPHARETTA DOWNTOWN MASTER PLAN TRAFFIC EVALUATION June 2015 CITY OF ALPHARETTA DOWNTOWN MASTER PLAN TRAFFIC EVALUATION Introduction The Alpharetta Downtown Master Plan was developed in the fall
Magnolia Place. Traffic Impact Analysis. Prepared for: City of San Mateo. Prepared by: Hexagon Transportation Consultants, Inc.
 Magnolia Place Traffic Impact Analysis Prepared for: City of San Mateo Prepared by: Hexagon Transportation Consultants, Inc. Updated January 4, 2010 Table of Contents 1. Introduction...1 2. Existing Conditions...6
ANALYSIS OF ACCIDENT SURVEY ON PEDESTRIANS ON NATIONAL HIGHWAY 16 USING STATISTICAL METHODS
 ANALYSIS OF ACCIDENT SURVEY ON PEDESTRIANS ON NATIONAL HIGHWAY 16 USING STATISTICAL METHODS K.SWETHA Assistant Professor Civil Department, Sai Ganapati Engineering College, JNTUK, Visakhapatnam, India,
Supporting Safer Cities. ENHANCING LAST MILE CONNECTIVITY a safety analysis of the RK Ashram Marg Metro Station
 Supporting Safer Cities ENHANCING LAST MILE CONNECTIVITY a safety analysis of the RK Ashram Marg Metro Station This Report has been prepared as part of the Project being undertaken with NDMC to Enhance
Planning and Design of Proposed ByPass Road connecting Kalawad Road to Gondal Road, Rajkot - Using Autodesk Civil 3D Software.
 Planning and Design of Proposed ByPass Road connecting Kalawad Road to Gondal Road, Rajkot - Using Autodesk Civil 3D Software. 1 Harshil S. Shah, 2 P.A.Shinkar 1 M.E. Student(Transportation Engineering),
DEVELOPMENT OF A SET OF TRIP GENERATION MODELS FOR TRAVEL DEMAND ESTIMATION IN THE COLOMBO METROPOLITAN REGION
 DEVELOPMENT OF A SET OF TRIP GENERATION MODELS FOR TRAVEL DEMAND ESTIMATION IN THE COLOMBO METROPOLITAN REGION Ravindra Wijesundera and Amal S. Kumarage Dept. of Civil Engineering, University of Moratuwa
Moving Cambridge. City of Cambridge Transportation Master Plan Public Consultation Centre. March 7, :00 8:00 PM.
 City of Cambridge Transportation Master Plan Public Consultation Centre March 7, 2018 5:00 8:00 PM Region of Waterloo City of Cambridge Transportation Master Plan Public Consultation Centre March 7, 2018
CPC Parking Lot Riverside Drive. Transportation Rationale
 CPC Parking Lot Transportation Rationale Prepared By: NOVATECH Suite 200, 240 Michael Cowpland Drive Ottawa, Ontario K2M 1P6 September 2015 Novatech File: 114093 Ref: R-2015-153 Table of Contents 1.0 INTRODUCTION...
Chapter Capacity and LOS Analysis of a Signalized I/S Overview Methodology Scope Limitation
 Chapter 37 Capacity and LOS Analysis of a Signalized I/S 37.1 Overview The Highway Capacity Manual defines the capacity as the maximum howdy rate at which persons or vehicle can be reasonably expected
APPENDIX 2 LAKESHORE ROAD TRANSPORTATION REVIEW STUDY EXECUTIVE SUMMARY
 APPENDIX 2 LAKESHORE ROAD TRANSPORTATION REVIEW STUDY EXECUTIVE SUMMARY Appendix 2 City of Mississauga Lakeshore Road FINAL REPORT Transportation Review Study December 2010 EXECUTIVE SUMMARY Study Purpose
Transportation Trends, Conditions and Issues. Regional Transportation Plan 2030
 Transportation Trends, Conditions and Issues Regional Transportation Plan 2030 23 Regional Transportation Plan 2030 24 Travel Characteristics Why Do People Travel? Over one-half of trips taken in Dane
BURGAS INTEGRATED PUBLIC TRANSPORT PROJECT. Information day, 5 th July 2011, Burgas
 BURGAS INTEGRATED PUBLIC TRANSPORT PROJECT Information day, 5 th July 2011, Burgas BRT TECHNICAL DESIGN TENDER Preliminary tender specifications and requirements Overview 1 Burgas BRT concept 2 Main outputs
TRAFFIC ANALYSIS AND SIGNAL DESIGN AT PATAN A PROJECT REPORT
 TRAFFIC ANALYSIS AND SIGNAL DESIGN AT PATAN A PROJECT REPORT NAME OF THE CANDIDATES Jagdish Chad (100783106007) Jaimin Patel (090780106035) INTERNAL GUIDE AMI H SHAH KINJAL R. PATEL IN CIVIL ENGINEERING
High frequency bus services operating to Little Island; Creation of a new Park and Ride site and train station at North Esk;
 Cork County Council 7 th December 2018 Dear Adrian O Neill (aoneill@jbbarry.ie) The Transport and Mobility Forum, Cork (TMF) is a representative group of organisations who have a common interest in sustainable
Rhode Island Moving Forward Long-Range Transportation Plan 2040 Municipal Roundtable Newport County
 Rhode Island Moving Forward Long-Range Transportation Plan 2040 Municipal Roundtable Newport County www.planri.com PlanRI2040@gmail.com Municipal Roundtable Meeting Summary Date/time: Location: Wednesday,
Transportation Engineering
 Transportation Engineering For Civil Engineering By www.thegateacademy.com Syllabus Syllabus for Transportation Engineering Transportation Infrastructure: Highway Alignment and Engineering Surveys; Geometric
National Cycle Network Funding Scheme 2012/2012 Application Form. Waterford City Council. Paul Cleary, Executive Engineer. 3.2km 289, ,000
 National Cycle Network Funding Scheme 2012/2012 Application Form Section 1:Project Outline Name and Address of Local Authority Contact person/proposed project manager Waterford City Council Paul Cleary,
TRANSPORTATION & MOBILITY
 TRANSPORTATION & MOBILITY ROADWAY SYSTEM There are approximately 40 miles of roadways in Manitou Springs. For planning purposes, roadways are typically assigned a functional classification which defines
Case Study on Traffic Management for Rectification of Congestion on a Road Stretch
 Case Study on Traffic Management for Rectification of Congestion on a Road Stretch Chander Mohan Kansal 1, Er. Sushant Gajbhiye 2 1 (Civil Engineering Department, GVIET Banur College/ PTU University, India)