Outcomes of the Cycling City and Towns programme: monitoring project report
|
|
|
- Juniper Dorsey
- 5 years ago
- Views:
Transcription
1 Outcomes of the Cycling City and Towns programme: monitoring project report Individual town results: York April 27 Report authors: Andy Cope, Research and Monitoring Unit, Sustrans Angela Kennedy, Research and Monitoring Unit, Sustrans Fiona Crawford, Research and Monitoring Unit, Sustrans Nick Cavill, Cavill Associates John Parkin, University of the West of England, Bristol Lynn Sloman, Transport for Quality of Life PART A: INTRODUCTION PART B: DATA COLLECTION AND ANALYTICAL METHODOLOGIES PART C: OVERALL FINDINGS PART D: INDIVIDUAL TOWN RESULTS PART D: BLACKPOOL PART D2: CAMBRIDGE PART D3: CHESTER PART D4: COLCHESTER PART D5: GREATER BRISTOL PART D6: LEIGHTON LINSLADE PART D7: SHREWSBURY PART D8: SOUTHEND PART D9: SOUTHPORT PART D: STOKE-ON-TRENT PART D: WOKING PART D2: YORK
2 About Sustrans Sustrans is the charity making it easier for people to walk and cycle. We are engineers and educators, experts and advocates. We connect people and places, create liveable neighbourhoods, transform the school run and deliver a happier, healthier commute. Sustrans works in partnership, bringing people together to find the right solutions. We make the case for walking and cycling by using robust evidence and showing what can be done. We are grounded in communities and believe that grassroots support combined with political leadership drives real change, fast. Join us on our journey. Head Office Sustrans 2 Cathedral Square College Green Bristol BS 5DD Sustrans April 27 Registered Charity No (England and Wales) SC39263 (Scotland) VAT Registration No Acknowledgments The authors are grateful for the extensive assistance of officers in the 2 Cycling City and Towns in supplying monitoring data for this research. We are also grateful for additional support provided by Lisa Muller, Katie Pullen, George Macklon, Katie Thomson, James O Hare, Richard Sanders, Alison Janes, Hannah Delaney, Laurence Bonner, Peter Stephenson, Charlotte Draycott and Jo Watson. Disclaimer Although this report was commissioned by the Department for Transport (DfT), the recommendations are those of the authors and do not necessarily represent the views of the DfT. While every effort has been made to ensure the information in this document is accurate, DfT does not guarantee the accuracy, completeness or usefulness of that information; and it cannot accept liability for any loss or damages of any kind resulting from reliance on the information or guidance this document contains. Mapping (c) Crown Copyright licence no Also OpenStreetMap (c) (and) contributors licence CC-BY-SA ( Outcomes of the Cycling City and Towns programme: monitoring project report Individual town results: York April 27
3 Table of contents Introduction Description of the Cycling City and Towns programme in York Expenditure Summary of available monitoring data Summary of headline findings Analysis of automatic cycle counter data Town-wide analysis Analysis of data from individual counter sites Relationship between programme activity and automatic count data Analysis of manual count data Inner cordon survey Bridge survey Boundaries survey Analysis of school related data PLASC Bike It Route User Intercept Surveys Analysis of counts of parked bicycles data Analysis of casualty data Analysis of physical activity data Maps Outcomes of the Cycling City and Towns programme: monitoring project report Individual town results: York April 27
4 Introduction. Description of the Cycling City and Towns programme in York The Cycling City and Towns programme delivered in York Cycling City York aimed to deliver a significant increase in levels of cycling in the city. Specific targets included an increase in overall participation in cycling of 25%, an increase of % in commuter cycling, and a % increase in children cycling to school. Infrastructure developments focused on the addition of approximately km of new cycle infrastructure and the improvement of approximately 5km of existing facilities. The northern, eastern and western sections of the Orbital Route were fully joined to the existing cycle network and improvements in facilities for cyclists were made at key junctions on the route. A programme of signage installation aimed to highlight the route at key points around the city. Cycle parking received a substantial boost from the Cycle Hub Station, managed by Bike Rescue, which offers secure indoor parking for bicycles as well as changing/locker rooms, bike repairs and retail. Large businesses have also benefited from the increased provision of secure, undercover parking through match funding from Cycling City York. To improve connectivity with the train, the railway station benefited from two new access points and ramps for cyclists. Cycling City York also engaged with workplaces. A range of major employers in the city including Nestle and York University were involved in a series of initiatives and events, such as the York Cycle Challenge, to encourage a modal shift towards cycling. Match-funding was offered to a specific set of ward committees to run events, including come and try road shows and the Fit as a Fiddle project. A range of marketing events were organised and promotional material was designed to promote the Cycling City York brand. This included the Festival of Cycling, Bike Week events, and a regular newsletter distributed to every household in York. Bike availability has been improved through the implementation of a low-interest loan scheme with the North Yorkshire Credit Union to buy a new cycle from local retailers. In addition, individuals with physical and learning disabilities had the option of hiring specially adapted cycles. Work in schools focused on raising the profile of cycling, through Bike It, themed bike rides, bike maintenance classes and all school action days. Guided leisure rides were also offered, as well as organised mountain bike events..2 Expenditure While this report is primarily concerned with the monitoring evidence around outcomes of the Cycling City and Towns programme, it is useful to place these in context through summarising the programme inputs in terms of capital and revenue expenditure. Details of expenditure in York during the Cycling City and Towns programme are summarised in Table -. Cycling City York (2) End of Programme Report, Cycling City York. Available at [Accessed 3 May 22] 4 Outcomes of the Cycling City and Towns programme: monitoring project report Individual town results: York April 27
5 Table - Funds invested in cycling in York Total revenue capital Cycling,38,949 2,444,8 3,825,29 England/DfT/DH investment Matched funding 3,728, 3,728, Total,38,949 6,72,8 7,553,29.3 Summary of available monitoring data The following data sources are available: Data from 34 automatic cycle counters 2 hour manual counts performed annually since 2 at 33 locations and every quarter since 29 at locations Pupil Level Annual School Census (PLASC) travel data and monitoring data from Bike It route user intercept surveys at six sites counts of parked bicycles STATS9 cycling casualty data Active People Survey (APS) data..4 Summary of headline findings Mixed evidence of change, tending towards modest growth in levels of cycling from a relatively high initial baseline Based on count data, there is mixed evidence of the direction and magnitude of change in levels of cycling in York over time. The most complete data sets, time series data from automatic cycle counters (located predominantly on traffic-free cycle routes), suggest a modest growth in levels of cycling. The majority of count sites have seen an increase in the volumes of cyclists recorded, although the magnitude of uplift is highly variable across individual count sites. Trends over time as indicated by manual counts are not consistent with the automatic counter data: manual count sites on an inner cordon around York indicate increasing counts over time; counts performed on bridges in York show a net decrease, although usage increases at as many sites as it decreases; and counts on an outer cordon around the city boundary tentatively suggest a decrease. In most instances, change is from a high base relative to most of the towns funded through the programme. Notwithstanding the limitations of the data source, levels of cycling to primary schools appear to have declined over the course of the programme, whilst cycling to secondary schools has increased. In both cases, the direction of change year-to-year is not constant over the time series, and as such it is not possible to draw firm conclusions around this. Schools engaged with Bike It have seen a significant increase in the numbers of children cycling to school everyday. 5 Outcomes of the Cycling City and Towns programme: monitoring project report Individual town results: York April 27
6 Automatic cycle counter data indicate an increase in volumes of cycles counted of +6% against a 27 baseline. Based on data from the 34 automatic cycle counters, this estimated growth corresponds to an increase from an estimated 7,7 trips per day in 27 to 7,544 in 2. An increase was observed at 24 of the automatic cycle counter sites, a decrease at eight sites and no change at the two remaining sites Annual manual counts on the inner cordon indicate growth in cycle volumes between 27 and 29 and between 2 and 2; quarterly data from eight of these sites suggest a slight increase when comparing quarter 4 29 and quarter 2 with quarter 4 2 and quarter 2 Annual manual counts on bridges in York indicate a decrease when comparing data from 26 and 27 with data from 2 and 2, with significant decreases at two of the five sites for which a comparison was reasonable, and significant increases at two sites Annual manual counts on an outer cordon of York indicate a decrease in counts Across all schools, the percentage of children cycling to school as measured by PLASC was 6.% in 2/ compared to 7.8% Bike It data indicate an increase in children cycling to school on the day of the survey, from 3.7% in pre surveys to 9.2% in post surveys, and an increase in children cycling to school everyday, from.9% in pre surveys to 6.9% in post surveys Route user intercept surveys undertaken at six sites, once in 2 and again in 2, reveal that the majority of cyclists in both surveys were making commuting journeys 6.4% in 2 and 62.4% in 2; an increase in counts of cyclists was recorded between the surveys at all six sites Counts of parked bicycles undertaken at the railway station, formal cycle parking in the city centre and on city centre footstreets (pedestrianised streets) increased between 27 and 2 Compared to pre-programme data, the number of cycling casualties was not significantly different during the Cycling City and Town programme Active People Survey data indicate significant decreases in York in the proportion of respondents cycling once or more per month and the proportion cycling 2 or more times per month between 27/8 and 2/ 2 Analysis of automatic cycle counter data Data from a total of 34 automatic cycle counters have been analysed. In the following sections information regarding the location, volumes of cyclists recorded, and change in volumes of cyclist recorded over time are presented for each location. Many of the counters are within the centre of York although there are also several to the north and west of the city. Five of the 34 counters were installed in 999 and one each in 23, 25 and 27. More recently, 23 counters were installed in 29 and the remaining three were installed in 2. The majority of the counters have data for two years or less, therefore although there are a relatively large number of counters in York, the analysis which can be performed in relation to change over time is somewhat limited. In order to be consistent across the Cycling City and Towns, data from 27 onwards are included in the analysis. Two distinct sets of analysis have been undertaken using cycle counter data in York. In the first, all available data are analysed using a regression model to allow an estimate of change in cycle trips recorded over the programme period against a 6 Outcomes of the Cycling City and Towns programme: monitoring project report Individual town results: York April 27
7 baseline. In the second, data from individual sites are analysed in order to determine the average volumes of cyclists recorded, distribution of cycle trips over the course of the day and (where sufficient data are available) the annual percentage change in the count of cyclists. 2. Town-wide analysis Table 2- presents the percentage change in cycle counts relative to a 27 baseline including data to the end of September 2. Table 2- Change in cycle count in York at the end of the Cycling City and Towns period relative to a 27 baseline (baseline = %) Change against 27 baseline % 95%* 4%* 99% 6%* * indicates a significant difference (p<.5) compared to the 27 baseline This analysis does not include data from the Millennium Bridge counter which records usage at a key crossing point on a popular route in York. Changes to the layout of the counter mean that a period of comparable data for robust analysis is not available. The counter data indicate a decline in the volume of cyclists recorded in 28 and 2 compared to previous years. The decline in 2 is potentially the result of poor weather during late 29 and early and late 2. A significant uplift in counts is observed between 28 and 29, and between 2 and 2. An additional element was added into the regression model to account for the two periods of poor weather nationally. Table 2-2 presents the findings of this analysis. When adjusting the model for these severe weather conditions, there is an increased percentage change between 28 and 29, and a smaller decrease in the volumes of cyclists recorded between 29 and 2. Although this supports the assertion that poor weather conditions in 29 and 2 impacted upon cycle volumes, other factors have contributed to the decrease in cycle volumes in 2. Table 2-2 Change in cycle count in York at the end of the Cycling City and Towns period relative to a 27 baseline including an adjustment for snow (baseline = %) Change against 27 baseline % 95%* 8%* 5%* 5%* * indicates a significant difference (p<.5) compared to the 27 baseline The above analyses have not included data from three of the counters in York (references 5, 24 and 25 in Table 2-5 below). These counters are in areas prone to flooding and Cycling City York does not consider the data to be sufficiently reliable. A visual inspection of the data available supports this assertion. Table 2-3 details the change in cycle counts in York if these three counters had been included in the analysis. 7 Outcomes of the Cycling City and Towns programme: monitoring project report Individual town results: York April 27
8 Table 2-3 Change in cycle count in York at the end of the Cycling City and Towns period relative to a 27 baseline, including Oakdale Road North, Oakdale Road South and St George s Field (baseline = %) Change against 27 baseline % 93%* 3%* 97% 3% * indicates a significant difference (p<.5) compared to the 27 baseline 2.2 Analysis of data from individual counter sites Data from individual cycle counters were analysed in order to determine the rate of change in volumes of counts recorded at each location over time. The results of this analysis are summarised in Table 2-4 and alongside more detailed information for each counter in Table 2-5. There are sufficient data available to robustly estimate the annual percentage change in the number of cyclists counted over time for seven counters. For the remaining counters, based on the more limited data available, change over time is positive for 8 count sites, negative for eight, and there is no change over time for one site. Table 2-4 Summary of findings of detailed analysis of data from individual count sites Number of counters for which data are available 34 Number of counters for which sufficient data are available to quantify change over time 2 7 Number of counters with quantifiable increase 6 Number of counters with no change Number of counters with quantifiable decrease In the following table counters are ordered by their location relative to the centre of York, starting with those located closest to the town centre. Map references refer to the accompanying map (section 9). 2 None of the changes at individual counters are statistically significant. 8 Outcomes of the Cycling City and Towns programme: monitoring project report Individual town results: York April 27
9 Table 2-5 Description of automatic cycle counters in York Map Location Time period Annual change Average daily count Comments reference in 2 b. Scarborough Bridge 2-2 Positive Overall: 358 Located on a traffic-free path near the Scarborough Weekdays: 393 Bridge on National Route 65 of the National Cycle Weekend days: 24 Network, approximately half a mile west of the centre of York. This site is on a key access route to the railway station. Weekday counts show commuting peaks. 2.. Almery Terrace 2-2 Positive Overall: 63 Located on National Route 65 of the National Cycle Weekdays: 62 Network, a traffic-free shared use riverside path next to Weekend days: 64 the River Ouse in the centre of York. A school site is nearby. Weekday counts show commuting peaks. 3. Scarcroft Lane 29-2 Negative Overall: 3 Located on a traffic-free shared use route between Weekdays: 65 buildings and a school. The site is approximately half a Weekend days: 78 mile south of the centre of York. Weekday counts show commuting peaks. 4. Skeldergate Bridge 27-2 a Positive Overall: 382 Located on National Route 65 of the National Cycle Weekdays: 47 Network, an on-road section of the Trans Pennine Trail Weekend days: 25 alongside the River Ouse, half a mile south of the centre of York. Weekday counts show commuting peaks. 5. St. George s Field 27-2 a Weekday: % Overall: 32 Located on a traffic-free shared use path in a riverside Sat/Sun: -% Weekdays: 333 area. Due to its riverside location the site is prone to Weekend days: 249 flooding and Cycling City York have reservations about the reliability of the data. The site is half a mile south of the centre of York, close to Clifford s Tower. Weekday counts show commuting peaks. 6. Cinder Lane/Jubilee 27-2 a Weekday: +2% Overall: 83 Located on a traffic-free shared use path between housing Terrace Sat/Sun: +4% Weekdays: 948 and a school. The site is approximately half a mile north- Weekend days: 45 west of the centre of York. Weekday counts show commuting peaks. 9 Outcomes of the Cycling City and Towns programme: monitoring project report Individual town results: York April 27
10 7. Rowntree Park (Terry 29-2 a Negative Overall: 54 Located on National Route 65 of the National Cycle Avenue) Weekdays: 68 Network, a traffic-free shared use riverside path in Weekend days: 34 Clementhorpe, approximately three quarters of a mile south of the centre of York. A riverside park is nearby. Weekday counts show commuting peaks. 8. Foss Islands Retail 29-2 Positive Overall: 24 Located on a traffic-free cycle route adjacent to James Park Weekdays: 266 Street, a supermarket and car park. The site is in Weekend days: 8 Layerthorpe, approximately half a mile east of the centre of York. Weekday counts show commuting peaks. 9. James Street/Hallfield 29-2 Positive Overall: 372 Located on a traffic-free cycle route within a retail park in Road Weekdays: 446 Layerthorpe, approximately half a mile east of the centre Weekend days: 27 of York. Weekday counts show commuting peaks.. Heworth Green 29-2 Positive Overall: 68 Located on an on-road cycle lane in Layerthorpe, Weekdays: 747 approximately three quarters of a mile north-east of the Weekend days: 36 centre of York.. Cemetery Road 29-2 Positive Overall: 254 Located on an on-road route, approximately three Weekdays: 28 quarters of a mile south-east of the centre of York. School Weekend days: 7 sites are nearby. Weekday counts show commuting peaks. 2. Lawrence Street 29-2 Positive Overall: 49 Located on-road on the A79 Lawrence Street, by a Weekdays: 528 central reservation crossing. The site is in a residential Weekend days: 322 area one mile east of the centre of York. Weekday counts show commuting peaks. 3. Fulford, by the river, 27-2 a Weekday: -% Overall: 63 Located on a traffic-free cycle path linking to National Maple Grove Sat/Sun: % Weekdays: 8 Route 66 of the National Cycle Network. Residential Weekend days: 34 housing, a riverside park and a school are nearby. The site is approximately one mile south-east of the centre of York. Weekday counts show commuting peaks. 4. Hob Moor 27-2 a Weekday: +4% Overall: 33 Located on a traffic-free shared use path across a park Sat/Sun: % Weekdays: 396 adjoining a residential area. The site is in Hob Moor, one Weekend days: 89 mile south-west of the centre of York. Weekday counts show commuting peaks. Outcomes of the Cycling City and Towns programme: monitoring project report Individual town results: York April 27
11 5. Huntington Road 29-2 Positive Overall: 352 Located on an on-road route on Huntington Road, (inbound) Weekdays: 398 approximately one mile north-east of the centre of York. Weekend days: 83 Weekday counts show commuting peaks. 6. Huntington Road 29-2 Negative Overall: 239 (outbound) Weekdays: 27 Weekend days: Bishopthorpe 28-2 a Weekday: +% Overall: 37 Located on National Route 65 of the National Cycle Road/Terrys Sat/Sun: +5% Weekdays: 388 Network, a traffic-free shared use path adjacent to Weekend days: 329 Bishopthorpe Road. The site is approximately one and a quarter miles south of the centre of York. Factories are nearby. Weekday counts show commuting peaks. 8. Retreat Lane 29-2 Positive Overall: 37 Located on a traffic-free shared use path surrounded by Weekdays: 4 urban green space. The site is approximately one and a Weekend days: 8 half miles south-east of the centre of York. A university site is nearby. Weekday counts show commuting peaks. 9. Woodlea Avenue to 29-2 Positive Overall: 7 Located on a traffic-free shared use route between urban Danebury Drive Weekdays: 76 green space in Acomb and a residential area Weekend days: 5 approximately one and a half miles west of the centre of York. Weekday counts show commuting peaks. 2 Malton Road (inbound) 29-2 Negative Overall: 24 Located on a traffic-free cycle path adjacent to A36 Weekdays: 274 Malton Road. It is in Heworth, approximately one and Weekend days: 64 three quarter miles north-east of the centre of York. Weekday counts show commuting peaks. 2. Malton Road 29-2 Positive Overall: 29 Located on a traffic-free segregated cycle lane adjacent to (outbound) Weekdays: 269 A36 Malton Road. The site is in Heworth, approximately Weekend days: 4 one and three quarter miles north-east of the centre of York. Weekday counts show commuting peaks. 22. Windmill Lane to 2-2 No change Overall: 267 Located on National Route 66 of the National Cycle Science Park Weekdays: 333 Network, a traffic-free segregated cycle path through a Weekend days: 3 university science park. The site is approximately two miles east of the centre of York. Weekday counts show commuting peaks. Outcomes of the Cycling City and Towns programme: monitoring project report Individual town results: York April 27
12 23. Water Lane to Tribune 29-2 Negative Overall: 76 Located on a traffic-free segregated cycle route between Way Weekdays: 9 buildings/industrial units. It is in Clifton, approximately two Weekend days: 22 miles north of the centre of York. Weekday counts show commuting peaks. 24. Oakdale Road (South) 29-2 Negative Overall: 37 Located on a traffic-free path connecting Oakdale Road to Weekdays: 4 a lake in the Clifton area, approximately two miles north- Weekend days: 25 west of the centre of York. A school site is adjacent. Weekday counts show commuting peaks. 25. Oakdale Road (North) 29-2 Negative Overall: 38 Located on a traffic-free path connecting Oakdale Road to Weekdays: 45 a lake in the Clifton area, approximately two miles north- Weekend days: 24 west of the centre of York. A school site is adjacent. Weekday counts show commuting peaks. 26. Beckfield Lane 29-2 Positive Overall: 35 Located on a traffic-free shared use path adjacent to Weekdays: 64 Beckfield Lane. The site is two miles north-west of the Weekend days: 7 centre of York. Weekday counts show school and commuting peaks. 27. Millfield Lane (off-road) 29-2 Positive Overall: 26 Located on a traffic-free shared use path, approximately Weekdays: 55 two and half miles north-west of the centre of York. A Weekend days: 94 school is located nearby. Weekday counts show school and commuting peaks. 28. Rawcliffe Bar 2-2 Positive Overall: 26 Located on National Route 65 of the National Cycle Weekdays: 24 Network, a traffic-free shared use railway path. It is Weekend days: 32 approximately two miles north-east of the centre of York. The site is surrounded by green space and a sewage works is nearby. Weekday counts show commuting peaks. 29. Manor Lane to 29-2 Negative Overall: 3 Located on a traffic-free shared use path between houses. Hurricane Way Weekdays: 54 A retail park is nearby. It is approximately two and a half Weekend days: miles north-west of the centre of York. Weekday counts show commuting peaks. 2 Outcomes of the Cycling City and Towns programme: monitoring project report Individual town results: York April 27
13 3. Stirling Road 29-2 Positive Overall: 52 Located on a traffic-free cycle route adjacent to A237 Weekdays: 62 Stirling Road. The site is approximately two and a half Weekend days: 37 miles north of the centre of York at the outer edge of the urban area. A retail park is nearby. Weekday counts show commuting peaks. 3. Hull Road (off-road) 27-2 Weekday: -% Overall: 82 Located on a traffic-free cycle route adjacent to the dual Sat/Sun: -% Weekdays: 97 carriageway A79 Hull Road, outside Osbaldwick, two Weekend days: 55 miles east of the centre of York. The site is adjacent to the car park of a superstore. Weekday counts show commuting peaks. 32. Naburn Bridge 29-2 Positive Overall: 98 Located on National Route 65 of the National Cycle Weekdays: 7 Network, a traffic-free shared use railway path at the Weekend days: 299 southern end of Bishopthorpe, three miles south of the centre of York. Weekday counts show commuting peaks. 33. Clifton Bridge 29-2 Positive Overall: 436 Located on a traffic-free shared use path at the east end (eastbound off-road) Weekdays: 489 of Clifton Bridge, one mile north-west of the centre of Weekend days: 23 York. Weekday counts show commuting peaks. 34. Clifton Bridge 29-2 Positive Overall: 4 Weekdays: 455 Weekend days: 2 a data are also available for earlier periods, but to ensure consistency across the Cycling City and Towns these have not been included in the analysis b for counters with less than 36 months of data only a tentative indication as to the direction of the change can be reported: positive, negative or no change 3 Outcomes of the Cycling City and Towns programme: monitoring project report Individual town results: York April 27
 monitors movement towards the railway station.")
14 2.3 Relationship between programme activity and automatic count data 2.3. Access to station Access improvements to York railway station have been implemented during the Cycle City York programme, creating links to other key cycle routes. A counter located close to Scarborough Bridge (map reference ) monitors movement towards the railway station. Scarborough Bridge provides a direct link between the station area and the northern part of the city. It accesses a new point of entrance to the station which is fitted with ramps, making access to the platforms considerably quicker for travellers coming from this part of town. The new ramps were officially opened on 2 nd August 2 and therefore the full impact on cycling levels may not be apparent within the data included herein. The volume of cyclists counted in this location on weekdays is almost double that recorded on weekend days. There has been a year on year increase based on comparable months in 2 and 2 although there are insufficient data to quantify growth over time (Chart 2-). The hourly distribution of counts at this location indicates peaks in flows recorded around commuting times (Chart 2-2). Chart 2- Median daily count of cyclists recorded at Scarborough Bridge close to York railway station in comparable months in 2 and Median daily count of cyclists March April May June July August September The Scarborough Bridge counter was installed in March 2 and therefore March to September are the only months for which both 2 and 2 data are available. 4 Outcomes of the Cycling City and Towns programme: monitoring project report Individual town results: York April 27
15 Chart 2-2 Median hourly count of cyclists recorded at Scarborough Bridge on weekdays and weekend days in 2 and 2 cycli sts count of 4 3 coun of t hourl y 2 ho urly 2 n : 2: 4: 6: 8: : 2: 4: 6: 8: 2: 22: Medi an : 2: 4: 6: 8: : 2: 4: 6: 8: 2: 22: weekday 2 2 weekend Beckfield Lane route development A traffic-free route was created at Beckfield Lane to the north west of the city providing access to Manor Church of England school. The route opened in July 29. Two automatic cycle counters are located in the area, one on Beckfield Lane (map reference 26) and a second on Millfield Lane (map reference 27). Similar volumes of cyclists are counted at both locations, with higher levels of use on weekdays compared to weekend days (Chart 2-3). The dip in volumes of cyclists recorded in August, corresponding with the school summer holidays, suggests the use of the route for school journeys. Chart 2-3 Median daily count of cyclists recorded on weekdays and weekend days at Millfield Lane and Beckfield Lane Median daily count of cyclists Oct- De c- Fe b- Apr - Jun 9 A u g- - Au g- Oct - De c- Fe b- Apr Millfield Lane - weekdays - Jun Millfield Lane - weekend days - Median daily count of cyclists Au g Aug-9 9 Beckfield Lane - weekdays Beckfield Lane - weekend days 5 Outcomes of the Cycling City and Towns programme: monitoring project report Individual town results: York April 27
16 M edi anho urlyc Whilst there are insufficient data to make a robust estimate of change in volumes of cyclists using this route over time, for most comparable months a greater median daily count was recorded in 2 than in 2. The hourly distribution of counts at both locations indicate peaks in flows around school commuting times, suggesting the use of the route for travel to school (Chart 2-4). Chart 2-4 Median hourly count of cyclists recorded on weekdays in 2 and 2 at Beckfield Lane and Millfield Lane ounto fcy cli sts : 2: 4: 6: 8: : 2: 4: 6: 8: 2: 2 2: : 2: 4: 6: 8: : 2: 4: 6: 8: 2: 22: Beckfield Lane 2 2 Millfield Lane Fulford Road route development During the York Cycle City programme, on-road and traffic-free cycle routes were introduced on the Fulford Road corridor to the south of the city, between Heslington Lane and Cemetery Road. The new route developments opened in June 29. Two counters are located within the Fulford Road corridor: On the route at Cemetery Road (map reference ) On Maple Grove (map reference 3), on a route linking to Fulford Road Insufficient data are available to quantify change over time in the volumes of cyclists recorded at the Cemetery Road site. Where months can be compared between years (Chart 2-5), the pattern of change is mixed, with an approximately equal balance of decreases and increases when comparing like months. 6 Outcomes of the Cycling City and Towns programme: monitoring project report Individual town results: York April 27

17 Chart 2-5 Median daily count of cyclists recorded at Cemetery Road in 29, 2 and Median daily count of cyclists Jan Feb Mar Apr May Jun Jul Aug Sep Oct Nov Dec Cemetery Road The route adjacent to Maple Grove links the Fulford Road corridor with the Millennium Bridge. The median daily count of cyclists recorded at this location since 27 is presented in Chart 2-6. Whilst there is no strong upward trend in volumes of cyclists recorded, there is a slight but distinct step in the volumes of cyclists recorded in 29 onwards compared to previous years, potentially linked the surrounding route developments. 7 Outcomes of the Cycling City and Towns programme: monitoring project report Individual town results: York April 27
18 Ju l- Chart 2-6 Median daily count of cyclist recorded at Maple Grove, between Fulford Road and the Millennium Bridge 3 Fulford Road route developments Median daily count of cyclists Jan-7 Weekday Weekend 3 Analysis of manual count data Three distinct groups of manual counts are performed in York on an inner cordon, bridges and boundaries. These groups will be considered separately. 3. Inner cordon survey Cyclists are counted annually at 5 locations forming a cordon around York. Counts were performed in March or April between 2 and 29 and in October or November from 2 onwards. Quarterly counts were undertaken at of these locations between quarter 4 29 and quarter 2 although some data are missing, for example only two of the sites have data in quarter 3 2. The count locations forming the inner cordon, indicated on the accompanying map (section 9), are as follows: Bishopthorpe Road (map reference C5) Blossom Street (map reference C2) Bootham (map reference C3) Clarence Street (map reference C6) Fulford Road (map reference C5) Heslington Road (map reference C2) Heworth Green (map reference C) Huntington Road (map reference C9) Lawrence Street (map reference C3) Layerthorpe (map reference C7) New Walk (map reference C) Terry Avenue (map reference C4) Cinder Lane (map reference C8) Riverside Walk (map reference C) Leeman Road (map reference C4) 8 Outcomes of the Cycling City and Towns programme: monitoring project report Individual town results: York April 27

19 The counts were moved from March/April each year to October/November in 2 so that the inner cordon count coincided with the bridge and boundary survey. These more recent counts are therefore not consistent with previous years. In Chart 3- below the 2 and 2 counts have been reduced by 6% in order to make them more comparable with the earlier counts. The adjustment was calculated using the average counts in the relevant months in 2 for all automatic cycle counters less than a mile from the centre of York. Chart 3- Total count at 5 sites on the inner cordon around York between 2 and 2 4, 2,, Total count 8, 6, 4, 2, * 2* * denotes that the counts have been reduced by 6% in order to adjust for a timing difference between the counts Counts are relatively constant between 24 and 27 followed by a sizeable increase to 29. The percentage change between 27 (prior to the programme commencement in 28) and 29 is +33%. A decrease in counts was recorded between 29 and 2, prior to an increase beyond previous levels in 2. The pattern since 29 is consistent with the findings from the automatic cycle counter data. Counts in 2 and 2 were performed at the same time of year, and an increase of 3% is recorded between these two years. Three automatic counter locations coincide with inner cordon count sites. A +% annual increase in counts has been observed at St George s Field (map reference 5) and Cinder Lane (map reference 6). Rowntree Park (Terry Avenue) (map reference 7) is also on the cordon and the tentative indication of change over time is negative. The automatic cycle count data is therefore inconsistent with the growth suggested by the manual count data. This may be because the roads where manual count sites have been performed have benefited from Cycling City and Towns interventions, or there may have been displacement from the routes where the automatic cycle counters are located to the road network. Data for sites were collected quarterly between quarter 4 29 and quarter 2. Chart 3-2 compares data collected in quarter 4 29 and quarter 2 with data collected in quarter 4 2 and quarter 2 for the sites where data are 9 Outcomes of the Cycling City and Towns programme: monitoring project report Individual town results: York April 27

20 available. The three sites which are shaded in Chart 3-2 have missing data in one of these quarters. An alternative comparison has therefore been made based on one quarter in each year. For Lawrence Road and Heslington Road quarter 4 29 has been compared with quarter 4 2 and for Fulford Road quarter 2 has been compared with quarter 2. Chart 3-2 Comparison of manual count data collected on the inner cordon in York in quarter 4 29 and quarter 2 with data collected in quarter 4 2 and quarter 2 4 4, 3,5 3, Total counts 2,5 2,,5, 5 Bo ot ha m ClarenceStreet Huntington Road HeworthGreen Layerthorpe Lawrence Street BishopthorpeR oad HeslingtonRoad t Leeman Road BlossomStree Fulford Road Q Q 2 Q4 2 + Q 2 Significant increase Significant decrease Combining data from the eight sites for which a comparison between quarter 4 29 / quarter 2 and quarter 4 2 / quarter 2 can be made indicates a 2% increase. A significant increase was recorded at five sites and a significant decrease at two sites. The significant increase on Blossom Street may be partly due to improvements made to the junction of this road with Micklegate and Queen Street during autumn 2, including an advance priority signal for cyclists. Chart 3-3 below suggests that cycle counts on Blossom Street were also increasing prior to the improvements and therefore the more recent growth may be part of a longer term trend in this area. 4 Significant where p<.5 2 Outcomes of the Cycling City and Towns programme: monitoring project report Individual town results: York April 27

 A64 Bridge (map reference Br5) Data collected since 999 are presented in Chart 3-4.")
21 Chart 3-3 Manual counts on Blossom Road between 27 and 29 2, 2 hour count,5, 5 Blossom Street Bridge survey Manual counts have been undertaken annually (in October) at six sites since 99. These sites are on bridges which form a screenline from north to south through York. The counts are conducted on the following bridges: Rawcliffe Bridge (map reference Br6) Clifton Bridge (map reference Br4) Lendal Bridge (map reference Br) Ouse Bridge (map reference Br2) Skeldergate Bridge (map reference Br3) A64 Bridge (map reference Br5) Data collected since 999 are presented in Chart 3-4. Chart 3-4 Total count at six sites on bridges in York 7, 6, 5, Total count 4, 3, 2,, Chart 3-5 below indicates that counts for four of the bridge count sites peaked in 29, followed by a decrease in counts recorded in 2 and 2. 2 Outcomes of the Cycling City and Towns programme: monitoring project report Individual town results: York April 27

22 Chart 3-5 Total counts at five of the bridge manual count sites in York between 27 and 2 5 2,5 2, 2 hour count,5, 5 Rawcliffe Bridge Clifton Bridge Lendal Bridge Ouse Bridge Skeldergate Bridge Comparing data from 2 to 25 with data from 27 to 2 indicates that the bridge counts have increased significantly over this time period. Comparing data from 26 and 27 (pre-programme) with data from 2 and 2, however, indicates that there to have been a small increase in counts overall. The counts for these comparable periods are presented in Chart 3-6. Significant increases are recorded at two sites, and significant decreases at two sites. Chart 3-6 Comparison of manual count data collected at five of the bridge manual count sites in York in 26 and 27 with data collected in 2 and 2 6 4, 3,5 3, Total counts 2,5 2,,5, 5 Rawcliffe Bridge CliftonBridge LendalBridge Ouse Bridge Skeldergate Bridge Significant increase Significant decrease 5 The A64 Bridge count has not been included as zero counts were recorded in three of the years being analysed and very low counts were recorded in other years. 6 Significant where p<.5 22 Outcomes of the Cycling City and Towns programme: monitoring project report Individual town results: York April 27
 show a tentative increase in counts using data from 29 to 2.")
23 The automatic cycle counters on Scarborough Bridge (map reference ) and Naburn Bridge (map reference 32) also form part of this screenline and both indicate a tentative annual increase in counts. Data from the Clifton Bridge automatic cycle counters (map references 33 and 34) show a tentative increase in counts using data from 29 to 2. This is not consistent with the manual count data at this site (see Chart 3-5). The manual counts are undertaken in October or November and may therefore have been affected by poor weather conditions. 3.3 Boundaries survey The annual bridges and boundaries survey conducted in October each year includes the bridge sites detailed above and 2 manual counts at sites forming an outer cordon on main routes around York. These boundary sites are located away from the centre of York and therefore the programme was not expected to have had as much of an impact as in more central areas. Chart 3-7 Total count at 2 boundary manual count sites in York 3,5 3, 2,5 Total count 2,,5, Chart 3-7 suggests that counts in 2 and 2 are lower than in previous years. A comparison of data collected in 2 to 25 with data collected in 27 to 2 suggests a significant decrease in counts (p<.5). A comparison of data collected in 26 and 27 with data collected in 2 and 2 also indicates a significant decrease (p<.5). 4 Analysis of school related data During the Cycling City and Towns programme, Cycling City York has engaged with 6 schools through the Bike It programme. Due to the already high levels of cycle training in primary schools (around 64% of pupils participating), a number of events were organised to increase the profile of children cycling. These included themed bike rides (e.g. Biking Vikings, Roaming Romans), virtual competitions (e.g. End to End Cycle Race), Save My Bike days and Beauty & the Bike. 4. PLASC The percentage of pupils surveyed in York stating cycling to be their usual mode of travel to school are summarised in Table 4-. Considering data across all schools, the proportion of children cycling to school decreased, from 6.9% in the 26/7 23 Outcomes of the Cycling City and Towns programme: monitoring project report Individual town results: York April 27
24 academic year to 6.7% in 2/. The percentages cycling to school show substantial fluctuation year to year. Table 4- Percentage of pupils surveyed stating cycling to be their usual mode of travel to school a Academic year 26/7 27/8 28/9 29/ 2/ Primary 7.% 5.6% 6.8% 5.7% 5.%* Secondary 6.8% 9.9% 6.7% 6.4% 8.2%* All schools 6.9% 7.7% 6.8% 6.% 6.7% a These figures are based on data from 38 primary schools and nine secondary schools * indicates a significant change in cycling in the 2/2 academic year compared to the 26/7 academic year (p<.5) These changes are quite heavily influenced by two secondary schools which recorded counts of zero cyclists in at least one year and relatively high counts of cyclists in other years. Table 4-2 includes the percentage of pupils cycling to school if the data from these two schools are excluded. Table 4-2 Percentage of pupils surveyed stating cycling to be their usual mode of travel to school, excluding two secondary schools with questionable data a Academic year 26/7 27/8 28/9 29/ 2/ Primary 7.% 5.6% 6.8% 5.7% 5.%* Secondary 8.8% 8.3% 7.6% 7.5% 7.4%* All schools 7.8% 6.8% 7.2% 6.5% 6.%* a These figures are based on data from 38 primary schools and seven secondary schools * indicates a significant change in cycling in the 2/2 academic year compared to the 26/7 academic year (p<.5) Considering data across 45 schools (excluding the secondary schools noted above), there was a significant decrease in the proportion of children cycling to primary schools and secondary schools. Combining primary and secondary school data, the proportion of children cycling to school decreased from 7.8% to 6.%. 4.2 Bike It Bike It has been delivered in a total of 6 schools in York since 29/. Data are available in the standard format (i.e., pre survey followed by a post intervention survey at the end of the first academic year of engagement) for schools. Aggregated percentages of children cycling everyday for schools starting Bike It in each academic year during the programme are presented in Chart 4-. The change in the proportion of children reporting to cycle to school everyday between the pre and post survey is significant for schools starting Bike It in the 29/ academic year. 24 Outcomes of the Cycling City and Towns programme: monitoring project report Individual town results: York April 27
25 Chart 4- Proportion of children cycling to school everyday in the pre engagement Bike It survey and the first post-engagement survey Percentage cycling to school everyday Pre survey (n = 96) First post survey (n = 539) Starting BI 29/ ( schools) Significant (p<.5) Aggregating together data from all pre intervention and first post intervention surveys performed during the project, the percentage of children surveyed reporting to cycle to school everyday increased from.9% to 6.9% 7, whilst the proportion reporting to cycle to school regularly (everyday or once or twice a week) increased from 36.% to 4.8% 8. The proportion never cycling to school decreased from 48.5% to 4.7% 9. The proportion of children cycling to school on the day of the survey increased from 3.7% to 9.2%. Table 4-3 presents levels of cycling to school as recorded by PLASC in schools where Bike It was delivered between 26 and 2. In the table below non-bike It schools are those not engaged in Bike It at any point between 26 and 2 (excluding data from the two secondary schools excluded from Table 4-2 above). Table 4-3 Comparison of PLASC data from non-bike It schools and Bike It schools grouped by year of first engagement in York Non-Bike It schools a 7.8% 6.9% 7.3% 6.3% 5.6% Bike It in 29 b,c 7.2% 6.4% 6.8% 7.5% 7.7% a Data for 3 primary schools and six secondary schools that were not engaged in Bike It b Data for eight primary schools and one secondary school initially engaged in Bike It in 29 c PLASC data are collected in January. Bike It engages with schools from the beginning of the academic year. For schools starting Bike It in, for example, 29, the relevant PLASC year is 2 7 Significant increase (p<.5) 8 Significant increase (p<.5) 9 Significant decrease (p<.5) Significant increase (p<.5) 25 Outcomes of the Cycling City and Towns programme: monitoring project report Individual town results: York April 27
26 5 Route User Intercept Surveys Route user intercept surveys were undertaken at six locations in York in 2 and 2. Table 5- includes details about the six survey locations and the map references refer to Map below. Table 5- Route user intercept surveys undertaken in York Site Hob Moor (map reference R4) Survey dates Site description February, March Urban, traffic-free, not on the National Cycle and April 2 and Network connecting Acomb / Dringhouses to April 2 Tadcaster Road on to the city centre and the Millennium Bridge Hurricane Way February and Urban, traffic-free, not on the National Cycle (map reference March 2 and Network connecting Rawcliffe and Clifton Moor R6) March and April 2 Jubilee Terrace February and Urban, traffic-free, not on the National Cycle (map reference March 2 and Network connecting Salisbury Road to the city R) March and April centre 2 Millennium Bridge (map reference R3) Water End (map reference R2) February, March Urban, traffic-free, on the National Cycle Network and April 2 and connecting east and west York over the River Ouse March and April south of the city centre 2 February and Urban, road-adjacent, not on the National Cycle March 2 and Network connecting north York over the River Ouse March and April to the north of city centre 2 Water Lane February and Urban, traffic-free, not on the National Cycle (map reference March 2 and Network connection from York to Clifton Moor from R5) March and April the south 2 26 Outcomes of the Cycling City and Towns programme: monitoring project report Individual town results: York April 27

27 Map 5- Route user intercept survey sites in York In all cases, route users were counted and interviews performed over 2 hours on each of four days a school-holiday weekday, a school-holiday weekend day, a term-time weekday and a term-time weekend day. Two iterations of surveys were performed at each location, one in 2 and one in 2. The number of cyclists counted at each site over the four 2 hour periods in 2 and 2 are shown in Table Outcomes of the Cycling City and Towns programme: monitoring project report Individual town results: York April 27
28 Table 5-2 Total count of cyclists on four 2 hour counts in 2 and 2 at the six survey sites 2 2 Hob Moor Hurricane Way Jubilee Terrace 2, 2,948 Millennium Bridge 3,44 5,684 Water End,235 2,643 Water Lane 44,2 The automatic cycle counter next to the Millennium Bridge counted,263 cyclists on average per day in 2 2, as opposed to,42 on average per 2 hour survey count performed. This suggests that either the days on which the surveys were performed were busier than average or that the counter does not count all cyclists crossing the bridge. There is only one day on which the automatic cycle counter was functioning correctly that coincides with a survey (9/4/2). Over the same 2 hour period the automatic cycle counter counted,28 cyclists, whilst,693 cyclists were counted as part of the survey. This supports the assertion that the automatic cycle counter is undercounting cyclists crossing the bridge. The data for York were aggregated for 2 and 2. Although the majority of cyclists recorded were male (8.9% in 2 and 67.5% in 2), there was an apparent increase in the proportion of females recorded between the two iterations at all six sites (Table 5-3). Table 5-3 Percentage of female cyclists counted at each route user intercept survey site 2 2 Hob Moor 24.7% 33.2% Hurricane Way 8.3% 33.6% Jubilee Terrace 9.9% 32.7% Millennium Bridge 23.3% 33.7% Water End 9.4% 32.% Water Lane 5.2% 24.5% The four day manual count is scaled up to an annual total based on automatic cycle counter data collected on a comparable route. This process also accounts for the time of year at which the counts were performed. 2 This figure relates to the median of data collected within the programme period only and therefore includes data from // 3/9/. 28 Outcomes of the Cycling City and Towns programme: monitoring project report Individual town results: York April 27
29 Overall, the majority of cyclists in both survey iterations were making commuting journeys (6.4% in 2 and 62.4% in 2). In 2 other journeys were for leisure, shopping, education, other reasons and personal business (8.6%,.7%, 4.8%, 2.5% and.%, respectively). In 2 other journeys were for leisure, shopping, personal business, education and other reasons (2.3%, 8.7%, 4.4%, 3.2% and.%, respectively). Commuting was the predominant journey purpose for cyclists across all six sites (Table 5-4). The proportion commuting varied from 45% of cyclists on Hurricane Way to 7% on Jubilee Terrace in 2. There was a decrease in commuting between survey iterations at four of the six survey sites. The most notable increase in commuting was recorded at the Millennium Bridge site, where 62.5% of cyclists were commuting in 2 compared with 49.5% in 2. Table 5-4 Percentage of cyclists who were commuting at each route user intercept survey site 2 2 Hob Moor 62.% 54.9% Hurricane Way 53.6% 45.4% Jubilee Terrace 78.4% 7.8% Millennium Bridge 49.5% 62.5% Water End 57.3% 58.7% Water Lane 95.4% 65.3% In 2 and 2 the survey respondents were asked on how many days in the past week they had undertaken physical activity for 3 minutes or more. Over half of the cyclists (56.% in 2 and 67.8% in 2) had undertaken physical activity for 3 minutes or more on five or more days in the past week 3. 3 The percentage of respondents undertaking 3 minutes or more of physical activity on five or more days in the past week has been chosen for reporting as this is one way in which individuals can achieve the Department of Health guidelines on physical activity (Department of Health (2) Start Active, Stay Active: A report on physical activity for health from the four home countries Chief Medical Officers). 29 Outcomes of the Cycling City and Towns programme: monitoring project report Individual town results: York April 27
30 Table 5-5 Percentage of survey respondents undertaking 3 minutes or more of physical activity on five or more days in the past week at each route user intercept survey site 2 2 Hob Moor 67.6% 66.4% Hurricane Way 4.% 49.8% Jubilee Terrace 6.% 55.% Millennium Bridge 5.% 74.2% Water End 68.% 69.8% Water Lane 44.9% 69.4% When asked about their reasons for cycling for their journey and their opinions about the route, a high proportion of survey respondents at all of the sites agreed with the best transport option and most convenient route statements. The percentage ranged from 87.7% to 98.% for the best transport option statement and from 85.9% to 95.8% for the most convenient route statement. The highest percentage of survey respondents agreeing with both statements was recorded at Jubilee Terrace. The difference between survey sites was more marked for statements about whether respondents liked the surroundings and whether the route felt safe. The highest percentage of respondents agreeing with these statements was recorded at the Millennium Bridge site: 97.2% liked the surroundings and 88.3% felt that the route was safe. By contrast, at Water Lane 44.5% of survey respondents liked the surroundings and 53.2% felt that the route was safe. 6 Analysis of counts of parked bicycles data Fortnightly counts of parked bicycles are undertaken on three beats in York including the railway station, formal cycle parking in the city centre and on city centre footstreets. Counts have been undertaken since the late nineties. Chart 6- shows monthly counts of bicycles on each of the beats. Although there appears to be a decrease in counts in 2, there is an increase to previous levels in 2. Comparing data from January to August, there is a +2% increase in counts of parked bicycles at York railway station since 27 and a +3% increase in the city centre. Comparing data from January to June (as subsequent data are not available for 2), there is an +% increase in counts of parked bicycles on the city centre footstreets beat between 27 and 2. 3 Outcomes of the Cycling City and Towns programme: monitoring project report Individual town results: York April 27
31 Chart 6- Counts of parked bicycles in each month on three beats in York count Bicycle Jan-5 May- 5 Sep- 5 Jan- 6 May- 6 Sep- 6 Jan-7 May- 7 Sep- 7 Jan-8 May- 8 Sep- 8 Jan-9 May- 9 Sep- 9 Jan- May- Sep- Jan- May- York Railway Station York City Centre York City Centre Footstreets 7 Analysis of casualty data Cycle user casualty data were derived for York from STATS9 collision data. The average number of killed, seriously injured and slightly injured in each year prior to the Cycling City and Towns programme (23-28) are compared to those occurring during the programme in Table 7-. The difference between the occurrence of such incidents across the time periods compared is not significant. Table 7- Annual average number of cyclists killed or injured in York before (23-28) and during (29-2) the Cycling City and Towns programme Annual average number of casualties Killed Seriously injured Slightly injured Total Pre-programme During programme * indicates a significant change between cycling casualties recorded before and during the Cycling City and Town programme 8 Analysis of physical activity data Data are available from Sport England s Active People Survey (APS) for two years prior to the Cycling City and Towns programme and all three years of the project. The APS data provide information on the proportion of people cycling for at least 3 minutes once or more per month and the proportion cycling for at least 3 minutes, 2 or more times per month. It should be noted that the data refer only to cycling in bouts of 3 minutes or more and therefore this measure may under represent overall cycling in the towns as shorter journeys are not included. The proportion cycling once or more per month fell by 5.8%-points (from 22.8% to 7.%) in York between 27/8 and 2/. The proportion cycling 2 or more 3 Outcomes of the Cycling City and Towns programme: monitoring project report Individual town results: York April 27
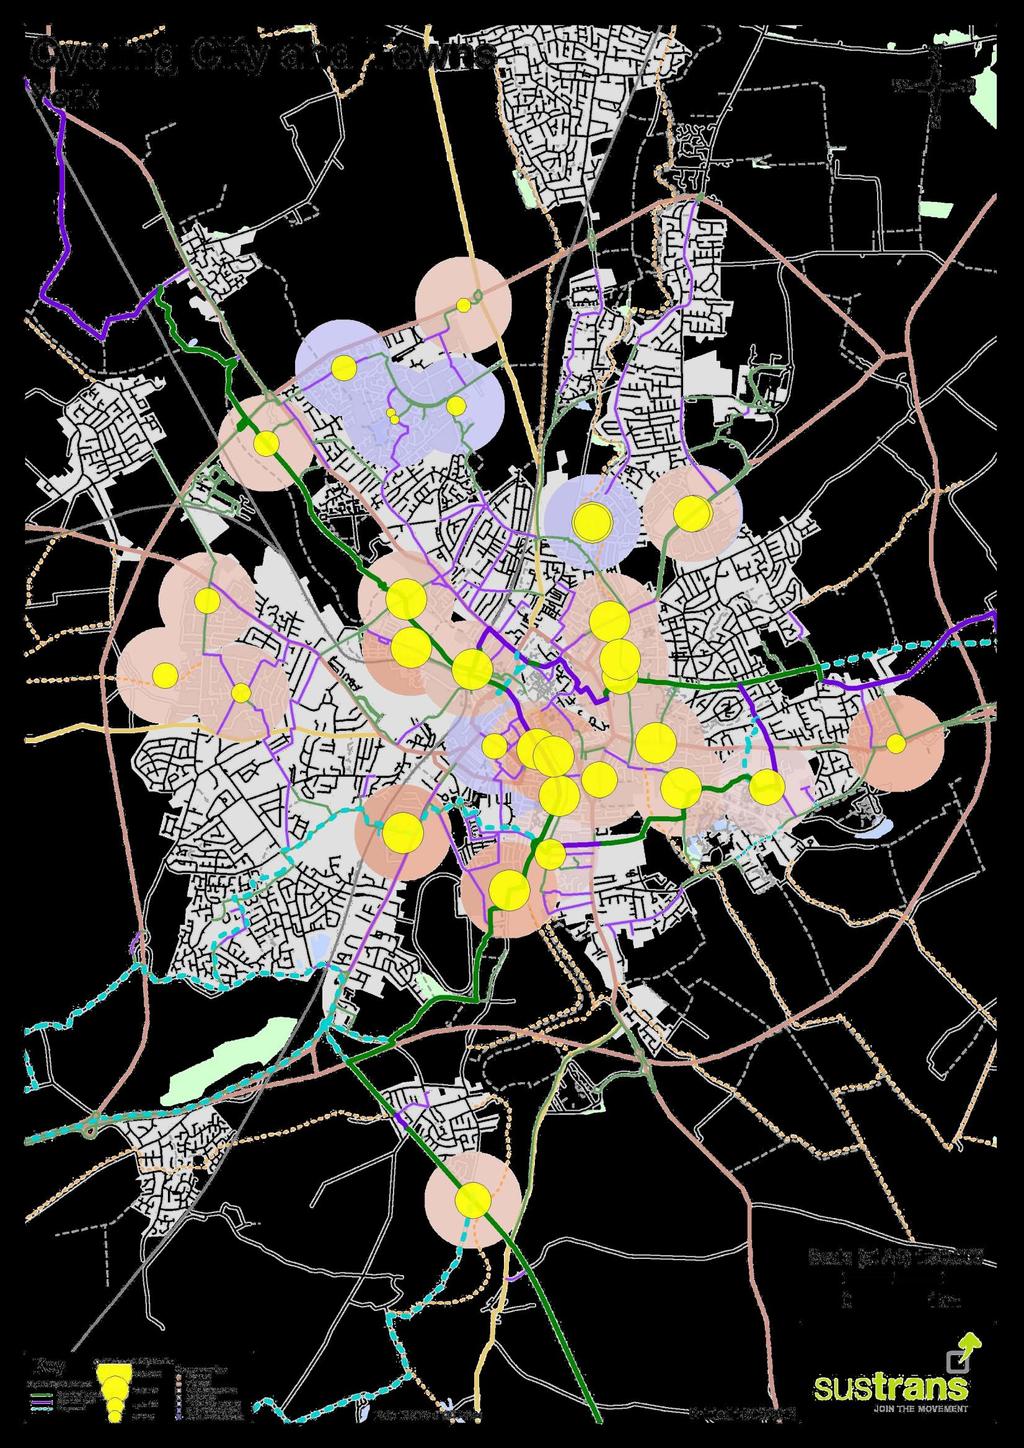
32 times per month fell by 3.9%-points (from 7.% to 3.%) over the same period. These are both significant decreases (p<.5). 9 Maps The following pages contain maps indicating the location of manual count and automatic cycle counter locations, and the estimated change in volumes of cycles recorded at these sites. 32 Outcomes of the Cycling City and Towns programme: monitoring project report Individual town results: York April 27

33
34
35
Outcomes of the Cycling City and Towns programme: monitoring project report
 Outcomes of the Cycling City and Towns programme: monitoring project report Individual town results: Leighton Linslade April 2017 Report authors: Andy Cope, Research and Monitoring Unit, Sustrans Angela
Outcomes of the Cycling City and Towns programme: monitoring project report
 Outcomes of the Cycling City and Towns programme: monitoring project report Individual town results: Colchester April 2017 Report authors: Andy Cope, Research and Monitoring Unit, Sustrans Angela Kennedy,
Outcomes of the Cycling City and Towns programme: monitoring project report
 Outcomes of the Cycling City and Towns programme: monitoring project report Individual town results: Blackpool April 217 Report authors: Andy Cope, Research and Monitoring Unit, Sustrans Angela Kennedy,
Outcomes of the Cycling City and Towns programme: monitoring project report
 Outcomes of the Cycling City and Towns programme: monitoring project report Individual town results: Shrewsbury April 2017 Report authors: Andy Cope, Research and Monitoring Unit, Sustrans Angela Kennedy,
Outcomes of the Cycling Demonstration Towns programme: monitoring project report
 Outcomes of the Cycling Demonstration Towns programme: monitoring project report Individual town results: Lancaster with Morecambe April 217 Report authors: Andy Cope, Research and Monitoring Unit, Sustrans
Outcomes of the Cycling Demonstration Towns programme: monitoring project report
 Outcomes of the Cycling Demonstration Towns programme: monitoring project report Individual town results: Darlington April 217 Report authors: Andy Cope, Research and Monitoring Unit, Sustrans Angela Kennedy,
Outcomes of the Cycling Demonstration Towns programme: monitoring project report
 Outcomes of the Cycling Demonstration Towns programme: monitoring project report Individual town results: Brighton and Hove April 217 Report authors: Andy Cope, Research and Monitoring Unit, Sustrans Angela
ANNEX1 The investment required to achieve the Government s ambition to double cycling activity by 2025
 ANNEX1 The investment required to achieve the Government s ambition to double cycling activity by 2025 May 2016 About Sustrans Sustrans makes smarter travel choices possible, desirable and inevitable.
The Infrastructure Impact Tool
 1 The Infrastructure Impact Tool Guidance notes Delivered by Sustrans in partnership with: 2 About Sustrans Sustrans is the charity making it easier for people to walk and cycle. We are engineers and educators,
Summary of Outcomes of the Cycling Demonstration Towns and Cycling City and Towns Programmes
 Summary of Outcomes of the Cycling Demonstration Towns and Cycling City and Towns Programmes Lynn Sloman, Andy Cope, Angela Kennedy, Fiona Crawford, Nick Cavill and John Parkin Report to the Department
European Levels of Investment in Cycling: Results and Insights
 Shifting Gears European Levels of Investment in Cycling: Results and Insights UWE, 2 July 2013 Dr Kiron Chatterjee Kiron.Chatterjee@uwe.ac.uk Associate Professor in Travel Behaviour Centre for Transport
The One Path Initiative
 About Sustrans 2017, Livia Lazar/Sustrans, all rights reserved Sustrans is the charity making it easier for people to walk and cycle. We are engineers and educators, experts and advocates. We connect people
Route User Intercept Survey Report
 Route User Intercept Survey Report Hills Road, Cambridge Fieldwork: October 2016 Report published: December 2016 1 About Sustrans Sustrans makes smarter travel choices possible, desirable and inevitable.
Active Travel Strategy Dumfries and Galloway
 Active Travel Strategy Dumfries and Galloway Our Active Travel Strategy The agreed Interventions for Dumfries and Galloway Council s Local Transport Strategy includes an action to Develop an Active Travel
Active Travel Towns Funding Scheme Project Proposal. Sligo. Sligo Local Authorities
 Active Travel Towns Funding Scheme 2014-2016 Project Proposal for Sligo by Sligo Local Authorities Introduction Over the last two years, Sligo Local Authorities have implemented years 1 & 2 of their 5
Scottish Parent Teacher Council School Travel Survey Introduction
 Introduction Scottish Parent Teacher Council (SPTC) is a membership organisation and charity whose purpose is to make parental involvement in children's education as good as it possibly can be. Sustrans
Cycle journeys on the Anderston-Argyle Street footbridge: a descriptive analysis. Karen McPherson. Glasgow Centre for Population Health
 Cycle journeys on the Anderston-Argyle Street footbridge: a descriptive analysis Karen McPherson Glasgow Centre for Population Health March 2017 Key points: There were 116,334 cycle journeys made using
CYCLING SCOTLAND SCOTTISH CHARITY NO.SCO Annual Cycling Monitoring Report
 CYCLING SCOTLAND SCOTTISH CHARITY NO.SCO29760 Annual Cycling Monitoring Report 2018 Annual Cycling Monitoring Report 2018 4 CYCLING SCOTLAND Annual Cycling Monitoring Report 2018 National cycling.scot
Transport Poverty in Scotland. August 2016
 Transport Poverty in Scotland August 2016 About Sustrans Sustrans is the charity making it easier for people to walk and cycle. We connect people and places, create liveable neighbourhoods, transform the
Transport Poverty in Scotland. August 2016
 Transport Poverty in Scotland August 2016 About Sustrans Sustrans makes smarter travel choices possible, desirable and inevitable. We re a leading UK charity enabling people to travel by foot, bike or
GD 0043/18 ACTIVE TRAVEL STRATEGY
 GD 0043/18 ACTIVE TRAVEL STRATEGY 2018-2021 May 2018 Minister s Introduction There is strong evidence that regular physical activity reduces the risk of a range of health conditions. The best way to increase
Determining bicycle infrastructure preferences A case study of Dublin
 *Manuscript Click here to view linked References 1 Determining bicycle infrastructure preferences A case study of Dublin Brian Caulfield 1, Elaine Brick 2, Orla Thérèse McCarthy 1 1 Department of Civil,
Active travel and economic performance: A What Works review of evidence from cycling and walking schemes
 1 Making the economic case for active travel Active travel and economic performance: A What Works review of evidence from cycling and walking schemes Active Travel Toolkit Slide Pack July 2017 Active travel
Cycle Superhighway 4 from Tower Bridge to Greenwich
 Cycle Superhighway 4 from Tower Bridge to Greenwich About Sustrans Sustrans is the charity making it easier for people to walk and cycle. We are engineers and educators, experts and advocates. We connect
Part 3: Active travel and public transport planning in new housing developments
 1 Linking active travel and public transport to housing growth and planning Part 3: Active travel and public transport planning in new housing developments Active Travel Toolkit Slide Pack July 2017 Linking
Using a Mixed-Method Approach to Evaluate the Behavioural Effects of the Cycling City and Towns Programme
 1 of 25 Using a Mixed-Method Approach to Evaluate the Behavioural Effects of the Cycling City and Towns Programme Kiron Chatterjee (Centre for Transport & Society, UWE) with acknowledgements to research
2011 Origin-Destination Survey Bicycle Profile
 TRANS Committee 2011 Origin-Destination Survey National Capital Region December 2012 TRANS Committee Members: City of Ottawa, including OC Transpo Ville de Gatineau Société de transport de l Outaouais
York Scarborough Bridge Economic Appraisal Update Technical Note
 York Scarborough Bridge Economic Appraisal Update Technical Note Specification No. 1 Client name West Yorkshire Combined Authority Client reference M088 Discipline Transportation Project name CCAG2 Economics
Our Cycle Promise. northernrailway.co.uk. Produced in partnership with Sustrans. July 2017
 Our Cycle Promise Produced in partnership with Sustrans July 2017 northernrailway.co.uk Contents Welcome 3 Working with others 4 Making your journey easier 5 to and from your local station 5 at the station
Cycling and Walking Investment Strategy & Local Cycling and Walking Infrastructure Plans
 Cycling and Walking Investment Strategy & Local Cycling and Walking Infrastructure Plans 1 Investing in cycling and walking contributes to a broad range of cross-cutting policy objectives Cycling and walking
SUSTAINABLE TRAVEL TOWNS: RESULTS AND LESSONS
 SUSTAINABLE TRAVEL TOWNS: RESULTS AND LESSONS Joe Finlay Sustainable Travel Team Department for Transport (UK) Introduction I will: Give brief background on the Sustainable Travel Towns and the projects
Regional Cycle Programme Update
 Agenda Item 10 (ii) Regional Cycle Programme Update Glossary Auckland Council Auckland Transport Cycle Action Auckland New Zealand Transport Agency Regional Cycle Network (AC) (AT) (CAA) (NZTA) (RCN) Executive
University of Leeds Travel Plan
 University of Leeds Travel Plan 2015-2018 Contents 1: Introduction 1.1 What is a Travel Plan? 1.2 Why do we need one? 1.3 Sustainability Strategy 2: Overview 2.1 The bigger picture 2.2 The City scale 2.3
UK Integrated Behaviour Change Programmes
 UK Integrated Behaviour Change Programmes 17 th November 2009 ACT TDM Summit Conference Daniel Johnson, Transport for London Nicky Ward, Steer Davies Gleave Structure 1. UK travel behaviour change 2. An
Baseline Survey of New Zealanders' Attitudes and Behaviours towards Cycling in Urban Settings
 Baseline Survey of New Zealanders' Attitudes and Behaviours towards Cycling in Urban Settings Highlights 67% of urban New Zealanders, 18 years of age or more own or have access to a bicycle that is in
Delivering Accident Prevention at local level in the new public health system
 1 Safety issue accidents don t have to happen Delivering Accident Prevention at local level in the new public health system Part 2: Accident prevention in practice Raise awareness Fact Sheet Road casualties
Final Plan 20 December 2016
 Final Plan 20 December 2016 Introduction Aims of the Travel Plan How do we travel? Understanding travel behaviours? The University Master Plan and its implications Galway City sustainable transport policies
London Cycle Network Annual Report 2000
 London Cycle Network Annual Report 2000 A cycle network for London by 2005 A cycle network for London by 2005 The London Cycle Network will: provide local links between residential neighbourhoods, railway
WEST YORKSHIRE LTP CYCLE PROSPECTUS
 WEST YORKSHIRE LTP CYCLE PROSPECTUS The West Yorkshire Ambition: To be recognised as a great place for safe cycling, inspiring more people to cycle more often. INTRODUCTION Cycling is low cost, environmentally
Nottingham Cycle City Frequently Asked Questions
 Nottingham Cycle City Frequently Asked Questions About the scheme How much money is to be spent on cycling? And where is the money from? We have 6.1 million in Growth Fund which we will be investing directly
Cambridgeshire floating bus stops interaction analysis
 Cambridgeshire floating bus stops interaction analysis Final report December 2015 About Sustrans Sustrans makes smarter travel choices possible, desirable and inevitable. We re a leading UK charity enabling
Summary of bicycle helmet law results in Western Australia
 Summary of bicycle helmet law results in Western Australia * All graphs, charts and tables presented in this document are scanned directly from reports published by Western Australia government departments,
CYCLING CHARTER ACTION PLAN EXECUTIVE SUMMARY
 CYCLING CHARTER ACTION PLAN EXECUTIVE SUMMARY THE VISION OF THE CYCLING CHARTER To realise the full potential of cycling s contribution to the health and wealth of the West Midlands creating more sustainable
Cycle journeys on the South-West City Way: a descriptive analysis. Karen McPherson. Glasgow Centre for Population Health
 Cycle journeys on the South-West City Way: a descriptive analysis Karen McPherson Glasgow Centre for Population Health March 2017 Key points: There were 107,000 journeys made using the route during the
Stepping up a gear. Our vision for cycling in Cardiff
 Stepping up a gear Our vision for cycling in Cardiff Cardiff is growing fast in fact, over the last 10 years its population has grown quicker than any UK city outside London and this rate of expansion
21/02/2018. How Far is it Acceptable to Walk? Introduction. How Far is it Acceptable to Walk?
 21/2/218 Introduction Walking is an important mode of travel. How far people walk is factor in: Accessibility/ Sustainability. Allocating land in Local Plans. Determining planning applications. Previous
Easton Safer Streets - Final Project Report BRISTOL
 - Final Project Report BRISTOL A Sustrans Community Street Design Project in partnership with Bristol City Council February 07 About Sustrans Sustrans makes smarter travel choices possible, desirable and
2014 peterborough city and county. active. transportation. & health. indicators primer
 2014 city and county active transportation & health indicators primer executive summary Walking, cycling and transit are good for our personal health, our local economies, and the environment. Understanding
Update June 2018 OUR 2017 PUBLIC ENGAGEMENT
 Update June 2018 Hi, Let s Get Wellington Moving (LGWM) is developing a Recommended Programme of Investment (RPI) that meets our programme objectives and supports the city s and region s growth. As part
Sustrans Scotland: walking and cycling outcomes
 Sustrans Scotland: walking and cycling outcomes Sustrans' Scottish Government Grant 2012 2015: First Interim Report September 2013 About Sustrans Sustrans makes smarter travel choices possible, desirable
Loughborough University Travel Planning
 Document Ti tle Client Name Loughborough University Travel Planning Loughborough University Travel Plan Executive Summary 2015-2020 23 December 2015 Loughborough University Travel Planning Project no:
To: The results of these surveys have been analysed and are summarised within this Technical Note.
 Technical Note Project: Histon Road / Milton Road, Cambridge Parking Surveys To: Andy Harrison Subject: Survey Report v1.6 From: Jonathan Barlow Date: 18 th February 2016 cc: Richard Jones / Dave Boddy
Neighborhood Influences on Use of Urban Trails
 Neighborhood Influences on Use of Urban Trails Greg Lindsey, Yuling Han, Jeff Wilson Center for Urban Policy and the Environment Indiana University Purdue University Indianapolis Objectives Present new
January Project No
 January 13 2015 Project No. 5070.05 Neil Connelly, Director University of Victoria, Campus Planning and Sustainability PO Box 1700 STN CSC Victoria, BC V8P 5C2 Dear Neil: Re: UVic 2014 Traffic Final Report
Nottingham, the great cycle city
 Nottingham, the great cycle city Our vision for the city s cycling future Foreword Councillor Jon Collins Leader of the Council Nottingham has a world class public transport system which is essential to
COUNT ME IN PEDESTRIAN COUNTERS CASE STUDY ABOUT THIS CASE STUDY:
 COUNT ME IN PEDESTRIAN COUNTERS CASE STUDY ABOUT THIS CASE STUDY: Getting hold of good data on the number of pedestrians is invaluable to plan and prioritise walking-friendly streets. This case study explains
Bicycle Crashes. Number of Bike Crashes. Total Bike Crashes. are down 21% and severe bike crashes down 8% since 2013 (5 years).
.") Bicycle Crashes The City of Fort Collins is well known for its bike culture, and there is a strong focus on encouraging increased riding. Bike safety is an important component of supporting these efforts.
Bicycle Crashes The City of Fort Collins is well known for its bike culture, and there is a strong focus on encouraging increased riding. Bike safety is an important component of supporting these efforts.
Summary of NWA Trail Usage Report November 2, 2015
 Summary of NWA Trail Usage Report November 2, 2015 Summary Findings: The study showed that Northwest Arkansas (NWA) had relatively high cyclist user counts per capita aggregated across the top three usage
BICYCLE INFRASTRUCTURE PREFERENCES A CASE STUDY OF DUBLIN
 Proceedings 31st August 1st ITRN2011 University College Cork Brick, McCarty and Caulfield: Bicycle infrastructure preferences A case study of Dublin BICYCLE INFRASTRUCTURE PREFERENCES A CASE STUDY OF DUBLIN
HAMILTON BIKING PLAN OUR VISION: A BIKE FRIENDLY CITY
 HAMILTON BIKING PLAN 2015-2045 OUR VISION: A BIKE FRIENDLY CITY INTRODUCTION Biking as a travel option is experiencing a resurgence internationally and in New Zealand, growing as a familyfriendly and healthy
KEY FINDINGS OF THE INTERIM EVALUATION OF THE SMARTER TRAVEL AREAS PROGRAMME
 Proceedings 1st - 2nd September 2016 BRICK, CANTWELL, SWIFT: Smarter Travel Areas KEY FINDINGS OF THE INTERIM EVALUATION OF THE SMARTER TRAVEL AREAS PROGRAMME Elaine Brick Associate Director AECOM Mairead
Analysis of 2015 Trail Usage Patterns along the Great Allegheny Passage
 Analysis of 2015 Trail Usage Patterns along the Great Allegheny Passage Prepared for the Allegheny Trail Alliance, August 2016 By Dr. Andrew R. Herr Associate Professor of Economics Saint Vincent College
AMETI PANMURE: A SUSTAINABLE TRANSPORT SOLUTION - OR NOT? Phil Harrison, Opus International Consultants
 IPWEA Conference: 7 June 11 June 2015 Abstract AMETI PANMURE: A SUSTAINABLE TRANSPORT SOLUTION - OR NOT? Phil Harrison, Opus International Consultants The AMETI project is a package of multi-modal transport
LESSONS FROM THE GREEN LANES: EVALUATING PROTECTED BIKE LANES IN THE U.S.
 LESSONS FROM THE GREEN LANES: EVALUATING PROTECTED BIKE LANES IN THE U.S. FINAL REPORT: APPENDIX C BICYCLIST ORIGIN AND DESTINATION ANALYSIS NITC-RR-583 by Alta Planning and Design Matt Berkow Kim Voros
Public Consultation on Braintree Integrated Transport Package (ITP) HAVE YOUR. Consultation open from 24 September to 5 November 2018 SAY
 HAVE YOUR. Consultation open from 24 September to 5 November 2018 SAY") Public Consultation on Braintree Integrated Transport Package (ITP) HAVE YOUR SAY Consultation open from 24 September to 5 November 2018 Contents Introduction 3 Background 4 Springwood Drive Roundabout
Public Consultation on Braintree Integrated Transport Package (ITP) HAVE YOUR SAY Consultation open from 24 September to 5 November 2018 Contents Introduction 3 Background 4 Springwood Drive Roundabout
Cycle traffic and the Strategic Road Network. Sandra Brown, Team Leader, Safer Roads- Design
 Cycle traffic and the Strategic Road Network Sandra Brown, Team Leader, Safer Roads- Design Highways England A Government owned Strategic Highways Company Department for Transport Road Investment Strategy
National Cycle Network - Signing and Route Branding
 National Cycle Network - Signing and Route Branding Technical Information Note No. 27 September 2012 About Sustrans Sustrans makes smarter travel choices possible, desirable and inevitable. We re a leading
Satisfaction with getting to work 56% 15% 6% 6% Total distance travelled. miles per week
 Page/... Headlines Emersons Green Travel to Work Survey March 0 Number of respondents Main modes of travel (%) 0% Satisfaction with getting to work % % Satisfaction with getting % % % (driver with others/
ABERDEEN: CITY OF THE FUTURE
 ABERDEEN: CITY OF THE FUTURE A contribution towards discussions on a future transport strategy for Aberdeen and its Region Prepared by the Centre for Transport Research University of Aberdeen June 2010
An introduction to the benefits of - a we developed monitoring process. Cycling Without Borders Conference. 19 th September 2014
 An introduction to the benefits of - a we developed monitoring process Cycling Without Borders Conference 19 th September 2014 Sustrans Research and Monitoring U Team of 30 - data collection experts Monitor,
Westminster s Joint Health and Wellbeing Strategy
 Westminster s Joint Health and Wellbeing Strategy 2013 2016 Response from Sustrans General comments From a strategic perspective, Sustrans welcomes the Health and Wellbeing Strategy s focus on encouraging
Walking and Cycling Action Plan Summary. A Catalyst for Change The Regional Transport Strategy for the west of Scotland
 Walking and Cycling Action Plan Summary A Catalyst for Change The Regional Transport Strategy for the west of Scotland 2007-2021 Strathclyde Partnership for Transport Contents Purpose...2 Issues, Constraints
Camosun College Modal Split
 2010 Camosun College Modal Split How Does the College Community Get to Campus? Shannon Craig & Julie Higginson Camosun College 1/21/2011 Contents Introduction... 3 Methodology... 3 Results... 6 Mode Share
National Bicycle and Pedestrian Documentation Project INSTRUCTIONS
 National Bicycle and Pedestrian Documentation Project INSTRUCTIONS The National Documentation Project (NBPD) is an annual bicycle and pedestrian count and survey effort sponsored by the Institute of Transportation
12. School travel Introduction. Part III Chapter 12. School travel
 12. School travel 12.1 Introduction This chapter presents the evidence on changes in travel patterns for the journey to school in the three towns over the period of the Sustainable Travel Town project.
A65 TRANSPORT ASSESSMENT. 13 th May 2005
 A65 TRANSPORT ASSESSMENT 13 th May 2005 1 CONTENTS 1.0 Introduction 2.0 Overview 3.0 Detailed Assessment of the A65 Corridor 4.0 Future Proposals 5.0 Conclusions List of Figures Figure 1: AM Average Traffic
The real cycling revolution. How the face of cycling is changing
 The real cycling revolution How the face of cycling is changing Contents Cycling steps up a gear on the National Cycle Network 3 Lower costs, no queues, and free exercise are driving change 4 The National
TYPES OF CYCLING. Figure 1: Types of Cycling by Gender (Actual) Figure 2: Types of Cycling by Gender (%) 65% Chi-squared significance test results 65%
 Figure 2: Types of Cycling by Gender (%) 65% Chi-squared significance test results 65%") TYPES OF CYCLING 1,980 responses were received to this question (multiple answers were allowed), 727 female (41%) and 1,242 (71%) from male respondents. The most common responses for both genders were
TYPES OF CYCLING 1,980 responses were received to this question (multiple answers were allowed), 727 female (41%) and 1,242 (71%) from male respondents. The most common responses for both genders were
Exploring the relationship between Strava cyclists and all cyclists*.
 Exploring the relationship between Strava cyclists and all cyclists*. Dr. David McArthur, Dr. Jinhyun Hong, Dr. Mark Livingston, Kirstie English *This presentation contains preliminary results which are
Birmingham Connected. Edmund Salt. Transportation Policy Birmingham City Council
 Birmingham Connected Edmund Salt Transportation Policy Birmingham City Council www.birmingham.gov.uk/connected Birmingham Connected the story so far Broadly following EU Guidance We ve done all of this
RE-CYCLING A CITY: EXAMINING THE GROWTH OF CYCLING IN DUBLIN
 Proceedings ITRN2013 5-6th September, Caulfield: Re-cycling a city: Examining the growth of cycling in Dublin RE-CYCLING A CITY: EXAMINING THE GROWTH OF CYCLING IN DUBLIN Brian Caulfield Abstract In the
Land Use and Cycling. Søren Underlien Jensen, Project Manager, Danish Road Directorate Niels Juels Gade 13, 1020 Copenhagen K, Denmark
 Land Use and Cycling Søren Underlien Jensen, Project Manager, Danish Road Directorate Niels Juels Gade 13, 1020 Copenhagen K, Denmark suj@vd.dk Summary: Research about correlation between land use and
DOE Climate Change Proposals
 DOE Climate Change Proposals Sustrans response to Proposals for Taking Forward NI Climate Change Legislation January 2016 About Sustrans Sustrans makes smarter travel choices possible, desirable and inevitable.
What s the issue for transport in Cardiff?
 Demand for travel The number of commuters travelling to work in Cardiff has increased from 190,000 in 2001 to 198,000 in 2010, with some 124,000 Cardiff residents travelling across the city daily to their
LEA BRIDGE ROAD - A STREET FOR EVERYONE Public consultation document
 LEA BRIDGE ROAD - A STREET FOR EVERYONE Public consultation document TELL US Bakers Arms to Leyton Green Road (Section D, E, F) Leyton Green Road to Whipps Cross Roundabout (Section G) YOUR VIEWS www.enjoywalthamforest.co.uk
Ben Timerson, MnDOT Erik Minge, SRF Consulting Group Greg Lindsey, University of Minnesota
 Ben Timerson, MnDOT Erik Minge, SRF Consulting Group Greg Lindsey, University of Minnesota 2050 Vision Minnesota Go Multimodal transportation system maximizes the health of people, the environment and
Satisfaction with getting to work 55% 17% 8% 7% Total distance travelled. miles per week
 Page/... Headlines North Bristol Suscom Travel to Work Survey March 0 Number of respondents 0 Main modes of travel (%) % Satisfaction with getting to work % % % % Satisfaction with getting % % (driver
A review of 2015 fatal collision statistics as of 31 December 2015
 A review of fatal collision statistics as of 31 December This report summarises the main trends in road fatalities that have emerged in. This has been prepared by the Road Safety Authority following analysis
Queensbury Tunnel. Estimating the economic impact of reopening walking and cycling routes around Queensbury Tunnel. June 2017
 Queensbury Tunnel Estimating the economic impact of reopening walking and cycling routes around Queensbury Tunnel June 2017 About Sustrans Sustrans makes smarter travel choices possible, desirable and
University of Victoria Campus Cycling Plan Terms of Reference. 1.0 Project Description
 University of Victoria Campus Cycling Plan Terms of Reference 1.0 Project Description The Campus Cycling Plan, a first for the University, will provide a comprehensive and coordinated approach to support
Chelmsford City Growth Package
 Chelmsford City Growth Package Public Consultation Document Volume 2 West Chelmsford July - August 2017 Chelmsford City Growth Package Public Consultation Document - Volume 2 - West Chelmsford Contents
BIKEPLUS Public Bike Share Users Survey Results 2017
 BIKEPLUS Public Bike Share Users Survey Results 2017 September 2017 Public Bike Share Users Survey Results 2017 The second annual Bikeplus survey combines robust data, and expert opinion to provide a snapshot
Child Road Safety in Great Britain,
 Child Road Safety in Great Britain, 21-214 Bhavin Makwana March 216 Summary This short report looks at child road casualties in Great Britain between 21 and 214. It looks at how children travel, the geographical
Our journey a 20 year Transport Manifesto for the North East
 Our journey a 20 year Transport Manifesto for the North East Sustrans submission to North East Combined Authority (NECA). March 2016 Summary Sustrans is a leading UK charity enabling people to travel by
January Transforming cities. The potential of everyday cycling
 January 2019 Transforming cities The potential of everyday cycling What is Bike Life? Bike Life is the UK s biggest assessment of cycling in cities. It is delivered by Sustrans in collaboration with 15
Department for Transport
 Improving UK evidence on health and environmental (low carbon) behaviours John Cummings Department for Transport 4 th November, 2015 CYCLING AND WALKING POLICY TEAM, OFFICIAL, 1st DRAFT 1 Walking and cycling
Service Business Plan
 Service Business Plan Service Name Transportation Planning Service Type Public Service Owner Name Kaylan Edgcumbe Budget Year 2019 Service Owner Title Service Description Manager of Transportation Planning
GETTING WHERE WE WANT TO BE
 CAMBRIDGESHIRE & peterborough GETTING WHERE WE WANT TO BE A GREEN PARTY TRANSPORT POLICY CONTENTS Our Campaign Priorities 4 Bus Franchising 6 Supporting Active Transport 8 Workplace Parking Levy 9 Tackling
Travel Patterns and Cycling opportunites
 Travel Patterns and Cycling opportunites The Household Travel Survey is the largest and most comprehensive source of information on the travel patterns of residents of the Sydney Greater Metropolitan Area
1.5 On this basis it is fundamental that the Transport Strategy for the site focuses on the following key criteria,
 1.0 Introduction 1.1 The Transport Assessment has been prepared on behalf of Eon and Roger Bullivant Ltd in respect of the proposed mixed use sustainable urban extension of Drakelow Park. 1.2 The methodology