AN EXPLORATORY DATA COLLECTION APPROACH FOR THE ASSESSMENT OF LEVEL OF SERVICE FROM A TRAVELER S PERSPECTIVE
|
|
|
- Philippa Martin
- 5 years ago
- Views:
Transcription
1 AN EXPLORATORY DATA COLLECTION APPROACH FOR THE ASSESSMENT OF LEVEL OF SERVICE FROM A TRAVELER S PERSPECTIVE By KIMBERLY SEAGER A THESIS PRESENTED TO THE GRADUATE SCHOOL OF THE UNIVERSITY OF FLORIDA IN PARTIAL FULFILLMENT OF THE REQUIREMENTS FOR THE DEGREE OF MASTER OF SCIENCE UNIVERSITY OF FLORIDA 2004
2 Copyright 2004 by Kimberly Seager
3 This document is dedicated to my two grandfathers who have passed away since I began college.
4 ACKNOWLEDGMENTS I would like to thank my committee chair and my committee chair members, Dr. Washburn, Professor Courage, and Dr. Li. I would also like to thank Cody for his help with all the equipment. I d like to thank Brad Choi for going with me to collect data and for convincing me to do a thesis. I would also like to thank David Kirshner and Luke McLeod for helping me on this project. iv
5 TABLE OF CONTENTS Page ACKNOWLEDGMENTS... iv LIST OF TABLES... vii LIST OF FIGURES... viii ABSTRACT... ix CHAPTER 1 INTRODUCTION...1 General Background...1 Problem Statement...2 Current Methodology Used to Define Service Measures...2 Applicable Service Measures for Urban and Rural Freeways...3 Research Objectives and Tasks...5 Organization of the Remainder of the Document LITERATURE REVIEW...6 Studies Pertaining to User Perceived LOS...6 Background Survey...17 Conclusions...18 HCM Freeway Analysis Methodology Overview...18 Urban and Rural Freeway Overview...18 Applicable Thresholds for Urban and Rural Freeways RESEARCH APPROACH...20 Alternative Approaches Evaluation...20 Video Data Collection Method...22 Vehicle Instrumentation...22 Data Collection Site Selection...24 Video Data Collection Runs...27 Video Clip Composition...32 Loop Data Collection...33 v
6 Pilot Test...34 Pilot Test Procedure...35 Survey RESULTS...38 Pilot Test Participant Feedback on Video Clips...38 Pilot Test Participant Feedback on Survey Instrument...39 Factors That Were Important in Evaluating Quality of Service...39 A Comparison of the HCM s LOS Evaluation to the LOS Ratings From the Pilot Test CONCLUSIONS AND RECOMMENDATIONS...43 Conclusions...43 Vehicle Instrumentation...43 Determination of Data Collection Sites...43 Collecting Video Data...44 Composition of Video Clips...44 Data Collection...44 Pilot Test...45 Recommendations...45 APPENDIX A COMMON ABBREVIATIONS...46 B POSSIBLE SITE LOCATION TRAFFIC INFORMATION...47 C FINAL SITE LOCATION DETAILS...52 D SITE LOCATIONS AND DRIVING TIME...59 E LOOP DATA SUMMARY TABLES...63 F PILOT TEST SURVEY...71 LIST OF REFERENCES...75 BIOGRAPHICAL SKETCH...77 vi
7 LIST OF TABLES Table page 3-1. Study Approach Alternatives Matrix Final Site Location Information Table Loop Detector Traffic Information Pilot Test Participants Factors Affecting Trip Quality Comparison of Results...42 vii
8 LIST OF FIGURES Figure page 3-1. Test Vehicle Front-View Camera Set-up Side-View Camera Picture Speedometer Camera Picture Equipment Connection Schematic Possible Site Locations Final Site Location Map Composite Video Screenshot...33 viii
9 Abstract of Thesis Presented to the Graduate School of the University of Florida in Partial Fulfillment of the Requirements for the Degree of Master of Science AN EXPLORATORY DATA COLLECTION APPROACH FOR THE ASSESSMENT OF LEVEL OF SERVICE FROM A TRAVELER S PERSPECTIVE By Kimberly Seager May 2004 Chair: Scott Washburn Major Department: Civil and Coastal Engineering Although the concept of level of service (LOS) for freeways is usually defined in terms of users perceptions, there have been very few studies that have sought drivers or passengers views about what is important to them. The objective of this study was to develop and test a method by which driver perceptions of LOS for varying roadway conditions can be collected. The approach decided upon was to create video clips of rural freeway driving conditions from the driver s perspective. These video clips consisted of the front-view, the rear-view, the side-view, and the speedometer. Each video clip was between 2 to 2 ½ minutes. In total, there were nine video clips. These video clips were then shown to seven pilot test participants. The participants were asked to rank the quality of their trip, the factors that influenced their trip quality, and the effectiveness of the video clips in terms of their ability to give the participants a feel for the traffic and roadway conditions they would experience if they were actually driving. An open ix
10 conversation was then held for the researchers to get advice about how to improve the videotapes. The four most common factors that influenced the participants trip quality were traffic volume, pavement quality, ability to maintain a constant speed, and the percentage of trucks. The participants results were then compared to the density-based LOS calculated by the Highway Capacity Manual (HCM). Out of the nine video clips, three were rated the same as the HCM s density-based LOS. Five other clips were rated one letter grade lower than the HCM s density-based LOS ranking. The last video clip was rated three letter grades lower than the HCM s density-based LOS ranking. Some suggestions and recommendations given by the pilot test participants were to add sound, improve the video quality, videotape during different times of the day and varying weather conditions, and videotape more peak hour traffic conditions. Two complaints about this method were that it was hard to determine the roadway s pavement quality and it was hard for some participants to compare two-lane rural freeways to threelane rural freeways. Out of the seven participants, three ranked this videotape method as very good. Another three ranked this method as good. One participant ranked this method as fair. x
11 CHAPTER 1 INTRODUCTION General Background Transportation engineers are continually faced with identifying roadway infrastructure improvements that will result in good benefit-to-cost ratios. Due to limited financial resources, it is extremely important to make good decisions regarding selected improvements. One of the most commonly used tools in the decision-making process is the Highway Capacity Manual (HCM). The HCM is the basic reference and procedural guide for traffic operations of analyses in the United States. It is one of the major resources used to predict operational improvements resulting from a new or improved facility. The HCM provides a systematic and consistent basis for analyzing the capacity and level of service (LOS) for various highway and street facilities, including signalized and unsignalized intersections, arterial streets, freeway segments, and highway segments. The HCM is published by the Transportation Research Board (TRB) of the National Academy of Sciences and is developed by the Highway Capacity and Quality of Service (HCQS) committee. A new edition of the HCM was published in 2000, the first complete revision of the HCM since LOS assessment of a roadway facility has become a major foundation of the HCM. The LOS concept is used in the HCM as a qualitative indicator of a traveler s trip quality under specified roadway, traffic, and control conditions. In the 2000 version of the HCM, LOS is described as a qualitative measure describing operational conditions within 1
12 2 a traffic stream, based on service measures such as speed and travel time, freedom to maneuver, traffic interruptions, comfort, and convenience [1]. The 2000 HCM divides quality of service into six levels of service, LOS A LOS F. LOS A represents excellent service and LOS F represents very poor service. If the HCM analysis yields LOS A, the user knows clearly that the road is uncongested. This facility has very low traffic volume and virtually no traffic congestion. At LOS C the facility is in the mid-range of congestion. If the facility is at LOS E, it is approaching its capacity, but still has undersaturated conditions. LOS F represents oversaturated conditions. This occurs when the traffic demand exceeds the capacity of the facility. Thus, the capacity of a roadway or intersection, as defined in the HCM, represents the boundary between LOS E and F. Problem Statement Current Methodology Used to Define Service Measures There is no commonly accepted quantitative procedure for setting LOS threshold values (the service measure values that delineate one LOS value from another). The criteria and breakpoints used to define LOS are based on the collective professional judgment of the members of the HCQS committee of the TRB. Therefore, the LOS threshold values represent the perspectives of transportation experts. The service measure for each facility type has generally been selected based on two considerations. The first consideration is that the service measure chosen should represent speed and travel time, freedom to maneuver, traffic interruptions, and comfort and convenience in a manner most appropriate to characterizing quality of service for the particular facility type being analyzed. The second consideration is that the service measure chosen should
13 3 be sensitive to traffic flow rates so that the service measure characterizes the degree of congestion of the facility [2]. However, the 1985 HCM described LOS as a qualitative measure that characterizes operational conditions within a traffic stream and their perception by motorists and passengers. The descriptions of individual levels of service characterize these conditions in terms of such factors as speed and travel time, freedom to maneuver, traffic interruptions, and comfort and convenience [3]. The quotation states that the perception of driving conditions by drivers and passengers is an essential element in evaluating the quality of service on a freeway facility. In addition, little has been done to compare the expert opinions of the HCQS committee with the user s perceptions of LOS despite a definition that suggests that it is driven by or meant to reflect user perception. When these service measures were chosen the committee probably felt that they were highly correlated with user perceptions, but they did not know for sure since users have rarely been asked how they felt. Research on traveler perceptions of quality of service is desirable so that the existing service measures can be validated (that the existing service measures and thresholds are reflective of how roadway users actually perceive conditions). This will assure transportation engineers and infrastructure investment decision-makers that improvements identified as a result of LOS analyses will actually be perceived as improvements by the traveling public. This will give the traveling public more faith in the abilities of the transportation engineering community and those in charge of managing the transportation system. Applicable Service Measures for Urban and Rural Freeways Rural freeways differ from urban freeways in that interchange spacing is much greater for rural freeways, posted speed limits are higher for rural freeways, and rural
14 4 freeways have a much larger percentage of social and recreational trips while urban freeways have a higher percentage of shopping and work trips, to name a few main differences. Yet rural and urban freeways have the same service measure (density) and thresholds for LOS, even though traveler perceptions and expectations are probably different for rural freeway trips and urban freeway trips. This belief is based on the premise that while urban freeway travelers experience the full range of LOS values, rural freeway travelers rarely experience density conditions that by current definition exceed LOS C. It is believed that travelers on rural freeways usually expect low-density conditions, and even moderate amounts of congestion can have a negative impact on a traveler s perceived quality of service being experienced [4]. If driver perceptions and expectations differ between rural and urban areas, the question that arises is whether rural and urban freeways should have the same service measure and/or thresholds. The concept of different service measures and/or thresholds for a certain facility type in areas with differing levels of development is nothing new. In fact, it is already being used for a couple of facility types. Other roadway facility analysis methodologies of the HCM have divided the facility type into different classes. For example, two-lane highways have been divided into two classes. The two-lane highway analysis procedure currently defines two classifications of highway by primary trip type served, with differing service measures and thresholds. For the service measure in common between the two classes (percent time spent following), the thresholds are different. Additionally, the urban arterials analysis methodology uses one service measure, average travel speed,
15 5 but four different sets of thresholds, corresponding to four different arterial street classifications. Research Objectives and Tasks The objective of this study was to develop and test a method by which driver perceptions of LOS for varying roadway conditions can be collected. The method that was chosen for this study was an in-vehicle video that would be shot from a driver s perspective. This will be described in detail in the research approach chapter. It is hoped that this method will provide the means to develop a procedure for estimating LOS on rural freeways based on drivers perceptions. Five major tasks were performed in the development of this method. These tasks are as follows: Determine how best to instrument the driving vehicle for the collection of rural freeway data via video Determine the rural freeway sites from which to collect video footage and traffic operations data Coordinate the simultaneous collection of loop detector data for the chosen sites Produce the final video clips to be used for survey participant review Pilot test the video scenes and LOS ranking survey Organization of the Remainder of the Document There are four remaining chapters in this document. Chapter 2 contains a summary of relevant literature and an overview of the 2000 HCM freeway analysis methodology. Chapter 3 contains the details of the research approach used for this study. Chapter 4 describes the results from the pilot test. The conclusions and recommendations section is contained in Chapter 5.
16 CHAPTER 2 LITERATURE REVIEW Although the HCM states that the concept of LOS should reflect traveler perception there have been very few studies that have sought travelers views about what factors are important to them in assessing trip quality. A literature review was conducted to identify previous research efforts into the specific issue of LOS perceptions by roadway users. Studies Pertaining to User Perceived LOS A study by Pécheux et al. [5] discusses how the right performance measures are not being used to measure traveler perceptions and satisfaction. The authors felt this way because there have not been many studies of drivers perceptions done or written about. Because there have been so few studies conducted to date in the area of traveler perception of quality of service, it is safe to assume that the performance measures currently in the HCM probably do not represent those most important to travelers. Pécheux et al. feel that if the HCM really means that LOS is meant to reflect drivers and passengers perceptions of the quality of service on a highway, then engineers cannot choose the performance measures as they have in the past. Instead, the public needs to decide what performance measures should be used to determine quality of service. This paper concluded that more studies need to be done focusing on traveler perceptions. A study by Sutaria and Haynes [6] used a road-user opinion survey to evaluate the current LOS methodology at signalized intersections. The survey involved depicting and rating different traffic situations at a signalized intersection. Two types of film sequences 6
17 7 were used: a driver s view and an overhead view of an intersection. Over 300 drivers rated randomly arranged films in terms of appropriate LOS. Field studies and the attitude survey given to the drivers surveyed provided data for the development of two models. According to the 1965 HCM, LOS is a qualitative measure of the effect of a number of factors, which include speed, travel time, traffic interruption, freedom to maneuver, safety, driving comfort, convenience, and operating costs [7]. Since there are stops at intersections, speed cannot be the appropriate measure of LOS for arterials. That led to the HCM establishing an operational index called load factor (LF). The HCM defined this index as a ratio of the total number of green signal intervals that are fully utilized by traffic during the peak hour to the total number of green intervals, for that approach during the same period [7]. The LF was then used to determine the various LOS at signalized intersections. Sutaria and Haynes decided that their premise would be that the quality of flow at any intersection should reflect the attitudes of the road users. Since there are different levels of satisfaction regarding intersection operation, they felt that the opinions of a group of road users could be used to establish a rational relationship between LF and LOS. To do this would involve a compilation of all the road users inclinations, feelings, and degrees of satisfaction about the quality of service at an intersection. Drivers subjective ratings of quality of flow at a signalized intersection would represent their attitudes or opinions, and LF, average individual delay (AID), or a saturation factor would represent an objective rating. The film segments chosen would represent various specific levels of service and would be shown to the drivers for a duration of one or two signal cycles. The final film
18 8 prepared was a compellation from one or two representative film segments for each LOS. The final film also included both types of view, and the order of the segments in each type was determined on a random basis. The survey consisted of two parts: a group attitude survey and the film survey. A user-response survey was decided upon because such an approach had been successfully utilized previously and showed that it could provide meaningful results. A questionnaire was developed for the group attitude survey. Drivers were asked to answer the first part of the questionnaire before they viewed the segments of film. The first part inquired about sex, age, driving experience, education, and type of roadway most often driven on. They were then requested to rate their opinions of five factors regarding the quality of service at an intersection: delay, number of stops, traffic congestion, number of trucks and buses, and difficulty of lane changing. Then the first part of the film was presented to them segment by segment. Each segment consisted essentially of a driver s view of approaching, waiting, and passing through the intersection. After each segment the group was requested to rate the traffic operations with regard to LOS provided. After the presentation of the film, the drivers were requested to again rate the five factors regarding quality of flow at the intersection. This was done in order to find out if the films influenced their initial opinions. In all, 310 respondents participated in the survey at several sessions. The results from the group attitude survey indicated that delay was considered the most important factor both before and after viewing the film segments. The other four factors changed in rank before and after viewing the films. Based on the results from the film survey, the hypothesis that LF is a better predictor of LOS than AID was not true.
19 9 This strongly supports the argument that the definition of LOS as a function of LF was not adequate. This lead to a new relationship among AID, LF, volume to capacity (v/c) ratio, and LOS based on user perception. This study was one of the first that asked users how they felt about traffic conditions. The results from this study changed the measure used by the HCM to assess LOS at signalized intersections. An additional study conducted by Pécheux et al. [8] addresses methodological issues faced in the development of a study to assess user perceived LOS at signalized intersections. This study had two main objectives. The first objective was to determine the appropriateness of the current LOS methodology by seeking users opinions. The second objective was to determine the factors affecting users LOS perceptions at signalized intersections. Although the concept of LOS is meant in part to reflect the operational conditions as perceived by motorists, the HCM LOS thresholds for signalized intersections were not based on studies of driver perceptions. The HCM criteria were created from observed field delays. Thus, each LOS represents different delay conditions, but not necessarily the delay that motorists perceived. The HCM specifies average control delay as the measure of effectiveness for signalized intersection LOS analysis, but it is unlikely that delay is the only factor that influences user perception of quality of service. The HCM uses the same delay thresholds that were established 15 years ago. Thus, travel conditions that would have been viewed as intolerable in the 1960s are considered normal by today s motorists, especially commuters. Methods of data collection evaluated for this project included: on-the-road field studies, controlled test-track studies, and controlled laboratory studies. The researchers
20 10 decided that subjects would be shown videos as though they were the driver. This method would allow for multiple subjects to be run simultaneously and give the researchers control over the experimental conditions. A questionnaire with three parts was designed to gather detailed subject information. The first part was designed to explore the subjects attitudes about driving in certain situations. The second part of the questionnaire was designed to explore personal characteristics of the subjects. Socio-demographic information was obtained in the third part of the questionnaire. Subjects were not persuaded to use delay for rating LOS, they were simply told to rate the quality of service provided by the traffic signal. The results of the survey show that subjects were more tolerant of delays than the HCM would suggest, and their LOS ratings tended to be similar for delays associated with LOS A and B and LOS C and D. The results also showed that subjects delay estimates were fairly accurate, but widely variable, as were their perceptions of LOS. Although a few subjects used delay as the only criterion when rating LOS, most subjects considered more than just delay. Fifteen factors were identified by the subjects as influential in their LOS ratings. They were as follows: delay size of intersection traffic signal efficiency pavement quality arrows/lanes for turning vehicles queue length visibility of traffic signals from queue traffic mix clear/legible signs and road markings location geometric design of intersection scenery/aesthetics leading left-turn phasing scheme presence of pedestrians
21 11 visual clutter/distractions These results suggest that users perceptions of LOS are sensitive to factors other than delay. The authors suggest in future experiments that the most important factors influencing users perceptions first be identified and then controlled in the experimental design. A study by Hall et al. [9] reports on the results of focus group sessions in which a group of commuters discussed their views about determinants of the freeway quality of service they experienced. The researchers tried to figure out what aspects of freeway travel are important to motorists. Hall et al. concluded that total travel time is the most important determinant for commuters, but a number of other aspects of the trip also mattered. These aspects included safety, traveler information, and maneuverability (density). This research used focus groups in order to determine what aspects of freeway travel are most important to motorists. There were two focus groups, one with five people, and the other with seven members. Focus group members were all university faculty members, in a wide range of departments. The total population of drivers included non-commuters as well as commuters, truck drivers as well as drivers of passenger cars, and a wide range of backgrounds and education. More men than women participated in this study. These people were selected to ensure that all of the participants traveled the same stretch of freeway, so that they all knew about the situations being discussed, and had relatively similar experiences. The research team felt that this would provide the most productive context for an exploratory analysis of users perceptions.
22 12 The focus groups lasted an average of one and a half hours. In the focus groups, perceptions of trip quality and the factors that influence trip quality were investigated, as well as the factors that influence changes in perception from trip to trip. The facilitator guided the focus group participants using an interview topic checklist containing a list of the topics relevant to the research, and a series of semi-structured, open-ended questions designed to draw out information on these topics. Finally, the researchers asked about the differences between being a driver and being a passenger. This was included in the topics discussed because the HCM states that the perceptions of both drivers and passengers are important. Preliminary results were circulated to research participants to help assess the credibility of the researchers interpretations of the experiences discussed. Responses indicate that the focus group participants agree with the researchers interpretations of their discussions. The results from the focus groups identified four primary factors that were important to urban freeway motorists. These factors were travel time, density, safety, and traveler information. Travel time is the first thing respondents used to describe the quality of a particular trip. How long it takes to get from where they are to where they need to be was the most important measure of the quality of that particular trip. Having time constraints on their arrival greatly increases the stress involved in the trip and with it the perceived quality of the trip. The participants also felt time spent commuting was lost time as far as they were concerned. An indicator of the importance of travel time was that when researchers asked about trips that were less than desirable the first item that came up in response was construction. Construction was mentioned because it tended to slow traffic down. The other indicator was the length some people went to in order to
23 13 keep the travel time relatively short. An example of this would be leaving the house for work at 4 a.m. instead of 6 a.m. A number of other issues were mentioned in the focus group: density, accidents, travel information, driver civility (or incivility), the use of photo radar, and weather. The way the focus groups felt about density was best summarized by the following comment. Even if there s an extraordinary volume of traffic, as long as it s clicking along, even if there s cars all around you, and trucks and everything, as long as everybody s going then it s just a question of time [9]. Participants were concerned about accidents not only in terms of congestion, but also because of the risk to their personal safety. Having adequate information about what was happening to traffic while they were on the road was also important to participants. Driver civility and politeness were mentioned in reference to the notion of lane etiquette (i.e. using different lanes for different speeds and to pass). The responses of both focus groups made it clear that people have a very different perspective on the trip when they are passengers as compared to drivers. The focus group participants felt that the tension and sense of responsibility are much less as a passenger than as a driver. Also, there is not the same degree of concern about the travel time. This paper was helpful because focus groups were one of the options considered in the alternative approaches evaluation. This paper also showed that density is not the only factor considered by drivers. A paper by Hostovsky and Hall [10] deals with the perceptions of tractor-trailer drivers regarding the quality of service on freeways. This was accomplished by a focus group with professional tractor-trailer drivers. Because of the different performance
24 14 characteristics between automobiles and tractor trailers, their reasons for being on the road, and the amount of time spent on the road, it is reasonable to expect that different factors will affect truck drivers perceptions of freeway quality of service. The paper also compares and contrasts tractor-trailer drivers perceptions with factors that are important to freeway automotive commuters. The focus group was held on November 15, 2001 and consisted of seven tractortrailer drivers. The session lasted for one and a half hours. The focus group was structured the same way as described in Hall s previous paper [5]. The researchers concluded that freeway conditions in general were the most frequently mentioned factors. The three variables that were used to describe traffic conditions were: travel time (or speed), traffic density (or maneuverability), and traffic flow. The most significant finding was that it is traffic flow that matters to tractor-trailer drivers, not density. Other important items that affected the perceived quality of service included weather, attitudes toward other drivers, and road rage. Some of the freeway conditions discussed included the condition of the road surface, lane restrictions, lane width, lane markings, and signage. These factors did not come up in the previous focus groups with freeway automobile commuters. The tractortrailer drivers contended that trucks have been getting longer and wider at the same time lanes are getting narrower. The condition of the road surface was not the only concern to tractor-trailer drivers, but traffic conditions were also important. A steady traffic flow within an acceptable range was more important to them than actual traffic density. It was clear from the focus group discussion that although tractor trailer drivers are concerned with some of the same characteristics of a freeway journey as are automobile
25 15 commuters, they also have some different concerns. Urban freeway commuters primary concern was travel time. Steadiness of the traffic flow was more important in terms of trucker s perception of the quality of service. Three other issues were also important to these truckers for their overall opinion on trip quality. The first was simply the physical condition of the roadways. The second was maneuverability. Urban commuters seemed content to stay in one lane. Meaning, maneuverability was not important in the urban context due to higher traffic density. The third trucking issue was the safety of the trip. Safety was also an important concern with urban commuters, although the nature of their concerns differed. This paper was informative because it went on to compare and contrast tractor-trailer drivers perceptions with factors that are important to freeway automotive commuters. In a study by Hostovsky et al. [11] focus group participants identified three themes important for rural freeways LOS. These three themes included the ease of rural driving (i.e. low density), predicable travel time and steady travel speed, and ample maneuverability on rural freeways. There was also concern about safety related problems on rural freeways, such as problems associated with the isolated nature of rural freeways in association with weather conditions. Secondary rural freeway themes included aesthetics, speeding, the discomforting presence of trucks, and the need for better commuter information. This is an important paper because it showed that rural freeway driver s consider other factor besides density in rating the quality of service of their trip. A paper by Nakamura et al. [12] summarizes a study performed along the Tomei Expressway in Japan on November 27, In this study, traffic flow conditions along a section of a basic intercity motorway were evaluated from the driver s viewpoint. The
26 16 study consisted of a field driving survey that was intended to collect data on the degree of driver s satisfaction under various uncongested traffic flow conditions along a rural motorway. The major concern of this study was to quantitatively analyze the interrelationship between traffic flow conditions (traffic volume, speed and lane utilization ratio), drivers perceptions (utility and degree of satisfaction) and driving behaviors (lane changing, adjustment of acceleration and adjustment of spacing) [12]. The objective of the field driving survey was to collect data on the perception of drivers and to observe driving behavior under various uncongested traffic flow conditions. Twenty-two subject vehicles drove themselves from the on-ramp to the offramp and back along the Tomei Expressway. A video camera was mounted on the navigator s seat of each vehicle to have the front views recorded. After every trip the subject driver was asked to answer a survey about the traffic flow conditions. A total of 105 surveys were collected. Each traffic flow condition was evaluated using a scale from one to five. The data collected for driving behavior was the number of lane changes, elapsed travel time by lane, and percentage of time spent following another vehicle. It was found that the factor that most strongly affected the degree of driver s satisfaction was the traffic flow rate. The number of lane changing, the percentage of time spent following, and the driving experience also affected the evaluation of the traffic condition. In addition, setting the LOS based on the average degree of driver s satisfaction was tried and was compared with the conventional LOS measures. The results suggest that the current traffic conditions on Japanese motorways hardly satisfy drivers. Meaning, if highways are designed employing the volume to capacity (v/c) ratio that is set only from the driver s degree of satisfaction it would take an enormous
27 17 monetary investment. This paper was helpful not only because it seeks users opinions but because having participants drive along rural freeways was one of the options considered in the alternative approaches evaluation. A few things to consider about this study are that this study was performed in Japan. Also, it collected 105 surveys from only twenty-two subjects. In a study initiated by the Wisconsin Department of Transportation (WDOT) [13] video segments of traffic operations at selected points along a highway were shown to subjects to try and determine what factors were important to motorists. Survey forms were also used to gather data and correlate it with field measurements of operational measures of effectiveness (MOE). In addition, qualitative input was sought from road users, using focus groups to gain further insights. Survey respondents were shown 50- second video clips for six different four-lane rural freeways. Field-measurements were made to determine volume and speed for the video segments shown to the subjects. Density was determined by calculation. The results showed that density and speed were both found to be significantly related to the subjective rating of overall quality of flow. This was a helpful paper because it performed a similar study (by showing video clips to participants and asking their opinion of the roadway conditions) to the type of research that will be performed. Background Survey A study conducted at the University of Florida [4] was performed hoping to obtain preliminary information about what factors are important to driver s when evaluating the quality of their trip on a rural freeway. After consideration of several potential methods for obtaining direct traveler input (i.e., focus groups, post simulation/video review, interview, etc.), it was decided to use a survey-based approach. One of the intents of this
28 18 survey-based approach was to help guide a more focused follow-on study that might make use of an alternate method that will only allow for a relatively small sample size. Two-hundred and thirty-three travelers were surveyed. The most important factors to drivers were decided on by the percentage of time they were ranked first, second, or third by drivers. The surveys concluded that the most important factor to drivers was the ability to consistently maintain their desired travel speed. This was in the top three 64.3% of the time. The second ranked factor was the ability to change lanes and pass other vehicles easily. This was part of the top three responses 33.3% of the time. The third most important factor to drivers was the ability to travel at a speed no less than the posted speed limit. This was in the top three 33.0% of the time. These results show that although density is important to drivers it is not the most important factor, driver s consider other factors besides density in the quality of service of their trip. Conclusions A recent survey of customer-oriented practices of highway agencies pointed out that a customer-oriented perspective not only increases the quality of performance but also helps build and sustain necessary public support for transportation programs [14]. This literature review has shown while it may not be possible to evaluate how drivers perceive the quality of their trip with extreme precision and confidence, it is still possible to arrive at useful conclusions which can help the decision makers more closely reflect user perceived quality of service. HCM Freeway Analysis Methodology Overview Urban and Rural Freeway Overview The HCM defines a freeway as a multilane, divided highway with a minimum of two lanes for the exclusive use of traffic in each direction and full control of access
29 19 without traffic interruption [1]. The service measure used to determine LOS for freeways is density (passenger cars per mile per lane). Density is a function of both speed and flow rate, which incorporates consideration of freedom to maneuver, driver comfort and convenience. Applicable Thresholds for Urban and Rural Freeways LOS has evolved throughout each revision of the HCM. The original HCM used a basic three-point scale to define level of capacity. In 1963 level of capacity was abandoned for the LOS concept. In 1965 a six point LOS definition was introduced in the HCM, LOS A LOS F. In 1985 the six point LOS scale was redefined to include traffic density (vehicles per unit length of roadway) as the measure for defining LOS for basic freeway sections. This is still used today. Not only do rural and urban freeways have the same service measure, density, but they also have the same limits for LOS. LOS thresholds for a basic freeway segment are summarized below. LOS Density Range (passenger cars/mile/lane) (pc/mi/ln) A 0-11 B > C > D > E > F > 45
30 CHAPTER 3 RESEARCH APPROACH Alternative Approaches Evaluation The objective of this study was to develop and test a method by which driver perceptions of LOS for varying roadway conditions can be collected. It is hoped that this method will provide the means to develop a procedure that will lead to specific recommendations for rural freeway LOS criteria and thresholds. An alternative approaches evaluation was created to weigh the pros and cons for methods of collecting driver s input about their driving experiences on rural freeways. Methods of data collection evaluated for this project included: focus groups, in-field surveys, videos from an overhead perspective, videos from a driver s perspective, a driving simulator, driving test participants on rural freeways, and having test participants drive themselves on rural freeways. These are now described in more detail. Focus Group: This method would consist of recruiting individuals to participate in group discussions with a facilitator to guide the discussion in a constructive manner such that the participants reveal the most important factors to them in evaluating quality of service. In-Field Survey: This approach would consist of developing a more focused survey based on the results from the University of Florida s study [4]. The survey would solicit driver opinions about various factors related to the perception of the quality of their trip on a rural freeway. Videos From an Overhead Perspective: This method would consist of having test participants review pre-recorded traffic scenes from an overhead perspective and then answer survey questions related to the observed video scenes. Videos From a Driver s Perspective: This approach would consist of test participants reviewing pre-recorded traffic scenes from a driver s perspective and then answering survey questions related to the observed video scenes. 20
31 21 Driving Simulator: This approach would consist of having test participants drive sections of a simulated rural freeway in which traffic and roadway conditions are systematically varied. Specific LOS thresholds would be determined from observed driving behavior and questionnaires administered either during or after the simulation exercises. Driving Test Participants Around on Rural Freeways: This approach would consist of having test participants ride in a vehicle driven by a research official, during which the participants would fill out a trip quality questionnaire, with responses being dependent on the given roadway and traffic conditions being experienced at that time. Recruiting Test Participants to Drive on Rural Freeways: This method would consist of having test subjects drive vehicles in the traffic stream and provide the researchers with real-time feedback either instrumented or verbal. A matrix was developed for these seven different methods of data collection. This matrix is shown in Table 3-1. The matrix had nine different criteria on which each approach was judged. For each criterion, each approach was evaluated with a low, medium, high, or not applicable (NA) ranking, depending on how the criterion related to the approach. The nine criteria chosen for this matrix were: number of test subjects at once, control over experimental conditions, liability issues, responses while conditions still fresh in mind, supplemental data collection, driver s perspective, concern of motion sickness, ability to relate to actual driving situation, and being directly in control of the driving situation. These criteria are now described in more detail. Multiple Test Subjects at Once: This criterion evaluated the number of test subjects that could participate at one time. Control Over Experimental Conditions: This evaluated whether the researchers would be able to control the experimental conditions (i.e. density, percentage of trucks) at the time the subjects participated in the study. Liability Issues: This criterion dealt with the liability concerns for the test participants and/or researchers at the time the study was prepared and conducted. Responses While Conditions Still Fresh in Mind: This criterion evaluated if the responses from the subjects would occur during, right after, or a considerable amount of time after a rural freeway trip.
32 22 Supplemental Data Collection: This criterion addressed if supplemental data collection (i.e. density, percentage of trucks) would be necessary and if so to what extent. Driver s Perspective: This criterion evaluated if the approach would give the subject a perspective as if he/she were the driver. Concern of Motion Sickness: This criterion addressed the possibility of participants getting motion sickness during the study. Ability to Relate to Actual Driving Situation: This criterion evaluated the subject s ability to relate this approach to a real world driving situation. Being Directly in Control of the Driving Situation: This criterion evaluated if the participant was able to control the movements made during the study. It explores if the participants were able to drive how they would normally drive on the rural freeway. The in-vehicle video approach was thought to offer the best compromise between a realistic driving experience, study efficiency, and liability concerns. As the literature review has shown, video studies in laboratory situations have been successfully used in traffic perception studies for at least 40 years. Video Data Collection Method Since it was concluded to show test participants videos as if they were the driver, a data collection method was developed for this task. The development of this method consisted of six parts: vehicle instrumentation, determination of data collection sites, collecting video data, composition of video clips, data collection, and a pilot test. Vehicle Instrumentation Again, the objective was to create video clips of rural freeway driving conditions from the driver s perspective. It was decided to capture the following fields-of-view (FOV) from within the vehicle: Front windshield and rear-view mirror Side-view mirror Speedometer
33 23 Table 3-1: Study Approach Alternatives Matrix Number of Test Subjects at Once Control over Experimental Conditions Liability Issues Responses While Conditions Still Fresh in Mind Supplemental Data Collection Driver s Perspective Concern of Motion Sickness Ability to Relate to Actual Driving Situation Being Directly in Control of the Driving Situation Focus Group Med NA Low Low Low Low NA Low NA In-Field Surveys High Low Low High Low High NA Med High Videos from an Overhead Perspective Med High Med High High Low Low Low Low Videos from a Driver s Perspective Med High Med High High Med Med Med Low Driving Simulator Med High Low High Low Med High Med High Driving Test Participants on Rural Freeways Low Low High High High Med Med High Low Having Test Participants Drive on Rural Freeways Low Low High High High High Low High High

34 24 The vehicle used for instrumentation was a Chevrolet Venture mini-van. The vehicle is shown in Figure 3-1. A total of three video cameras were used. Each video camera was attached to a VCR. A video monitor was attached to each VCR such that a visual confirmation could be made of each camera s FOV. A microphone was also connected to the audio input of one of the VCRs. Portable 12-volt batteries were used as the power source for all the equipment. The front-view Figure 3-1: Test Vehicle camera was set up on a pole between the two front seats. It was attached to the driver s armrest. This is shown in Figure 3-2. The side-view camera was attached to a pole between the driver s seat and door. This is shown in Figure 3-3. The third camera was positioned on the dashboard to capture the speedometer. Duct tape was used to cover the instrument panel to help reduce the glare. This is shown in Figure 3-4. An equipment connection schematic is shown in Figure 3-5. Data Collection Site Selection The rural freeway sites used were all within Florida. It was desired to obtain actual traffic conditions at the time the video data collection runs were made. Thus, one of the requirements in site selection was the presence of inductance loop detectors on the segment. The Florida Department of Transportation (FDOT) maintains an extensive network of inductance loop detectors (ILD) on the Florida Intrastate Highway System (FIHS). There are over 7,500 detector stations on the state s highways. There are two types of ILD stations, telemetered and portable. The telemetered stations were preferred


35 25 Figure 3-2: Front-View Camera Set-up Figure 3-3: Side-View Camera Picture Figure 3-4: Speedometer Camera Picture Figure 3-5: Equipment Connection Schematic because they record data on a continuous basis (365 days a year) and are permanent stations. The portable stations require a traffic data recorder to be installed in a roadside cabinet (adjacent to the ILD station). Each ILD station has a unique identification number assigned to it. The data collected at the ILD stations is compiled every year and made available on the Florida Traffic Information (FTI) CD [15]. Some other
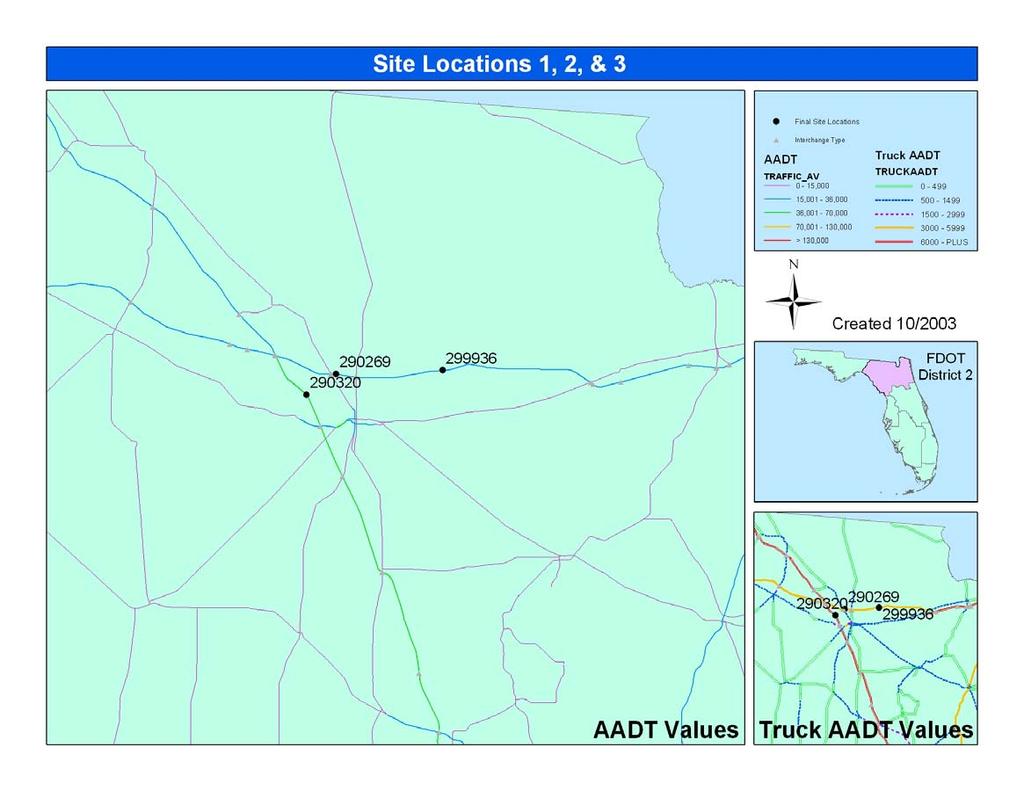
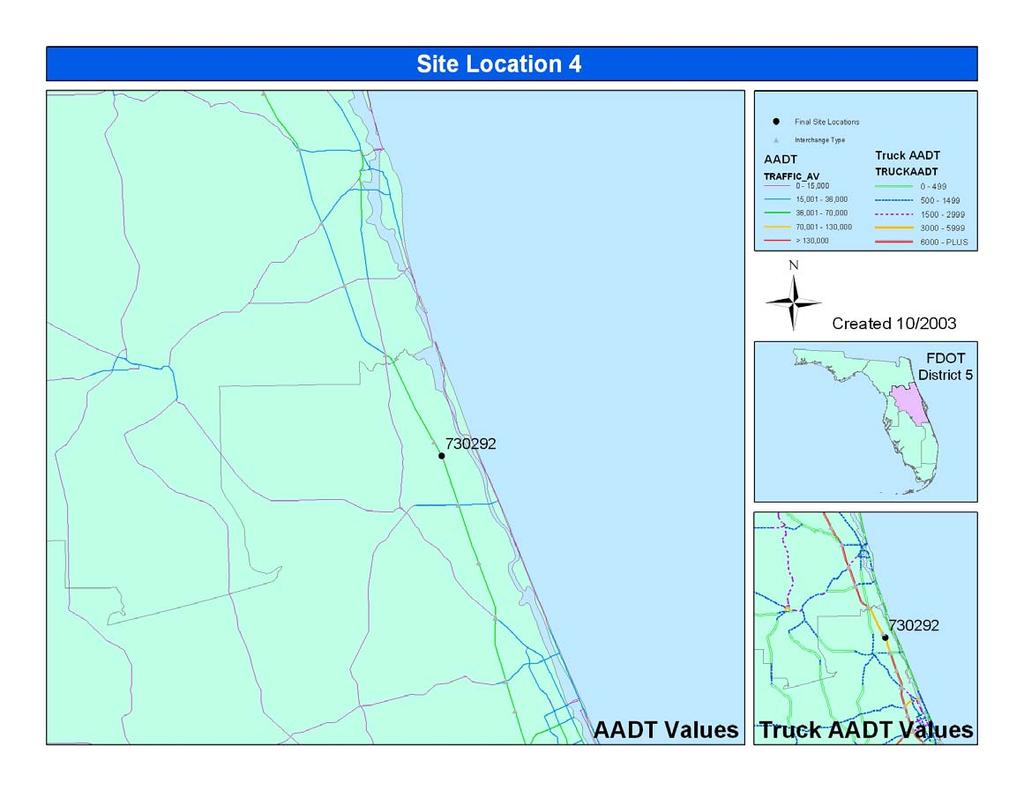
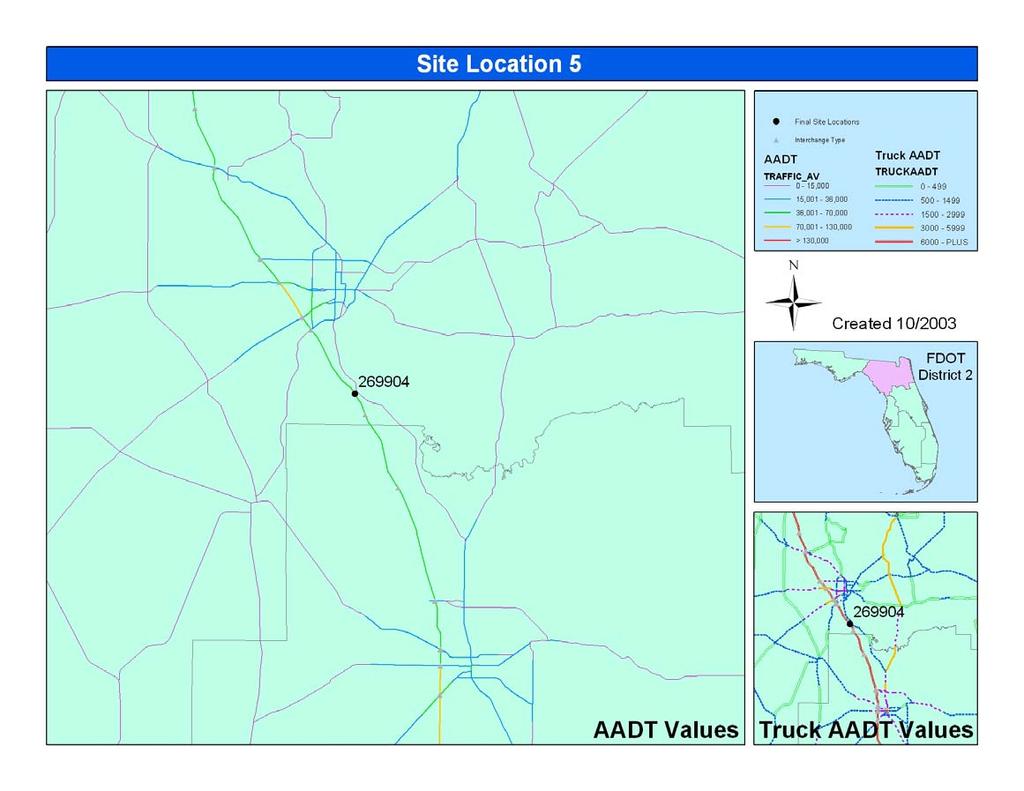
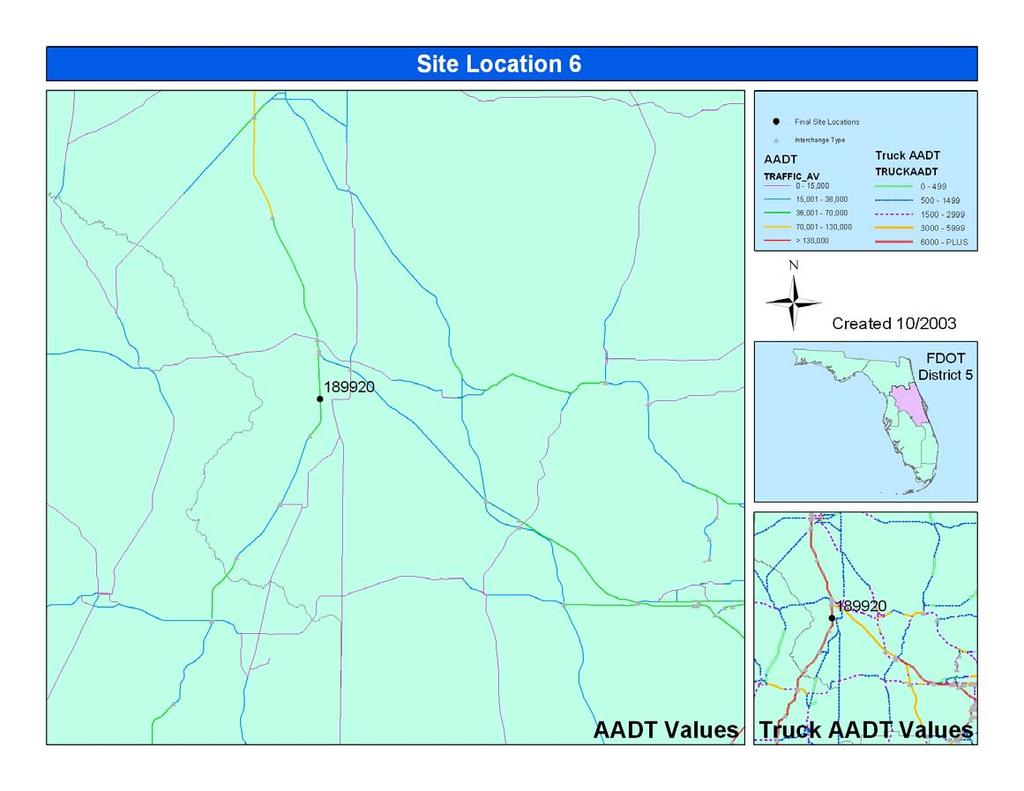
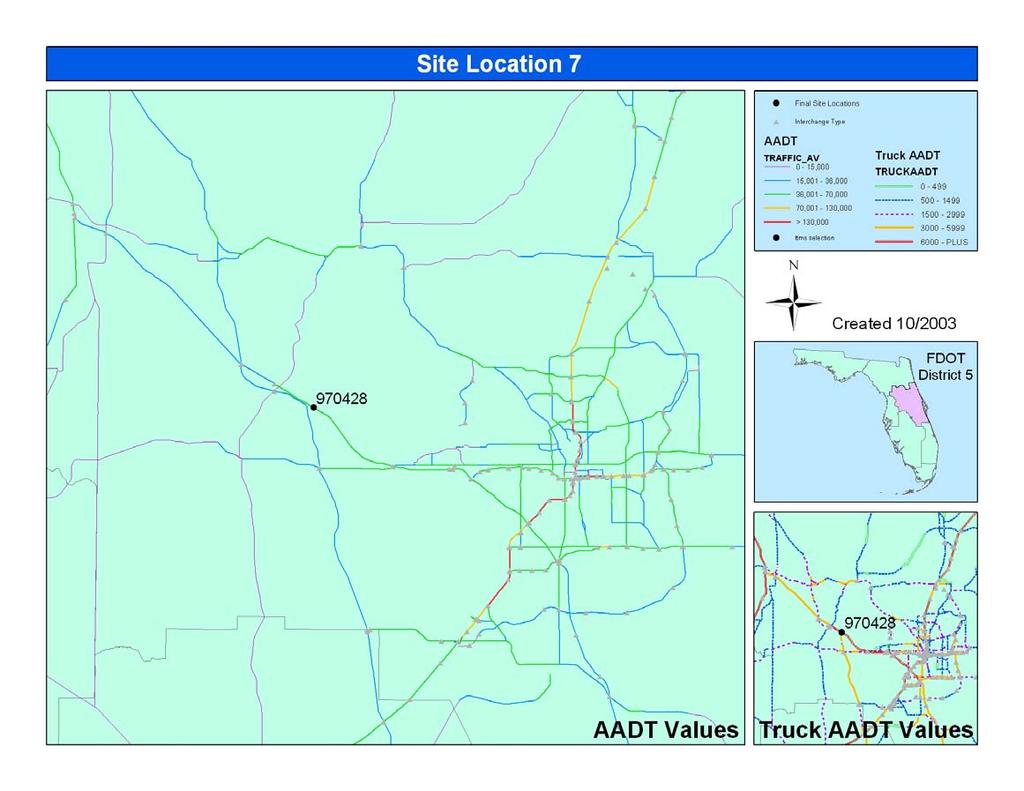
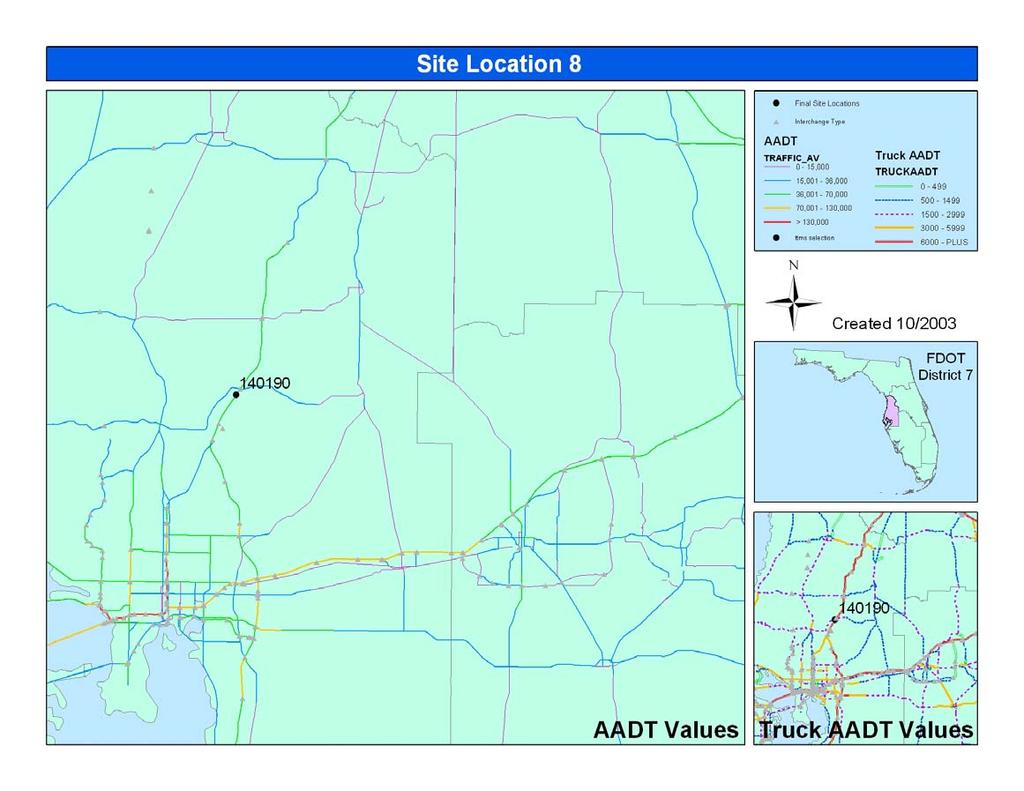
36 26 information that the FTI CD provides is the number of lanes in each direction, the site type (telemetered or portable), a site description, the Annual Average Daily Traffic (AADT) information, the percentage of trucks, and the peak hour in each direction. All the freeway locations with telemetered loop detectors in the state of Florida are shown in Figure 3-6. They are also listed in Appendix B with their site descriptions and AADT information. Not all of these stations are located on rural freeway segments, so Geographic Information System (GIS) software was used to help determine suitable locations. Eight specific site locations were then decided upon. These eight locations can be seen in Figure 3-7. A more detailed breakdown of the traffic conditions at these sites can be found in Table 3-2. Appendix C provides graphical information for these final eight site locations. Both two-lane and three-lane rural freeway sections were selected. South Florida was generally not considered due to limited number of rural locations and long distance from Gainesville. Also, the Panhandle was not considered due to driving distance reasons. The Turnpike site was chosen for its rolling terrain. The characteristics possessed by these eight site locations address the top four concerns to motorists according to the survey conducted at the University of Florida [4]. These four items addressed are: ability to maintain travel speed, ability to change lanes, ability to exceed the posted speed limit, and the percentage of heavy vehicles. It was desired to collect a good range of traffic and roadway conditions. As many different LOS values between A and E as possible was desired. This required the experimenters to try to find low, medium, and heavy traffic conditions for these rural freeways. The FTI CD provided the times for peak hour traffic. These times can be seen
37 27 in Table 3-2. In order to determine the LOS of the rural freeway at the time the roadway was filmed, data that was recorded by the loop detectors would need to be obtained from the FDOT. The FDOT normally has the loop detectors programmed to report the traffic conditions in one-hour time intervals. Since traffic information for the exact time the loop detector was passed would be preferred, the FDOT reprogrammed their loop detectors to report the traffic data in five-minute intervals. Video Data Collection Runs After coordination on the reprogramming of the telemetered data collection stations for five-minute intervals, the actual data collection driving runs were made. Three different drivers made driving runs. All used the same basic driving strategy, which consisted of attempting to drive five mi/hr over the posted speed limit (that is, 75 mi/hr) and generally staying in the right lane unless it was necessary to move to another lane to stay at the desired travel speed (such as a passing maneuver). Each rural freeway was videotaped for approximately ten miles before and after the loop detector to ensure consistent traffic conditions. The microphone was used during the experiment to record time, date, and location information on the audio track of one of the videotapes. Each time a loop detector was passed, the route, site number, direction, and time of day was spoken into the microphone. The first day of filming occurred on Monday, November 3, The sites filmed were along I-75 and I-10 (site numbers , , and ). The segment containing the I-75 loop detector (site number ) was videotaped in the northbound direction at 3:24 p.m., 4:24 p.m., and 5:33 p.m. The same segment was videotaped in the southbound direction at 4:18 p.m. and 5:17 p.m. The segment containing the furthest west loop detector along I-10 (site number ) was videotaped in the eastbound
38 Figure 3-6: Possible Site Locations 28

39 Figure 3-7: Final Site Location Map 29
40 Table 3-2: Final Site Location Information Table # Route Site Number # of Lanes Each Direction Truck Lane Restraint Truck AADT Truck % AADT Peak Hour Volume (AADT*K*D) Peak Hour Direction 1: N,E Peak Hour Direction 2: S,W I No 5, ,192 1,661 6 p.m. 5 p.m. I No 5, ,287 1,446 6 p.m. 5 p.m. I Yes 11, ,131 3,347 4 p.m. 5 p.m. I No 5, ,736 3,213 5 p.m. 4 p.m. I Yes 12, ,687 4,182 1 p.m. & 4 p.m. Mile Post p.m. 376 I No 7, ,000 2,356 Unavailable Unavailable 7 Turnpike No 4, ,926 1,950 6 p.m. 6 p.m. I No 13, ,702 3,569 6 p.m. 8 a.m
41 31 direction at 3:30 p.m., 4:32 p.m., and 5:40 p.m. This segment was videotaped in the westbound direction at 4:09 p.m. and 5:08 p.m. The last site recorded on November 3 rd was the segment containing the east loop detector on I-10 (site number ). This segment was videotaped in the eastbound direction at 3:40 p.m., 4:39 p.m., and 5:48 p.m. This segment was videotaped in the westbound direction at 4:02 p.m., 5:01 p.m., and 6:09 p.m. The second day of filming was to record the loop detector on I-95 just south of Palm Coast (site number ). This segment was videotaped on Tuesday, November 4, The segment was videotaped in the northbound direction at 12:55 p.m., 1:21 p.m., 1:46 p.m., 5:04 p.m., and 5:35 p.m. The southbound direction of this segment was videotaped at 1:13 p.m., 1:38 p.m., 4:56 p.m., and 5:22 p.m. The third day of filming was to capture the Tampa and Orlando site locations. This occurred on Wednesday, November 5, The segments videotaped were loop detectors along I-75 by Micanopy (site number ), by Wildwood (site number ), by County Road 54 (site number ), and along the Turnpike (site number ). The first segment, by Micanopy (site number ), was videotaped heading northbound at 11:05 a.m. and 11:20 a.m. This segment was videotaped in the southbound direction at 11:01 a.m., 11:16 a.m., and 11:32 a.m. The segment by Wildwood (site number ) was videotaped heading northbound at 12:19 p.m. and southbound at 12:13 p.m. and 12:29 p.m. The segment south of County Road 54 was videotaped heading northbound at 1:58 p.m. and 2:17 p.m. and southbound at 2:11 p.m. The segment along the Turnpike (site number ) was videotaped heading northbound at
42 32 4:18 p.m. and 4:50 p.m. The southbound direction of this segment was videotaped at 3:21 p.m. and 4:33 p.m. Filming this day was cut short due to weather conditions. The fourth, fifth, and sixth days of filming recorded the same sites as the third day did. The fourth day was Friday, November 7, The segment near Micanopy (site number ) was videotaped in the northbound direction at 11:55 a.m., 12:13 p.m., and 4:48 p.m. This segment was videotaped in the southbound direction at 12:09 p.m. and 12:28 p.m. The segment near Wildwood (site number ) was videotaped heading northbound at 1:16 p.m. and 1:34 p.m. and it was videotaped southbound at 1:09 p.m. and 1:28 p.m. The Turnpike segment (site number ) was videotaped heading northbound at 3:20 p.m. and southbound at 2:48 p.m. and 3:28 p.m. The fifth day of filming was Sunday, November 9, The segment by County Road 54 (site number ) was videotaped in the northbound direction at 3:00 p.m. and the segment near Wildwood (site number ) was videotaped heading northbound at 3:35 p.m. The sixth day of filming occurred on Friday, November 21, The segment videotaped on this day was the one near County Road 54 (site number ). This segment was videotaped in the northbound direction at 6:37 a.m., 6:48 a.m., 6:59 a.m., 7:12 a.m., 2:18 p.m., 2:28 p.m., and 2:39 p.m. This segment was videotaped in the southbound direction at 6:41 a.m., 6:52 a.m., 7:04 a.m., 7:15 a.m., 2:11 p.m., 2:22 p.m., and 2:32 p.m. A table of these site locations and driving times can be seen in Appendix D. Video Clip Composition The survey participants were shown a video that consists of a single composite scene of the three views recorded with the video cameras in the mini-van. The front-view video was the main part of the final video. The front-view video showed the driver s front-view with the rear-view mirror in the upper middle. The side-view mirror video

43 33 was placed in the upper left corner. The speedometer video was shown to the right of the rear-view mirror. The video editing software program, Adobe Premiere [16], was used to create these composite videos. A composite video screenshot is shown in Figure 3-8. Each video was approximately 2 to 2½ minutes in length. This length was chosen because the researchers felt that it was a good compromise between consistent traffic conditions experienced on the rural freeway at the time of filming and the survey participants attention span. Figure 3-8: Composite Video Screenshot Loop Data Collection In order to determine the LOS of the traffic conditions when the video runs were made based upon the HCM s density criterion, loop data was simultaneously recorded with the video segments. The loop data collected included speed, volume, and vehicle classification. The telemetered loop detectors were collecting traffic information while the rural freeways were being filmed. The FDOT was able to provide this traffic information to the researchers in five-minute intervals. The information provided by the FDOT included a traffic count file, a classification file, and a speed file for the eight
44 34 telemetered site locations used in this study. A summary table was created to show the traffic conditions at the times the loop detectors were passed. This table can be seen in Appendix E. From this data the density and heavy vehicle percentage for the site location in the five-minute period in which the segment containing the loop detector was videotaped was calculated. It needs to be mentioned that the conditions seen in the video scene could still vary substantially from the average five-minute conditions calculated from the collected ILD data. Based on these calculations, nine 2 to 2½ minute video clips were chosen to be used for the pilot test. The criteria possessed by the nine video clips selected were: 1. Low density, two lane 2. Low density, two lane, rolling terrain 3. Low/Medium density, three lane 4. Medium density, two lane 5. Medium density, two lane, rolling terrain 6. High density, two lane 7. Low heavy vehicle percentage, three lane 8. Medium heavy vehicle percentage, two lane 9. High heavy vehicle percentage, two lane The traffic information, including the LOS based on the HCM s density criteria, for these nine video clips, is shown in Table 3-2. Pilot Test The main purpose of this pilot test was to see if the developed method could be successful at obtaining useful driver perception data on rural freeway LOS. The researchers wanted to determine if the pilot test participants felt they were able to relate to the videos from a driver s perspective. The researchers also wanted to find out if this was a realistic method and what improvements could be made to make this study more accurate.
45 35 Pilot test procedure Survey participants for the pilot test were University of Florida civil engineering undergraduate students. Since these participants had just completed the introductory transportation engineering course, they were familiar with the freeway LOS methodology. Because of the video format, multiple test participants could be run simultaneously while allowing the researchers control over the test conditions. As many participants as the room allowed to have a clear view of the screen could be tested at the same time. The video screen was placed at approximately sitting eye level so the participants were looking at the screen as if they were looking out of a car s windshield. Seven students participated in the pilot test. The subjects were shown nine 2 to 2½ minute videos. Before viewing the videos, test participants were given only the basic instruction to imagine themselves driving the vehicle in these conditions, and to make their trip quality ranking based on how they would drive in those conditions, not necessarily how the driver of the instrumented vehicle was driving. The conditions shown by the video clips were representative of an extended rural freeway trip. After each video, the participants were asked to fill out a survey. Survey A test survey was developed for use with the pilot test. The main objective was to identify the general suitability of the survey and any potential improvements. Test participants gave a trip quality ranking after viewing each video. Subjects were not persuaded to use density as the criteria for rating the trip quality. They were simply told to just rate the quality of the trip. Trip quality was evaluated using six classifications: excellent, very good, good, fair, poor, and very poor. These classifications were generally
46 Table 3-2: Loop Detector Traffic Information Clip No Date (2003) Site Time Dir. Total Volume Avg. Speed 5 min vol veh/hr/ln Density Total 24 Hr Vol 24 Hr Buses 24 Hr Trucks 24 Hr HV 24 Hr % HV LOS 11/ :40 EB % A 11/ :04 SB % D 11/ :12 NB % B 11/ :16 SB % A 11/ :13 NB % B 11/ :55 NB no data available A 11/4/ :21 NB no data available A 11/ :48 SB % A 11/7/ :20 NB % B 36
47 37 intended to correspond to LOS ranking levels A-F. The LOS from the pilot group was then compared to the density-based LOS calculated in accordance to the HCM. The survey completed by the test participants can be seen in Appendix F.
48 CHAPTER 4 RESULTS The main purpose of this project was to see if driver perceptions of LOS for varying roadway and traffic conditions could be collected using videos from a driver s perspective. Another desired result was to find out what improvements could be made to make this study more accurate. This chapter consists of four sections. These sections are: pilot test participant feedback on video clips pilot test participant feedback on survey instrument factors that were important in evaluating trip quality a comparison of the HCM s LOS evaluation to the LOS rankings from the pilot test Pilot Test Participant Feedback on Video Clips The last question on the survey given to the participants of the pilot test asked how they would rate this exercise in terms of its ability to give them a feel for the traffic and roadway conditions they would experience if they were actually traveling. The choices available were excellent, very good, good, fair, poor, and very poor. Out of the seven participants, three ranked this method very good, another three ranked this method good, and one participant ranked this method as fair. Some suggestions and recommendations given by the participants were to add sound, improve the video quality, videotape different times of the day and varying weather conditions, and videotape more during peak hour traffic conditions. Two complaints about this method were that it was hard to determine pavement quality and it was hard to compare two-lane rural freeways to threelane rural freeways. 38
49 39 Pilot Test Participant Feedback on Survey Instrument One of the main objectives of the pilot test was to identify the general suitability of the survey and any potential improvements that could be made to improve the survey. The participants of the pilot test did not offer any comments on how to improve the survey. The survey provided the researchers with factors that the participants felt affected their trip quality which was the intent of the survey. Factors That Were Important in Evaluating Quality of Service After the participant evaluated each video clip for the quality of the trip (i.e. excellent, very good, etc.) they were asked to explain what factors led them to give that ranking. Since there were seven participants and nine video clips there were a total of 63 surveys (7 participants x 9 videos) collected during the pilot test. The factor that was mentioned the most in affecting the trip quality was traffic volume. Thirty-one percent of the comments dealt with traffic volume. Pavement quality was mentioned the second most, over twelve percent of the time. The factors that influenced the participant s trip quality are listed below in Table 4-1, along with the percentage of time it was mentioned. Table 4-1: Pilot Test Participants Factors Affecting Trip Quality Factors Influencing Trip Quality % of Time Mentioned Traffic Volume 31.0% Pavement Quality 12.6% Ability to Maintain a Constant Speed 9.2% Percentage of Trucks 9.2% Ability to Pass/Change Lanes 8.0% Weather Conditions 7.5% Number of Lanes 4.6% Other Vehicles Speeding By 4.0% Drive at Speed Limit 2.9% Straight Roadway (Easy to See) 2.9% Drive Above Speed Limit 2.9% Cars Following Closely Behind 1.7%
50 40 Lane Width 1.1% On/Off Ramps 1.1% Shoulders 1.1% Scenic 0.6% A Comparison of the HCM s LOS Evaluation to the LOS Ratings From the Pilot Test The LOS rankings from the pilot test were calculated by two methods. The first method was the average response. Whichever category had the most responses was the average survey ranking. If the majority of the seven participants rated the video clip excellent it received a LOS rating of A. If the majority of the seven participants rated the video clip good it received a LOS rating of C. The second method was the modal response. This method was calculated by converting the ranking to a numerical scale first, then averaging the rankings, and finally converting the average ranking back to a LOS letter. The participants results were then compared to the LOS calculated by the HCM. The range of the participants responses for trip quality was also noted. Out of the nine video clips, three were rated the same as the HCM s density-based LOS. Five other clips were rated one letter grade lower than the HCM s density-based LOS ranking. The last video clip was rated three letter grades lower than the HCM s density-based LOS ranking. Table 4-2 shows the comparison of the HCM s LOS evaluation to the LOS rankings from the pilot test. There was a correlation between some of the factors the researchers were capturing on the video clips and what some of the participants indicated as factors influencing their trip quality. All of the participants mentioned the number of lanes as a factor influencing their trip quality for the video clips containing the three-lane rural freeway. For the video clips that had a HCM density-based LOS of A participants noted the low traffic volume
51 41 as a factor influencing their decision. For the video clip that had a HCM density-based LOS of D the participants noted high traffic volume as a factor influencing their decision. The participants also noted percentage of trucks as a factor influencing their decision on the videotape with the highest percentage of heavy vehicles. However, participants did not note percentage of trucks as a factor influencing their decision when there were one or no trucks in the video clip. Pilot test participants did not consider the rolling terrain on the Turnpike video clips as one of the factors influencing their decision. This could have been because the rolling terrain was hard to pick-up in the video clips. Generally, what was seen in the video clips correlates well to the five-minute loop data collected from the telemetered loop detectors. However, one of the segments, clip number six, appeared to have a more significant amount of traffic at the time it was filmed than the five-minute loop data indicated. In this case it could have been that the five-minute interval was not small enough. Most of the data collected for the five-minute interval could have occurred in the minute the segment was videotaped. As the other eight video clips have shown, they accurately represent the traffic conditions that are occurring on the rural freeway as indicated by the five-minute loop data.
52 Table 4-2: Comparison of Results Clip No. Date Site Time Direction Density (pc/hr/ln) 24 Hr % HV HCM LOS Avg. Survey Rankings Modal Response Survey Rankings Range of Survey Rankings 11/3/ :40 EB % A B A/B A/B 11/21/ :04 SB % D D/E D/E C/E 11/21/ :12 NB % B C B/C B/C 11/5/ :16 SB % A A A/B A/C 11/7/ :13 NB % B B B/C A/D No 11/4/ :55 NB 10.9 data A D/E C/D C/D No 11/4/ :21 NB 9.9 data A A A/B A/B 11/7/ :48 SB % A B B A/C 11/7/ :20 NB % B C B/C A/C 42
53 CHAPTER 5 CONCLUSIONS AND RECOMMENDATIONS The purpose of the pilot test was to see if a method had been developed by which driver perceptions of LOS for varying roadway conditions could be collected. The development of this method consisted of accomplishing six parts: vehicle instrumentation, determination of data collection sites, collecting video data, composition of video clips, data collection, and a pilot test. The researchers wanted to identify if the participants were able to relate to the videos from a driver s perspective. The researchers also wanted to find out if this was a realistic method and what improvements could be made to make this study more accurate. Vehicle Instrumentation Conclusions The instrumentation of the vehicle produced the video clips the researchers were hoping for. All three views were captured simultaneously with good quality. The video clips could have been more consistent if the video cameras were permanently mounted in the test vehicle. Having to set up the test vehicle everyday not only took time but it led to inconsistencies in the video cameras FOV. Determination of Data Collection Sites The sites chosen worked well for the purpose of this study. These sites were chosen based on their AADT and percentage of heavy vehicle data from the FTI CD. The researchers were able to capture both two and three-lane rural freeways, low density and medium density conditions, both low and high percentages of heavy vehicles, and 43
54 44 flat and rolling terrain. The researchers were unable to capture the higher range of density conditions. Collecting Video Data For this study, more than one site location was videotaped in a day. This led to the inability to capture all the varying traffic conditions at one site. Some sites were filmed in the middle of the day when there wasn t much traffic while other sites were filmed only during peak hour traffic conditions. The best approach would be to devote at least one day for each site that is going to be videotaped and capture the full range of density conditions for that particular site. Composition of Video Clips The video editing software program, Adobe Premier, was used to composite the video clips. This software was able to merge three videotapes together in the layout that the researchers desired. There were two problems with the composition of the video clips. The main problem was when the videotapes were transformed into digital format the digital output would sometimes freeze. This led to the second problem which was synchronization between the three camera views. If one of the views froze it would become off sync from the other two views. Data Collection The traffic information was provided from the telemetered loop detectors in fiveminute intervals. Generally, what was seen in the video clips correlated well to the fiveminute loop data collected from the telemetered loop detectors. The alternative to using the telemetered loop data is to determine if there is enough correlation with what can be seen through the video to use what can be seen as the traffic data.
55 45 Pilot Test From the pilot test most of the participants were able to relate to the videos as if they were the driver. There were a few situations where participants commented that they would have driven differently, but for the most part the participants said they were able to relate to being the driver. Most of the participants also felt that this was a realistic method for what the researchers were trying to achieve. The results of the pilot test showed that subjects LOS rankings were not far from the density-based HCM s LOS ranking. Out of the seven participants, no one used density as the only criterion when rating LOS. All participants considered more than just density. Recommendations The method of showing subjects videos as if they were the driver was successful. The overall video quality used in the pilot test could be improved. Also, another way to better show pavement quality on the videos should be investigated. Since density was not the only consideration by the participants in this study, it is recommended that a more detailed study using this research approach be conducted. It is hoped that a more detailed study will provide the means to develop a procedure that will lead to specific recommendations for rural freeway LOS criteria and thresholds.
56 APPENDIX A COMMON ABBREVIATIONS HCM LOS TRB HCQS QOS LF v/c AID WDOT MOE pc/mi/ln NA FOV FDOT ILD FIHS AADT GIS FTI Highway Capacity Manual Level of Service Transportation Research Board Highway Capacity and Quality of Service Quality of Service Load Factor Volume to Capacity Ratio Average Individual Delay Wisconsin Department of Transportation Measures of Effectiveness Passenger Cars per Mile per Lane Not Applicable Field of View Florida Department of Transportation Inductance Loop Detectors Florida Intrastate Highway System Average Annual Daily Traffic Geographic Information System Florida Traffic Information 46
57 APPENDIX B POSSIBLE SITE LOCATION TRAFFIC INFORMATION
58 48 Site Site Type Description T SR-93/I-75,0.5 MI N OF CR-896,COLLIER CO. Direction 1 27,043 N Direction 2 27,573 S T SR-93/I-75,W OF EVERGLADES BLVD,COLLIER CO. 9,169 E 9,182 W AADT Two- Way 54,616 C 18,351 C 99,529 "K" Factor "D" Factor "T" Factor 9.88 A A D A A A T SR-400/I-4, UNDER BETHLEHAM RD OVERPASS, HILL CO 48,583 E 50,946 W C 8.30 A A D 62,329 62, , T I-275, 1.3 MI E OF HOWARD FRANKLIN BR E W C 8.46 A A 8.71 D AT S. END OF FLORIBRASKA AVE OVERP- 65, T BAD LP C 9.20 D D 8.71 D I-75, 0.6 M S OF US301, 2.3 M N OF I-4, HILLS--BAD 49,231 97, T LOOP N 48,660 S C 9.10 D D 9.35 A I-75, 0.9 MI S OF SR60 AT SR618 O.P., 51, , T HILLSBOROUGH CO N 52,487 S C 9.20 D D 9.82 A SR-93/I-275, 0.25 MI N OF FLETCHER AV, TAMPA, 66, T HILL CO S 9.20 D D 8.71 D 1-75, 1.25 MI N OF SR-60 (ADAMO DR.), TAMPA, 57, , T WIM#26 N 54,369 S C 9.20 D D 7.05 A SR-93/I-75, 225' S OF DANIELS PKWY UNDERPASS, 24,674 46, T LEE N 21,993 S C 9.73 A A D I-75, 0.6 MI. SOUTH OF SR-54, PASCO CO. - 35,427 70, T UC10/28/94 N 35,275 S C 8.99 A A D I-275, 300 YDS S OF THE SB TOLL, PINELLAS- 22,171 45, T UC11/93 N 22,848 S C 9.57 A A 5.87 A PROCTOR RD OP, 0.7 MI N SR 72, 42,732 85, T SARASOTA CO N 42,863 S C 9.83 A A D 39, T I-75, 3.5 MI S OF FLORIDA TURNPIKE, WIM#20 F D D D I-75/SR-93, 3 MILES NORTH OF MARION COUNTY 29,922 58, T LINE N 28,765 S C D D A 10,164 10,028 20, T I-10, 0.45 MI EAST OF US41, LAKE CITY E W C A A A I-75 NORTH OF LAKE CITY BETWEEN I-10 AND US- 22,340 45, T 90 N 22,791 S C A A A
59 AADT Two- Way 20,287 "T" Factor Site Site Type Description Direction 1 Direction 2 "K" Factor "D" Factor I-10, 50 FT WEST OF CR-250 OVERPASS, LAKE 10,104 10, T CITY E W C D D A 18,515 37, T I-75, S OF STATE LINE NORTH OF S.R. 143 N S C A A A I-75, SB SHOULDER, 0.35 MILES N OF WILLIAMS 37,579 74, T RD. N 26,937 S C A A D 12,725 12,621 25, T I-10, 0.15 MILES WEST OF CR 136 E W C A A A I-10, SUWANNEE CO, 1.5 MI W OF ELLAVILLE T SCALES 8,124 C D D A 16,073 14,564 30, T I-10, 1.5 MI WEST OF US-90 E W C A A D 20, T SR-8/I-10, 1 MILE OF SR-291/DAVIS HWY (RTMS) 0 E W 0 C 9.64 D D D I-110, 1 MI S OF I-10, PENSACOLA, WIM#24--UC 26,390 52, T 10/94 N 26,051 S C 9.64 D D 4.05 A I-10, 250 FT W OF CR-268 OVERPASS, GADSDEN 13,664 13,337 27, T CO. E W C A A A I-10, 1 MI. EAST OF US-231, JACKSON CO. -- UC 10,821 10,768 21, T 11/94 E W C A A D T SR-8/I-10,0.66 MI E OF CR-257,JEFFERSON CO. 12,478 12,527 25,005 E W C A A A T T MISSION RD,NORTH OF I-10,TALLAHASSEE,LEON CO. SR-8/I-10,1 MI W OF THOMASVILLE RD U/P,LEON CO T SR-8/I-10,@ANTIOCH RD O/P,OKALOOSA CO T T SR-8/I-10,1.3 MI WEST OF BOY SCOUT RD,WALTON CO. SR-8/I-10,AT CR-273,SE OF CHIPLEY,WASHINGTON CO T SR-9/I-95,3.34 MI. S. OF SR-514,BREVARD CO. 4, 896 N 4,916 S 9,812 C D D 5.3 D 28,625 E 10,347 E 28,275 W 10,504 W 9,590 E 9,526 W 9,320 E 9,355 W 17,780 N 18,070 S 56,900 C 20,851 C 19,116 C 18,675 C 35,850 C 9.64 A A A A A A D D A A A A D D A 49
60 Site Site Type T T Description SR-9/I-95,0.9 MI S OF AURANTIA RD U/P,BREVARD CO. SR-9/I-95,3.45 MI S OF SR-514,MALABAR,BREVARD CO T SR-9/I-95,0.75 MI S OF DUNN AVE,JAX,DUVAL CO T SR-8/I-10,1 MI E OF MCDUFF AV,JAX,DUVAL CO T T T T T SR-8/I-10,@CR-217 OVERPASS,E. OF BALDWIN,DUVAL CO. SR-9/I-95,0.7 MI N OF UNIVERSITY BLVD,JAX,DUVAL CO SR-9A/I-295,3 MI N OF I-10,JACKSONVILLE,DUVAL CO. SR-9/I-95,2 MI S OF I-295 S INTERCHANGE,DUVAL CO. SR-9/I-95,1.4 MI S OF PALM COAST PKWY,FLAGLER CO T SR-9/I-95,2.0 MI S OF GA. STATE LINE,NASSAU CO T SR-400/I-4,1.6 MI E OF SR-434,SEMINOLE CO T I-95,2.7 MI N OF SR44,@CR44 O/P,VOLUSIA CO T T T T ON I-4,169' E OF ENTERPRISE RD O/P,VOLUSIA CO. SR-9/I-95,@NE 48TH ST,POMPANO BCH,BROWARD CO. SR-862/I-595,0.2 MI E OF UNIVERSITY DR,BROWARD CO. SR-93/I-75,2 MI W OF US-27,.6 MI W TOLL,BROWARD CO T SR-112/I-195,1600' E OF SR-5/US-1,DADE CO. Direction 1 14,566 N 17, 994 N 68,110 E 22,665 E 55,386 N 31,128 N 34,405 N 28,115 N 26,031 N 60,981 E 20,046 N 0 E 0 W AADT Direction Two- 2 Way 29,167 14,601 S C 35,720 17,726 S C 69,500 S 69, ,138 W C 22,429 45,094 W C 55,381 S 110,767 C 61,791 30,663 S C 67,858 33,453 S C 56,736 28,621 S C 51,792 25,761 S C 60, ,650 W C 39,791 19,745 S C 76,000 F 99,696 S 198,765 C 86, ,112 99,069 N 91, 065 E W C 10,043 10,026 20,069 E W C 48,348 47,387 95,735 E W C "K" Factor "D" Factor "T" Factor A A 18.7 A D D A 9.06 D D D 8.83 A A 4.15 A 9.54 A A A 9.11 A A 5.77 A 9.24 A A A 9.06 D D D A A 8.94 D 12.5 D D D 8.06 A A 6.41 A 9.89 A A A 8.61 D D 8.94 D 7.83 A A 6.83 A 8.32 A A 4.7 A A A A 8.47 A A 2.35 D 50
61 Site Site Type T T T T Description ON I-4,0.5 MI SW OF ORANGE CO LINE,OSCEOLA CO. SR-9/I-95,@SW23RD AVE O/P,1.5 MI S SR- 804,PALM BCH SR-9/I-95,0.8 MI N OF DONALD ROSS RD,PALM BEACH CO SR-9/I-95,0.6 MI S OF SR-68/ORANGE AV,ST LUCIE CO T SR-9/I-95,@MARTIN CO LINE,ST. LUCIE CO. Direction 1 54,281 E 41,368 N 21,475 N Direction 2 55,142 W 42,333 S 22,348 S AADT Two- Way 109,423 C 159,000 S 83,701 C 42,500 F 43,823 C "K" Factor "D" Factor "T" Factor 7.63 A A 7.42 A 8.56 D D 10.8 D 8.81 A A A 8.56 D D 10.8 D 9.28 A A A Site Type: T = Telemetered; P = Portable AADT Flags: C = Computed; E = Manual Estimate; F = First Year Est; S = Second Year Est; T = Third Year Est; X = Unknown "K/D" Flags: A = Actual; F = Volume Fctr Catg; D = Dist/Functional Class; S = State-wide Default; W = One-Way Road "T" Flags: A = Actual; F = Axle Fctr Catg; D = Dist/Functional Class; S = State-wide Default; X = Cross- Reference 51
62 APPENDIX C FINAL SITE LOCATION DETAILS
63 53
64 54
65 55
66 56
67 57
68 58
69 APPENDIX D SITE LOCATIONS AND DRIVING TIMES
70 60 # Site # of Lanes Peak Hour Peak Hour Route Number Direction N, E Direction S, W Direction MP Date Time Direction 1 I p.m. 5 p.m /3/2003 3:30 p.m. EB 4:09 p.m. WB 4:32 p.m. EB 5:08 p.m. WB 5:40 p.m. EB 2 I p.m. 5 p.m /3/2003 3:40 p.m. EB 4:02 p.m. WB 4:39 p.m. EB 5:01 p.m. WB 5:48 p.m. EB 6:09 p.m. WB 3 I p.m. 5 p.m /3/2003 3:24 p.m. NB 4:18 p.m. SB 4:24 p.m. NB 5:17 p.m. SB 5:33 p.m. NB 4 I p.m. 4 p.m /4/ :55 p.m. NB 1:13 p.m. SB 1:21 p.m. NB 1:38 p.m. SB 1:46 p.m. NB 4:56 p.m. SB 5:04 p.m. NB 5:22 p.m. SB 5:35 p.m. NB 5 I p.m. & 4 p.m. 4 p.m /5/ :01 a.m. SB 11:16 a.m. SB 11:20 a.m. NB
71 Site # of Lanes Peak Hour Peak Hour Direction # Route Number Direction N, E Direction S, W Direction MP Date Time 11:05 a.m. NB 11:32 a.m. SB 11/7/ :55 a.m. NB 12:09 p.m. SB 12:13 p.m. NB 12:28 p.m. SB 4:48 p.m. NB 6 I /5/ :13 p.m. SB 12:19 p.m. NB 12:29 p.m. SB 11/7/2003 1:09 p.m. SB 1:16 p.m. NB 1:28 p.m. SB 1:34 p.m. NB 11/9/2003 3:35 p.m. NB 7 Turnpike p.m. 6 p.m /5/2003 3:21 p.m. SB 4:18 p.m. NB 4:33 p.m. SB 4:50 p.m. NB 11/7/2003 2:48 p.m. SB 3:20 p.m. NB 3:28 p.m. SB 8 I p.m. 8 a.m /5/2003 1:58 p.m. NB 2:11 p.m. SB 2:17 p.m. NB 11/9/2003 3:00 p.m. NB 11/21/2003 6:37 a.m. NB 6:41 a.m. SB 61
72 # Site # of Lanes Peak Hour Peak Hour Direction Route Number Direction N, E Direction S, W Direction MP Date Time 6:48 a.m. NB 6:52 a.m. SB 6:59 a.m. NB 7:04 a.m. SB 7:12 a.m. NB 7:15 a.m. SB 2:11 p.m. SB 2:18 p.m. NB 2:22 p.m. SB 2:28 p.m. NB 2:32 p.m. SB 2:39 p.m. NB 62
73 APPENDIX E LOOP DATA SUMMARY TABLES
74 Date Tag Site Time Direction Total Volume Avg. Speed 5 min vol veh/hr/ln density 11/3/2003 SPD 11/3/2003 SPD 11/3/2003 SPD (I-75, near I-10) NO DATA AVAILABLE (I-10, near I-75 NO DATA AVAILABLE (I-10, near I-75) 15:40 Eastbound : : :02 Westbound : : /4/2003 SPD (I-95, near Daytona) 12:55 Northbound : : : : :13 Southbound : : : /5/2003 SPD (I-75, near Micanopy) 11:05 Northbound : :01 Southbound : :
75 Date Tag Site Time Direction 11/5/2003 SPD (I-75, s. of Turnpike merge) 12:19 Northbound Total Volume Avg. Speed 5 min vol veh/hr/ln NO DATA AVAILABLE 12:13 Southbound NO DATA AVAILABLE 12:29 NO DATA AVAILABLE density 11/5/2003 SPD (I-75, near Tampa) 13:58 Northbound : :11 Southbound /5/2003 SPD (Turnpike, near Orlando) 16:18 Northbound : :21 Southbound : /7/2003 SPD (I-75, near Micanopy) 11:55 Northbound : : :09 Southbound : /7/2003 SPD (I-75, s. of Turnpike merge) 13:16 Northbound DATA AT ONE HOUR INTERVAL 13:34 DATA AT ONE HOUR INTERVAL 13:09 Southbound DATA AT ONE HOUR INTERVAL 13:28 DATA AT ONE HOUR INTERVAL 11/7/2003 SPD (Turnpike, near Orlando) 15:20 Northbound :48 Southbound
76 Total Avg. 5 min density Date Tag Site Time Direction Volume Speed vol veh/hr/ln 15: /9/2003 SPD (I-75, near Tampa) 15:00 Northbound NO DATA AVAILABLE 11/9/2003 SPD (I-75, s. of Turnpike merge) 15:35 Northbound DATA AT ONE HOUR INTERVAL 11/21/2003 SPD (I-75, near Tampa) 6:37 Northbound : : : : : : :41 Southbound : : : : : :
77 Date Tag Site Time Direction 5 min vol HV veh/hr/ln HV Total 24 Hr Vol 24 Hr Buses 24 Hr Trucks 24 Hr HV 24 Hr %HV 11/3/ /3/ /3/ /4/ /5/2003 CLS (I-75, near I-10) CLS (I-10, near I-75) no data available CLS (I-10, near I-75) 15:40 Eastbound 4 24 Total % 16: : WB % 16:02 Westbound : EB % 18: (I-95, near CLS Daytona) 12:55 Northbound 13:21 13:46 17:04 17:35 no data available 13:13 Southbound 13:38 16:56 17: (I-75, near CLS Micanopy) 11:05 Northbound Total % 11: :01 Southbound NB % 11: : SB % 67
78 Date 11/5/ /5/2003 Total 24 Hr Vol 24 Hr %HV Tag Site Time Direction 5 min vol HV veh/hr/ln HV 24 Hr Buses 24 Hr Trucks 24 Hr HV (I-75, s. of Total CLS Turnpike merge) 12:19 Northbound % 12:13 Southbound data at one hour NB % interval 12:29 SB % CLS (I-75, near Tampa) 13:58 Northbound Total % 14: :11 Southbound NB % 11/5/ /7/2003 CLS CLS SB % (Turnpike, near Orlando) 16:18 Northbound Total % 16: :21 Southbound NB : (I-75, near Micanopy) 11:55 Northbound Total % 12: : NB % 12:09 Southbound : SB % 68
79 Date Tag Site Time Direction 5 min vol HV veh/hr/ln HV 24 Hr Buses 24 Hr Trucks 24 Hr HV 11/7/2003 CLS (I-75, s. of Total Turnpike merge) 13:16 Northbound data at one hour 13:34 interval % 13:09 Southbound NB % 13:28 SB % 11/7/2003 CLS (Turnpike, near Orlando) 15:20 Total 24 Hr Vol 24 Hr %HV Northbound Total % 14:48 Southbound : NB % 11/9/2003 CLS (I-75, near Tampa) 15:00 Northbound SB % 69 no data available 11/9/2003 CLS (I-75, s. of Turnpike merge) 15:35 Northbound Total % data at one hour interval NB % SB %
80 Date 11/21/ min vol HV veh/hr/ln HV Total 24 Hr Vol 24 Hr Buses 24 Hr Trucks 24 Hr HV 24 Hr %HV Tag Site Time Direction (I-75, near CLS Tampa) 6:37 Northbound Total % 6: : NB % 7: : SB % 14: : :41 Southbound : : : : : :
81 APPENDIX F PILOT TEST SURVEY

82 Transportation Research Center About Yourself Gender: Male Female Age: 16 to 25 years 26 to 45 years 46 to 65 years Over 65 years Highest level of education: Some or no high school Technical college degree (A.A.) Post-graduate degree High school diploma or equivalent College degree Approximate annual household income: No income Under $25,000 $25,000 49,999 $50,000 74,999 $75,000 99,999 $100, ,999 $150,000 or more Number of years possessing a driver s license: About Your Rural Freeway Driving Typical number of rural freeway trips made during a month? 1 to 2 3 to 4 5 to 6 7 to 8 9 to to 12 Over 12 Typical length of trip made on rural freeway (in miles)? less than 16 miles 16 to to to to to to to to to 200 Over 200 Vehicle type most often used for rural freeway trips: Sedan Sports car Pick-up truck SUV Mini-van Full-size van RV/Motorhome motorcycle Other 72
Analysis of the Interrelationship Among Traffic Flow Conditions, Driving Behavior, and Degree of Driver s Satisfaction on Rural Motorways
 Analysis of the Interrelationship Among Traffic Flow Conditions, Driving Behavior, and Degree of Driver s Satisfaction on Rural Motorways HIDEKI NAKAMURA Associate Professor, Nagoya University, Department
A Traffic Operations Method for Assessing Automobile and Bicycle Shared Roadways
 A Traffic Operations Method for Assessing Automobile and Bicycle Shared Roadways A Thesis Proposal By James A. Robertson Submitted to the Office of Graduate Studies Texas A&M University in partial fulfillment
Chapter 4 Traffic Analysis
 Chapter 4 Traffic Analysis PURPOSE The traffic analysis component of the K-68 Corridor Management Plan incorporates information on the existing transportation network, such as traffic volumes and intersection
3 ROADWAYS 3.1 CMS ROADWAY NETWORK 3.2 TRAVEL-TIME-BASED PERFORMANCE MEASURES Roadway Travel Time Measures
 ROADWAYS Approximately 6 million trips are made in the Boston metropolitan region every day. The vast majority of these trips (80 to percent, depending on trip type) involve the use of the roadway network
Unit 7 Speed, Travel Time and Delay Studies
 Unit 7 Speed, Travel Time and Delay Studies Introduction Speed, travel time and delay are all related measures that are common used as indicators of performance for traffic facilities Measure of Effectiveness
Defining Purpose and Need
 Advanced Design Flexibility Pilot Workshop Session 4 Jack Broz, PE, HR Green May 5-6, 2010 Defining Purpose and Need In your agency s project development process, when do design engineers typically get
An Analysis of Reducing Pedestrian-Walking-Speed Impacts on Intersection Traffic MOEs
 An Analysis of Reducing Pedestrian-Walking-Speed Impacts on Intersection Traffic MOEs A Thesis Proposal By XIAOHAN LI Submitted to the Office of Graduate Studies of Texas A&M University In partial fulfillment
METHODOLOGY. Signalized Intersection Average Control Delay (sec/veh)
") Chapter 5 Traffic Analysis 5.1 SUMMARY US /West 6 th Street assumes a unique role in the Lawrence Douglas County transportation system. This principal arterial street currently conveys commuter traffic
Chapter 5 Traffic Analysis 5.1 SUMMARY US /West 6 th Street assumes a unique role in the Lawrence Douglas County transportation system. This principal arterial street currently conveys commuter traffic
ENHANCED PARKWAY STUDY: PHASE 2 CONTINUOUS FLOW INTERSECTIONS. Final Report
 Preparedby: ENHANCED PARKWAY STUDY: PHASE 2 CONTINUOUS FLOW INTERSECTIONS Final Report Prepared for Maricopa County Department of Transportation Prepared by TABLE OF CONTENTS Page EXECUTIVE SUMMARY ES-1
Traffic Impact Study. Westlake Elementary School Westlake, Ohio. TMS Engineers, Inc. June 5, 2017
 TMS Engineers, Inc. Traffic Impact Study Westlake Elementary School Westlake, Ohio June 5, 2017 Prepared for: Westlake City Schools - Board of Education 27200 Hilliard Boulevard Westlake, OH 44145 TRAFFIC
Complete Street Analysis of a Road Diet: Orange Grove Boulevard, Pasadena, CA
 Complete Street Analysis of a Road Diet: Orange Grove Boulevard, Pasadena, CA Aaron Elias, Bill Cisco Abstract As part of evaluating the feasibility of a road diet on Orange Grove Boulevard in Pasadena,
CAPACITY, LEVEL OF SERVICE, FUNDAMENTALS OF HIGHWAY CAPACITY ANALYSIS
 CAPACITY, LEVEL OF SERVICE, FUNDAMENTALS OF HIGHWAY CAPACITY ANALYSIS 1. GENERAL Transportation facilities can be classified into two categories of flow: uninterrupted and interrupted. Uninterrupted-flow
Subject: Solberg Avenue / I-229 Grade Separation: Traffic Analysis
 MEMORANDUM Transportation Bill Troe, AICP Jason Carbee, AICP 12120 Shamrock Plaza Suite 300 Omaha, NE 68154 (402) 334-8181 (402) 334-1984 (Fax) To: Project File Date: Subject: Solberg Avenue / I-229 Grade
Multimodal Arterial Level of Service
 Multimodal Arterial Level of Service DOUGLAS S. MCLEOD Florida Department of Transportation, USA ABSTRACT The concept of quality of service from a user perspective of a transportation facility or service
An Analysis of the Travel Conditions on the U. S. 52 Bypass. Bypass in Lafayette, Indiana.
 An Analysis of the Travel Conditions on the U. S. 52 Bypass in Lafayette, Indiana T. B. T readway Research Assistant J. C. O ppenlander Research Engineer Joint Highway Research Project Purdue University
TRAFFIC STUDY GUIDELINES Clarksville Street Department
 TRAFFIC STUDY GUIDELINES Clarksville Street Department 9/1/2009 Introduction Traffic studies are used to help the city determine potential impacts to the operation of the surrounding roadway network. Two
METHODOLOGY FOR THE OPERATIONAL PERFORMANCE ASSESSMENT OF TWO-LANE HIGHWAY FACILITIES
 METHODOLOGY FOR THE OPERATIONAL PERFORMANCE ASSESSMENT OF TWO-LANE HIGHWAY FACILITIES By QINGYONG YU A DISSERTATION PRESENTED TO THE GRADUATE SCHOOL OF THE UNIVERSITY OF FLORIDA IN PARTIAL FULFILLMENT
HCM Sixth Edition. Plus More. Rahim (Ray) Benekohal University of Illinois at Urban Champaign,
 Benekohal University of Illinois at Urban Champaign,") HCM Sixth Edition What s New in the HCM Sixth Edition Plus More Rahim (Ray) Benekohal University of Illinois at Urban Champaign, 65 th Traffic Engineering and Safety Conference October 19 20, 2016 Institute
HCM Sixth Edition What s New in the HCM Sixth Edition Plus More Rahim (Ray) Benekohal University of Illinois at Urban Champaign, 65 th Traffic Engineering and Safety Conference October 19 20, 2016 Institute
FINAL DESIGN TRAFFIC TECHNICAL MEMORANDUM
 FINAL DESIGN TRAFFIC TECHNICAL MEMORANDUM July 2014 FINAL (SR 43) Project Development and Environment Study From State Road 60 (Adamo Drive) to I-4 (SR 400) Hillsborough County, Florida Work Program Item
City of Homewood Transportation Plan
 City of Homewood Transportation Plan Prepared for: City of Homewood, Alabama Prepared by: Skipper Consulting, Inc. May 2007 TABLE OF CONTENTS INTRODUCTION... 1 BACKGROUND INFORMATION... 1 EXISTING TRANSPORTATION
Planning and Design of Proposed ByPass Road connecting Kalawad Road to Gondal Road, Rajkot - Using Autodesk Civil 3D Software.
 Planning and Design of Proposed ByPass Road connecting Kalawad Road to Gondal Road, Rajkot - Using Autodesk Civil 3D Software. 1 Harshil S. Shah, 2 P.A.Shinkar 1 M.E. Student(Transportation Engineering),
Pedestrian Level of Service at Intersections in Bhopal City
 Pedestrian Level of Service at Intersections in Bhopal City 1 Rakesh Wahane 1 M.E. Student 1 Department of Civil Engineering 1 Samrat Ashok Technological Institute Vidisha MP 464001 Abstract - This study
Assessing Level of Service for Highways in a New Metropolitan City
 Assessing Level of Service for Highways in a New Metropolitan City Ganesh Pawar Civil Engineering Department G. H. Raisoni College of Engineering Nagpur, India,4416 Dr. Bhalachandra Khode Civil Engineering
STATIC AND DYNAMIC EVALUATION OF THE DRIVER SPEED PERCEPTION AND SELECTION PROCESS
 STATIC AND DYNAMIC EVALUATION OF THE DRIVER SPEED PERCEPTION AND SELECTION PROCESS David S. Hurwitz, Michael A. Knodler, Jr. University of Massachusetts Amherst Department of Civil & Environmental Engineering
ADOT Statewide Bicycle and Pedestrian Program Summary of Phase IV Activities APPENDIX B PEDESTRIAN DEMAND INDEX
 ADOT Statewide Bicycle and Pedestrian Program Summary of Activities APPENDIX B PEDESTRIAN DEMAND INDEX May 24, 2009 Pedestrian Demand Index for State Highway Facilities Revised: May 29, 2007 Introduction
Planning Committee STAFF REPORT March 7, 2018 Page 2 of 4 The following MTSOs are being used across the five subregions: Intersection Level of Service
 Planning Committee STAFF REPORT Meeting Date: March 7, 2018 Subject Summary of Issues Recommendations Financial Implications Options Attachments Changes from Committee Review Draft 2017 Multimodal Transportation
Table of Contents FIGURES TABLES APPENDICES. Traffic Impact Study Hudson Street Parking Garage MC Project No.: A Table of Contents
 Traffic Impact Study Hudson Street Parking Garage MC Project No.: 151714A Table of Contents Table of Contents I. INTRODUCTION... 2 II. EXISTING CONDITIONS... 5 III. 215 EXISTING TRAFFIC CONDITIONS... 6
Basic Freeways and Multilane Highways (LOS) CIVL 4162/6162
 CIVL 4162/6162") Basic Freeways and Multilane Highways (LOS) CIVL 4162/6162 Learning Objectives Define uninterrupted facilities Determine LOS of Basic freeway segments Multilane highways Uninterrupted Flow Facilities Pure
Basic Freeways and Multilane Highways (LOS) CIVL 4162/6162 Learning Objectives Define uninterrupted facilities Determine LOS of Basic freeway segments Multilane highways Uninterrupted Flow Facilities Pure
DESIGN BULLETIN #66/2010
 DESIGN BULLETIN #66/2010 Highway Geometric Design Guide Chapter B, Climbing Lane Warrants for Two Lane Undivided and Four Lane Divided Highways - Revised Summary This Design Bulletin is being issued as
Chapter Capacity and LOS Analysis of a Signalized I/S Overview Methodology Scope Limitation
 Chapter 37 Capacity and LOS Analysis of a Signalized I/S 37.1 Overview The Highway Capacity Manual defines the capacity as the maximum howdy rate at which persons or vehicle can be reasonably expected
Mobility and Congestion
 Technical Memorandum Mobility and Congestion Prepared for: Prepared by: September 25, 2013 1 Table of Contents 1. Introduction... 1 2. Congestion Forecasting Process... 1 2.1 Mobility and Congestion Terms...
SELECTED ROADWAY CAPACITY ANALYSIS
 CHAPTERFOUR SELECTED ROADWAY CAPACITY ANALYSIS 4.1 SELECTED ROADWAY CAPACITY ANALYSIS Introduction Capacity analysis was performed on six selected roadways within the Dearborn County study area using the
Traffic Impact Analysis Walton Acres at Riverwood Athletic Club Clayton, NC
 Traffic Impact Analysis Walton Acres at Riverwood Athletic Club Clayton, NC 1. TABLE OF CONTENTS INTRODUCTION...1 1.1. Site Location and Study Area...1 1.2. Proposed Land Use and Site Access...2 1.3.
Moving Towards Complete Streets MMLOS Applications
 Moving Towards Complete Streets MMLOS Applications Transportation Education Series May 18 th, 2012 It s not just for cars! Presentation Overview The Complete Streets Movement What is Multi-Modal Level
The Corporation of the City of Sarnia. School Crossing Guard Warrant Policy
 The Corporation of the City of Sarnia School Crossing Guard Warrant Policy Table of Contents Overview And Description... 2 Role of the School Crossing Guard... 2 Definition of a Designated School Crossing...
1. Introduction. 2. Survey Method. Volume 6 Issue 5, May Licensed Under Creative Commons Attribution CC BY
 A Study on Performance of an Urban Arterial Corridor Guggilla Raju 1, Rontala Ashwini 2 1 Assistant Professor, Department of Civil Engineering, GCET 2 Assistant Professor, Department of Civil Engineering,
2009 PE Review Course Traffic! Part 1: HCM. Shawn Leight, P.E., PTOE, PTP Crawford Bunte Brammeier Washington University
 2009 PE Review Course Traffic! Part 1: HCM Shawn Leight, P.E., PTOE, PTP Crawford Bunte Brammeier Washington University sleight@cbbtraffic.com Topic Areas Highway Capacity Manual Highway Capacity Analysis
Owl Canyon Corridor Project Overview and Summary
 Owl Canyon Corridor Project Overview and Summary December 22, 2008 The Owl Canyon corridor (generally the connection between the I-25 / Larimer County Road 70 interchange and the US 287 / Larimer County
Management of Multi-Lane Highways in Jordan (Case Study)
") Management of Multi-Lane Highways in Jordan (Case Study) Basim Jrew 1), Nidal Hussein 2) and Rami Al-Kouz 3) 1) Isra University, Jordan. E-Mail: basim.jrew@iu.edu.jo 2) Isra University, Jordan. E-Mail:
Management of Multi-Lane Highways in Jordan (Case Study) Basim Jrew 1), Nidal Hussein 2) and Rami Al-Kouz 3) 1) Isra University, Jordan. E-Mail: basim.jrew@iu.edu.jo 2) Isra University, Jordan. E-Mail:
US 81 CORRIDOR STUDY FROM NORTH OF UNION CITY SOUTH TO SH 19 SOUTH OF CHICKASHA CANADIAN AND GRADY COUNTIES, OKLAHOMA JULY 2007
 US 81 CORRIDOR STUDY FROM NORTH OF UNION CITY SOUTH TO SH 19 SOUTH OF CHICKASHA CANADIAN AND GRADY COUNTIES, OKLAHOMA JULY 2007 PREPARED BY THE RESEARCH AND PLANNING DIVISION OKLAHOMA DEPARTMENT OF TRANSPORTATION
Capacity and Level of Service LOS
 Chapter 21 Capacity and Level of Service LOS 21.1 Introduction Often it is required to ascertain how much a transport facility can accommodate. Such information is useful in the design of traffic facility.
Roundabouts along Rural Arterials in South Africa
 Krogscheepers & Watters 0 0 Word count: 00 text + figures = 0 equivalent words including Title and Abstract. Roundabouts along Rural Arterials in South Africa Prepared for: rd Annual Meeting of Transportation
Technical Memorandum TRAFFIC IMPACT STUDY. RIDLEY ROAD CONVENIENCE STORE Southampton County, VA. Prepared for: Mr. David Williams.
 Technical Memorandum TRFFIC IMPCT STUDY RIDLEY ROD CONVENIENCE STORE Southampton County, V Prepared for: Mr. David Williams By: Charles Smith, P.E., PTOE EPR Charlottesville, V July 2014 1 TBLE OF CONTENTS
Project Report. South Kirkwood Road Traffic Study. Meadows Place, TX October 9, 2015
 Meadows Place, TX October 9, 2015 Contents 1 Introduction... 1 2 Data Collection... 1 3 Existing Roadway Network... 2 4 Traffic Volume Development... 2 5 Warrant Analysis... 3 6 Traffic Control Alternative
International Journal of Advance Research in Engineering, Science & Technology
 Impact Factor (SJIF): 4.542 International Journal of Advance Research in Engineering, Science & Technology e-issn: 2393-9877, p-issn: 2394-2444 Volume 4, Issue 4, April-2017 Planning & Design Of New By-pass
JONESBORO HIGHWAY 63 HIGHWAY 18 CONNECTOR STUDY
 JONESBORO HIGHWAY 63 HIGHWAY 18 CONNECTOR STUDY Craighead County May 2007 JONESBORO HIGHWAY 63 HIGHWAY 18 CONNECTOR STUDY Craighead County May 2007 Prepared by Planning and Research Division Arkansas State
Truck Climbing Lane Traffic Justification Report
 ROUTE 7 (HARRY BYRD HIGHWAY) WESTBOUND FROM WEST MARKET STREET TO ROUTE 9 (CHARLES TOWN PIKE) Truck Climbing Lane Traffic Justification Report Project No. 6007-053-133, P 101 Ι UPC No. 58599 Prepared by:
1.3.4 CHARACTERISTICS OF CLASSIFICATIONS
 Geometric Design Guide for Canadian Roads 1.3.4 CHARACTERISTICS OF CLASSIFICATIONS The principal characteristics of each of the six groups of road classifications are described by the following figure
Evaluating Roundabout Capacity, Level of Service and Performance
 Roundabouts with Metering Signals ITE 2009 Annual Meeting, San Antonio, Texas, USA, August 9-12, 2009 Evaluating Roundabout Capacity, Level of Service and Performance Presenter: Rahmi Akçelik rahmi.akcelik@sidrasolutions.com
Highway Capacity and LOS. Reading Assignment: pgs
 Highway Capacity and LOS Reading Assignment: pgs. 170-200 We know from the previous section that traffic flows fairly well when Demand < Capacity. However, when demand approaches capacity, we begin to
City of Wayzata Comprehensive Plan 2030 Transportation Chapter: Appendix A
 A1. Functional Classification Table A-1 illustrates the Metropolitan Council s detailed criteria established for the functional classification of roadways within the Twin Cities Metropolitan Area. Table
MEASURING PASSENGER CAR EQUIVALENTS (PCE) FOR LARGE VEHICLES AT SIGNALIZED INTERSECTIONS
 FOR LARGE VEHICLES AT SIGNALIZED INTERSECTIONS") MEASURING PASSENGER CAR EQUIVALENTS (PCE) FOR LARGE VEHICLES AT SIGNALIZED INTERSECTIONS Md. Mizanur RAHMAN Doctoral Student Graduate School of Engineering Department of Civil Engineering Yokohama National
MEASURING PASSENGER CAR EQUIVALENTS (PCE) FOR LARGE VEHICLES AT SIGNALIZED INTERSECTIONS Md. Mizanur RAHMAN Doctoral Student Graduate School of Engineering Department of Civil Engineering Yokohama National
Transferability of HCM to Asian Countries: An Exploratory Evidence From Bangkok s Multilane Highways
 Transferability of HCM to Asian Countries: An Exploratory Evidence From Bangkok s Multilane Highways Piti ROTWANNASIN (corresponding author) Graduate student Transportation Research Laboratory Faculty
TRANSPORTATION ANALYSIS REPORT US Route 6 Huron, Erie County, Ohio
 TRANSPORTATION ANALYSIS REPORT US Route 6 Huron, Erie County, Ohio December 12, 2012 Prepared for: The City of Huron 417 Main Huron, OH 44839 Providing Practical Experience Technical Excellence and Client
ALLEY 24 TRAFFIC STUDY
 ALLEY 24 TRAFFIC STUDY in City of Frostburg, Maryland January 2013 3566 Teays Valley Road Hurricane, WV Office: (304) 397-5508 www.denniscorporation.com Alley 24 Traffic Study January 2013 Frostburg, Maryland
Waterford Lakes Small Area Study
 Waterford Lakes Small Area Study Existing Traffic Conditions PREPARED FOR: ORANGE COUNTY PUBLIC WORKS DEPARTMENT TRAFFIC ENGINEERING DIVISION ORLANDO, FLORIDA PREPARED WITH: INWOOD CONSULTING ENGINEERS
Access Management Regulations and Standards
 Access Management Regulations and Standards Efficient highway operation Reasonable property access Concept of Access Management The way to manage access to land development while simultaneously preserving
Access Location, Spacing, Turn Lanes, and Medians
 Design Manual Chapter 5 - Roadway Design 5L - Access Management 5L-3 Access Location, Spacing, Turn Lanes, and Medians This section addresses access location, spacing, turn lane and median needs, including
City of Elizabeth City Neighborhood Traffic Calming Policy and Guidelines
 City of Elizabeth City Neighborhood Traffic Calming Policy and Guidelines I. Purpose: The City of Elizabeth City is committed to ensure the overall safety and livability of residential neighborhoods. One
3.9 - Transportation and Traffic
 Transportation and Traffic 3.9 - Transportation and Traffic This section describes the potential transportation and traffic effects of project implementation on the project site and its surrounding area.
Operational Comparison of Transit Signal Priority Strategies
 Operational Comparison of Transit Signal Priority Strategies Revision Submitted on: November, 0 Author: Adriana Rodriguez, E.I Assistant Engineer Parsons Brinckerhoff 0 South Orange Avenue, Suite 00 Orlando,
4.11 TRANSPORTATION 4.11 TRANSPORTATION Environmental Setting Intersection, Roadway, and Freeway Evaluation Methodology
 4.11 TRANSPORTATION This section describes the road transportation system in the vicinity of the proposed Project and the potential impacts to this system from the proposed Project. The analysis in this
TRAFFIC ASSESSMENT River Edge Colorado
 TRAFFIC ASSESSMENT River Edge Colorado Submitted by: Fehr & Peers 621 17th Street, Ste. 231 Denver, CO 8293 (33) 296-43 December, 21 App. M-2 Traffic Assessment River Edge Colorado December 21 TABLE OF
Dr. Naveed Anwar Executive Director, AIT Consulting Affiliated Faculty, Structural Engineering Director, ACECOMS
 Dr. Naveed Anwar Executive Director, AIT Consulting Affiliated Faculty, Structural Engineering Director, ACECOMS Overview Highway Functions and Classifications Highway Design Components Design Control
Grade Separated Intersection
 Grade Separated Intersection Lecture Notes in Transportation Systems Engineering Prof. Tom V. Mathew Contents 1 Overview 1 2 Classification of Intersection 2 2.1 Grade Separated Intersection...........................
THIS PAGE LEFT BLANK INTENTIONALLY
 GA SR 25 Spur at Canal Road Transportation Impact Analysis PREPARED FOR GLYNN COUNTY, GEORGIA 1725 Reynolds Street, Suite 300 Brunswick, Georgia 31520 PREPARED BY 217 Arrowhead Boulevard Suite 26 Jonesboro,
Impact of Signalized Intersection on Vehicle Queue Length At Uthm Main Entrance Mohd Zulhilmi Abdul Halim 1,b, Joewono Prasetijo 2,b
 Impact of Signalized Intersection on Vehicle Queue Length At Uthm Main Entrance Mohd Zulhilmi Abdul Halim 1,b, Joewono Prasetijo 2,b 1,2 Smart Driving Research Center, Faculty of Civil and Environmental
Baseline Survey of New Zealanders' Attitudes and Behaviours towards Cycling in Urban Settings
 Baseline Survey of New Zealanders' Attitudes and Behaviours towards Cycling in Urban Settings Highlights 67% of urban New Zealanders, 18 years of age or more own or have access to a bicycle that is in
Updated Roundabout Analysis Methodology
 Updated Roundabout Analysis Methodology In 1998, the Transportation Planning Analysis Unit (TPAU) working as part of the Roundabout Task Group selected the interim roundabout methodologies of the SIDRA
unsignalized signalized isolated coordinated Intersections roundabouts Highway Capacity Manual level of service control delay
 Whether unsignalized or signalized, isolated or coordinated, you can use TransModeler to simulate intersections with greater detail and accuracy than any other microsimulation software. TransModeler allows
A location model for pedestrian crossings in arterial streets
 A location model for pedestrian crossings in arterial streets B. Amini¹ & H. Ghahramani² ¹Department of Civil Engineering, International University of Imam Khomeini, Iran ²Iran University of Science and
Multimodal Analysis in the 2010 Highway Capacity Manual
 Multimodal Analysis in the 2010 Highway Capacity Manual It s not just cars anymore! Jamie Parks, AICP HCAT Conference May 9-10, 2011 Multimodal LOS in the 2010 HCM History and background Overview of methods
Saturation Flow Rate, Start-Up Lost Time, and Capacity for Bicycles at Signalized Intersections
 Transportation Research Record 1852 105 Paper No. 03-4180 Saturation Flow Rate, Start-Up Lost Time, and Capacity for Bicycles at Signalized Intersections Winai Raksuntorn and Sarosh I. Khan A review of
T R A N S P O R T A T I O N M E M O R A N D U M
 WILKINSON LLC t raffic engineering and t ransportation p lanning 3405 Harbor Way Fort Collins, CO 80524 phone: 970-988-0143 fax: 970-472-0223 martinawilkinson@msn.com T R A N S P O R T A T I O N M E M
MUTCD Part 6: Temporary Traffic Control
 MUTCD Part 6: Temporary Traffic Control OMUTCD English units are preferred. OHIO MANUAL OF UNIFORM TRAFFIC CONTROL DEVICES TABLE OF CONTENTS PREFACE INTRODUCTION TABLE OF CONTENTS PART 1. GENERAL Chapter
URBAN STREET CONCEPTS
 CHAPTER 10 URBAN STREET CONCEPTS CONTENTS I. INTRODUCTION... 10-1 II. URBAN STREETS...10-1 Flow Characteristics... 10-3 Free-Flow Speed...10-3 Running Speed... 10-3 Travel Speed... 10-4 Time-Space Trajectory...10-4
CROSSING GUARD PLACEMENT CONSIDERATIONS AND GAP ASSESSMENT
 CROSSING GUARD PLACEMENT CONSIDERATIONS AND GAP ASSESSMENT Many factors contribute to the need for a Crossing Guard. General federal guidance, provided by the FHWA MUTCD, states that adult crossing guards
Traffic Impact Analysis Chatham County Grocery Chatham County, NC
 Chatham County Grocery Chatham County, NC TABLE OF CONTENTS 1. INTRODUCTION... 1 1.1. Location and Study Area... 1 1.2. Proposed Land Use and Access... 2 1.3. Adjacent Land Uses... 2 1.4. Existing ways...
Addressing Deficiencies HCM Bike Level of Service Model for Arterial Roadways
 Petritsch, et al 1 1 2 3 4 5 6 7 8 9 10 11 12 13 14 15 16 17 18 19 20 21 22 23 24 25 26 27 28 Addressing Deficiencies HCM Bike Level of Service Model for Arterial Roadways Submitted July 31, 2013 Word
Module 3 Developing Timing Plans for Efficient Intersection Operations During Moderate Traffic Volume Conditions
 Module 3 Developing Timing Plans for Efficient Intersection Operations During Moderate Traffic Volume Conditions CONTENTS (MODULE 3) Introduction...1 Purpose...1 Goals and Learning Outcomes...1 Organization
List of Attachments. Location Map... Site Plan... City of Lake Elsinore Circulation Element... City of Lake Elsinore Roadway Cross-Sections...
 List of Attachments Exhibits Location Map... Site Plan... City of Lake Elsinore Circulation Element... City of Lake Elsinore Roadway Cross-Sections... Existing Lane Geometry and Traffic Controls... Existing
Non-motorized Transportation Planning Resource Book Mayor s Task Force on Walking and Bicycling City of Lansing, Michigan Spring 2007 pg.
 Non-motorized Transportation Planning Resource Book pg. 105 of 158 Non-motorized Transportation Planning Resource Book pg. 106 of 158 Non-motorized Transportation Planning Resource Book pg. 107 of 158
Measurement along a Length of Road
 Chapter 7 Measurement along a Length of Road 7.1 Overview This is normally used to obtain variations in speed over a stretch of road. Usually the stretch will be having a length more than 5 meters. We
Highway 111 Corridor Study
 Highway 111 Corridor Study June, 2009 LINCOLN CO. HWY 111 CORRIDOR STUDY Draft Study Tea, South Dakota Prepared for City of Tea Sioux Falls Metropolitan Planning Organization Prepared by HDR Engineering,
Methodology for analysing capacity and level of service for signalized intersections (HCM 2000)
") Methodology for analysing capacity and level of service for signalized intersections (HCM 2000) Ivana Nedevska 1, Slobodan Ognjenović 2,* and Elena Gusakova 3 1 GEING Krebs und Kiefer-Skopje, Macedonia
Methodology for analysing capacity and level of service for signalized intersections (HCM 2000) Ivana Nedevska 1, Slobodan Ognjenović 2,* and Elena Gusakova 3 1 GEING Krebs und Kiefer-Skopje, Macedonia
Overview. Existing Conditions. Corridor Description. Assessment
 Overview A study of the 23 rd Street corridor was undertaken to document the existing conditions, analyze traffic operations, and recommend remedies for deficient situations Although 23 rd Street is frequently
7.0 FREEWAYS CONGESTION HOT SPOT PROBLEM & IMPROVEMENT PROJECT ANALYSIS & DEFINITION
 7.0 FREEWAYS CONGESTION HOT SPOT PROBLEM & IMPROVEMENT PROJECT ANALYSIS & DEFINITION 7.1 INTRODUCTION & METHODOLOGY FEASIBILITY REPORT Congestion hot spot problem locations have been assessed using the
Benefits and Limitations of J- Turn Intersections
 Benefits and Limitations of J- Turn Intersections Ernest B. Perry, Eric Oberhart, Steven Wagner, and Teresa Adams Mid-America Freight Coalition National Center for Freight and Infrastructure Research and
Traffic Circulation Study for Neighborhood Southwest of Mockingbird Lane and Airline Road, Highland Park, Texas
 ARIZONA TEXAS NEW MEXICO OKLAHOMA February 13, 2015 Mr. Meran Dadgostar P.E., R.S. Town of Highland Park 4700 Drexel Dr. Highland Park, Texas 75205 Re: Traffic Circulation Study for Neighborhood Southwest
Document 2 - City of Ottawa Pedestrian Crossover (PXO) Program
 Program") 40 Document 2 - City of Ottawa Pedestrian Crossover (PXO) Program OVERVIEW The City of Ottawa Pedestrian Crossover (PXO) Program provides the basis for PXO implementation in Ottawa. The program s processes
40 Document 2 - City of Ottawa Pedestrian Crossover (PXO) Program OVERVIEW The City of Ottawa Pedestrian Crossover (PXO) Program provides the basis for PXO implementation in Ottawa. The program s processes
PREDICTING THE PERFORMANCE OF AUTOMOBILE TRAFFIC ON URBAN STREETS
 Project No. 3-79 Copy No. B PREDICTING THE PERFORMANCE OF AUTOMOBILE TRAFFIC ON URBAN STREETS FINAL REPORT Prepared For National Cooperative Highway Research Program Transportation Research Board of The
The Walkability Indicator. The Walkability Indicator: A Case Study of the City of Boulder, CO. College of Architecture and Planning
 1 : A Case Study of the City of Boulder, CO College of Architecture and Planning University of Colorado Author Note: Daryoosh Ardalan, Urban Regional Planning, College of Architecture and Planning, University
TRAFFIC IMPACT ANALYSIS. For CHABAD LA JOLLA. Prepared for. Rabbi Baruch Ezagui. and. Edwin L. Laser, AIA. May 1, 2008
 TRAFFIC IMPACT ANALYSIS For CHABAD LA JOLLA Prepared for Rabbi Baruch Ezagui and Edwin L. Laser, AIA May 1, 2008 Note: This Traffic Impact Analysis (TIA) was prepared under the Direction of Andrew P. Schlaefli
Highway 49, Highway 351 and Highway 91 Improvements Feasibility Study Craighead County
 Highway 49, Highway 351 and Highway 91 Improvements Feasibility Study Craighead County Executive Summary March 2015 Highway 49, Highway 351 and Highway 91 Improvements Feasibility Study Craighead County
Planning Guidance in the 2012 AASHTO Bike Guide
 Planning Guidance in the 2012 AASHTO Bike Guide Presentation by: RJ Eldridge Peter Lagerwey August 22, 2012 WEBINAR 2: PLANNING GUIDANCE IN THE 2012 AASHTO BIKE GUIDE Today s Webinar Significant Updates
ANALYSIS OF SIGNALISED INTERSECTIONS ACCORDING TO THE HIGHWAY CAPACITY MANUAL FROM THE POINT OF VIEW OF THE PROCESSES APPLIED IN HUNGARY
 2nd Int. Symposium in Civil Engineering 1998 Budapest ANALYSIS OF SIGNALISED INTERSECTIONS ACCORDING TO THE HIGHWAY CAPACITY MANUAL FROM THE POINT OF VIEW OF THE PROCESSES APPLIED IN HUNGARY István Styevola
Guidelines for Integrating Safety and Cost-Effectiveness into Resurfacing, Restoration, and Rehabilitation Projects
 Guidelines for Integrating Safety and Cost-Effectiveness into Resurfacing, Restoration, and Rehabilitation Projects NCHRP Project 15-50 July 2017 1 Research Objective Develop guidelines for safe and cost-effective
Exhibit 1 PLANNING COMMISSION AGENDA ITEM
 Exhibit 1 PLANNING COMMISSION AGENDA ITEM Project Name: Grand Junction Circulation Plan Grand Junction Complete Streets Policy Applicant: City of Grand Junction Representative: David Thornton Address:
MUTCD Part 6G: Type of Temporary Traffic Control Zone Activities
 MUTCD Part 6G: Type of Temporary Traffic Control Zone Activities 6G.01 Typical Applications Each temporary traffic control (TTC) zone is different. Many variables, such as location of work, highway type,
DEFINITIONS Activity Area - Advance Warning Area Advance Warning Sign Spacing Advisory Speed Approach Sight Distance Attended Work Space
 DEFINITIONS Activity Area - that part of a TTC zone activity area where the work actually takes place. It consists of the work space, traffic space and one or more buffer spaces. Advance Warning Area -