Single Index and Portfolio Models for Forecasting Value-at- Risk Thresholds *
|
|
|
- Brent Hudson
- 5 years ago
- Views:
Transcription
1 Single Index and Porfolio Models for Forecasing Value-a- Risk Thresholds * Bernardo da Veiga and Michael McAleer School of Economics and Commerce Universiy of Wesern Ausralia January 2005 Absrac: The variance of a porfolio can be forecased using a single index model or he covariance marix of he porfolio. Using univariae and mulivariae condiional volailiy models, his paper evaluaes he performance of he single index and porfolio models in forecasing Value-a-Risk (VaR) hresholds of a porfolio. The LR ess of uncondiional coverage, independence and condiional coverage of he VaR forecass sugges ha he single index model leads o excessive and ofen serially dependen violaions, while he porfolio model leads o oo few violaions. The single index model also leads o lower daily Basel Accord capial charges. The univariae models which display correc condiional coverage lead o higher capial charges han models which lead o oo many violaions. Overall, he Basel Accord penalies may be oo lenien and favour models wih oo many violaions. Keywords and phrases: Single index, porfolio spillover, Value-a-Risk hresholds, Basel Accord penalies, mulivariae condiional volailiy, condiional correlaions. JEL classificaions: F37, C51, C53, C32 * The auhors wish o hank Dave Allen, Felix Chan, Alvaro Veiga, Marcelo Medeiros, and seminar paricipans a he Insiue of Economics, Academia Sinica, Taiwan, Griffih Universiy, Ling Tung Universiy, Taiwan, Macquarie Universiy, Queensland Universiy of Technology, Universiy of Queensland and Ponifical Caholic Universiy, Brazil, for helpful commens and suggesions. The firs auhor acknowledges a Universiy Posgraduae Award and an Inernaional Posgraduae Research Scholarship a he Universiy of Wesern Ausralia, and he second auhor is graeful for he financial suppor of he Ausralian Research Council. 1
2 1. Inroducion The need o model he variance of a financial porfolio accuraely has become especially imporan following he 1995 amendmen o he Basel Accord, whereby banks were permied o use inernal models o calculae heir Value-a-Risk (VaR) hresholds (see Jorion (2000) for a deailed discussion of VaR). This amendmen was in response o widespread criicism ha he Sandardized approach, which banks used o calculae heir VaR hresholds, led o excessively conservaive forecass. Excessive conservaism has a negaive impac on he profiabiliy of banks as higher capial charges are subsequenly required. Alhough he amendmen o he Basel Accord was designed o reward insiuions wih superior risk managemen sysems, a backesing procedure, whereby he realized reurns are compared wih he VaR forecass, was inroduced o asses he qualiy of he inernal models. In cases where he inernal models lead o a greaer number of violaions han could reasonably be expeced, given he confidence level, he bank is required o hold a higher level of capial (see Table 7 for he penalies imposed under he Basel Accord). If a bank s VaR forecass are violaed more han 9 imes in any financial year, he bank may be required o adop he Sandardized approach. The imposiion of such a penaly is severe as i affecs he profiabiliy of he bank direcly hrough higher capial charges, has a damaging effec on he bank s repuaion, and may lead o he imposiion of a more sringen exernal model o forecas he bank s VaR hresholds. One of he main ingrediens required o produce he VaR hreshold of a porfolio is he condiional variance of he porfolio reurns. Condiional volailiy models can be used o esimae he condiional variance of he porfolio reurns eiher by: (1) fiing a univariae volailiy model o he porfolio reurns (hereafer called he single index model); or (2) using a mulivariae volailiy model o forecas he condiional variance of each asse in he porfolio, as well as he condiional correlaions beween all asse pairs, in order o calculae he forecased porfolio variance (hereafer called he porfolio model). The porfolio model has boh inuiive and empirical appeal as i enables he modelling of he 2
3 relaionship beween subses of he porfolio, and also allows for scenario and sensiiviy analysis. Bollerslev (1990) proposed a Consan Condiional Correlaion (CCC) mulivariae GARCH model which models he condiional variances and correlaions using a simple 2-sep procedure. In his approach, a univariae GARCH model is fied o each reurns series in he firs sep, and he condiional correlaion marix is calculaed using he sandardized residuals in he second sep. The CCC approach can be exended by using more general univariae condiional volailiy models in he firs sep. In his paper we compare he performance of he single index and porfolio models in forecasing VaR hresholds for a porfolio conaining he S&P500 (USA), FTSE100 (UK), CAC40 (France) and SMI (Swizerland) indexes. Six differen crieria are used o compare he forecasing performance of he various condiional volailiy models and mehods considered, namely: (1) he linear regression approach of Pagan and Schwer (1990); (2) he uncondiional coverage es; (3) he serial independence of violaions es; (4) he condiional coverage es; (5) he size of he average capial charge: and (6) he magniude of he average violaions which would arise from using each model o forecas he VaR hreshold. The ess given in (2)-(4) above are likelihood raio ess, as derived in Chrisoffersen (1998). The plan of he paper is as follows. Secion 2 discusses various calibraed and esimaed univariae and mulivariae condiional volailiy models ha will be used o forecas he volailiy and VaR hresholds of a porfolio (see McAleer (2005) for a comparison of alernaive univariae and mulivariae, condiional and sochasic, financial volailiy models ha are available in he lieraure. The daa are discussed in Secion 3, he forecasing performance of he alernaive models is analysed and compared in Secion 4, and some concluding remarks are given in Secion 5. 3
4 2. Model Specificaions This secion describes alernaive models ha can be used o esimae he condiional variance of a porfolio direcly by modelling he hisorical porfolio reurns (namely, he single index model), or indirecly by modelling he condiional variance of each asse and he condiional correlaion of each pair of asses (namely, he porfolio model). Financial reurns are ypically modelled as a saionary AR(1) process, alhough his can easily be relaxed. In wha follows, he final wo models o be discussed, namely PS-GARCH and VARMA- GARCH, are valid only for he mulivariae approach. The models are presened in increasing order of complexiy. 2.1 Sandardized Normal (SN) The Sandardized Normal (SN) approach forecass he condiional variance a ime as he hisorical variance over a specified ime inerval. This approach is exremely simple and easy o implemen compuaionally. In his paper, he hisorical variance is calculaed using a rolling window for he previous 250 business days. 2.1 EWMA Riskmerics TM (1996) developed a model which esimaes he condiional variances and covariances based on he exponenially weighed moving average (EWMA) mehod, which is, in effec, a resriced version of he ARCH( ) model of Engle (1982). This approach forecass he condiional variance a ime as a linear combinaion of he lagged condiional variance and he squared uncondiional shock a ime 1. The EWMA model calibraes he condiional variance as: h = λh + (1 λε ) (1)
5 where λ is a decay parameer. Riskmerics TM (1996) suggess ha λ should be se a 0.94 for purposes of analysing daily daa. 2.3 ARCH Engle (1982) proposed he Auoregressive Condiional Heeroskedasiciy of order p, or ARCH( p ), model as follows: p 2 j j j= 1 h = ω + αε. (2) For he case p = 1, ω > 0, α1 > 0 are sufficien condiions o ensure a sricly posiive condiional variance, h > 0. The ARCH (or α 1 ) effec capures he shor run persisence of shocks. 2.4 GARCH Bollerslev (1986) generalized ARCH( p ) o he GARCH( p, q ) model, which is given by: h p q 2 = ω + αε j j + βh i j= 1 i= 1. (3) For he case p = 1, ω > 0, α1 > 0, β1 0 are sufficien condiions o ensure a sricly posiive condiional variance, h > 0. The ARCH (or α 1 ) effec capures he shor run persisence of shocks, and he GARCH (or β 1) effec indicaes he conribuion of shocks o long run persisence ( α1 + β1). In ARCH and GARCH models, he parameers are ypically esimaed using he maximum likelihood esimaion (MLE) mehod. In he absence of normaliy of he 5
6 sandardized residuals, η, he parameers are esimaed by he Quasi-Maximum Likelihood Esimaion (QMLE) mehod (see, for example, Li, Ling and McAleer (2002)). 2.5 GJR Glosen, Jagannahan and Runkle (1992) exended he GARCH model o capure possible asymmeries beween he effecs of posiive and negaive shocks of he same magniude on he condiional variance hrough changes in he deb-equiy raio. The GJR( p, q ) model is given by: p q 2 2 = ω+ α jε j + γ ( η 1) ε 1+ β i i j= 1 i= 1 (4) h I h where he indicaor variable, I( η ), is defined as: { 1, ε 0 0, ε > 0 I( η ) =. (5) For he case p = 1, ω > 0, α1 > 0, α1+ γ1 > 0, β1 0 are sufficien condiions o ensure a sricly posiive condiional variance, h > 0. The indicaor variable disinguishes beween posiive and negaive shocks, where he asymmeric effec ( γ 1 > 0 ) measures he conribuion of shocks o boh shor run persisence ( α /2 1+ γ 1 ) and long run persisence ( α + β + γ /2) Several imporan heoreical resuls are relevan for he GARCH model. Ling and McAleer (2002a) esablished he necessary and sufficien condiions for sric saionariy and ergodiciy, as well as for he exisence of all momens, for he univariae GARCH( p, q ) model, and Ling and McAleer (2003) demonsraed ha he QMLE for GARCH( p, q ) is consisen if he second momen is finie, E( ε 2 ) <, and 6
7 asympoically normal if he fourh momen is finie, E( ε 4 ) <. The necessary and sufficien condiion for he exisence of he second momen of ε for he GARCH(1,1) model is α1+ β1 < 1. Anoher imporan resul is ha he log-momen condiion for he QMLE of GARCH(1,1), which is a weak sufficien condiion for he QMLE o be consisen and asympoically normal, is given by E(log( αη + β )) < 0. The log-momen condiion was derived in Elie and Jeanheau (1995) and Jeanheau (1998) for consisency, and in Boussama (2000) for asympoic normaliy. In pracice, i is more sraighforward o verify he second momen condiion han he weaker log-momen condiion, as he laer is a funcion of unknown parameers and he mean of he logarihmic ransformaion of a random variable. The GJR model has also had some imporan heoreical developmens. In he case of symmery of η, he regulariy condiion for he exisence of he second momen of GJR(1,1) is α 1+ β γ / < (see Ling and McAleer (2002b)). Moreover, he weak logmomen condiion for GJR(1,1), E(log[( α + γ I( η )) η + β ]) < 0, is sufficien for he consisency and asympoic normaliy of he QMLE (see McAleer, Chan and Marinova (2002)). 2.6 EGARCH Nelson (1991) proposed he Exponenial GARCH (EGARCH) model, which is given as: ε ε log( h) log( ) p r q i k = ω+ αi + γk + β j h j i= 1 h i k= 1 h k j= 1. (6) As he range of log( h ) is he real number line, he EGARCH model does no require any parameric resricions o ensure ha he condiional variances are posiive. Furhermore, 7
8 he EGARCH specificaion is able o capure several sylised facs, such as small posiive shocks having a greaer impac on condiional volailiy han small negaive shocks, and large negaive shocks having a greaer impac on condiional volailiy han large posiive shocks. Such feaures in financial reurns and risk are ofen cied in he lieraure o suppor he use of EGARCH o model he condiional variances. Unlike he EWMA, ARCH, GARCH and GJR models, EGARCH uses he sandardized raher han he uncondiional shocks. Moreover, as he sandardized shocks have finie momens, he momen condiions of EGARCH are sraighforward and may be used as diagnosic checks of he underlying models. However, he saisical properies of EGARCH have no ye been developed formally. If he sandardized shocks are independenly and idenically disribued, he saisical properies of EGARCH are likely o be naural exensions of (possibly vecor) ARMA ime series processes (for furher deails, see McAleer (2005)). 2.6 PGARCH Ding, Granger and Engle (1993) generalized he sandard deviaion GARCH models of Taylor (1986) and Schwer (1989), and proposed an asymmeric Power GARCH (PGARCH) model. The PGARCH model is given by: p q δ δ δ = + i( i i i) + j j i= 1 j= 1, (7) σ ω α ε γ ε β σ in which he power parameer, δ, can be esimaed raher han imposed, and γ is included o capure he effecs of asymmeric shocks. Ling and McAleer (2002a) derived he necessary and sufficien condiions for he momens o exis for PGARCH. However, unlike he case of he EGARCH model, which also uses he absolue value funcion bu sandardized raher han uncondiional shocks, he PGARCH model uses uncondiional raher han sandardized shocks. As he disribuion of he absolue value of he 8
9 uncondiional shocks is presenly unknown, he saisical properies of he PGARCH model have ye o be developed. 2.7 PS-GARCH This secion describes he parsimonious porfolio spillover GARCH (PS-GARCH) model of McAleer and da Veiga (2005), which is inended o capure porfolio spillover effecs. Le Y = E( Y F ) + ε (8) 1 be a vecor of reurns on m financial asses, where F is he pas informaion available o 1 ime -1, and he condiional mean of he reurns follows a VARMA process: Φ( L)( Y µ ) =Ψ ( L) ε. (9) The reurn on he porfolio consising of he m asses is denoed as: m Y = E( x y F ) + ε (10) p, i, i, 1 p, i= 1 where y i, denoes he reurn on asse i a ime and x i denoes he porfolio weigh of asse i a ime, such ha: m xi = 1. (11) i= 1 The PS-GARCH model assumes ha he reurns on he porfolio follow a VARMA process, as follows: 9
10 Φ( L)( Y µ ) =Ψ ( L) ε (12) p, p p, ε = Dη (13) ε = h η (14) 1/2 p p p h r s 2 p = ωp + αplε p, l + βplhp, l l= 1 l= 1 (16) r r s s s (16) H = W + A ε + C I( η ) ε + BH + G ˆ ε + K hˆ l l l l l l l l p, l l p, l l= 1 l= 1 l= 1 l= 1 l= 1 where H = ( h 1,..., h m )', W = ( ω1,..., ω m )', ( 1/ D = diag h i ), η = ( η1,..., ηm), ε = ( ε1,..., εm), and 2 ˆp ε, l and ˆp, l h are he fied values from and (12) and (15), respecively. The marices Al, Bl, C l, G l and K l are diagonal, wih ypical elemens α ii, β ii, γ ii, λ ii and δ, respecively, for i = 1,..., m, I η ) = diag( I ( η )) is an m m diagonal marix, ii Φ... ( i p q ( L) = I m Φ1 L Φ pl and m q Ψ ( L) = I Ψ1 L... Ψ L are polynomials in L, he lag operaor, F is he pas informaion available o ime 1, 1 I m is he marix, and I ( η i ) is an indicaor funcion, given as: m m ideniy I ( η ) i, { 1, ε 0 i, = 0, εi, > 0. (17) The indicaor funcion disinguishes beween he effecs of posiive and negaive shocks of equal magniude on condiional volailiy. Using (13), he condiional covariance marix for he PS-GARCH model is given by Q = D Γ D, in which i is assumed ha he condiional correlaions of he uncondiional 10
11 shocks are given by E η η ) = Γ. The marix Γ is he consan condiional correlaion ( marix of he uncondiional shocks which is, by definiion, equivalen o he consan condiional correlaion marix of he condiional shocks. 2.8 VARMA-GARCH The VARMA-GARCH model of Ling and McAleer (2003), which assumes symmery in he effecs of posiive and negaive shocks on mulivariae condiional volailiy, is given as follows: Y = E( Y F ) + ε (8) 1 Φ( L)( Y µ ) =Ψ ( L) ε (19) ε = Dη (20) r s = + l ε l + l l l= 1 l= 1 (21) H W A BH where H = ( h1,..., hm)', W = ( ω 1,..., ω m )', D 1/2 = diag( hi ), η = ( η1,..., ηm)', ε = ( ε,..., ε ), A l and m B l are m m marices wih ypical elemens α ij and β ij, respecively, for i, j = 1,..., m, I η ) = diag( I( η )) is an m m marix, ( i p ( L) = I m Φ1 L Φ pl and Φ... q ( L) = I m Ψ1 L Ψq L are polynomials in L, he Ψ... lag operaor, and F is he pas informaion available o ime. Spillover effecs are given in he condiional volailiy for each asse in he porfolio. Based on (20), he VARMA- GARCH model also assumes ha he condiional correlaion marix of he uncondiional shocks is given by E η η ) = Γ. ( 11
12 An exension of he VARMA-GARCH model is he VARMA-AGARCH model of Hoi, Chan and McAleer (2002), which capures he asymmeric spillover effecs from each of he oher asses in he porfolio. The VARMA-AGARCH model is also a mulivariae exension of he GJR model. 3. Daa The daa used in he empirical applicaion are daily prices measured a 16:00 Greenwich Mean Time (GMT) for four inernaional sock marke indexes (henceforh referred o as synchronous daa), namely S&P500 (USA), FTSE100 (UK), CAC40 (France), and SMI (Swizerland). All prices are expressed in US dollars. The daa were obained from DaaSream for he period 3 Augus 1990 o 5 November A he ime he daa were colleced, his period was he longes for which daa on all four variables were available. The raionale for employing daily synchronous daa in modelling sock reurns and volailiy ransmission is four-fold (see McAleer and da Veiga (2005)): (i) The Efficien Markes Hypohesis would sugges ha informaion is quickly and efficienly incorporaed ino sock prices. While informaion generaed yeserday may be significan in explaining sock price changes oday, i is less likely ha news generaed las monh would have any explanaory power oday. (ii) I has been argued by Engle, Io and Lin (1990) ha volailiy is caused by he arrival of unexpeced news and ha volailiy clusering is he resul of invesors reacing differenly o news. The use of daily daa may help in modelling he ineracion beween he heerogeneiy of invesor responses in differen markes. (iii) Sudies ha use close-o-close non-synchronous reurns suffer from he nonsynchroniciy problem, as highlighed in Scholes and Williams (1977). In paricular, hese sudies canno disinguish a spillover from a conemporaneous correlaion when markes wih common rading hours are analysed. Kahya (1997) and Burns, Engle and 12
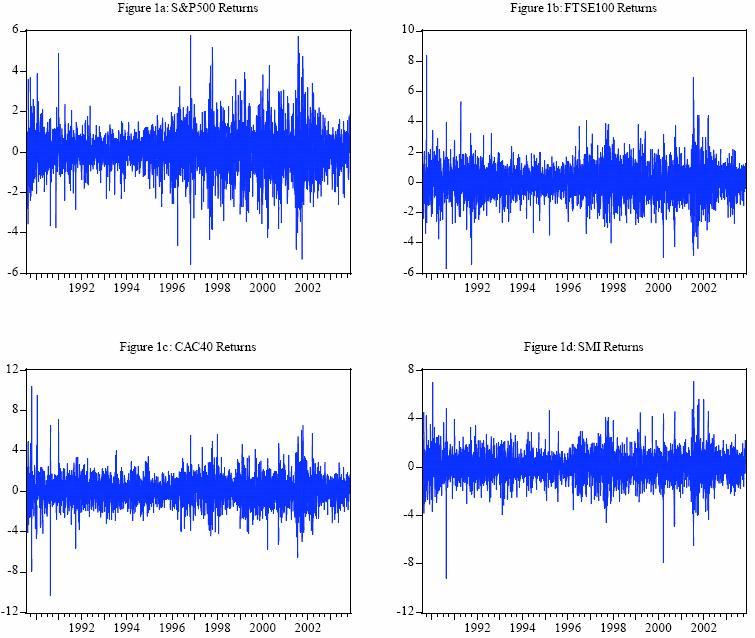
13 Mezrich (1998) also observe ha, if cross marke correlaions are posiive, he use of close-o-close reurns for non-synchronous markes will underesimae he rue correlaions, and hence underesimae he rue risk associaed wih a porfolio of such asses. (iv) The use of synchronous daa allows he sysem o be wrien in a simulaneous equaions form, which can be esimaed joinly. Such join esimaion of he parameers eliminaes poenial economeric problems associaed wih generaed regressors (see, for example, Pagan(1984) and Oxley and McAleer (1993, 1994)), improves efficiency in esimaion, increases he power of he es for cross-marke spillovers, and analyses marke ineracions simulaneously. This allows all he relaionships o be esed joinly. Join esimaion is also consisen wih he noion ha spillovers are he impac of global news on each marke. The synchronous reurns for each marke i a ime R ) are defined as: ( i, Ri = log( Pi, / Pi, 1), where P i, is he price in marke i a ime, as recorded a 16:00 GMT. The plos of he synchronous reurns are given in Figures 1a-d. Each of he reurns series exhibis clusering, which will be capured by an appropriae ime series model. The descripive saisics for he synchronous reurns of he four indexes are given in Table 1. All series have similar means and medians, which are close o zero, minima which vary beween and , and maxima ha range beween and Alhough he four sandard deviaions vary slighly, he coefficiens of variaion (CoV) are quie differen, ranging from for S&P500 o for CAC40. The skewness differs among all four series, bu he kurosis is reasonably similar for all series. The Jarque-Bera es srongly rejecs he null hypohesis of normally disribued reurns, which may be due o he presence of exreme observaions. As each of he series displays a high degree of kurosis, his would seem o indicae he exisence of exreme observaions. 13
14 [Inser Figures 1a-d here] [Inser Table 1 here] Several definiions of volailiy are available in he lieraure. This paper adops he measure of volailiy proposed in Franses and van Dijk (1999), where he rue volailiy of reurns is defined as: V = ( R E( R F )) i, i, i, 1 2 where F 1 is he informaion se a ime -1. The plos of he volailiies of he synchronous reurns are given in Figures 2a-d. Each of he series exhibis clusering, which needs o be capured by an appropriae ime series model. The volailiy of all series appears o be high during he early 1990 s, followed by a quie period from he end of 1992 o he beginning of Finally, he volailiy of all series appears o increase dramaically around 1997, due in large par o he Asian economic and financial crises. This increase in volailiy persiss unil he end of he period, and is likely o have been affeced by he Sepember 11, 2001 erroris aacks and he conflics in Afghanisan and Iraq. [Inser Figures 2a-d here] The descripive saisics for he volailiy of he synchronous reurns of he four indexes are given in Table 2. The CAC40 displays he highes mean (median) volailiy a (0.665), while FTSE100 has he lowes mean (median) volailiy a (0.425). The maxima of he four volailiy series differ subsanially, wih SMI displaying he highes maxima and S&P500 displaying he lowes. Alhough he four sandard deviaions vary, he coefficiens of variaion (CoV) are similar. All series are highly skewed. As each of he series displays a high degree of kurosis, his would seem o indicae he exisence of exreme observaions. 14
15 [Inser Table 2 here] 4. Forecass In his secion he forecasing performance of he various models described in he previous secion is compared. For purposes of he empirical analysis, i is assumed ha he porfolio weighs are equal and consan over ime, bu hese assumpions can be relaxed. Exchange rae risk is conrolled by convering all prices o a common currency, namely he US Dollar. The models described in Secion 2 are used o esimae he variance of he porfolio direcly for he single index model, and o esimae he condiional variances and correlaions of all asses and asse pairs o calculae he variance of he porfolio for he porfolio model. Apar from he Sandardized Normal and Riskmerics TM models, all he condiional volailiy models are esimaed under he following disribuional assumpions of he uncondiional shocks: (1) normal; and (2), wih en degrees of freedom. A rolling window is used o forecas he 1-day ahead condiional correlaions, condiional variances and VaR hresholds. The sample ranges from 3 Augus 1990 o 5 November In order o srike a balance beween efficiency in esimaion and a viable number of rolling regressions, he rolling window size is se a 2000 for all four daa ses, which leads o a forecasing period from 6 April 1998 o 5 November Six differen approaches are used o evaluae he porfolio variance and forecass of he VaR hresholds, as described below. 4.1 Linear Regression Approach Pagan and Schwer (1990) proposed a procedure whereby he volailiy forecass are regressed on he realized volailiy. In his paper, he squared porfolio reurns are used as a proxy for he realized volailiy. The auxiliary regression equaion is given by: 15
16 RV = α + βfv + ε where RV is he realized volailiy and FV is he forecased volailiy. In his auxiliary equaion, he inercep, α, should be equal o zero and he slope, β, 2 should be equal o 1. The coefficien of deerminaion, R, is a measure of forecasing performance, and he -raio of he coefficiens is a measure of he bias. Tables 3-4 give he esimaes and es saisics for he single index and porfolio models. On he basis of 2 2 he R crierion, he porfolio PGARCH- model performs he bes, wih R = The wors performing models are he single index and porfolio Sandardized Normal 2 models, boh of which have R = I is ineresing o noe ha models esimaed using a -disribuion end o display marginally superior forecass, he only excepion being he porfolio CCC model. In all cases, he porfolio models ouperform he single 2 index models based on R, which suggess ha he porfolio model approach leads o superior forecass of he condiional variance of he porfolio compared wih heir single index counerpars. [Inser Tables 3-4 here] 4.2 Tess of Uncondiional Coverage, Serial Independence and Condiional Coverage Chrisoffersen (1998) derived likelihood raio (LR) ess of uncondiional coverage, serial independence and condiional coverage. Subsequenly, Lopez (1998) adaped hese ess o evaluae VaR hreshold forecass. An adequae VaR model should exhibi he propery ha he uncondiional coverage (which is calculaed as he number of observed violaions divided by T ) should equal α, where α is he level of significance chosen for he VaR, and T is he number of rading days in he evaluaion period. The probabiliy of observing x violaions in a sample of size T, under he null hypohesis, is given by: 16
17 250 x T-x Pr(x) = C x (0.01) (0.99) Therefore, he LR saisic for esing wheher he number of observed violaions, divided by T, is equal o α is: x N x x N x LR = 2[log( α (1 α) ) log((0.01 )(0.99 ))] UC where α = x / N, x is he number of violaions, and N is he number of forecass. The LR saisic is asympoically disribued as χ 2 (1) under he null hypohesis. However, a model ha leads o he correc uncondiional coverage may sill be subopimal if he violaions are serially dependan, as hey may lead o bank failures. The es of independence is he LR saisic for he null hypohesis of serial independence agains he alernaive of firs-order Markov dependence. Finally, Chrisoffersen (1998) proposed he condiional coverage es, which is a join es of uncondiional coverage and independence. The condiional coverage LR saisic is given as he sum of he uncondiional coverage LR saisic and he independence LR saisic, which is asympoically disribued as χ 2 (2) under he join null hypohesis. Tables 5-6 presen he resuls of he LR ess of uncondiional coverage, serial independence and condiional coverage. Wih he excepion of Riskmerics TM and EGARCH, all he single index models which assume normaliy fail he uncondiional coverage es, in ha hey lead o a significanly greaer number of violaions han expeced. The single index models esimaed under he assumpion ha he reurns follow a -disribuion perform far beer, wih he ARCH model being he only model o fail he uncondiional coverage es due o an excessive number of violaions. The porfolio models perform quie poorly, wih en of he sixeen models considered failing he uncondiional coverage es. I is worh noing ha he porfolio models fail he uncondiional coverage es because hey lead o an insufficien number of violaions. 17
18 Five single index models fail he serial independence es, four of which assume ha he reurns follow a -disribuion. However, only wo of he porfolio models fail he serial independence es, boh of which assume normaliy. Finally, eigh of he welve single index models fail he condiional coverage es. Of he porfolio models considered, eigh of he sixeen fail he condiional coverage es. I is ineresing o noe ha rejecion of he null hypohesis in each case was more likely under a -disribuion han under normaliy. [Inser Tables 5-6 here] Overall, he empirical resuls presened in his secion offer some mixed evidence on he relaive performance of he VaR hreshold forecass produced by he single index and porfolio models. Based on he uncondiional coverage es, i seems ha he single index model leads o an excessive number of violaions, while he porfolio model has oo few violaions. Furhermore, he serial independence es favours he porfolio model. From a regulaory viewpoin, he porfolio model may be preferred as i is likely o lead o fewer bank failures, while banks are likely o favour he model which leads o he lowes coss. The nex secion aemps o quanify he coss o boh banks and regulaors ha are associaed wih he use of each ype of model. 4.3 Daily Capial Charge and Magniude of Violaions The Basel Accord sipulaes ha he daily capial charge mus be se a he higher of he previous day s VaR or he average VaR over he las 60 business days, muliplied by a facor k. The muliplicaive facor k is se by he local regulaors, bu mus no be lower han 3. In 1995, he 1988 Basel Accord was amended o allow banks o use inernal models o deermine heir VaR hresholds. However, banks wishing o use inernal models mus demonsrae ha heir models are sound. The backesing procedure is used 18
19 o es he adequacy of he models by comparing he realised and forecased losses (for furher deails, see Basel Commiee (1988, 1995, 1996)). Furhermore, he Basel Accord imposes penalies in he form of a higher muliplicaive facor k on banks which use models ha lead o a greaer number of violaions han would reasonably be expeced given he specified confidence level of 1%. Table 7 shows he penalies imposed for a given number of violaions for 250 business days. [Inser Table 7 here] Tables 8-9 give he mean daily capial charges for each model. The wors performing models are he porfolio and single index Sandardized Normal models, which would lead o average daily capial charges of 12.92% and 12.33% respecively. The bes performing models are he single index EGARCH and PGARCH models, which would lead o average daily capial charges of 7.97% and 8.04%, respecively. Wih he excepion of he Riskmerics TM model, all single index models lead o lower daily capial charges han he corresponding porfolio models. Furhermore, all he single index models which are esimaed assuming a -disribuion lead o higher capial charges han he equivalen models esimaed under a normal disribuion These resuls sugges ha he penalies imposed under he Basel Accord may no be sufficienly severe, as virually all of he normally disribued single index models are found o lead o a greaer number of violaions han would be expeced on he basis of he uncondiional coverage es. Thus, i would seem ha he Basel Accord ends o favour models which lead o an excessive number of violaions. However, such an inference may be overly simplisic because, in cerain cases where he number of violaions is deemed o be excessively large, regulaors may penalize banks even furher by requiring ha heir inernal models be reviewed. In circumsances where he inernal models are found o be inadequae, he offending banks may be required o adop he sandardized mehod originally proposed in 1993 under he Basel Accord. The sandardized mehod suffers from several drawbacks, he mos noiceable of which is is 19
20 sysemaic overesimaion of risk, which sems from he assumpion of perfec correlaion across differen risk facors. This penaly would lead o higher capial charges, which would have a negaive impac on boh he profiabiliy and repuaion of he affeced banks. The cenral idea underlying capial reserve requiremens is o minimize he possibiliy of bank failures, so ha banks are required o hold sufficien capial o cover a leas hree imes he forecased wors poenial loss. The magniude of he average violaion is, herefore, an imporan consideraion, because models ha perform well according o all he relevan crieria may sill be inadequae if hey lead o an excessively large number of violaions. Tables 8-9 give he maximum and average absolue deviaions of violaions from he VaR forecass. The wors performing models are he single index and porfolio Sandardized Normal models, respecively, as hey lead o boh he larges maximum absolue deviaions a and 3.509, respecively, and he highes average absolue deviaions a and 0.617, respecively. The bes performing models on he basis of he maximum absolue deviaions are he porfolio PGARCH- and EGARCH- models, which lead o he lowes maximum absolue deviaions a and 0.727, respecively, while he bes performing models on he basis of he average absolue deviaions are he single index EGARCH and PGARCH models, which lead o he lowes average absolue deviaions a and 0.362, respecively. Alhough hese resuls migh seem o offer suppor for he use of hese wo single index models, i is imporan o noe ha he single index EGARCH and PGARCH models lead o 30 and 31 violaions, respecively, which is large even in comparison wih heir - disribuion counerpars. Overall, he numbers of violaions are considerably greaer for he single index models han for heir porfolio counerpars. [Inser Tables 8-9 here] 20
21 5. Conclusion The variance of a porfolio can be forecased using a single index model, or from he forecased variances and covariances of all he asses in he porfolio. Using alernaive univariae and mulivariae condiional volailiy models, including he simple Sandardized Normal (SN) model, he exponenially weighed moving average (EWMA) model proposed by Riskmerics TM (1996), and alernaive univariae and mulivariae, symmeric and asymmeric, condiional volailiy models, his paper evaluaed he performance of he single index and porfolio models in forecasing he Value-a-Risk (VaR) hresholds. In he empirical example, he porfolio comprised four inernaional sock marke indexes, namely he S&P500, FTSE100, CAC40 and SMI financial indexes, for he period 3 Augus 1990 o 5 November On he basis of he empirical resuls, he porfolio approach was found o yield superior porfolio volailiy forecass based on he linear regression approach of Pagan and Schwer (1990). The likelihood raio ess of uncondiional coverage, independence and condiional coverage of he VaR forecass, as proposed in Chrisoffersen (1998), offered mixed evidence, wih a large proporion of he single index and porfolio models failing he uncondiional coverage es, he former due o an excessive number of violaions and he laer due o an insufficien number of violaions. Furhermore, i was found ha he single index models led o lower daily capial charges based on he Basel Capial Accord penalies, as compared wih heir porfolio counerpars. Finally, wihin he class of single index models, he models which display correc condiional coverage led o higher capial charges han models which led o excessive violaions. These resuls seemed o sugges ha he penalies imposed under he Basel Capial Accord may be oo lenien, and ended o favour models ha led o an excessive number of violaions, as well as models ha were found o be sub-opimal based on various performance crieria. 21
22 References Basel Commiee on Banking Supervision, (1988), Inernaional Convergence of Capial Measuremen and Capial Sandards, BIS, Basel, Swizerland. Basel Commiee on Banking Supervision, (1995), An Inernal Model-Based Approach o Marke Risk Capial Requiremens, BIS, Basel, Swizerland. Basel Commiee on Banking Supervision, (1996), Supervisory Framework for he Use of Backesing in Conjuncion wih he Inernal Model-Based Approach o Marke Risk Capial Requiremens, BIS, Basel, Swizerland. Bollerslev, T. (1986), Generalised Auoregressive Condiional Heeroscedasiciy, Journal of Economerics, 31, Bollerslev, T. (1990), Modelling he Coherence in Shor-Run Nominal Exchange Rae: A Mulivariae Generalized ARCH Approach, Review of Economics and Saisics, 72, Boussama, F. (2000), Asympoic Normaliy for he Quasi-Maximum Likelihood Esimaor of a GARCH Model, Compes Rendus de l Académie des Sciences, Série I, 331, (in French). Burns, P., R. Engle and J. Mezrich (1998), Correlaions and Volailiies of Asynchronous Daa, Journal of Derivaives, 5, Chrisoffersen (1998), Evaluaing Inerval Forecass, Inernaional Economic Review, 39, Ding, Z., C.W.J. Granger and R.F. Engle (1993), A Long Memory Propery of Sock Marke Reurns and a New Model, Journal of Empirical Finance, 1, Elie, L. and T. Jeanheau (1995), Consisency in Heeroskedasic Models, Compes Rendus de l Académie des Sciences, Série I, 320, (in French). Engle, R.F. (1982), Auoregressive Condiional Heeroscedasiciy wih Esimaes of he Variance of Unied Kingdom Inflaion, Economerica, 50, Engle, R.F., T. Io and W. Lin (1990), Meeor Showers or Hea Waves? Heeroskedasic Inra-Daily Volailiy in he Foreign Exchange Marke, Economerica, 58, Franses, P.H. and D. van Dijk (1999), Nonlinear Time Series Models in Empirical Finance, Cambridge, Cambridge Universiy Press. 22
23 Glosen, L.R., R. Jagannahan and D.E. Runkle (1992), On he Relaion Beween he Expeced Value and Volailiy of he Nominal Excess Reurn on Socks, Journal of Finance, 46, Hoi, S., F. Chan and M. McAleer (2002), Srucure and Asympoic Theory for Mulivariae Asymmeric Volailiy: Empirical Evidence for Counry Risk Raings, Invied paper presened o he Ausralasian Meeing of he Economeric Sociey, Brisbane, Ausralia, July Jeanheau, T. (1998), Srong Consisency of Esimaors for Mulivariae ARCH Models, Economeric Theory, 14, Jorion, P. (2000), Value a Risk: The New Benchmark for Managing Financial Risk, McGraw-Hill, New York. Kahya, E. (1997), Correlaion of Reurns in Non-Conemporaneous Markes, Mulinaional Finance Journal, 1, Li, W.K., S. Ling and M. McAleer (2002), Recen Theoreical Resuls for Time Series Models wih GARCH Errors, Journal of Economic Surveys, 16, Reprined in M. McAleer and L. Oxley (eds.), Conribuions o Financial Economerics: Theoreical and Pracical Issues, Blackwell, Oxford, 2002, pp Ling, S. and M. McAleer (2002a), Necessary and Sufficien Momen Condiions for he GARCH(r,s) and Asymmeric Power GARCH(r,s) Models, Economeric Theory, 18, Ling, S. and M. McAleer (2002b), Saionariy and he Exisence of Momens of a Family of GARCH Processes, Journal of Economerics, 106, Ling, S. and M. McAleer (2003), Asympoic Theory for a Vecor ARMA-GARCH Model, Economeric Theory, 19, Lopez, J.A (1998), Mehods for Evaluaing Value-a-Risk Esimaes, Federal Reserve Bank of New York Economic Policy Review, McAleer, M. (2005), Auomaed Inference and Learning in Modeling Financial Volailiy, Economeric Theory, 21, McAleer, M., F. Chan and D. Marinova (2002), An Economeric Analysis of Asymmeric Volailiy: Theory and Applicaion o Paens, invied paper presened o he Ausralasian Meeing of he Economeric Sociey, Brisbane, July 2002, o appear in Journal of Economerics. 23
24 McAleer, M. and B. da Veiga (2005), Spillover Effecs in Forecasing Volailiies and VaR, unpublished paper, School of Economics and Commerce, Universiy of Wesern Ausralia. Nelson, D. (1991), Condiional Heeroskedasiciy in Asse Reurns: a New Approach, Economerica, 59, Oxley, L. and M. McAleer (1993), Economeric Issues in Macroeconomic Models wih Generaed Regressors, Journal of Economic Surveys, 7, Oxley, L. and M. McAleer (1994), Tesing he Raional Expecaions Hypohesis in Macroeconomeric Models wih Unobserved Variables, in L. Oxley, D.A.R. George, C.J. Robers and S. Sayer (eds.), Surveys in Economerics, Basil Blackwell, Oxford, 1994, pp Pagan, A.R. (1984), Economeric Issues in he Analysis of Regressions wih Generaed Regressors, Inernaional Economic Review, 2, Pagan, A.R. and W. Schwer (1990), Alernaive Models for Condiional Sock Volailiy, Journal of Economerics, 50, Riskmerics TM (1996), J.P. Morgan Technical Documen, 4 h ediion, New York. J.P. Morgan. Scholes, M. and J. Williams (1977), Esimaing Beas from Nonsynchronous Daa, Journal of Financial Economics, 5, Schwer, W. (1989), Sock Volailiy and Crash of 87, Review of Financial Sudies, 3, Taylor, S. (1986), Modelling Financial Time Series, New York, Wiley. 24
25 Table 1: Descripive Saisics for Reurns Saisics S&P500 FTSE100 CAC40 SMI Mean Median Maximum Minimum Sd. Dev Skewness Kurosis CoV Jarque-Bera Table 2: Descripive Saisics for Volailiies Saisics S&P500 FTSE100 CAC40 SMI Mean Median Maximum Minimum Sd. Dev Skewness Kurosis CoV
26 Table 3: Linear Regression Tes for he Single Index Model Model α -raio β -raio 2 R Sandardized Normal Riskmerics TM ARCH ARCH GARCH GARCH GJR GJR PGARCH PGARCH EGARCH EGARCH Noes: (1) The null hypohesis α = 0 is esed agains he alernaive 0 (2) The null hypohesis β = 1 is esed agains he alernaive 1 α. β. 26
27 Table 4: Linear Regression Tes for he Porfolio Model Model α -raio β -raio 2 R Sandardized Normal Riskmerics TM ARCH ARCH CCC CCC GJR GJR EGARCH EGARCH PGARCH PGARCH VARMA-GARCH VARMA-GARCH PS-GARCH PS-GARCH Noes: (1) The null hypohesis α = 0 is esed agains he alernaive 0 (2) The null hypohesis β = 1 is esed agains he alernaive 1 α. β. 27
28 Table 5: Likelihood Raio Tes of Uncondiional Coverage, Serial Independence and Condiional Coverage for he Single Index Model Model UC SI CC Sandardized Normal * * Riskmerics TM ARCH * * ARCH * GARCH GARCH GJR GJR PGARCH PGARCH * * EGARCH EGARCH * * Noe: Enries in bold denoe significance a he 5% level; * denoes significance a 1%. 28
29 Table 6: Likelihood Raio Tes of Uncondiional Coverage, Serial Independence and Condiional Coverage for he Porfolio Model Model UC SI CC Sandardized Normal 6.857* * * Riskmerics TM ARCH ARCH CCC CCC * * GJR GJR * EGARCH EGARCH * * PGARCH * * PGARCH * * VARMA-GARCH VARMA-GARCH * * PS-GARCH PS-GARCH * * Noes: Enries in bold denoe significance a he 5% level; * denoes significance a 1%. 29
30 Table 7: Basel Accord Penaly Zones Zone Number of Violaions Increase in k Green 0 o Yellow Red Noe: The number of violaions is given for 250 business days. 30
31 Table 8: Mean Daily Capial Charge and AD of Violaions for he Single Index Model Model Number of Violaions Mean Daily AD of Violaions Capial Charge Maximum Mean Sandardized Normal Riskmerics TM ARCH ARCH GARCH GARCH GJR GJR PGARCH PGARCH EGARCH EGARCH Noes: (1) The daily capial charge is given as he negaive of (3+k) imes he greaer of he previous day s VaR or he average VaR over he las 60 business days, where k is he penaly. (2) AD is he absolue deviaion of he violaions from he VaR forecas. 31
32 Table 9: Mean Daily Capial Charge and AD of Violaions for he Porfolio Model Model Number of Violaions Mean Daily AD of Violaions Capial Charge Maximum Mean Sandardized Normal Riskmerics TM ARCH ARCH CCC CCC GJR GJR EGARCH EGARCH PGARCH PGARCH VARMA-GARCH VARMA-GARCH PS-GARCH PS-GARCH Noes: (1) The daily capial charge is given as he negaive of (3+k) imes he greaer of he previous day s VaR or he average VaR over he las 60 business days, where k is he penaly. (2) AD is he absolue deviaion of he violaions from he VaR forecas. 32
33 33
34 34
A Probabilistic Approach to Worst Case Scenarios
 A Probabilisic Approach o Wors Case Scenarios A Probabilisic Approach o Wors Case Scenarios By Giovanni Barone-Adesi Universiy of Albera, Canada and Ciy Universiy Business School, London Frederick Bourgoin
Paul M. Sommers David U. Cha And Daniel P. Glatt. March 2010 MIDDLEBURY COLLEGE ECONOMICS DISCUSSION PAPER NO
 AN EMPIRICAL TEST OF BILL JAMES S PYTHAGOREAN FORMULA by Paul M. Sommers David U. Cha And Daniel P. Gla March 2010 MIDDLEBURY COLLEGE ECONOMICS DISCUSSION PAPER NO. 10-06 DEPARTMENT OF ECONOMICS MIDDLEBURY
Market Timing with GEYR in Emerging Stock Market: The Evidence from Stock Exchange of Thailand
 Journal of Finance and Invesmen Analysis, vol. 1, no. 4, 2012, 53-65 ISSN: 2241-0998 (prin version), 2241-0996(online) Scienpress Ld, 2012 Marke Timing wih GEYR in Emerging Sock Marke: The Evidence from
Evaluating the Performance of Forecasting Models for Portfolio Allocation Purposes with Generalized GRACH Method
 Advances in mahemaical finance & applicaions, 2 (1), (2017), 1-7 Published by IA Universiy of Arak, Iran Homepage: www.amfa.iauarak.ac.ir Evaluaing he Performance of Forecasing Models for Porfolio Allocaion
296 Finance a úvěr-czech Journal of Economics and Finance, 64, 2014, no. 4
 JEL Classificaion: C32, F31, G11 Keywords: Emerging Easern Europe, sock and currency markes, porfolio, VaR Effeciveness of Porfolio Diversificaion and he Dynamic Relaionship beween Sock and Currency Markes
MODEL SELECTION FOR VALUE-AT-RISK: UNIVARIATE AND MULTIVARIATE APPROACHES SANG JIN LEE
 MODEL SELECTION FOR VALUE-AT-RISK: UNIVARIATE AND MULTIVARIATE APPROACHES By SANG JIN LEE Bachelor of Science in Mahemaics Yonsei Universiy Seoul, Republic of Korea 999 Maser of Business Adminisraion Yonsei
Idiosyncratic Volatility, Stock Returns and Economy Conditions: The Role of Idiosyncratic Volatility in the Australian Stock Market
 Idiosyncraic Volailiy, Sock Reurns and Economy Condiions: The Role of Idiosyncraic Volailiy in he Ausralian Sock Marke Bin Liu Amalia Di Iorio RMIT Universiy Melbourne Ausralia Absrac This sudy examines
Time-Variation in Diversification Benefits of Commodity, REITs, and TIPS 1
 Time-Variaion in Diversificaion Benefis of Commodiy, REITs, and TIPS 1 Jing-zhi Huang 2 and Zhaodong Zhong 3 This Draf: July 11, 2006 Absrac Diversificaion benefis of hree ho asse classes, Commodiy, Real
The t-test. What We Will Cover in This Section. A Research Situation
 The -es 1//008 P331 -ess 1 Wha We Will Cover in This Secion Inroducion One-sample -es. Power and effec size. Independen samples -es. Dependen samples -es. Key learning poins. 1//008 P331 -ess A Research
Homework 2. is unbiased if. Y is consistent if. c. in real life you typically get to sample many times.
 Econ526 Mulile Choice. Homework 2 Choose he one ha bes comlees he saemen or answers he quesion. (1) An esimaor ˆ µ of he oulaion value µ is unbiased if a. ˆ µ = µ. b. has he smalles variance of all esimaors.
Morningstar Investor Return
 Morningsar Invesor Reurn Morningsar Mehodology Paper March 3, 2009 2009 Morningsar, Inc. All righs reserved. The informaion in his documen is he propery of Morningsar, Inc. Reproducion or ranscripion by
Stock Return Expectations in the Credit Market
 Sock Reurn Expecaions in he Credi Marke Hans Bysröm * Sepember 016 In his paper we compue long-erm sock reurn expecaions (across he business cycle) for individual firms using informaion backed ou from
Measuring dynamics of risk and performance of sector indices on Zagreb Stock Exchange
 Measuring dynamics of risk and performance of secor indices on Zagreb Sock Exchange Tihana Škrinjarić Faculy of Economics and Business, Universiy of Zagreb, Zagreb, Croaia skrinjaric@efzg.hr Absrac Invesors
Valuing Volatility Spillovers
 Valuing Volailiy Spillovers George Milunovich Division of Economic and Financial Sudies Macquarie Universiy Sydney Susan Thorp School of Finance and Economics Universiy of Technology Sydney March 2006
Testing Portfolio Efficiency with Non-Traded Assets: Taking into Account Labor Income, Housing and Liabilities
 Tesing Porfolio Efficiency wih Non-Traded Asses: Taking ino Accoun Labor Income, Housing and Liabiliies Roy Kouwenberg Mahidol Universiy and Erasmus Universiy Roerdam Thierry Pos Erasmus Universiy Roerdam
The APT with Lagged, Value-at-Risk and Asset Allocations by Using Econometric Approach
 Proceedings of he 16 Inernaional Conference on Indusrial Engineering and Operaions Managemen Deroi, USA, Sepember 3-5, 16 he AP wih Lagged, Value-a-Risk and Asse Allocaions by Using Economeric Approach
Economics 487. Homework #4 Solution Key Portfolio Calculations and the Markowitz Algorithm
 Economics 87 Homework # Soluion Key Porfolio Calculaions and he Markowiz Algorihm A. Excel Exercises: (10 poins) 1. Download he Excel file hw.xls from he class websie. This file conains monhly closing
Unsystematic Risk. Xiafei Li Cass Business School, City University. Joëlle Miffre Cass Business School, City University
 The Universiy of Reading Momenum Profis and Time-Varying Unsysemaic Risk Xiafei Li Cass Business School, Ciy Universiy Joëlle Miffre Cass Business School, Ciy Universiy Chris Brooks ICMA Cenre, Universiy
Constructing Absolute Return Funds with ETFs: A Dynamic Risk-Budgeting Approach. July 2008
 Consrucing Absolue Reurn Funds wih ETFs: A Dynamic Risk-Budgeing Approach July 2008 Noël Amenc Direcor, EDHEC Risk & Asse Managemen Research Cenre Professor of Finance, EDHEC Business School noel.amenc@edhec-risk.com
Can Optimized Portfolios Beat 1/N?
 Can Opimized Porfolios Bea 1/N? This disseraion is presened in par fulfillmen of he requiremen for he compleion of an MSc in Economics in he Deparmen of Economics, Universiy of Konsanz, and an MSc in Economics
Strategic Decision Making in Portfolio Management with Goal Programming Model
 American Journal of Operaions Managemen and Informaion Sysems 06; (): 34-38 hp://www.sciencepublishinggroup.com//aomis doi: 0.648/.aomis.0600.4 Sraegic Decision Making in Porfolio Managemen wih Goal Programming
Centre for Investment Research Discussion Paper Series. Momentum Profits and Time-Varying Unsystematic Risk
 Cenre for Invesmen Research Discussion Paper Series Discussion Paper # 08-0* Momenum Profis and Time-Varying Unsysemaic Risk Cenre for Invesmen Research O'Rahilly Building, Room 3.0 Universiy College Cork
Simulation based approach for measuring concentration risk
 MPRA Munich Personal RePEc Archive Simulaion based approach for measuring concenraion risk Kim, Joocheol and Lee, Duyeol UNSPECIFIED February 27 Online a hp://mpra.ub.uni-muenchen.de/2968/ MPRA Paper No.
Market timing and statistical arbitrage: Which market timing opportunities arise from equity price busts coinciding with recessions?
 Journal of Applied Finance & Banking, vol.1, no.1, 2011, 53-81 ISSN: 1792-6580 (prin version), 1792-6599 (online) Inernaional Scienific Press, 2011 Marke iming and saisical arbirage: Which marke iming
Portfolio Efficiency: Traditional Mean-Variance Analysis versus Linear Programming
 Porfolio Efficiency: Tradiional Mean-Variance Analysis versus Linear Programming Seve Eli Ahiabu Universiy of Torono Spring 003 Please send commens o Sephen.ahiabu@uorono.ca I hank Prof. Adonis Yachew
Betting Against Beta
 Being Agains Bea Andrea Frazzini and Lasse H. Pedersen * This draf: Ocober 5, 2010 Absrac. We presen a model in which some invesors are prohibied from using leverage and oher invesors leverage is limied
Momentum profits and time varying unsystematic risk
 Momenum profis and ime varying unsysemaic risk Aricle Acceped Version Li, X., Miffre, J., Brooks, C. and O'Sullivan, N. (008) Momenum profis and ime varying unsysemaic risk. Journal of Banking & Finance,
Bootstrapping Multilayer Neural Networks for Portfolio Construction
 Asia Pacific Managemen Review 17(2) (2012) 113-126 Boosrapping Mulilayer Neural Neworks for Porfolio Consrucion Chin-Sheng Huang a*, Zheng-Wei Lin b, Cheng-Wei Chen c www.apmr.managemen.ncku.edu.w a Deparmen
Overview. Do white-tailed tailed and mule deer compete? Ecological Definitions (Birch 1957): Mule and white-tailed tailed deer potentially compete.
: Mule and white-tailed tailed deer potentially compete.") COMPETITION BETWEEN MULE AND WHITE- TAILED DEER METAPOPULATIONS IN NORTH-CENTRAL WASHINGTON E. O. Garon, Kris Hennings : Fish and Wildlife Dep., Univ. of Idaho, Moscow, ID 83844 Maureen Murphy, and Seve
COMPETITION BETWEEN MULE AND WHITE- TAILED DEER METAPOPULATIONS IN NORTH-CENTRAL WASHINGTON E. O. Garon, Kris Hennings : Fish and Wildlife Dep., Univ. of Idaho, Moscow, ID 83844 Maureen Murphy, and Seve
Sources of Over-Performance in Equity Markets: Mean Reversion, Common Trends and Herding
 The Universiy of Reading THE BUSINESS SCHOOL FOR FINANCIAL MARKETS Sources of Over-Performance in Equiy Markes: Mean Reversion, Common Trends and Herding ISMA Cenre Discussion Papers in Finance 2003-08
MULTIVARIATE RISK-RETURN DECISION MAKING WITHIN DYNAMIC ESTIMATION
 Economic Analysis Working Papers.- 7h Volume Number 11 MULIVARIAE RISK-REURN DECISION MAKING WIHIN DYNAMIC ESIMAION Josip Arnerić 1, Elza Jurun, and Snježana Pivac, 3 Universiy of Spli, Faculy of Economics,
Lifecycle Funds. T. Rowe Price Target Retirement Fund. Lifecycle Asset Allocation
 Lifecycle Funds Towards a Dynamic Asse Allocaion Framework for Targe Reiremen Funds: Geing Rid of he Dogma in Lifecycle Invesing Anup K. Basu Queensland Universiy of Technology The findings of he Mercer
The Current Account as A Dynamic Portfolio Choice Problem
 Public Disclosure Auhorized Policy Research Working Paper 486 WPS486 Public Disclosure Auhorized Public Disclosure Auhorized The Curren Accoun as A Dynamic Porfolio Choice Problem Taiana Didier Alexandre
QUANTITATIVE FINANCE RESEARCH CENTRE. Optimal Time Series Momentum QUANTITATIVE FINANCE RESEARCH CENTRE QUANTITATIVE F INANCE RESEARCH CENTRE
 QUANTITATIVE FINANCE RESEARCH CENTRE QUANTITATIVE F INANCE RESEARCH CENTRE QUANTITATIVE FINANCE RESEARCH CENTRE Research Paper 353 January 15 Opimal Time Series Momenum Xue-Zhong He, Kai Li and Youwei
DYNAMIC portfolio optimization is one of the important
 , July 2-4, 2014, London, U.K. A Simulaion-based Porfolio Opimizaion Approach wih Leas Squares Learning Chenming Bao, Geoffrey Lee, and Zili Zhu Absrac This paper inroduces a simulaion-based numerical
Rolling ADF Tests: Detecting Rational Bubbles in Greater China Stock Markets
 Singapore Managemen Universiy Insiuional Knowledge a Singapore Managemen Universiy Disseraions and Theses Collecion (Open Access) Disseraions and Theses 2008 Rolling ADF Tess: Deecing Raional Bubbles in
Evaluating Portfolio Policies: A Duality Approach
 OPERATIONS RESEARCH Vol. 54, No. 3, May June 26, pp. 45 418 issn 3-364X eissn 1526-5463 6 543 45 informs doi 1.1287/opre.16.279 26 INFORMS Evaluaing Porfolio Policies: A Dualiy Approach Marin B. Haugh
Asset Allocation with Higher Order Moments and Factor Models
 Asse Allocaion wih Higher Order Momens and Facor Models Kris Boud (VU Brussel, Amserdam) Based on join research wih: Wanbo Lu (SWUFE) and Benedic Peeers (Finvex Group) 1 The world of asse reurns is non-normal.
An Alternative Mathematical Model for Oxygen Transfer Evaluation in Clean Water
 An Alernaive Mahemaical Model for Oxygen Transfer Evaluaion in Clean Waer Yanjun (John) He 1, PE, BCEE 1 Kruger Inc., 41 Weson Parkway, Cary, NC 27513 Email: john.he@veolia.com ABSTRACT Energy consumpion
A Liability Tracking Portfolio for Pension Fund Management
 Proceedings of he 46h ISCIE Inernaional Symposium on Sochasic Sysems Theory and Is Applicaions Kyoo, Nov. 1-2, 214 A Liabiliy Tracking Porfolio for Pension Fund Managemen Masashi Ieda, Takashi Yamashia
Do Competitive Advantages Lead to Higher Future Rates of Return?
 Do Compeiive Advanages Lead o Higher Fuure Raes of Reurn? Vicki Dickinson Universiy of Florida Greg Sommers Souhern Mehodis Universiy 2010 CARE Conference Forecasing and Indusry Fundamenals April 9, 2010
The credit portfolio management by the econometric models: A theoretical analysis
 The credi porfolio managemen by he economeric models: A heoreical analysis Abdelkader Derbali To cie his version: Abdelkader Derbali. The credi porfolio managemen by he economeric models: A heoreical analysis.
FORECASTING TECHNIQUES ADE 2013 Prof Antoni Espasa TOPIC 1 PART 2 TRENDS AND ACCUMULATION OF KNOWLEDGE. SEASONALITY HANDOUT
 FORECASTING TECHNIQUES ADE 2013 Prof Anoni Espasa TOPIC 1 PART 2 TRENDS AND ACCUMULATION OF KNOWLEDGE. SEASONALITY HANDOUT February 2013 MAIN FACTORS CAUSING TRENDS Increases in populaion. Seady inflaion.
Monte Carlo simulation modelling of aircraft dispatch with known faults
 Loughborough Universiy Insiuional Reposiory Mone Carlo simulaion modelling of aircraf dispach wih known fauls This iem was submied o Loughborough Universiy's Insiuional Reposiory by he/an auhor. Ciaion:
Reexamining Sports-Sentiment Hypothesis: Microeconomic Evidences from Borsa Istanbul
 Reexamining Spors-Senimen Hypohesis: Microeconomic Evidences from Borsa Isanbul Ka Wai Terence Fung +, Ender Demir, Chi Keung Marco Lau And Kwok Ho Chan * Absrac This paper examines he impac of inernaional
Dynamics of market correlations: Taxonomy and portfolio analysis
 Dynamics of marke correlaions: Taxonomy and porfolio analysis J.-P. Onnela, A. Chakrabori, and K. Kaski Laboraory of Compuaional Engineering, Helsinki Universiy of Technology, P.O. Box 9203, FIN-02015
ITG Dynamic Daily Risk Model for Europe
 December 2010 Version 1 ITG Dynamic Daily Risk Model for Europe 2010 All righs reserved. No o be reproduced or reransmied wihou permission. 121610 29140 These maerials are for informaional purposes only,
Using Rates of Change to Create a Graphical Model. LEARN ABOUT the Math. Create a speed versus time graph for Steve s walk to work.
 2.4 Using Raes of Change o Creae a Graphical Model YOU WILL NEED graphing calculaor or graphing sofware GOAL Represen verbal descripions of raes of change using graphs. LEARN ABOUT he Mah Today Seve walked
Overreaction and Underreaction : - Evidence for the Portuguese Stock Market -
 Overreacion and Underreacion : - Evidence for he Poruguese Sock Marke - João Vasco Soares* and Ana Paula Serra** March 2005 * Faculdade de Economia da Universidade do Poro ** (corresponding auhor) CEMPRE,
KEY CONCEPTS AND PROCESS SKILLS. 1. An allele is one of the two or more forms of a gene present in a population. MATERIALS AND ADVANCE PREPARATION
 Gene Squares 61 40- o 2 3 50-minue sessions ACIVIY OVERVIEW P R O B L E M S O LV I N G SUMMARY Sudens use Punne squares o predic he approximae frequencies of rais among he offspring of specific crier crosses.
NBER WORKING PAPER SERIES DIVERSIFICATION AND THE OPTIMAL CONSTRUCTION OF BASIS PORTFOLIOS. Bruce N. Lehmann David M. Modest
 NBER WORKING PAPER SERIES DIVERSIFICATION AND THE OPTIMAL CONSTRUCTION OF BASIS PORTFOLIOS Bruce N. Lehmann David M. Modes Working Paper 9461 hp://www.nber.org/papers/w9461 NATIONAL BUREAU OF ECONOMIC
THE PERSISTENCY OF INTERNATIONAL DIVERSIFICATION BENEFITS: THE ROLE OF THE ASYMMETRY VOLATILITY MODEL
 ASIA ACADEMY of MAAGEMET JOURAL of ACCOUTIG and FIACE AAMJAF, Vol. 10, o. 1, 151 165, 014 THE PERSISTECY OF ITERATIOAL DIVERSIFICATIO BEEFITS: THE ROLE OF THE ASYMMETRY VOLATILITY MODEL Ung Sze ie 1*,
Review of Economics & Finance Submitted on 27/03/2017 Article ID: Mackenzie D. Wood, and Jungho Baek
 Review of Economics & Finance Submied on 27/03/2017 Aricle ID: 1923-7529-2017-04-63-09 Mackenzie D. Wood, and Jungho Baek Facors Affecing Alaska s Salmon Permi Values: Evidence from Brisol Bay Drif Gillne
Capacity Utilization Metrics Revisited: Delay Weighting vs Demand Weighting. Mark Hansen Chieh-Yu Hsiao University of California, Berkeley 01/29/04
 Capaciy Uilizaion Merics Revisied: Delay Weighing vs Demand Weighing Mark Hansen Chieh-Yu Hsiao Universiy of California, Berkeley 01/29/04 1 Ouline Inroducion Exising merics examinaion Proposed merics
Improving Measurement Uncertainty of Differential Pressures at High Line Pressures & the Potential Impact on the Global Economy & Environment.
 Improving Measuremen Uncerainy of Differenial Pressures a igh Line Pressures & he Poenial Impac on he Global Economy & Environmen. Speaker/uhor: Mike Collins Fluke Calibraion 5 urricane Way Norwich. NR6
The Measuring System for Estimation of Power of Wind Flow Generated by Train Movement and Its Experimental Testing
 Energy and Power Engineering, 2014, 6, 333-339 Published Online Ocober 2014 in SciRes. hp://www.scirp.org/journal/epe hp://dx.doi.org/10.4236/epe.2014.611028 The Measuring Sysem for Esimaion of Power of
Performance Attribution for Equity Portfolios
 PERFORMACE ATTRIBUTIO FOR EQUITY PORTFOLIOS Performance Aribuion for Equiy Porfolios Yang Lu and David Kane Inroducion Many porfolio managers measure performance wih reference o a benchmark. The difference
What should investors know about the stability of momentum investing and its riskiness? The case of the Australian Security Exchange
 Wha should invesors know abou he sabiliy of momenum invesing and is riskiness? The case of he Ausralian Securiy Exchange Emilios C. Galariois To cie his version: Emilios C. Galariois. Wha should invesors
Measuring Potential Output and Output Gap and Macroeconomic Policy: The Case of Kenya
 Universiy of Connecicu DigialCommons@UConn Economics Working Papers Deparmen of Economics Ocober 2005 Measuring Poenial Oupu and Oupu Gap and Macroeconomic Policy: The Case of Kenya Angelica E. Njuguna
Portfolio Strategies Based on Analysts Consensus
 Porfolio Sraegies Based on Analyss Consensus Enrico Maria Cervellai Deparmen of Managemen Faculy of Economics Universiy of Bologna Piazza Scaravilli, 1 40126 Bologna Tel: +39 (0)51 2098087 Fax: +39 (0)51
FIVE RISK FACTORS MODEL: PRICING SECTORAL PORTFOLIOS IN THE BRAZILIAN STOCK MARKET
 Revisa Caarinense da Ciência Conábil, ISSN 1808-3781 - eissn 2237-7662, Florianópolis, SC, Brazil, v. 16, n. 48, p. 81-98, May/Aug. 2017 doi: 10.16930/2237-7662/rccc.v16n48.2376 Available a hp://revisa.crcsc.org.br
ANALYSIS OF RELIABILITY, MAINTENANCE AND RISK BASED INSPECTION OF PRESSURE SAFETY VALVES
 ANALYSIS OF RELIABILITY, MAINTENANCE AND RISK BASED INSPECTION OF PRESSURE SAFETY VALVES Venilon Forunao Francisco Machado Mechanical Engineering Dep, Insiuo Superior Técnico, Av. Rovisco Pais, 049-00,
CALCULATION OF EXPECTED SLIDING DISTANCE OF BREAKWATER CAISSON CONSIDERING VARIABILITY IN WAVE DIRECTION
 CALCULATION OF EXPECTED SLIDING DISTANCE OF BREAKWATER CAISSON CONSIDERING VARIABILITY IN WAVE DIRECTION SU YOUNG HONG School of Civil, Urban, and Geosysem Engineering, Seoul Naional Universiy, San 56-1,
Local Does as Local Is: Information Content of the Geography of Individual Investors Common Stock Investments
 Local Does as Local Is: Informaion Conen of he Geography of Individual Invesors Common Sock Invesmens Zoran Ivković and Sco Weisbenner Deparmen of Finance Universiy of Illinois a Urbana-Champaign 340 Wohlers
Macro Sensitive Portfolio Strategies
 Marke Insigh Macro Sensiive Porfolio Sraegies Marke Insigh Macro Sensiive Porfolio Sraegies Macroeconomic Risk and Asse Cash Flows Kur Winkelmann, Raghu Suryanarayanan, Ludger Henschel, and Kaalin Varga
What is a Practical (ASTM C 618) SAI--Strength Activity Index for Fly Ashes that can be used to Proportion Concretes Containing Fly Ash?
 SAI--Strength Activity Index for Fly Ashes that can be used to Proportion Concretes Containing Fly Ash?") 2017 World of Coal Ash (WOCA) Conference in Lexingon, KY - May 9-11, 2017 hp://www.flyash.info/ Wha is a Pracical (ASTM C 618) SAI--Srengh Aciviy Index for Fly Ashes ha can be used o Proporion Concrees
2017 World of Coal Ash (WOCA) Conference in Lexingon, KY - May 9-11, 2017 hp://www.flyash.info/ Wha is a Pracical (ASTM C 618) SAI--Srengh Aciviy Index for Fly Ashes ha can be used o Proporion Concrees
SIMULATION OF WAVE EFFECT ON SHIP HYDRODYNAMICS BY RANSE
 1 h Inernaional Conference on Sabiliy of Ships and Ocean Vehicles 591 SIMULATION OF WAVE EFFECT ON SHIP HYDRODYNAMICS BY RANSE Qiuxin Gao, Universiy of Srahclyde, UK, Gao.q.x@srah.ac.uk Dracos Vassalos,
On convexity of SD efficiency sets - no short sales case
 4. mezinárodní konference Řízení a modelování finančních rizik Osrava VŠB-U Osrava Ekonomická fakula kaedra Financí.-. září 008 On conveiy of SD efficiency ses - no shor sales case Miloš Kopa Absrac his
Towards a New Dynamic Measure of Competitive Balance: A Study Applied to Australia s Two Major Professional Football Leagues *
 Economic Analysis & Policy, Vol. 39 No. 3, december 2009 Towards a New Dynamic Measure of Compeiive Balance: A Sudy Applied o Ausralia s Two Major Professional Fooball Leagues * Liam J. A. Lenen School
Low-frequency data present significant
 MICKAËL MALLINGER- DOGAN is an assisan vice presiden, Illiquid Asses Analics, a Harvard Managemen Compan in Boson, MA. doganm@hmc.harvard.edu MARK C. SZIGETY is vice presiden and head of Quaniaive Risk
The Effects of Systemic Risk on the Allocation between Value and Growth Portfolios
 Journal of Mahemaical Finance, 013, 3, 165-180 hp://x.oi.org/10.436/mf.013.31a016 Publishe Online March 013 (hp://www.scirp.org/ournal/mf) The Effecs of Sysemic Risk on he Allocaion beween Value an Growh
Methods for Estimating Term Structure of Interest Rates
 Mehods for Esimaing Term Srucure of Ineres Raes Iskander Karibzhanov Absrac This paper compares differen inerpolaion algorihms for consrucing yield curves: cubic splines, linear and quadraic programming,
Proportional Reasoning
 Proporional Reasoning Focus on Afer his lesson, you will be able o... solve problems using proporional reasoning use more han one mehod o solve proporional reasoning problems When you go snowboarding or
Bill Turnblad, Community Development Director City of Stillwater Leif Garnass, PE, PTOE, Senior Associate Joe DeVore, Traffic Engineer
 Memorandum SRF No. 16 94 To: From: Bill Turnblad, Communiy Developmen Direcor Ciy of Sillwaer Leif Garnass, PE, PTOE, Senior Associae Joe DeVore, Traffic Engineer Dae: November 9, 16 Subjec: Downown Plan
Revisiting the Growth of Hong Kong, Singapore, South Korea, and Taiwan, From the Perspective of a Neoclassical Model
 Revisiing he Growh of Hong Kong, Singapore, Souh Korea, and Taiwan, 978-2006 From he Perspecive of a Neoclassical Model Shu-shiuan Lu * Naional Tsing Hua Univereseiy December, 2008 Absrac This paper sudies
Guidance Statement on Calculation Methodology
 Guidance Saemen on Calculaion Mehodology Adopion Dae: 28 Sepember 200 Effecive Dae: January 20 Reroacive Applicaion: No Required www.gipssandards.org 200 CFA Insiue Guidance Saemen on Calculaion Mehodology
Reliability Design Technology for Power Semiconductor Modules
 Reliabiliy Design Technology for Power Semiconducor Modules Akira Morozumi Kasumi Yamada Tadashi Miyasaka 1. Inroducion The marke for power semiconducor modules is spreading no only o general-purpose inverers,
PRESSURE SENSOR TECHNICAL GUIDE INTRODUCTION FEATURES OF ELECTRIC PRESSURE SENSOR. Photoelectric. Sensor. Proximity Sensor. Inductive. Sensor.
 Proximiy INTRDUCTIN Pressur sensor The sensor convers of gases or liquid ino elecrical magniude wih he sensing elemen, and generaes he analog oupu proporional o applied level or he swiching oupu oggled
A Statistical, Age-Structured, Life-History-Based Stock Assessment Model for Anadromous Alosa
 American Fisheries Sociey Symposium 35:275 283, 2003 2003 by he American Fisheries Sociey A Saisical, Age-Srucured, Life-Hisory-Based Sock Assessmen Model for Anadromous Alosa A. JAMIE F. GIBSON 1 Acadia
Are Fluctuations in Gas Consumption Per Capita Transitory? Evidence from LM Unit Root Test with Two Structural Breaks
 MPRA Munich Personal RePEc Archive Are Flucuaions in Gas Consumpion Per Capia Transiory? Evidence from LM Uni Roo Tes wih Two Srucural Breaks Muhammad Shahbaz and Sakiru Adebola Solarin and Hrushikesh
What the Puck? an exploration of Two-Dimensional collisions
 Wha he Puck? an exploraion of Two-Dimensional collisions 1) Have you ever played 8-Ball pool and los he game because you scrached while aemping o sink he 8-Ball in a corner pocke? Skech he sho below: Each
Detection of activity cycles from capture-recapture data
 See discussions, sas, and auhor profiles for his publicaion a: hps://www.researchgae.ne/publicaion/264644551 Deecion of aciviy cycles from capure-recapure daa Aricle in cological nomology February 1986
Simulation Validation Methods
 Simulaion Validaion Mehods J. PELLETTIERE* Federal Aviaion Adminisraion, Washingon DC Absrac Modeling and simulaion is increasingly being used o represen occupan behavior, boh of human subjecs and of Anhropomorphic
The safe ships trajectory in a restricted area
 Scienific Journals Mariime Universiy of Szczecin Zeszyy Naukowe Akademia Morska w Szczecinie 214, 39(111) pp. 122 127 214, 39(111) s. 122 127 ISSN 1733-867 The safe ships rajecory in a resriced area Zbigniew
FINVEX WHITE PAPER ON ASSET ALLOCATION WITH RISK FACTORS
 FINVEX WHITE PAPER ON AET ALLOCATION WITH RIK FACTOR By Dr Kris Boud PhD Professor of Finance & Research Parner a Finvex Group Benedic Peeers Co-Founder Finvex Group July 3 Execuive ummary In his paper,
Semi-Fixed-Priority Scheduling: New Priority Assignment Policy for Practical Imprecise Computation
 Semi-Fixed-Prioriy Scheduling: New Prioriy Assignmen Policy for Pracical Imprecise Compuaion Hiroyuki Chishiro, Akira Takeda 2, Kenji Funaoka 2 and Nobuyuki Yamasaki School of Science for Open and Environmen
INSTRUCTIONS FOR USE. This file can only be used to produce a handout master:
 INSTRUCTIONS OR USE This file can only be used o produce a handou maser: Use Prin from he ile menu o make a prinou of he es. You may no modify he conens of his file. IMPORTNT NOTICE: You may prin his es
Reproducing laboratory-scale rip currents on a barred beach by a Boussinesq wave model
 See discussions, sas, and auhor profiles for his publicaion a: hps://www.researchgae.ne/publicaion/9977 Reproducing laboraory-scale rip currens on a barred beach by a Boussinesq wave model Aricle in Journal
Evaluation of a car-following model using systems dynamics
 Evaluaion of a car-following model using sysems dynamics Arif Mehmood, rank Saccomanno and Bruce Hellinga Deparmen of Civil Engineering, Universiy of Waerloo Waerloo, Onario, Canada N2 3G1 Tel: 519 888
James Sefton and Sylvain Champonnois London Quant Conference September 2012
 Dynamic Porfolio Opimisaion wih Trading Coss James Sefon and Sylvain Champonnois London Quan Conference Sepember 2012 Tracabiliy and Transparency Imporan Quans have needed o upgrade heir approach To rebalance
Application of System Dynamics in Car-following Models
 Applicaion of Sysem Dynamics in Car-following Models Arif Mehmood, rank Saccomanno and Bruce Hellinga Deparmen of Civil Engineering, Universiy of Waerloo Waerloo, Onario, Canada N2 3G1 E-mail: saccoman@uwaerloo.ca
Online Portfolio Selection: A Survey
 Online Porfolio Selecion: A Survey BIN LI, Wuhan Universiy STEVEN C. H. HOI, Nanyang Technological Universiy Online porfolio selecion is a fundamenal problem in compuaional finance, which has been exensively
Flexible Seasonal Closures in the Northern Prawn Fishery
 Flexible Seasonal Closures in he Norhern Prawn Fishery S. Beare, L. Chapman and R. Bell Ausralian Bureau of Agriculural and Resource Economics IIFET 2 Proceedings Given high levels of uncerainy associaed
As time goes by - Using time series based decision tree induction to analyze the behaviour of opponent players
 As ime goes by - Using ime series based decision ree inducion o analyze he behaviour of opponen players Chrisian Drücker, Sebasian Hübner, Ubbo Visser, Hans-Georg Weland TZI - Cener for Compuing Technologies
Improving the Tournament Performance of ATP Players from the Perspective of Efficiency Enhancement
 Inernaional Journal of Spors Science 2014, 4(5): 152-164 DOI: 10.5923/j.spors.20140405.02 Improving he Tournamen Performance of ATP Players from he Perspecive of Efficiency Enhancemen Chia-Hui Tsai 1,
Performance Optimization of Markov Models in Simulating Computer Networks
 Proceedings of he World Congress on Engineering and Copuer Science 9 Vol I WCECS 9, Ocober -, 9, San Francisco, USA Perforance Opiizaion of Marov Models in Siulaing Copuer Newors Nisrine Sinno, Hussein
Breeding Incentive Programs and Demand for California Thoroughbred Racing: The Tradeoff Between Quantity and Quality. Martin D.
 Breeding Incenive Programs and Demand for California horoughbred Racing: he radeoff Beween Quaniy and Qualiy by Marin D. Smih Deparmen of Agriculural and Resource Economics Universiy of California, Davis
Prepared by: Candice A. Churchwell, Senior Consultant Aimee C. Savage, Project Analyst. June 17, 2014 CALMAC ID SCE0350
 Execuive Summary: 2014 2024 Demand Response Porfolio of Souhern California Edison Company Submied o Souhern California Edison Co. Submied by Nexan, Inc. June 17, 2014 CALMAC ID SCE0350 Prepared by: Candice
Transit Priority Strategies for Multiple Routes Under Headway-Based Operations
 Transi Prioriy Sraegies for Muliple Roues Under Headway-Based Operaions Yongjie Lin, Xianfeng Yang, Gang-Len Chang, and Nan Zou This paper presens a ransi signal prioriy (TSP) model designed o consider
The Economic Costs of Vetoes: Evidence from NATO
 The Economic Coss of Veoes: Evidence from NATO Kyriakos Drivas PhD Candidae Deparmen of Agriculural Economics Universiy of California-Berkeley 207 Giannini Hall # 3310 Universiy of California Berkeley,