Common visualization Issues & how to fix them
|
|
|
- Pamela Cameron
- 6 years ago
- Views:
Transcription
1 CSE6242 / CX4242: Data & Visual Analytics Common visualization Issues & how to fix them Duen Horng (Polo) Chau Assistant Professor Associate Director, MS Analytics Georgia Tech Partly based on materials by Professors Guy Lebanon, Jeffrey Heer, John Stasko, Christos Faloutsos

2 Student of Edward Tufte 2

3 Also Highly Recommended:
4 Bar Charts 4


5 Bar Charts The color scheme reminds you of what? 4


6 Better than Christmas (Use color brewer to find good color schemes) 5
7 Company Profits 6


8 Company Profits Don t show profits in red!! Think carefully about your color choices. 6


9 7
10 8
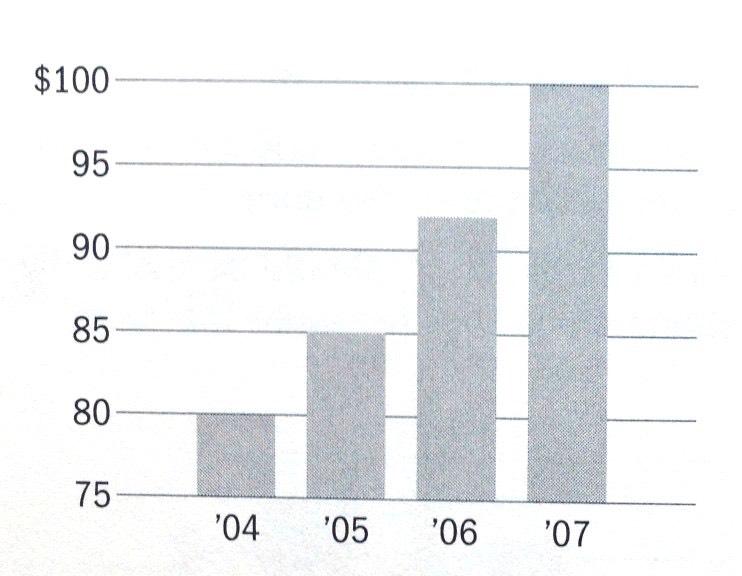
11 Misleading Bar Charts 8


12 Vertical axis of bar charts should start at 0, almost always 9
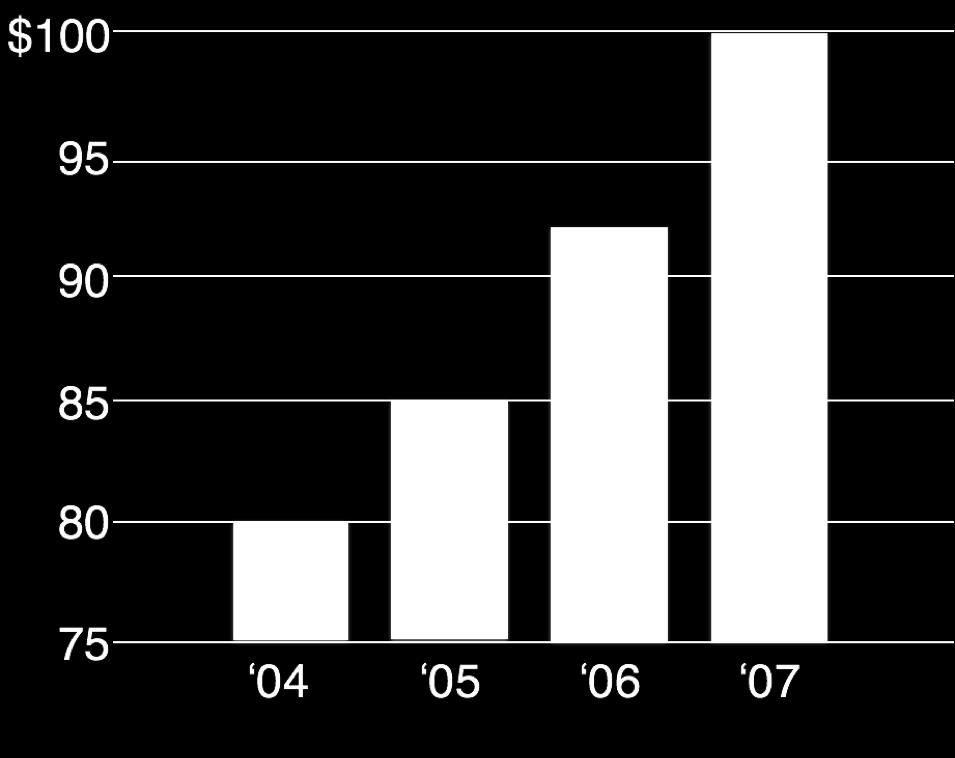
13 10

14 Disorienting color bars 10


15 Use gradation 11
16 12

17 Avoid Tilted or Rotated Labels 12
18 Bars Can be Horizontal 13


19 Bars Can be Horizontal When labels are hard to read, try horizontal layout. Don t settle for the default. 13
20 14
")

21 Line Charts (a.k.a. fever lines) Can you improve the tick labels? 15

22 Use ticks at common intervals (e.g., 2, 5, 10, etc.) 16

23 Too flat or too steep? Too flat obscures the message Too exaggerated overstates the trend Note y-axis does not need to start at 0. Why not as bad as in the case of bar chart? 17
24 Rule of Thumb 18

25 Multiple Patterned Lines in one chart 19

26 Better? Note the double encoding of line width and brightness. What if you have many lines you want to show? 20

27 Small Multiple - Edward Tufte Better than overlapping (sometimes) a series or grid of small similar graphics or charts, allowing them to be easily compared 21
28 Tables Name Data Data Data Company A Company B Company C Company D What can you improve? 22
29 What s the problem with making everything bold or italic?
30

31 When everyone is super, no one will be
32 When everyone is special, no will be! Name Data Data Data Company A Company B Company C Company D
33 Name Data Data Data Data Data Data Company A Company B Company C Company D Company E Company F Company G Company H

34 Name Data Data Data Data Data Data Company A Company B Company C Company D Company E Company F Company G Company H A lot of chart junk. Low data to ink ratio (Edward Tufte) 26
35 Name Data Data Data Data Data Data Company A Company B Company C Company D Company E Company F Company G Company H Company I Company J Company K Company L Higher data to ink ratio 27

36 Problems? Name Data Name Data Company A 1000 Company B 900 Company C 80 Company D 7 Company A Company B 9.49 Company C 8 Company D
37 Name Data Name Data Company A Company B 9.49 Company C 8 Company D 7.4 Company A 10.8 Company B 9.5 Company C 8.0 Company D
38 Beautiful Publication-quality LaTeX Tables Short guide: Long guide: 30


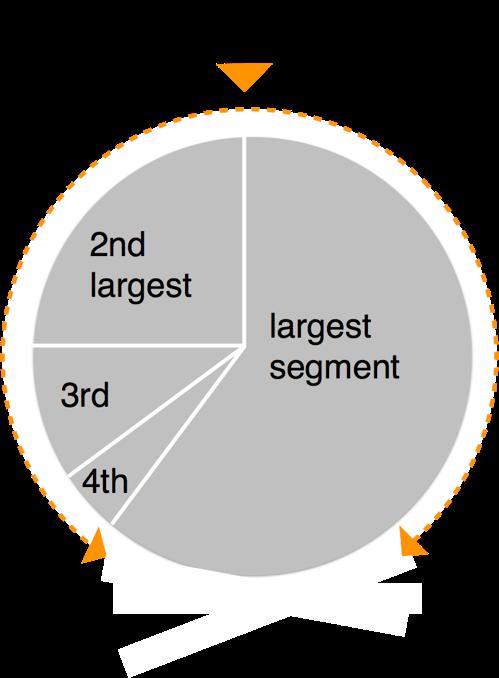
39 The Dreaded Pie Charts Why people like to use pie charts? 31

40 32

41 33

42 34


43 35

44 36
45 Log scale instead of linear scale Include numbers from different orders of magnitude 37
46 Example log-log 38


47 log also works well for time Example The yield curve of Treasury bills, notes and bonds 39
48 In-class Exercise. Applying what you have just learned. 40

49 HEADLINE OF THE CHART A brief description that outlines what the data shows Can you improve its visual design? 41


50 HEADLINE OF THE CHART A brief description that outlines what the data shows Headline of the chart A brief description that outlines what the data shows Town A Town B Town C Town D Which is better? 42
51 How to fix the defaults 43

52 How to fix the defaults 43
53 How to fix the defaults 44
54 How to fix the defaults 44
55 Practitioners Guide Colors: start with black & white, then add colors, carefully Forces you to focus on content and layout Fonts: sans-serif generally easier to read (On Mac: Helvetica is great start) Animation: start with no animation, then add meaningful ones 45
56 Practitioners Guide: Use Pictures and Videos Pictures include tables, diagrams, charts, etc. Pictures often more succinct & memorable People like pictures and love movies And show them ASAP! Once people fall asleep, it s hard to wake them up! If you have good stuff, show them now. 46

57 Example 47

 it s refreshing to read an interesting paper How to do it?")
58 Practitioners Guide: Additional Tips for Researchers Crown-jewel pictures are important Overview of what readers is going to get cut to the chase (don t tease!) People skim and look at interesting things first Reviewers are busy and sleepy (read 5-10 papers per conference) it s refreshing to read an interesting paper How to do it? Use your most impressive figure Can be similar to another shown later 48
59 Figures should be self-contained Why? Don t make people go back and forth between text & figure Bad figures means bad first impression (reject!) How to fix? Succinctly describe your main (take-away) messages 49
60 Example 50

61 More generally, how to write good papers? Wobbrock-2015.pdf 51
62 Use legible fonts. 52
63 If people can t see it, they won t appreciate it. For printed materials, print them out and check! Rule of thumb: about 7 lines of text on a slide. 53
64 Redesign figures for presentation Designing for print is different from designing for the screen Resolution (which is higher?) Levels of details (people mostly want a few take-away messages from your talk) 54

65 Example 55
66 Example Judges Scores 16 Apolo Scholar Score 8 0 Modelbased *Prototyping *Average Higher is better. Apolo wins. * Statistically significant, by two-tailed t test, p <0.05
67 Great Work destroyed by Poor Presentation Bad color schemes Bad, tiny fonts Too much animation can you read this? 100 times faster! Too much data Don McMillan: Life After Death by PowerPoint 57
Poster and PowerPoint Presentations. Curtis Olson, PhD UW Office of Continuing Professional Development in Medicine and Public Health Rich Path, ICTR
 Poster and PowerPoint Presentations Curtis Olson, PhD UW Office of Continuing Professional Development in Medicine and Public Health Rich Path, ICTR Agenda Design principles for PowerPoint slides 45 min
Bring information alive
 Bring information alive An introduction to data visualisation Rebecca Wolfe Research Uptake Manager RESYST (Resilient and Responsive Health Systems) Consortium Overview Introduction to data visualisation
GUIDELINES. Internal signage guidelines
 GUIDELINES 2 St John Ambulance Why this guide matters Whenever people come into contact with St John Ambulance, it s important that they re able to immediately understand what kind of organisation we are,
Dobbin Day - User Guide
 Dobbin Day - User Guide Introduction Dobbin Day is an in running performance form analysis tool. A runner s in-running performance is solely based on the price difference between its BSP (Betfair Starting
a. Determine the sprinter's constant acceleration during the first 2 seconds. b. Determine the sprinters velocity after 2 seconds have elapsed.
 AP Physics 1 FR Practice Kinematics 1d 1 The first meters of a 100-meter dash are covered in 2 seconds by a sprinter who starts from rest and accelerates with a constant acceleration. The remaining 90
Prerequisite skills: The students need have a basic understanding of scatter plots.
 Objective: Students will investigate the g-forces. Students will then create scatter plots given data in a table. Students will then use the graphs to analyze the data and make predictions about who will
3. Answer the following questions with your group. How high do you think he was at the top of the stairs? How did you estimate that elevation?
 J Hart Interactive Algebra 1 Classwork Exploratory Challenge 1. Watch the first 1:08 minutes of the video below and describe in words the motion of the man. Elevation vs. Time #2 [http://www.mrmeyer.com/graphingstories1/graphingstories2.mov.
BRAND BOOK. Standards and Guidelines
 BRAND BOOK Standards and Guidelines Dear JCC Family: As faculty, staff, and administrators at Jamestown Community College, we share the common goal of making our students successful. The interdependence
M. Mikkonen.
 Wind study by using mobile sodar technology M. Mikkonen Oulu University of Applied Sciences, School of Engineering, Oulu, Finland t3mimi00@students.oamk.com Abstract In this paper is presented a concept
INTRODUCTION P. 3 THE TEE P. 4 THE TEXT P. 7 THE GRAPHICS P. 9 THE LAYOUT P. 11 THE END P. 16
 created for YOU by contents INTRODUCTION P. 3 THE TEE P. 4 THE TEXT P. 7 THE GRAPHICS P. 9 THE LAYOUT P. 11 THE END P. 16 How To Design An Event Tee 2 introduction Designing an event tee can be super easy
Parametric Ball Toss TEACHER NOTES MATH NSPIRED. Math Objectives. Vocabulary. About the Lesson. TI-Nspire Navigator System
 Math Objectives Students will be able to use parametric equations to represent the height of a ball as a function of time as well as the path of a ball that has been thrown straight up. Students will be
MADISON BALLET. Graphic Standards for. Madison Ballet
 MADISON BALLET Graphic Standards for Madison Ballet Brittney Leemon Fall 2015 Table of Contents Introduction - 3 Glossary - 4 Logo - 5 Use of Space - 6 Use of Color - 7 Typography - 8 Business Card - 9
Teaching Notes. Contextualised task 35 The 100 Metre Race
 Contextualised task 35 The 100 Metre Race Teaching Notes This activity involves interpreting data presented in different forms to compare speed, distance and time. The aim is to find who might win a race
UMKC ATHLETICS BRANDING GUIDELINES
 UMKC ATHLETICS BRANDING GUIDELINES UMKC Athletics is proud to be Kansas City s Division I team. The University of Missouri-Kansas City Intercollegiate Athletics brand is distinguished nationally by our
Physics 2204 Worksheet 6.5: Graphical Analysis of Non- Uniform Motion D-T GRAPH OF NON-UNIFORM MOTION (ACCELERATING) :
 :") Physics 2204 Worksheet 6.5: Graphical Analysis of Non- Uniform Motion D-T GRAPH OF NON-UNIFORM MOTION (ACCELERATING) : The d-t graph for uniformly Accelerated motion is definitely not the same as a d-t
Physics 2204 Worksheet 6.5: Graphical Analysis of Non- Uniform Motion D-T GRAPH OF NON-UNIFORM MOTION (ACCELERATING) : The d-t graph for uniformly Accelerated motion is definitely not the same as a d-t
Just How Big are the Pockets, Anyway? Part II
 David Alciatore, PhD ( Dr. Dave ) ILLUSTRATED PRINCIPLES Just How Big are the Pockets, Anyway? Part II Note: Supporting narrated video (NV) demonstrations, high-speed video (HSV) clips, and technical proofs
Misaligned Folds Paper Feed Problems Double Feeds Won t Feed FLYER Won t Run iii
 Operator s Manual Table of Contents Operator Safety... 1 Introduction... 2 Unpacking and Setup... 3 Unpacking... 3 Setup... 4 FLYER Overview... 5 FLYER Diagram... 5 Capabilities... 5 Control Panel... 6
Last First Date Per SETTLE LAB: Speed AND Velocity (pp for help) SPEED. Variables. Variables
 SPEED. Variables. Variables") DISTANCE Last First Date Per SETTLE LAB: Speed AND Velocity (pp108-111 for help) Pre-Activity NOTES 1. What is speed? SPEED 5-4 - 3-2 - 1 2. What is the formula used to calculate average speed? 3. Calculate
DISTANCE Last First Date Per SETTLE LAB: Speed AND Velocity (pp108-111 for help) Pre-Activity NOTES 1. What is speed? SPEED 5-4 - 3-2 - 1 2. What is the formula used to calculate average speed? 3. Calculate
FF Chartwell User Manual. FontFont.com
 FF Chartwell User Manual FontFont.com 9+41+12+1+2+2+16+2+7+4+2+1+1+E 46+20+11+9+1+3+2+2+3+1+1+1+c 14+30+1+7+17+5+4+10+2+1+4+1+1+1+1+1+o 43+ +1+1+1+1+1+1+1+2+3+4+14+4+3+20O 6+18+32+9+11+4+6+4+5+2+1+1+1+Q
Who takes the driver seat for ISO and DO 254 verification?
 Who takes the driver seat for ISO 26262 and DO 254 verification? Reconciling requirement based verification with coverage-driven verification Avidan Efody, Mentor Graphics Corp. Motivation ISO and DO users
Pre Feasibility Study Report Citiwater Cleveland Bay Purification Plant
 SOLAR POWER SPECIALISTS.Pure Power ACN 074 127 718 ABN 85 074 127 718 POWER MAGIC PTY LTD 245 INGHAM RD GARBUTT QLD 4814 Phone: 1800 068 977 Fax: 07 4725 2479 Email: FNQSOLAR@bigpond.com Pre Feasibility
3. Answer the following questions with your group. How high do you think he was at the top of the stairs? How did you estimate that elevation?
 Classwork Exploratory Challenge 1. Watch the first 1:08 minutes of the video below and describe in words the motion of the man. Elevation vs. Time #2 [http://www.mrmeyer.com/graphingstories1/graphingstories2.mov.
REAL LIFE GRAPHS M.K. HOME TUITION. Mathematics Revision Guides Level: GCSE Higher Tier
 Mathematics Revision Guides Real Life Graphs Page 1 of 19 M.K. HOME TUITION Mathematics Revision Guides Level: GCSE Higher Tier REAL LIFE GRAPHS Version: 2.1 Date: 20-10-2015 Mathematics Revision Guides
Policy Management: How data and information impacts the ability to make policy decisions:
 Policy Management: How data and information impacts the ability to make policy decisions: Louis Cripps Regional Transportation District, Asset Management Denver, Colorado Quick exercise... What do these
Ramblers Walking for Health
 Ramblers Walking for Health Visual identity for schemes Ramblers Walking for Health vision That everyone will have access to a short, free and friendly health walk within easy reach of where they live,
Math 10 Lesson 3-3 Interpreting and Sketching Graphs
 number of cards Math 10 Lesson 3-3 Interpreting and Sketching Graphs I. Lesson Objectives: 1) Graphs communicate how two things are related to one another. Straight, sloped lines indicate a constant change
Analyzing Categorical Data & Displaying Quantitative Data Section 1.1 & 1.2
 Analyzing Categorical Data & Displaying Quantitative Data Section 1.1 & 1.2 Reference Text: The Practice of Statistics, Fourth Edition. Starnes, Yates, Moore Starter Problem Antoinette plays a lot of golf.
Creating Effective Poster Presentations For Fun and Profit! Aaron Price, AAVSO 95th Spring Meeting of the AAVSO Rockford, IL
 Creating Effective Poster Presentations For Fun and Profit! Aaron Price, AAVSO 95th Spring Meeting of the AAVSO Rockford, IL Posters are legitimate forms of publication Many important discoveries begin
How we look. St John Ambulance 2012 Produced by Creative Services
 How we look St John Ambulance 2012 Produced by Creative Services 020 7324 4205 creative-services@sja.org.uk Overview St John Ambulance is a huge, multi-faceted organisation. There are many different aspects
12936 RLWC Abridged guidelines_print 05/01/ :58 Page 1 ENGLAND AND WALES Rugby League World Cup Style Guide
 12936 RLWC Abridged guidelines_print 05/01/2011 09:58 Page 1 ENGLAND AND WALES 2013 Rugby League World Cup 2013 Style Guide 12936 RLWC Abridged guidelines_print 05/01/2011 09:58 Page 2 Contents Introduction
Poster-Making Guidelines. Joy Gerhard, Nora Sturgeon, and Walter Blair December 5, 2011
 Poster-Making Guidelines Joy Gerhard, Nora Sturgeon, and Walter Blair December 5, 2011 Tell a story visually and concisely Goal of Posters Present information that can stand on its own Poster session at
Fuga. - Validating a wake model for offshore wind farms. Søren Ott, Morten Nielsen & Kurt Shaldemose Hansen
 Fuga - Validating a wake model for offshore wind farms Søren Ott, Morten Nielsen & Kurt Shaldemose Hansen 28-06- Outline What is Fuga? Model validation: which assumptions are tested? Met data interpretation:
SHOT ON GOAL. Name: Football scoring a goal and trigonometry Ian Edwards Luther College Teachers Teaching with Technology
 SHOT ON GOAL Name: Football scoring a goal and trigonometry 2006 Ian Edwards Luther College Teachers Teaching with Technology Shot on Goal Trigonometry page 2 THE TASKS You are an assistant coach with
Comparison of flow models
 Comparison of flow models Rémi Gandoin (remga@dongenergy.dk) March 21st, 2011 Agenda 1. Presentation of DONG Energy 2. Today's presentation 1. Introduction 2. Purpose 3. Methods 4. Results 3. Discussion
Skills Key Words. Task. Key words. Write a definition for each of the key words listed below. Hypothesis. Variable. Prediction. Method.
 KS3 Science Skills Skills Key Words Write a definition for each of the key words listed below Key words Hypothesis Variable Prediction Method Hazard Precision Accuracy Repeatability Reproducibility Anomaly
Health, safety and risk 1. Introduction. Personal and social life (eg as discussed in PSE lessons) Health and safety at work. Environmental safety
 Health and safety at work. Environmental safety") Health, safety and risk 1 Introduction This book contains a series of student activities intended to promote health and safety within the world of school and work. The student activities place safety within
Health, safety and risk 1 Introduction This book contains a series of student activities intended to promote health and safety within the world of school and work. The student activities place safety within
PHYSICS 105. Assignment #3 Due by 10 pm September 29, DISCUSSION SECTION: [ ] D7 W 9 am [ ] D8 W 10 am [ ] HS W 10 am
![PHYSICS 105. Assignment #3 Due by 10 pm September 29, DISCUSSION SECTION: [ ] D7 W 9 am [ ] D8 W 10 am [ ] HS W 10 am](/thumbs/89/98903187.jpg "PHYSICS 105. Assignment #3 Due by 10 pm September 29, DISCUSSION SECTION: [ ] D7 W 9 am [ ] D8 W 10 am [ ] HS W 10 am") PHYSICS 105 Assignment #3 Due by 10 pm September 9, 009 NAME: DISCUSSION SECTION: [ ] D7 W 9 am [ ] D8 W 10 am [ ] HS W 10 am [ ] D9 W 11 am [ ] F 1 W 1 pm [ ] F W pm [ ] F3 W 3 pm [ ] F4 W 4 pm [ ] F5
PHYSICS 105 Assignment #3 Due by 10 pm September 9, 009 NAME: DISCUSSION SECTION: [ ] D7 W 9 am [ ] D8 W 10 am [ ] HS W 10 am [ ] D9 W 11 am [ ] F 1 W 1 pm [ ] F W pm [ ] F3 W 3 pm [ ] F4 W 4 pm [ ] F5
There are 3 sections to the home page shown in the first screenshot below. These are:
 Welcome to pacecards! Pacecards is a unique service that places the likely pace in the race and the running style of each horse at the centre of horseracing form analysis. This user guide takes you through
EEC 686/785 Modeling & Performance Evaluation of Computer Systems. Lecture 6. Wenbing Zhao. Department of Electrical and Computer Engineering
 EEC 686/785 Modeling & Performance Evaluation of Computer Systems Lecture 6 Department of Electrical and Computer Engineering Cleveland State University wenbing@ieee.org Outline 2 Review of lecture 5 The
GCSE 4353/01 MATHEMATICS (UNITISED SCHEME) UNIT 3: Calculator-Allowed Mathematics FOUNDATION TIER
 UNIT 3: Calculator-Allowed Mathematics FOUNDATION TIER") Surname Centre Number Candidate Number Other Names 0 GCSE 4353/01 MATHEMATICS (UNITISED SCHEME) UNIT 3: Calculator-Allowed Mathematics FOUNDATION TIER A.M. MONDAY, 10 November 2014 A14-4353-01 1 hour 30
Surname Centre Number Candidate Number Other Names 0 GCSE 4353/01 MATHEMATICS (UNITISED SCHEME) UNIT 3: Calculator-Allowed Mathematics FOUNDATION TIER A.M. MONDAY, 10 November 2014 A14-4353-01 1 hour 30
Outline. Terminology. EEC 686/785 Modeling & Performance Evaluation of Computer Systems. Lecture 6. Steps in Capacity Planning and Management
 EEC 686/785 Modeling & Performance Evaluation of Computer Systems Lecture 6 Department of Electrical and Computer Engineering Cleveland State University wenbing@ieee.org Outline Review of lecture 5 The
Part 2: E-Learning Module Description. Elizabeth C. Rodriguez. University of Texas at Brownsville. EDTC 6325 Educational Telecommunications
 [E- LEARNING MODULE DESCRIPTION] 1 Part 2: E-Learning Module Description Elizabeth C. Rodriguez University of Texas at Brownsville EDTC 6325 Educational Telecommunications Spring 2011 E-Learning Module
x 2 = (60 m) 2 + (60 m) 2 x 2 = 3600 m m 2 x = m
 2 + (60 m) 2 x 2 = 3600 m m 2 x = m") 3.1 Track Question a) Distance Traveled is 1600 m. This is length of the path that the person took. The displacement is 0 m. The person begins and ends their journey at the same position. They did not
3.1 Track Question a) Distance Traveled is 1600 m. This is length of the path that the person took. The displacement is 0 m. The person begins and ends their journey at the same position. They did not
Pro-Stringer Tennis Quick Start Stringing Instructions
 For a full instructional video on how to string a tennis racket using Pro-Stringer visit http://www.tennisprostringer.com Section 1 - Setting up your Pro-Stringer 1. Unpack and layout the contents of the
Describing a journey made by an object is very boring if you just use words. As with much of science, graphs are more revealing.
 Distance vs. Time Describing a journey made by an object is very boring if you just use words. As with much of science, graphs are more revealing. Plotting distance against time can tell you a lot about
ICF Style Guide Always moving forward
 ICF Style Guide Always moving forward Table of contents i. Introduction 3 Section One The Logo I. The Official Logo 4 II. Logo Significance 4 III. Typography 4 IV. General Logotype 4 V. General Guidelines
GRADE LEVEL(S): Grade 4, Grade 5
: Grade 4, Grade 5") WRITTEN BY; TITLE: George Skip Toops Step It Up!! GRADE LEVEL(S): Grade 4, Grade 5 TIME ALLOTMENT: One lesson, 30 50 minutes long depending on how many students are in the class. Students will have some
WRITTEN BY; TITLE: George Skip Toops Step It Up!! GRADE LEVEL(S): Grade 4, Grade 5 TIME ALLOTMENT: One lesson, 30 50 minutes long depending on how many students are in the class. Students will have some
UNIT 2 RIGHT TRIANGLE TRIGONOMETRY Lesson 2: Applying Trigonometric Ratios Instruction
 Prerequisite Skills This lesson requires the use of the following skills: defining and calculating sine, cosine, and tangent setting up and solving problems using the Pythagorean Theorem identifying the
 PROCESS OVERVIEW Please read the whole instruction series through once carefully before you begin tapping. x x 3 x 4 x 5 x 6 x The cortices tapping process is easy to do and easy to remember, once you've
ATHLETICS. Adhering to the athletic brand standards will help create and maintain a clearly defined athletics program and identity.
 ATHLETICS OVERVIEW Westminster College has created Athletic Brand Standards to ensure proper use of athletic logos for use on printed and visual materials, including but not limited to: Uniforms, T-Shirts,
Identity Guidelines. As of 01.07
 Identity Guidelines This US Youth Soccer Identity Guidelines Manual contains the minimum required graphic standards designed to maintain the organizationʼs standards of quality and visual consistency.
SmartMan Code User Manual Section 5.0 Results
 SmartMan Code User Manual Section 5.0 Results For SmartMan Code, Megacode and Megacode Low Volume Table of Contents SmartMan Code User Manual Section 5.0 Results... 1 SMARTMAN CODE MEGACODE MEGACODE LOW
Section 4.2 Objectives
 Section 4. Objectives Determine whether the slope of a graphed line is positive, negative, 0, or undefined. Determine the slope of a line given its graph. Calculate the slope of a line given the ordered
Mastering the Mechanical E6B in 20 minutes!
 Mastering the Mechanical E6B in 20 minutes Basic Parts I am going to use a Jeppesen E6B for this write-up. Don't worry if you don't have a Jeppesen model. Modern E6Bs are essentially copies of the original
Please use the typefaces Aachen Bold, Helvetica, Verdana and Arial as shown in the text throughout this manual. Supporting Typefaces
 Identity Guidelines The Eastern Pennsylvania Youth Soccer Identity Guidelines Manual contains the minimum required graphic standards designed to maintain the organization s standards of quality and visual
2D and Relative Motion. Group Problem 02 PROBLEM 1. Against the Grain
 PROBLEM 1. Against the Grain You are on the west bank of a river which flows due south and you need to swim to the east bank. You have told your friends to meet you on the east bank directly opposite your
A Simple Visualization Tool for NBA Statistics
 A Simple Visualization Tool for NBA Statistics Kush Nijhawan, Ian Proulx, and John Reyna Figure 1: How four teams compare to league average from 1996 to 2016 in effective field goal percentage. Introduction
FREEFORM POOL MEASURING GUIDELINES: HOW TO FILL OUT YOUR FREEFORM FORM!
 FREEFORM POOL MEASURING GUIDELINES: HOW TO FILL OUT YOUR FREEFORM FORM! Read instructions fully and carefully both here and on your Freeform Measurements form. Liners are non-refundable and an error in
(Lab Interface BLM) Acceleration
 Acceleration") Purpose In this activity, you will study the concepts of acceleration and velocity. To carry out this investigation, you will use a motion sensor and a cart on a track (or a ball on a track, if a cart
Purpose In this activity, you will study the concepts of acceleration and velocity. To carry out this investigation, you will use a motion sensor and a cart on a track (or a ball on a track, if a cart
SELF-LEVELLING PLANERS
 PL SELF-LEVELLING PLANERS For planing asphalt and cement in pre-set depths. 4 Designed for removing the entire layer of asphalt or cement in preparation for trenching, or for milling deteriorated sections
MTB 02 Intermediate Minitab
 MTB 02 Intermediate Minitab This module will cover: Advanced graphing Changing data types Value Order Making similar graphs Zooming worksheet Brushing Multi-graphs: By variables Interactively upgrading
Flow modelling hills complex terrain and other issues
 Flow modelling hills, complex terrain and other issues Modelling approaches sorted after complexity Rules of thumbs Codes and standards Linear model, 1 st order turbulence closure LINCOM/Wasp Reynolds-averaged
 1 In 2012, Special Olympics, Inc. (SOI) launched a brand refresh. These new rules are not optional and have been mandated by SOI. The following information is specific to sub-programs (local programs).
BISHOP MONTGOMERY HIGH SCHOOL
 BISHOP MONTGOMERY HIGH SCHOOL BRAND & GRAPHICS GUIDELINES Contents Introduction 1.1 Approved Logos 2.1 Non-Approved Logos 3.1 Identity Enhancements 3.2 Approved Colors 4.1 Typography 5.1 Follow BMHS on
Saint Joseph High School Brand Book
 Saint Joseph High School Brand Book July 2017 From the Principal I am pleased to introduce our official "Brand Book" which contains our graphic identity standards and guidelines. Communication with the
DO YOU KNOW WHO THE BEST BASEBALL HITTER OF ALL TIMES IS?...YOUR JOB IS TO FIND OUT.
 Data Analysis & Probability Name: Date: Hour: DO YOU KNOW WHO THE BEST BASEBALL HITTER OF ALL TIMES IS?...YOUR JOB IS TO FIND OUT. This activity will find the greatest baseball hitter of all time. You
Compare the scalar of speed and the vector of velocity.
 Review Video QOD 2/14/12: Compare the scalar of speed and the vector of velocity. What are the equations for each? Feb 14 6:51 AM 1 Imagine that you are a race car driver. You push on the accelerator.
3D Scan Processing Procedures for Surfer
 3D Scan Processing Procedures for Surfer Instructions Version 1.0 Alistair Evans, 30 September 2008 Pre-processing of Point Cloud Remove Extraneous Points The output from most scanners will include parts
Chapter 2 - Displaying and Describing Categorical Data
 Chapter 2 - Displaying and Describing Categorical Data August 28, 2014 Exploratory Data Analysis - The use of graphs or numerical summaries (values) to describe the variables in a data set and the relation
Chapter 3 - Displaying and Describing Categorical Data
 Chapter 3 - Displaying and Describing Categorical Data August 25, 2010 Exploratory Data Analysis - The use of graphs or numerical summaries (values) to describe the variables in a data set and the relation
box and whisker plot 3880C798CA037B A83B07E6C4 Box And Whisker Plot 1 / 6
 Box And Whisker Plot 1 / 6 2 / 6 3 / 6 Box And Whisker Plot In descriptive statistics, a box plot or boxplot is a method for graphically depicting groups of numerical data through their quartiles.box plots
Recognise that some mechanisms, including levers, pulleys and gears, allow a smaller force to have a greater effect
 MODULE 7 FEEL THE FORCE Key vocabulary: lever, pivot, push, pull, mechanism, machine, force, fulcrum LESSON 8: HOW CAN WE USE LEVERS TO HELP US? LESSON SUMMARY: This lesson introduces mechanisms devices
NAME:... SCHOOL: LINEAR MOTION. Answer ALL questions in this paper in the spaces provided.
 NAME:.... SCHOOL: DATE:... LINEAR MOTION INSTRUCTIONS TO CANDIDATES Answer ALL questions in this paper in the spaces provided. 1. Two forces that act on a moving cyclist are the driving force and the resistive
ICYNENE INSTALLATION INSTRUCTIONS
 ICYNENE LD-C-50 INSTALLATION INSTRUCTIONS ICYNENE LD-C-50 is a Low Density completely water blown open-cell spray foam insulation and air barrier material. Completely free of any HFC s and PBDE s, ICYNENE
OUR LOGO. CLIC Sargent Visual Identity Guidelines. November 2015
 OUR LOGO CLIC Sargent Visual Identity Guidelines 7 An overview Secondary logo As our unique identifier, it is essential that our logo is applied consistently. The primary version of our logo, shown on
renewable energy projects by renewable energy people
 renewable energy projects by renewable energy people Our Services Full lifecycle services across renewable energy sectors 2 Time variant energy yield analysis A case study Presenter: Daniel Marmander Date:
Low Wind High Yields Series
 Low Wind High Yields Series Wind Turbines USER S MANUAL Introduction Low Wind High Yields Series rotor blades apply the latest advanced thermoplastic engineering and are manufactured by precision injection
90º and 30º Rule Review
 David Alciatore ( Dr. Dave ) 90º and 30º Rule Review ILLUSTRATED PRINCIPLES Note: Supporting narrated video (NV) demonstrations, high-speed video (HSV) clips, and technical proofs (TP) can be accessed
The High School Math Project Focus on Algebra. Bottles and Divers. (Rates of Change)
") The High School Math Project Focus on Algebra Bottles and Divers (Rates of Change) Objective Students calculate the rate of change between two points on a curve by determining the slope of the line joining
The High School Math Project Focus on Algebra Bottles and Divers (Rates of Change) Objective Students calculate the rate of change between two points on a curve by determining the slope of the line joining
Moorhead Baseball Routines/Hitting Drills
 Moorhead Baseball Routines/Hitting Drills Philosophy How we train: Teach everyday with the goal of our players becoming their own coach. Get them to feel what s going on. Consistent mix of instruction
Homework 2b: Bathymetric Profiles [based on the Chauffe & Jefferies (2007)]
![Homework 2b: Bathymetric Profiles [based on the Chauffe & Jefferies (2007)]](/thumbs/77/75183244.jpg "Homework 2b: Bathymetric Profiles [based on the Chauffe & Jefferies (2007)]") 14 August 2008 HW-2b: - Bathymetric Profiles 1 2-5. BATHYMETRIC PROFILES Homework 2b: Bathymetric Profiles [based on the Chauffe & Jefferies (2007)] A bathymetric profile provides a "skyline view" of the
14 August 2008 HW-2b: - Bathymetric Profiles 1 2-5. BATHYMETRIC PROFILES Homework 2b: Bathymetric Profiles [based on the Chauffe & Jefferies (2007)] A bathymetric profile provides a "skyline view" of the
UNDERSTANDING THE TENNIS BALL SPIN
 UNDERSTANDING THE TENNIS BALL SPIN Reijo Leppänen, Espoo, Finland Jan 16, 2016 1 1. Why I made this article This article was created following my personal struggle with the American twist serve (the struggle
THE GEORGE WASHINGTON UNIVERSITY ATHLETICS GRAPHIC IDENTITY MANUAL FOR MERCHANDISE
 THE GEORGE WASHINGTON UNIVERSITY ATHLETICS GRAPHIC IDENTITY MANUAL FOR MERCHANDISE THE GEORGE WASHINGTON UNIVERSITY ATHLETICS GRAPHIC IDENTITY MANUAL FOR MERCHANDISE This manual presents guidelines for
The Basics of Signage
 2009 The Basics of Signage The nature of signage is, at the most basic level, designed to let these employees know the nature of the danger and what they need to do to avoid injury Rob Vajko 1/12/2009
Gas Pressure and Volume Relationships *
 Gas Pressure and Volume Relationships * MoLE Activities To begin this assignment you must be able to log on to the Internet (the software requires OSX for mac users). Type the following address into the
Racing and Sports RACING ANALYTICS
 Racing and Sports RACING ANALYTICS Racing Analytics is a new way of presenting the free race form statistics available on the Racing and Sports website. These statistics are accrued in the Racing and Sports
Helicopter & Launcher
 Helicopter & Launcher Category: Physics: Force & Motion Type: Make & Take Rough Parts List: 2 Large craft sticks or paint paddles 12 Dowel, ¼ 1 Dowel, 1 long, ¼ 1 Wood block, 8 x 1 x 1 1 Wood block, tiny
CHILDREN S SLEEPWEAR STANDARD OPERATING PROCEDURE
 CHILDREN S SLEEPWEAR STANDARD OPERATING PROCEDURE Table of Contents 1 SCOPE... 2 2 FLAMMABILITY TESTING REQUIREMENT... 2 3 TIGHT-FITTING (SNUG FITTING) SLEEPWEAR - REQUIREMENT... 3 4 TIGHT-FITTING (SNUG-FITTING)
The Welsh Government logo
 The Welsh Government logo 1 Our logo consists of a dragon and Welsh Government name separated by a horizontal line, positioned together in a fixed relationship which must not be altered. These elements
C# Tutorial - Create a Pong arcade game in Visual Studio
 C# Tutorial - Create a Pong arcade game in Visual Studio Start Visual studio, create a new project, under C# programming language choose Windows Form Application and name project pong and click OK. Click
Look and Style Guide. Always moving forward. Copyright 2018 by ICF
 Look and Style Guide Always moving forward Table of contents i. Introduction 3 Section one - ICF Logo I. Official ICF Logo 4 II. Logo Significance 4 III. Typography 4 IV. General Logotype 4 V. General
STAT 155 Introductory Statistics. Lecture 2-2: Displaying Distributions with Graphs
 The UNIVERSITY of NORTH CAROLINA at CHAPEL HILL STAT 155 Introductory Statistics Lecture 2-2: Displaying Distributions with Graphs 8/31/06 Lecture 2-2 1 Recall Data: Individuals Variables Categorical variables
Ripple Tank P CONTENTS: DEMONSTRATION SETUP INSTRUCTIONS:
 WWW.ARBORSCI.COM Ripple Tank P7-7260 CONTENTS: 11 x 14 tank 1 9 white plastic rod 2 white plastic blocks, 4 long 1 white plastic block, 2 long Also required: Standard overhead projector 1 white plastic
Homework Helpers Sampler
 Homework Helpers Sampler This sampler includes s for Algebra I, Lessons 1-3. To order a full-year set of s visit >>> http://eurmath.link/homework-helpers Published by the non-profit Great Minds. Copyright
Watching Out for Us! Skills for Safe Walking. Presenter Guide
 Watching Out for Us! Skills for Safe Walking Presenter Guide Watching Out for Us! was developed for the National Highway Traffic Safety Administration by the University of North Carolina Highway Safety
Movement and Position
 Movement and Position Syllabus points: 1.2 plot and interpret distance-time graphs 1.3 know and use the relationship between average speed, distance moved and 1.4 describe experiments to investigate the
Teacher's Manual. First Printing: September Master Books P.O. Box 726 Green Forest, AR Printed in the United States of America
 Teacher's Manual First Printing: September 2008 First Printing: February 2009 Copyright 2009 by Tom DeRosa and Carolyn Reeves. All rights reserved. No part of this book may be reproduced in any manner
F For this paper you must have:
 Centre Number Surname Candidate Number For Examiner s Use Other Names Candidate Signature Examiner s Initials Mathematics Unit 1 General Certificate of Secondary Education Foundation Tier March 2011 43601F
Guided Slides: Flexible Lectures using a Tablet PC
 Guided Slides: Flexible Lectures using a Tablet PC Lester I. McCann mccann@cs.arizona.edu Computer Science Department The University of Arizona Tucson, AZ Frontiers in Education October 24, 2008 FIE 2008
GN21 Frequently Asked Questions For Golfers
 Posting Scores (My Score Center) 1. Click on the Enter Score button to enter an adjusted gross score or click on the Enter Hole-By-Hole Score button to enter your score hole-by-hole. NOTE: to use the Game